
THE DIVERSIFICATION POTENTIAL OF REAL ESTATE · 2 TE DIERSIICATION POTENTIA O REA ESTATE NORGES ANK...
55
The Discussion Note series provides analysis which may form relevant back- ground for Norges Bank Investment Management’s investment strategy and advice to the asset owner. Any views expressed in the Discussion Notes are not necessarily held by our organisation. The series is written by employees, and is informed by our investment research and our experience as a large, long-term asset manager. [email protected] www.nbim.no Date 06/11/2015 ISSN 1893-966X We review the return characteristics and return drivers of private real estate investments and assess these in the perspective of a multi-asset portfolio. Our conclusions are based on our interpretation and weighting of published academic research. THE DIVERSIFICATION POTENTIAL OF REAL ESTATE DISCUSSION NOTE 01 2015
Transcript of THE DIVERSIFICATION POTENTIAL OF REAL ESTATE · 2 TE DIERSIICATION POTENTIA O REA ESTATE NORGES ANK...

The Discussion Note series provides analysis which may form relevant back-ground for Norges Bank Investment Management’s investment strategy and advice to the asset owner. Any views expressed in the Discussion Notes are not necessarily held by our organisation. The series is written by employees, and is informed by our investment research and our experience as a large, long-term asset manager.
Date 06/11/2015ISSN 1893-966X
We review the return characteristics and return drivers of private real estate investments and assess these in the perspective of a multi-asset portfolio. Our conclusions are based on our interpretation and weighting of published academic research.
THE DIVERSIFICATION POTENTIAL OF REAL ESTATEDISCUSSION NOTE
01 2015

2
THE DIVERSIFICATION POTENTIAL OF REAL ESTATE
NORGES BANK INVESTMENT MANAGEMENT / DISCUSSION NOTE
SUMMARY
• A significant share of global wealth is in real estate, but the investable share is lower. Various estimations indicate the value of real estate investments to be in the range of 10 to 15 percent of the global market portfolio, slightly higher than the average allocations of institutional investors.
• The vast majority of academic studies come to the conclusion that adding real estate does improve the riskreturn profile of a mixedasset portfolio. Estimates of optimal allocations to real estate vary strongly. The median range of the suggested allocations to real estate in the 30 studies reviewed was 15 percent.
• Equity investments in real estate can be made through direct ownership of buildings, through nonlisted real estate funds or through investments in listed real estate companies. Research indicates that direct and listed investments should deliver similar return characteristics in the long term, but the observed differences are very significant in the short term, with public real estate exhibiting more similarity to general stocks than to private real estate. Also, the availability of listed vehicles is limited in many regions of the world, affecting the ability to follow a defined portfolio strategy.
• When analysing direct real estate returns, a number of measurement issues need to be considered. In particular, the most popular appraisalbased indices tend to be too smooth. Unsmoothing the indices should provide a volatility measure that expresses risk in a more realistic manner.
• Historical returns of real estate investments vary significantly across countries. Average annual returns between 2000 and 2013 were mostly in the range of 7 to 9 percent in nominal terms and 5 to 7 percent in real terms. However, returns have had a declining trend in recent years. Average return levels and volatilities based on unsmoothed indices were between government bonds and equities, and tended to be closer to those of government bonds.
• Low correlation of real estate returns with returns of equities and bonds are typically the key argument for including real estate in a mixedasset portfolio. This is especially the case for private real estate investments, as public vehicles tend to correlate strongly with the general stock market. The level of correlation is not stable over time, and correlations might increase during extreme market movements, but empirical evidence is not conclusive.
THE DIVERSIFICATION POTENTIAL OF REAL ESTATE

3
THE DIVERSIFICATION POTENTIAL OF REAL ESTATE
NORGES BANK INVESTMENT MANAGEMENT / DISCUSSION NOTE
• Direct real estate investments are exposed to a number of assetspecific, idiosyncratic risks. While the impact of assetspecific risks should decrease with portfolio size, it might not be possible to eliminate those risks entirely, even in portfolios with several hundreds of properties.
• Private real estate investments are significantly less liquid than investments in equities and bonds. The uncertainty associated with the duration and the outcome of the sale process results in additional risks. While the impact on the riskreturn profile of the investment can be significant in the short term, it appears to be marginal for longterm investment horizons.
• Real estate returns are often considered as a natural inflation hedge, as rents tend to be linked to inflation. Academic studies generally support inflationhedging properties for private real estate but not for public real estate investments.
• Research supports the existence of a specific real estate factor for private real estate, which reflects realestatespecific risk and is independent of equity or bondrelated factors. This is highly relevant for the construction of investment portfolios based on fundamental factors.

4
THE DIVERSIFICATION POTENTIAL OF REAL ESTATE
NORGES BANK INVESTMENT MANAGEMENT / DISCUSSION NOTE
1 IntroductionThe purpose of the paper is to review various aspects of private real estate investments seen in the perspective of a multiasset portfolio held by a longterm investor, such as the Government Pension Fund Global. It focuses on direct equity investments in commercial real estate, and draws heavily on findings in academic literature. In particular, it can be seen as an update and extension of the study by Hoesli and Lizieri (2007) prepared for the Investment Strategy Council of the Royal Ministry of Finance.
The issue of the diversification potential is viewed in a broad context of the consequences of including real estate investments in a mixedasset portfolio. While the traditional approach concentrates on the correlations between returns of individual investments, it is difficult to apply to real estate due to relatively poor availability of data and a short history of returns. In order to provide a more general longterm view, we investigate various aspects of return and risk characteristics of real estate, comparing them with those of equities and bonds. We also discuss the fundamental drivers of real estate which determine the returns in the long term and are the actual source of any diversification benefits that this asset class is likely to provide.
The paper is structured as follows: Section 2 addresses the question of allocations to real estate by looking at the size of the market, allocations of institutional investors and findings in the academic literature. Section 2.3 addresses certain aspects specific to this asset class, such as vehicles available to investors and return measurement issues, setting the stage for further analysis. Section 4 looks deeper into the riskreturn profiles associated with real estate investments as well as correlations with equities and bonds. The section also covers some issues specific to real estate, such as the impact of assetspecific risks and the consequences of illiquidity. In Section 5, we look at the drivers of real estate returns, including the most relevant economic factors as well as the endogenous system dynamics of real estate markets. We also address the existence of a unique real estate factor in return time series that is unrelated to other asset classes. The final section summarises and concludes.
2 Allocations to real estate in mixed-asset portfoliosThe level of allocations to real estate in investment portfolios is reviewed from three different perspectives. First, we look at the size of the global real estate market accessible to institutional investors and the share of this asset class in the global market portfolio. An overview of academic research addressing the optimal share of real estate in mixedasset portfolios follows. The section concludes with a review of the allocations of institutional investors. The different approaches indicate allocations to real estate in the range of 10 to 15 percent.
5
THE DIVERSIFICATION POTENTIAL OF REAL ESTATE
NORGES BANK INVESTMENT MANAGEMENT / DISCUSSION NOTE
2.1 Size of the real estate marketThere is broad agreement in the literature that real estate accounts for a significant share of global wealth, especially in the form of land and home ownership, although estimates vary strongly. Ibbotson and Siegel (1983) estimated that more than half of global wealth is in real estate. The 2006 Luxembourg Wealth Study found that the share of real estate in household portfolios across various countries ranged from 25 to 65 percent (net of debt), while the share of real estate investments ranged from 9 to 23 percent.
While the share of real estate in a hypothetical global market portfolio is important from a theoretical point of view, e.g. it plays a central role in the Capital Asset Pricing Model (CAPM), investments accessible to institutional investors are of higher practical relevance when constructing an investment portfolio. A number of studies address the size of “invested” real estate, i.e. the volume of real estate held in institutional portfolios as financial investments.1 Estimates produced and updated annually by DTZ are widely used in this respect.2 They are based on a fourquadrant approach looking at private real estate (holdings of funds and other private investors), public real estate (listed real estate market capitalisation), private real estate debt (lending by banks and other institutions) and public real estate debt (MBSs and covered bond market capitalisation). The size of global “invested” real estate according to this methodology was estimated at 13,700 billion US dollars in 2014. Comparing this figure with the market capitalisation of listed equities and bonds, estimated at 42,300 billion dollars and 43,400 billion dollars respectively, indicates a share of real estate in a stockbondreal estate portfolio of approx.14 percent (after correcting for double counting of listed holdings). However, given the lack of transparency in many markets, such estimates need to be considered with caution, and other sources deviate considerably. For example, IPD/MSCI estimate the total invested market size based on the IPD index universe to be 6,000 billion dollars.3 Estimates of investable real estate, which also include owneroccupied properties held for business rather than investment purposes, are significantly higher, ranging from DTZ’s 26,800 billion dollars to LaSalle’s 47,000 billion dollars.
Relatively few academic studies address the composition of a global multiasset market portfolio.4 A recent study by Doeswijk et al. (2014) looks at the “invested market portfolio”, which contains all publicly available assets in which financial investors have actually invested. Over a time period of over 50 years, they report that the share of real estate investments has increased from 1.4 to 5.3 percent in 2012. However, the authors use only the equity part to reflect real estate investments, while the debt part is captured as
1 Among others, IPD, DTZ, LaSalle Investment Management, Pramerica, Prudential, RREEF, UBS and EPRA have published estimates of the invested real estate market size. In this context, it should be noted that DTZ and some of the other sources differentiate between “invested” real estate, which includes only assets held in institutional portfolios for pure investment purposes, and “investable” real estate, which additionally includes assets occupied and used by the owner that have sufficient quality to enter an investment portfolio, e.g. office or industrial buildings occupied by owners, which could theoretically be sold as investments and leased. See also Hobbs and Chin (2007).
2 See DTZ (2015).
3 The IPD/MSCI methodology differs from the approach used by other sources. It takes into account the value of properties in the sample, on which the calculation of national indices is based, and inflates the figure with the estimated market coverage in each country. Since the latter step is an approximation and IPD/MSCI indices are available only in 25 countries, the approach is likely to underestimate the size of the global real estate investment market.
4 See Ibbotson and Siegel (1983), Ibbotson et al. (1985) and Bekkers et al. (2009).
6
THE DIVERSIFICATION POTENTIAL OF REAL ESTATE
NORGES BANK INVESTMENT MANAGEMENT / DISCUSSION NOTE
fixed income. Considering the actual values of properties, and hence treating mortgage debt (public and private) and listed real estate companies as real estate would result in more than doubling of this figure, bringing the effective real estate exposure in the market portfolio to approx. 13 percent.5
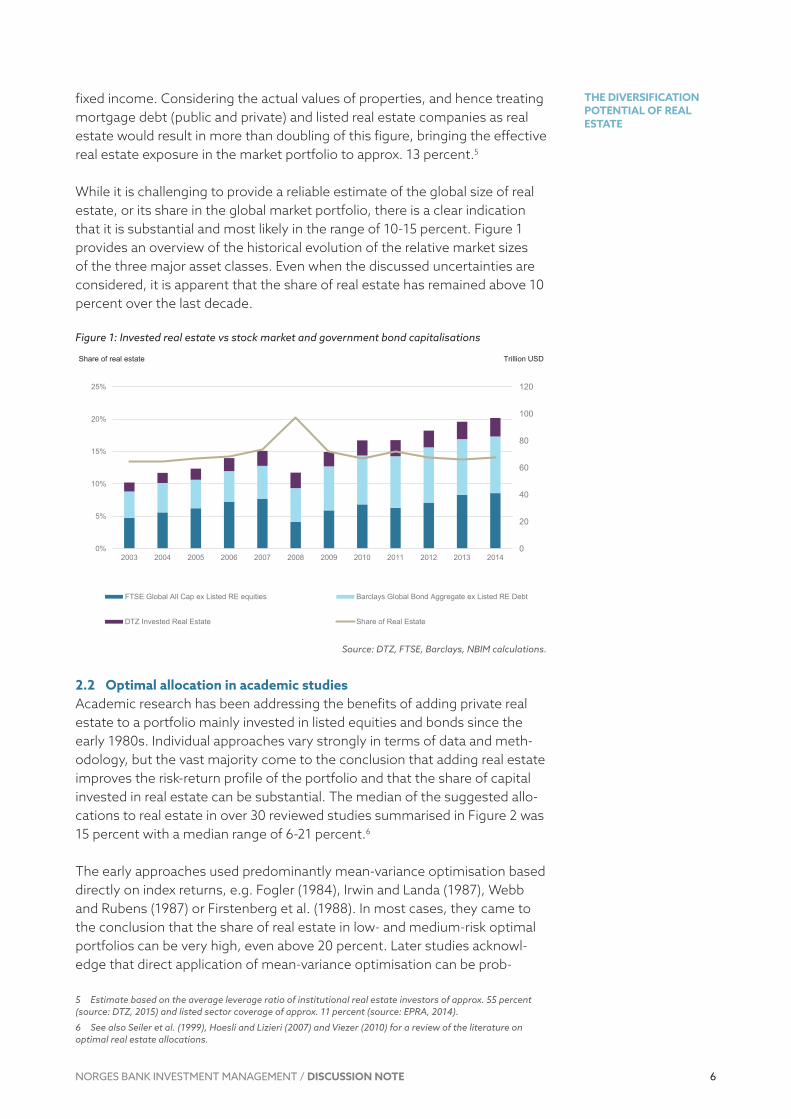
While it is challenging to provide a reliable estimate of the global size of real estate, or its share in the global market portfolio, there is a clear indication that it is substantial and most likely in the range of 1015 percent. Figure 1 provides an overview of the historical evolution of the relative market sizes of the three major asset classes. Even when the discussed uncertainties are considered, it is apparent that the share of real estate has remained above 10 percent over the last decade.
Figure 1: Invested real estate vs stock market and government bond capitalisations
Source: DTZ, FTSE, Barclays, NBIM calculations.
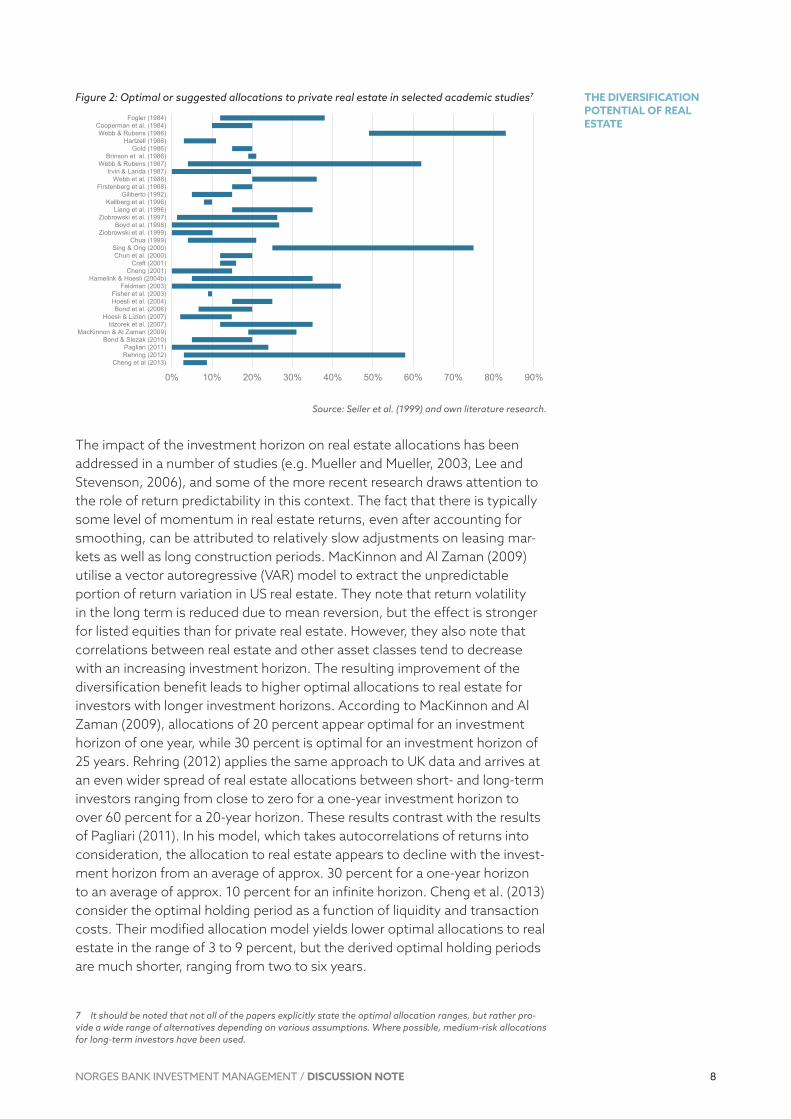
2.2 Optimal allocation in academic studiesAcademic research has been addressing the benefits of adding private real estate to a portfolio mainly invested in listed equities and bonds since the early 1980s. Individual approaches vary strongly in terms of data and methodology, but the vast majority come to the conclusion that adding real estate improves the riskreturn profile of the portfolio and that the share of capital invested in real estate can be substantial. The median of the suggested allocations to real estate in over 30 reviewed studies summarised in Figure 2 was 15 percent with a median range of 621 percent.6
The early approaches used predominantly meanvariance optimisation based directly on index returns, e.g. Fogler (1984), Irwin and Landa (1987), Webb and Rubens (1987) or Firstenberg et al. (1988). In most cases, they came to the conclusion that the share of real estate in low and mediumrisk optimal portfolios can be very high, even above 20 percent. Later studies acknowledge that direct application of meanvariance optimisation can be prob
5 Estimate based on the average leverage ratio of institutional real estate investors of approx. 55 percent (source: DTZ, 2015) and listed sector coverage of approx. 11 percent (source: EPRA, 2014).
6 See also Seiler et al. (1999), Hoesli and Lizieri (2007) and Viezer (2010) for a review of the literature on optimal real estate allocations.
0
20
40
60
80
100
120
0%
5%
10%
15%
20%
25%
2003 2004 2005 2006 2007 2008 2009 2010 2011 2012 2013 2014
FTSE Global All Cap ex Listed RE equities Barclays Global Bond Aggregate ex Listed RE Debt
DTZ Invested Real Estate Share of Real Estate
Trillion USDShare of real estate
7
THE DIVERSIFICATION POTENTIAL OF REAL ESTATE
NORGES BANK INVESTMENT MANAGEMENT / DISCUSSION NOTE
lematic, as real estate breaches a number of assumptions of the standard MPT framework. In particular, returns are not normally distributed (see e.g. Young and Graff, 1995, Young et al., 2006, Young, 2008), investments tend to be illiquid (Liu et al., 1990a) and there are significant costs associated with investing in real estate (Chua, 1999). The shortcomings of real estate indices should also be considered (see discussion in section 3.3). However, even with adjustments aimed at making the studies more realistic, the optimal allocations to real estate still appear to be high and significantly above the observed actual allocations.
More recent studies of optimal allocations to real estate tend to use more sophisticated approaches and account for a number of realestatespecific issues. Chua (1999) applies a series of corrections to the data, allowing for taxes, transaction costs, asset management fees and appraisal smoothing. Several studies allow for the illiquidity of real estate, ranging from a simple subtraction of an arbitrary illiquidity premium (Hoesli and Lizieri, 2007) to more complex, searchbased approaches (Fisher et al., 2003, Bond et al., 2006, Cheng et al., 2013). While most studies focus on specific countries, predominantly the US and the UK, mainly due to data availability, some researchers also tried to look at allocations to global real estate (Chua, 1999, Hoesli et al., 2004). Other studies apply even more sophisticated optimisation approaches, e.g. bootstrapping techniques to estimate confidence intervals (e.g. Liang et al., 1996, Ziobrowski et al., 1997), use alternative risk measures (Sing and Ong, 2000, Cheng, 2001, Hamelink and Hoesli, 2004b, Coleman and Mansour, 2005) or consider allocations in an assetliability framework (Chun et al., 2000, Craft, 2001, Brounen et al., 2010). Although the results vary, many of the studies still conclude that allocations significantly above 10 percent are desirable, as indicated in Figure 2. However, when reviewing the academic research one needs to bear in mind the general challenges associated with this kind of analysis. Data are scarce, have a short history and are frequently burdened with flaws such as appraisal smoothing, as discussed in section 3.3.
8
THE DIVERSIFICATION POTENTIAL OF REAL ESTATE
NORGES BANK INVESTMENT MANAGEMENT / DISCUSSION NOTE
Figure 2: Optimal or suggested allocations to private real estate in selected academic studies7
Source: Seiler et al. (1999) and own literature research.
The impact of the investment horizon on real estate allocations has been addressed in a number of studies (e.g. Mueller and Mueller, 2003, Lee and Stevenson, 2006), and some of the more recent research draws attention to the role of return predictability in this context. The fact that there is typically some level of momentum in real estate returns, even after accounting for smoothing, can be attributed to relatively slow adjustments on leasing markets as well as long construction periods. MacKinnon and Al Zaman (2009) utilise a vector autoregressive (VAR) model to extract the unpredictable portion of return variation in US real estate. They note that return volatility in the long term is reduced due to mean reversion, but the effect is stronger for listed equities than for private real estate. However, they also note that correlations between real estate and other asset classes tend to decrease with an increasing investment horizon. The resulting improvement of the diversification benefit leads to higher optimal allocations to real estate for investors with longer investment horizons. According to MacKinnon and Al Zaman (2009), allocations of 20 percent appear optimal for an investment horizon of one year, while 30 percent is optimal for an investment horizon of 25 years. Rehring (2012) applies the same approach to UK data and arrives at an even wider spread of real estate allocations between short and longterm investors ranging from close to zero for a oneyear investment horizon to over 60 percent for a 20year horizon. These results contrast with the results of Pagliari (2011). In his model, which takes autocorrelations of returns into consideration, the allocation to real estate appears to decline with the investment horizon from an average of approx. 30 percent for a oneyear horizon to an average of approx. 10 percent for an infinite horizon. Cheng et al. (2013) consider the optimal holding period as a function of liquidity and transaction costs. Their modified allocation model yields lower optimal allocations to real estate in the range of 3 to 9 percent, but the derived optimal holding periods are much shorter, ranging from two to six years.
7 It should be noted that not all of the papers explicitly state the optimal allocation ranges, but rather pro-vide a wide range of alternatives depending on various assumptions. Where possible, medium-risk allocations for long-term investors have been used.
0% 10% 20% 30% 40% 50% 60% 70% 80% 90%
Cheng et al (2013)Rehring (2012)Pagliari (2011)
Bond & Slezak (2010)MacKinnon & Al Zaman (2009)
Idzorek et al. (2007)Hoesli & Lizieri (2007)
Bond et al. (2006)Hoesli et al. (2004)Fisher et al. (2003)
Feldman (2003)Hamelink & Hoesli (2004b)
Cheng (2001)Craft (2001)
Chun et al. (2000)Sing & Ong (2000)
Chua (1999)Ziobrowski et al. (1999)
Boyd et al. (1998)Ziobrowski et al. (1997)
Liang et al. (1996)Kallberg et al. (1996)
Giliberto (1992)Firstenberg et al. (1988)
Webb et al. (1988)Irvin & Landa (1987)
Webb & Rubens (1987)Brinson et al. (1986)
Gold (1986)Hartzell (1986)
Webb & Rubens (1986)Cooperman et al. (1984)
Fogler (1984)

9
THE DIVERSIFICATION POTENTIAL OF REAL ESTATE
NORGES BANK INVESTMENT MANAGEMENT / DISCUSSION NOTE
Summing up, despite the shortcomings of the individual studies, most of the literature concludes that the addition of private real estate to a mixedasset portfolio is beneficial, and recommends allocations in the range of 10 to 20 percent.
2.3 Real estate allocations of institutional investorsInstitutional investors’ allocations to real estate vary strongly depending on the geographical region and investor type. A study by Cornell University and Hodes Weill & Associates (2013) surveys allocations of 198 institutional investors worldwide and finds an average allocation to real estate of 8.8 percent, which is below their average declared target allocation of 9.8 percent.8 A breakdown by type of institution reveals that the highest allocations are targeted by family offices, sovereign wealth funds (SWFs) and governmentowned entities (GEs), and public pensions, which are typically longterm investors aiming at preservation of real values. The breakdown by size of the investment portfolio reveals that smaller investors tend to have higher target allocations. Finally, the geographical breakdown indicates that US investors tend to have lower allocations than European and Asian ones.
Figure 3: Average target allocations to real estate in 2013 (sample size in brackets)
Source: Cornell University and Hodes Weill & Associates (2013).
Other studies report slightly lower allocations to real estate. For example, Andonov et al. (2013 and 2015) look at pension funds using a very large database with over 900 funds, mostly in the US and Canada. They find an average allocation of approx. 6.5 percent, but indicate that it increased from 4 percent at the beginning of the decade after having declined from approx. 7 percent in 1990. Looking further back, Ennis and Burik (1991) report that US pension funds’ investments in real estate were even higher during the early 1980s, reaching 13 to 15 percent, and declined to 7 percent in 1990. For European
8 The definition of real estate was not imposed by the survey and differed across the participants. Approx. 50 percent of respondents included REITs and real estate securities in their real estate allocation, and approx. 44 percent included real-estate-secured debt. Others treated listed investments as part of their equity or bond allocations.
8,0 %9,1 %
8,3 %9,3 %
12,0 %
9,8 % 10,2 %
8,4 % 8,4 % 8,8 %9,6 % 9,9 %
10,8 %
17,7 %
8,4 %
12,2 %12,5 %
9,8 %
0%
2%
4%
6%
8%
10%
12%
14%
16%
18%
20%
10
THE DIVERSIFICATION POTENTIAL OF REAL ESTATE
NORGES BANK INVESTMENT MANAGEMENT / DISCUSSION NOTE
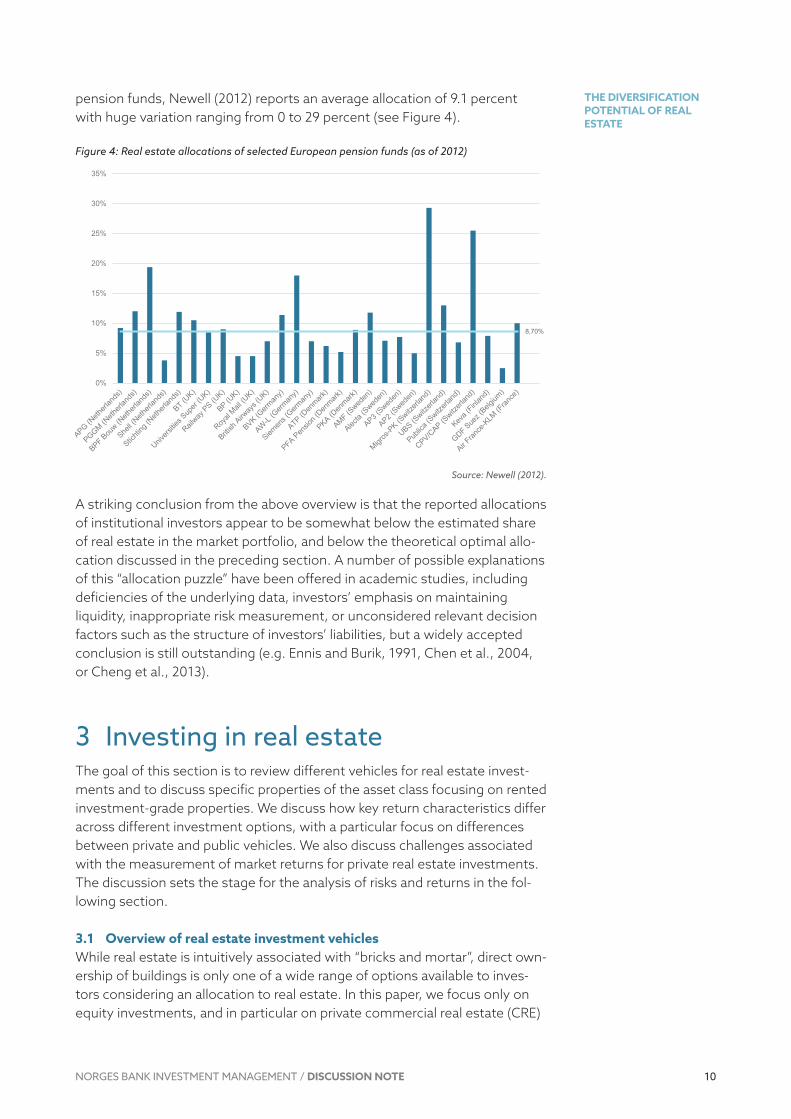
pension funds, Newell (2012) reports an average allocation of 9.1 percent with huge variation ranging from 0 to 29 percent (see Figure 4).
Figure 4: Real estate allocations of selected European pension funds (as of 2012)
Source: Newell (2012).
A striking conclusion from the above overview is that the reported allocations of institutional investors appear to be somewhat below the estimated share of real estate in the market portfolio, and below the theoretical optimal allocation discussed in the preceding section. A number of possible explanations of this “allocation puzzle” have been offered in academic studies, including deficiencies of the underlying data, investors’ emphasis on maintaining liquidity, inappropriate risk measurement, or unconsidered relevant decision factors such as the structure of investors’ liabilities, but a widely accepted conclusion is still outstanding (e.g. Ennis and Burik, 1991, Chen et al., 2004, or Cheng et al., 2013).
3 Investing in real estateThe goal of this section is to review different vehicles for real estate investments and to discuss specific properties of the asset class focusing on rented investmentgrade properties. We discuss how key return characteristics differ across different investment options, with a particular focus on differences between private and public vehicles. We also discuss challenges associated with the measurement of market returns for private real estate investments. The discussion sets the stage for the analysis of risks and returns in the following section.
3.1 Overview of real estate investment vehiclesWhile real estate is intuitively associated with “bricks and mortar”, direct ownership of buildings is only one of a wide range of options available to investors considering an allocation to real estate. In this paper, we focus only on equity investments, and in particular on private commercial real estate (CRE)
8,70%
0%
5%
10%
15%
20%
25%
30%
35%

11
THE DIVERSIFICATION POTENTIAL OF REAL ESTATE
NORGES BANK INVESTMENT MANAGEMENT / DISCUSSION NOTE
investments. However, for the sake of completeness, other options should also be mentioned.
A common way of looking at real estate investment vehicles is in terms of four quadrants classifying them as equity or debt and as private or public (see Gordon, 1994, or HudsonWilson et al., 2003 and 2005). This classification results in four broad types of investments with distinctly different characteristics.
Table 1: Four quadrants of real estate
Equity DebtPrivate Direct ownership
Real estate fundsPrivate REITs
Private mortgages
Public Listed real estate companiesPublic REITs
Mortgagebacked securitiesCovered bonds
Source: NBIM based on Hudson-Wilson et al. (2003).
Private equity investments include, in particular, direct ownership of buildings. Such investments are typically bulky, illiquid and associated with high transaction costs. Since pricing arises from individual negotiations, and limited market information is publicly available, valuations in direct markets tend to adapt relatively slowly to changes in the value drivers, resulting in appraisal smoothing. As each direct real estate investment requires a significant amount of capital, only very large investors will be able to build a broadly diversified portfolio. In order to overcome the latter issue, private equity investments are often made via fund vehicles. Since the valuation of fund units is based on regular property appraisals, and their tradability is often limited, the key return characteristics of such investments are rather similar to direct ownership of a real estate portfolio.9 The levels and types of risks associated with investments in private real estate equity vary significantly with type of investment, ranging from lowrisk, incomeproducing “core” properties, through development and repositioning projects, to highly speculative “opportunistic” investments.
Public equity investments in real estate are usually conducted via listed property companies or real estate investment trusts (REITs). These vehicles are in many ways similar to other listed stocks. However, the main source of revenue in these companies is rental income from real estate. Also, in the case of REITs, the companies enjoy certain taxation benefits if they comply with specific regulations, the most notable of which include limiting their business activities to real estate and distributing most of their profits as dividends.10 A more detailed discussion, as well as a comparison of private and public equity investments, follows in the next section.
9 The main difference between non-listed real estate funds and direct investments is the impact of fees associated with the non-listed vehicles, which can be complex and differ strongly across countries and fund types (see INREV, 2014). However, fees should essentially reflect the costs of managing the assets and operat-ing the fund, which are also borne by a direct investor. Hence the main difference should be the cost of those parts of the fund’s operations which are not related to asset management (e.g. investor relations and fund raising).
10 While REIT regulations are in place in numerous countries worldwide, and the main features remain simi-lar, there are some differences in the details (see e.g. EPRA Global REIT Survey at http://www.epra.com). Also, there are significant differences in the maturity and the breadth of the sectors across countries.

12
THE DIVERSIFICATION POTENTIAL OF REAL ESTATE
NORGES BANK INVESTMENT MANAGEMENT / DISCUSSION NOTE
While debt investments are outside the scope of this paper, we briefly discuss some of the available options for the sake of completeness. The exposure to real estate is indirect – while the income stream until maturity is defined in the loan agreement, the default probability and the recovery value depend on the state of the real estate market. Private debt issues with a property as collateral are the most common type of real estate debt instrument available. While in many regions, especially in Europe and Asia, financing of property transactions is provided predominantly by banks, institutional investors, such as insurance companies, have been increasingly active lenders to commercial real estate in recent years, either directly or via dedicated real estate debt funds.11 Since contracts are highly individual, and the market lacks public transparency, valuation of these investments is challenging, and their liquidity limited. Securitised listed real estate debt is another option in the debt space. These instruments are generally highly liquid and offer a higher level of diversification by bundling large numbers of loans. Among the most popular instruments of this type are various types of mortgagebacked securities (MBSs) and covered bonds.
3.2 Private vs public real estateInvestments in listed real estate companies are sometimes considered to constitute an alternative to private real estate investments offering superior liquidity. However, from a portfolio perspective, substitutability of private investments with public ones depends on the similarity of their return characteristics: expected returns and volatilities, and even more importantly, correlations with other investment opportunities.
Real estate investments constitute the main part of real estate companies’ asset holdings and their main source of income. For example, Real Estate Investment Trusts (REITs) in the US are required by law to have at least 75 percent of their assets in real estate, derive at least 95 percent of income from property, dividends and interest, and pay dividends of at least 90 percent of taxable income. Regulations in other countries are similar. Hence, the valuation of these companies should be fundamentally driven by the same factors as privately held buildings in the underlying real estate markets. However, valuation may also be affected by other factors. In particular, REITs are typically leveraged, so the valuation of their debt is also reflected in the stock price, and part of the income stream in a REIT can come from activities other than owning real estate, e.g. from fees for managing properties or development activities. Even more importantly, general stock market sentiment can have a profound shortterm effect on REIT share prices, leading to deviations from real estate market trends.
The return time series of the US listed real estate index in Figure 5 (NAREIT) compared with private real estate indices reveals significant shortterm differences with respect to both broad trends and the level of volatility. Indeed, early research analysing returns of public real estate noted that their shortterm behaviour, as measured by contemporaneous correlations, resembles that of the general stock market and has little in common with the available private real estate indices (Goetzmann and Ibbotson, 1990, Ross and Zisler, 1991). However, later research found that in the long term and after cor
11 See e.g. INREV Debt Funds Universe at http://www.inrev.org for an overview of active funds/lenders.

13
THE DIVERSIFICATION POTENTIAL OF REAL ESTATE
NORGES BANK INVESTMENT MANAGEMENT / DISCUSSION NOTE
recting for specific data issues, the link between public and private is much stronger (e.g. Pagliari et al., 2003 and 2005). In fact, Clayton and MacKinnon (2001 and 2003) argue that the REIT sector underwent a maturing process in the 1980s and 1990s, resulting in a stronger link with the underlying real estate markets. Currently, there is a wide consensus that the link between public and private real estate increases with a longer investment horizon (e.g. Morawski et al., 2008, McKinnon and Al Zaman, 2009, Oikarinen et al., 2011, Hoesli and Oikarinen, 2012, Stefek and Suryanarayanan, 2012, Haran et al., 2013, Ling and Naranjo, 2015, Hoesli et al., 2015) and that there is a common real estate factor driving both vehicles (e.g. Mei and Lee 1994, Bond and Hwang, 2003, Ang et al. 2013).
However, even though the commonality of private and public real estate does seem to be strong, and several studies have found a common factor driving both return series, substitutability is not perfect. For example, Ang et al. (2013) found that all real estate indices, both private and public, were loading on a common factor. However, unlike for private real estate, innovations in public real estate indices, i.e. portions of return not attributable to the common factor, were positively correlated with equity and bond indices, indicating that the real estate exposure achieved with listed property shares may be “polluted” by equity and bond factors. McKinnon and Al Zaman (2009) state that although the correlation between private and public indices increases with the investment horizon, it is still only 0.54 on the 25year view. In fact, several studies concluded that it is beneficial to add both types of real estate investments to the portfolio (Stevenson, 2001, Feldman, 2003, Mueller and Mueller, 2003).
The case for including both listed and private real estate investments in the strategy strengthens further when practical implications are considered. Listed investments are more liquid and enable shortterm portfolio adjustments, which may be necessary to achieve rebalancing strategies in periods of market turbulence. Furthermore, some regions, sectors and other real estate submarkets might be more accessible with listed instruments. On the other hand, despite the growing popularity of REITs, this type of investment vehicle is still not available in many countries, and where it is available, it often has a very low market capitalisation or does not cover all real estate segments. DTZ estimates that public real estate accounts for only around 8 percent of global invested real estate; the equivalent estimate by EPRA is only slightly higher at around 11 percent. This means that the implementation of a specific global real estate allocation using only listed vehicles may prove impossible in practice. Thus, including both listed and private real estate investments may increase the possibility to harvest the risk premium inherent in the real estate market and provide the means to implement a predefined investment strategy.
3.3 Challenges in measuring real estate market returnsMeasuring returns of private real estate investments is challenging due to poor availability of data and numerous sources of bias in the data. Return time series for direct real estate investments are scarce. The majority of the available indices have a relatively short history (often less than ten years) and low frequency (annual). Furthermore, issues arising from the quality of the

14
THE DIVERSIFICATION POTENTIAL OF REAL ESTATE
NORGES BANK INVESTMENT MANAGEMENT / DISCUSSION NOTE
underlying data and index construction methodology affect the reliability of risk and return estimations based on these indices. Nevertheless, these data series should provide useful insights into the characteristics of real estate.
Most of the available real estate indices use appraisals for estimating the values of the underlying property pool. This is known to create certain biases referred to as “smoothing” in the time series. As a result, these indices tend to understate the volatility in returns and reflect market developments with a lag. Smoothing appears on two levels for distinctly different reasons:
• Smoothing on a disaggregated level resulting from the anchoring of property values by appraisers to past values due to the unavailability of more recent market information, which is the consequence of poor market transparency (Geltner, 1989, Clayton et al., 2001). As demonstrated by Quan and Quigley (1991), it is rational for appraisers committed to maximising valuation precision in such markets to anchor new valuations to the most recently available ones.
• Smoothing on an aggregated level, resulting from the aggregation of a large number of valuations in a single index. This may happen when not all properties in the index are actually valued on the same date, or only a part of the portfolio is revalued in each period, which is typically the case (Geltner, 1993).
As a consequence of smoothing, appraisalbased indices average past and current values, resulting in a moving average process. In order to tackle this issue and retrieve estimates of “true” market volatility and correlations, a number of “unsmoothing” techniques have been developed. The most straightforward one reverses the moving average process and removes the autocorrelation in the historical index series (Geltner, 1991 and 1993), while more sophisticated methods refer to observed transactions (Fisher et al., 1994, Fisher, 2000) and allow for variable market liquidity (Fisher et al., 2003) or regime switching (Lizieri et al., 2012). In either case, some uncertainty remains as to the appropriate level of unsmoothing.12
IPD/MSCI is the only global provider of appraisalbased total return indices for private real estate across a number of different geographical markets. In addition to IPD/MSCI, national indices exist in a number of countries, NCREIF in the US being the most notable one. Due to data availability, much of the research on real estate investment returns is based on data for the US and the UK, using the NCREIF property index available quarterly since 1978 and/or the IPD UK index available monthly since 1985. Both indices aim to reflect performance measured at a property level, excluding transaction costs, taxation, currency and financing effects. They are based on detailed cash flows and regular appraisals reported to NCREIF and MSCI/IPD directly by investors and portfolio managers.
An alternative to appraisalbased indices are indices based on observed transaction values. Given the lack of public transparency and relatively low
12 A reverse filter as defined by Geltner (1993) is used for unsmoothing in this paper. The level of unsmooth-ing depends on the assumption regarding the magnitude of the moving average process, which is reflected in the unsmoothing parameter. For the purpose of this paper, we set this parameter at a level which results in autocorrelation of quarterly returns on the same level as observed in listed real estate returns.
15
THE DIVERSIFICATION POTENTIAL OF REAL ESTATE
NORGES BANK INVESTMENT MANAGEMENT / DISCUSSION NOTE
transaction frequency in real estate markets, these return measures are typically based on fewer data points. This is their major weakness. In addition, comparability of transacted properties represents a challenge. This is typically solved by applying repeatsales measures (including only multiple sales of the same property) or hedonic index techniques (regressing observed prices on the characteristics of the properties and deriving the price of a hypothetical standard property).13 Another challenge is the varying intensity and structure of transactions over time, which can lead to inconsistencies.14
A notable example of a transactionbased index is the TBI proposed by Fisher et al. (2007), based on earlier work by Fisher et al. (2003). This index is produced by NCREIF. It utilises information about sales prices achieved for properties in the NCREIF database, relating them to pretransaction appraisals.15 Another example of a family of transactionbased indices is the CPPI published by Real Capital Analytics (RCA) and Moody’s. These indices are based on transaction information in the RCA database and calculated as repeatsales indices for the US. A UK version of the index is also available, developed on the basis of Chegut et al. (2013).
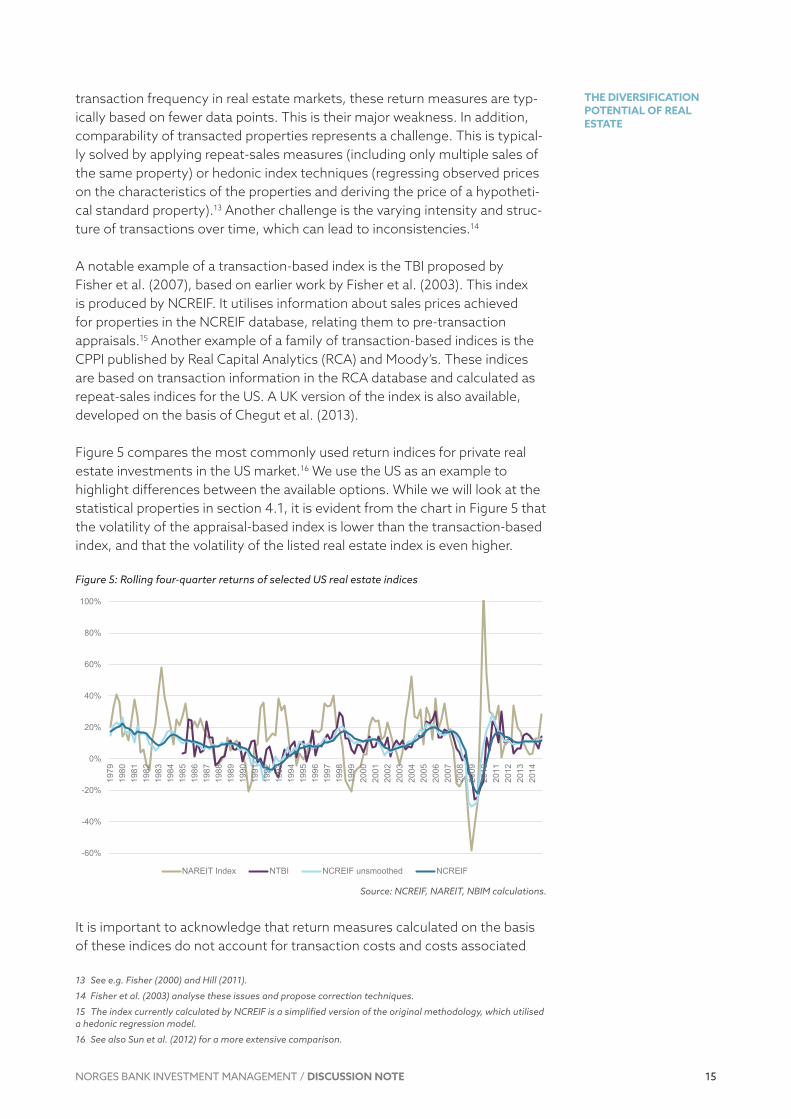
Figure 5 compares the most commonly used return indices for private real estate investments in the US market.16 We use the US as an example to highlight differences between the available options. While we will look at the statistical properties in section 4.1, it is evident from the chart in Figure 5 that the volatility of the appraisalbased index is lower than the transactionbased index, and that the volatility of the listed real estate index is even higher.
Figure 5: Rolling four-quarter returns of selected US real estate indices
Source: NCREIF, NAREIT, NBIM calculations.
It is important to acknowledge that return measures calculated on the basis of these indices do not account for transaction costs and costs associated
13 See e.g. Fisher (2000) and Hill (2011).
14 Fisher et al. (2003) analyse these issues and propose correction techniques.
15 The index currently calculated by NCREIF is a simplified version of the original methodology, which utilised a hedonic regression model.
16 See also Sun et al. (2012) for a more extensive comparison.
-60%
-40%
-20%
0%
20%
40%
60%
80%
100%
1979
1980
1981
1982
1983
1984
1985
1986
1987
1988
1989
1990
1991
1992
1993
1994
1995
1996
1997
1998
1999
2000
2001
2002
2003
2004
2005
2006
2007
2008
2009
2010
2011
2012
2013
2014
NAREIT Index NTBI NCREIF unsmoothed NCREIF
16
THE DIVERSIFICATION POTENTIAL OF REAL ESTATE
NORGES BANK INVESTMENT MANAGEMENT / DISCUSSION NOTE
with structuring real estate investments. While these costs are typically negligible for equities and bonds, they can be significant for private real estate investments. Collett et al. (2003) assume a roundtrip cost of 7 to 8 percent in the UK, but it can also be in excess of 10 percent in some countries.17 Additionally, taxation of privately held real estate can be very complex and significantly different from the rules applicable to listed vehicles, which additionally complicates the comparability of returns. While it is outside the scope of this paper to cover all these aspects, one needs to be aware of their potential impact on riskreturn profiles from the point of view of a reallife investor.
4 Risk and return from real estateThe goal of this section is to review the riskreturn profile of real estate investments. The first part addresses return levels and return volatilities, looking at their levels and stability over time. An analysis of correlations with other types of assets follows. Additionally, some more specific issues which are not captured by return volatility measures are discussed, in particular assetspecific risks and liquidity.
4.1 Risk-return profilesThis section focuses on riskreturn characteristics of real estate investments, including a review of historical return levels and volatilities for the available indices, and compares them with returns of broad equity market indices and government bonds.
In order to assess the riskreturn profile of real estate investments, a decision needs to be made on which type of data to use. As discussed in section 3.3, all of the time series available for this purpose have some weaknesses. Appraisalbased indices require unsmoothing, which is always arbitrary to some extent, while transactionbased indices suffer from thin data and the heterogeneity of transactions, which can introduce significant amounts of noise. Moreover, there are only a handful of transactionbased indices available worldwide. It is mainly for the latter reason that we consider unsmoothed valuationbased indices to be most likely to provide the least biased picture of global real estate return characteristics. We also argue that the picture provided by indices based on listed real estate companies is likely to be biased due to influences from leverage and general stock market trends.
In order to validate the decision to use unsmoothed appraisalbased indices for further analysis, we review the key return and risk metrics for various measures of real estate returns in the US and the UK, which are the most transparent markets with the longest total return time series. In addition to the options discussed earlier, we also look at the returns of public real estate companies after correcting for the effects of leverage.18 Public equities were
17 See CMS (2012) for an international overview.
18 A simplified method of removing leverage effects is used in this paper. Rather than doing this on a company-by-company basis, we assume constant average gearing of 40 percent and a financing cost 200 basis points above the three-month swap rate (assumptions based on data from EPRA and NAREIT as well as anecdotal evidence). While certainly imprecise, the result should be sufficient for the purpose of this section.
17
THE DIVERSIFICATION POTENTIAL OF REAL ESTATE
NORGES BANK INVESTMENT MANAGEMENT / DISCUSSION NOTE
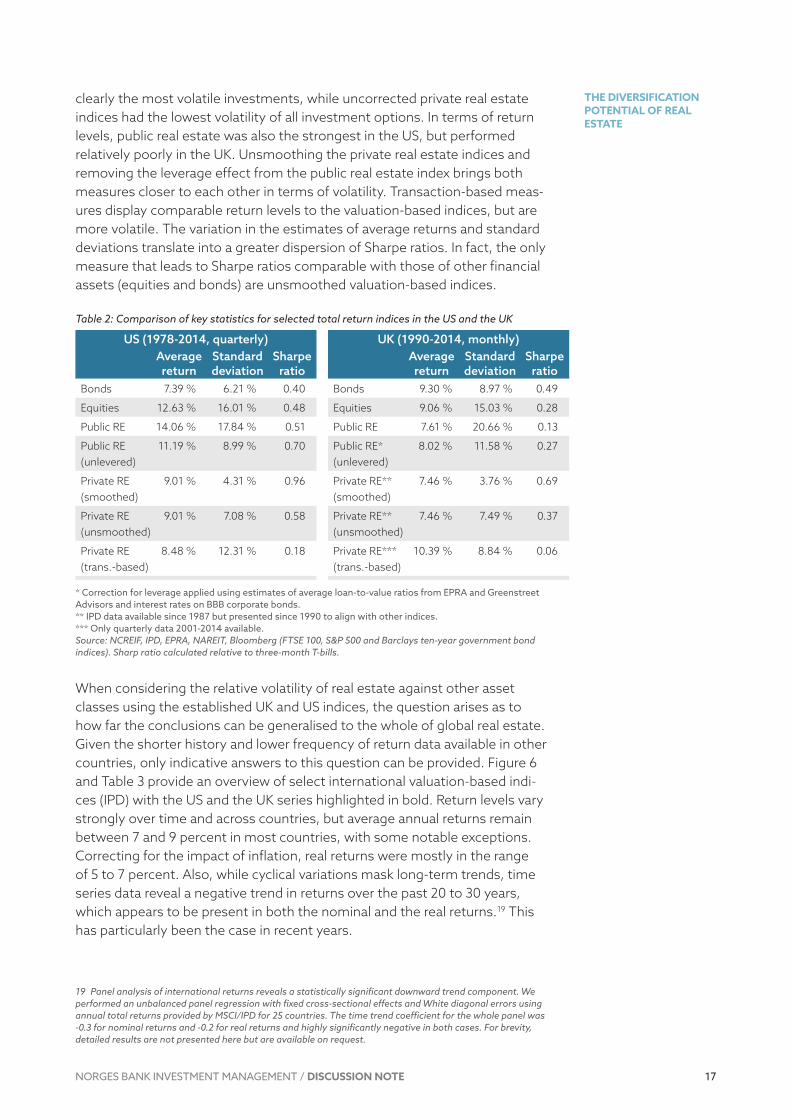
clearly the most volatile investments, while uncorrected private real estate indices had the lowest volatility of all investment options. In terms of return levels, public real estate was also the strongest in the US, but performed relatively poorly in the UK. Unsmoothing the private real estate indices and removing the leverage effect from the public real estate index brings both measures closer to each other in terms of volatility. Transactionbased measures display comparable return levels to the valuationbased indices, but are more volatile. The variation in the estimates of average returns and standard deviations translate into a greater dispersion of Sharpe ratios. In fact, the only measure that leads to Sharpe ratios comparable with those of other financial assets (equities and bonds) are unsmoothed valuationbased indices.
Table 2: Comparison of key statistics for selected total return indices in the US and the UK
US (1978-2014, quarterly) UK (1990-2014, monthly)Average return
Standard deviation
Sharpe ratio
Average return
Standard deviation
Sharpe ratio
Bonds 7.39 % 6.21 % 0.40 Bonds 9.30 % 8.97 % 0.49
Equities 12.63 % 16.01 % 0.48 Equities 9.06 % 15.03 % 0.28
Public RE 14.06 % 17.84 % 0.51 Public RE 7.61 % 20.66 % 0.13
Public RE (unlevered)
11.19 % 8.99 % 0.70 Public RE* (unlevered)
8.02 % 11.58 % 0.27
Private RE (smoothed)
9.01 % 4.31 % 0.96 Private RE** (smoothed)
7.46 % 3.76 % 0.69
Private RE (unsmoothed)
9.01 % 7.08 % 0.58 Private RE** (unsmoothed)
7.46 % 7.49 % 0.37
Private RE (trans.based)
8.48 % 12.31 % 0.18 Private RE*** (trans.based)
10.39 % 8.84 % 0.06
* Correction for leverage applied using estimates of average loan-to-value ratios from EPRA and Greenstreet Advisors and interest rates on BBB corporate bonds. ** IPD data available since 1987 but presented since 1990 to align with other indices. *** Only quarterly data 2001-2014 available. Source: NCREIF, IPD, EPRA, NAREIT, Bloomberg (FTSE 100, S&P 500 and Barclays ten-year government bond indices). Sharp ratio calculated relative to three-month T-bills.
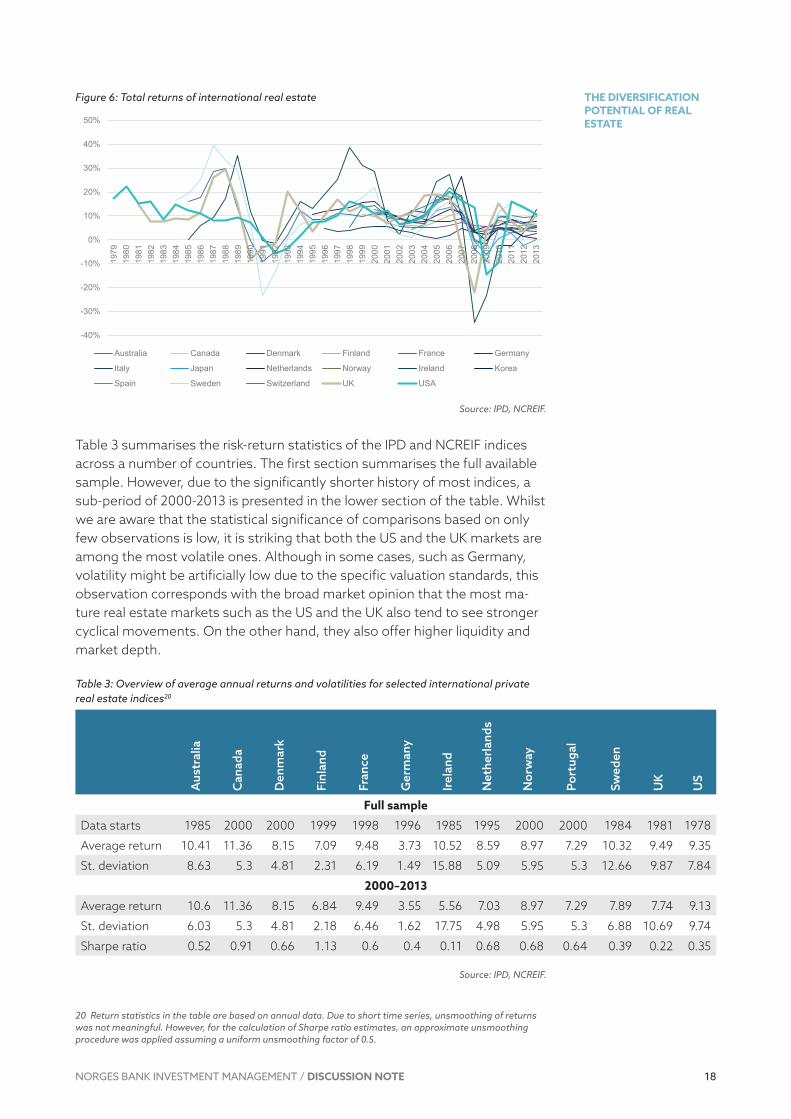
When considering the relative volatility of real estate against other asset classes using the established UK and US indices, the question arises as to how far the conclusions can be generalised to the whole of global real estate. Given the shorter history and lower frequency of return data available in other countries, only indicative answers to this question can be provided. Figure 6 and Table 3 provide an overview of select international valuationbased indices (IPD) with the US and the UK series highlighted in bold. Return levels vary strongly over time and across countries, but average annual returns remain between 7 and 9 percent in most countries, with some notable exceptions. Correcting for the impact of inflation, real returns were mostly in the range of 5 to 7 percent. Also, while cyclical variations mask longterm trends, time series data reveal a negative trend in returns over the past 20 to 30 years, which appears to be present in both the nominal and the real returns.19 This has particularly been the case in recent years.
19 Panel analysis of international returns reveals a statistically significant downward trend component. We performed an unbalanced panel regression with fixed cross-sectional effects and White diagonal errors using annual total returns provided by MSCI/IPD for 25 countries. The time trend coefficient for the whole panel was -0.3 for nominal returns and -0.2 for real returns and highly significantly negative in both cases. For brevity, detailed results are not presented here but are available on request.
18
THE DIVERSIFICATION POTENTIAL OF REAL ESTATE
NORGES BANK INVESTMENT MANAGEMENT / DISCUSSION NOTE
Figure 6: Total returns of international real estate
Source: IPD, NCREIF.
Table 3 summarises the riskreturn statistics of the IPD and NCREIF indices across a number of countries. The first section summarises the full available sample. However, due to the significantly shorter history of most indices, a subperiod of 20002013 is presented in the lower section of the table. Whilst we are aware that the statistical significance of comparisons based on only few observations is low, it is striking that both the US and the UK markets are among the most volatile ones. Although in some cases, such as Germany, volatility might be artificially low due to the specific valuation standards, this observation corresponds with the broad market opinion that the most mature real estate markets such as the US and the UK also tend to see stronger cyclical movements. On the other hand, they also offer higher liquidity and market depth.
Table 3: Overview of average annual returns and volatilities for selected international private real estate indices20
Aus
tral
ia
Can
ada
Den
mar
k
Finl
and
Fran
ce
Ger
man
y
Irel
and
Net
herl
ands
Nor
way
Port
ugal
Swed
en
UK
US
Full sample
Data starts 1985 2000 2000 1999 1998 1996 1985 1995 2000 2000 1984 1981 1978
Average return 10.41 11.36 8.15 7.09 9.48 3.73 10.52 8.59 8.97 7.29 10.32 9.49 9.35
St. deviation 8.63 5.3 4.81 2.31 6.19 1.49 15.88 5.09 5.95 5.3 12.66 9.87 7.84
2000–2013
Average return 10.6 11.36 8.15 6.84 9.49 3.55 5.56 7.03 8.97 7.29 7.89 7.74 9.13
St. deviation 6.03 5.3 4.81 2.18 6.46 1.62 17.75 4.98 5.95 5.3 6.88 10.69 9.74
Sharpe ratio 0.52 0.91 0.66 1.13 0.6 0.4 0.11 0.68 0.68 0.64 0.39 0.22 0.35
Source: IPD, NCREIF.
20 Return statistics in the table are based on annual data. Due to short time series, unsmoothing of returns was not meaningful. However, for the calculation of Sharpe ratio estimates, an approximate unsmoothing procedure was applied assuming a uniform unsmoothing factor of 0.5.
-40%
-30%
-20%
-10%
0%
10%
20%
30%
40%
50%19
7919
8019
8119
8219
8319
8419
8519
8619
8719
8819
8919
9019
9119
9219
9319
9419
9519
9619
9719
9819
9920
0020
0120
0220
0320
0420
0520
0620
0720
0820
0920
1020
1120
1220
13
Australia Canada Denmark Finland France Germany
Italy Japan Netherlands Norway Ireland Korea
Spain Sweden Switzerland UK USA
19
THE DIVERSIFICATION POTENTIAL OF REAL ESTATE
NORGES BANK INVESTMENT MANAGEMENT / DISCUSSION NOTE
In particular in the US, the historical Sharpe ratios have been above those of bonds and equities, which led to some researchers raising the question of a “real estate risk premium puzzle” (e.g. Shilling, 2003). However, when considering index return volatility and related measures such as the Sharpe ratio, one needs to consider that real estate investments are frequently subject to risks other than market price fluctuations, e.g. risks related to specific assets or arising from the lack of liquidity. We discuss these assetspecific risks in sections 4.3 and 4.4.
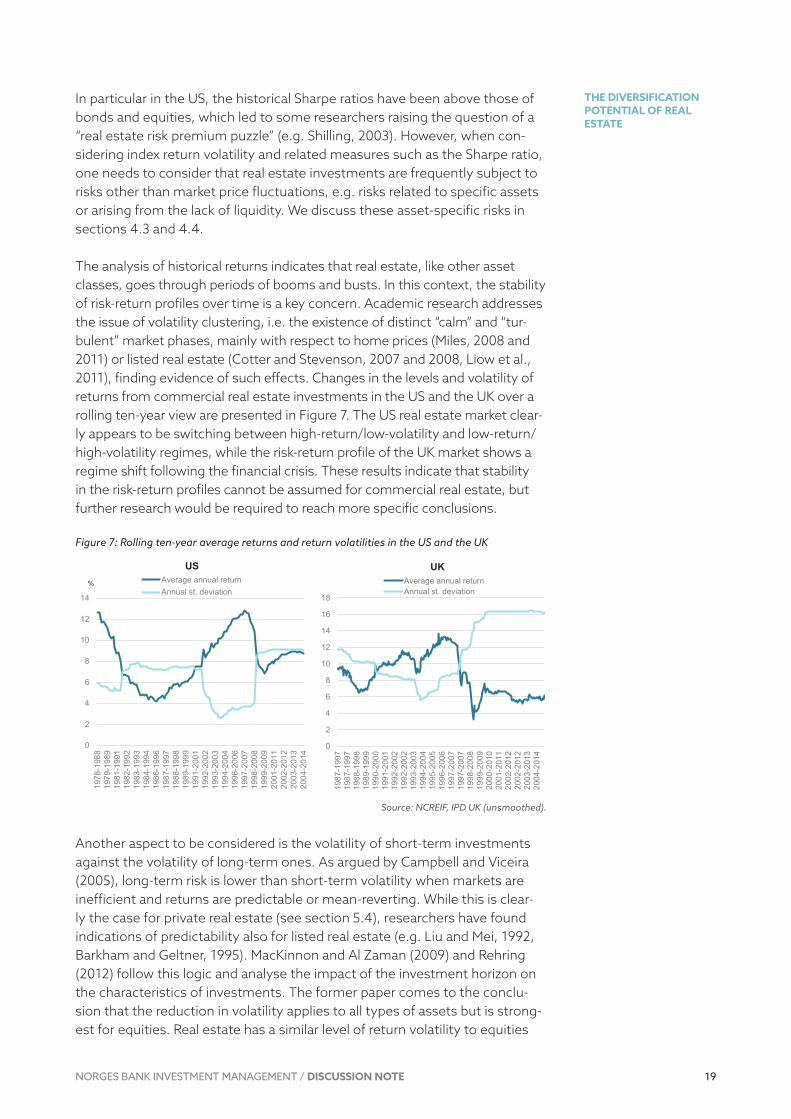
The analysis of historical returns indicates that real estate, like other asset classes, goes through periods of booms and busts. In this context, the stability of riskreturn profiles over time is a key concern. Academic research addresses the issue of volatility clustering, i.e. the existence of distinct “calm” and “turbulent” market phases, mainly with respect to home prices (Miles, 2008 and 2011) or listed real estate (Cotter and Stevenson, 2007 and 2008, Liow et al., 2011), finding evidence of such effects. Changes in the levels and volatility of returns from commercial real estate investments in the US and the UK over a rolling tenyear view are presented in Figure 7. The US real estate market clearly appears to be switching between highreturn/lowvolatility and lowreturn/highvolatility regimes, while the riskreturn profile of the UK market shows a regime shift following the financial crisis. These results indicate that stability in the riskreturn profiles cannot be assumed for commercial real estate, but further research would be required to reach more specific conclusions.
Figure 7: Rolling ten-year average returns and return volatilities in the US and the UK
Source: NCREIF, IPD UK (unsmoothed).
Another aspect to be considered is the volatility of shortterm investments against the volatility of longterm ones. As argued by Campbell and Viceira (2005), longterm risk is lower than shortterm volatility when markets are inefficient and returns are predictable or meanreverting. While this is clearly the case for private real estate (see section 5.4), researchers have found indications of predictability also for listed real estate (e.g. Liu and Mei, 1992, Barkham and Geltner, 1995). MacKinnon and Al Zaman (2009) and Rehring (2012) follow this logic and analyse the impact of the investment horizon on the characteristics of investments. The former paper comes to the conclusion that the reduction in volatility applies to all types of assets but is strongest for equities. Real estate has a similar level of return volatility to equities
0
2
4
6
8
10
12
14
1978
-198
819
79-1
989
1981
-199
119
82-1
992
1983
-199
319
84-1
994
1986
-199
619
87-1
997
1988
-199
819
89-1
999
1991
-200
119
92-2
002
1993
-200
319
94-2
004
1996
-200
619
97-2
007
1998
-200
819
99-2
009
2001
-201
120
02-2
012
2003
-201
320
04-2
014
Average annual returnAnnual st. deviation
US%
0
2
4
6
8
10
12
14
16
18
1987
-199
719
87-1
997
1988
-199
819
89-1
999
1990
-200
019
91-2
001
1992
-200
219
92-2
002
1993
-200
319
94-2
004
1995
-200
519
96-2
006
1997
-200
719
97-2
007
1998
-200
819
99-2
009
2000
-201
020
01-2
011
2002
-201
220
02-2
012
2003
-201
320
04-2
014
Average annual returnAnnual st. deviation
UK
0
2
4
6
8
10
12
14
1978
-198
819
79-1
989
1981
-199
119
82-1
992
1983
-199
319
84-1
994
1986
-199
619
87-1
997
1988
-199
819
89-1
999
1991
-200
119
92-2
002
1993
-200
319
94-2
004
1996
-200
619
97-2
007
1998
-200
819
99-2
009
2001
-201
120
02-2
012
2003
-201
320
04-2
014
Average annual returnAnnual st. deviation
US%
0
2
4
6
8
10
12
14
16
18
1987
-199
719
87-1
997
1988
-199
819
89-1
999
1990
-200
019
91-2
001
1992
-200
219
92-2
002
1993
-200
319
94-2
004
1995
-200
519
96-2
006
1997
-200
719
97-2
007
1998
-200
819
99-2
009
2000
-201
020
01-2
011
2002
-201
220
02-2
012
2003
-201
320
04-2
014
Average annual returnAnnual st. deviation
UK
20
THE DIVERSIFICATION POTENTIAL OF REAL ESTATE
NORGES BANK INVESTMENT MANAGEMENT / DISCUSSION NOTE
on a 25year view, while bonds have a similar level to cash. This contrasts with the results of Rehring (2012) for the UK, who concludes that the reduction in volatility is stronger for real estate than for equities, while volatility increases with a longer investment horizon for bonds and Tbills. All in all, these studies confirm that the effective market risk level of real estate declines with a longer investment horizon, but the literature provides no clear conclusion regarding the relative change in riskreturn profile against other asset classes.
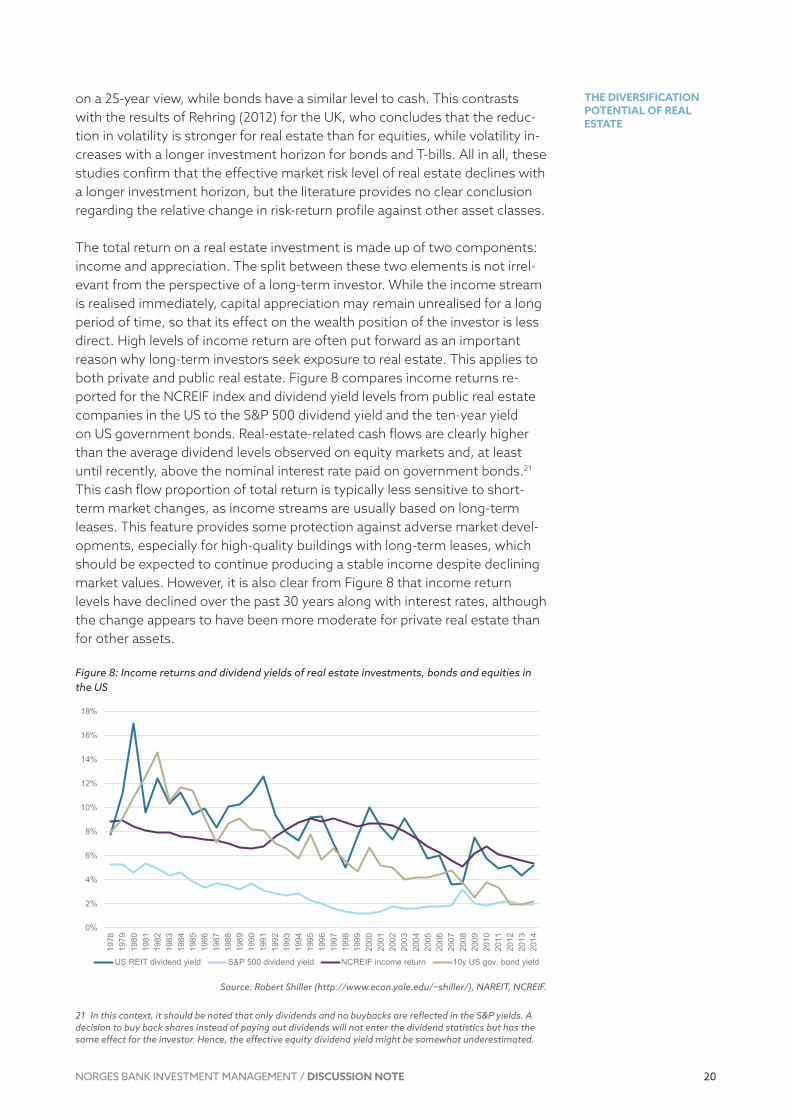
The total return on a real estate investment is made up of two components: income and appreciation. The split between these two elements is not irrelevant from the perspective of a longterm investor. While the income stream is realised immediately, capital appreciation may remain unrealised for a long period of time, so that its effect on the wealth position of the investor is less direct. High levels of income return are often put forward as an important reason why longterm investors seek exposure to real estate. This applies to both private and public real estate. Figure 8 compares income returns reported for the NCREIF index and dividend yield levels from public real estate companies in the US to the S&P 500 dividend yield and the tenyear yield on US government bonds. Realestaterelated cash flows are clearly higher than the average dividend levels observed on equity markets and, at least until recently, above the nominal interest rate paid on government bonds.21 This cash flow proportion of total return is typically less sensitive to shortterm market changes, as income streams are usually based on longterm leases. This feature provides some protection against adverse market developments, especially for highquality buildings with longterm leases, which should be expected to continue producing a stable income despite declining market values. However, it is also clear from Figure 8 that income return levels have declined over the past 30 years along with interest rates, although the change appears to have been more moderate for private real estate than for other assets.
Figure 8: Income returns and dividend yields of real estate investments, bonds and equities in the US
Source: Robert Shiller (http://www.econ.yale.edu/~shiller/), NAREIT, NCREIF.
21 In this context, it should be noted that only dividends and no buybacks are reflected in the S&P yields. A decision to buy back shares instead of paying out dividends will not enter the dividend statistics but has the same effect for the investor. Hence, the effective equity dividend yield might be somewhat underestimated.
0%
2%
4%
6%
8%
10%
12%
14%
16%
18%
1978
1979
1980
1981
1982
1983
1984
1985
1986
1987
1988
1989
1990
1991
1992
1993
1994
1995
1996
1997
1998
1999
2000
2001
2002
2003
2004
2005
2006
2007
2008
2009
2010
2011
2012
2013
2014
US REIT dividend yield S&P 500 dividend yield NCREIF income return 10y US gov. bond yield

21
THE DIVERSIFICATION POTENTIAL OF REAL ESTATE
NORGES BANK INVESTMENT MANAGEMENT / DISCUSSION NOTE
Summing up, various indices of real estate investments lead to different conclusions regarding the level of returns and volatility compared to other asset classes. Despite their deficiencies, valuationbased returns corrected for smoothing appear to offer the most precise measure of private real estate returns. Our analyses of such indices across a number of countries (IPD and NCREIF) show average historical returns to be in the range of 7 to 9 percent, with a declining trend over the past ten to 20 years. However, there is strong international and cyclical variation of returns in terms of both their levels and their volatility. Compared with other asset classes, the average returns and historical return volatilities of real estate have been closer to government bonds than to equities. Also, for the US and the UK, unsmoothed real estate indices show Sharpe ratios comparable or slightly above the levels measured for equity and bond indices. However, one needs to consider that riskreturn profiles may not be stable over time. Also, the riskreturn profiles of investments may be different for longterm investors, although there is no conclusive evidence that the reduction of the effective volatility should be higher for real estate than for other types of assets. Nevertheless, the fact that a high portion of the return is derived from income may indeed favour real estate in the long term.
4.2 CorrelationsLow correlations of real estate returns with returns of other asset classes are typically the key argument for introducing real estate investments into a mixedasset portfolio. A number of studies have found that private real estate indices correlate only weakly with equities and bonds. Hoesli and Lizieri (2007) report correlations close to zero for private real estate in the US and the UK, and find a negative correlation with bonds in Australia. Hoesli et al. (2004) review correlations for several other countries for the period from 1987 to 2001, finding moderate positive levels of correlation with equities and moderately negative levels of correlation with bonds. In contrast, for public real estate (REITs) most studies find moderate to high levels of correlation with the general equity market. This is in line with the discussion in section 3.2. In fact, a number of studies identify the equity market to be the main driver of returns in listed real estate (Peterson and Hsieh, 1999, Hoesli and Serrano, 2007, Lizieri, 2013).
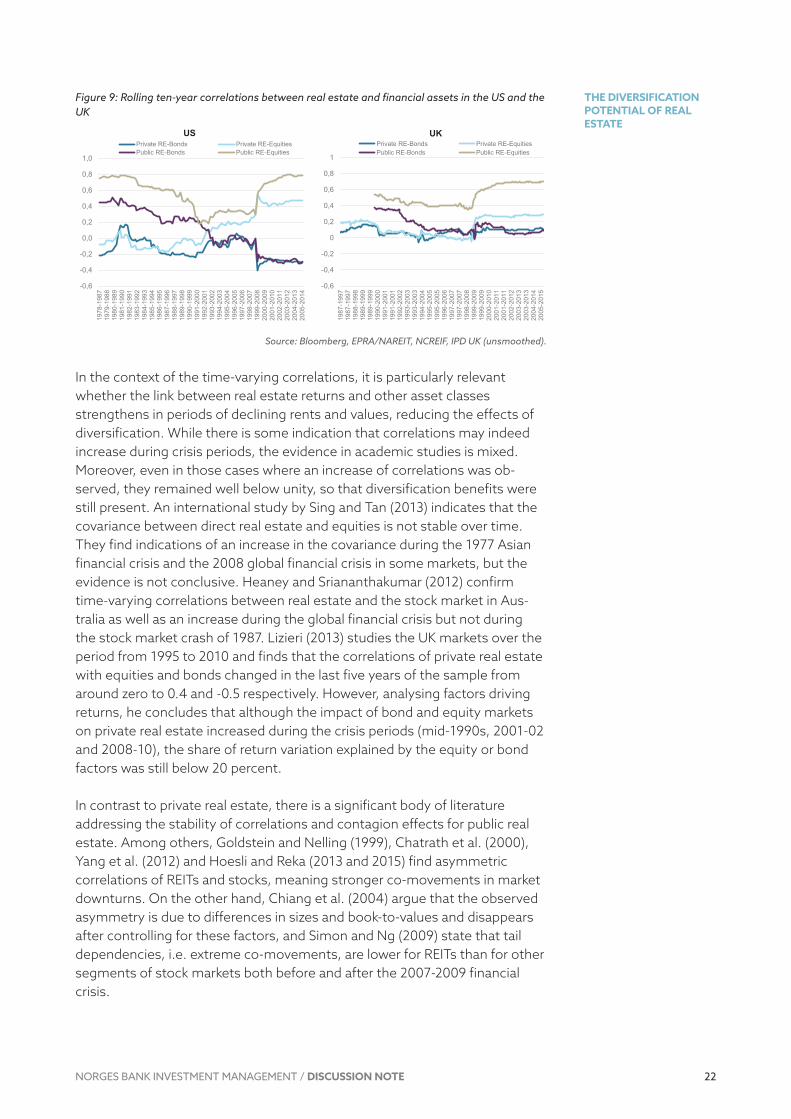
Correlations are, however, not stable over time. A look at the rolling correlations between private and public real estate versus equities and bonds in the US and the UK in Figure 9 reveals significant variation. In both countries, the correlations of real estate with equities appear to have increased markedly after the 2008 financial crisis, after having declined from higher levels in the 1990s (US). The correlation with bonds has remained relatively stable at or slightly below zero, except for the US REITs, for which it has declined strongly over the past 30 years. The conclusion from this observation is that the correlation patterns between real estate and other assets are not stable over time and might depend on the state of the markets.
22
THE DIVERSIFICATION POTENTIAL OF REAL ESTATE
NORGES BANK INVESTMENT MANAGEMENT / DISCUSSION NOTE
Figure 9: Rolling ten-year correlations between real estate and financial assets in the US and the UK
Source: Bloomberg, EPRA/NAREIT, NCREIF, IPD UK (unsmoothed).
In the context of the timevarying correlations, it is particularly relevant whether the link between real estate returns and other asset classes strengthens in periods of declining rents and values, reducing the effects of diversification. While there is some indication that correlations may indeed increase during crisis periods, the evidence in academic studies is mixed. Moreover, even in those cases where an increase of correlations was observed, they remained well below unity, so that diversification benefits were still present. An international study by Sing and Tan (2013) indicates that the covariance between direct real estate and equities is not stable over time. They find indications of an increase in the covariance during the 1977 Asian financial crisis and the 2008 global financial crisis in some markets, but the evidence is not conclusive. Heaney and Sriananthakumar (2012) confirm timevarying correlations between real estate and the stock market in Australia as well as an increase during the global financial crisis but not during the stock market crash of 1987. Lizieri (2013) studies the UK markets over the period from 1995 to 2010 and finds that the correlations of private real estate with equities and bonds changed in the last five years of the sample from around zero to 0.4 and 0.5 respectively. However, analysing factors driving returns, he concludes that although the impact of bond and equity markets on private real estate increased during the crisis periods (mid1990s, 200102 and 200810), the share of return variation explained by the equity or bond factors was still below 20 percent.
In contrast to private real estate, there is a significant body of literature addressing the stability of correlations and contagion effects for public real estate. Among others, Goldstein and Nelling (1999), Chatrath et al. (2000), Yang et al. (2012) and Hoesli and Reka (2013 and 2015) find asymmetric correlations of REITs and stocks, meaning stronger comovements in market downturns. On the other hand, Chiang et al. (2004) argue that the observed asymmetry is due to differences in sizes and booktovalues and disappears after controlling for these factors, and Simon and Ng (2009) state that tail dependencies, i.e. extreme comovements, are lower for REITs than for other segments of stock markets both before and after the 20072009 financial crisis.
-0,6
-0,4
-0,2
0,0
0,2
0,4
0,6
0,8
1,0
1978
-198
719
79-1
988
1980
-198
919
81-1
990
1982
-199
119
83-1
992
1984
-199
319
85-1
994
1986
-199
519
87-1
996
1988
-199
719
89-1
998
1990
-199
919
91-2
000
1992
-200
119
93-2
002
1994
-200
319
95-2
004
1996
-200
519
97-2
006
1998
-200
719
99-2
008
2000
-200
920
01-2
010
2002
-201
120
03-2
012
2004
-201
320
05-2
014
Private RE-Bonds Private RE-EquitiesPublic RE-Bonds Public RE-Equities
US
-0,6
-0,4
-0,2
0
0,2
0,4
0,6
0,8
1
1987
-199
719
87-1
997
1988
-199
819
89-1
999
1989
-199
919
90-2
000
1991
-200
119
91-2
001
1992
-200
219
93-2
003
1993
-200
319
94-2
004
1995
-200
519
95-2
005
1996
-200
619
97-2
007
1997
-200
719
98-2
008
1999
-200
919
99-2
009
2000
-201
020
01-2
011
2001
-201
120
02-2
012
2003
-201
320
03-2
013
2004
-201
420
05-2
015
Private RE-Bonds Private RE-EquitiesPublic RE-Bonds Public RE-Equities
UK
-0,6
-0,4
-0,2
0,0
0,2
0,4
0,6
0,8
1,0
1978
-198
719
79-1
988
1980
-198
919
81-1
990
1982
-199
119
83-1
992
1984
-199
319
85-1
994
1986
-199
519
87-1
996
1988
-199
719
89-1
998
1990
-199
919
91-2
000
1992
-200
119
93-2
002
1994
-200
319
95-2
004
1996
-200
519
97-2
006
1998
-200
719
99-2
008
2000
-200
920
01-2
010
2002
-201
120
03-2
012
2004
-201
320
05-2
014
Private RE-Bonds Private RE-EquitiesPublic RE-Bonds Public RE-Equities
US
-0,6
-0,4
-0,2
0
0,2
0,4
0,6
0,8
1
1987
-199
719
87-1
997
1988
-199
819
89-1
999
1989
-199
919
90-2
000
1991
-200
119
91-2
001
1992
-200
219
93-2
003
1993
-200
319
94-2
004
1995
-200
519
95-2
005
1996
-200
619
97-2
007
1997
-200
719
98-2
008
1999
-200
919
99-2
009
2000
-201
020
01-2
011
2001
-201
120
02-2
012
2003
-201
320
03-2
013
2004
-201
420
05-2
015
Private RE-Bonds Private RE-EquitiesPublic RE-Bonds Public RE-Equities
UK

23
THE DIVERSIFICATION POTENTIAL OF REAL ESTATE
NORGES BANK INVESTMENT MANAGEMENT / DISCUSSION NOTE
As argued in the previous section, holding periods affect the statistical properties of investments when markets are not efficient and returns are predictable. This applies also to correlations. Contemporaneous correlations are typically calculated for the highest available frequency of data. However, this approach also implies a short investment horizon, and correlation levels experienced by longterm investors may differ. Studies based on a VAR framework proposed by Campbell and Viceira (2005) come to the conclusion that correlations of real estate with equities and bonds are affected by the investment horizon. However, the shape of this dependency appears to be different in the US and the UK. In the model by MacKinnon and Al Zaman (2009) based on US data, the correlation between real estate and equities increases from around 0.2 for very shortterm investments to around 0.4 for investment horizons of two to four years, but declines back to around 0.2 for very longterm horizons (25 years). The correlation of real estate with bonds remains near zero for all investment horizons. In the UK model estimated by Rehring (2012), correlations with equities and bonds decline from around 0.6 and 0.3 respectively to around 0.3 and 0.0 when the investment horizon increases from one year to three to five years. For investment horizons of 25 years, correlations increase to approx. 0.45 for both equities and bonds. These results would imply that the diversification potential of real estate is higher for longterm investors than for mediumterm investors in the US, but it is lower in the UK. As this result is not conclusive for a global portfolio, further investigation of this aspect would be necessary.
Summing up, diversification potential resulting from low correlations with other asset classes should be higher for private real estate investments than for public ones. However, the level of correlation, and hence the diversification potential, are not stable over time. These is some indication that it might increase during extreme market movements, but empirical evidence is not conclusive. Finally, correlations are also likely to depend on the investment horizon, but the direction of this effect can differ across markets.
4.3 Asset-specific risksThe foregoing sections focused on return series and viewed risk mainly in the context of return variation over time. While this may be appropriate for an assessment of the risk associated with listed instruments, risks associated with private investments may not be captured well by market volatility measures. While the impact of assetspecific risks should, in principle, decrease with the size of the portfolio, it might not be possible to eliminate them entirely.
While no formal classification of assetspecific risks exists, the following are often mentioned in real estate textbooks:
• Tenant credit – risk of the tenant defaulting on his contractual obligations and leaving the property partially or fully vacant; this risk is typically measured with the tenant’s credit score
• Leasing risk – uncertainty associated with the leasing process and referring to its duration, equivalent to the period during which no income is accrued, and the achieved effective rent in relation to the market level

24
THE DIVERSIFICATION POTENTIAL OF REAL ESTATE
NORGES BANK INVESTMENT MANAGEMENT / DISCUSSION NOTE
• Development risk – set of risks associated with the development process, encompassing e.g. the uncertainty regarding construction costs, random incidents, or unknown characteristics of the property uncovered during the process, e.g. land contamination
• Physical risks – uncertainty referring to the effective life span of building components as well as random events affecting the building structure, e.g. natural catastrophes. Many of these risks are insurable
• Regulatory/tax risks – uncertainty associated with changes in the legal environment; it is often considered to be higher for real estate than publicly traded investments due to its immobility and the resulting difficulties countering this risk by, for example, moving holdings to a different country
While a detailed discussion is beyond the scope of this paper, these risks need to be addressed in the investment and asset management process. The key question in the context of portfolio construction is to what extent these types of risks are idiosyncratic, meaning to what extent they can be eliminated by investing in a portfolio of properties. It appears intuitive that the assetspecific risks enumerated above are associated with independent random events. This would mean that their impact can be reduced by increasing the number of properties in the portfolio, and practically eliminated in a sufficiently large pool of assets. In consequence, there should be no return premium associated with assetspecific risks. To the best of our knowledge, very limited research exists that would verify this hypothesis with respect to private real estate markets.22 Its validity will depend on answers to two questions: (1) are these individual risks truly independent and (2) is it practically possible to achieve sufficient diversification to eliminate them?
With respect to the first question, the answer appears to be yes, although some of the risks can be affected by the market situation, e.g. tenant credit is likely to deteriorate and leasing of vacant space is likely to become more timeconsuming in a weak economic environment. However, these effects can be considered as aspects of the market risk as they impact upon all assets in the affected market. Assetspecific risks should be defined as the residual risk affecting only the specific building, i.e. the level of credit risk relative to the market average or the deviation of the leasing duration from the typical current value. In this sense, the individual risks should be independent.
Academic research confirms the significance of propertyspecific factors. Early studies by Miles and McCue (1984) and Hartzell et al. (1986) attempted to identify the level of unsystematic risk in real estate returns, reaching the conclusion that it can account for as much as 90 percent of the total risk. Brown (1991) finds that only a small portion of variation in returns of individual properties can be explained by market developments, ranging between 7 percent for retail and 14 percent for office properties. A study by
22 This section focuses on private real estate only. It should be noted, however, that there is a significant amount of research on idiosyncratic risks with respect to listed real estate, which finds indications that these risks may be priced, although the evidence is not always conclusive, e.g. Sun and Yung (2009), Chiang et al. (2009), Ooi et al. (2009) or Schulte et al. (2011).
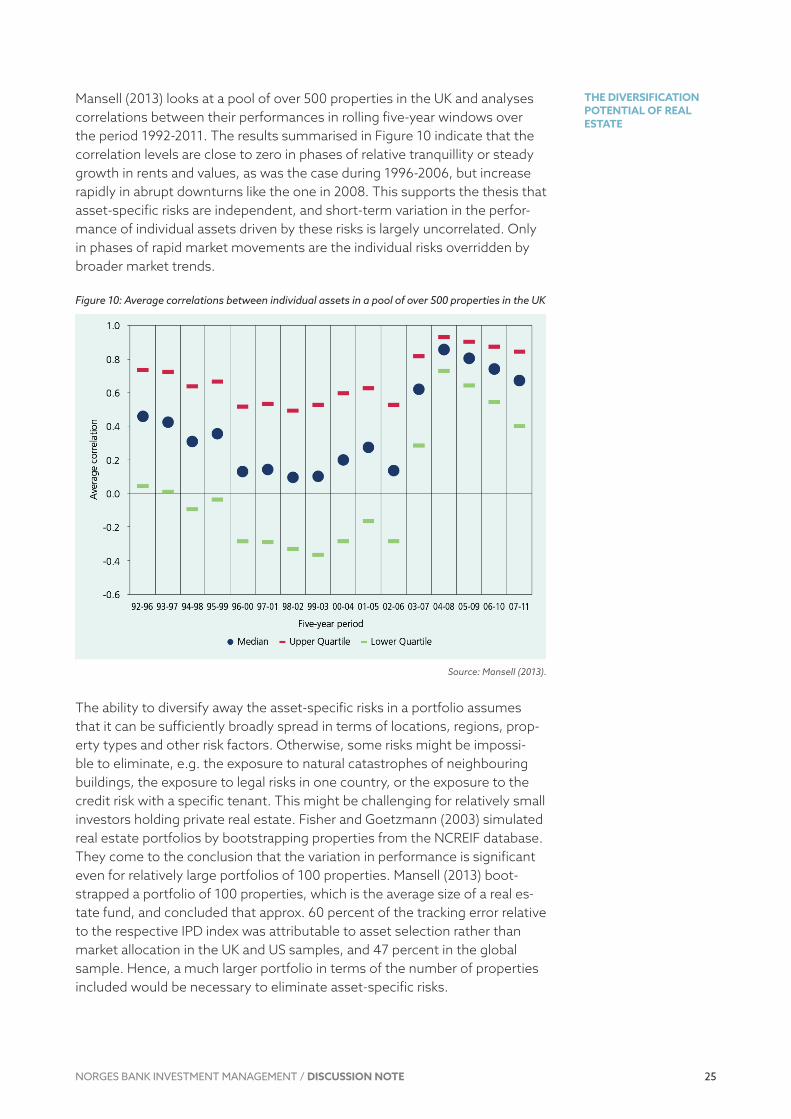
25
THE DIVERSIFICATION POTENTIAL OF REAL ESTATE
NORGES BANK INVESTMENT MANAGEMENT / DISCUSSION NOTE
Mansell (2013) looks at a pool of over 500 properties in the UK and analyses correlations between their performances in rolling fiveyear windows over the period 19922011. The results summarised in Figure 10 indicate that the correlation levels are close to zero in phases of relative tranquillity or steady growth in rents and values, as was the case during 19962006, but increase rapidly in abrupt downturns like the one in 2008. This supports the thesis that assetspecific risks are independent, and shortterm variation in the performance of individual assets driven by these risks is largely uncorrelated. Only in phases of rapid market movements are the individual risks overridden by broader market trends.
Figure 10: Average correlations between individual assets in a pool of over 500 properties in the UK
Source: Mansell (2013).
The ability to diversify away the assetspecific risks in a portfolio assumes that it can be sufficiently broadly spread in terms of locations, regions, property types and other risk factors. Otherwise, some risks might be impossible to eliminate, e.g. the exposure to natural catastrophes of neighbouring buildings, the exposure to legal risks in one country, or the exposure to the credit risk with a specific tenant. This might be challenging for relatively small investors holding private real estate. Fisher and Goetzmann (2003) simulated real estate portfolios by bootstrapping properties from the NCREIF database. They come to the conclusion that the variation in performance is significant even for relatively large portfolios of 100 properties. Mansell (2013) bootstrapped a portfolio of 100 properties, which is the average size of a real estate fund, and concluded that approx. 60 percent of the tracking error relative to the respective IPD index was attributable to asset selection rather than market allocation in the UK and US samples, and 47 percent in the global sample. Hence, a much larger portfolio in terms of the number of properties included would be necessary to eliminate assetspecific risks.

26
THE DIVERSIFICATION POTENTIAL OF REAL ESTATE
NORGES BANK INVESTMENT MANAGEMENT / DISCUSSION NOTE
All in all, it might be challenging for any investor investing in direct real estate to eliminate assetspecific risks completely, although their impact should decrease with the size of the portfolio. Manager skills are therefore likely to have a significant impact on private real estate returns.
4.4 LiquidityLiquidity is a complex multidimensional concept that manifests itself in a number of ways, and has no single, generally accepted definition or measure.23 Keynes’ description of a liquid asset “being more certainly realisable at short notice without loss” is probably the most frequently cited one. In this sense, liquidity can be viewed in terms of the transaction price and transaction time. Typically, investors who are forced to sell within a certain time limit may be able to do so at the cost of a lower effective sale price, while a higher price could be achievable if a longer marketing period had been accepted. Moreover, liquidity in private markets is associated with uncertainty regarding the time and the value of the transaction. Most of the literature on real estate liquidity focuses only on certain aspects of the problem, namely:24
• Transaction intensity
• Transaction cost
• Duration of the sale process (time on the market)
• Uncertainty associated with the sale process
The following analysis attempts to cover these points and indicate the impact of adding an illiquid asset to the investment portfolio.
Despite the increased transaction activity on real estate markets in recent decades, the number of transactions is still very low compared to listed assets. While the capitalisation of public equity markets is higher than the value of invested real estate by a magnitude of two to five in most countries, trading intensity is higher by a magnitude of approx. 50 to 100. One way to illustrate this is by comparing the turnover in the equity market to that of the real estate market in the same country. While the ratio of traded stock to market capitalisation on stock exchanges in developed countries is mostly above 50 percent and often above 100 percent, the corresponding figure for the real estate markets is well below 10 percent even in those countries that have the most active real estate markets, as illustrated in Figure 11.
23 Lizieri and Bond (2004) review different definitions in the financial and real estate literature.
24 See e.g. Lizieri and Bond (2004) or Hoesli and Lizieri (2007).
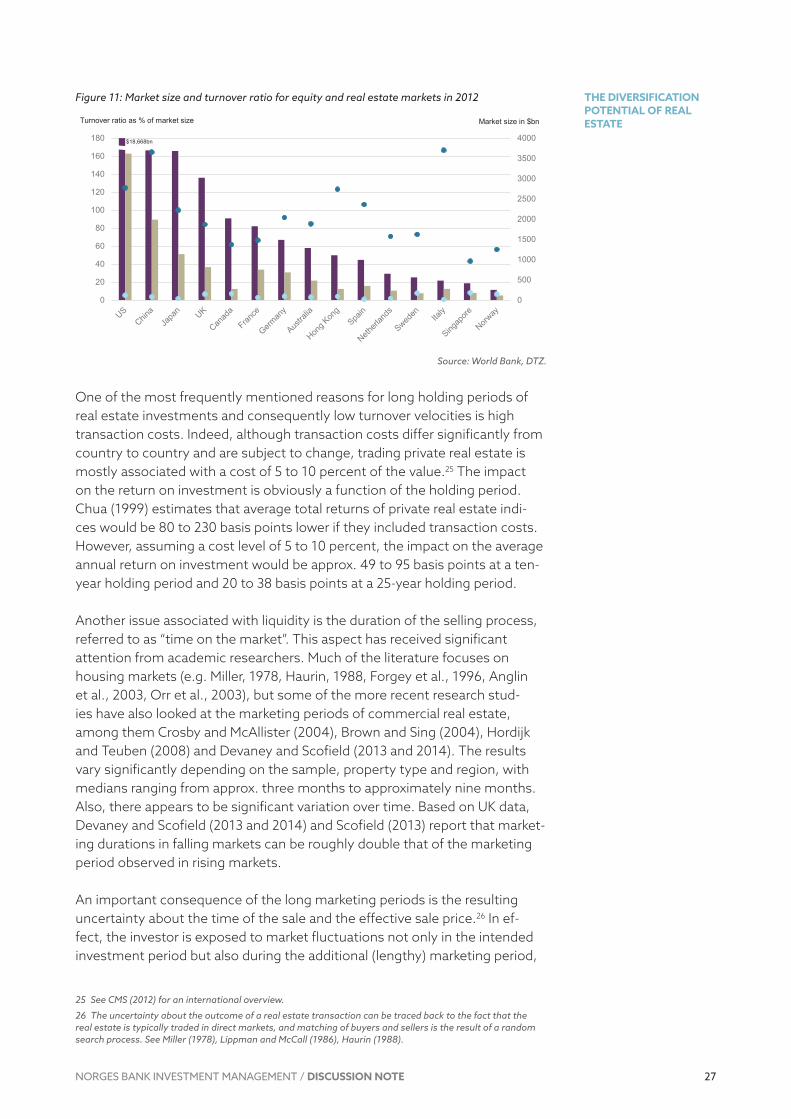
27
THE DIVERSIFICATION POTENTIAL OF REAL ESTATE
NORGES BANK INVESTMENT MANAGEMENT / DISCUSSION NOTE
Figure 11: Market size and turnover ratio for equity and real estate markets in 2012
Source: World Bank, DTZ.
One of the most frequently mentioned reasons for long holding periods of real estate investments and consequently low turnover velocities is high transaction costs. Indeed, although transaction costs differ significantly from country to country and are subject to change, trading private real estate is mostly associated with a cost of 5 to 10 percent of the value.25 The impact on the return on investment is obviously a function of the holding period. Chua (1999) estimates that average total returns of private real estate indices would be 80 to 230 basis points lower if they included transaction costs. However, assuming a cost level of 5 to 10 percent, the impact on the average annual return on investment would be approx. 49 to 95 basis points at a tenyear holding period and 20 to 38 basis points at a 25year holding period.
Another issue associated with liquidity is the duration of the selling process, referred to as “time on the market”. This aspect has received significant attention from academic researchers. Much of the literature focuses on housing markets (e.g. Miller, 1978, Haurin, 1988, Forgey et al., 1996, Anglin et al., 2003, Orr et al., 2003), but some of the more recent research studies have also looked at the marketing periods of commercial real estate, among them Crosby and McAllister (2004), Brown and Sing (2004), Hordijk and Teuben (2008) and Devaney and Scofield (2013 and 2014). The results vary significantly depending on the sample, property type and region, with medians ranging from approx. three months to approximately nine months. Also, there appears to be significant variation over time. Based on UK data, Devaney and Scofield (2013 and 2014) and Scofield (2013) report that marketing durations in falling markets can be roughly double that of the marketing period observed in rising markets.
An important consequence of the long marketing periods is the resulting uncertainty about the time of the sale and the effective sale price.26 In effect, the investor is exposed to market fluctuations not only in the intended investment period but also during the additional (lengthy) marketing period,
25 See CMS (2012) for an international overview.
26 The uncertainty about the outcome of a real estate transaction can be traced back to the fact that the real estate is typically traded in direct markets, and matching of buyers and sellers is the result of a random search process. See Miller (1978), Lippman and McCall (1986), Haurin (1988).
0
500
1000
1500
2000
2500
3000
3500
4000
0
20
40
60
80
100
120
140
160
180
Stock market capitalisation Value of invested real estate
Stock market turnover ratio Real estate turnover ratio
Turnover ratio as % of market size
$18,668bn
Market size in $bn
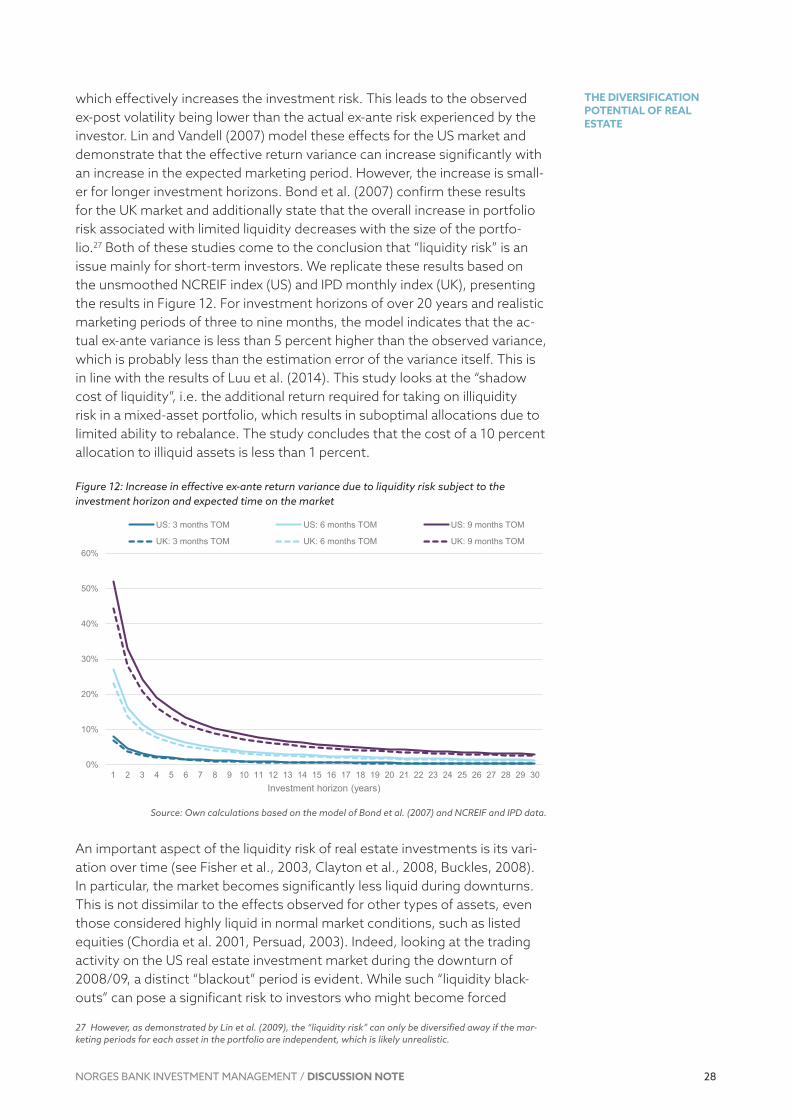
28
THE DIVERSIFICATION POTENTIAL OF REAL ESTATE
NORGES BANK INVESTMENT MANAGEMENT / DISCUSSION NOTE
which effectively increases the investment risk. This leads to the observed expost volatility being lower than the actual exante risk experienced by the investor. Lin and Vandell (2007) model these effects for the US market and demonstrate that the effective return variance can increase significantly with an increase in the expected marketing period. However, the increase is smaller for longer investment horizons. Bond et al. (2007) confirm these results for the UK market and additionally state that the overall increase in portfolio risk associated with limited liquidity decreases with the size of the portfolio.27 Both of these studies come to the conclusion that “liquidity risk” is an issue mainly for shortterm investors. We replicate these results based on the unsmoothed NCREIF index (US) and IPD monthly index (UK), presenting the results in Figure 12. For investment horizons of over 20 years and realistic marketing periods of three to nine months, the model indicates that the actual exante variance is less than 5 percent higher than the observed variance, which is probably less than the estimation error of the variance itself. This is in line with the results of Luu et al. (2014). This study looks at the “shadow cost of liquidity”, i.e. the additional return required for taking on illiquidity risk in a mixedasset portfolio, which results in suboptimal allocations due to limited ability to rebalance. The study concludes that the cost of a 10 percent allocation to illiquid assets is less than 1 percent.
Figure 12: Increase in effective ex-ante return variance due to liquidity risk subject to the investment horizon and expected time on the market
Source: Own calculations based on the model of Bond et al. (2007) and NCREIF and IPD data.
An important aspect of the liquidity risk of real estate investments is its variation over time (see Fisher et al., 2003, Clayton et al., 2008, Buckles, 2008). In particular, the market becomes significantly less liquid during downturns. This is not dissimilar to the effects observed for other types of assets, even those considered highly liquid in normal market conditions, such as listed equities (Chordia et al. 2001, Persuad, 2003). Indeed, looking at the trading activity on the US real estate investment market during the downturn of 2008/09, a distinct “blackout” period is evident. While such “liquidity blackouts” can pose a significant risk to investors who might become forced
27 However, as demonstrated by Lin et al. (2009), the “liquidity risk” can only be diversified away if the mar-keting periods for each asset in the portfolio are independent, which is likely unrealistic.
0%
10%
20%
30%
40%
50%
60%
1 2 3 4 5 6 7 8 9 10 11 12 13 14 15 16 17 18 19 20 21 22 23 24 25 26 27 28 29 30Investment horizon (years)
US: 3 months TOM US: 6 months TOM US: 9 months TOM
UK: 3 months TOM UK: 6 months TOM UK: 9 months TOM
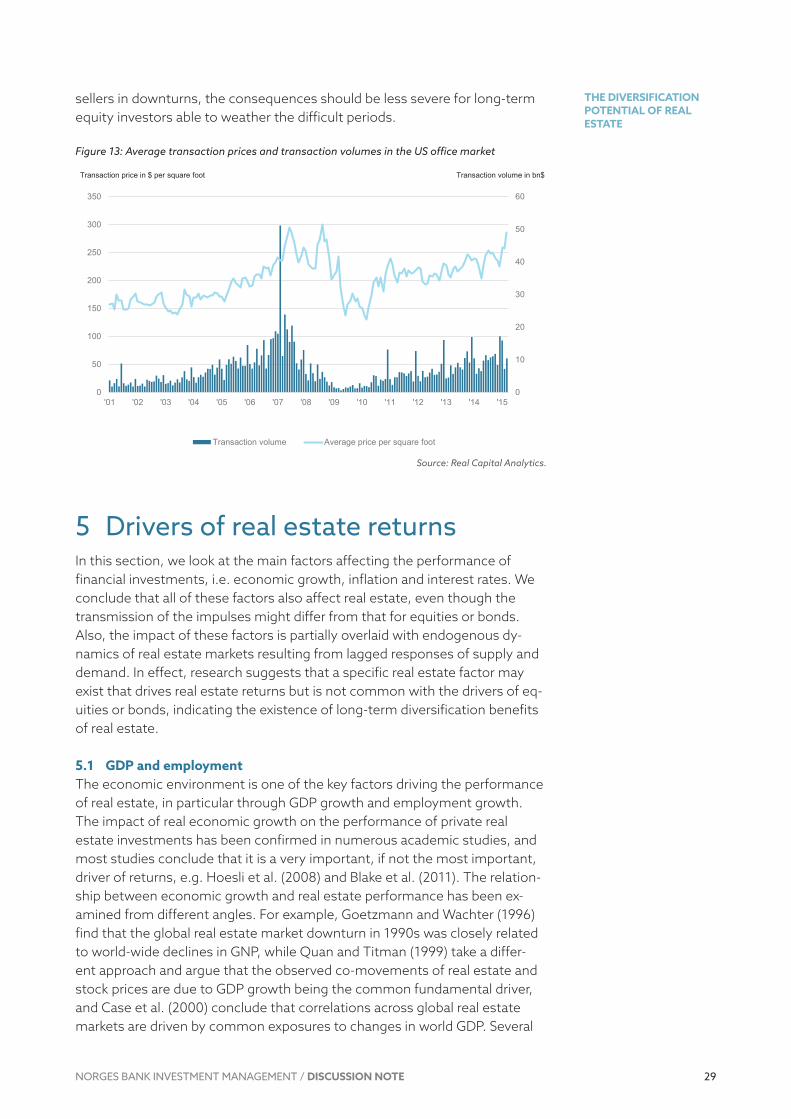
29
THE DIVERSIFICATION POTENTIAL OF REAL ESTATE
NORGES BANK INVESTMENT MANAGEMENT / DISCUSSION NOTE
sellers in downturns, the consequences should be less severe for longterm equity investors able to weather the difficult periods.
Figure 13: Average transaction prices and transaction volumes in the US office market
Source: Real Capital Analytics.
5 Drivers of real estate returnsIn this section, we look at the main factors affecting the performance of financial investments, i.e. economic growth, inflation and interest rates. We conclude that all of these factors also affect real estate, even though the transmission of the impulses might differ from that for equities or bonds. Also, the impact of these factors is partially overlaid with endogenous dynamics of real estate markets resulting from lagged responses of supply and demand. In effect, research suggests that a specific real estate factor may exist that drives real estate returns but is not common with the drivers of equities or bonds, indicating the existence of longterm diversification benefits of real estate.
5.1 GDP and employmentThe economic environment is one of the key factors driving the performance of real estate, in particular through GDP growth and employment growth. The impact of real economic growth on the performance of private real estate investments has been confirmed in numerous academic studies, and most studies conclude that it is a very important, if not the most important, driver of returns, e.g. Hoesli et al. (2008) and Blake et al. (2011). The relationship between economic growth and real estate performance has been examined from different angles. For example, Goetzmann and Wachter (1996) find that the global real estate market downturn in 1990s was closely related to worldwide declines in GNP, while Quan and Titman (1999) take a different approach and argue that the observed comovements of real estate and stock prices are due to GDP growth being the common fundamental driver, and Case et al. (2000) conclude that correlations across global real estate markets are driven by common exposures to changes in world GDP. Several
0
10
20
30
40
50
60
0
50
100
150
200
250
300
350
'01 '02 '03 '04 '05 '06 '07 '08 '09 '10 '11 '12 '13 '14 '15
Transaction volume Average price per square foot
Transaction price in $ per square foot Transaction volume in bn$
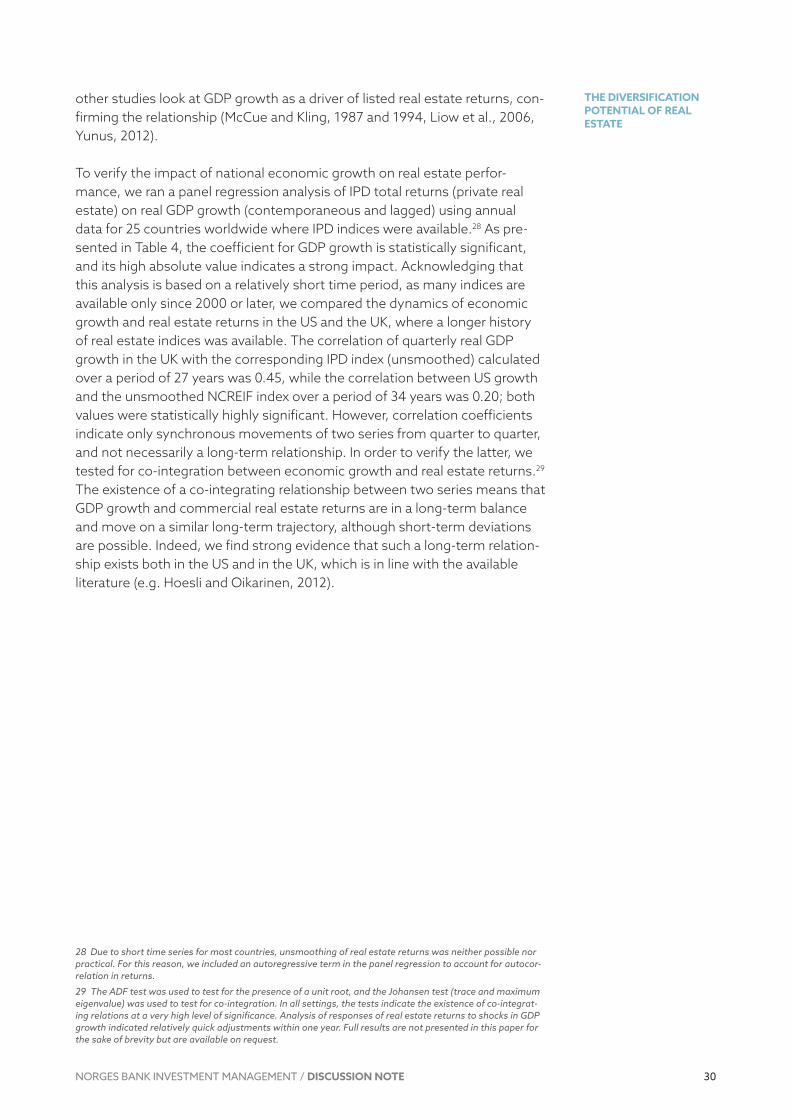
30
THE DIVERSIFICATION POTENTIAL OF REAL ESTATE
NORGES BANK INVESTMENT MANAGEMENT / DISCUSSION NOTE
other studies look at GDP growth as a driver of listed real estate returns, confirming the relationship (McCue and Kling, 1987 and 1994, Liow et al., 2006, Yunus, 2012).
To verify the impact of national economic growth on real estate performance, we ran a panel regression analysis of IPD total returns (private real estate) on real GDP growth (contemporaneous and lagged) using annual data for 25 countries worldwide where IPD indices were available.28 As presented in Table 4, the coefficient for GDP growth is statistically significant, and its high absolute value indicates a strong impact. Acknowledging that this analysis is based on a relatively short time period, as many indices are available only since 2000 or later, we compared the dynamics of economic growth and real estate returns in the US and the UK, where a longer history of real estate indices was available. The correlation of quarterly real GDP growth in the UK with the corresponding IPD index (unsmoothed) calculated over a period of 27 years was 0.45, while the correlation between US growth and the unsmoothed NCREIF index over a period of 34 years was 0.20; both values were statistically highly significant. However, correlation coefficients indicate only synchronous movements of two series from quarter to quarter, and not necessarily a longterm relationship. In order to verify the latter, we tested for cointegration between economic growth and real estate returns.29 The existence of a cointegrating relationship between two series means that GDP growth and commercial real estate returns are in a longterm balance and move on a similar longterm trajectory, although shortterm deviations are possible. Indeed, we find strong evidence that such a longterm relationship exists both in the US and in the UK, which is in line with the available literature (e.g. Hoesli and Oikarinen, 2012).
28 Due to short time series for most countries, unsmoothing of real estate returns was neither possible nor practical. For this reason, we included an autoregressive term in the panel regression to account for autocor-relation in returns.
29 The ADF test was used to test for the presence of a unit root, and the Johansen test (trace and maximum eigenvalue) was used to test for co-integration. In all settings, the tests indicate the existence of co-integrat-ing relations at a very high level of significance. Analysis of responses of real estate returns to shocks in GDP growth indicated relatively quick adjustments within one year. Full results are not presented in this paper for the sake of brevity but are available on request.
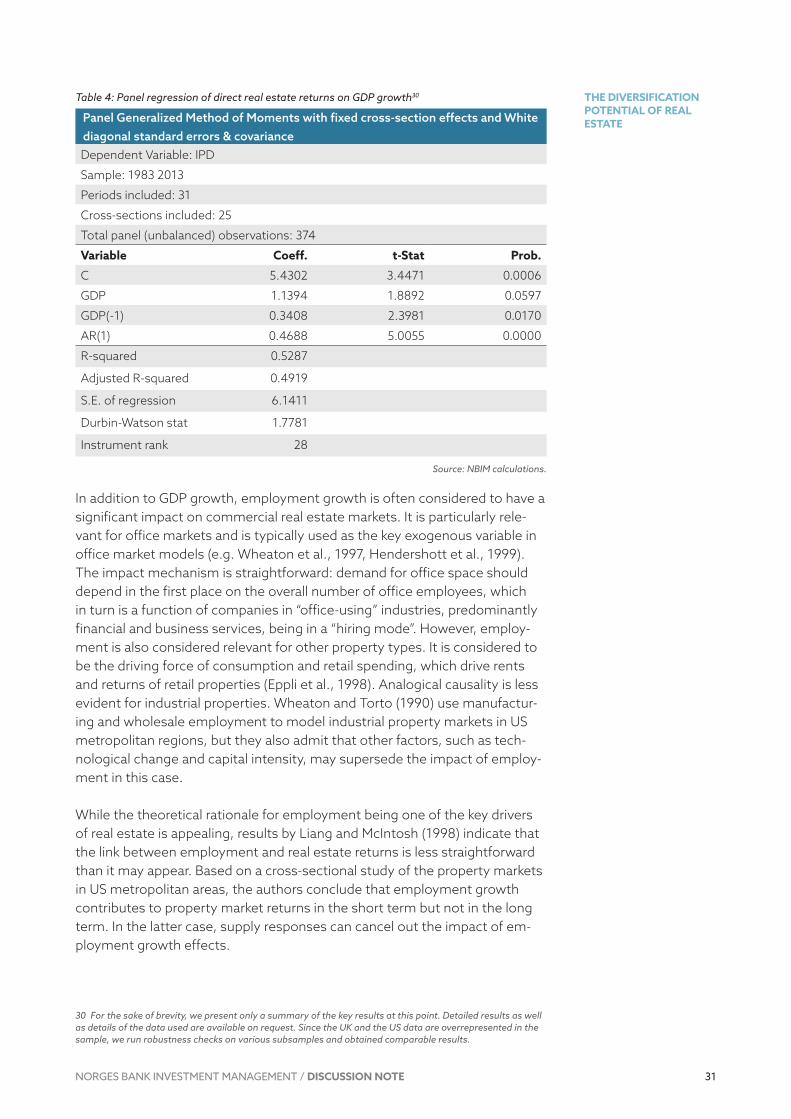
31
THE DIVERSIFICATION POTENTIAL OF REAL ESTATE
NORGES BANK INVESTMENT MANAGEMENT / DISCUSSION NOTE
Table 4: Panel regression of direct real estate returns on GDP growth30
Panel Generalized Method of Moments with fixed cross-section effects and White diagonal standard errors & covarianceDependent Variable: IPD
Sample: 1983 2013
Periods included: 31
Crosssections included: 25
Total panel (unbalanced) observations: 374
Variable Coeff. t-Stat Prob.
C 5.4302 3.4471 0.0006
GDP 1.1394 1.8892 0.0597
GDP(1) 0.3408 2.3981 0.0170
AR(1) 0.4688 5.0055 0.0000
Rsquared 0.5287
Adjusted Rsquared 0.4919
S.E. of regression 6.1411
DurbinWatson stat 1.7781
Instrument rank 28
Source: NBIM calculations.
In addition to GDP growth, employment growth is often considered to have a significant impact on commercial real estate markets. It is particularly relevant for office markets and is typically used as the key exogenous variable in office market models (e.g. Wheaton et al., 1997, Hendershott et al., 1999). The impact mechanism is straightforward: demand for office space should depend in the first place on the overall number of office employees, which in turn is a function of companies in “officeusing” industries, predominantly financial and business services, being in a “hiring mode”. However, employment is also considered relevant for other property types. It is considered to be the driving force of consumption and retail spending, which drive rents and returns of retail properties (Eppli et al., 1998). Analogical causality is less evident for industrial properties. Wheaton and Torto (1990) use manufacturing and wholesale employment to model industrial property markets in US metropolitan regions, but they also admit that other factors, such as technological change and capital intensity, may supersede the impact of employment in this case.
While the theoretical rationale for employment being one of the key drivers of real estate is appealing, results by Liang and McIntosh (1998) indicate that the link between employment and real estate returns is less straightforward than it may appear. Based on a crosssectional study of the property markets in US metropolitan areas, the authors conclude that employment growth contributes to property market returns in the short term but not in the long term. In the latter case, supply responses can cancel out the impact of employment growth effects.
30 For the sake of brevity, we present only a summary of the key results at this point. Detailed results as well as details of the data used are available on request. Since the UK and the US data are overrepresented in the sample, we run robustness checks on various subsamples and obtained comparable results.

32
THE DIVERSIFICATION POTENTIAL OF REAL ESTATE
NORGES BANK INVESTMENT MANAGEMENT / DISCUSSION NOTE
Summing up, the fundamental link between real estate returns and economic growth is clear. In principle, a stronger economy should lead to increased demand for space through higher office employment, retail sales, production output and other related factors. Higher demand, in turn, should lead to increased income streams to owners of real estate. However, in the long term, one also needs to consider the reaction of the supply side. This aspect is discussed more thoroughly in section 5.4.
5.2 InflationThe relationship between real estate returns and inflation has been examined in a large body of academic literature. These studies generally find inflationhedging properties for private real estate investments, but not for public real estate investments.31
In theory, real estate returns should be linked to consumer prices for a number of reasons, their relevance varying across different property types:
• Rents are indexed to inflation in a number of countries, so that cash flows from investment properties should move with the consumer price index (CPI) in such cases
• Costs associated with housing are often included in the product basket used for the calculation of the CPI
• Construction costs are usually highly correlated with consumer prices and should, in the absence of structural changes, provide an indication of replacement costs in the sense of Tobin’s q, which should not significantly deviate from values in the long term.
Fama and Schwert (1977) were among the first to address the question of inflationhedging of private real estate investments. Examining the inflationhedging properties of different types of investments, they conclude that only residential real estate is a complete hedge against both expected and unexpected inflation, while government debt instruments hedge only against expected inflation, and stocks turn out to be negatively related to inflation. Since then, a large body of academic literature has been devoted to this topic.
Hartzell et al. (1987) confirm the inflationhedging characteristics of large portfolios of privately held commercial properties in the US with respect to both expected and unexpected inflation. This is in line with a number of other studies, e.g. Bond and Seiler (1998) or Miles and Mahoney (1998). Strong links between real estate and inflation have also been attested by academic studies in a number of other countries: e.g. Australia (Newell, 1996), Canada (Le Moignes and Viveiros, 2008), Germany (Maurer and Sebastian, 2002), New Zealand (Gunasekarage et al., 2008), Switzerland (Hamelink and Hoesli, 1994) and Singapore (Sing and Low, 2000). For the UK, however, the evidence is more mixed. Blake et al. (2011) reject the inflationhedging properties of
31 As argued by Hamelink et al. (1997), the terms “inflation hedging” and “inflation protection” are similar but not identical. While the former refers to co-movements with the inflation rate, the latter refers to the ability to deliver positive real returns. We do not strictly delimit these two concepts, but the first part of this section is more focused on inflation hedging while the second part is more focused on long-term real values.

33
THE DIVERSIFICATION POTENTIAL OF REAL ESTATE
NORGES BANK INVESTMENT MANAGEMENT / DISCUSSION NOTE
UK real estate. Barkham et al. (1996) and Matysiak et al. (1996) do not confirm inflation hedging in the short term, on a yeartoyear basis, but identify a longterm relationship between UK commercial real estate returns and expected and unexpected inflation; Hoesli et al. (2008) reach a similar conclusion. In contrast, several studies focusing on emerging markets tend to reject the ability to hedge inflation in these countries using real estate investments, e.g. Önder (2000) for Turkey or Chu and Sing (2004) for China. While the validity of results for emerging markets may suffer from the lack of market transparency and short time series, it appears likely that other factors have a far stronger impact on real estate in these countries.
As indicated earlier in this section, the relationship between real estate and inflation may differ with types of properties. The pricing mechanism for private housing differs significantly from that for commercial real estate, and hence the impact of inflation may also differ. While the literature cited above provides evidence for housing and privately held commercial properties, a number of studies break down real estate into more detailed segments. Rubens et al. (1989) differentiate between homes, farmland and offices, concluding that the first two types hedge against unexpected inflation, while offices hedge against expected inflation. An extensive study by Demary and Voigtländer (2009) analyses returns of office, retail and residential real estate in ten countries, reaching the conclusion that office and residential are generally a good hedge against inflation, while retail investments are a significantly weaker one, especially with respect to expected inflation. Similarly, Huang and HudsonWilson (2007) and Blake et al. (2011) find that offices and industrial properties in the US and the UK provide a better hedge than retail properties.
The abovementioned studies use different time periods: some include periods of high inflation during the 1970s and 1980s, while others include only data from recent decades characterised by low inflation. While the empirical evidence is limited, some researchers indicate that the impact of inflation on real estate may be stronger in periods of higher inflation than in times of relative price stability. Fogler et al. (1984), Wurzebach et al. (1991) and Le Moignes and Viveiros (2008) investigate the US and Canadian markets in different sub–periods, concluding that inflationhedging properties appear to be stronger in periods of generally higher inflation.
While the literature on private real estate confirms its inflationhedging properties, studies examining the properties of public real estate investments almost unanimously reject a direct link between returns and consumer prices. Liu et al. (1997), Chatrath and Liang (1998), Maurer and Sebastian (2002) and Demary and Voigtländer (2009) are examples of academic studies arriving at this conclusion.32 Moreover, REIT returns appear to be negatively correlated with inflation, providing a “perverse” hedge.
The most straightforward interpretation of “inflation hedging”, followed also in much of the literature on this topic, assumes simultaneous, contemporaneous reactions of real estate returns to changes in the inflation rate. However, in some cases, such an immediate link might be either nonexistent or
32 On the other hand, Glascock et al. (2002) is one of the few studies contradicting the general consensus.
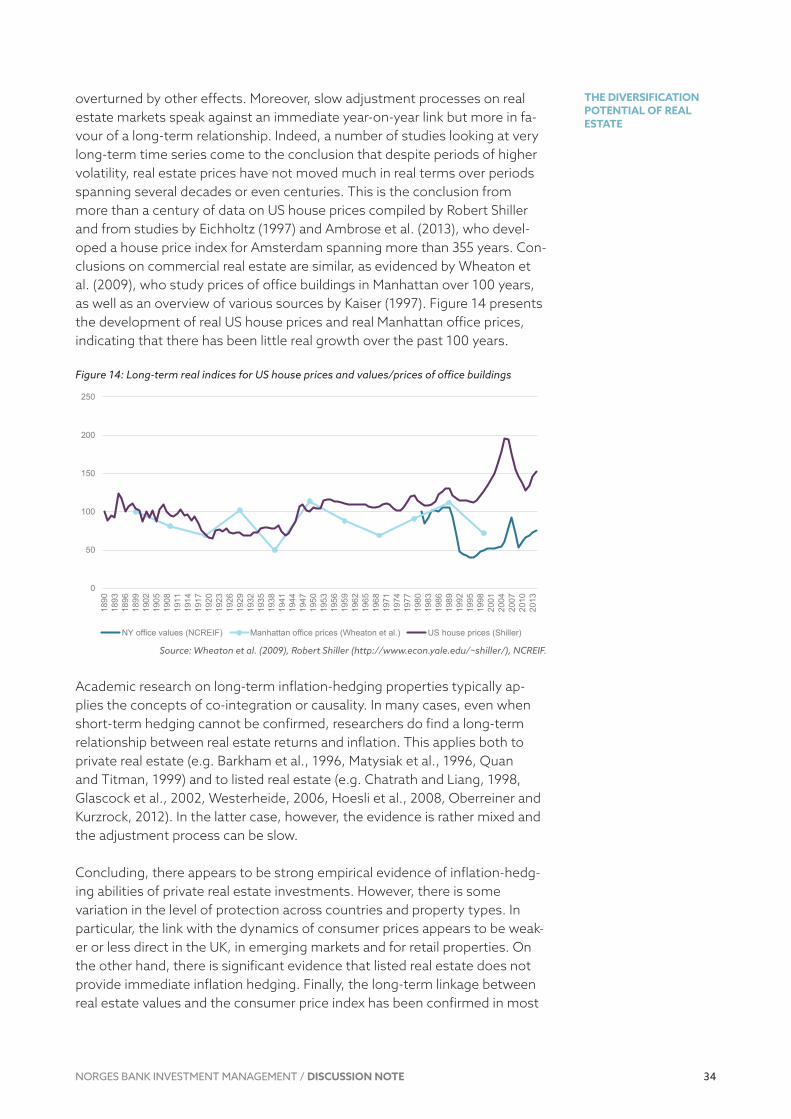
34
THE DIVERSIFICATION POTENTIAL OF REAL ESTATE
NORGES BANK INVESTMENT MANAGEMENT / DISCUSSION NOTE
overturned by other effects. Moreover, slow adjustment processes on real estate markets speak against an immediate yearonyear link but more in favour of a longterm relationship. Indeed, a number of studies looking at very longterm time series come to the conclusion that despite periods of higher volatility, real estate prices have not moved much in real terms over periods spanning several decades or even centuries. This is the conclusion from more than a century of data on US house prices compiled by Robert Shiller and from studies by Eichholtz (1997) and Ambrose et al. (2013), who developed a house price index for Amsterdam spanning more than 355 years. Conclusions on commercial real estate are similar, as evidenced by Wheaton et al. (2009), who study prices of office buildings in Manhattan over 100 years, as well as an overview of various sources by Kaiser (1997). Figure 14 presents the development of real US house prices and real Manhattan office prices, indicating that there has been little real growth over the past 100 years.
Figure 14: Long-term real indices for US house prices and values/prices of office buildings
Source: Wheaton et al. (2009), Robert Shiller (http://www.econ.yale.edu/~shiller/), NCREIF.
Academic research on longterm inflationhedging properties typically applies the concepts of cointegration or causality. In many cases, even when shortterm hedging cannot be confirmed, researchers do find a longterm relationship between real estate returns and inflation. This applies both to private real estate (e.g. Barkham et al., 1996, Matysiak et al., 1996, Quan and Titman, 1999) and to listed real estate (e.g. Chatrath and Liang, 1998, Glascock et al., 2002, Westerheide, 2006, Hoesli et al., 2008, Oberreiner and Kurzrock, 2012). In the latter case, however, the evidence is rather mixed and the adjustment process can be slow.
Concluding, there appears to be strong empirical evidence of inflationhedging abilities of private real estate investments. However, there is some variation in the level of protection across countries and property types. In particular, the link with the dynamics of consumer prices appears to be weaker or less direct in the UK, in emerging markets and for retail properties. On the other hand, there is significant evidence that listed real estate does not provide immediate inflation hedging. Finally, the longterm linkage between real estate values and the consumer price index has been confirmed in most
0
50
100
150
200
250
1890
1893
1896
1899
1902
1905
1908
1911
1914
1917
1920
1923
1926
1929
1932
1935
1938
1941
1944
1947
1950
1953
1956
1959
1962
1965
1968
1971
1974
1977
1980
1983
1986
1989
1992
1995
1998
2001
2004
2007
2010
2013
NY office values (NCREIF) Manhattan office prices (Wheaton et al.) US house prices (Shiller)
35
THE DIVERSIFICATION POTENTIAL OF REAL ESTATE
NORGES BANK INVESTMENT MANAGEMENT / DISCUSSION NOTE
studies, indicating that real estate values tend to remain stable in real terms over very long time horizons.
5.3 Interest ratesThe relationship between interest rates and real estate returns or values is very complex. The empirical evidence on the nature and direction of this relationship is rather inconclusive. Increasing interest rates should negatively affect property values in the long term. However, shortterm effects depend on the speed and the causes of the interest rate shift.
Real estate is considered to be sensitive to interest rates, and most models of real estate markets include interest rates as an explanatory factor (see section 5.4). This sensitivity has been addressed in a number of academic studies. Ling and Naranjo (1998) model risk factors for US private real estate returns using several alternative measurements and conclude that the impact of the real Tbill rate is negative. This observation is explained by the negative impact of higher interest rates on real estate values through a higher discount rate applied to future cash flows. On the other hand, Vogel (2006) finds little confirmation of a link between real estate prices and interest rates, neither in the historical data nor in the conducted experiment, arguing that other factors such as market psychology can distort this relationship. For public real estate investments, Lizieri and Satchell (1997) and Lizieri et al. (1998) highlight the relevance of real interest rates on the performance of listed property companies, finding asymmetries in their performance in high and lowinterest rate environments. In contrast, Brooks and Tsolacos (1999) find no link between returns of UK property companies and shortterm interest rates using a VAR framework. Hence, the empirical evidence on the link between interest rates and real estate returns is inconclusive.
Chaney and Hoesli (2010) point out that the change in the interest rate level affects not only the present value of future cash flows, but also the level of current cash flows. For example, while an interest rate increase generally diminishes the present value of the investment, it is also likely to drive rents up due to inflationary pressures and presumably a stronger economy, which are typically the reasons for policy rate increases. The authors perform a Monte Carlo simulation of the interest rate sensitivity of a typical office investment and conclude that the traditional approaches, which assume stable cash flows, overstate the sensitivity in the case of incomeproducing real estate. Moreover, the sensitivity is subject to a number of factors, such as the macroeconomic environment, the term structure of interest rates and the remaining lifetime of the property.
Much of the research on the relationships between interest rates and real estate performance refers to real estate capitalisation rates (cap rates or yields), i.e. ratios of current income to the value of the property.33 While not identical, this indicator is related to the discount rate used in valuation and is therefore more directly comparable with interest rates. There is a significant body of research addressing the drivers of cap rates, including Sivitanidou
33 Note that the precise definitions of cap rates and yields differ across global markets, in particular with respect to the segment of the market they are referring to (prime, average) and the inclusion of various costs (net, gross).

36
THE DIVERSIFICATION POTENTIAL OF REAL ESTATE
NORGES BANK INVESTMENT MANAGEMENT / DISCUSSION NOTE
and Sivitanides (1999), Sivitanides et al. (2001), Peyton (2009), Chervachidze at al. (2009), Chervachidze and Wheaton (2013) and Chaney and Hoesli (2015a). A clear majority of them confirm a significant positive relationship between interest rates and cap rates, but also identify other highly relevant factors, in particular property market fundamentals and riskrelated variables. Summarising these approaches, cap rates can be decomposed into three components:34
• (riskfree) interest rate
• real estate risk premium
• income growth expectation
This implies that interest rates should drive cap rates, but the impact will be distorted by other factors. Moreover, the individual components are not unrelated. For example, interest rates can increase as a consequence of the central bank raising the policy rate to counter inflationary pressures, but this would also imply a strong economic environment in which real estate risks would decline and rent growth expectations would increase (see also Conner and Liang, 2005, and Chaney and Hoesli, 2010). Furthermore, higher interest rates are also likely to have a negative impact on construction activity, which in time should increase the scarcity of space and support rent growth. Hence, although a positive relationship between interest rates and cap rates, and a negative relation between interest rates and property values, can be expected in the long term, it can be significantly distorted in the medium and short term.
The main conclusion from the above considerations is that the relationship between real estate returns and values and the interest rate level is complex. In particular, it is important to differentiate between shortterm changes in interest rates and longterm trends. In the long term, a negative relationship between interest rates and property values can be expected, but the opposite might be true in the short term. Not only is the direction of the interest rate change relevant, but also the speed of change and the reasons behind it. The final effect depends on the combination of circumstances.
5.4 Endogenous market dynamicsWhile the previous sections focused on exogenous economic and monetary drivers of returns, real estate markets also exhibit significant endogenous dynamics. State variables of real estate markets, such as rents, prices, stock and new construction, are interlinked with lagged responses. In effect, initial exogenous impulses affect the system in a complex way over longer time periods. This specific endogenous market dynamic may also affect the riskreturn profile of real estate and its correlations with other asset classes.
The internal dynamics of real estate markets have been the subject of numerous research programmes relating typically to real estate cycles. In this context, the model by DiPasquale and Wheaton (1992) is used as a reference. In essence, it views the real estate market in terms of two separate markets:
34 See e.g. Clayton and Glass (2009).
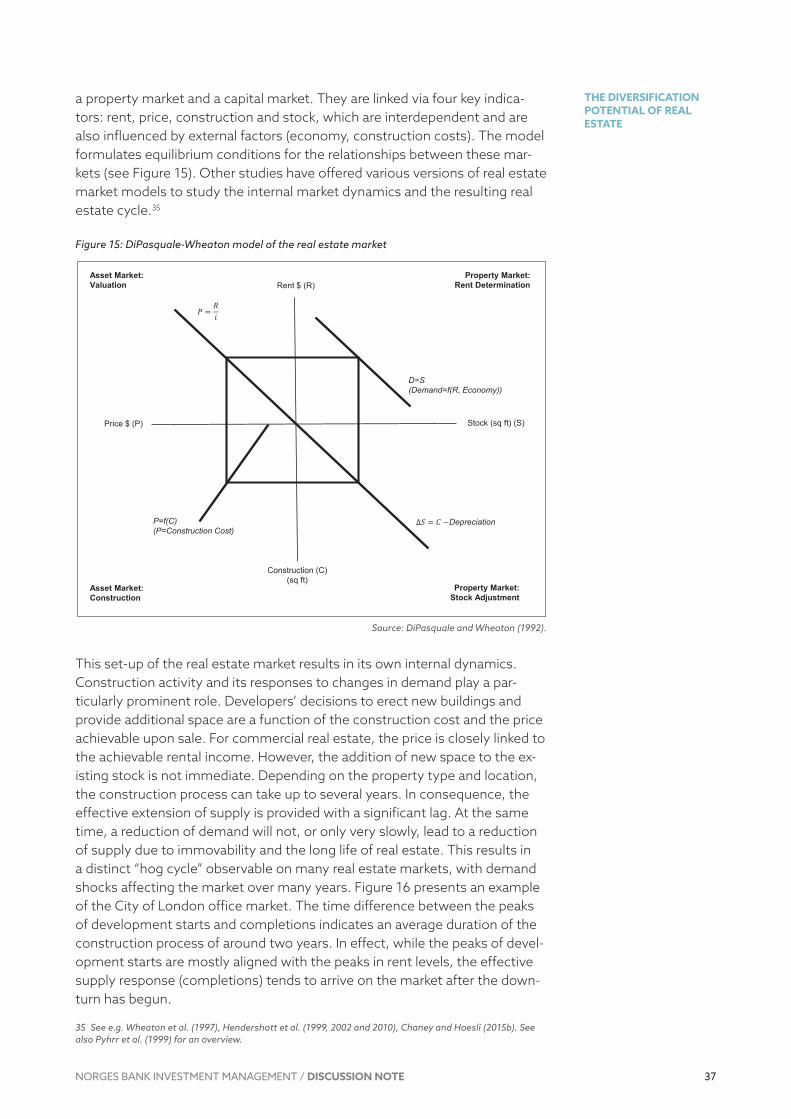
37
THE DIVERSIFICATION POTENTIAL OF REAL ESTATE
NORGES BANK INVESTMENT MANAGEMENT / DISCUSSION NOTE
a property market and a capital market. They are linked via four key indicators: rent, price, construction and stock, which are interdependent and are also influenced by external factors (economy, construction costs). The model formulates equilibrium conditions for the relationships between these markets (see Figure 15). Other studies have offered various versions of real estate market models to study the internal market dynamics and the resulting real estate cycle.35
Figure 15: DiPasquale-Wheaton model of the real estate market
Source: DiPasquale and Wheaton (1992).
This setup of the real estate market results in its own internal dynamics. Construction activity and its responses to changes in demand play a particularly prominent role. Developers’ decisions to erect new buildings and provide additional space are a function of the construction cost and the price achievable upon sale. For commercial real estate, the price is closely linked to the achievable rental income. However, the addition of new space to the existing stock is not immediate. Depending on the property type and location, the construction process can take up to several years. In consequence, the effective extension of supply is provided with a significant lag. At the same time, a reduction of demand will not, or only very slowly, lead to a reduction of supply due to immovability and the long life of real estate. This results in a distinct “hog cycle” observable on many real estate markets, with demand shocks affecting the market over many years. Figure 16 presents an example of the City of London office market. The time difference between the peaks of development starts and completions indicates an average duration of the construction process of around two years. In effect, while the peaks of development starts are mostly aligned with the peaks in rent levels, the effective supply response (completions) tends to arrive on the market after the downturn has begun.
35 See e.g. Wheaton et al. (1997), Hendershott et al. (1999, 2002 and 2010), Chaney and Hoesli (2015b). See also Pyhrr et al. (1999) for an overview.
Rent $ (R)
Construction (C) (sq ft)
Price $ (P) Stock (sq ft) (S)
D=S(Demand=f(R, Economy))
P=f(C)(P=Construction Cost)
𝑃𝑃𝑃𝑃 =𝑅𝑅𝑅𝑅𝑖𝑖𝑖𝑖
∆𝑆𝑆𝑆𝑆 = 𝐶𝐶𝐶𝐶 −Depreciation
Asset Market:Valuation
Property Market:Rent Determination
Asset Market:Construction
Property Market:Stock Adjustment
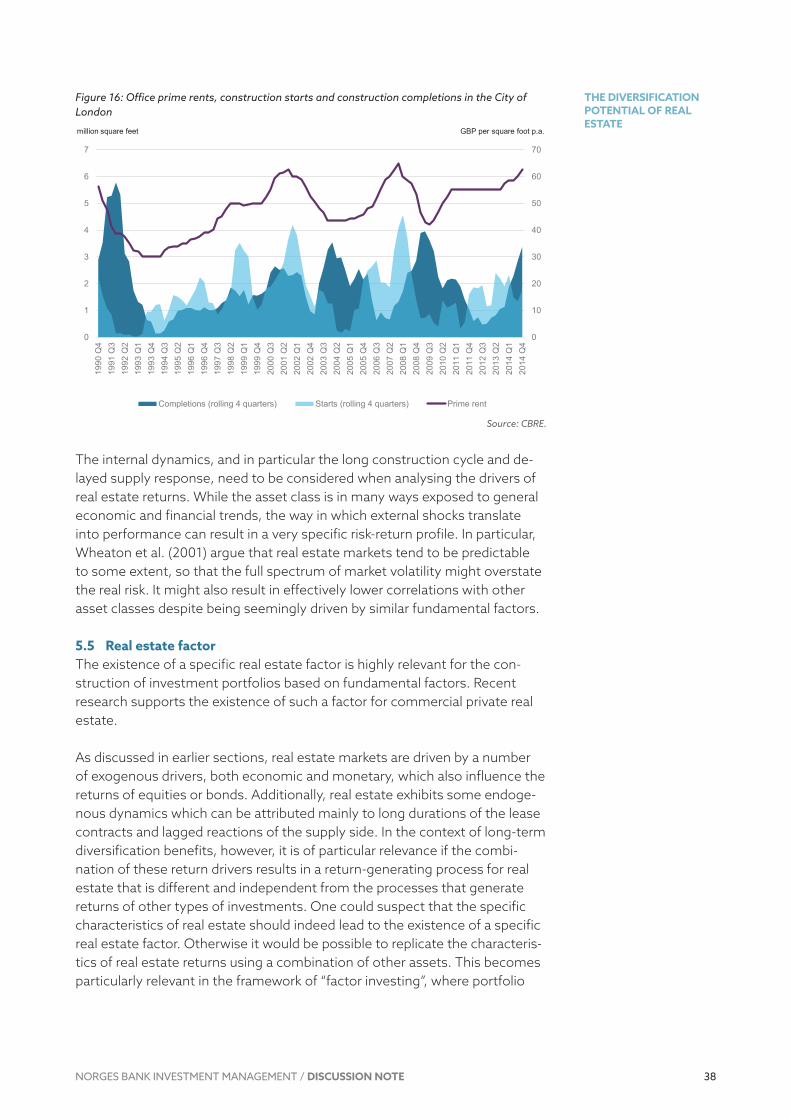
38
THE DIVERSIFICATION POTENTIAL OF REAL ESTATE
NORGES BANK INVESTMENT MANAGEMENT / DISCUSSION NOTE
Figure 16: Office prime rents, construction starts and construction completions in the City of London
Source: CBRE.
The internal dynamics, and in particular the long construction cycle and delayed supply response, need to be considered when analysing the drivers of real estate returns. While the asset class is in many ways exposed to general economic and financial trends, the way in which external shocks translate into performance can result in a very specific riskreturn profile. In particular, Wheaton et al. (2001) argue that real estate markets tend to be predictable to some extent, so that the full spectrum of market volatility might overstate the real risk. It might also result in effectively lower correlations with other asset classes despite being seemingly driven by similar fundamental factors.
5.5 Real estate factorThe existence of a specific real estate factor is highly relevant for the construction of investment portfolios based on fundamental factors. Recent research supports the existence of such a factor for commercial private real estate.
As discussed in earlier sections, real estate markets are driven by a number of exogenous drivers, both economic and monetary, which also influence the returns of equities or bonds. Additionally, real estate exhibits some endogenous dynamics which can be attributed mainly to long durations of the lease contracts and lagged reactions of the supply side. In the context of longterm diversification benefits, however, it is of particular relevance if the combination of these return drivers results in a returngenerating process for real estate that is different and independent from the processes that generate returns of other types of investments. One could suspect that the specific characteristics of real estate should indeed lead to the existence of a specific real estate factor. Otherwise it would be possible to replicate the characteristics of real estate returns using a combination of other assets. This becomes particularly relevant in the framework of “factor investing”, where portfolio
0
10
20
30
40
50
60
70
0
1
2
3
4
5
6
7
1990
Q4
1991
Q3
1992
Q2
1993
Q1
1993
Q4
1994
Q3
1995
Q2
1996
Q1
1996
Q4
1997
Q3
1998
Q2
1999
Q1
1999
Q4
2000
Q3
2001
Q2
2002
Q1
2002
Q4
2003
Q3
2004
Q2
2005
Q1
2005
Q4
2006
Q3
2007
Q2
2008
Q1
2008
Q4
2009
Q3
2010
Q2
2011
Q1
2011
Q4
2012
Q3
2013
Q2
2014
Q1
2014
Q4
Completions (rolling 4 quarters) Starts (rolling 4 quarters) Prime rent
million square feet GBP per square foot p.a.

39
THE DIVERSIFICATION POTENTIAL OF REAL ESTATE
NORGES BANK INVESTMENT MANAGEMENT / DISCUSSION NOTE
optimisation is based not on the return characteristics of individual assets or asset classes but on fundamental risk factors reflected in these returns.36
The issue of a specific “real estate factor” has been addressed in several academic studies, and researchers do find indications of the existence of such a factor. Mei and Lee (1994) apply factor analysis to uncover statistical factors driving equities, bonds and real estate returns, and find that all realestaterelated series (private and public) load strongly on one factor on which neither bonds nor equities load. Ang et al. (2013) are also able to extract a factor that is common to all real estate indices. The common real estate factor is procyclical and has low correlations with standard systematic factors. Indirect evidence is provided by Liu et al. (1990b), who conclude that real estate and stock markets are segregated. Ling and Naranjo (1999) reach a similar conclusion when using unsmoothed appraisalbased returns, although they acknowledge that this may also be due to the inability of these returns to accurately proxy true commercial real estate returns.
The existence of a specific risk factor has also been noted in the analysis of drivers of listed real estate. In an early study, Chan et al. (1990) find that factors explaining general stock market returns explain only 60 percent of REIT returns. The remaining variation can be attributed to the real estate factor. Hamelink and Hoesli (2004a) study the impact of various factors on real estate security returns across 21 countries and are unable to account for a significant portion of the return variance, stating that some hidden factors specific only to this asset class must exist. Westerheide (2006) concludes on the basis of a cointegration analysis that listed real estate is a separate asset class to stocks and bonds and hence driven by a separate specific longterm factor. Contradicting these results, Liu and Mei (1992) indicate that the specific factor in REIT returns might disappear when timevarying risk premiums are assumed, and Ling and Naranjo (1999) find that the market for listed real estate companies in the US is integrated with the market for nonrealestate stocks.
In order to verify the existence of a real estate factor, we ran a factor analysis for the US and the UK following the reasoning of Mei and Lee (1994). In addition to a broad stock market index and a bond market index, we included five alternative real estate indices discussed in section 3.3. Quarterly data were used in the US, and monthly data in the UK, except for the RCA transactionbased index, which is only available quarterly. Table 5 summarises the loadings of each index to three extracted factors. A higher absolute value for a loading means that the factor has a higher impact, positive or negative, on the returns of the index, while a value close to zero indicates no significant impact. When interpreting the results, one needs to bear in mind that the extracted factors are purely statistical and do not necessarily have a straightforward realworld interpretation.
36 See Ang (2010) for an extensive discussion of factor-based investing.
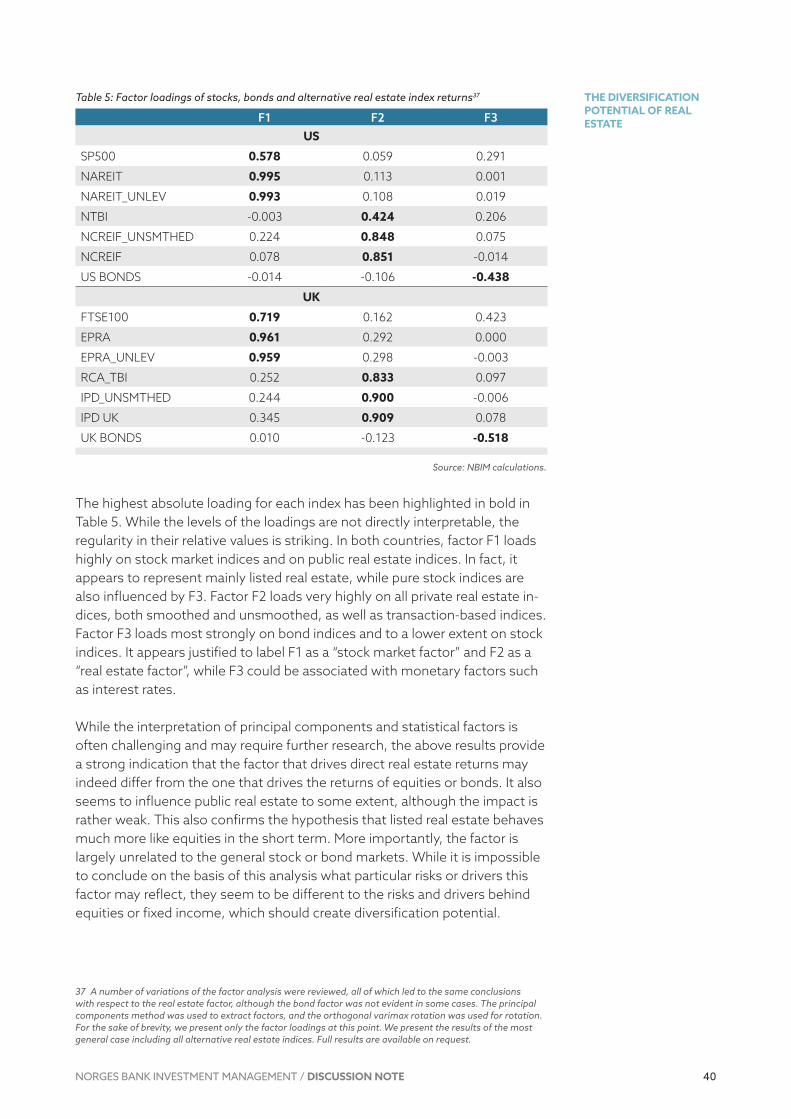
40
THE DIVERSIFICATION POTENTIAL OF REAL ESTATE
NORGES BANK INVESTMENT MANAGEMENT / DISCUSSION NOTE
Table 5: Factor loadings of stocks, bonds and alternative real estate index returns37
F1 F2 F3US
SP500 0.578 0.059 0.291
NAREIT 0.995 0.113 0.001
NAREIT_UNLEV 0.993 0.108 0.019
NTBI 0.003 0.424 0.206
NCREIF_UNSMTHED 0.224 0.848 0.075
NCREIF 0.078 0.851 0.014
US BONDS 0.014 0.106 -0.438
UK
FTSE100 0.719 0.162 0.423
EPRA 0.961 0.292 0.000
EPRA_UNLEV 0.959 0.298 0.003
RCA_TBI 0.252 0.833 0.097
IPD_UNSMTHED 0.244 0.900 0.006
IPD UK 0.345 0.909 0.078
UK BONDS 0.010 0.123 -0.518
Source: NBIM calculations.
The highest absolute loading for each index has been highlighted in bold in Table 5. While the levels of the loadings are not directly interpretable, the regularity in their relative values is striking. In both countries, factor F1 loads highly on stock market indices and on public real estate indices. In fact, it appears to represent mainly listed real estate, while pure stock indices are also influenced by F3. Factor F2 loads very highly on all private real estate indices, both smoothed and unsmoothed, as well as transactionbased indices. Factor F3 loads most strongly on bond indices and to a lower extent on stock indices. It appears justified to label F1 as a “stock market factor” and F2 as a “real estate factor”, while F3 could be associated with monetary factors such as interest rates.
While the interpretation of principal components and statistical factors is often challenging and may require further research, the above results provide a strong indication that the factor that drives direct real estate returns may indeed differ from the one that drives the returns of equities or bonds. It also seems to influence public real estate to some extent, although the impact is rather weak. This also confirms the hypothesis that listed real estate behaves much more like equities in the short term. More importantly, the factor is largely unrelated to the general stock or bond markets. While it is impossible to conclude on the basis of this analysis what particular risks or drivers this factor may reflect, they seem to be different to the risks and drivers behind equities or fixed income, which should create diversification potential.
37 A number of variations of the factor analysis were reviewed, all of which led to the same conclusions with respect to the real estate factor, although the bond factor was not evident in some cases. The principal components method was used to extract factors, and the orthogonal varimax rotation was used for rotation. For the sake of brevity, we present only the factor loadings at this point. We present the results of the most general case including all alternative real estate indices. Full results are available on request.

41
THE DIVERSIFICATION POTENTIAL OF REAL ESTATE
NORGES BANK INVESTMENT MANAGEMENT / DISCUSSION NOTE
6 ReferencesAmbrose, B. W., Eichholtz, P. and Lindenthal, T. (2013). House prices and fundamentals: 355 years of evidence. Journal of Money, Credit and Banking, 45(23), 477491.
Andonov, A., Kok, N. and Eichholtz, P. (2013). A global perspective on pension fund investments in real estate. Journal of Portfolio Management, 39(5), 3242.
Andonov, A., Eichholtz, P. and Kok, N. (2015). Intermediated investment management in private markets: Evidence from pension fund investments in real estate. Journal of Financial Markets, 22, 73103.
Ang, A. (2010). Asset management: A systematic approach to factor invest-ing. New York: Oxford University Press.
Ang, A., Nabar, N. and Wald, S. (2013). Searching for a common factor in public and private real estate returns. Journal of Portfolio Management, Special Real Estate Issue 2013, 120133.
Anglin, P. M., Rutherford, R. and Springer, T. M. (2003). The tradeoff between the selling price of residential properties and timeonthemarket: The impact of price setting. Journal of Real Estate Finance and Economics, 26(1), 95111.
Barkham, R. and Geltner, D. (1995). Price discovery in American and British property markets. Real Estate Economics, 23(1), 2144.
Barkham, R. J., Ward, C. W. and Henry, O. T. (1996). The inflationhedging characteristics of UK property. Journal of Property Finance, 7(1), 6276
Bekkers, N., Doeswijk, R. Q. and Lam, T. W. (2009). Strategic asset allocation: Determining the optimal portfolio with ten asset classes. Journal of Wealth Management, 12(3), 6177.
Blake, N., Goodwin, A., McIntosh, A. and Simmons, C. (2011). Property and inflation. London: Investment Property Forum.
Bond, M. and Seiler, M. (1998). Real estate returns and inflation: An added variable approach. Journal of Real Estate Research, 15(3), 327338.
Bond, S. A. and Hwang, S. (2003). A measure of fundamental volatility in the commercial property market. Real Estate Economics, 31(4), 577600.
Bond, S. A. and Slezak, S. L. (2010). The optimal portfolio weight for real estate with liquidity risk and uncertainty aversion. Retrieved from http://ssrn.com/abstract=1691503.
Bond, S. A., Hwang, S. and Richards, K. (2006). Optimal allocation to real estate incorporating illiquidity risk. Journal of Asset Management, 7(1), 216.

42
THE DIVERSIFICATION POTENTIAL OF REAL ESTATE
NORGES BANK INVESTMENT MANAGEMENT / DISCUSSION NOTE
Bond, S. A., Hwang, S., Lin, Z. and Vandell, K. D. (2007). Marketing period risk in a portfolio context: Theory and empirical estimates from the UK commercial real estate market. Journal of Real Estate Finance and Economics, 34(4), 447461.
Boyd, J., Ziobrowski, A., Ziobrowski, B. and Cheng, P. (1998). Leverage and real estate investment in mixedasset portfolios. Journal of Real Estate Port-folio Management, 4(2), 135147.
Brinson, G. P., Diermeier, J. and Schlarbaum, G. (1986). A composite portfolio benchmark for pension plans. Financial Analysts Journal, 42(2), 1524.
Brooks, C. and Tsolacos, S. (1999). The impact of economic and financial factors on UK property performance. Journal of Property Research, 16(2), 139152.
Brounen, D., Prado, M. P. and Verbeek, M. (2010). Real estate in an ALM framework: The case of fair value accounting. Real Estate Economics, 38(4), 775804.
Brown, G. R. (1991). Property investment and the capital markets. London: E. & F.N. Spon.
Brown, G. R. and Foo Sing, T. (2004). Equilibrium time on the market (ETOM) for commercial real estate in the UK. Journal of Property Investment & Fi-nance, 22(6), 458471.
Buckles, B. (2008). Liquidity dynamics in commercial real estate. Journal of Real Estate Portfolio Management, 14(4), 307324.
Campbell, J. Y. and Viceira, L. M. (2005). The term structure of the riskreturn tradeoff. Financial Analysts Journal, 61(1), 3444.
Case, B., Goetzmann, W. N. and Rouwenhorst, K. G. (2000). Global real estate markets – cycles and fundamentals. National Bureau of Economic Research, Working Paper No. 7566.
Chan, K. C., Hendershott, P. H. and Sanders, A. B. (1990). Risk and return on real estate: Evidence from equity REITs. Real Estate Economics, 18(4), 431452.
Chaney, A. and Hoesli, M. (2010). The interest rate sensitivity of real estate. Journal of Property Research, 27(1), 6185.
Chaney, A. and Hoesli, M. (2015a). Transactionbased and appraisalbased capitalization rate determinants. International Real Estate Review, 18(1), 143.
Chaney, A. and Hoesli, M. (2015b). Multifamily residential asset and space markets and linkages with the economy. Journal of Property Research, 32(1), 5076.

43
THE DIVERSIFICATION POTENTIAL OF REAL ESTATE
NORGES BANK INVESTMENT MANAGEMENT / DISCUSSION NOTE
Chatrath, A. and Liang, Y. (1998). REITs and inflation: A longrun perspective. Journal of Real Estate Research, 16(3), 311326.
Chatrath, A., Liang, Y. and McIntosh, W. (2000). The asymmetric REITbeta puzzle. Journal of Real Estate Portfolio Management, 6(2), 101111.
Chegut, A.M., Eichholtz, P. and Rodrigues, P. (2013). The London Commercial Property Price Index. Journal of Real Estate Finance and Economics, 47(4), 588616.
Chen, J., HudsonWilson, S. and Nordby, H. (2004). Real estate pricing: Spreads & sensibilities: Why real estate pricing is rational. Journal of Real Estate Portfolio Management, 10(1), 121.
Cheng, P. (2001). Comparing downsiderisk and meanvariance analysis using bootstrap simulation. Journal of Real Estate Portfolio Management, 7(3), 225238.
Cheng, P., Lin, Z. and Liu, Y. (2013). Is there a real estate allocation puzzle? Journal of Portfolio Management, Special Real Estate Issue 2013, 6174.
Chervachidze, S. and Wheaton, W. (2013). What determined the Great Cap Rate Compression of 20002007, and the dramatic reversal during the 20082009 Financial Crisis? Journal of Real Estate Finance and Economics, 46(2), 208231.
Chervachidze, S., Costello, J. and Wheaton, W. C. (2009). The secular and cyclic determinants of capitalization rates: The role of property fundamentals, macroeconomic factors and “structural changes”. Journal of Portfolio Management, 35(5), 5069.
Chiang, K. C., Jiang, X. and Lee, M. L. (2009). REIT idiosyncratic risk. Journal of Property Research, 26(4), 349366.
Chiang, K., Lee, M. L. and Wisen, C. (2004). Another look at the asymmetric REITbeta puzzle. Journal of Real Estate Research, 26(1), 2542.
Chordia, T., Roll, R. and Subrahmanyam, A. (2001). Market liquidity and trading activity. Journal of Finance, 56(2), 501530.
Chu, Y. and Sing, T. (2004). Inflation hedging characteristics of the Chinese real estate market. Journal of Real Estate Portfolio Management, 10(2), 145154.
Chua, A. (1999). The role of international real estate in global mixedasset investment portfolios. Journal of Real Estate Portfolio Management, 5(2), 129137.
Chun, G. H., Ciochetti, B. A. and Shilling, J. D. (2000). Pensionplan real estate investment in an assetliability framework. Real Estate Economics, 28(3), 467491.

44
THE DIVERSIFICATION POTENTIAL OF REAL ESTATE
NORGES BANK INVESTMENT MANAGEMENT / DISCUSSION NOTE
Clayton, J. and Glass, L. D. (2009). Cap rates & real estate cycles: A histori-cal perspective with a look to the future. Hartford: Cornerstone Real Estate Advisors.
Clayton, J. and MacKinnon, G. (2001). The timevarying nature of the link between REIT, real estate and financial asset returns. Journal of Real Estate Portfolio Management, 7(1), 4354.
Clayton, J. and MacKinnon, G. (2003). The relative importance of stock, bond and real estate factors in explaining REIT returns. Journal of Real Estate Finance and Economics, 27(1), 3960.
Clayton, J., Geltner, D. and Hamilton, S. W. (2001). Smoothing in commercial property valuations: Evidence from individual appraisals. Real Estate Econom-ics, 29(3), 337360.
Clayton, J., MacKinnon, G. and Peng, L. (2008). Time variation of liquidity in the private real estate market: An empirical investigation. Journal of Real Estate Research, 30(2), 125160.
CMS (2014). CMS Guide to Real Estate Transaction Costs and Taxes in Europe. Retrieved from http://www.cmslegal.com.
Coleman, M. and Mansour, A. (2005). Real estate in the real world: Dealing with nonnormality and risk in an asset allocation model. Journal of Real Es-tate Portfolio Management, 11(1), 3753.
Collett, D., Lizieri, C. and Ward, C. (2003). Timing and the holding periods of institutional real estate. Real Estate Economics, 31(2), 205222.
Conner, P. and Liang, Y. (2005). The complex interaction between real estate cap rates and interest rates. Briefings in Real Estate Finance, 4(3), 185197.
Cooperman, L. G., Einhorn, S. G. and Melnikoff, M. (1984). Property revisited: The role of property in pension fund investments. New York: Goldman Sachs.
Cornell University’s Baker Program in Real Estate and Hodes Weill & Associates (2013). Institutional Real Estate Allocations Monitor. Retrieved from http://baker.realestate.cornell.edu.
Cotter, J. and Stevenson, S. (2007). Uncovering volatility dynamics in daily REIT returns. Journal of Real Estate Portfolio Management, 13(2), 119128.
Cotter, J. and Stevenson, S. (2008). Modelling long memory in REITs. Real Estate Economics, 36(3), 533554.
Craft, T. (2001). The role of private and public real estate in pension plan portfolio allocation choices. Journal of Real Estate Portfolio Management, 7(1), 1723.

45
THE DIVERSIFICATION POTENTIAL OF REAL ESTATE
NORGES BANK INVESTMENT MANAGEMENT / DISCUSSION NOTE
Crosby, N. and McAllister, P. (2004). Deconstructing the transaction process: An analysis of fund transaction data. In Liquidity in commercial property mar-kets (pp. 2239). London: Investment Property Forum.
Demary, M. and Voigtländer, M. (2009). The inflation hedging properties of real estate: A comparison between direct investments and equity returns. Research Center for Real Estate Economics, Institut der deutschen Wirtschaft Köln.
Devaney, S. and Scofield, D. (2013). Broker use and the cost of liquidity in commercial real estate investment. Journal of European Real Estate Re-search, 6(3), 279302.
Devaney, S. and Scofield, D. (2014). Time to transact: Measurement and driv-ers. London: Investment Property Forum.
DiPasquale, D. and Wheaton, W. C. (1992). The markets for real estate assets and space: A conceptual framework. Real Estate Economics, 20(2), 181198.
Doeswijk, R., Lam, T. and Swinkels, L. (2014). The global multiasset market portfolio, 19592012. Financial Analysts Journal, 70(2), 2641.
DTZ (2015). Money into Property 2015: Risks from overheating markets. Retrieved from http://www.dtz.com/Global/Research/DTZ+Money+into+Property+2015
Eichholtz, P. (1997). A long run house price index: The Herengracht index, 16281973. Real Estate Economics, 25(2), 175192.
Ennis, R. M. and Burik, P. (1991). Pension fund real estate investment under a simple equilibrium pricing model. Financial Analysts Journal, 47(3), 2030.
Eppli, M. J., Shilling, J. D. and Vandell, K. D. (1998). What moves retail property returns at the metropolitan level? Journal of Real Estate Finance and Economics, 16(3), 317342.
EPRA (2014). Monthly Statistical Bulletin, December 2014. Retrieved from http://www.epra.com/researchandindices/indices/monthlybulletins/.
Fama, E. F. and Schwert, G. W. (1977). Asset returns and inflation. Journal of Financial Economics, 5(2), 115146.
Feldman, B. (2003). Investment policy for securitized and direct real estate. Chicago: Ibbotson Associates.
Firstenberg, P. M., Ross, S. A. and Zisler, R. C. (1988). Real estate: The whole story. Journal of Portfolio Management, 14(3), 2234.
Fisher, J. D. (2000). A repeat sales index for commercial real estate – using sold properties in the NCREIF database. Real Estate Finance, 17(2), 6671.

46
THE DIVERSIFICATION POTENTIAL OF REAL ESTATE
NORGES BANK INVESTMENT MANAGEMENT / DISCUSSION NOTE
Fisher, J. D., Gatzlaff, D., Geltner, D. and Haurin, D. (2003). Controlling for the impact of variable liquidity in commercial real estate price indices. Real Estate Economics, 31(2), 269303.
Fisher, J. D., Geltner, D. and Webb, R. B. (1994). Value indices of commercial real estate: A comparison of index construction methods. Journal of Real Estate Finance and Economics, 9(2), 137164.
Fisher, J. D. and Goetzmann, W. N. (2005). Performance of real estate portfolios. Journal of Portfolio Management, Special Real Estate Issue, September, 3245.
Fogler, H. (1984). 20% in real estate: Can theory justify it? Journal of Portfolio Management, 10(2), 613.
Fogler, H. R., Granito, M. R. and Smith, L. R. (1985). A theoretical analysis of real estate returns. Journal of Finance, 40(3), 711719.
Forgey, F. A., Rutherford, R. C. and Springer, T. M. (1996). Search and liquidity in singlefamily housing. Real Estate Economics, 24(3), 273292.
Geltner, D. (1989). Estimating real estate’s systematic risk from aggregate level appraisalbased returns. Real Estate Economics, 17(4), 463481.
Geltner, D. (1991). Smoothing in appraisalbased returns. Journal of Real Es-tate Finance and Economics, 4(3), 327345.
Geltner, D. (1993). Estimating market values from appraised values without assuming an efficient market. Journal of Real Estate Research, 8(3), 325345.
Giliberto, S. (1992). The allocation of real estate to future mixedasset institutional portfolios. Journal of Real Estate Research, 7(4), 423432.
Glascock, J. L., Lu, C. and So, R. W. (2002). REIT returns and Inflation: Perverse or reverse causality effects? Journal of Real Estate Finance and Eco-nomics, 24(3), 301317
Goetzmann, W. N. and Ibbotson, R. G. (1990). The performance of real estate as an asset class. Journal of Applied Corporate Finance, 3(1), 6576.
Goetzmann, W. N. and Wachter, S. M. (2001). The global real estate crash: Evidence from an international database. In Brown, S. J., and Liu, C. H. (Eds.), A global perspective on real estate cycles (pp. 523). US: Springer.
Gold, R. B. (1986). Real estate: Can institutional portfolios be diversified with-out it? Chicago: JMB Institutional Realty Corporation.
Goldstein, M. A. and Nelling, E. F. (1999). REIT return behavior in advancing and declining stock markets. Real Estate Finance, 15(4), 6877.

47
THE DIVERSIFICATION POTENTIAL OF REAL ESTATE
NORGES BANK INVESTMENT MANAGEMENT / DISCUSSION NOTE
Gordon, J. N. (1994). The real estate capital markets matrix: A paradigm approach. Real Estate Finance, 11(3), 715
Gunasekarage, A., Power, D. M. and Ting Zhou, T. (2008). The longterm inflation hedging effectiveness of real estate and financial assets: A New Zealand investigation. Studies in Economics and Finance, 25(4), 267278.
Hamelink, F. and Hoesli, M. (1996). Swiss real estate as a hedge against inflation: New evidence using hedonic and autoregressive models. Journal of Property Finance, 7(1), 3349.
Hamelink, F. and Hoesli, M. (2004a). What factors determine international real estate security returns? Real Estate Economics, 32(3), 437.
Hamelink, F. and Hoesli, M. (2004b). Maximum drawdown and the allocation to real estate. Journal of Property Research, 21(1), 529.
Haran, M., Davis, P., McCord, M., Grissom, T. and Newell, G. (2013). Equities or real estate? An international evaluation of listed property markets. Journal of European Real Estate Research, 6(2), 139162.
Hartzell, D. (1986). Real estate in the portfolio. New York: Salomon Brothers.
Hartzell, D., Hekman, J. and Miles, M. (1986). Diversification categories in investment real estate. Real Estate Economics, 14(2), 230254.
Hartzell, D., Hekman, J. S. and Miles, M. E. (1987). Real estate returns and inflation. Real Estate Economics, 15(1), 617637.
Haurin, D. (1988). The duration of marketing time of residential housing. Real Estate Economics, 16(4), 396410.
Heaney, R. and Sriananthakumar, S. (2012). Timevarying correlation between stock market returns and real estate returns. Journal of Empirical Finance, 19(4), 583594.
Hendershott, P., Lizieri, C. and MacGregor, B. (2010). Asymmetric adjustment in the City of London office market. Journal of Real Estate Finance and Eco-nomics, 41(1), 80101.
Hendershott, P. H., Lizieri, C. and Matysiak, G. A. (1999). The workings of the London office market. Real Estate Economics, 27(2), 365387.
Hendershott, P. H., MacGregor, B. and Tse, R. Y. (2002). Estimation of the rental adjustment process. Real Estate Economics, 30(2), 165183.
Hill, R. (2011). Hedonic price indexes for housing. OECD Statistics Working Papers, 2011/1.
Hobbs, P. and Chin, H. (2007). The future size of the global real estate mar-ket. London: RREEF.

48
THE DIVERSIFICATION POTENTIAL OF REAL ESTATE
NORGES BANK INVESTMENT MANAGEMENT / DISCUSSION NOTE
Hoesli, M. and Lizieri, C. (2007). Real estate in the investment portfolio. A report for the Investment Strategy Council of the Royal Ministry of Finance.
Hoesli, M. and Moreno, C. S. (2006). Securitized real estate and its link with financial assets and real estate: An international analysis. Journal of Real Estate Literature, 15(1), 5784.
Hoesli, M. and Oikarinen, E. (2012). Are REITs real estate? Evidence from international sector level data. Journal of International Money and Finance, 31(7), 18231850.
Hoesli, M. and Reka, K. (2013). Volatility spillovers, comovements and contagion in securitized real estate markets. Journal of Real Estate Finance and Economics, 47(1), 135.
Hoesli, M. and Reka, K. (2015). Contagion channels between real estate and financial markets. Real Estate Economics, 43(1), 101138.
Hoesli, M., Lekander, J. and Witkiewicz, W. (2004). International evidence on real estate as a portfolio diversifier. Journal of Real Estate Research, 26(2), 161206.
Hoesli, M., Lizieri, C. and MacGregor, B. (2008). The inflation hedging characteristics of US and UK investments: A multifactor error correction approach. Journal of Real Estate Finance and Economics, 36(2), 183206.
Hoesli, M., Oikarinen, E. and Serrano, C. (2015). Do public real estate returns really lead private returns? Journal of Portfolio Management. Forthcoming.
Hordijk, A. and Teuben, B. (2008). The liquidity of direct real estate in institutional investors’ portfolios: The Netherlands. Journal of Property Investment & Finance, 26(1), 3858.
Huang, H. and HudsonWilson, S. (2007). Private commercial real estate equity returns and inflation. Journal of Portfolio Management, 33(5), 6373.
HudsonWilson, S., Fabozzi, F. J. and Gordon, J. N. (2003). Why real estate? Journal of Portfolio Management, 29(5), 1225.
HudsonWilson, S., Gordon, J. N., Fabozzi, F. J., Anson, M. J. and Giliberto, S. M. (2005). Why real estate? The Journal of Portfolio Management, 31(5), 1221.
Ibbotson, R. G. and Siegel, L. B. (1983). The world market wealth portfolio. Journal of Portfolio Management, 9(2), 517.
Ibbotson, R. G., Siegel, L. B. and Love, K. S. (1985). World wealth: Market values and returns. Journal of Portfolio Management, 12(1), 423.
Idzorek, T. M., Barad, M. and Meier, S. L. (2007). Global commercial real estate. Journal of Portfolio Management, 33(5), 3752.

49
THE DIVERSIFICATION POTENTIAL OF REAL ESTATE
NORGES BANK INVESTMENT MANAGEMENT / DISCUSSION NOTE
INREV (2014). Management fees and terms global. Available at: https://www.inrev.org.
Irwin, S. H. and Landa, D. (1987). Real estate, futures, and gold as portfolio assets. Journal of Portfolio Management, 14(1), 2934.
Kaiser, R. (1997). The long cycle in real estate. Journal of Real Estate Re-search, 14(3), 233257.
Kallberg, J. G., Liu, C. H. and Greig, D. W. (1996). The role of real estate in the portfolio allocation process. Real Estate Economics, 24(3), 359377.
LaSalle Investment Management (2014). The Real Estate Investable Uni-verse 2014. Retrieved from http://www.pensionfundsonline.co.uk/content/pensionfundsinsider/specialistoutlook/therealestateinvestableuniverse2014/1521.
Le Moigne, C. and Viveiros, É. (2008). Private real estate as an inflation hedge: An updated look with a global perspective. Journal of Real Estate Port-folio Management, 14(4), 263286.
Lee, S. and Stevenson, S. (2006). Real estate in the mixedasset portfolio: The question of consistency. Journal of Property Investment & Finance, 24(2), 123135.
Liang, Y. and McIntosh, W. (1998). Employment growth and real estate return: Are they linked? Journal of Real Estate Portfolio Management, 4(2), 125133.
Liang, Y., Myer, F. C. and Webb, J. R. (1996). The bootstrap efficient frontier for mixedasset portfolios. Real Estate Economics, 24(2), 247256.
Lin, Z. and Vandell, K. D. (2007). Illiquidity and pricing biases in the real estate market. Real Estate Economics, 35(3), 291330.
Lin, Z., Liu, Y. and Vandell, K. D. (2009). Marketing period risk in a portfolio context: Comment and extension. Journal of Real Estate Finance and Eco-nomics, 38(2), 183191.
Ling, D. C. and Naranjo, A. (1998). The fundamental determinants of commercial real estate returns. Real Estate Finance, 14, 1324.
Ling, D. C. and Naranjo, A. (1999). The integration of commercial real estate markets and stock markets. Real Estate Economics, 27(3), 483515.
Ling, D. C. and Naranjo, A. (2015). Returns and information transmission dynamics in public and private real estate markets. Real Estate Economics, 43(1), 163208.

50
THE DIVERSIFICATION POTENTIAL OF REAL ESTATE
NORGES BANK INVESTMENT MANAGEMENT / DISCUSSION NOTE
Liow, K. H., Chen, Z. and Liu, J. (2011). Multiple regimes and volatility transmission in securitized real estate markets. Journal of Real Estate Finance and Economics, 42(3), 295328.
Liow, K. H., Muhammad, F. a. I. and Huang, Q. (2006). Macroeconomic risk influences on the property stock market. Journal of Property Investment & Finance, 24(4), 295323.
Liu, C. H. and Mei, J. (1992). The predictability of returns on equity REITs and their co-movement with other assets. Cornell University, SHA School.
Liu, C. H., Grissom, T. V. and Hartzell, D. J. (1990a). The impact of market imperfections on real estate returns and optimal investor portfolios. Real Estate Economics, 18(4), 453478.
Liu, C. H., Hartzell, D. J. and Hoesli, M. E. (1997). International evidence on real estate securities as an inflation hedge. Real Estate Economics, 25(2), 193221.
Liu, C. H., Hartzell, D. J., Greig, W. and Grissom, T. V. (1990b). The integration of the real estate market and the stock market: Some preliminary evidence. Journal of Real Estate Finance and Economics, 3(3), 261282.
Lizieri, C. (2013). After the fall: Real estate in the mixedasset portfolio in the aftermath of the global financial crisis. Journal of Portfolio Management, Spe-cial Real Estate Issue 2013, 4359.
Lizieri, C. and Bond, S. (2004). Defining liquidity in property. In Liquidity in commercial property markets (pp. 721). London: Investment Property Forum.
Lizieri, C. and Satchell, S. (1997). Property company performance and real interest rates: A regimeswitching approach. Journal of Property Research, 14(2), 8597.
Lizieri, C., Satchell, S. and Wongwachara, W. (2012). Unsmoothing real estate returns: A regimeswitching approach. Real Estate Economics, 40(4), 775807.
Lizieri, C., Satchell, S., Worzala, E. and Dacco, R. (1998). Real interest regimes and real estate performance: A comparison of UK and US markets. Journal of Real Estate Research, 16(3), 339356.
Luu, B. V., Sharaiha, Y. M., Doskov, N., Patel, C. and Turkington, D. (2014). The shadow price of liquidity in asset allocation – a case study. Journal of Investment Management, 12(2), 118.
MacKinnon, G. H. and Al Zaman, A. (2009). Real estate for the long term: The effect of return predictability on longhorizon allocations. Real Estate Eco-nomics, 37(1), 117153.

51
THE DIVERSIFICATION POTENTIAL OF REAL ESTATE
NORGES BANK INVESTMENT MANAGEMENT / DISCUSSION NOTE
Mansell, G. (2013). Private real estate: From asset class to asset. London: Investment Property Databank.
Matysiak, G., Hoesli, M., MacGregor, B. and Nanthakumaran, N. (1996). The longterm inflationhedging characteristics of UK commercial property. Jour-nal of Property Finance, 7(1), 5061.
Maurer, R. and Sebastian, S. (2002). Inflation risk analysis of European real estate securities. Journal of Real Estate Research, 24(1), 4778.
McCue, T. E. and Kling, J. L. (1987). Office building investment and the macroeconomy: Empirical evidence, 19731985. Real Estate Economics, 15(3), 234255.
McCue, T. and Kling, J. (1994). Real estate returns and the macroeconomy: Some empirical evidence from real estate investment trust data, 19721991. Journal of Real Estate Research, 9(3), 277287.
Mei, J. and Lee, A. (1994). Is there a real estate factor premium? Journal of Real Estate Finance and Economics, 9(2), 113126.
Miles, M. and Mahoney, J. (1997). Is commercial real estate an inflation hedge? Real Estate Finance, 13, 3145.
Miles, M. and McCue, T. (1984). Commercial real estate returns. Real Estate Economics, 12(3), 355377.
Miles, W. (2008). Volatility clustering in US home prices. Journal of Real Estate Research, 30(1), 7390.
Miles, W. (2011). Clustering in UK home price volatility. Journal of Housing Research, 20(1), 87101.
Miller, N. G. (1978). Time on the market and selling price. Real Estate Eco-nomics, 6(2), 164174.
Morawski, J., Rehkugler, H. and Füss, R. (2008). The nature of listed real estate companies: Property or equity market? Financial Markets and Portfolio Management, 22(2), 101126.
Mueller, A. and Mueller, G. (2003). Public and private real estate in a mixedasset portfolio. Journal of Real Estate Portfolio Management, 9(3), 193203.
Newell, G. (1996). The inflationhedging characteristics of Australian commercial property: 19841995. Journal of Property Finance, 7(1), 620.
Obereiner, D. and Kurzrock, B. M. (2012). Inflationhedging properties of indirect real estate investments in Germany. Journal of Property Investment & Finance, 30(3), 218240.

52
THE DIVERSIFICATION POTENTIAL OF REAL ESTATE
NORGES BANK INVESTMENT MANAGEMENT / DISCUSSION NOTE
Oikarinen, E., Hoesli, M. and Serrano, C. (2011). The longrun dynamics between direct and securitized real estate. Journal of Real Estate Research, 33(1), 73103.
Önder, Z. (2000). High inflation and returns on residential real estate: Evidence from Turkey. Applied Economics, 32(7), 917931.
Ooi, J. T., Wang, J. and Webb, J. R. (2009). Idiosyncratic risk and REIT returns. Journal of Real Estate Finance and Economics, 38(4), 420442.
Orr, A. M., Dunse, N. and Martin, D. (2003). Time on the market and commercial property prices. Journal of Property Investment & Finance, 21(6), 473494.
Pagliari, J. (2011). Long-run investment horizons and implications for mixed-asset portfolio allocations. Retrieved from http://ssrn.com/abstract=1921612.
Pagliari Jr, J. L., Scherer, K. A. and Monopoli, R. T. (2003). Public versus private real estate equities. Journal of Portfolio Management, 29(5), 101111.
Pagliari, J. L., Scherer, K. A. and Monopoli, R. T. (2005). Public versus private real estate equities: A more refined, longterm comparison. Real Estate Eco-nomics, 33(1), 147187.
Persuad, A. (2003). Liquidity black holes. London: Risk Books.
Peterson, J. D. and Hsieh, C. H. (1997). Do common risk factors in the returns on stocks and bonds explain returns on REITs? Real Estate Economics, 25(2), 321345.
Peyton, M. S. (2009). Capital markets impact on commercial real estate cap rates: A practitioner’s view. Journal of Portfolio Management, 35(5), 3849.
Pyhrr, S., Roulac, S. and Born, W. (1999). Real estate cycles and their strategic implications for investors and portfolio managers in the global economy. Journal of Real Estate Research, 18(1), 768.
Quan, D. C. and Quigley, J. M. (1991). Price formation and the appraisal function in real estate markets. Journal of Real Estate Finance and Economics, 4(2), 127146.
Quan, D. C. and Titman, S. (1999). Do real estate prices and stock prices move together? An international analysis. Real Estate Economics, 27(2), 183207.
Rehring, C. (2012). Real estate in a mixedasset portfolio: The role of the investment horizon. Real Estate Economics, 40(1), 6595.
Ross, S. A. and Zisler, R. C. (1991). Risk and return in real estate. Journal of Real Estate Finance and Economics, 4(2), 175190.

53
THE DIVERSIFICATION POTENTIAL OF REAL ESTATE
NORGES BANK INVESTMENT MANAGEMENT / DISCUSSION NOTE
Rubens, J., Bond, M. and Webb, J. (1989). The inflationhedging effectiveness of real estate. Journal of Real Estate Research, 4(2), 4555.
Schulte, K. M., Dechant, T. and Schaefers, W. (2011). Systematic risk factors in European real estate equities. Journal of European Real Estate Research, 4(3), 185224.
Scofield, D. (2013). Time to completion liquidity in UK commercial real estate investment: 20002008. Journal of European Real Estate Research, 6(1), 3447.
Seiler, M., Webb, J. and Myer, N. (1999). Diversification issues in real estate investment. Journal of Real Estate Literature, 7(2), 163179.
Shilling, J. D. (2003). Is there a risk premium puzzle in real estate? Real Estate Economics, 31(4), 501525.
Simon, S. and Ng, W. L. (2009). The effect of the real estate downturn on the link between REITs and the stock market. Journal of Real Estate Portfolio Man-agement, 15(3), 211219.
Sing, T. F. and Low, S. H. Y. (2000). The inflationhedging characteristics of real estate and financial assets in Singapore. Journal of Real Estate Portfolio Management, 6(4), 373385.
Sing, T. F. and Ong, S. E. (2000). Asset allocation in a downside risk framework, Journal of Real Estate Portfolio Management, 6(3), 213223.
Sing, T. F. and Tan, Z. Y. (2013). Timevarying correlations between stock and direct real estate returns. Journal of Property Investment & Finance, 31(2), 179195.
Sivitanides, P., Southard, J., Torto, R. G. and Wheaton, W. C. (2001). The determinants of appraisalbased capitalization rates. Real Estate Finance, 18(2), 2738.
Sivitanidou, R. and Sivitanides, P. (1999). Office capitalization rates: Real estate and capital market influences. Journal of Real Estate Finance and Eco-nomics, 18(3), 297322.
Stefek, D. and Suryanarayanan, R. (2012). Private and public real estate: What is the link? Journal of Alternative Investments, 14(3), 6675.
Stevenson, S. (2001). The longterm advantages to incorporating indirect securities in direct real estate portfolios. Journal of Real Estate Portfolio Man-agement, 7(1), 516.
Sun, Q. and Yung, K. (2009). Idiosyncratic risk and expected returns of equity real estate investment trusts. Journal of Real Estate Portfolio Management, 15(1), 4557.

54
THE DIVERSIFICATION POTENTIAL OF REAL ESTATE
NORGES BANK INVESTMENT MANAGEMENT / DISCUSSION NOTE
Sun, J., Yang, X. and Zhao, X. (2012). Understanding commercial real estate indices. Journal of Real Estate Portfolio Management, 18(3), 289303.
Viezer, T. W. (2010). The application of modern portfolio theory to real estate: A brief survey. In Guerard, J. B. (Ed.). Handbook of portfolio construction (pp. 733760). New York: Springer.
Vogel, J. H. (2006). Cap rates and interest rates: The impact of interest rates on commercial real estate values. Real Estate Finance, 22(6), 1014.
Webb, J. R. and Rubens, J. H. (1986). Portfolio considerations in the valuation of real estate. Real Estate Economics, 14(3), 465495.
Webb, J. R. and Rubens, J. H. (1987). How much in real estate? A surprising answer. Journal of Portfolio Management, 13(3), 1014.
Webb, J. R., Curcio, R. J. and Rubens, J. H. (1988). Diversification gains from including real estate in mixedasset portfolios. Decision Sciences, 19(2), 434452.
Westerheide, P. (2006). Cointegration of real estate stocks and REITs with common stocks, bonds and consumer price inflation – an international comparison. ZEW – Centre for European Economic Research Discussion Paper, 06057.
Wheaton, W. W. and Torto, R. G. (1990). An investment model of the demand and supply for industrial real estate. Real Estate Economics, 18(4), 530547.
Wheaton, W. C., Baranski, M. S. and Templeton, C. A. (2009). 100 years of commercial real estate prices in Manhattan. Real Estate Economics, 37(1), 6983.
Wheaton, W. C., Torto, R. G. and Evans, P. (1997). The cyclic behavior of the Greater London office market. Journal of Real Estate Finance and Economics, 15(1), 7792.
Wheaton, W. C., Torto, R. G., Sivitanides, P. S., Southard, J. A., Hopkins, R E. and Costello, J. M. (2001). Real estate risk: A forwardlooking approach. Real Estate Finance, 18(3), 2028.
Wurtzebach, C., Mueller, G., Machi, D. (1991). The impact of inflation and vacancy on real estate returns. Journal of Real Estate Research, 6(2), 153168.
Yang, J., Zhou, Y. and Leung, W. K. (2012). Asymmetric correlation and volatility dynamics among stock, bond, and securitized real estate markets. Journal of Real Estate Finance and Economics, 45(2), 491521.
Young, M. S. (2008). Revisiting nonnormal real estate return distributions by property type in the US. Journal of Real Estate Finance and Economics, 36(2), 233248.

55
THE DIVERSIFICATION POTENTIAL OF REAL ESTATE
NORGES BANK INVESTMENT MANAGEMENT / DISCUSSION NOTE
Young, M. S. and Graff, R. A. (1995). Real estate is not normal: A fresh look at real estate return distributions. Journal of Real Estate Finance and Economics, 10(3), 225259.
Young, M. S., Lee, S. L. and Devaney, S. P. (2006). Nonnormal real estate return distributions by property type in the UK. Journal of Property Research, 23(2), 109133.
Yunus, N. (2012). Modeling relationships among securitized property markets, stock markets and macroeconomic variables. Journal of Real Estate Research, 34(2), 127156.
Ziobrowski, A., Caines, R. and Ziobrowski, B. (1999). Mixedasset portfolio composition with longterm holding periods and uncertainty. Journal of Real Estate Portfolio Management, 5(2), 139144.
Ziobrowski, A. J., Cheng, P. and Ziobrowski, B. J. (1997). Using a bootstrap to measure optimum mixedasset portfolio composition. Real Estate Econom-ics, 25(4), 695705.