
innovation diversification rejuvenation - Estate Intel · annual rEPort 2010 EMIRA Property Fund...
116
ANNUAL REPORT 2010 EMIRA Property Fund annual report 2010 INNOVATION DIVERSIFICATION REJUVENATION
Transcript of innovation diversification rejuvenation - Estate Intel · annual rEPort 2010 EMIRA Property Fund...

a n n u a l r E P o r t 2 0 1 0
EMIRA
Property Fund annual report 2010
innovation diversification rejuvenation

Strategic focus 1
Major achievements 2
Five-year financial review 5
Portfolio of top 10 properties by value 6
Portfolio summary 8
Chief Executive officer’s message 10
Manager’s report 15
Directorate 32
Corporate governance 34
Sustainability 40
annual financial statements 45
Participatory interest holders’ analysis 83
Property listing 85
Strategic real Estate Managers (Pty) limited – Financial statements 97
notice of annual general meeting 108
administration information 110
Form of proxy 111
emira Property fund’s principal objective is to grow earnings from a quality-based property portfolio.
Growth will be sought by making strategic investments where yields are enhancing in the medium to long term.
Management will further maintain the quality of the portfolio by disposing of assets, which no longer meet the strategic objectives of the fund.
www.emira.co.za
A property fund created under the Emira Property Scheme, registered in terms of the Collective Investment Schemes Control Act No 45 of 2002
Share code: EMIISIN: ZAE000050712(“Emira”)
Discovery Health
Technohub
Dalefern
Front cover – Wonderpark Shopping Centre, Boundary Terraces, Southern Sentrum, RTT Acsa Park

• Optimise net income and growth in distributions;
• Apply gearing to the portfolio to the extent that it enhances returns, limited to 40% of total assets as provided for in the Collective Investment Schemes Control Act;
• �Increase market capitalisation, liquidity and spread of investors through selective acquisitions and capital raising;
• Selectively recycle assets;
• Broaden the Fund’s geographic exposure to KwaZulu-Natal and the Western and Eastern Cape;
• Maintain a balanced exposure to the office, retail and industrial property sectors;
• Dispose of non-performing or potentially under-performing properties;
• Reduce vacancies and manage the lease expiry profile of the portfolio; and
• Meet the requirements of the Property Sector Transformation Charter.
Strategic focus
Page 1
Annual Report 2010 Emira Property Fund
R527,2�millionDistributable�income��
108,08�cents�+�6,8%�Distribution�per�participatory�interest�(PI)�
1�133�cents�Net�asset�value�per�PI
+�32,8%�12-month�total�return�
Imfundo House UNDP House

The� announcement� in� July� 2010� that� Emira� would� amend� the� terms� of� its�
asset management fee structure� was� the� culmination� of� extended�
negotiations�between�the�Fund,�the�shareholders�of�the�Manager,�Strategic�
Real� Estate� Managers� (STREM)� and� the� regulatory� authorities.� It� will� bring�
short- and long-term benefits�for�participatory�interest�(PI)�holders�of�
the�Fund.
When�PI�holders�voted�in�favour�of�the�change�to�the�Trust�Deed�of�the�Fund,�
Emira� became� the� first� Collective� Investment� Scheme� in� Property� (CISP)� to�
align�management�and�PI�holders’�interests�by�introducing�a�cost�only�related�
fee�structure.
Under�the�terms�of�the�agreement�the�Manager,�STREM,�agreed�to�amend�the�
terms� of� its� service� charge� arrangement� to� a� monthly fee based on
STREM’s actual operating costs�rather�than�the�historical�arrangement�
whereby� the� monthly� charge� was� based� on� enterprise� value.� A� once-off�
cancellation�payment�of�R197,4�million�was�paid�in�September�2010.
PI� holders� will� benefit� from� a� more� effective� cost� structure� as� the� new�
arrangement�will�be�tangibly�earnings enhancing�from�the�first�year.
Simultaneously,�the�Trust�Deed�was�changed�to�allow�the�Fund�to�invest�in�a�
broader class of assets�and�to�increase the gearing limit from�the�
current�limit�of�30%�to�40%�of�the�value�of�its�underlying�assets.
The� changes� were� overwhelmingly� positively� received� with� between� 94%�
and� 98%� of� eligible� PI� holders� who� responded,� voting� in� favour� of� the�
amendments.
Page 2
Annual Report 2010 Emira Property Fund
Major achievements
Amending the management structure to unlock benefits for all
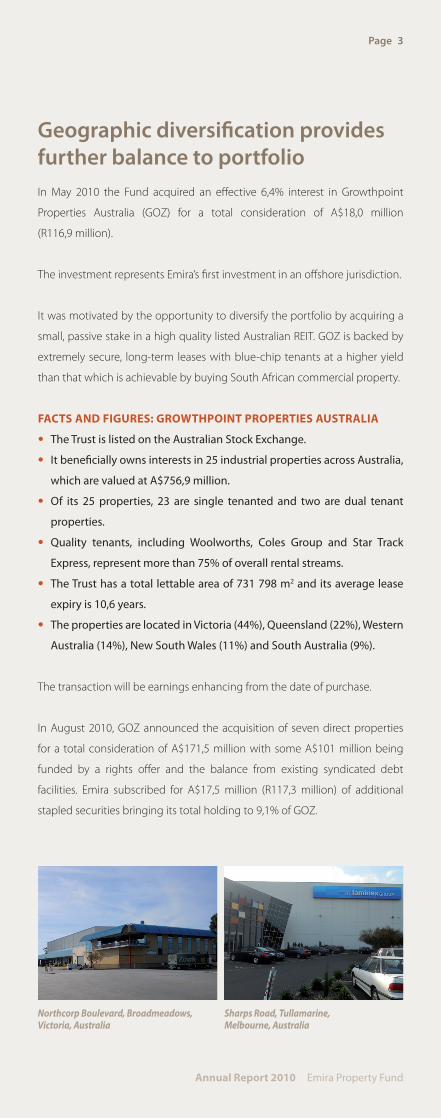
Geographic diversification provides further balance to portfolioIn� May� 2010� the� Fund� acquired� an� effective� 6,4%� interest� in� Growthpoint�
Properties� Australia� (GOZ)� for� a� total� consideration� of� A$18,0� million�
(R116,9 million).�
The�investment�represents�Emira’s�first�investment�in�an�offshore�jurisdiction.�
It�was�motivated�by�the�opportunity�to�diversify�the�portfolio�by�acquiring�a�
small,�passive�stake�in�a�high�quality�listed�Australian�REIT.�GOZ�is�backed�by�
extremely�secure,� long-term�leases�with�blue-chip�tenants�at�a�higher�yield�
than�that�which�is�achievable�by�buying�South�African�commercial�property.�
FAcTS And FiguRES: gRowThpoinT pRopERTiES AuSTRAliA
• The Trust is listed on the Australian Stock Exchange.
• It beneficially owns interests in 25 industrial properties across Australia,
which are valued at A$756,9 million.
• Of its 25 properties, 23 are single tenanted and two are dual tenant
properties.
• Quality tenants, including Woolworths, Coles Group and Star Track
Express, represent more than 75% of overall rental streams.
• The Trust has a total lettable area of 731 798 m2 and its average lease
expiry is 10,6 years.
• The properties are located in Victoria (44%), Queensland (22%), Western
Australia (14%), New South Wales (11%) and South Australia (9%).
The�transaction�will�be�earnings�enhancing�from�the�date�of�purchase.
In�August�2010,�GOZ�announced�the�acquisition�of�seven�direct�properties�
for�a� total�consideration�of�A$171,5�million�with�some�A$101 million�being�
funded� by� a� rights� offer� and� the� balance� from� existing� syndicated� debt�
facilities.� Emira� subscribed� for� A$17,5� million� (R117,3� million)� of� additional�
stapled�securities�bringing�its�total�holding�to�9,1%�of�GOZ.
Page 3
Annual Report 2010 Emira Property Fund
Northcorp Boulevard, Broadmeadows, Victoria, Australia
Sharps Road, Tullamarine, Melbourne, Australia

Continued active asset management to enhance property portfolio
The�Fund�extended�its�track�record�of�investing�to�enhance�the�quality�of�its�
property�portfolio�in�2010,�as�has�been�the�case�in�recent�years.
During�the�past�three�years,�the�Fund�has:
• Acquired 10 properties with a total value of R394,9 million;
• Invested R88,6 million in upgrading eight office properties;
• Refurbished and extended 14 shopping centres with a capital value of
R358,1 million;
• Spent R21,4 million on enhancing two industrial properties; and
• Disposed of 12 non-core buildings for a total consideration
of R258,5 million and four sectional title units worth R9,0 million.
FAcTS And FiguRES: pRopERTy invESTMEnTS in 2010
• Two new properties were purchased for R98,0 million, being a single
tenanted industrial warehouse let to Taylor Blinds and a 50% undivided
share in a multi-tenanted office and retail building located at 80 Strand
Street in the Cape Town CBD.
• Capital investments of some R181,4 million to refurbish and extend
12 properties were completed and ongoing. Seven projects are ongoing
at year-end including a R126,2 million refurbishment and extension of
Randridge Mall.
• The board approved two projects to demolish and rebuild prime office
space to the order of R291,8 million at Podium House in Menlyn, Pretoria
and FNB Heerengracht in the Cape Town CBD which will commence
once a predetermined level of pre-letting has been achieved.�
Page 4
Annual Report 2010 Emira Property Fund
Randridge Mall
Rigel Park
Page 5
Annual Report 2010 Emira Property Fund
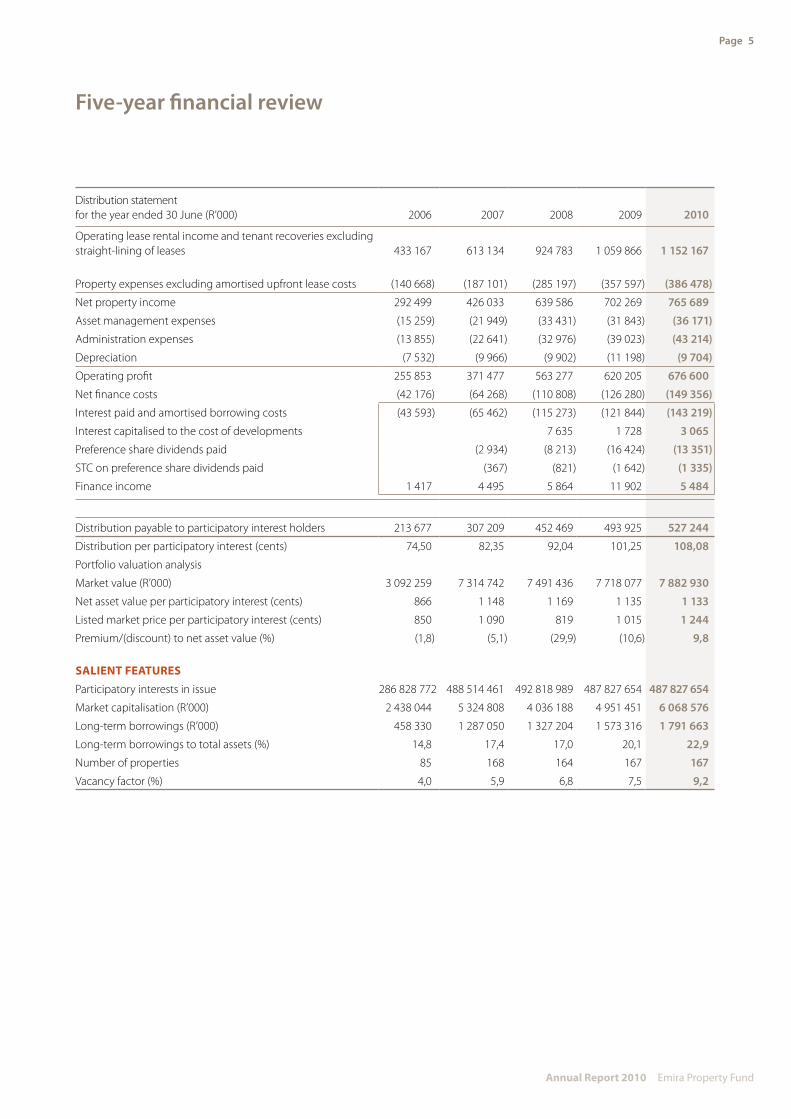
Five-year financial review
Distribution statement for the year ended 30 June (R’000) 2006 2007 2008 2009 2010
Operating lease rental income and tenant recoveries excluding straight-lining of leases 433 167 613 134 924 783 1 059 866 1 152 167
Property expenses excluding amortised upfront lease costs (140 668) (187 101) (285 197) (357 597) (386 478)
Net property income 292 499 426 033 639 586 702 269 765 689
Asset management expenses (15 259) (21 949) (33 431) (31 843) (36 171)
Administration expenses (13 855) (22 641) (32 976) (39 023) (43 214)
Depreciation (7 532) (9 966) (9 902) (11 198) (9 704)
Operating profit 255 853 371 477 563 277 620 205 676 600
Net finance costs (42 176) (64 268) (110 808) (126 280) (149 356)
Interest paid and amortised borrowing costs (43 593) (65 462) (115 273) (121 844) (143 219)
Interest capitalised to the cost of developments 7 635 1 728 3 065
Preference share dividends paid (2 934) (8 213) (16 424) (13 351)
STC on preference share dividends paid (367) (821) (1 642) (1 335)
Finance income 1 417 4 495 5 864 11 902 5 484
Distribution payable to participatory interest holders 213 677 307 209 452 469 493 925 527 244
Distribution per participatory interest (cents) 74,50 82,35 92,04 101,25 108,08
Portfolio valuation analysis
Market value (R’000) 3 092 259 7 314 742 7 491 436 7 718 077 7 882 930
Net asset value per participatory interest (cents) 866 1 148 1 169 1 135 1 133
Listed market price per participatory interest (cents) 850 1 090 819 1 015 1 244
Premium/(discount) to net asset value (%) (1,8) (5,1) (29,9) (10,6) 9,8
SAlient feAtuReSParticipatory interests in issue 286 828 772 488 514 461 492 818 989 487 827 654 487 827 654
Market capitalisation (R’000) 2 438 044 5 324 808 4 036 188 4 951 451 6 068 576
Long-term borrowings (R’000) 458 330 1 287 050 1 327 204 1 573 316 1 791 663
Long-term borrowings to total assets (%) 14,8 17,4 17,0 20,1 22,9
Number of properties 85 168 164 167 167
Vacancy factor (%) 4,0 5,9 6,8 7,5 9,2

Annual Report 2010 Emira Property Fund
Portfolio of top 10 properties by value o f f i c e , R e tA i l A n d i n d u S t R i A l S e c t o R S
3
54
2
1
1. Wonderpark Shopping Centre RetailLocated in middle-LSM market of Akasia, north-west of Pretoria between the Pretoria CBD and Rosslyn/SoshanguveValue at 30 June 2010: R601,5 million Major tenants:Size: 63 360 m2 Pick n Pay (14 000 m²)Number of tenants: 144 Game (3 992 m²)Average net rentals: R78,32/ m2 Builders Express (3 950 m²) Footcount: 9,2 million p.a. Virgin Active Gym (3 500 m²)
Edgars (3 450 m²) Chevron (3 461 m²)
2. Fuel Group Acsa Park Industrial Located in Jet Park adjacent to OR Tambo International Airport just off the N12 and R21Value at 30 June 2010: R298,4 million Single, triple-net tenant:Size: 59 594 m2 Fuel Logistics GroupNumber of tenants: 1Average net rentals: R45,61/ m2
4. Randridge Mall RetailLocated in Randpark Ridge, just off Beyers Naudé Drive in a primarily residential areaValue at 30 June 2010: R207,8 million Major tenants:Size: 22 624 m2 Pick n Pay (4 470 m²)Number of tenants: 86 Dis-Chem (1 400 m²)Average net rentals: R65,55/ m2 Pep Stores (600 m²)Footcount: Not available due to refurbishments Truworths (412 m²)
5. Hyde Park Lane OfficeLocated in Hyde Park, corner of Jan Smuts Avenue and William Nicol Drive opposite Hyde Park Shopping Centre Value at 30 June 2010: R175,8 million Major tenants:Size: 15 334 m2 Standard Bank (1 900 m²)Number of tenants: 44 Tag Travel (1 073 m²)Average net rentals: R82,23/ m2 Lufthansa (730 m²)
WDB Investment Holdings (723 m²)Willis RE (700 m²)
3. Quagga Centre RetailLocated in Pretoria West, within close proximity to Church Street and the Pretoria CBD Value at 30 June 2010: R258,0 million Major tenants:Size: 29 748 m2 Shoprite Checkers (5 715 m²)Number of tenants: 75 Pick n Pay (4 880 m²)Average net rentals: R72,92/ m2 Woolworths (1 800 m²)Footcount: 4,45 million p.a. First National Bank (1 367 m²)
Absa (1 155 m²)
Page 6

Annual Report 2010 Emira Property Fund
6
7
8
9
10. Braamfontein Centre OfficeLocated near the CBD of Johannesburg, in close proximity to the University of the WitwatersrandValue at 30 June 2010: R121,6 million Major tenants:Size: 20 776 m2 Pick n Pay (2 180 m²)Number of tenants: 65 CTH Legal Admin Trust (1 333 m²)Average net rentals: R57,70/ m2 Centre for the Study of Violence
and Reconciliation (1 210 m²)The Ford Foundation (822 m²)
10
6. Woodmead Office Park OfficeLocated within the Woodmead office node with exposure to the M1 highway Value at 30 June 2010: R163,1 million Major tenants:Size: 17 514 m2 DB Thermal (2 400 m²)Number of tenants: 42 ECI Africa Consulting (1 600 m²)Average net rentals: R59,41/ m2 Mine Health and Safety Council
t/a SIMPROSS (1 440 m²)Cummins SA (691 m²)
7. Lynnridge Mall Retail
Located in Lynnwood Ridge, in the eastern suburbs of Pretoria Value at 30 June 2010: R156,4 million Major tenants:Size: 14 220 m2 Pick n Pay (3 930 m²)Number of tenants: 59 Mr Price Home (1 700 m²)Average net rentals: R106,06/ m2 Absa (1 190 m²)Footcount: 3,26 million p.a. Lion Bridge Hardware (915 m²)
Jimnetts Arts and Crafts (792 m²)Pep Home (556 m²)
8. Faerie Glen Office Park OfficeSituated east of Pretoria close to Menlyn overlooking Atterbury Drive, a short drive from Menlyn Shopping Centre Value at 30 June 2010: R131,2 million Major tenants:Size: 10 324 m2 Softline VIP (5 755 m²)Number of tenants: 10 FirstRand Bank (1 300 m²)Average net rentals: R91,56/ m2 SA Local Government Association (960 m²)
WesBank (600 m²)
9. Southern Sentrum Retail Located between Benade Drive and Charlie Sutton Road in Fichardt Park,
Bloemfontein, south of the CBDValue at 30 June 2010: R125,0 million Major tenants:Size: 21 224 m2 Pick n Pay (13 950 m2)Number of tenants: 59 Shell SA Marketing (1 700 m²)Average net rentals: R49,80/ m2 First National Bank (613 m²)Footcount: 4,37 million p.a. Cash Crusaders (495 m²)
Page 7
Page 8
Annual Report 2010 Emira Property Fund
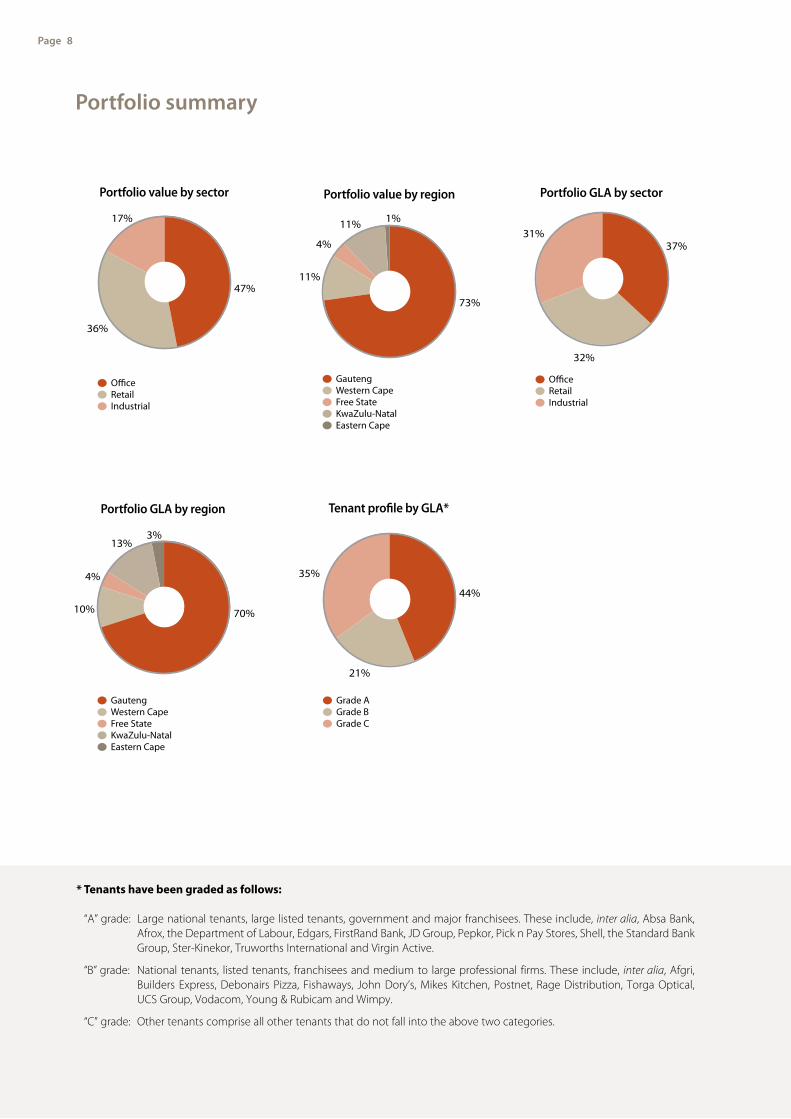
Portfolio summary
* tenants have been graded as follows:
“A” grade: Large national tenants, large listed tenants, government and major franchisees. These include, inter alia, Absa Bank, Afrox, the Department of Labour, Edgars, FirstRand Bank, JD Group, Pepkor, Pick n Pay Stores, Shell, the Standard Bank Group, Ster-Kinekor, Truworths International and Virgin Active.
“B” grade: National tenants, listed tenants, franchisees and medium to large professional firms. These include, inter alia, Afgri, Builders Express, Debonairs Pizza, Fishaways, John Dory’s, Mikes Kitchen, Postnet, Rage Distribution, Torga Optical, UCS Group, Vodacom, Young & Rubicam and Wimpy.
“C” grade: Other tenants comprise all other tenants that do not fall into the above two categories.
Portfolio value by sector
17%
36%
47%
O�ceRetailIndustrial
31%
32%
37%
O�ceRetailIndustrial
31%
32%
37%
O�ceRetailIndustrial
Portfolio GLA by sector
11%
11%
73%
4%
1%
GautengWestern CapeFree StateKwaZulu-NatalEastern Cape
11%
11%
73%
4%
1%
GautengWestern CapeFree StateKwaZulu-NatalEastern Cape
Portfolio value by region
13%
10% 70%
4%
3%
GautengWestern CapeFree StateKwaZulu-NatalEastern Cape
13%
10% 70%
4%
3%
GautengWestern CapeFree StateKwaZulu-NatalEastern Cape
Portfolio GLA by region
35%
21%
44%
Grade AGrade BGrade C
35%
21%
44%
Grade AGrade BGrade C
Tenant profile by GLA*

Page 9
Annual Report 2010 Emira Property Fund
Lease expiry profile (% of GLA)
Lease expiry profile by sector (% of revenue)
Vacancy profile (% of GLA)
Lease expiry profile by sector (% of GLA)
Weighted average lease escalation (%)
Vacancy profile by sector (% of GLA)
9,2
28,2
15,3
11,8
Year 5+
Year 3
Year 4
Year 2
Year 1
Vacant
18,6
16,9
■ O�ce ■ Retail ■ Industrial
16,1 9,7 4,6
10,6 7,0 2,9
16,9 7,2 2,9
3,0 2,13,5
3,5 3,26,8Year 5+
Year 3
Year 4
Year 2
Year 1
8,6
9,2
9,2
9,0
June 2010
March 2010
December 2009
September 2009
June 2009 7,5
■ O�ce ■ Retail ■ Industrial
5,9 1,7 1,6
12,2 7,2 8,8
7,5 5,5 5,6
6,5 5,2 5,2
2,1 3,8 5,9
2,7 7,9 4,7Year 5+
Year 3
Year 4
Year 2
15,3
11,8
16,9
18,6
28,2
9,2
Year 1
Vacant
■ O�ce ■ Retail ■ Industrial
9,3
Industrial
Retail
O�ce
8,0
8,9
5,1
5,5
■ O�ce ■ Retail ■ Industrial
5,0
4,8
5,9
4,9
5,3
14,7
15,3
16,2
15,8
5,3
5,2
3,0
June 2010
March 2010
December 2009
September 2009
June 2009 13,6
5,1
5,5

Page 10
Annual Report 2010 Emira Property Fund
Chief Executive Officer’s message
The directors of STREM (“the Manager”) are pleased to present their report on Emira’s performance for the year ended 30 June 2010.
cHief eXecutiVe officeR’S MeSSAGeBusiness environmentThe financial year was characterised by two very distinct halves. In the six months to December 2009, the market was uncertain and tenants operated under highly challenging conditions, resulting in pressure on rentals. The South African economy came out of recession early in 2010, which provided some relief to tenants in the second half of the financial year.
As the economic climate in South Africa and globally improved, Emira observed definite signs of recovery in the domestic property market, but progress has been slower than anticipated.
Although the South African consumer remains highly indebted, lower interest rates and the end of the domestic recession led to some improvement in consumer sentiment in the second half of the financial year when new vehicle sales, a leading indicator of the economy, showed a strong turnaround. Following the uptick in economic activity during the first quarter of the calendar year,
Admiral House
Granada Square
R527,2 millionDistributable income
108,08 cents + 6,8% Distribution per participatory interest (PI)
1 133 cents Net asset value per PI
+ 32,8% 12-month total return
questions arose with regard to the fundamentals for global
economic growth once stimulus packages in developed
economies come to an end. Accordingly, economists’ trimmed
their local GDP growth expectations, now ranging between 2%
and 3%.
On the downside, the market has been highly sensitised to
negative newsflow and the Greek credit crisis which started in
March 2010 unleashed concerns that the global economy could
revert back into recession, with a resultant contagion in global
equity and bond markets.
Rental arrears, a lagging indicator of economic activity, continued
to increase. At the same time vacancies took time to respond to
the improved economy as tenants waited for confirmation of
sustainable economic recovery before committing to additional
rental space. These have now stabilised with letting interest
improving since December 2009.
The tighter credit environment has been associated with higher
debt margins which in turn led to more demanding return
requirements on new investments, be they improvements to
existing properties or acquisitions of new buildings. As a result,
the occurrence of feasible brownfields projects has slowed,
especially given the current downward rental pressures. In the
wake of limited building opportunities, contractors slashed their
prices to support waning utilisation levels. In evaluating the
feasibility of new projects, this dampened some of the impact
from lower rentals when evaluating returns on potential new
projects. Unrealistic expectations of sellers have also made
acquisitions difficult.
A benefit of the tighter property market has been a marked
reduction in speculative activity and a slower rate of new
development. This has stemmed the risk of oversupply from new properties as the number of developers with the financial wherewithal to commit to new investments

Page 11
Annual Report 2010 Emira Property Fund
declined substantially. Accordingly, the supply and demand dynamics are now more balanced.
By way of evidence, the real growth of investment by value in non-residential property moderated to 1,9% in 2009, compared to 7,8% in 2008 and was flat in the second half of the financial year. The number of square metres approved for new non-residential construction fell by 35,8% year on year in the first quarter of 2010 although activity in the renovations segment increased.
Retailer and wholesaler confidence improved during the first quarter of 2010. Retailer confidence rose from 41 to 51 index points (RMB/BER Business Confidence) due to a stabilising labour market, lower interest rates and better affordability while wholesaler confidence jumped from 27 to 50 index points. This provides further evidence of improving market conditions.
PerformanceEmira once again delivered a solid performance despite the tighter prevailing market conditions. The more stable operating environment which emerged in the second half underpinned the Fund’s performance for the full year. It continued to deliver against its strategic objectives, investing to enhance the quality of its portfolio, however the availability of value accretive opportunities was lower than in previous years.
The Fund delivered 6,8% growth in distributions per participatory interest (PI) which amounted to 108,08 cents as it reaped the rewards of consistent year-on-year progress towards its strategic objectives. The management team’s conservative yet consistent and proactive approach to managing the portfolio over the long term is clearly reflected in these results.
Revenue from operating lease rentals and tenant recoveries increased 8,7% to R1,2 billion (2009: R1,1 billion). Net income from property rental operations showed a 9% increase to R765,7 million because of good cost control.
Net asset value per PI remained virtually stable at 1 133 cents from 1 135 cents. It was impacted by a marginal reduction in the fair value of derivative financial instruments amounting to R63,8 million. Excluding the provision for deferred tax, net asset value per PI declined by 4% from 1 232 cents to 1 186 cents.
The price of Emira PIs on the JSE Limited continued its strong performance, increasing by 23% to 1 244 cents at 30 June 2010 from 1 015 cents the previous year. This compares favourably to a return of 19% on the listed property sector. Emira’s closing price at year-end reflected a premium of 10% to its net asset value of 1 133 cents per PI. The PIs reached a maximum level of 1 270 cents on 3 April 2010, recovering from a low of 980 cents on 3 July 2009. The total returns of PIs
diStRiBution StAteMent
for the year ended 30 June 2010
R’000 2009 2010%
change
Operating lease rental income and tenant recoveries excluding straight-lining of leases 1 059 866 1 152 167 8,7
Property expenses excluding amortised upfront lease costs (357 597) (386 478) 8,1
Net property income 702 269 765 689 9,0
Asset management expenses (31 843) (36 171) 13,6
Administration expenses (39 023) (43 214) 10,7
Depreciation (11 198) (9 704) (13,3)
Net finance costs (126 280) (149 356) 18,3
Interest paid and amortised borrowing costs (121 844) (143 219) 17,5
Interest capitalised to the cost of developments 1 728 3 065 77,4
Preference share dividends paid (16 424) (13 351) (18,7)
STC on preference share dividends paid (1 642) (1 335) (18,7)
Finance income 11 902 5 484 (53,9)
distribution payable to participatory interest holders 493 925 527 244
Number of units in issue 487 827 654 487 827 654
distribution per participatory interest (cents) 101,25 108,08 6,8
Page 12
Annual Report 2010 Emira Property Fund
Chief Executive Officer’s message (continued)
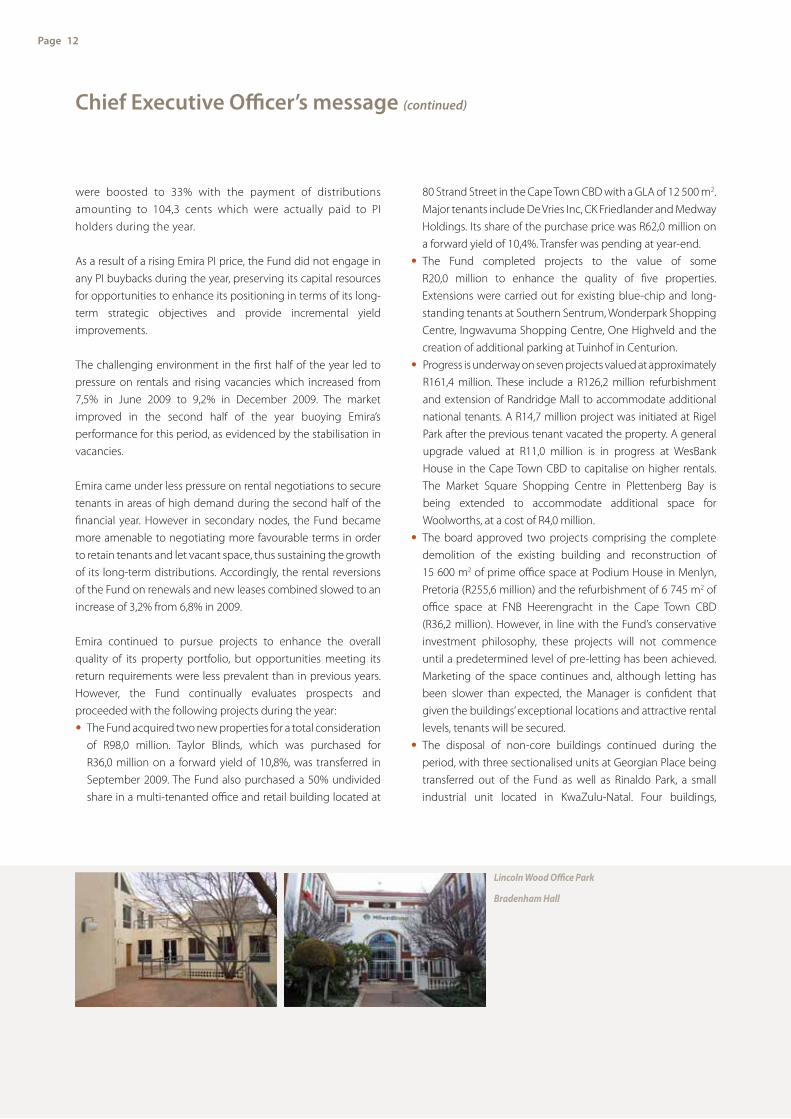
were boosted to 33% with the payment of distributions amounting to 104,3 cents which were actually paid to PI holders during the year.
As a result of a rising Emira PI price, the Fund did not engage in any PI buybacks during the year, preserving its capital resources for opportunities to enhance its positioning in terms of its long-term strategic objectives and provide incremental yield improvements.
The challenging environment in the first half of the year led to pressure on rentals and rising vacancies which increased from 7,5% in June 2009 to 9,2% in December 2009. The market improved in the second half of the year buoying Emira’s performance for this period, as evidenced by the stabilisation in vacancies.
Emira came under less pressure on rental negotiations to secure tenants in areas of high demand during the second half of the financial year. However in secondary nodes, the Fund became more amenable to negotiating more favourable terms in order to retain tenants and let vacant space, thus sustaining the growth of its long-term distributions. Accordingly, the rental reversions of the Fund on renewals and new leases combined slowed to an increase of 3,2% from 6,8% in 2009.
Emira continued to pursue projects to enhance the overall quality of its property portfolio, but opportunities meeting its return requirements were less prevalent than in previous years. However, the Fund continually evaluates prospects and proceeded with the following projects during the year:• The Fund acquired two new properties for a total consideration
of R98,0 million. Taylor Blinds, which was purchased for R36,0 million on a forward yield of 10,8%, was transferred in September 2009. The Fund also purchased a 50% undivided share in a multi-tenanted office and retail building located at
80 Strand Street in the Cape Town CBD with a GLA of 12 500 m2. Major tenants include De Vries Inc, CK Friedlander and Medway Holdings. Its share of the purchase price was R62,0 million on a forward yield of 10,4%. Transfer was pending at year-end.
• The Fund completed projects to the value of some R20,0 million to enhance the quality of five properties. Extensions were carried out for existing blue-chip and long-standing tenants at Southern Sentrum, Wonderpark Shopping Centre, Ingwavuma Shopping Centre, One Highveld and the creation of additional parking at Tuinhof in Centurion.
• Progress is underway on seven projects valued at approximately R161,4 million. These include a R126,2 million refurbishment and extension of Randridge Mall to accommodate additional national tenants. A R14,7 million project was initiated at Rigel Park after the previous tenant vacated the property. A general upgrade valued at R11,0 million is in progress at WesBank House in the Cape Town CBD to capitalise on higher rentals. The Market Square Shopping Centre in Plettenberg Bay is being extended to accommodate additional space for Woolworths, at a cost of R4,0 million.
• The board approved two projects comprising the complete demolition of the existing building and reconstruction of 15 600 m2 of prime office space at Podium House in Menlyn, Pretoria (R255,6 million) and the refurbishment of 6 745 m2 of office space at FNB Heerengracht in the Cape Town CBD (R36,2 million). However, in line with the Fund’s conservative investment philosophy, these projects will not commence until a predetermined level of pre-letting has been achieved. Marketing of the space continues and, although letting has been slower than expected, the Manager is confident that given the buildings’ exceptional locations and attractive rental levels, tenants will be secured.
• The disposal of non-core buildings continued during the period, with three sectionalised units at Georgian Place being transferred out of the Fund as well as Rinaldo Park, a small industrial unit located in KwaZulu-Natal. Four buildings,
Lincoln Wood Office Park
Bradenham Hall

Page 13
Annual Report 2010 Emira Property Fund
namely Nampak, Howick Gardens, QD House and Standard Bank, Glenwood were sold for R62,8 million and all with the exception of the Nampak Building were transferred out of the Fund after year-end. A total of nine non-core properties with a total value of R288,9 million remain on the disposal list.
• In May 2010 the Fund acquired 10,25 million stapled securities* or an effective 6,4% interest in Growthpoint Properties Australia (GOZ) for a total consideration of A$18,0 million (R116,9 million). This represents Emira’s first investment in an offshore jurisdiction and was motivated by the opportunity to diversify the portfolio by acquiring a small, passive stake in a high quality listed Australian REIT, backed by extremely secure, long-term leases with blue-chip tenants at a yield higher than that which is achievable by buying South African commercial property. It has a high quality portfolio consisting of 25 properties which are mainly situated in Brisbane and Melbourne, with a few properties in Perth and Sydney. The transaction will be earnings enhancing from the date of purchase.
* A stapled security is security that is contractually bound to one or more other securities to form a single saleable unit.
The long-term debt facility which Emira secured from Rand Merchant Bank in the previous year continued to provide the Fund with a relative advantage in the current market, especially against the context of higher prevailing lending margins. These have settled at lower levels of between 160 and 170 basis points, compared to 200 basis points at the peak of the economic crisis.
As at June 2010 Emira had a total debt facility (including preference shares) available of R2 257 million, of which R1 799 million had been accessed. Of the Fund’s total debt, 94,2% has been fixed for periods of between three and thirteen years. At 30 June 2010, the weighted average cost of debt equated to 9,51% and the Fund’s overall gearing level increased
marginally to 22,7% from 20,4% in 2009, in line with its strategic objectives.
PoSt yeAR-end eVentSAfter year-end, Emira announced a proposed amendment to its management fee structure, becoming the first Collective Investment Scheme in Property (CISP) on the JSE Limited to do so. Emira and the Manager, Strategic Real Estate Managers (STREM), agreed to amend the terms of its service charge arrangement to a monthly fee based on STREM’s actual operating costs as announced to PI holders on 14 July 2010. The change in management fee structure will result in the calculation of the existing service charge arrangement changing from a monthly charge based on enterprise value to a monthly charge equal to the actual operating costs incurred by the Manager in administering the Fund and a once-off cancellation payment of R197,4 million to the Manager.
The Manager and the Trustee agreed to enter into supplemental deeds to amend the Trust Deed and approval was received from the regulatory authorities with effect from 15 September 2010. The Trust Deed was also amended to allow the Fund to invest in a broader class of assets and to increase the limit of borrowing by the Emira Property Scheme from the current limit of 30% to 40% of the value of its underlying assets.
In August 2010, GOZ announced the acquisition of seven direct properties comprising two office buildings, a car park and four industrial properties for a total price of A$171,5 million at a weighted average yield of 8,4%. The
Highway Business Park
Brandwag
The Tramshed

Page 14
Annual Report 2010 Emira Property Fund
Chief Executive Officer’s message (continued)
acquisition will diversify the 100% industrial portfolio of GOZ into the office sector. The properties are located in the attractive Brisbane property market in Queensland with quality tenants and good lease covenants. The acquisition will be funded by a 1-for-3 pro rata renounceable rights offer at A$1,90 per stapled security, providing approximately A$101 million, and the balance from existing syndicated debt facilities. Emira has subscribed for A$17,5 million (R117,3 million) worth of additional stapled securities bringing its total holding to 9,1% of GOZ.
The Fund also purchased a 50% undivided share in a multi-tenanted office and retail building located at 80 Strand Street in the Cape Town CBD with a GLA of 12 500 m2. Transfer into Emira had not taken place at time of going to print.
The transfer of Howick Gardens, QD House and Standard Bank, Glenwood which were disposed of during the year, took place after year-end.
BoARd of diRectoRSMr BH Kent, an independent non-executive director of STREM since April 2007, was appointed as lead independent director on 20 May 2010.
On 24 June 2010, Mr V Mahlangu was appointed to the board of STREM as an independent non-executive director. Mr Mahlangu qualified as a chemical engineer at UCT and has an MBA from Harvard. He has extensive experience in structured finance and investment banking, as well as mezzanine funding and currently manages his own investment company. Mr Mahlangu was also appointed to the audit committee.
Prospects and outlookDuring the year under review, Emira has been highly proactive in initiating positive changes to ensure the Fund’s ability to deliver long-term benefits to PI holders and to continue delivering on its strategic objectives.
Not only was it one of the first JSE-listed CISPs to diversify its assets by investing offshore, but it is also the pioneer in effectively restructuring the fee payable to its Manager, both of which hold significant potential to provide value for PI holders. Over and above the cost benefits for PI holders, the new structure will also result in the greater alignment of the interests of the management company, while creating a vehicle to incentivise management and staff, which was not possible under the previous structure. In line with its strategic objectives, the Fund once again delivered above average growth in distributions as the underlying portfolios continued to perform well.
In the year ahead, the portfolio is positioned to continue showing good growth in distributions underpinned by its diversified pool of long-term tenants and contractual escalations. While the economic recovery has been confirmed with several consecutive quarters of GDP growth, the recent Eskom price hikes and future escalation rates are certain to limit the affordability of higher rentals and curtail tenants’ propensity to commit to new leases.
Throughout its office, retail and industrial property portfolio, Emira has a good pipeline of capital projects to continue improving the quality of its asset base. The board has approved several projects which the Fund will initiate once it has achieved the requisite levels of pre-letting.

Page 15
Annual Report 2010 Emira Property Fund
PeRfoRMAnceSouth African listed property sectorTotal returns to June 2010The overall equity markets, which had trended strongly up since early in 2009, corrected sharply after the Greek credit crisis which started in 2010 and sent global and domestic equities into a correction.
The JSE All Share Index and the JSE FINDI 30 Index showed total returns of 21,5% and 22,7% respectively for the 12 months ended 30 June 2010. However, in the fourth quarter of the financial year, they lost -9,5% and -8,4% respectively. PLSs and PUTs continued to perform well despite the volatility which affected the general equity markets in the fourth quarter, with an annualised return of 26,5% and 27,3% respectively over the same time horizon.
Compound annual total returns to 30 June 2010 (pretax) (%)
PeriodAll
Share FINDI 30 PLSs PUTs R153
1 year 21,5 22,7 26,5 27,3 7,43 year 0,6 1,9 8,5 7,1 6,55 year 14,8 13,4 17,2 12,2 5,510 year 14,0 9,8 17,4 14,6 8,3
Source: Inet-Bridge
The listed property sector and bond yield differentialThe listed property sector continued to perform well although its performance lagged general equities until December 2009. However with the European credit issues in April 2010, investors sought out the relative security of the listed property sector which showed a strong outperformance compared to general equities. Indications that domestically the market is moving towards a low inflation environment have also been positive for long bond and property yields. The capital growth of the listed property sector for the year ended 30 June 2010 was in line with the previous year at 19,1%. Most South African listed property funds continued to show positive distribution growth albeit at a slower pace during the period under review, as a result of more challenging conditions in the local property sector.
Over the 12 months ended 30 June 2010, the yield differential between the historic listed property yield and the R153 traded in a narrow band ranging from 0,25% to -0,25%, indicating that market expectations for growth were positive but not at levels experienced in recent years.
0,0135
0,0130
0,0125
0,0120
0,0115
0,0110
South African listed Property Index relative to All Share Index
Source: Inet-Bridge
Jul 09 Aug 09 Sep 09 Oct 09 Nov 09 Dec 09 Feb 10Jan 10 Mar 10 Apr 10 May 10 Jun 10
3,5
2,5
1,5
0,5
-0,5
-1,5
-2,5
16
15
14
13
12
11
10
9
8
7
R157 and yield di�erential (%)*
2000 2001 2002 2003 2004 2005 2006 2007 2008 2009 2010
Source: Inet-Bridge
Di�erential Long bond (R157)
* South African listed property yield less the R157 yield.
Manager’s report
South African listed Property Index
South African listed Property Index relative to All Share Index
R157 and yield differential (%)*
360
350
340
330
320
310
300
290
280
270
Source: Inet-Bridge
Jul 09 Aug 09 Sep 09 Oct 09 Nov 09 Dec 09 Feb 10Jan 10 Mar 10 Apr 10 May 10 Jun 10
Page 16
Annual Report 2010 Emira Property Fund
Manager’s report (continued)
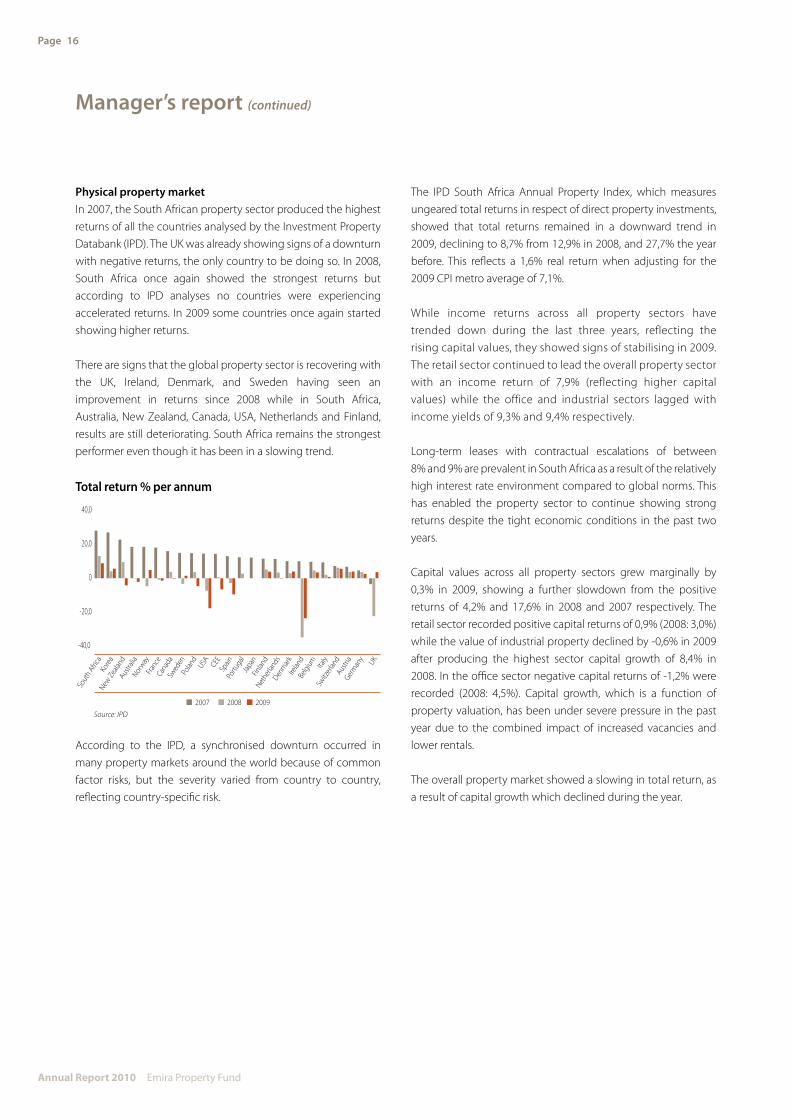
Physical property marketIn 2007, the South African property sector produced the highest returns of all the countries analysed by the Investment Property Databank (IPD). The UK was already showing signs of a downturn with negative returns, the only country to be doing so. In 2008, South Africa once again showed the strongest returns but according to IPD analyses no countries were experiencing accelerated returns. In 2009 some countries once again started showing higher returns.
There are signs that the global property sector is recovering with the UK, Ireland, Denmark, and Sweden having seen an improvement in returns since 2008 while in South Africa, Australia, New Zealand, Canada, USA, Netherlands and Finland, results are still deteriorating. South Africa remains the strongest performer even though it has been in a slowing trend.
40,0
20,0
0
-20,0
-40,0
Total return % per annum
Sout
h Afric
aNew
Zeala
ndAus
tralia
Norway
Cana
daSw
eden
Polan
dUSA CE
ESp
ainPo
rtuga
lJa
pan
Finlan
dNet
herla
nds
Denm
arkIre
land
Belgi
um Italy
Switz
erlan
dAus
tria
Germ
any UK
Franc
e
Korea
Source: IPD
■ 2007 ■ 2008 ■ 2009
According to the IPD, a synchronised downturn occurred in many property markets around the world because of common factor risks, but the severity varied from country to country, reflecting country-specific risk.
The IPD South Africa Annual Property Index, which measures ungeared total returns in respect of direct property investments, showed that total returns remained in a downward trend in 2009, declining to 8,7% from 12,9% in 2008, and 27,7% the year before. This reflects a 1,6% real return when adjusting for the 2009 CPI metro average of 7,1%.
While income returns across all property sectors have trended down during the last three years, reflecting the rising capital values, they showed signs of stabilising in 2009. The retail sector continued to lead the overall property sector with an income return of 7,9% (reflecting higher capital values) while the office and industrial sectors lagged with income yields of 9,3% and 9,4% respectively.
Long-term leases with contractual escalations of between 8% and 9% are prevalent in South Africa as a result of the relatively high interest rate environment compared to global norms. This has enabled the property sector to continue showing strong returns despite the tight economic conditions in the past two years.
Capital values across all property sectors grew marginally by 0,3% in 2009, showing a further slowdown from the positive returns of 4,2% and 17,6% in 2008 and 2007 respectively. The retail sector recorded positive capital returns of 0,9% (2008: 3,0%) while the value of industrial property declined by -0,6% in 2009 after producing the highest sector capital growth of 8,4% in 2008. In the office sector negative capital returns of -1,2% were recorded (2008: 4,5%). Capital growth, which is a function of property valuation, has been under severe pressure in the past year due to the combined impact of increased vacancies and lower rentals. The overall property market showed a slowing in total return, as a result of capital growth which declined during the year.
Total return % per annum

Annual Report 2010 Emira Property Fund
Page 17
IPD total returns for 2009 (2008) (%) Total
return Income
returnCapitalgrowth
All property 8,7 (12,9) 8,4 (8,5) 0,3 (4,2)Retail 8,8 (11,1) 7,9 (7,9) 0,9 (3,0)Office 8,0 (13,9) 9,3 (9,1) -1,2 (4,5)Industrial 8,7 (18,1) 9,4 (9,1) -0,6 (8,4)Other 11,9 (18,8) 7,8 (10,3) 3,8 (7,8)Source: IPD
Total returns annualised (%)
Period Retail Office IndustrialAll
Property
One year 8,8 8,0 8,7 8,7Three year 15,0 17,1 20,2 16,2Five year 20,8 20,2 25,0 21,0Ten years 18,2 15,0 18,8 17,3Source: IPD
The property market started showing signs of stabilisation as increasing vacancy rates started levelling out towards the end of the financial year. In a market characterised by increasing arrears, rental pressure and higher vacancies, landlords nevertheless need to remain amenable to innovative ways to retain existing tenants and attracting new tenants.
Overall vacancies increased to 7,1% at the end of 2009 (2008: 4,3%) according to the IPD annual survey.
An IPD survey of participants in the South African property market indicates that 75% are expecting that 2010 returns will exceed 2009 levels.
Emira’s performance and property portfolioEmira’s performance and tradability on the JSEReflecting the continued strength of the listed property sector during the year ended 30 June 2010, the price of Emira’s PIs increased by 22,6% to 1 244 cents from 1 015 cents at 30 June 2009. The total return on PIs for the year increases to 32,8% if the total distributions paid during the year, amounting to 104,3 cents are included.
164,8 million PIs traded during the year ended 30 June 2010, representing 33,4% of the weighted average number of PIs.
Performance relative to the IPD indexThe 2009 IPD index survey, which aggregates the capital and income of listed and unlisted portfolios to provide a measure of total annual performance, reported that Emira achieved a total return of 6,1%, an improvement from the 5,6% return in 2009.
At 9,3%, the Fund’s income return was 0,4% higher than the benchmark income return of 8,9% for the period and was accordingly ranked second out of the seven listed property funds constituting the IPD South African Benchmark. As a result of its cautious stance on valuations, the Fund was ranked fifth out of the seven listed funds in the universe using total returns.
Despite the Manager’s conservative approach to property valuations given the current economic climate, the Fund has outperformed the benchmark on a three and five year time horizon:
Total return to 2009 (%)Emira Benchmark
One year 6,1 8,6Three year 15,7 15,6Five year 24,5 21,7Source: IPD
Portfolio exposureAt 30 June 2010, Emira’s portfolio consisted of 167 properties, with a total GLA of 1 217 990 m2, which was valued at R7,9 billion, translating into an average value of R47,2 million per property.

Page 18
Annual Report 2010 Emira Property Fund
Refurbishments and extensionsEmira continued to actively evaluate opportunities to improve the quality of its properties throughout the year. However, given the current environment where tenants’ appetite to pre-commit to the higher rentals associated with upgraded premises or increased rental area has been low, fewer projects have met the Fund’s return threshold requirements.
Emira invested a total of R181,4 million in its property portfolio during the year under review, which was focused predominantly in its office and retail portfolios and includes both ongoing and completed projects. The most substantial project is a refurbishment and extension to the Randridge Mall amounting to R126,2 million, which will be completed in October 2010.
DisposalsAn important component of Emira’s active asset management approach is to continually evaluate properties to ensure that they enhance the overall quality and total value of the property portfolio, contributing to higher returns and thereby improving the Fund’s investor appeal.
At the end of the 2009 financial year, the Manager had 14 non-core properties identified for sale. In 2010, three sectionalised units at Georgian Place were sold for R6,6 million and transferred out of the Fund as well as Rinaldo Park, a small industrial unit located in KwaZulu-Natal which was sold
Manager’s report (continued)
for R6,0 million and transferred in June 2010. The Fund accepted offers for the sale of four properties, two industrial properties being the Nampak Building (Denver, Johannesburg) and QD House (Kyalami); the Howick Gardens Office Park (Midrand) and the Standard Bank retail property in Glenwood (Durban). The properties were sold for a total consideration of R62,8 million and all but the Nampak Building were transferred out of the Fund after year-end.
Nine non-core properties remain on the disposal list, with a total value of R288,9 million.
AcquisitionsAlthough the Fund continued to actively evaluate prospective purchases, prevailing asking prices were not in line with its return threshold. One property was purchased during the year, namely a 50% undivided share in 80 Strand Street a multi-tenanted office building in the Cape Town CBD which has a GLA of 12 500 m2 for R62 million, but was yet to be transferred into Emira at time of going to print.
A single tenanted industrial warehouse in Montague Gardens which is occupied by Taylor Blinds was transferred into Emira in September 2009.
A detailed breakdown of Emira Property Fund’s portfolio is disclosed on pages 85 to 96.

Notes to the financial statements (continued)for the year ended 30 June 2010
Page 19
Annual Report 2010 Emira Property Fund
optimising on an excellent location to upgrade building to A-grade specifications
Value at June 2010: R45,1 m
Gross lettable area: 4 417 m²
o f f i c e
The property:Rigel Park consists of two multi-level, face brick office buildings and parking facilities. It was developed in the late 1980s for the Financial Services Board and has a total lettable area of 4 417m². The Financial Services Board relocated to new premises in November 2009.
The property is well located next to the improved Rigel Road/N1 intersection and is highly visible from the adjacent routes and the highway. In its previous state prior to the refurbishment, the building was classified as B-grade which could command gross rentals of R70/m² to R80/m².
The opportunity:An opportunity was identified to upgrade the building into an A-grade property which would attract better quality tenants and higher rentals based on its location close to major access routes and it being less than 5 km from the important Menlyn node.
The upgrade:The board approved a R14,7 million proposal on risk in November 2009 to substantially refurbish the property. The new design included internal upgrades and modernising the facades which are exposed to the national road. The aesthetics of the building were cost effectively updated using a combination of plaster and paint. All brick balconies were replaced with steel balustrades to improve the visual impact of the building and give it a modern finish.
All common areas of the building received a face lift by introducing new floor finishes, ceiling lay-outs, down lighters and wall finishes. All toilet facilities and kitchenettes were renovated and lifts were upgraded, both aesthetically and mechanically.
The updated configuration of the buildings also allowed more flexibility in letting to new tenants as they can either be leased to a single tenant, one tenant per block or the two blocks can be configured to accommodate a maximum of 12 tenants.
The outcome:The renovation was completed subsequent to year-end and the buildings are being marketed at market related rentals of R110/m² to R115/m² gross. Two tenants committed to leases for some 70% of the lettable area in August 2010. The incremental yield on the project is some 12,9%, based on 100% occupancy. The investment enabled the Fund to take full advantage of the location of the Rigel Park office building, upgrading it into an A-grade property which has enhanced its lettability in the current competitive market.
The board’s decision to proceed with the project on risk has been justified by the successful letting of the majority of the office space at budgeted rentals.
office case study: Rigel Park
Page 19

Page 20
Annual Report 2010 Emira Property Fund
Manager’s report (continued)o f f i c e
office MARket conditionSThe fundamentals for the office property segment started turning in
2010 as the financial services industry which represents about one fifth
of South Africa’s GDP and provides a similar proportion of the country’s
non-agricultural formal employment started showing signs of a
rebound. As a major tenant class in the office sector, this had a positive
impact on the sector. Of the eight industries surveyed in SAPOA’s
Property Market Trends Report for 2009 five showed increased turnover,
but mining and quarrying and real estate and other business services
were still in decline.
According to the IPD, office vacancies, which generally lag the
economy, continued to increase during the year, reflecting the highest
vacancy rate in the property sector at 10,6% for 2009 (2008: 7,2%). As a
result of the tighter market, the lower availability of credit and a more
cautious approach, fewer new office developments came to market in
2009 although activity levels have started recovering since the
beginning of 2010.
The oversupply of office space persisted in 2009, although the excess is
lower than in the late 1990s when vacancies increased to more than
20%. Accordingly the recovery, when it takes place, is expected to be
quicker than in the previous cycle.
The main office hubs of Johannesburg and Cape Town have been
worst affected by the current downturn.
Prime grade offices continue to outperform and the volatility of their
returns has been more favourable than the second grade offices over
the last 15 years.
According to the Rode’s Report on the SA Property Market, the overall
growth in office rentals to the end of 2009 was weak and a
decentralisation trend was in evidence. The rental market in Cape Town
and Johannesburg declined by -6% and -4% respectively while Pretoria
and Durban showed growth of 9% and 10% respectively over the same
period.
Revenue of R510,2 million which represents an increase of 5%
Operating profit of R320,0 million showing an increase of 5%
Office portfolio valued at R3,7 billion comprising 47% of the Fund’s total portfolio by value
Dorbyl Parktown
Century Gate
100 on Armstrong
Page 21
Annual Report 2010 Emira Property Fund
Despite the tougher markets, according to the IPD, the office
sector showed an improvement in net income growth of 14,6%
in 2009 (2008: 10,5%). Office landlords experienced an above
inflation increase in operating costs per m2 of 13% taking the
average monthly costs to R31,5 per m2 (2008: R27,9 per m2). In
recent years, the growth in operating costs has exceeded net
income growth, growing to 36,7% of gross rent received,
although relatively high this is still lower than the long-term
average.
The IPD South Africa Annual Property Index disclosed that the
office sector total return in 2009 was 8,0% (2008: 13,9%). Income
returns rose marginally to 9,3% (2008: 9,1%) and negative capital
growth of -1,2% was recorded (2008: growth of 4,5%) as vacancies
increased and overall rental escalations were under pressure.
25
20
15
10
5
0
16141210
86420
-2-4-6
O�ce vacancy rates and net income growth (%)
200019991997 199819961995 2001 2002 2003 2004 2005 2006 2007 2008 2009
Source: IPDO�ce vacancy rates Net income growth
2,53,0
10,211,3
14,0
16,9
18,8
23,6
22,2
17,0
10,6
7,7
5,4
10,3 10,6
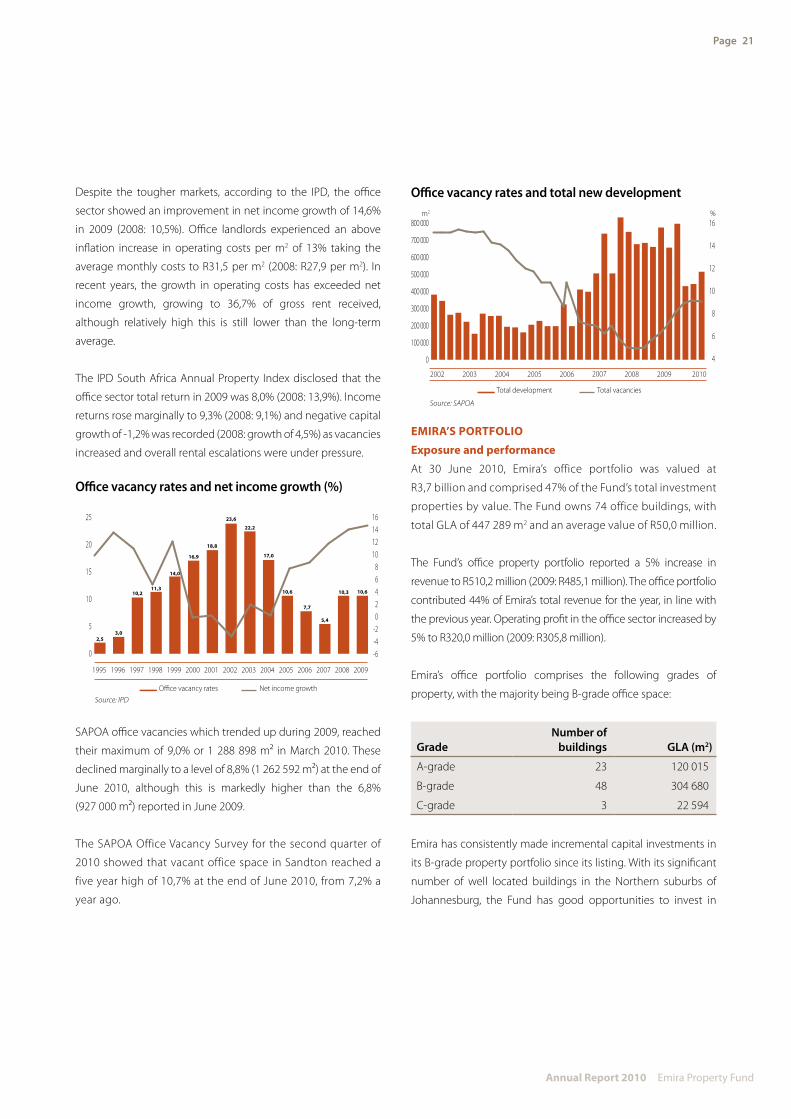
SAPOA office vacancies which trended up during 2009, reached
their maximum of 9,0% or 1 288 898 m² in March 2010. These
declined marginally to a level of 8,8% (1 262 592 m²) at the end of
June 2010, although this is markedly higher than the 6,8%
(927 000 m²) reported in June 2009.
The SAPOA Office Vacancy Survey for the second quarter of
2010 showed that vacant office space in Sandton reached a
five year high of 10,7% at the end of June 2010, from 7,2% a
year ago.
800 000
700 000
600 000
500 000
400 000
300 000
200 000
100 000
0
16
14
12
10
8
6
4
O�ce vacancy rates and total new developmentm2 %
2002 2003 2004 2005 2006 20082007 2009 2010
Source: SAPOA
Total development Total vacancies
eMiRA’S PoRtfolio
exposure and performance
At 30 June 2010, Emira’s office portfolio was valued at
R3,7 billion and comprised 47% of the Fund’s total investment
properties by value. The Fund owns 74 office buildings, with
total GLA of 447 289 m2 and an average value of R50,0 million.
The Fund’s office property portfolio reported a 5% increase in
revenue to R510,2 million (2009: R485,1 million). The office portfolio
contributed 44% of Emira’s total revenue for the year, in line with
the previous year. Operating profit in the office sector increased by
5% to R320,0 million (2009: R305,8 million).
Emira’s office portfolio comprises the following grades of
property, with the majority being B-grade office space:
GradeNumber of
buildings GLA (m2)
A-grade 23 120 015
B-grade 48 304 680
C-grade 3 22 594
Emira has consistently made incremental capital investments in
its B-grade property portfolio since its listing. With its significant
number of well located buildings in the Northern suburbs of
Johannesburg, the Fund has good opportunities to invest in

Annual Report 2010 Emira Property Fund
Page 22
order to upgrade and extend these into A-grade office buildings
which command higher rentals and are less impacted by
economic downturns. In addition, B-grade properties which are
centrally located in the Northern suburbs and which have good
access to major arterial routes will increase in value over time.
This has been the case with properties close to Gautrain stations
and along its bus routes. Buildings which cannot be turned
around or generate income which meets the Fund’s required
rate of return, will be earmarked for sale.
While the Fund did not embark on any substantial upgrade
projects in its office portfolio during the year, it obtained board
approval for two refurbishment projects which will commence
once sufficient commitment from new tenants has been
achieved. The properties are Podium House in Menlyn, Pretoria
which will be demolished and completely rebuilt, at a cost of
R255,6 million to build 15 600 m2 of prime office space and FNB
Heerengracht in the Cape Town CBD where a R36,2 million
project will comprise the refurbishment of 6 745 m2 of office
space. Marketing of the space continues and, although letting
has been slower than expected, management is confident that
given the buildings’ exceptional locations and attractive rental
levels, occupancies will be secured.
New parking facilities were completed at the Tuinhof building in
Centurion at a cost of R750 000 with a high incremental yield of
20,0%.
Refurbishments with total investments of R25,7 million were still
in progress at the end of the financial year:
• The R14,7 million refurbishment of the Rigel Park office
building in Pretoria East (see case study on page 19); and
• WesBank House in the Cape Town CBD was being
refurbished at year-end. The installation of more efficient
air conditioning will reduce the operating costs of the
property. The R11,0 million project has an incremental
yield of 11,0% with completion in September 2010.
Vacancies and letting
Emira’s office vacancies increased to 16,2% (2009: 13,6%) in line
with the tighter rental market.
Major office vacancies include the following:
• The FNB Building Heerengracht in the Cape Town CBD is
100% unoccupied as its 6 745m² GLA has been vacated in
anticipation of a refurbishment. The project will commence
once there is sufficient commitment from tenants to take
up space in the completed building. It is currently being
held vacant in anticipation of the project going ahead
in 2011.
• Vacancies at the Hurlingham Office Park (total GLA 16 159 m2)
remain high at 6 264 m2, but space is mainly available in the
refurbished blocks and letting is expected to improve as the
market recovers.
• A major redevelopment is planned at Podium House
(GLA 4 832 m²) which is 100% vacant and marketing is under
way to initiate work on the new building.
• The Rigel Park (GLA 4 417 m²) refurbishment is nearing
completion and two tenants have already committed to
leases on some 70% of the office space.
Prospects and outlook
The fortunes of the office portfolio are linked to the speed of the
domestic recovery. Office vacancies are off their peak of 9,2%,
and fortunately there are no indications that the office sector
could be faced with the vacancies of some 20% which plagued
the sector in the late 1990s and early 2000s. Accordingly, the
uplift and speed of the recovery is expected to be more
favourable this time around. With GDP growth forecasts of
between 2,0% and 3,0% for the next 12 months, there are signs
that vacancies will start trending down, although the recovery is
fragile at this stage.
Continual improvement is essential to sustainable success and
Emira has identified two capital projects which it expects to start
work on in 2011 once sufficient pre-letting is in place to mitigate
the risks.
Manager’s report (continued)o f f i c e

Annual Report 2010 Emira Property Fund
Page 23
M A j o R t e n A n t S• Pick n Pay• Dis-Chem• Pep Stores• Foschini Group• Ackermans• Mr Price • Truworths• Woolworths
Value at June 2010: R207,8 m
Gross lettable area: 22 624 m²
Weighted average rental/ m2: R65,28
The property:Randridge Mall is located in the Western suburbs of Johannesburg and was built in 1983 with a GLA of 18 957 m2. Its national tenants include Pick n Pay (4 500 m2), Woolworths (2 140 m2) and Dis-Chem (1 400 m2) among others. The centre was acquired by Emira in 2003 as part of its original listing.
The opportunity:In order to capitalise on the current trend among retailers to increase the size of successful stores instead of opening new stores which is seen as more risky, the Manager embarked on an extension of the Randridge Mall. The feasibility of the project was backed by strong tenant demand. The centre also had demand for space from new national retail tenants which enhanced the feasibility of the project.
The upgrade:The board approved a R126,2 million refurbishment and extension of the mall with a projected yield of 9,4% in August 2009.
The project was split into two phases to minimise disruption and income loss.
Certain tenants were relocated to more suitable positions which also allowed for the enlargement of several larger tenants’ stores. At the same time, floor tiles, ceilings and air conditioners were upgraded to give the centre a more modern atmosphere. An external addition was built onto the existing centre into the parking area to accommodate new tenants, adding 3 667 m² in rentable space and bringing the total GLA to 22 624 m². Foschini Group has taken up 1 700 m2 to open several new branded stores in the centre, while Woolworths has committed to an extension of trading area measuring some 500 m2.
Both Pick n Pay and Dis-Chem have refurbished their stores.
The outcome:The upgrade and extension has rejuvenated the centre while renewing its ability to attract better quality tenants such as the Foschini Group. It has also secured the ongoing commitment of existing nationals such as Truworths, Woolworths, Ackermans and Mr Price.
Historically 48% of the retail area has been rented to national tenants, but this is set to increase to 79% once the project has been completed.
The upgrade has ensured that the Randridge Mall is a compelling destination in the face of increasing competition from more recently developed centres in the area.
Cost savings have been realised on the project, which will increase the yield to Emira PI holders.
R e tA i l
capitalising on existing anchor tenants and central location to enhance return
Retail case study:Randridge Mall
Page 23

Annual Report 2010 Emira Property Fund
Page 24
Manager’s report (continued)R e tA i l
RetAil MARket conditionS There are indications of good news in the retail sector which had led the downward cycle. South Africa’s retail sales recorded its sixth consecutive month of improvement in June 2010, reflecting a year-on- year increase of 7,4% compared to a year ago although the impact of the 2010 FIFA Soccer World CupTM was lower than anticipated. Recent retail sales data suggests a gradual improvement in consumption. This is a key contributor to the economy but has lagged the rest of the economy’s recovery. Consumer spending remains under pressure due to high levels of household debt and unemployment.
Performance has been mixed across the sector. Shopping centres targeted at higher and very low income brackets are performing well but centres targeted at middle income consumers are under more pressure in line with their target market’s limited discretionary income and higher levels of personal debt. Accordingly the rate of rental growth has also varied from one centre to another. Foot traffic is stable with some improvement in places.
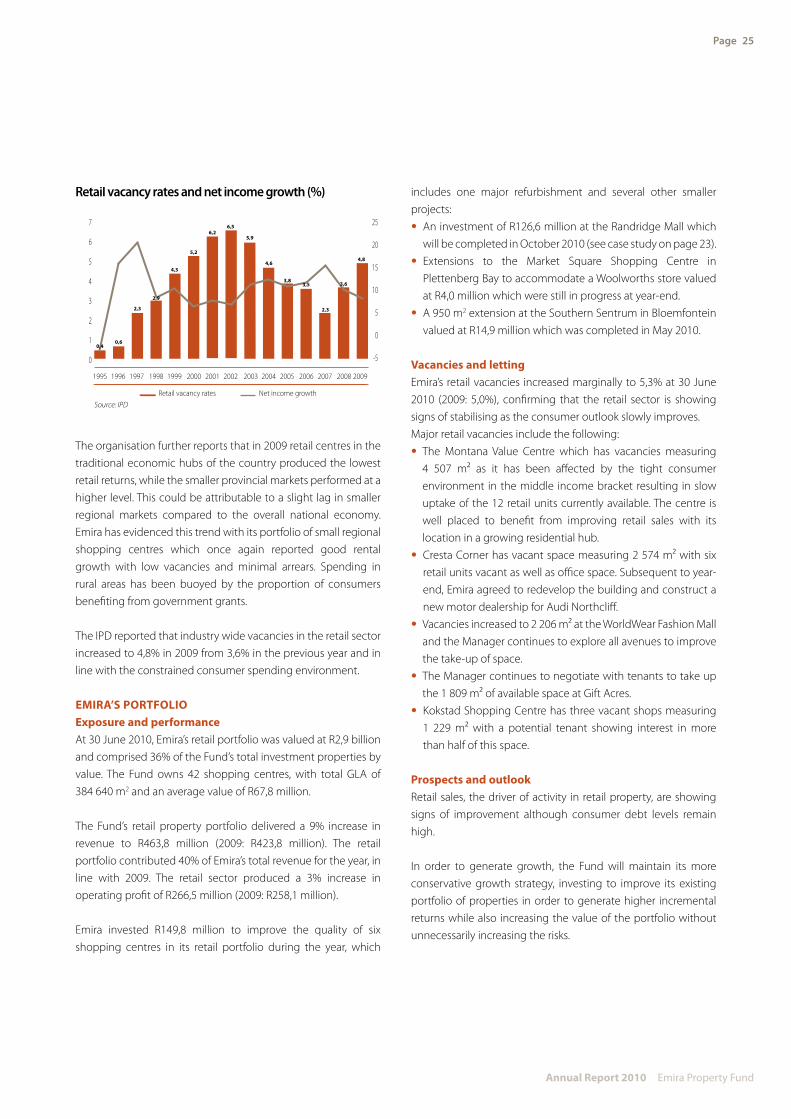
During 2009, the retail sector, traditionally the least volatile commercial property category, continued to be the most resilient class, with an annual total return of 8,8% (2008: 11,1%) according to the IPD South Africa Annual Property Index.
The retail sector reported an income return of 7,9% (2008: 7,9%) which was the lowest of the three property classes (reflecting higher capital value). Retail property was the only category to show a positive capital growth of 0,9% (2008: 3,0%).
Retailers are faced with increasing operating costs, especially with the recent electricity tariff hikes. Landlords are finding it difficult to pass all of these increases on to tenants. According to SAPOA, operating costs have reflected a 27,6% year-on-year increase per square metre to R49,3 per m2 (2008: R38,7 per m2). These account for 41,7% of average gross rental received which is the highest recorded level by SAPOA in the history of its index.
Revenue of R463,8 million which represents an increase of 9%
Operating profit of R266,5 million showing an increase of 3%
Retail portfolio valued at R2,9 billion comprising 36% of the Fund’s total portfolio by value
Epsom Downs Shopping Centre
Dundee Boulevard
Market Square
Annual Report 2010 Emira Property Fund
7
6
5
4
3
2
1
0
25
20
15
10
5
0
-5
Retail vacancy rates and net income growth (%)
200019991998199719961995 2001 2002 2003 2004 2005 2006 2007 2008 2009
0,40,6
2,3
2,9
4,3
5,2
6,26,5
5,9
4,6
3,83,5
2,3
3,6
4,8
Source: IPDRetail vacancy rates Net income growth
The organisation further reports that in 2009 retail centres in the traditional economic hubs of the country produced the lowest retail returns, while the smaller provincial markets performed at a higher level. This could be attributable to a slight lag in smaller regional markets compared to the overall national economy. Emira has evidenced this trend with its portfolio of small regional shopping centres which once again reported good rental growth with low vacancies and minimal arrears. Spending in rural areas has been buoyed by the proportion of consumers benefiting from government grants.
The IPD reported that industry wide vacancies in the retail sector increased to 4,8% in 2009 from 3,6% in the previous year and in line with the constrained consumer spending environment.
eMiRA’S PoRtfolioexposure and performanceAt 30 June 2010, Emira’s retail portfolio was valued at R2,9 billion and comprised 36% of the Fund’s total investment properties by value. The Fund owns 42 shopping centres, with total GLA of 384 640 m2 and an average value of R67,8 million.
The Fund’s retail property portfolio delivered a 9% increase in revenue to R463,8 million (2009: R423,8 million). The retail portfolio contributed 40% of Emira’s total revenue for the year, in line with 2009. The retail sector produced a 3% increase in operating profit of R266,5 million (2009: R258,1 million).
Emira invested R149,8 million to improve the quality of six shopping centres in its retail portfolio during the year, which
includes one major refurbishment and several other smaller projects:• An investment of R126,6 million at the Randridge Mall which
will be completed in October 2010 (see case study on page 23). • Extensions to the Market Square Shopping Centre in
Plettenberg Bay to accommodate a Woolworths store valued at R4,0 million which were still in progress at year-end.
• A 950 m2 extension at the Southern Sentrum in Bloemfontein valued at R14,9 million which was completed in May 2010.
Vacancies and lettingEmira’s retail vacancies increased marginally to 5,3% at 30 June 2010 (2009: 5,0%), confirming that the retail sector is showing signs of stabilising as the consumer outlook slowly improves. Major retail vacancies include the following:• The Montana Value Centre which has vacancies measuring
4 507 m² as it has been affected by the tight consumer environment in the middle income bracket resulting in slow uptake of the 12 retail units currently available. The centre is well placed to benefit from improving retail sales with its location in a growing residential hub.
• Cresta Corner has vacant space measuring 2 574 m² with six retail units vacant as well as office space. Subsequent to year-end, Emira agreed to redevelop the building and construct a new motor dealership for Audi Northcliff.
• Vacancies increased to 2 206 m² at the WorldWear Fashion Mall and the Manager continues to explore all avenues to improve the take-up of space.
• The Manager continues to negotiate with tenants to take up the 1 809 m² of available space at Gift Acres.
• Kokstad Shopping Centre has three vacant shops measuring 1 229 m² with a potential tenant showing interest in more than half of this space.
Prospects and outlookRetail sales, the driver of activity in retail property, are showing signs of improvement although consumer debt levels remain high.
In order to generate growth, the Fund will maintain its more conservative growth strategy, investing to improve its existing portfolio of properties in order to generate higher incremental returns while also increasing the value of the portfolio without unnecessarily increasing the risks.
Page 25

Page 26
Annual Report 2010 Emira Property Fund
Value at June 2010: R23,6 m
Gross lettable area: 4 460 m²
The property:Admiral House is an industrial property located in Corporate Park South, Midrand comprising four adjoining warehouse units attached to a double storey office building. The property historically measured 5 116 m² with 42% being office space which had led to challenges in letting the property. The site measures 10 000 m2, has excellent exposure to the M1 highway and is zoned Special for industrial use.
The opportunity:The property was identified as non-core by the Manager because it did not meet the Fund’s rental growth or capital return hurdles. It had been earmarked for sale, but following a fire in 2009 which started on the tenants’ premises and caused extensive damage, the Manager re-evaluated the potential of the property. A proposal was put forward to unlock the value inherent in its good location to redesign and rebuild the building in such a manner as to improve the asset for Emira in the long term. The capital expenditure was fully covered by the proceeds of the insurance claim.
The upgrade:While the office portion of Admiral House was deemed to have value, the new building was designed to be more efficient by reducing the office space to 20% of GLA, in line with current tenant demand in the industrial sector and in order to enhance the rental appeal of the industrial property.
The warehouse portion of the building was increased from its original GLA of 2 981 m² to 3 571 m². In addition, a courtyard which previously separated the offices and the warehouse was removed to allow better vehicle access to the warehouse.
As a result of these changes, the renovated building’s GLA decreased but its new design is more generic. It should therefore attract the interest of a broader range of potential tenants at better rentals and thereby exceed Emira’s income streams from the old building prior to demolition even though the total GLA has decreased from GLA 5 116 m² to 4 460 m². The project was completed in August 2010 and letting is currently in progress.
The outcome:The redevelopment design has improved the quality of the asset and therefore Emira’s overall portfolio while strengthening its lettability. The refurbishment has also taken full advantage of the location by offering an A-grade building.
Projected monthly rentals for the industrial space which has been upgraded from B-grade to A-grade should increase by between 6% and 14%.
Manager’s report (continued)i n d u S t R i A l
taking advantage of opportunity to create a modern, sought-after lettable industrial building
industrial case study: Admiral House
Page 26
Page 27
Annual Report 2010 Emira Property Fund
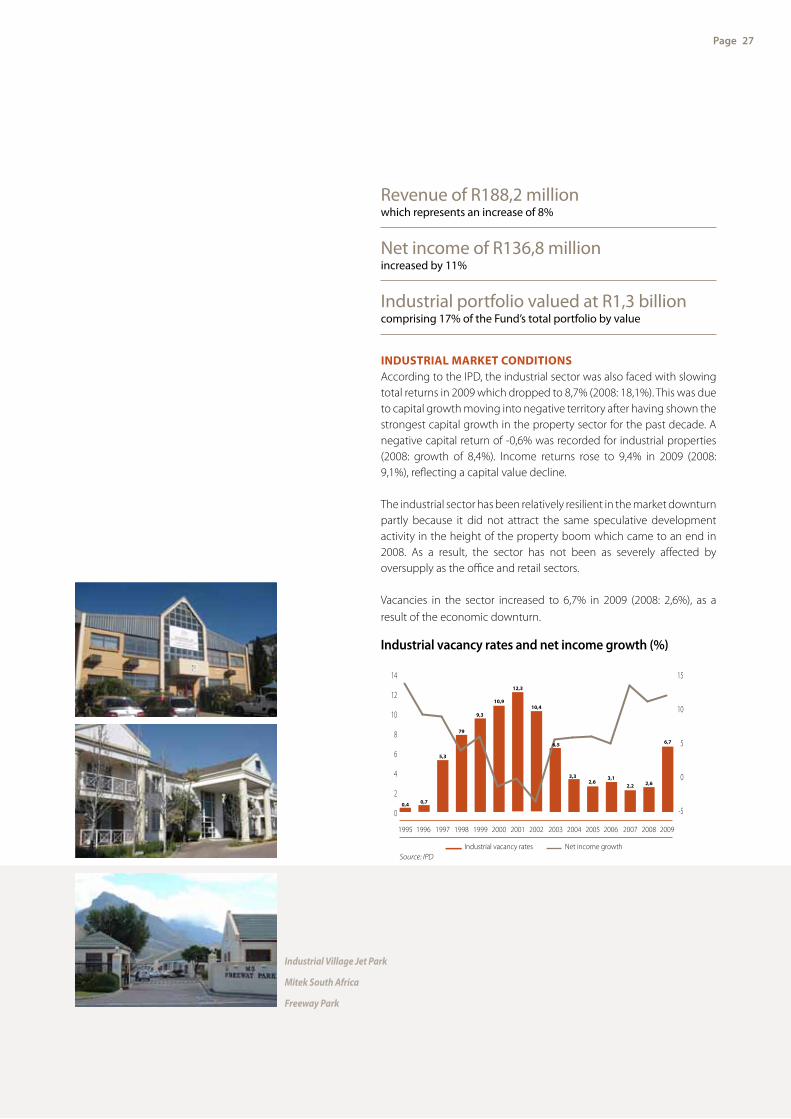
induStRiAl MARket conditionS According to the IPD, the industrial sector was also faced with slowing total returns in 2009 which dropped to 8,7% (2008: 18,1%). This was due to capital growth moving into negative territory after having shown the strongest capital growth in the property sector for the past decade. A negative capital return of -0,6% was recorded for industrial properties (2008: growth of 8,4%). Income returns rose to 9,4% in 2009 (2008: 9,1%), reflecting a capital value decline.
The industrial sector has been relatively resilient in the market downturn partly because it did not attract the same speculative development activity in the height of the property boom which came to an end in 2008. As a result, the sector has not been as severely affected by oversupply as the office and retail sectors.
Vacancies in the sector increased to 6,7% in 2009 (2008: 2,6%), as a result of the economic downturn.
14
12
10
8
6
4
2
0
15
10
5
0
-5
Industrial vacancy rates and net income growth (%)
200019991998199719961995 2001 2002 2003 2004 2005 2006 2007 2008 2009
Source: IPDIndustrial vacancy rates Net income growth
0,4 0,7
5,3
79
9,3
10,9
12,3
10,4
3,32,6
3,12,2 2,6
6,76,5
Revenue of R188,2 million which represents an increase of 8%
Net income of R136,8 million increased by 11%
Industrial portfolio valued at R1,3 billion comprising 17% of the Fund’s total portfolio by value
Industrial Village Jet Park
Mitek South Africa
Freeway Park

Page 28
Annual Report 2010 Emira Property Fund
Manager’s report (continued)i n d u S t R i A l
eMiRA’S PoRtfolioexposure and performanceAt 30 June 2010, Emira’s industrial portfolio was valued at R1,3 billion and comprised 17% of the Fund’s total investment properties by value. The Fund owns 51 industrial properties, with total GLA of 386 061 m2 and an average value of R26,3 million.
The Fund’s industrial property portfolio’s revenue totalled R188,2 million, which represents an increase of 8% (2009: R173,8 million). The industrial portfolio’s contribution to Emira’s revenue increased slightly to 16%. Operating profit in the industrial sector increased by 11% to R136,8 million (2009: R122,7 million).
The Fund did not conclude the purchase of any new properties during the year, but Taylor Blinds in Montague Gardens in Cape Town (GLA 7 794 m2) which was purchased in the previous financial year for R36,0 million, was transferred in September 2009. Investments to improve the quality of the industrial portfolio during the year amounted to R5 million. In addition, Admiral House (see case study on page 26) which suffered extensive damage after a fire which started in the tenants’ premises, was rebuilt using the proceeds of the insurance claim.
Vacancies and lettingEmira’s industrial vacancies increased to 5,1% as at 30 June 2010 (2009: 3,0%), but the figure was slightly down from vacancies of 5,2% reported at the end of March 2010.
The Technohub industrial property in Midrand which was purchased in the previous financial year with an 18-month rental warranty from the developer, Eris Property Group, has been fully let. New leases were concluded with Vodacom and Paramount Logistics Corporation (Pty) Limited on more than 6 000 m2.
Major industrial vacancies at year-end included the following:• A vacant unit measuring 4 970 m² at Isando-Unitrans which is
being marketed.• Approximately a third of Midline Business Park located in the
active business node in Midrand is currently vacant, comprising 2 416 m² of offices and 1 727 m² of industrial space and is being marketed.
• Industrial Village Kya Sands has 3 851 m² of vacant warehousing space, comprising five vacant units. The industrial node has been affected by the downturn and letting has been slow although interest has picked up subsequent to year-end as a result of various incentives being put in place by Emira.
• Cambridge Park where a 1 957 m² unit is currently vacant. • One Highveld which has vacant units measuring 1 106 m² but
leases are currently under negotiation.
Prospects and outlookGiven the relatively low vacancy levels in the industrial sector, combined with the difficulty in bringing new developments on stream at prevailing rentals, the fundamentals for the sector are in place. The priority for Emira is to retain its existing tenants and attract new tenants to maximise the occupancy of its portfolio.

Page 29
Annual Report 2010 Emira Property Fund
Acquisitions and capital projectsAcquisitions and capital projects totalling R243,4 million were concluded during the year.
capital expenditure projects completed
Project Sector Location GLA (m2)
Capitalconsideration
(Rm)Effective
dateKey
tenants
One Highveld Industrial Centurion 5 932 0,9 Nov-09 V CustomMotorcycles
Wonderpark Shopping Centre Retail Karenpark, Pretoria
63 360 2,0 Nov-09 IncredibleConnection,
MaxisIngwavuma Shopping Centre Retail Ingwavuma 4 886 1,3 Dec-09 Spar, Build-ItSouthern Sentrum Retail Bloemfontein 21 224 14,9 May-10 Pick n Pay
and VariousTuinhof Office Centurion 9 182 0,8 May-10 Various
capital expenditure projects in progress
Project Sector Location GLA (m2)
Capital consideration
(Rm)
Expectedcompletion
dateKey
tenants
Randridge Mall Retail Randpark Ridge
22 624 126,2 Oct-10 Pick n Pay,Dis-Chem,
Woolworths, Foschini
GroupAdmiral House Industrial Midrand 4 460 17,1* Aug-10 –Tin Roof Retail Umtata 2 175 1,4 Jul-10 VariousRigel Park Office Pretoria 4 417 14,7 Jul-10 –WesBank House Office Cape Town 8 693 11,0 Sep-10 WesBank,
Department of Labour
Market Square Shopping Centre Retail Plettenberg Bay
13 425 4,0 Oct-10 Woolworths
Epping Warehouse (WGA) Industrial Epping 25 076 3,4 Sep-10 Nampak,Santam
One Highveld Industrial Centurion 5 932 0,8 Aug-10 OntapPlumbing
* Funded from proceeds of insurance claim and not considered as new capital expenditure.
disposalsThe disposal of non-core buildings continued during the period, with three sectionalised units at Georgian Place being transferred out of the Fund as well as Rinaldo Park, a small industrial unit located in KwaZulu-Natal. The sale of four buildings, Nampak Building, Howick Gardens, QD House and Standard Bank, Glenwood – are all unconditional. All buildings with the exception of the Nampak Building were transferred after year-end.
Transferred out of Emira
Property Sector Location GLA (m2) Selling
price (Rm) Yield
%
Georgian Place (sections 9, 16 and 19) Office Kelvin 1 578 6,6 3,9 Rinaldo Park Industrial Durban North 1 650 6,0 9,8

Page 30
Annual Report 2010 Emira Property Fund
Yet to be transferred out of Emira
Property Sector Location GLA (m2) Selling
price (Rm) Yield
%
Howick Gardens* Office Midrand 3 075 20,7 9,4 Standard Bank, Glenwood* Retail Durban 368 5,0 11,6Nampak Building Industrial Denver 24 880 20,5 8,5QD House* Industrial Kyalami 3 470 16,6 11,7
* Transferred out of the Fund after year-end.
Nine non-core properties remain on the disposal list with a total value of R288,9 million at 30 June 2010.
Valuations and net asset valueExcluding acquisitions and capital expenditure, Emira’s property valuations were marginally higher for the year.
One-third of Emira’s portfolio is valued by independent valuers at the end of every financial year, with the balance being valued by the directors.
SectorJune 2009
(R’000) R/m²June 2010
(R’000) R/m²Difference
(%)Difference
(R’000)
Office 3 679 586 8 193 3 696 931 8 265 0,5 17 345 Retail 2 732 279 7 185 2 846 316 7 400 4,2 114 037 Industrial 1 306 212 3 430 1 339 683 3 470 2,6 33 471
Total 7 718 077 7 882 930 164 853
Net asset value per PI remained virtually stable during the year from 1 135 cents (1 186 cents excluding the deferred tax provision) to 1 133 cents (1 182 cents), largely as a result of a reduction in the fair value of derivative financial instruments of R63,8 million. This is, in effect, a mark-to-market accounting entry and is not a liability to Emira. The adjustment reflects the variance between the interest rates payable in terms of the interest rate swaps entered into by Emira and prevailing market interest rates. It has no impact on the distribution payable by the Fund.
GearingEmira has a relatively low level of gearing, with available debt facilities at attractive margins which will enable the Fund to acquire good quality properties with sustainable income streams.
Manager’s report (continued)
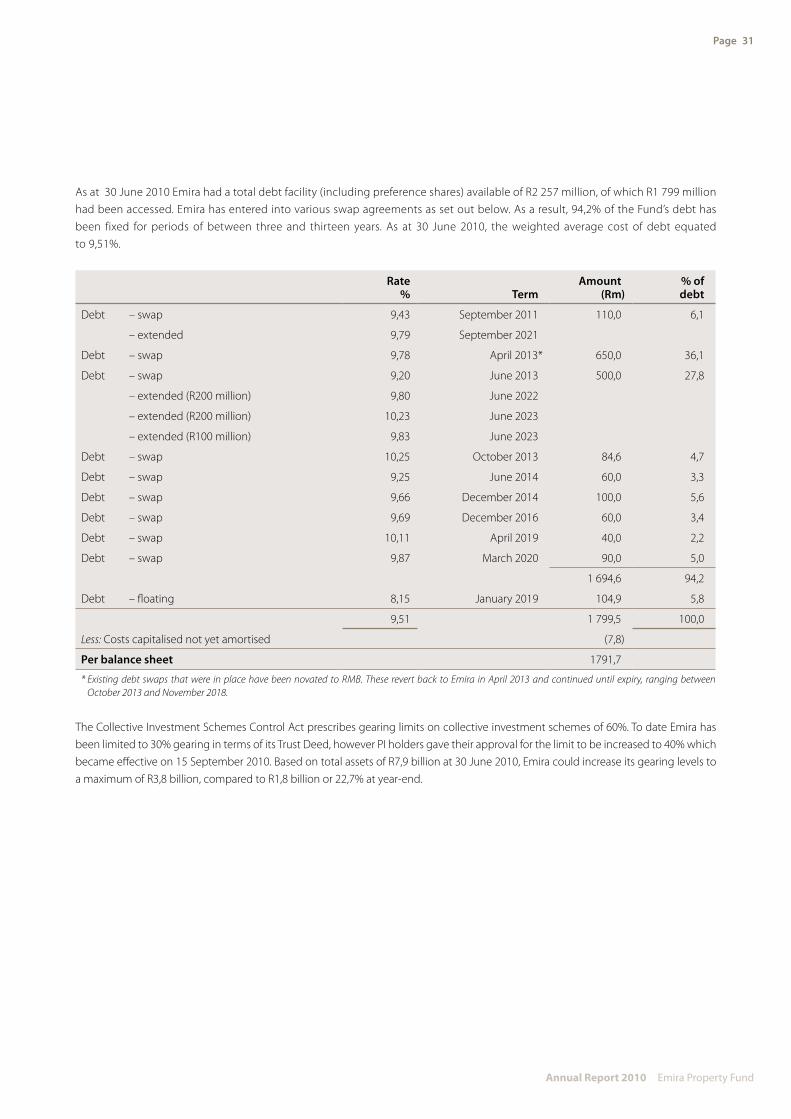
Page 31
Annual Report 2010 Emira Property Fund
As at 30 June 2010 Emira had a total debt facility (including preference shares) available of R2 257 million, of which R1 799 million had been accessed. Emira has entered into various swap agreements as set out below. As a result, 94,2% of the Fund’s debt has been fixed for periods of between three and thirteen years. As at 30 June 2010, the weighted average cost of debt equated to 9,51%.
Rate% Term
Amount(Rm)
% ofdebt
Debt – swap 9,43 September 2011 110,0 6,1
– extended 9,79 September 2021
Debt – swap 9,78 April 2013* 650,0 36,1
Debt – swap 9,20 June 2013 500,0 27,8
– extended (R200 million) 9,80 June 2022
– extended (R200 million) 10,23 June 2023
– extended (R100 million) 9,83 June 2023
Debt – swap 10,25 October 2013 84,6 4,7
Debt – swap 9,25 June 2014 60,0 3,3
Debt – swap 9,66 December 2014 100,0 5,6
Debt – swap 9,69 December 2016 60,0 3,4
Debt – swap 10,11 April 2019 40,0 2,2
Debt – swap 9,87 March 2020 90,0 5,0
1 694,6 94,2
Debt – floating 8,15 January 2019 104,9 5,8
9,51 1 799,5 100,0
Less: Costs capitalised not yet amortised (7,8)
Per balance sheet 1791,7
* Existing debt swaps that were in place have been novated to RmB. These revert back to Emira in April 2013 and continued until expiry, ranging between October 2013 and November 2018.
The Collective Investment Schemes Control Act prescribes gearing limits on collective investment schemes of 60%. To date Emira has been limited to 30% gearing in terms of its Trust Deed, however PI holders gave their approval for the limit to be increased to 40% which became effective on 15 September 2010. Based on total assets of R7,9 billion at 30 June 2010, Emira could increase its gearing levels to a maximum of R3,8 billion, compared to R1,8 billion or 22,7% at year-end.

Page 32
Annual Report 2010 Emira Property Fund
Directorated i R e c t o R S o f t H e M A n A G e M e n t c o M P A n y, S t R At e G i c R e A l e S tAt e M A n A G e R S ( P t y ) l i M i t e d ( S t R e M )
1. Benedict james van der Ross (63) (Non-executive Chairman)Qualifications: Dip LawOccupation: Company director
Mr Van der Ross was admitted to the Cape Bar as attorney in 1970 and practised law for his own account until 1988. He has served as a director of various companies including Executive Director for the Urban Foundation and Independent Development Trust.
He was appointed Commissioner to the First Independent Electoral Commission by the State President on the advice of the Transitional Executive Council and subsequently served as Deputy Chief Executive Officer of the Independent Development Trust and acting Chief Executive Officer of South African Rail Commuter Corporation.
He currently serves on a number of boards including those of FirstRand, Naspers, Distell, Lewis Stores, Pick n Pay and Momentum Group, and is the Chairman of RMB Asset Management.
2. Warren kirkwood Schultze (50) (Executive director)Qualifications: BCom, BAcc, CA(SA)Occupation: Chief Executive Officer of Eris Property Group
Prior to joining RMB Properties, Mr Schultze served his articles with Arthur Young and was later appointed Financial Director for two property financing and property trading companies. During this time he gained extensive experience in property asset management, property financing and property trading activities.
He was appointed Chief Operating Officer of RMB Properties in 2000 and Chief Executive Officer in 2004. He was appointed Chief Executive Officer of RMB Properties on 1 April 2004 and Chief Executive Officer of the Eris Property Group on 1 April 2008. He was President of SAPOA for the 2009/2010 year.
3. james William Andrew templeton (37) (Chief Executive Officer)Qualifications: BCom (Hons), CFAOccupation: Chief Executive Officer of Strategic Real Estate Managers (Pty) Limited
Mr Templeton joined RMB Properties in April 2004 as Business Development Executive. Previously he was employed at Barnard Jacobs Mellet Securities as an Equities Analyst for seven years.
He was the top-ranked analyst in the real estate sector, according to the Financial mail, in 2002 and 2003 and was appointed Chief Executive Officer of STREM in July 2004. Mr Templeton currently also serves as the Deputy Chairman of the Association of the Property Unit Trusts.
4. Peter john thurling (55) (Chief Financial Officer)Qualifications: BCom, BAcc, CA(SA)Occupation: Chief Financial Officer of Strategic Real Estate Managers (Pty) Limited
Mr Thurling, a chartered accountant, has over 20 years’ experience in the property industry; in particular with listed property vehicles. Previously he was the Financial Director of Corovest Property Group and the Chief Financial Officer of Freestone Property Holdings Limited.
5. Michael Simpson Aitken (53) (Non-executive director)Qualifications: BA, LLBOccupation: Company director
Mr Aitken has over 20 years’ experience in property-related activity, with specific expertise in asset and fund management related to directly held and listed property vehicles. He was previously an executive director of Freestone Property Holdings Limited. Currently he is Managing Director of Corovest Property Group and the non-executive Chairman of Hyprop Investments Limited.
6. Bryan Hugh kent (65) (Independent non-executive director)Qualifications: BCom, FCMA, CA(SA)Occupation: Company director
Mr Kent was previously a partner at Price Waterhouse. He is presently a financial business consultant with considerable experience in property matters and financial structuring. He was also previously a non-executive director of Freestone Property Holdings Limited and Chairman of its audit and risk committee.
He is currently a non-executive director of Set Point Group Holdings Limited and non-executive director of Cadiz Holdings Limited.
He is Chairman of CIC Holdings Limited (Namibia) and Country Bird Holdings.
1
2
3
4
5
6

Page 33
Annual Report 2010 Emira Property Fund
7. Vusumuzi Mahlangu (39) (Independent non-executive director)Qualifications: BSc Eng (Chem), MBA (Harvard) Occupation: Company director
Mr Mahlangu is a former investment banker with over 11 years’ experience gained at Investec Bank as the Head of the bank’s Public Sector Finance department and at Makalani. In 2005 he became the Chief Executive Officer of Makalani where he pioneered mezzanine funding in South Africa by launching the first specialised mezzanine fund, Makalani, which was listed on the JSE Limited. During his tenure at Makalani, he specialised in BEE transactions across all sectors of the economy including providing mezzanine finance for the Gautrain. Prior to joining Investec, he worked for African Oxygen Limited for four years, as a process engineer and later as a production manager.
In 2008 he established Tamela Holdings (Pty) Limited, a black-owned and managed investment company.
8. nkululeko leonard Sowazi (47) (Non-executive director)Qualifications: BA, MA (UCLA)Occupation: Executive Chairman of the Tiso Group
Mr Sowazi is co-founder and the Executive Chairman of the Tiso Group – a black empowerment investment company with interests in natural resources, industrial services and investment banking. He is currently a member of the boards of JSE- listed Exxaro Resources and Aveng Limited, and is a non-executive director of the boards of Grinaker-LTA, Trident Steel (Pty) Limited, African Explosives Limited and Alstom SA. He is also Chairman of Eris Property Group (formerly RMB Properties), Idwala Industrial Holdings, The Home Loan Guarantee Company and the Financial Markets Trust.
Mr Sowazi was previously Executive Deputy Chairman of African Bank Investments Limited and prior to that Managing Director of the Mortgage Indemnity Fund (Pty) Limited. He also served on the board of Kagiso Trust Investment Company, Kagiso Media and Development Bank of Southern Africa.
9. nocawe eustacia Makiwane (51) (Independent non-executive director)Qualifications: BSocScience (UCT), BA (Hons) Economics (Wits), Executive Leadership Programme (Wharton Business School), MBA (University of Exeter)Occupation: Managing Director of Avuka Investments
Ms Makiwane was previously a portfolio manager at Stanlib Asset Management. Currently she serves as a non-executive director of National Housing Finance Corporation (“NHFC”), Advantage Asset Management, AM Mfolozi Group Holdings companies, Xau Investments (Pty) Limited, Women In Capital Growth (Pty) Limited, Pacific Breeze Trading (Pty) Limited and Strate Limited.
10. Wayne Mccurrie (50) (Non-executive director)Qualifications: BCompt (Hons), CA(SA)Occupation: Senior Portfolio Manager
Mr McCurrie joined the RMB Asset Management investment team as an investment professional on 1 March 2008. He started his career in the financial services industry in 1988, when he joined Lifegro Limited as a management accountant. Lifegro was taken over by the Momentum Group in 1989 where Mr McCurrie stayed until it was incorporated into RMB Asset Management in 1994. He left RMB Asset Management for Sage in 2002 and joined the FirstRand Group again in 2004 as Managing Director of Momentum International Multi-Managers. At RMB Asset Management, Mr McCurrie focuses on managing various retirement fund portfolios.
11. Matthys Stefanus Benjamin neser (54) (Independent non-executive director)Qualifications: BSc (Building Management), MBAOccupation: Company director
Mr Neser has been involved with the Abcon group of companies since 1981 and is currently Executive Chairman for the various companies in the Group. He is active in the residential and commercial property field as well as in other business ventures.
7
9
8
10
11
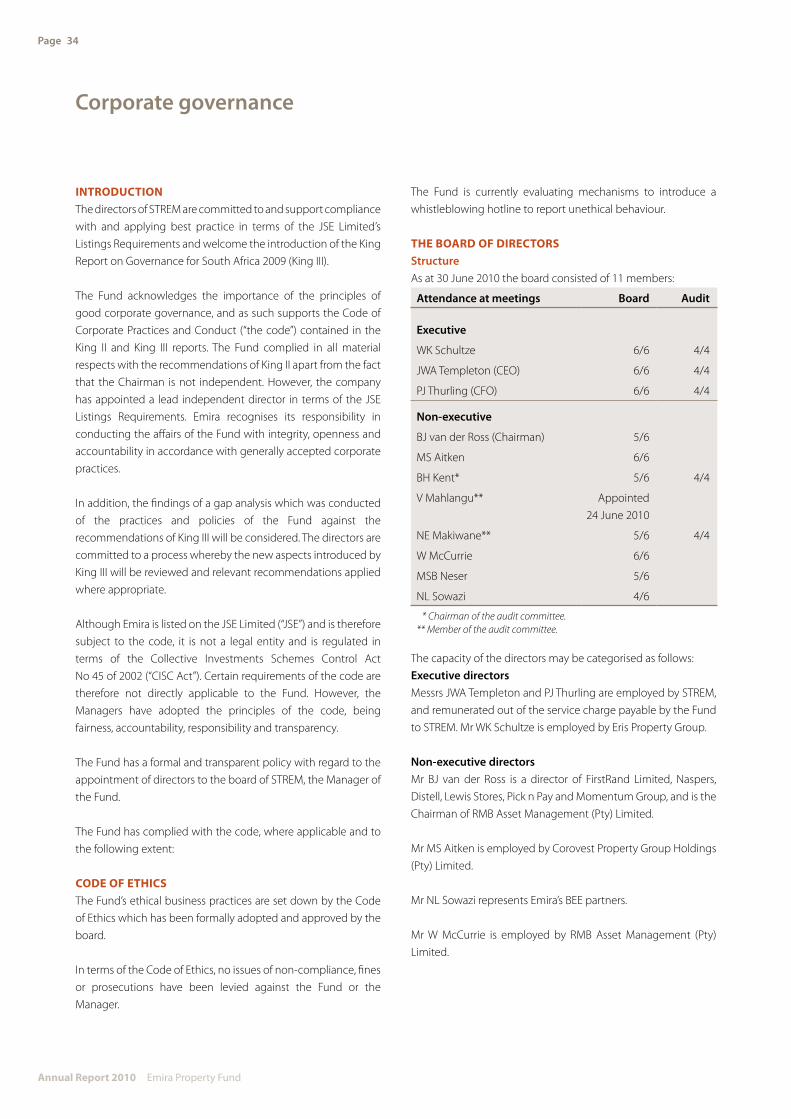
Page 34
Annual Report 2010 Emira Property Fund
Corporate governance
intRoductionThe directors of STREM are committed to and support compliance with and applying best practice in terms of the JSE Limited’s Listings Requirements and welcome the introduction of the King Report on Governance for South Africa 2009 (King III).
The Fund acknowledges the importance of the principles of good corporate governance, and as such supports the Code of Corporate Practices and Conduct (“the code”) contained in the King II and King III reports. The Fund complied in all material respects with the recommendations of King II apart from the fact that the Chairman is not independent. However, the company has appointed a lead independent director in terms of the JSE Listings Requirements. Emira recognises its responsibility in conducting the affairs of the Fund with integrity, openness and accountability in accordance with generally accepted corporate practices.
In addition, the findings of a gap analysis which was conducted of the practices and policies of the Fund against the recommendations of King III will be considered. The directors are committed to a process whereby the new aspects introduced by King III will be reviewed and relevant recommendations applied where appropriate.
Although Emira is listed on the JSE Limited (“JSE”) and is therefore subject to the code, it is not a legal entity and is regulated in terms of the Collective Investments Schemes Control Act No 45 of 2002 (“CISC Act”). Certain requirements of the code are therefore not directly applicable to the Fund. However, the Managers have adopted the principles of the code, being fairness, accountability, responsibility and transparency.
The Fund has a formal and transparent policy with regard to the appointment of directors to the board of STREM, the Manager of the Fund.
The Fund has complied with the code, where applicable and to the following extent:
code of etHicSThe Fund’s ethical business practices are set down by the Code of Ethics which has been formally adopted and approved by the board.
In terms of the Code of Ethics, no issues of non-compliance, fines or prosecutions have been levied against the Fund or the Manager.
The Fund is currently evaluating mechanisms to introduce a whistleblowing hotline to report unethical behaviour.
tHe BoARd of diRectoRSStructureAs at 30 June 2010 the board consisted of 11 members:
Attendance at meetings Board Audit
Executive
WK Schultze 6/6 4/4
JWA Templeton (CEO) 6/6 4/4
PJ Thurling (CFO) 6/6 4/4
Non-executive
BJ van der Ross (Chairman) 5/6
MS Aitken 6/6
BH Kent* 5/6 4/4
V Mahlangu** Appointed24 June 2010
NE Makiwane** 5/6 4/4
W McCurrie 6/6
MSB Neser 5/6
NL Sowazi 4/6
* Chairman of the audit committee.** member of the audit committee.
The capacity of the directors may be categorised as follows:Executive directorsMessrs JWA Templeton and PJ Thurling are employed by STREM, and remunerated out of the service charge payable by the Fund to STREM. Mr WK Schultze is employed by Eris Property Group.
Non-executive directorsMr BJ van der Ross is a director of FirstRand Limited, Naspers, Distell, Lewis Stores, Pick n Pay and Momentum Group, and is the Chairman of RMB Asset Management (Pty) Limited.
Mr MS Aitken is employed by Corovest Property Group Holdings (Pty) Limited.
Mr NL Sowazi represents Emira’s BEE partners.
Mr W McCurrie is employed by RMB Asset Management (Pty) Limited.
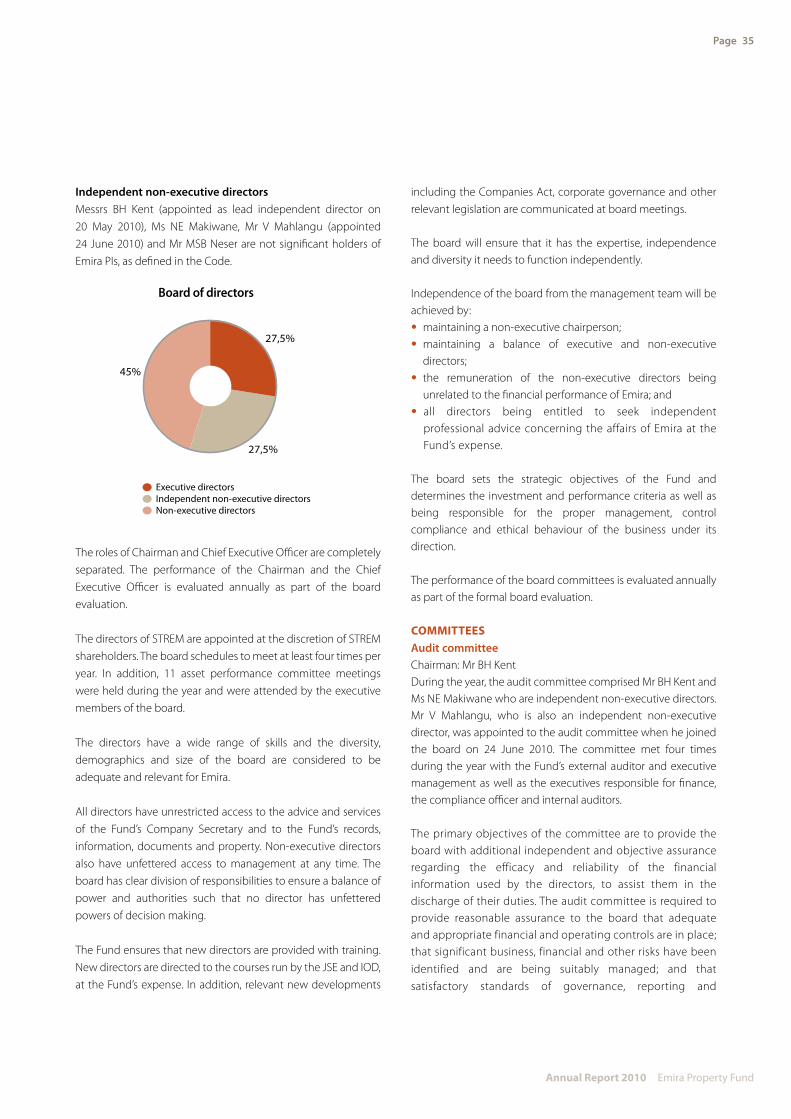
Page 35
Annual Report 2010 Emira Property Fund
Independent non-executive directors Messrs BH Kent (appointed as lead independent director on 20 May 2010), Ms NE Makiwane, Mr V Mahlangu (appointed 24 June 2010) and Mr MSB Neser are not significant holders of Emira PIs, as defined in the Code.
Board of directors
45%
27,5%
27,5%
Executive directorsIndependent non-executive directorsNon-executive directors
The roles of Chairman and Chief Executive Officer are completely separated. The performance of the Chairman and the Chief Executive Officer is evaluated annually as part of the board evaluation.
The directors of STREM are appointed at the discretion of STREM shareholders. The board schedules to meet at least four times per year. In addition, 11 asset performance committee meetings were held during the year and were attended by the executive members of the board.
The directors have a wide range of skills and the diversity, demographics and size of the board are considered to be adequate and relevant for Emira.
All directors have unrestricted access to the advice and services of the Fund’s Company Secretary and to the Fund’s records, information, documents and property. Non-executive directors also have unfettered access to management at any time. The board has clear division of responsibilities to ensure a balance of power and authorities such that no director has unfettered
powers of decision making.
The Fund ensures that new directors are provided with training. New directors are directed to the courses run by the JSE and IOD, at the Fund’s expense. In addition, relevant new developments
including the Companies Act, corporate governance and other relevant legislation are communicated at board meetings.
The board will ensure that it has the expertise, independence and diversity it needs to function independently.
Independence of the board from the management team will be achieved by:• maintaining a non-executive chairperson;• maintaining a balance of executive and non-executive
directors;• the remuneration of the non-executive directors being
unrelated to the financial performance of Emira; and• all directors being entitled to seek independent
professional advice concerning the affairs of Emira at the Fund’s expense.
The board sets the strategic objectives of the Fund and determines the investment and performance criteria as well as being responsible for the proper management, control compliance and ethical behaviour of the business under its direction.
The performance of the board committees is evaluated annually as part of the formal board evaluation.
coMMitteeSAudit committeeChairman: Mr BH KentDuring the year, the audit committee comprised Mr BH Kent and Ms NE Makiwane who are independent non-executive directors. Mr V Mahlangu, who is also an independent non-executive director, was appointed to the audit committee when he joined the board on 24 June 2010. The committee met four times during the year with the Fund’s external auditor and executive management as well as the executives responsible for finance, the compliance officer and internal auditors.
The primary objectives of the committee are to provide the board with additional independent and objective assurance regarding the efficacy and reliability of the financial information used by the directors, to assist them in the discharge of their duties. The audit committee is required to provide reasonable assurance to the board that adequate and appropriate financial and operating controls are in place; that significant business, financial and other risks have been identified and are being suitably managed; and that satisfactory standards of governance, reporting and

Page 36
Annual Report 2010 Emira Property Fund
Corporate governance (continued)
compliance are in operation. The committee also monitors proposed changes in accounting policies, and discusses and advises the board on the accounting implications of major transactions.
The board is responsible for the Fund’s system of internal and operational control. The executive directors are charged with the responsibility of ensuring that assets are protected, systems operate effectively and all valid transactions are recorded properly. Comprehensive reviews and testing of the effectiveness of the internal control systems in operation are performed by internal auditors, who report to the audit committee. The internal audit function co-ordinates with other internal and external providers of assurance to ensure proper coverage of financial, operational and compliance controls.
The committee has the co-operation of all directors, management and staff and is satisfied that controls and systems within the Fund have been adhered to and, where necessary, improved during the period under review.
To date the external auditor has not performed any non-audit services and should these be required in the future, appropriate principles will be considered. The audit committee has considered and satisfied itself of the appropriateness of the expertise and experience of Peter Thurling, the Financial Director.
The committee has fulfilled its responsibilities during the year. It has furthermore assured itself of the independence of the external auditor and its suitability for reappointment for the 2011 financial year.
During the year, the audit committee reviewed the aspects and scope of risk which is to be expanded upon at the management operational level. It also established a separate subcommittee at board level.
Investment committeeChairman: Mr JWA TempletonAn investment committee comprises at least two executive directors, and four senior staff employed by STREM with the appropriate skills and experience. The committee meets on an ad hoc basis to assess acquisitions and disposals, and makes recommendations to the board.
Remuneration and nomination committeeChairman: Mr BJ van der RossThe committee comprises the Chairman of the board of directors and Mr BH Kent, an independent non-executive director. The committee considers and recommends the remuneration payable to non-executive directors by the management company. The committee meets on an ad hoc basis as required and met twice during the financial year.
Risk committeeThe Fund will establish the risk committee with effect from November 2010. Mr PJ Thurling has been appointed as Emira’s Chief Risk Officer.
Management and financial controlDuring the year independent internal auditors performed a management and financial control review. No significant weaknesses were identified and the overall conclusion was that:• the directors had maintained an adequate system of internal
controls and accounting records;• the Fund’s assets are safeguarded and appropriately insured;• the Fund should remain a going concern for the foreseeable
future; and• management understood the Fund’s policy and employed
the appropriate strategy.
DirectorateDetails of the directors are set out on pages 32 to 33 of this report. According to the articles of association of STREM, one-third of the directors shall retire at the following annual general meeting of STREM and will be eligible for re-election.
Directors’ remunerationThe directors of STREM are remunerated from the management fee payable by the Fund.
Directors’ dealingsThe board has adopted policies prohibiting dealings by directors and certain other managers in periods immediately preceding the announcement of its interim and year-end financial results and at any other time deemed necessary by the board or as required in terms of the JSE regulations.

Page 37
Annual Report 2010 Emira Property Fund
SecRetARy of tHe fundMr ME Harris is the Company Secretary who was appointed on 16 February 2010 following the resignation of Ms D Isserow. His business and postal addresses, which are also the Fund’s registered and business addresses, are set out on page 110.
AuditoRThe Fund’s auditor is PricewaterhouseCoopers Inc.
MAjoR inteReSt HoldeRMomentum is the majority interest holder in Emira with a 20,8% holding of the PIs in issue.
MAteRiAl cHAnGeS And SuBSeQuent eVentS to tHe yeAR-endOn 8 July 2010 the Fund reached an agreement with the Manager, STREM, to amend the terms of its service charge arrangement to a monthly fee based on STREM’s actual operating costs. The Manager and the Trustee agreed to enter into supplemental deeds in order to amend the Trust Deed. Approval was received from the regulatory authorities with effect from 15 September 2010. The Trust Deed was also amended to allow the Fund to invest in a broader class of assets and to increase the limit of borrowing by the Emira Property Scheme from the current limit of 30% to 40% of the value of its underlying assets.
In August 2010, GOZ announced the acquisition of seven direct properties to be partly funded by a 1-for-3 pro rata renounceable rights offer at A$1,90 per stapled security. Emira has subscribed for 9,2 million additional stapled securities to the amount of A$17,5 million.
The transfer of Howick Gardens, QD House and Standard Bank, Glenwood which were disposed of during the year, took place after year-end.
The Fund also purchased a 50% undivided share in a multi-tenanted office and retail building located at 80 Strand Street in the Cape Town CBD with a GLA of 12 500 m2 which has not yet been transferred into the Fund.
StRuctuRe of tHe fundEmira Property Fund (“the Fund”) is a portfolio established in terms of the CISC Act. The Fund is managed by STREM, which is
approved by the Registrar of Collective Investment Schemes to manage the Fund.
In terms of the CISC Act, the Fund is obliged to distribute all income earned to its participatory interest holders. As a result of its distribution obligations, no income tax or capital gains tax is payable by the Fund.
MAnAGeMent of tHe fundSTREM – Asset managementSTREM has been approved by the Registrar of Collective Investment Schemes to manage the Emira Property Scheme.
Up to 14 September 2010, STREM received an amount equal to 0,5% of the total market capitalisation of the Fund, calculated monthly on the average daily closing price of the Fund as recorded by the JSE Limited, plus total long-term borrowings.
Fees paid for the period amounted to R36,1 million (2009: R31,8 million).
With the agreement referred to above, the monthly service fee in respect of the administration of the Fund will be equal to the actual operating costs incurred by the Manager in administering the Fund. Accordingly, the Manager will no longer profit from administering the Fund but will recover its actual costs and will be compensated with a cancellation payment amounting to R197,4 million. The implementation date for the new fee structure was 15 September 2010.
Property managementProperty management of the Fund has been outsourced to Eris Property Group, an associate of FirstRand.
Property management fees and commissions paid for the period were R53,4 million (2009: R58,6 million).
RiSk MAnAGeMentThe STREM management philosophy on risk recognises that managing risk is an integral part of generating sustainable PI holder value and enhancing stakeholder interest. It also recognises that an appropriate balance should be struck between entrepreneurial endeavour and sound business practice.
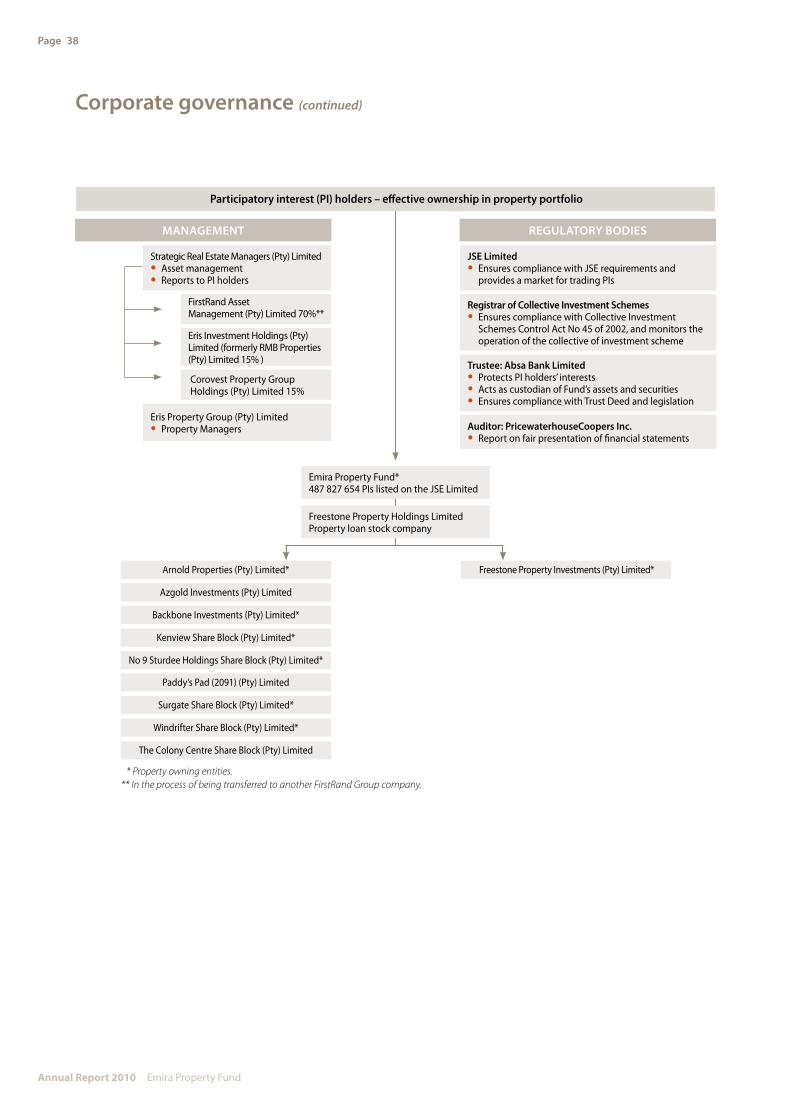
Page 38
Annual Report 2010 Emira Property Fund
Corporate governance (continued)
Windrifter Share Block (Pty) Limited*
The Colony Centre Share Block (Pty) Limited
Surgate Share Block (Pty) Limited*
Paddy’s Pad (2091) (Pty) Limited
No 9 Sturdee Holdings Share Block (Pty) Limited*
Kenview Share Block (Pty) Limited*
Backbone Investments (Pty) Limited*
Azgold Investments (Pty) Limited
Arnold Properties (Pty) Limited* Freestone Property Investments (Pty) Limited*
* Property owning entities.** In the process of being transferred to another FirstRand Group company.
Emira Property Fund*487 827 654 PIs listed on the JSE Limited
Freestone Property Holdings LimitedProperty loan stock company
Eris Property Group (Pty) Limited• Property Managers
Corovest Property Group Holdings (Pty) Limited 15%
Auditor: PricewaterhouseCoopers Inc.• Report on fair presentation of financial statements
Trustee: Absa Bank Limited• Protects PI holders’ interests• Acts as custodian of Fund’s assets and securities• Ensures compliance with Trust Deed and legislation
Eris Investment Holdings (Pty) Limited (formerly RMB Properties (Pty) Limited 15% )
FirstRand Asset Management (Pty) Limited 70%**
Registrar of Collective Investment Schemes• Ensures compliance with Collective Investment
Schemes Control Act No 45 of 2002, and monitors the operation of the collective of investment scheme
JSE Limited• Ensures compliance with JSE requirements and
provides a market for trading PIs
MANAGEMENT REGULATORY BODIES
Participatory interest (PI) holders – effective ownership in property portfolio
Strategic Real Estate Managers (Pty) Limited• Asset management• Reports to PI holders
Page 39
Annual Report 2010 Emira Property Fund
The management of STREM operates a risk management framework, which is based on COSO’s Enterprise Risk Management Framework. The underlying premise of enterprise risk management is that every entity exists to provide value for its stakeholders. All entities face uncertainty, and the challenge for management is to determine how much uncertainty to accept as it strives to grow stakeholder value.
Value is maximised when management sets strategy and objectives to strike an optimal balance between growth and return goals and related risks, and efficiently and effectively deploys resources in pursuit of the entity’s objectives.
Enterprise risk management in STREM encompasses:• Aligning risk appetite and strategy which considers the risk
appetite in evaluating strategic alternatives, setting related objectives, and developing mechanisms to manage related risks;
• Enhancing risk response decisions by selecting alternative risk response, which includes risk avoidance, reduction, sharing or acceptance;
• Reducing operational losses by gaining enhanced capabilities to identify potential events and establish responses;
• Identifying and managing multiple cross-enterprise risks;• Seizing opportunities by identifying a full range of potential
events; and• Improving deployment of capital by obtaining robust risk
information to allow management to effectively assess overall capital needs and enhance capital allocation.
These capabilities inherent in enterprise risk management help management achieve the Fund’s performance and profitability targets and prevent loss of resources. Enterprise risk management helps to ensure effective reporting and compliance with laws and regulations, and helps avoid damage to the Fund’s reputation and associated consequences.
The Fund’s annual risk assessment was under way at time of going to print.
Financial risk factorsThe financial instruments of the Fund consist mainly of deposits with banks, long-term borrowings, derivative instruments, accounts receivable and accounts payable. The Fund issues or purchases financial instruments in order to finance operations and to manage the interest rate risks that arise from these operations.
The Fund’s credit, interest and liquidity risks are continually monitored.
The main objective of using financial instruments is to reduce the uncertainty over future cash flows arising principally as a result of interest rate fluctuations. The Fund finances its operations through the combination of bank borrowings and issue of additional units.
Interest rate risk managementAs at 30 June 2010, approximately 94,2% of total borrowing facilities were at fixed rates (in terms of the swap contracts).
Credit risk managementThe Fund has no significant concentration of credit risk due to a large number of widespread tenants.
The Fund has policies in place to ensure that lease agreements concluded are with tenants with an appropriate credit history.
The Fund has policies that limit the amount of credit exposure to any one financial institution, and cash transactions are limited to high credit quality financial institutions. The debts are monitored on a continual basis in order to maintain a low default rate on trade receivables.
Liquidity risk managementCash flows are monitored on a monthly basis to ensure that cash resources are adequate to meet the funding requirements of the Fund.

Page 40
Annual Report 2010 Emira Property Fund
Sustainability
intRoductionThe Emira Property Fund recognises its responsibility to protect the interests of all its stakeholders and believes that good governance and corporate citizenship is essential to the Fund’s long-term sustainability and functioning. The objective of the Fund is to conform to its stringent requirement for transparency, while operating profitably and remaining accountable to the broader community which it serves and respecting the natural environment.
The Fund has embraced the King II report’s guidelines for socially responsible reporting according to the “triple bottom line” – the economic, social and environmental impacts of its properties. Going forward, the Fund is formalising its approach in order to reflect its commitment to sustainable business practice, and introduce measurable targets for the future, including an evaluation of the implications of King III.
StAkeHoldeR enGAGeMentThe STREM board considers it a duty to keep all the Fund’s stakeholders informed and up to date with regard to its practices, policies and financial results, while remaining accountable for the sustainability of the Fund to its investors and tenants.
Direct discussions with stakeholders are always welcomed by the Fund. In addition to communication at the annual results presentation which is made to key PI holders and analysts, media releases are published when appropriate as well as ad hoc meetings with interested parties on request.
The Fund meets regularly with its PI holders and recognises its fiduciary duty to maximise the value of its assets for their benefit. In addition, PI holders are encouraged to attend the Fund’s annual general meeting to vote on resolutions and, where appropriate, to enter into discussions with the STREM directors.
The Fund has defined its major stakeholders and communicates with them as follows:
Investors The Fund makes a presentation of its interim and annual results to the investment community in both Johannesburg and Cape Town and subsequently meets with significant PI holders on a one-to-one basis. The Fund’s commitment to transparent disclosure to the investment community was recognised by the Investment Analyst Society of South Africa with the award of the 2010 Best Presentation to the Society in 2009/2010 – companies with market capitalisation below R5 billion.
TenantsThrough its property management service provider, Eris, the Fund engages with its base of more than 4 000 tenants on a daily basis. These tenants range from small owner-run enterprises, to blue-chip companies and government departments spanning local, provincial and national government. The Fund also engages with government departments in matters relating to properties, for example zoning, planning permissions and rates.
Suppliers and property management service providersSuppliers include cleaning services, security, etc and the property managers are the main point of contact.
CommunitiesAs part of its duty as a South African corporate citizen, the Fund is committed to its responsibility of engaging with local communities where its operations have a potential environmental impact on their surroundings. The Fund aims to develop a positive working relationship with local communities through organised committees. For example, when the Fund engages in property development, where required, the impacts are fully evaluated with environmental impacts assessments, which involve extensive consultation with the local communities.
The Fund’s portfolio of shopping centres also actively engages with their local communities, involving local residents in events and corporate social investment initiatives. Prior to engaging in
Students of the Penreach Programme

Page 41
Annual Report 2010 Emira Property Fund
any redevelopment of retail properties, the Fund engages with local communities to obtain the necessary approvals.
Industry bodiesThe Fund is an active participant in the industry and was a participant on the Property Sector Transformation Council. It is also a member of the Association of Property Unit Trust Management Companies and is represented on the board of SAPOA.
GovernmentThe Fund engages with Government on a number of levels including its ongoing discussions with the National Treasury in respect of the REIT legislation and the Department of Public Works with regard to the Property Sector Transformation Charter. The Fund also engages regularly with the FSB on industry matters.
econoMic iMPActTransformationThe Fund is committed to empowering historically disadvantaged South Africans and considers this as an imperative to model corporate citizenship. The underlying principles which define the STREM board’s transformation agenda, and relating specifically to BEE ownership are as follows:• Transferring ownership of land to people who were previously
denied access to land through discriminatory policy and legislation.
• Empowering previously disadvantaged individuals in order to redress the imbalances of the past.
• Achieving a change in the racial and gender composition of ownership, control and management within the property sector.
The Property Sector Charter entered into between representatives of the South African property industry and the Department of Public Works lists these reasons among its
objectives and the directors believe that the BEE shareholding is an important step in achieving the targets as set out in the Charter.
The empowerment credentials of the Fund and the management company were verified by Empowerdex for the first time during the year. The findings will form the baseline for both entities to set targets and start monitoring progress towards these targets in order to improve their performance on each aspect of the BBBEE scorecard. Emira Property Fund and STREM were rated at a Level 7 and Level 6 respectively in terms of the Department of Trade and Industry’s Codes of Good Practice. Having achieved a good performance on the ownership, employment equity and procurement aspects of the scorecard, both Emira and STREM are reviewing their skills development to enhance their ratings in the future.
Emira Property Fund’s BEE holding in its PIs is 12,5%. The shareholders include the following:
The Tiso Group (Pty) Limited Tiso is a leading black-owned, controlled and managed investment company investing in infrastructure and engineering, power, resources, industrial services, property and investments, employing in excess of 20 individuals with a diverse but complementary set of business and entrepreneurial skills. Tiso is predominantly controlled by its management and staff (54,1%) and the Tiso Foundation (18,27%), a registered public benefit organisation created for the purpose of ensuring broad-based equity participation in Tiso beyond that of its employees. Other
OFS “Winter Warmer” Blanket Project
Golden Oldies at Wonderpark Shopping Centre
Relocated monument of the Nederlandse Stigting

Page 42
Annual Report 2010 Emira Property Fund
Sustainability (continued)
shareholders include Investec, Standard Bank and RMB (26,86%). Tiso is headed up by Nkululeko Sowazi and David Adomakoh. Tiso is the single largest shareholder in Idwala Industrial Holdings, while holding significant equity stakes in Aveng Limited, AECI, Exxaro, Alstom, Investec, ACT, Emira and Eris.
The Shalamuka FoundationThe Shalamuka Foundation (“Shalamuka”) is a trust registered to create sustainable long-term funding for the Penreach Whole School Development Programme (“Penreach”). Its inclusion as a BEE PI holder in the Emira Property Fund creates sustainable long-term support and funding for the school-based outreach programme.
For further information relating to Shalamuka see page 43.
Avuka Investments (Pty) LimitedAvuka is a black-controlled company established in 2005. The company is wholly owned by the following black women:• Dr Lulu Gwagwa: ex-Deputy Director General in the
Department of Public Works and a non-executive director on the boards of FirstRand, the Development Bank of Southern Africa (“DBSA”) , Sun International Limited and Massmart.
• Ms Nocawe Makiwane: ex Portfolio manager at Stanlib Asset Management. Currently she serves as a non-executive director of National Housing Finance Corporation (“NHFC”), Advantage Asset Management, AM Mfolozi Group Holdings companies, Xau Investments (Pty) Limited, Women In Capital Growth (Pty) Limited, Pacific Breeze Trading (Pty) Limited and Strate Limited.
• Ms Nhlanhla Mjoli Mncube: CEO of Mjoli Development Company. Obtained her Masters degree in city and regional planning from the University of Cape Town and a Certificate in Technology from Warwick University (UK). In addition, she obtained a fellowship at Massachusetts Institute of Technology (USA), a Senior Executive Certificate from Harvard University (USA) and a Certificate in Finance from Wharton School of Business. Non-executive director of the following companies: Capitec Bank Holdings Limited, Pioneer Foods, Tongaat Hulett and Cadiz Holdings.
Mr Ben van der RossMr Ben van der Ross is the Chairman of STREM. Mr Van der Ross also serves on the boards of FirstRand, Naspers, Distell, Lewis Stores, Pick n Pay, and on those of various unlisted companies.
The RMBP Broad-Based Empowerment TrustIn terms of the existing contracts between STREM and Eris Property Group, all asset and property management functions are currently outsourced to STREM and Eris Property Group, a
Level 5 contributor. Eris and STREM employ approximately 113 black individuals, many of whom are responsible for the administration of the Fund and the day-to-day management on properties owned by Emira. The PIs issued in terms of the BEE transaction have been, and will be, utilised to retain and incentivise existing black employees and to attract future black executives.
Indirect impactEmira, through its 167 properties, supports a large number of people who are employed either by Eris or by the tenants of these properties. Emira has therefore had a significant beneficial impact on the lives of these people by providing them a high quality and safe workplace.
enViRonMentAl iMPActNotwithstanding the Emira Property Fund’s classification as having a low environmental impact, the STREM directors acknowledge the importance of adopting sustainable environmental business practices to minimise the impact of the Fund’s activities on all stakeholder groups.
In support of the environmental policy which was approved in 2009, the Fund continued the pilot study initiated in 2009 to evaluate its options to minimise the existing carbon footprint of existing properties in an economically viable manner.
Emira engaged with external consultants to evaluate an existing office property for greening opportunities including reducing the energy and water consumption, minimising the property’s impact on the environment and improving the indoor quality for occupants which included a full sustainability audit of the property. The findings of the audit identified opportunities to reduce environmental impacts without capital investments as well as identifying potential investments to sustainably reduce its carbon footprint. The Fund is considering its options with regard to its industrial portfolio.
Having conducted this successful pilot, Emira has however maintained its conservative stance to making its buildings greener. It has to date opted for operational initiatives rather than incurring extensive capital expenditure, except where required by its tenants. These include supporting awareness campaigns to conserve water and reduce power consumption. The Fund also engaged the services of a specialist environmental consultancy to encourage its tenants to adopt energy saving activities such as using low voltage light bulbs. The initiative was piloted at an office property in the Johannesburg CBD but the uptake among tenants was disappointing. This demonstrated

Page 43
Annual Report 2010 Emira Property Fund
that tenants are unwilling to outlay cash to reduce their power costs, even if long-term benefits exist. Accordingly, Emira is re-evaluating its approach to greening its properties. This could involve future capital spending to lower the environmental impact of its properties with a view to sharing the long-term benefits between the landlord and the tenants.
While the Fund continues to evaluate proposals and to develop its strategy to reduce the environmental impact of its property portfolio, it always remains cognisant that the Fund’s long-term economic viability should not be compromised by extensive investments to enhance the environmental sustainability of its properties.
SociAl iMPActHealth and safetyThe Emira Property Fund’s health and safety policy complies with the Occupational Health and Safety Act No 85 of 1993 (“the Act”) and other relevant legislation, regulations and codes of practice for South Africa. It aims to prevent and minimise work-related and health impairments by applying international best practice and ensuring that all employees are supplied with adequate training and supervision for the role they undertake. The Fund, through its property management company, Eris, strives to continuously improve its Occupational Health and Safety progress which is monitored and regularly reported to the STREM board of directors.
This year management took the initiative to engage with a leading information solution provider, LexisNexis, to verify the level of its compliance with the Act with regards to its policy.
In line with its priority to ensure that efficient evacuation drills were in place, the Fund continued to implement these nationally at all its properties. Employees continued to be educated to heighten their awareness of risks.
Individual and company responsibilities were communicated to avoid and deal with any crises. Tenants are continually reminded of their OHS responsibilities. All tenants receive an Eris OHS manual as well as an Eris “House Rule” guide.
Social initiativesAs a Collective Investment Scheme in Property, Emira is precluded from making direct corporate social investments by the Collective Investments Schemes Control Act. However, as a shareholder in the Emira Property Fund, involvement with Shalamuka is regarded as an indirect CSI initiative.
The Fund also uses its infrastructure to benefit society and the communities around its shopping centres. Within Emira’s extensive retail portfolio is a rural property portfolio of 15 shopping centres which are located in outlying areas that do not have large regional shopping centres. Many local inhabitants’ lives are improved by having good retail facilities in close proximity to their homes. Through its properties, Emira has also played a role in uplifting local business by providing good facilities from which local business people can conduct and grow their businesses.
Emira has indirectly contributed to several initiatives in the community through the retail centres that it owns and manages:• The Randridge Mall hosted the FORA Awareness Day for the
Friends of Rescued Animals at the shopping centre in July 2010. Cash and goods were donated to the charity including donations of pet foods. The event also helped to enhance awareness of this worthy cause.
• The Wonderpark Shopping Centre hosted the “Love to live, Love to be there!” initiative to raise funds for a toddler diagnosed with Hutchinson-Gilford Progeria syndrome, a rare genetic condition wherein symptoms resembling aspects of ageing are manifested at an early age. The child’s parents are frequent shoppers at the centre and R30 000 was raised over 30 days towards the cost of travelling abroad to engage in trial tests to find a cure for the condition.
• During the 1950s the City of Pretoria erected a monument next to the Tramshed to commemorate the role of the Dutch Community in developing the City’s transport system. When the monument which was built in the form of a fountain fell into disrepair over time Emira approached the Dutch community, Stigting Nederlanders, to relocate the monument to a more suitable location and together they identified a site in Muckleneuk. As a result of having relocated the monument to this more suitable location, with Emira having contributed to the costs, it was able to enlarge the Tramshed Pick n Pay by 800 m².
Community involvementOne of the beneficiaries of Emira’s BEE transactions in 2006 and 2007 is the Shalamuka Foundation (“Shalamuka”), a trust formed in 2006 to raise long-term, sustainable funding for educational development in South Africa.
As a Collective Investment Scheme in Property, Emira is precluded from making direct corporate social investments by the Collective Investments Schemes Control Act. However, as a PI holder in the Emira Property Fund, participation by Shalamuka in its BEE transactions is regarded as an indirect CSI initiative.

Page 44
Annual Report 2010 Emira Property Fund
Sustainability (continued)
Shalamuka acts solely as the funding vehicle for the highly regarded Penreach Whole School Development Programme (“Penreach”). Penreach is a non-profit, skills development programme that strives to improve the teaching skills of qualified and unqualified teachers and their schools in Mpumalanga and the surrounding areas. It has resulted in the upliftment of local communities through improved in education and the quality of schools, and has received numerous awards in recognition of its work and results. The mission statement of Penreach is “To improve the quality and accessibility of education in underresourced schools in black rural communities”. Penreach is striving to create functional, efficient schools where future generations of young people can acquire the skills they will need to take South Africa to new heights as a nation.
Penreach holds weekly workshops that provide skills training to teachers. Workshops are supplemented by regular visits to rural schools by experienced fieldworkers, and tutorial workshops are offered to mathematics and science learners and their educators.
The programme’s focus areas include the following:• Pre-primary school educators;• Primary school educators;• High school educators (with a focus on mathematics and
science development);• School governing bodies;• School management teams, including mentorship to school
principals;• Tutorial lessons for Grade 10, 11 and 12 mathematics and
science learners; and• Early childhood development National Qualifications
Framework (“NQF”) courses.
Penreach began working with 40 teachers from 10 schools in 1994. It has grown exponentially since then and now reaches
more than 2 000 teachers a year, representing over 900 schools. It is estimated that over 350 000 learners from rural areas benefit from Penreach annually. Beneficiaries are 100% black; more than 90% are women and over 50% are rural-dwelling.
Shalamuka participates in BEE deals and other investment opportunities in order to create long-term investments that will provide sufficient funds to sustain Penreach on an annual basis and allow room for planning, growth and important research. This will increase the number of educators, and consequently learners who can be reached, thereby improving their standard of education.
It is the profound belief of the Shalamuka trustees that South Africa will benefit from widespread, improved education.
The Shalamuka trustees are respected members of the business community and have impressive socio-economic development track records. Some 85% of the trustees are black South Africans and 71% are black women. The Shalamuka trustees are volunteers and do not benefit economically in any way from Shalamuka or Penreach.
Shalamuka has Empowerdex certification, scoring maximum points. It is 100% compliant as a broad-based organisation, as per the 2007 Department of Trade and Industry Codes, and it significantly enhances the CSI/BEE scorecard of investee companies.
Shalamuka has successfully participated in a number of BEE transactions to date. These include Emira Property Fund; Hulamin (Pty) Limited; Shalamuka Capital/RMB Corvest; Brimstone Investment Corporation Limited; Sasol Inzalo; Barloworld Limited and PPC Limited. Shalamuka has access to funding at favourable rates.

Page 45
Annual Report 2010 Emira Property Fund
Hyde Park Lane
Annual financial statementsfor the year ended 30 June 2010
contentsemira Property Fund
statement of directors’ responsibilities 46Approval of annual financial statements 46
Report of the independent auditor 47Report of the trustee 47
statements of comprehensive income 48statements of financial position 49
statements of cash flows 50statements of changes in equity 51
notes to the financial statements 52– Participatory interest holders’ analysis
– Property listing
strategic Real estate Managers (Pty) Limited 97notice of annual general meeting 108
Administration information 110Form of proxy 111
Deloitte

Page 46
Annual Report 2010 Emira Property Fund
Statement of directors’ responsibilities
Approval of annual financial statements
The directors of STREM are responsible for the preparation, integrity, and fair presentation of the financial statements of the Fund. The financial statements presented on pages 48 to 96 have been prepared in accordance with International Financial Reporting Standards (“IFRS”), and include amounts based on judgements and estimates made by management.
The directors consider that in preparing the financial statements they have used the most appropriate accounting policies, consistently applied and supported by reasonable and prudent judgements and estimates, and that all statements of International Financial Reporting Standards that they consider to be applicable have been followed.
The directors are satisfied that the information contained in the financial statements fairly presents the results of operations for the period and the financial position of the Fund at year-end. The directors also prepared the other information included in the report and are responsible for both its accuracy and its consistency with the financial statements.
The directors have responsibility for ensuring that accounting records are kept. The accounting records should disclose with reasonable accuracy the financial position of the Fund to enable the directors to ensure that the financial statements comply with the relevant legislation.
The Fund operated in a well-established control environment, which is well documented and regularly reviewed. This incorporates risk management and internal control procedures, which are designed to provide reasonable, but not absolute, assurance that assets are safeguarded and the risks facing the business, are being controlled.
The going-concern basis has been adopted in preparing the financial statements. The directors have no reason to believe that the Fund will not be a going-concern in the foreseeable future, based on forecasts and available cash resources. These financial statements support the viability of the Fund.
The Fund’s external auditor, PricewaterhouseCoopers Incorporated, audited the financial statements, and their report is presented on the next page.
BJ van der Ross JWA TempletonChairman ChiefExecutiveOfficer
The annual financial statements of the Fund, incorporating statutorily required information in respect of the Fund, for the year ended 30 June 2010 set out on pages 48 to 96 were approved by the board of directors of STREM on 30 September 2010 and are signed on its behalf by:
BJ van der Ross JWA TempletonChairman ChiefExecutiveOfficer

Page 47
Annual Report 2010 Emira Property Fund
Report of the independent auditor
InDePenDent AUDItoR’s RePoRt to tHe PARtIcIPAtoRY InteRest HoLDeRs oF eMIRA PRoPeRtY FUnDWe have audited the Group annual financial statements and annual financial statements of Emira Property Fund, which comprise the consolidated and separate statements of financial position as at 30 June 2010, and the consolidated and separate statements of comprehensive income, changes in equity and cash flows for the year then ended, and a summary of significant accounting policies and other explanatory notes, as set out on pages 48 to 96.
Directors’ responsibility for the financial statementsStrategic Real Estate Managers (Proprietary) Limited’s directors are responsible for the preparation and fair presentation of these financial statements in accordance with International Financial Reporting Standards and in the manner required by the Companies Act of South Africa. This responsibility includes: designing, implementing and maintaining internal control relevant to the preparation and fair presentation of financial statements that are free from material misstatement, whether due to fraud or error; selecting and applying appropriate accounting policies; and making accounting estimates that are reasonable in the circumstances.
Auditor’s responsibilityOur responsibility is to express an opinion on these financial statements based on our audit. We conducted our audit in accordance with International Standards on Auditing. Those standards require that we comply with ethical requirements and plan and perform the audit to obtain reasonable assurance whether the financial statements are free from material misstatement.
An audit involves performing procedures to obtain audit evidence about the amounts and disclosures in the financial statements. The procedures selected depend on the auditor’s judgement, including the assessment of the risks of material misstatement of the financial statements, whether due to fraud or error. In making those risk assessments, the auditor considers internal control relevant to the entity’s preparation and fair presentation of the financial statements in order to design audit procedures that are appropriate in the circumstances, but not for the purpose of expressing an opinion on the effectiveness of the entity’s internal control. An audit also includes evaluating the appropriateness of accounting policies used and the reasonableness of accounting estimates made by management, as well as evaluating the overall presentation of the financial statements.
We believe that the audit evidence we have obtained is sufficient and appropriate to provide a basis for our audit opinion.
opinionIn our opinion, the financial statements present fairly, in all material respects, the consolidated and separate financial position of Emira Property Fund as at 30 June 2010, and its consolidated and separate financial performance and its consolidated and separate cash flows for the year then ended in accordance with International Financial Reporting Standards and in the manner required by the Companies Act of South Africa.
PricewaterhouseCoopers Inc. Director:NMtetwaRegisteredAuditor
Johannesburg30 September 2010
Report of the Trustee for the year ended 30 June 2010
In terms of section 70(I)(f ) of the Collective Investment Schemes Control Act, No 45 of 2002
to tHe PARtIcIPAtoRY InteRest HoLDeRs oF eMIRA PRoPeRtY FUnDDuring the period as set out above during which the Collective Investment Schemes Control Act, No 45 of 2002 has been in effect the Trust has been administered in accordance with:
(i) The limitations imposed on the investment and borrowing powers of the Manager by the Act; and(ii) The provisions of the Act and the Deed.
Absa Bank LimitedTrustee
Johannesburg6 September 2010
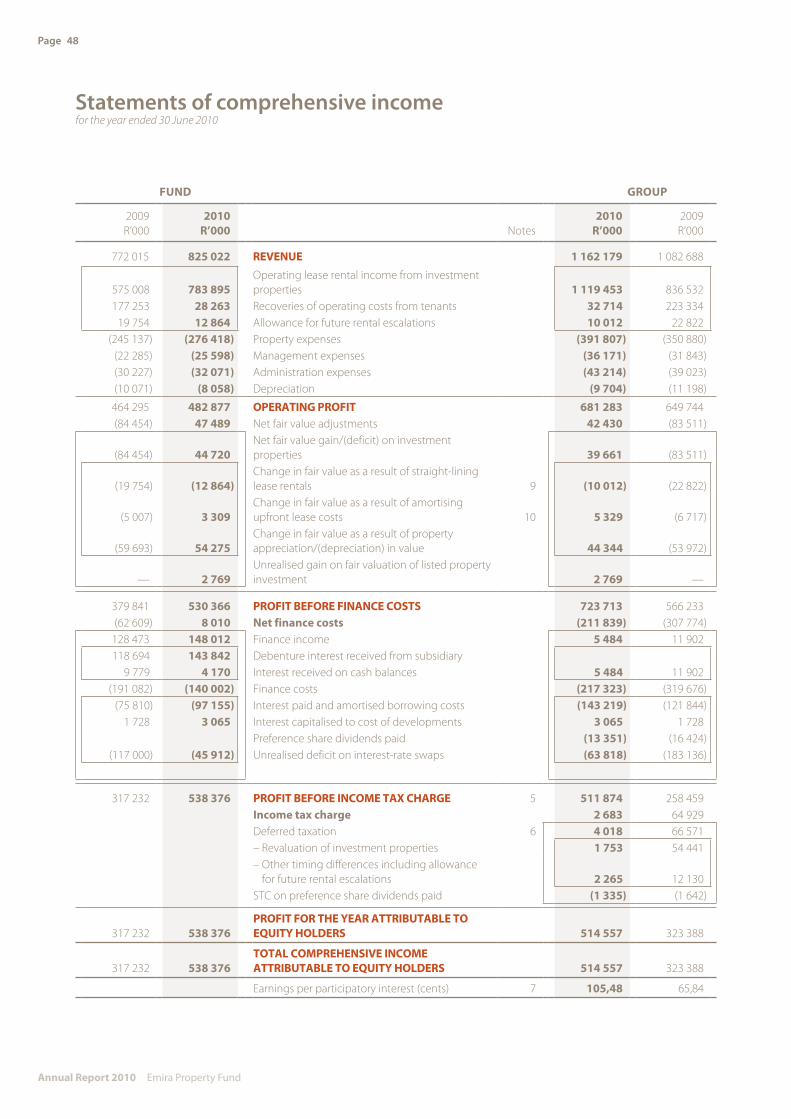
Page 48
Annual Report 2010 Emira Property Fund
Statements of comprehensive incomefor the year ended 30 June 2010
FUnD GRoUP
2009 R’000
2010 R’000 Notes
2010R’000
2009 R’000
772 015 825 022 RevenUe 1 162 179 1 082 688
575 008 783 895 Operating lease rental income from investment properties 1 119 453 836 532
177 253 28 263 Recoveries of operating costs from tenants 32 714 223 334 19 754 12 864 Allowance for future rental escalations 10 012 22 822
(245 137) (276 418) Property expenses (391 807) (350 880) (22 285) (25 598) Management expenses (36 171) (31 843) (30 227) (32 071) Administration expenses (43 214) (39 023) (10 071) (8 058) Depreciation (9 704) (11 198)
464 295 482 877 oPeRAtInG PRoFIt 681 283 649 744 (84 454) 47 489 Net fair value adjustments 42 430 (83 511)
(84 454) 44 720 Net fair value gain/(deficit) on investment properties 39 661 (83 511)
(19 754) (12 864)Change in fair value as a result of straight-lining lease rentals 9 (10 012) (22 822)
(5 007) 3 309 Change in fair value as a result of amortising upfront lease costs 10 5 329 (6 717)
(59 693) 54 275 Change in fair value as a result of property appreciation/(depreciation) in value 44 344 (53 972)
— 2 769 Unrealised gain on fair valuation of listed property investment 2 769 —
379 841 530 366 PRoFIt beFoRe FInAnce costs 723 713 566 233 (62 609) 8 010 net finance costs (211 839) (307 774)
128 473 148 012 Finance income 5 484 11 902 118 694 143 842 Debenture interest received from subsidiary
9 779 4 170 Interest received on cash balances 5 484 11 902 (191 082) (140 002) Finance costs (217 323) (319 676)
(75 810) (97 155) Interest paid and amortised borrowing costs (143 219) (121 844) 1 728 3 065 Interest capitalised to cost of developments 3 065 1 728
Preference share dividends paid (13 351) (16 424) (117 000) (45 912) Unrealised deficit on interest-rate swaps (63 818) (183 136)
317 232 538 376 PRoFIt beFoRe IncoMe tAx cHARGe 5 511 874 258 459 Income tax charge 2 683 64 929 Deferred taxation 6 4 018 66 571 – Revaluation of investment properties 1 753 54 441 – Other timing differences including allowance
for future rental escalations 2 265 12 130 STC on preference share dividends paid (1 335) (1 642)
317 232 538 376 PRoFIt FoR tHe YeAR AttRIbUtAbLe to eqUItY HoLDeRs 514 557 323 388
317 232 538 376 totAL coMPReHensIve IncoMe AttRIbUtAbLe to eqUItY HoLDeRs 514 557 323 388
Earnings per participatory interest (cents) 7 105,48 65,84
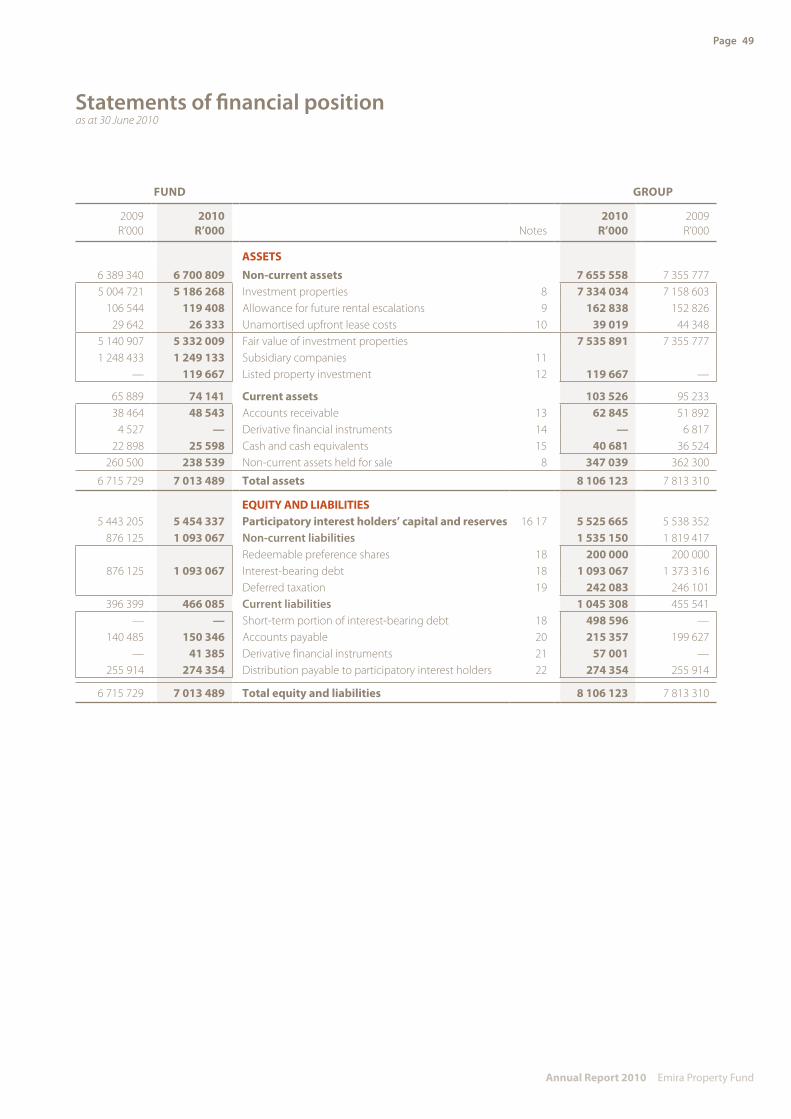
Page 49
Annual Report 2010 Emira Property Fund
Statements of financial positionas at 30 June 2010
FUnD GRoUP
2009 R’000
2010 R’000 Notes
2010R’000
2009 R’000
Assets 6 389 340 6 700 809 non-current assets 7 655 558 7 355 777 5 004 721 5 186 268 Investment properties 8 7 334 034 7 158 603
106 544 119 408 Allowance for future rental escalations 9 162 838 152 826 29 642 26 333 Unamortised upfront lease costs 10 39 019 44 348
5 140 907 5 332 009 Fair value of investment properties 7 535 891 7 355 777 1 248 433 1 249 133 Subsidiary companies 11
— 119 667 Listed property investment 12 119 667 —
65 889 74 141 current assets 103 526 95 233 38 464 48 543 Accounts receivable 13 62 845 51 892
4 527 — Derivative financial instruments 14 — 6 817 22 898 25 598 Cash and cash equivalents 15 40 681 36 524
260 500 238 539 Non-current assets held for sale 8 347 039 362 300
6 715 729 7 013 489 total assets 8 106 123 7 813 310
eqUItY AnD LIAbILItIes 5 443 205 5 454 337 Participatory interest holders’ capital and reserves 16 17 5 525 665 5 538 352
876 125 1 093 067 Non-current liabilities 1 535 150 1 819 417 Redeemable preference shares 18 200 000 200 000
876 125 1 093 067 Interest-bearing debt 18 1 093 067 1 373 316 Deferred taxation 19 242 083 246 101
396 399 466 085 Current liabilities 1 045 308 455 541 — — Short-term portion of interest-bearing debt 18 498 596 —
140 485 150 346 Accounts payable 20 215 357 199 627 — 41 385 Derivative financial instruments 21 57 001 —
255 914 274 354 Distribution payable to participatory interest holders 22 274 354 255 914
6 715 729 7 013 489 total equity and liabilities 8 106 123 7 813 310

Page 50
Annual Report 2010 Emira Property Fund
Statements of cash flowsfor the year ended 30 June 2010
FUnD GRoUP
2009 R’000
2010 R’000 Notes
2010R’000
2009 R’000
cAsH FLows FRoM oPeRAtInG ActIvItIes 468 062 481 162 Cash generated from operations 22 691 269 664 501 128 473 148 012 Finance income 5 484 11 902 (75 810) (97 155) Interest paid (143 219) (121 844)
Preference share dividends paid (13 351) (16 424) Taxation paid 22 (1 523) (1 228)
(473 086) (508 804) Distribution to participatory interest holders 22 (508 804) (473 086)
47 639 23 215 net cash generated from operating activities 29 856 63 821
cAsH FLows FRoM InvestInG ActIvItIes (251 768) (128 572) Acquisition of investment properties (133 427) (302 963)
(4 310) (3 476) Acquisition of fixtures and fittings (5 910) (8 149) 20 914 12 189 Proceeds on disposal of investment properties 12 189 20 914
115 — Proceeds on disposal of fixtures and fittings — 115 70 554 (700) Loan to subsidiary
— (116 898) Acquisition of investment in listed property fund (116 898) —
(164 495) (237 457) net cash utilised in investing activities (244 046) (290 083)
cAsH FLows FRoM FInAncInG ActIvItIes (52 151) — Repurchase of participatory interests — (52 151)
134 707 216 942 Increase in interest-bearing debt 218 347 246 112
82 556 216 942 net cash generated from financing activities 218 347 193 961
(34 300) 2 700 net IncReAse/(DecReAse) In cAsH AnD cAsH eqUIvALents 4 157 (32 301)
57 198 22 898 Cash and cash equivalents at the beginning of the year 36 524 68 825
22 898 25 598 cash and cash equivalents at the end of the year 40 681 36 524

Page 51
Annual Report 2010 Emira Property Fund
Statements of changes in equityfor the year ended 30 June 2010
Partici-patory
interestR’000
Fair valuereserve
R’000
otherreserve
R’000
Retainedearnings
R’000total
R’000
GRoUP 2009Balance at 1 July 2008 3 563 635 2 297 012 (98 262) (1 345) 5 761 040 Total comprehensive income for the year — — — 323 388 323 388 Distribution to participatory interest holders — — — (493 925) (493 925)Repurchase of participatory interests (52 151) — — — (52 151)Transfer to fair value reserve (net of deferred taxation) — (170 537) — 170 537 —
Balance at 30 June 2009 3 511 484 2 126 475 (98 262) (1 345) 5 538 352
2010Balance at 1 July 2009 3 511 484 2 126 475 (98 262) (1 345) 5 538 352 Total comprehensive income for the year — — — 514 557 514 557 Distribution to participatory interest holders — — — (527 244) (527 244)Transfer to fair value reserve (net of deferred taxation) — (12 687) — 12 687 —
balance at 30 June 2010 3 511 484 2 113 788 (98 262) (1 345) 5 525 665
FUnD 2009Balance at 1 July 2008 3 563 635 2 208 187 (98 262) (1 511) 5 672 049 Total comprehensive income for the year — — — 317 232 317 232 Distribution to participatory interest holders — — — (493 925) (493 925)Repurchase of participatory interests (52 151) — — — (52 151)Transfer to fair value reserve (net of deferred taxation) — (176 693) — 176 693 —
Balance at 30 June 2009 3 511 484 2 031 494 (98 262) (1 511) 5 443 205
2010Balance at 1 July 2009 3 511 484 2 031 494 (98 262) (1 511) 5 443 205 Total comprehensive income for the year — — — 538 376 538 376 Distribution to participatory interest holders — — — (527 244) (527 244)Transfer to fair value reserve (net of deferred taxation) — 11 132 — (11 132) —balance at 30 June 2010 3 511 484 2 042 626 (98 262) (1 511) 5 454 337
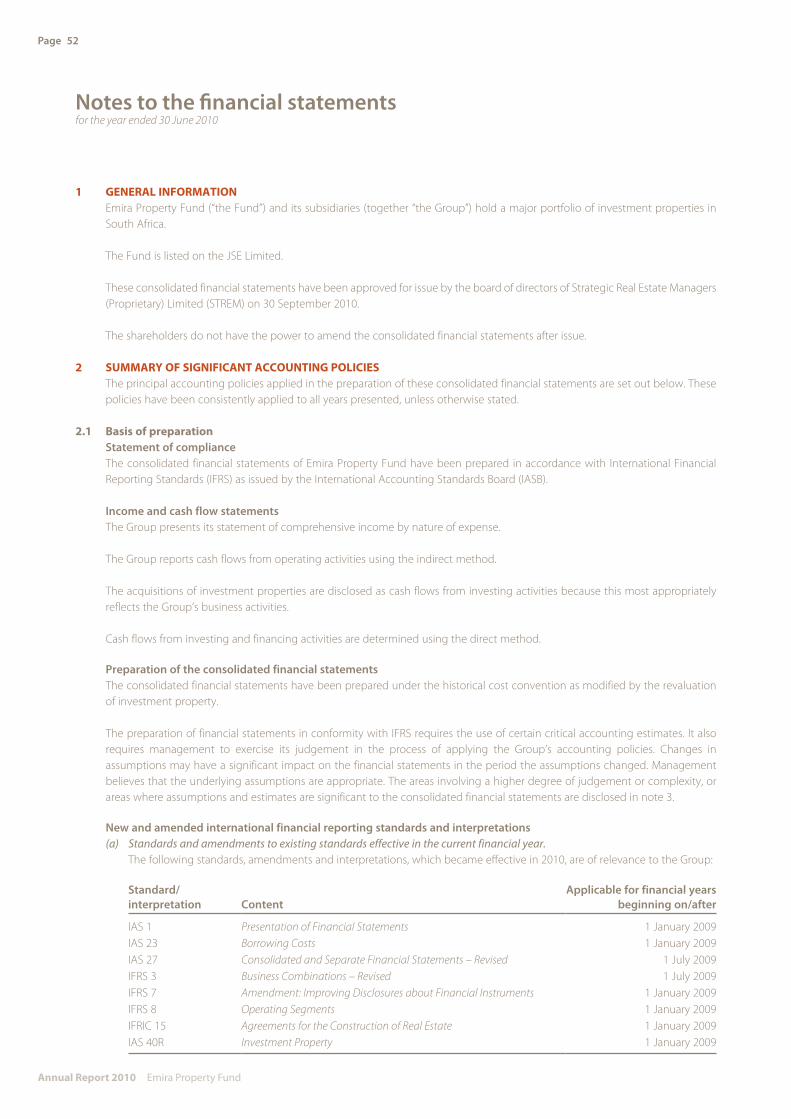
Page 52
Annual Report 2010 Emira Property Fund
Notes to the financial statementsfor the year ended 30 June 2010
1 GeneRAL InFoRMAtIon Emira Property Fund (“the Fund”) and its subsidiaries (together “the Group”) hold a major portfolio of investment properties in
South Africa.
The Fund is listed on the JSE Limited.
These consolidated financial statements have been approved for issue by the board of directors of Strategic Real Estate Managers (Proprietary) Limited (STREM) on 30 September 2010.
The shareholders do not have the power to amend the consolidated financial statements after issue.
2 sUMMARY oF sIGnIFIcAnt AccoUntInG PoLIcIes The principal accounting policies applied in the preparation of these consolidated financial statements are set out below. These
policies have been consistently applied to all years presented, unless otherwise stated.
2.1 basis of preparation Statement of compliance The consolidated financial statements of Emira Property Fund have been prepared in accordance with International Financial
Reporting Standards (IFRS) as issued by the International Accounting Standards Board (IASB).
Income and cash flow statements The Group presents its statement of comprehensive income by nature of expense.
The Group reports cash flows from operating activities using the indirect method.
The acquisitions of investment properties are disclosed as cash flows from investing activities because this most appropriately reflects the Group’s business activities.
Cash flows from investing and financing activities are determined using the direct method.
Preparation of the consolidated financial statements The consolidated financial statements have been prepared under the historical cost convention as modified by the revaluation
of investment property.
The preparation of financial statements in conformity with IFRS requires the use of certain critical accounting estimates. It also requires management to exercise its judgement in the process of applying the Group’s accounting policies. Changes in assumptions may have a significant impact on the financial statements in the period the assumptions changed. Management believes that the underlying assumptions are appropriate. The areas involving a higher degree of judgement or complexity, or areas where assumptions and estimates are significant to the consolidated financial statements are disclosed in note 3.
New and amended international financial reporting standards and interpretations (a) Standardsandamendmentstoexistingstandardseffectiveinthecurrentfinancialyear. The following standards, amendments and interpretations, which became effective in 2010, are of relevance to the Group:
Standard/interpretation Content
Applicable for financial years beginning on/after
IAS 1 Presentation of Financial Statements 1 January 2009IAS 23 Borrowing Costs 1 January 2009IAS 27 Consolidated and Separate Financial Statements – Revised 1 July 2009IFRS 3 Business Combinations – Revised 1 July 2009IFRS 7 Amendment: Improving Disclosures about Financial Instruments 1 January 2009IFRS 8 Operating Segments 1 January 2009IFRIC 15 Agreements for the Construction of Real Estate 1 January 2009IAS 40R Investment Property 1 January 2009

Page 53
Annual Report 2010 Emira Property Fund
IAS 1 Presentation of Financial Statements A revised version of IAS 1 was issued in September 2007. The revised standard prohibits the presentation of items of income
and expenses (that is, ‘non-owner changes in equity’) in the statement of changes in equity, requiring ‘non-owner changes in equity’ to be presented separately from owner changes in equity in a statement of comprehensive income. As a result, the Group presents in the consolidated statement of changes in equity all owner changes in equity; all non-owner changes in equity are presented in the consolidated statement of comprehensive income. The adoption of this revised standard impacts only presentation aspects; therefore, it has no impact on profit or earnings per participatory interest.
IAS 23 Borrowing Costs A revised version was issued in March 2007. Under the revised standard, an entity is required to capitalise borrowing costs
directly attributable to the acquisition, construction or production of a qualifying asset (one that takes a substantial period of time to get ready for use or sale) as part of the cost of that asset. The option of immediately expensing those borrowing costs was removed. The capitalisation is required for qualifying assets for which the commencement date for capitalisation is on or after 1 January 2009. The Group has already been applying this standard.
Amendment: IFRS 7 Improving Disclosures about Financial Instruments The IASB published amendments to IFRS 7 in March 2009. The amendment requires enhanced disclosures about fair value
measurements and liquidity risk. In particular, the amendment requires disclosure of fair value measurements by level of a three-level fair value measurement hierarchy. In addition to that, the amendment clarifies that the maturity analysis of liabilities should include issued financial guarantee contracts at the maximum amount of the guarantee in the earliest period in which the guarantee could be called; and secondly requires disclosure of remaining contractual maturities of financial derivatives if the contractual maturities are essential for an understanding of the timing of the cash flows. The entity has to disclose a maturity analysis of financial assets it holds for managing liquidity risk, if that information is necessary to enable users of its financial statements to evaluate the nature and extent of liquidity risk. The adoption of the amendment results in additional disclosures but does not have an impact on profit or earnings per PI.
IFRS 8 Operating Segments IFRS 8 replaces IAS 14 Segment Reporting, and is effective for annual periods beginning on or after 1 January 2009. The new
standard requires a ‘management approach’, under which segment information is presented on a similar basis to that used for internal reporting purposes. There were no changes made to the segments that are reported on by the Group.
IAS 40 Investment Property, amendment (and consequential amendment to IAS 16 Property, Plant and Equipment) The amendments are part of the IASB’s annual improvements project published in May 2008 and are effective from 1 January
2009. Property that is under construction or development for future use as investment property is brought within the scope of IAS 40. Where the fair value model is applied, such property is measured at fair value. However, where fair value of investment property under construction is not reliably determinable, the property is measured at cost until the earlier of the date construction is completed and the date at which fair value becomes reliably measurable. As the Group does not have any property under construction, there were no effects of adoption.
Improvements to IFRS (issued in May 2008) The improvements project contains numerous amendments to IFRS that the IASB considers non-urgent but necessary.
“Improvements to IFRS” comprise amendments that result in accounting changes for presentation, recognition or measurement purposes, as well as terminology or editorial amendments related to a variety of individual IFRS standards. Most of the amendments are effective for annual periods beginning on or after 1 January 2009. No material changes to accounting policies arose as a result of these amendments except to the amendments to IAS 40 Investment Property (see above). The revision will not affect results as the current accounting policy is consistent with the revised standard.
IAS 27 Consolidated and Separate Financial Statements – Revised IAS 27 (revised) requires the effects of all transactions with non-controlling interests to be recorded in equity if there is no
change in control and they will no longer result in goodwill or gains and losses. The standard also specifies when control is lost any remaining interest in the entity is remeasured to fair value and a gain or loss is recognised in profit or loss.
Page 54
Annual Report 2010 Emira Property Fund
Notes to the financial statements (continued)for the year ended 30 June 2010
IFRS 3 Business Combinations – Revised The new standard continues to apply the acquisition method to business combinations, with some significant changes for
example, all payments to purchase a business are to be recorded at fair value at the acquisition date, with some contingent payments subsequently remeasured at fair value through income. Goodwill may be calculated based on the parent’s share of net assets or it may include goodwill related to the minority interest. All transaction costs will be expensed.
(b) InterpretationsandamendmentstostandardsbecomingeffectiveinthecurrentfinancialyearbutnotrelevanttotheGroup.
Standard/interpretation Content
Applicable for financial years beginning on/after
IAS 32 and IAS 1 Puttable Financial Instruments and Obligations arising on Liquidation 1 January 2009
IAS 39*Financial Instruments: Recognition and Measurement – Eligible Hedged Items 1 July 2009
IFRS 1 and IAS 27Cost of an Investment in a Subsidiary, Jointly-controlled Entity or Associate 1 January 2009
IFRS 1* First-time Adoption of International Financial Reporting Standards 1 July 2009IFRS 2 Share-based Payments – Vesting Conditions and Cancellations 1 January 2009IFRIC 13 Customer Loyalty Programmes 1 July 2008IFRIC 16 Hedges of a Net Investment in a Foreign Operation 1 October 2008 IFRIC 17 Distribution of Non-cash Assets to Owners 1 July 2009IFRIC 18 Transfers of Assets from Customers 1 July 2009
(c) Standards,amendmentsandinterpretationsthatarenotyeteffectiveandnotexpectedtohavesignificantimpactontheGroup’sfinancialstatements.
Standard/interpretation Content
Applicable for financial years beginning on/after
Amendment: IFRS 1* Additional Exemptions for First-time Adopters 1 July 2010IFRIC 19* Extinguishing Financial Liabilities with Equity Instruments 1 July 2010IFRS 9 Financial Instruments: Classification and Measurement 1 January 2013IAS 24* Related Party Disclosures 1 January 2011IAS 32* Classification of Rights Issues 1 February 2010Amendment: IFRS 2* Group Cash-settled Share-based Payment TransactionsAmendment: IFRIC 14* Prepayments of Minimum Funding Requirements 1 January 2011
*Not expected to be relevant to the Group.
IFRS 9 Financial Instruments: Classification and Measurement In November 2009, the board issued the first part of IFRS 9 relating to the classification and measurement of financial assets.
IFRS 9 will ultimately replace IAS 39. The standard requires an entity to classify its financial assets on the basis of the entity’s business model for managing the financial assets and the contractual cash flow characteristics of the financial asset, and subsequently measures the financial assets as either at amortised cost or fair value. The new standard is mandatory for annual periods beginning on or after 1 January 2013.
Improvements to IFRS (issued in April 2009) The improvements project contains numerous amendments to IFRS that the IASB considers non-urgent but necessary.
“Improvements to IFRS” comprise amendments that result in accounting changes for presentation, recognition or measurement purposes, as well as terminology or editorial amendments related to a variety of individual IFRS standards. Most of the amendments are effective for annual periods beginning on or after 1 January 2010 respectively, with earlier application permitted. No material changes to accounting policies are expected as a result of these amendments.
(d) Earlyadoptionofstandards In 2010, the Group did not early adopt any new or amended standards and do not plan to early adopt any of the standards
issued not yet effective.

Page 55
Annual Report 2010 Emira Property Fund
2.2 consolidation Subsidiaries are all entities (including special purpose entities) over which the Group has the power to govern the financial and
operating policies generally accompanying a shareholding of more than one half of the voting rights. The existence and effect of potential voting rights that are currently exercisable or convertible are considered when assessing whether the Group controls another entity.
Joint control is the contractually agreed sharing of control over an economic activity. There are no jointly controlled entities within the Group.
An associate is an entity, including an unincorporated entity such as a partnership, over which the investor has significant influence and that is neither a subsidiary nor an interest in a joint venture. No consolidated entity holds interests in any associate.
Subsidiaries are fully consolidated from the date on which control is transferred to the Group. They are de-consolidated from the date that control ceases.
Accounting for business combinations under IFRS 3 only applies if it is considered that a business has been acquired.
Under IFRS 3 Business Combinations, a business is defined as an integrated set of activities and assets conducted and managed for the purpose of providing a return to investors or lower costs or other economic benefits directly and proportionately to policyholders or participants. A business generally consists of inputs, processes applied to those inputs, and resulting outputs that are, or will be, used to generate revenues. In the absence of such criteria, a group of assets is deemed to have been acquired. If goodwill is present in a transferred set of activities and assets, the transferred set is presumed to be a business.
For acquisitions meeting the definition of a business, the purchase method of accounting is used. The cost of an acquisition is measured as the fair value of the assets given, equity instruments issued and liabilities incurred or assumed at the date of exchange, plus costs directly attributable to the acquisition.
Identifiable assets acquired and liabilities and contingent liabilities assumed in a business combination are measured initially at their fair values at the acquisition date, irrespective of the extent of any minority interest. The excess of the cost of acquisition over the fair value of the Group’s share of the identifiable net assets acquired is recorded as goodwill. If the cost of acquisition is less than the fair value of the Group’s share of the net assets acquired, the difference is recognised directly in the profit or loss for the year as negative goodwill.
For acquisitions not meeting the definition of a business, the Group allocates the cost between the individual identifiable assets and liabilities in the Group based on their relative fair values at the date of acquisition. Such transactions or events do not give rise to goodwill.
All the Group companies have 30 June as their year-end. Consolidated financial statements are prepared using uniform accounting policies for like transactions. Accounting policies of subsidiaries have been changed where necessary to ensure consistency with the policies adopted by the Group.
Intercompany transactions, balances and unrealised gains on transactions between Group companies are eliminated. Unrealised losses are also eliminated unless the transaction provides evidence of an impairment of the asset transferred.
The Group applies a policy of treating transactions with minority interests as transactions with parties external to the Group. Minority interests represent the portion of profit and net assets not held by the Group. They are presented separately in the statement of comprehensive income and in the consolidated statement of financial position separately from the amounts attributable to the owners of the parent. At year-end, no minority interest exists.

Page 56
Annual Report 2010 Emira Property Fund
Notes to the financial statements (continued)for the year ended 30 June 2010
2.3 operating segments Operating segments are reported in a manner consistent with the internal reporting provided to the chief operating decision
maker. The chief operating decision maker is the person or group that allocates resources to and assesses the performance of the operating segments of an entity. The Group has determined that its chief operating decision maker is the Chief Executive Officer (CEO) of the Fund.
2.4 Foreign currency translation (a) Functional and presentation currency Items included in the financial statements of each of the Group’s entities are measured using the currency of the primary
economic environment in which the entity operates (the ‘functional currency’). The consolidated financial statements are presented in South African Rand, the Fund’s functional currency and the Group’s presentation currency.
(b) Transactions and balances Foreign currency transactions are translated into the functional currency using the exchange rates prevailing at the dates of
the transactions. Foreign exchange gains and losses resulting from the settlement of such transactions and from the translation at year-end exchange rates of monetary assets and liabilities denominated in foreign currencies are recognised in the profit or loss for the year.
Foreign exchange gains and losses that relate to borrowings and cash and cash equivalents are presented net in the statements of comprehensive income within finance income or finance costs. All other foreign exchange gains and losses are presented net in the statements of comprehensive income within other losses or gains.
2.5 Investment property Property comprising both freehold and leasehold land and buildings that is held for long-term rental yields or for capital
appreciation or both, is classified as investment property.
Borrowing costs incurred for the purpose of acquiring, developing or producing a qualifying investment property are capitalised as part of its cost. Borrowing costs are capitalised while acquisition or development is actively underway and cease once the asset is substantially complete, or suspended if the development of the asset is suspended.
After initial recognition, investment property is carried at fair value. Fair value is based on active market prices, adjusted, if necessary, for any difference in the nature, location or condition of the specific asset. If this information is not available, the Group uses alternative valuation methods, such as recent prices on less active markets or discounted cash flow projections. Valuations are performed as of the financial position date by professional valuers who hold recognised and relevant professional qualifications and have recent experience in the location and category of the investment property being valued. These valuations form the basis for the carrying amounts in the financial statements. Investment property that is being redeveloped for continuing use as investment property or for which the market has become less active continues to be measured at fair value.
Fair value measurement on property under development is only applied if the fair value is considered to be reliably measurable.
It may sometimes be difficult to determine reliably the fair value of the investment property under development. In order to evaluate whether the fair value of an investment property under development can be determined reliably, management considers the following factors, among others:
• The provisions of the development contract • The stage of completion • Whether the project/property is standard (typical for the market) or non-standard • The level of reliability of cash inflows after completion • The development risk specific to the property • Past experience with similar developments.
Page 57
Annual Report 2010 Emira Property Fund
The fair value of investment property reflects, among other things, rental income from current leases and assumptions about rental income from future leases in the light of current market conditions. The fair value also reflects, on a similar basis, any cash outflows that could be expected in respect of the property.
Subsequent expenditure is capitalised to the asset’s carrying amount only when it is probable that future economic benefits associated with the expenditure will flow to the Group and the cost of the item can be measured reliably. All other repairs and maintenance costs are expensed when incurred.
When part of an investment property is replaced, the carrying amount of the replaced part is derecognised.
The fair value of investment property does not reflect future capital expenditure that will improve or enhance the property and does not reflect the related future benefits from this future expenditure other than those a rational market participant would take into account when determining the value of the property.
Changes in fair values are recognised in the statement of comprehensive income. Investment properties are derecognised either
when they have been disposed of or when the investment property is permanently withdrawn from use and no future economic benefit is expected from its disposal.
Where the Group disposes of a property at fair value in an arm’s length transaction, the carrying value immediately prior to the sale is adjusted to the transaction price, and the adjustment is recorded in the statement of comprehensive income within net gain from fair value adjustment on investment property.
Gains or losses arising from the disposal of investment properties, being the difference between the net disposal proceeds and the carrying value, are brought to account in the determination of the net income/loss for the year. The net gains or losses are transferred from retained earnings to a fair value reserve and are not available for distribution in accordance with the Fund’s Trust Deed.
2.6 Fixtures and fittings Fixtures and fittings are stated at historical cost less accumulated depreciation and impairment charges. Cost comprises the
purchase price as well as all costs incurred in order to bring the asset to a working condition. Depreciation is calculated at cost less expected residual value on the straight-line method, which is reviewed annually. The useful lives of fixtures and fittings range between five and twenty years. Repairs and maintenance are charged to the statement of comprehensive income during the financial period in which they are
incurred.
Fixtures and fittings are linked to specific properties. Consequently, any gains or losses on disposal are incorporated with the gains or losses on the disposal of the investment property.

Page 58
Annual Report 2010 Emira Property Fund
Notes to the financial statements (continued)for the year ended 30 June 2010
2.7 Leases (a) A Group company is the lessee (i) Operatinglease Leases in which a significant portion of the risks and rewards of ownership are retained by another party, the lessor, are
classified as operating leases. Payments, including prepayments, made under operating leases (net of any incentives received from the lessor) are charged to profit or loss on a straight-line basis over the period of the lease. Properties leased out under operating leases are included in investment properties.
(ii) Financelease Leases of assets where the Group has substantially all the risks and rewards of ownership are classified as finance leases.
Finance leases are recognised at the lease’s commencement at the lower of the fair value of the leased property and the present value of the minimum lease payments.
Each lease payment is allocated between the liability and finance charges so as to achieve a constant rate on the finance balance outstanding. The corresponding rental obligations, net of finance charges, are included in current and non-current borrowings. The interest element of the finance cost is charged to the income statement over the lease period so as to produce a constant periodic rate of interest on the remaining balance of the liability for each period. Investment properties recognised under finance leases are carried at their fair value.
(b) A Group company is the lessor in an operating lease Properties leased out under operating leases are included in investment property in the statement of financial position.
(c) A Group company is the lessor – fees paid in connection with arranging leases and lease incentives The Group makes payments to agents for services in connection with negotiating lease contracts with the Group’s lessees.
The letting fees are capitalised within the carrying amount of the related investment property and amortised over the lease term.
Lease incentives are recognised as a reduction of rental income on a straight-line basis over the lease term.
2.8 Investment in subsidiaries The investment in subsidiaries is recognised at cost.
2.9 Goodwill Goodwill represents the excess of the cost of an acquisition over the fair value of the Group’s share of the net identifiable assets
of the acquired business at the date of acquisition (providing that the acquisition fulfils the definition of a business combination in accordance with IFRS 3). Goodwill is tested annually for impairment and carried at cost less accumulated impairment losses. Impairment losses on goodwill are not reversed. Gains and losses on the disposal of an entity include the carrying amount of goodwill relating to the entity sold.
Goodwill is allocated to cash-generating units for the purpose of impairment testing. The allocation is made to those cash-generating units or groups of cash-generating units that are expected to benefit from the business combination in which the goodwill arose identified according to operating segment.
The Group classifies its financial assets in the following categories: at fair value through profit or loss and loans and receivables. The classification depends on the purpose for which the financial assets were acquired. Management determines the classification of its financial assets at initial recognition.

Page 59
Annual Report 2010 Emira Property Fund
2.10 Impairment of non-financial assets Assets that have an indefinite useful life – for example, goodwill – are not subject to amortisation and are tested annually for
impairment. Assets that are subject to amortisation are reviewed for impairment whenever events or changes in circumstances indicate that the carrying amount may not be recoverable. An impairment loss is recognised for the amount by which the asset’s carrying amount exceeds its recoverable amount. The recoverable amount is the higher of an asset’s fair value less costs to sell and value in use. For the purposes of assessing impairment, assets are grouped at the lowest levels for which there are separately identifiable cash flows (cash-generating units). Non-financial assets other than goodwill that suffered impairment are reviewed for possible reversal of the impairment at each reporting date.
2.11 Financial instruments (a) Financial assets at fair value through profit or loss This category has two sub-categories: financial assets held for trading and those designated at fair value through profit or
loss at inception. A financial asset is classified as held for trading if acquired principally for the purpose of selling in the short term, if it forms part of a portfolio of financial assets in which there is evidence of short-term profit-making or if so designated by management. Derivatives are also classified as held for trading, unless they are designated as hedges.
A financial asset is designated as fair value through profit or loss because either it eliminates or significantly reduces a measurement or recognition inconsistently that would otherwise arise from measuring the asset or recognising the gains or losses on it on different bases; or a group of financial assets is managed and its performance is evaluated on a fair value basis, in accordance with a risk management or investment strategy and information about the Group is provided internally on that basis to key management personnel. Under this criterion, the main classes of financial assets designated at fair value through profit or loss by the Group are listed property investments.
Subsequently to initial recognition, these assets are measured at fair value. All related realised and unrealised gains and losses arising from changes in fair value are included in fair value gains on financial assets at fair value through profit and loss.
(b) Loans and receivables Loans and receivables are non-derivative financial assets with fixed or determinable payments that are not quoted in an
active market. They are included in current assets, except for maturities greater than 12 months after the end of the reporting period. These are classified as non-current assets. The Group’s loans and receivables comprise “accounts receivable” and cash and cash equivalents in the statement of financial position.
2.12 Recognition and measurement (a) Financial assets Regular purchases and sales of financial assets are recognised on the trade-date – the date on which the Group commits to
purchase or sell the assets. Investments are initially recognised at fair value plus transaction costs for all financial assets not carried at fair value through profit or loss. Financial assets carried at fair value through profit or loss are initially recognised at fair value, and transaction costs are expensed in the statement of comprehensive income. Financial assets are derecognised when the rights to receive cash flows from the investments have expired or have been transferred and the Group has transferred substantially all risks and rewards of ownership. Available-for-sale financial assets and financial assets at fair value through profit or loss are subsequently carried at fair value. Loans and receivables are subsequently carried at amortised cost using the effective interest method.
Gains or losses arising from changes in the fair value of the “financial assets at fair value through profit or loss” category are presented in the statement of comprehensive income within “net fair value adjustments” in the period in which they arise. Dividend income from financial assets at fair value through profit or loss is recognised in the statement of comprehensive income as part of other income when the Group’s right to receive payment is established.
Page 60
Annual Report 2010 Emira Property Fund
Notes to the financial statements (continued)for the year ended 30 June 2010
2.12 Recognition and measurement (continued) (b) Financial liabilities Liabilities within the scope of IAS 39 are classified as financial liabilities at fair value through profit or loss or other liabilities,
as appropriate.
A financial liability is derecognised when the obligation under the liability is discharged or cancelled or expires.
All loans and borrowings are classified as other liabilities. Initial recognition is at fair value less directly attributable transaction costs. After initial recognition, interest bearing loans and borrowings are subsequently measured at amortised cost using the effective interest method.
Financial liabilities included in trade and other payables are recognised initially at fair value and subsequently at amortised cost. The fair value of a non-interest bearing liability is its discounted repayment amount. If the due date of the liability is less than one year, discounting is omitted.
2.13 Accounts receivable Accounts receivable are initially recognised at fair value and subsequently at amortised cost, using the effective interest rate
method. A provision for impairment of trade receivables is established when there is objective evidence that the Group will not be able to collect all amounts due according to the original term of the receivables.
Prepayments are carried at cost less any accumulated impairment losses.
2.14 cash and cash equivalents Cash and cash equivalents includes cash in hand, deposits held at call with banks, other short-term highly liquid investments with
original maturities of three months or less, and bank overdrafts.
2.15 Participatory interest (PI) capital PIs are classified as equity when there is no obligation to transfer cash or other assets. Incremental costs directly attributable to
the issue of new PIs are shown in equity as a deduction, from the proceeds.
2.16 Accounts payable Trade and other payables are recognised initially at fair value and subsequently measured at amortised cost using the effective
interest method.
The Group obtains deposits from tenants as a guarantee for returning the property at the end of the lease term in a specified good condition or for the lease payments for a period ranging from 1 to 12 months. Such deposits are treated as financial liabilities in accordance with IAS 39 and they are initially recognised at fair value. The difference between fair value and cash received is considered to be part of the minimum lease payments received for the operating lease. The deposit is subsequently measured at amortised cost.
2.17 borrowings Borrowings are recognised initially at fair value, net of transaction costs incurred. Borrowings are subsequently stated at amortised
cost; any difference between the proceeds (net of transaction costs) and the redemption value is recognised as finance cost over the period of the borrowings using the effective interest method.
Fees paid on the establishment of loan facilities are recognised as transaction costs of the loan to the extent that it is probable that some or all of the facility will be drawn down. In this case, the fee is deferred until the draw-down occurs. To the extent there is no evidence that it is probable that some or all of the facility will be drawn down, the fee is capitalised as a prepayment for liquidity services and amortised over the period of the facility to which it relates.
Borrowings are classified as current liabilities unless the Group has an unconditional right to defer settlement of the liability for at least 12 months after the date of the statement of financial position.

Page 61
Annual Report 2010 Emira Property Fund
2.18 Derivative financial instruments The Group uses derivative financial instruments to hedge its exposure to interest rate risks arising from financing and investment
activities. The Group does not hold or issue derivative financial instruments for trading purposes. However, derivatives that do not qualify for hedge accounting are accounted for as financial instruments held for trading.
Derivative financial instruments are initially recognised and subsequently stated at fair value. The gain or loss on re-measurement to fair value is taken immediately to profit or loss. The fair value of interest rate swaps is the estimated amount that the Group would receive or pay to terminate the swap at the statement of financial position date, taking into account current interest rates and the current creditworthiness of the swap counterparties.
2.19 current and deferred income tax The Fund is exempt from income tax and capital gains tax. Tax charge comprises current and deferred tax in respect of the Fund’s
subsidiaries. Tax is recognised in the statement of comprehensive income, except to the extent that it relates to items recognised directly, in other comprehensive income, in which case the tax is also recognised in other comprehensive income.
Deferred income tax is provided in full, using the liability method, on temporary differences arising between the tax bases of assets and liabilities and their carrying amounts in the consolidated financial statements. However, deferred income tax is not accounted for if it arises from initial recognition of an asset or liability in a transaction other than a business combination that at the time of the transaction affects neither accounting nor taxable profit or loss. Deferred income tax is determined using tax rates (and laws) that have been enacted or substantially enacted by the date of the statement of financial position and are expected to apply when the related deferred income tax asset is realised or the deferred income tax liability is settled. Deferred income tax assets are recognised to the extent that it is probable that future taxable profit will be available against which the temporary differences can be utilised.
The carrying value of the Group’s investment property will generally be realised by a combination of income (rental stream during the period of use) and capital (the consideration on the sale at the end of use). Where different tax rates exist for income and capital gains, the Group considers the planned recovery of the asset and how that affects the tax rate used in the calculation of the deferred tax.
The length of the period for which a property will be held prior to disposal is based on the Group’s current plans and recent experience with similar properties. The capital gains tax rate applied is that which would apply on a direct sale of the property recorded in the statement of financial position, regardless of whether the Group would structure the sale via the disposal of the subsidiary holding the asset, to which a different tax rate may apply. The deferred tax is then calculated based on the respective temporary differences and tax consequences arising from recovery through use and recovery through sale.
2.20 Provisions Provisions for legal claims are recognised when: the Group has a present legal or constructive obligation as a result of past events;
it is probable that an outflow of resources will be required to settle the obligation; and the amount can be reliably estimated.
Provisions are measured at the present value of the expenditures expected to be required to settle the obligation using a pre-tax rate that reflects current market assessments of the time value of money and the risks specific to the obligation. The increase in the provision due to passage of time is recognised as finance cost.
Where the Group, as lessee, is contractually required to restore a leased property to an agreed condition prior to release by a lessor, provision is made for such costs as they are identified.
2.21 Revenue recognition Revenue includes rental income, and operating cost recoveries from tenants, but excludes Value Added Tax. Rental income from
operating leases is recognised on a straight-line basis over the lease term. When the Group provides incentives to its tenants, the cost of incentives is recognised over the lease term, on a straight-line basis.

Page 62
Annual Report 2010 Emira Property Fund
Notes to the financial statements (continued)for the year ended 30 June 2010
2.22 Distributions payable to participatory interest holders Distributions payable to participatory interest holders are recognised in the period in which income is earned, in accordance with
the Trust Deed of the Fund. The accrued income arising as a result of the difference between actual cash rental received and the amortised amount on a straight-line basis over the periods of the lease contracts is not distributable until realised. The additional profit arising as a result of the Group amortising upfront lease costs over the period of the lease contracts is not distributable.
2.23 Income from listed property investment Distribution income revenue from the listed property investment is recognised when the unit holder’s right to receive payment
has been established.
2.24 Interest income and expense Interest income and expense are recognised within ‘finance income’ and ‘finance costs’ in profit or loss using the effective interest
rate method, except for borrowing costs relating to qualifying assets, which are capitalised as part of the cost of that asset. The Group has chosen to capitalise borrowing costs on all qualifying assets irrespective of whether they are measured at fair value.
The effective interest method is a method of calculating the amortised cost of a financial asset or financial liability and of allocating the interest income or interest expense over the relevant period. The effective interest rate is the rate that exactly discounts estimated future cash payments or receipts throughout the expected life of the financial instrument, or a shorter period where appropriate, to the net carrying amount of the financial asset or financial liability. When calculating the effective interest rate, the Group estimates cash flows considering all contractual terms of the financial instrument (for example, prepayment options) but does not consider future credit losses. The calculation includes all fees and points paid or received between parties to the contract that are an integral part of the effective interest rate, transaction costs and all other premiums or discounts.
2.25 other expenses Expenses include legal, accounting, auditing and other fees. They are recognised as expense in profit or loss in the period in
which they are incurred (on an accruals basis).
2.26 non-current assets held for sale Non-current assets are classified as assets held for sale when their carrying amount is to be recovered principally through a sale
transaction and a sale is considered highly probable. They are stated at the lower of carrying amount and fair value less costs to sell if their carrying amount is to be recovered principally through a sale transaction rather than through continuing use.
3 cRItIcAL AccoUntInG estIMAtes AnD JUDGeMents Estimates and judgements are continually evaluated and are based on historical experience as adjusted for current market
conditions and other factors.
3.1 critical accounting estimates and assumptions Management makes estimates and assumptions concerning the future. The resulting accounting estimates will, by definition,
seldom equal the related actual results. The estimates, assumptions and management judgements that have a significant risk of causing a material adjustment to the carrying amounts of assets and liabilities within the next financial year are outlined in the following:

Page 63
Annual Report 2010 Emira Property Fund
Investmentproperties–Note8 The valuation of investment properties was determined principally using discounted cash flow projections, based on estimates
of future cash flows, supported by the terms of any existing lease contracts and by external evidence such as current market rentals for similar properties in the same location and condition, and using discount rates that reflect current market assessments, of the uncertainty in the amount and timing of the cash flows.
The future rental rates were estimated depending on the actual location, type and quality of the properties and taking into account market data and projections at the valuation date, as well as the length of vacant periods following the expiry of existing lease agreements.
Accountsreceivable–Note13 At each statement of financial position date, management considers each material debtor in respect of whom legal proceedings
have been instituted, in order to determine the level of recoverability. A provision is made for portion of those considered irrecoverable.
Derivativefinancialinstruments–Note21 The valuation of derivative financial instruments was determined using discounted cash flow projections, based on estimates of
future cash flows, supported by the terms of the relevant swap agreements and external evidence such as the ZAR 0-coupon perfect-fit swap curve (“the swap curve”). Future floating cash flows are determined using forward rates ranging from 6,37% to 8,92%, derived from the swap curve as at 30 June 2010. The net cash flows were discounted using the swap curve as at 30 June 2010, at rates which ranged between 6,19% and 8,25%.
3.2 critical judgements in applying the Group’s accounting policies The Group did not make any critical accounting judgements in 2010 and 2009.
4 oPeRAtInG seGMents The Group adopted IFRS 8 Operating Segments. This has not resulted in an increase in the number of reportable segments
presented.
The chief operating decision maker is the person or group that allocates resources to and assesses the performance of the operating segments of an entity. The Group has determined that its chief operating decision maker is the Chief Executive Officer (CEO) of the Fund.
Management has determined the operating segments based on the reports reviewed by the CEO in making strategic decisions.
The CEO considers the business based on the following operating segments: • Office • Retail • Industrial
The operating segments derive their revenue primarily from rental income from lessees. All of the Group’s business activities and operating segments are reported within the above segments.

Page 64
Annual Report 2010 Emira Property Fund
Notes to the financial statements (continued)for the year ended 30 June 2010
FUnD GRoUP
2009R’000
2010R’000
2010R’000
2009R’000
5 PRoFIt FoR tHe YeAR beFoRe IncoMe tAx cHARGeProfit for the year before income tax charge is arrived at after taking into account the following items:expenses
1 029 1 248 Auditors’ remuneration 1 248 1 029
1 025 1 241 Audit fee 1 241 1 025 4 7 Expenses 7 4
3 398 4 579 Operating lease payments – leasehold properties 11 152 8 925
6 DeFeRReD tAxAtIonReconciliation of the taxation charge:
88 825 150 745 Profit for the year before income tax charge at 28% (2009: 28%) 143 325 72 369
(88 825) (150 745) Exempt income (150 745) (88 825)Non-allowable deductions 3 738 4 599 Fair value adjustments (336) (54 705)Other timing differences 552 284 Utilisation of losses (552) (293)
— — (4 018) (66 571)
7 eARnInGs PeR PARtIcIPAtoRY InteRestReconciliation between earnings and headline earnings and distribution payableProfit for the year attributable to equity holders 514 557 323 388 Adjusted for:Net fair value (gain)/deficit on investment properties (39 661) 83 511 Change in fair value of investment properties as a result of straightlining lease rentals 10 012 22 822 Change in fair value of investment properties as a result of amortising upfront lease costs (5 329) 6 717 Change in fair value of investment properties as a result of property (appreciation)/depreciation in value (44 344) 53 972 Deferred taxation on revaluation of investment properties (1 753) (54 441)
Headline earnings 473 143 352 458

Page 65
Annual Report 2010 Emira Property Fund
FUnD GRoUP
2009R’000
2010R’000
2010R’000
2009R’000
7 eARnInGs PeR PARtIcIPAtoRY InteRest (continued)Headline earnings 473 143 352 458 Adjusted for:Allowance for future rental escalations (10 012) (22 822)Amortised upfront lease costs 5 329 (6 717)Unrealised deficit on interest-rate swaps 63 818 183 136 Unrealised gain on listed property investment (2 769) —Deferred taxation – other timing differences (2 265) (12 130)
Distribution payable to participatory interest holders 527 244 493 925
Distribution per participatory interestInterim (cents) 51,84 48,79Final (cents) 56,24 52,46
108,08 101,25
Number of participatory interests in issue at the end of the year 487 827 654 487 827 654 Weighted average number of participatory interests in issue 487 827 654 491 194 770 earnings per participatory interest (cents) 105,48 65,84The calculation of earnings per participatory interest is based on net profit for the year of R514,6 million (2009: R323,4 million), divided by the weighted average number of participatory interests in issue during the year of 487 827 654 (2009: 491 194 770).Headline earnings per participatory interest (cents) 96,99 71,76The calculation of headline earnings per participatory interest is based on net profit for the year, adjusted for the non-trading items, of R473,1 million (2009: R352,5 million), divided by the weighted average number of participatory interests in issue during the year of 487 827 654 (2009: 491 194 770).

Page 66
Annual Report 2010 Emira Property Fund
Notes to the financial statements (continued)for the year ended 30 June 2010
FUnD GRoUP
Freehold and
leasehold land and
buildingsR’000
Fixturesand
fittingsR’000
totalR’000
Freehold and
leasehold land and
buildingsR’000
Fixturesand
fittingsR’000
totalR’000
8 InvestMent PRoPeRtIes net carrying value at 30 June 2010
3 583 901 71 708 3 655 609 Cost 4 828 608 84 139 4 912 747 (52 858) (52 858) Accumulated depreciation (56 331) (56 331)
1 822 056 1 822 056 Revaluation surplus 2 824 657 2 824 657 (238 539) (238 539) Non-current assets held for sale (347 039) (347 039)
5 167 418 18 850 5 186 268 7 306 226 27 808 7 334 034
Movement for the year 4 981 289 23 432 5 004 721 Valuation at 1 July 2009 7 127 001 31 602 7 158 603
36 000 — 36 000 Acquisitions 36 000 — 36 000 95 637 3 476 99 113 Additions 100 492 5 910 106 402
(12 189) — (12 189) Disposals (12 189) — (12 189) (8 058) (8 058) Depreciation (9 704) (9 704)
44 720 44 720 Surplus on revaluation 39 661 39 661 Non-current assets held for sale
260 500 260 500 – prior year 362 300 362 300 Non-current assets held for sale
(238 539) (238 539) – current year (347 039) (347 039)
5 167 418 18 850 5 186 268 valuation at 30 June 2010 7 306 226 27 808 7 334 034
Reconciliation to independent and directors’ valuations
5 167 418 18 850 5 186 268 Valuation at 30 June 2010 – as above 7 306 226 27 808 7 334 034
119 408 119 408 Allowance for future rental escalations 162 838 162 838 26 333 26 333 Unamortised upfront lease costs 39 019 39 019
238 539 238 539 Non-current assets held for sale 347 039 347 039
5 551 698 18 850 5 570 548 Independent and directors’ valuations at 30 June 2010 7 855 122 27 808 7 882 930

Page 67
Annual Report 2010 Emira Property Fund
FUnD GRoUP
Freehold and
leasehold land and
buildingsR’000
Fixturesand
fittingsR’000
totalR’000
Freehold and
leasehold land and
buildingsR’000
Fixturesand
fittingsR’000
totalR’000
8 InvestMent PRoPeRtIes (continued)net carrying value at 30 June 2009
3 458 878 68 232 3 527 110 Cost 4 698 729 78 229 4 776 958 (44 800) (44 800) Accumulated depreciation (46 627) (46 627)
1 782 911 1 782 911 Revaluation surplus 2 790 572 2 790 572 (260 500) (260 500) Non-current assets held for sale (362 300) (362 300)
4 981 289 23 432 5 004 721 7 127 001 31 602 7 158 603
Movement for the year 5 074 819 29 515 5 104 334 Valuation at 1 July 2008 7 270 193 34 973 7 305 166
198 125 — 198 125 Acquisitions 198 125 198 125 55 371 4 310 59 681 Additions 106 566 8 149 114 715
(20 914) (137) (21 051) Disposals (20 914) (137) (21 051) 22 22 Disposals – accumulated depreciation 22 22
(10 071) (10 071) Depreciation (11 198) (11 198) 207 (207) — Reclassification 207 (207) —
(84 454) (84 454) Deficit on revaluation (83 511) (83 511)Non-current assets held for sale
18 635 18 635 – prior year 18 635 18 635 Non-current assets held for sale
(260 500) (260 500) – current year (362 300) (362 300)
4 981 289 23 432 5 004 721 Valuation at 30 June 2009 7 127 001 31 602 7 158 603
Reconciliation to independent and directors’ valuations
4 981 289 23 432 5 004 721 Valuation at 30 June 2009 – as above 7 127 001 31 602 7 158 603
106 544 106 544 Allowance for future rental escalations 152 826 152 826 29 642 29 642 Unamortised upfront lease costs 44 348 44 348
260 500 260 500 Non-current assets held for sale 362 300 362 300
5 377 975 23 432 5 401 407 Independent and directors’ valuations at 30 June 2009 7 686 475 31 602 7 718 077
Full details of freehold and leasehold investment properties owned by the Group are available for inspection at the registered office of the Group.
In terms of its accounting policy, one-third of the Group’s property portfolio is valued annually by independent valuers.
The properties were valued as at 30 June 2010 using a discounted cash flow approach based on future income streams, applying an appropriate capitalisation rate to each property.
Independent valuations were carried out by Benchmark Valuation Group, CB Richard Ellis and DDP Valuers, all registered valuers in terms of section 19 of the Property Valuers Profession Act (Act No 47 of 2000).
The balance of the portfolio was valued by the directors on a similar basis.
Investment properties classified as held for sale were valued at fair value.
Investment properties to the value of R7 512,2 (2009: R7 351,3 million) have been used to provide security for loans taken out. See note 18.
Page 68
Annual Report 2010 Emira Property Fund
Notes to the financial statements (continued)for the year ended 30 June 2010
FUnD GRoUP
2009R’000
2010R’000
2010R’000
2009R’000
9 ALLowAnce FoR FUtURe RentAL escALAtIons 86 790 106 544 Opening balance at 1 July 2009 152 826 130 004 19 754 12 864 Income recognised during the year 10 012 22 822
106 544 119 408 Closing balance at 30 June 2010 162 838 152 826
19 193 22 933 Current portion 37 693 31 444
10 UnAMoRtIseD UPFRont LeAse costs 24 635 29 642 Opening balance at 1 July 2009 44 348 37 631
5 007 — Expense deferred during the year — 6 717 — (3 309) Expense recognised during the year (5 329) —
29 642 26 333 Closing balance at 30 June 2010 39 019 44 348
11 sUbsIDIARY coMPAnIes 1 339 187 1 339 187 Shares at cost
(90 754) (90 054) Amounts owed to subsidiary companies
1 248 433 1 249 133
The Group’s shares in Arnold Properties (Proprietary) Limited have been pledged to Nedbank Limited as security for the issue of preference shares to them.
The Group’s shares in Freestone Property Investments (Proprietary) Limited have been pledged to Freestone Mortgage Bond SPV Series 1 (Proprietary) Limited as security for the issue of CMBS notes.
The directors’ valuation of the investment in subsidiaries at 30 June 2010 was R1 410 519 (2009: R1 434 336).
Investment in subsidiaries
Issued ordinary share capital
Proportion held by holding company shares at cost
Amount due to/(by) holding company
2010R’000
2009 R’000
2010 %
2009 %
2010 R’000
2009 R’000
2010R’000
2009 R’000
subsidiaries directly heldFreestone Property Holdings Ltd 38 659 38 659 100 100 1 339 187 1 339 187 (90 054) (90 754)subsidiaries indirectly heldArnold Properties (Pty) Ltd* — — 100 100 8 020 8 020 180 245 174 922 Freestone Property Investments (Pty) Ltd* — — 100 100 — — 419 616 424 240 Azgold Investments (Pty) Ltd 10 382 10 382 100 100 3 247 3 247 (3 947) (3 947)Backbone Investments (Pty) Ltd* — — 100 100 3 243 3 243 2 774 2 780 Kenview Share Block (Pty) Ltd* — — 100 100 (1 885) (1 885) 4 560 4 556 No. 9 Sturdee Holdings Share Block (Pty) Ltd* — — 100 100 497 497 7 366 7 362 Paddy’s Pad (2091) (Pty) Ltd* — — 100 100 15 539 15 539 (16 715) (16 715)Surgate Share Block (Pty) Ltd 1 1 100 100 (1 981) (1 981) 5 105 5 107 The Colony Centre Share Block (Pty) Ltd 1 1 100 100 4 913 4 913 (11 057) (11 057)Windrifter Share Block (Pty) Ltd* — — 100 100 20 192 20 192 59 359 57 972* The zero balances represent nominal amounts under R1 000.

Page 69
Annual Report 2010 Emira Property Fund
FUnD GRoUP
2009R’000
2010R’000
2010R’000
2009R’000
12 LIsteD PRoPeRtY InvestMentGrowthpoint Properties Australia Limited
— 116 898 Cost 116 898 —— 2 769 Fair value adjustment 2 769 —
— 119 667 Fair value at 30 June 2010 119 667 —
Exchange rate ZAR: 1 AUD 6,486During May 2010 the Fund acquired 10 250 000 stapled securities in Growthpoint Properties Australia Limited (GOZ), which represented a 6,4% interest. GOZ is listed on the Australian Stock Exchange (ASX).The investment is designated as fair value through profit and loss. The fair value is determined using the quoted bid price at 30 June 2010 of AUD1,80.
13 AccoUnts ReceIvAbLe 29 109 44 884 Trade receivables 59 125 40 195
(11 452) (15 963) Less: Provision for non-recoverable receivables (24 705) (18 524)
17 657 28 921 Net trade receivables 34 420 21 671 1 547 3 010 Prepayments 3 887 3 514
19 260 16 612 Other receivables 24 538 26 707
38 464 48 543 62 845 51 892
38 464 48 543 Due within one year 62 845 51 892
The carrying values of accounts receivable approximate their fair value.
The movement in the accumulated provision for non-recoverable receivables is as follows:
8 038 11 452 Accumulated provision for non-recoverable receivables at 1 July 2009
18 524 11 146
(4 814) (4 257) Amounts written off during the year as uncollectable (5 806) (5 603)8 228 8 768 Additional provision recognised during the year 11 987 12 981
11 452 15 963 Accumulated provision for non-recoverable receivables at 30 June 2010 24 705 18 524
Ageing of receivables past due but not impaired 6 315 10 435 30 days 12 403 9 645 3 045 3 985 60 days 5 230 4 772 1 868 2 425 90 days 2 799 2 939 6 429 12 076 120+ days 13 988 4 315
17 657 28 921 34 420 21 671
Ageing of impaired receivables— 1 030 30 days 1 557 —— 1 282 60 days 2 463 —— 1 172 90 days 1 686 —
11 452 12 479 120+ days 18 999 18 524
11 452 15 963 24 705 18 524

Page 70
Annual Report 2010 Emira Property Fund
Notes to the financial statements (continued)for the year ended 30 June 2010
FUnD GRoUP
2009R’000
2010R’000
2010R’000
2009R’000
14 DeRIvAtIve FInAncIAL InstRUMentsnet fair values of derivative assets at the balance sheet date were:
4 527 — Interest rate swap contracts — 6 817
4 527 — — 6 817
Interest rate swapsThe notional principal amount of the outstanding interest rate swap contracts at 30 June 2010 was R1 694,6 million (2009: R1 574,6 million)
Refer to note 18 for details of the swap contracts.
15 cAsH AnD cAsH eqUIvALents 22 898 25 598 Cash at bank 40 681 36 524
16 PARtIcIPAtoRY InteRest HoLDeRs cAPItALAuthorisedandissued
3 563 635 3 511 484 Opening balance at 1 July 2009 3 511 484 3 563 635 (52 151) — Repurchased during the year — (52 151)
(4 991 335 PIs were repurchased in March 2009 in terms of a special resolution passed on 18 November 2008. Emira has the right to re-issue the PIs at a later date).
3 511 484 3 511 484 Closing balance at 30 June 2010 3 511 484 3 511 484
17 ReseRvesFairvaluereserve
2 208 187 2 031 494 Opening balance at 1 July 2009 2 126 475 2 297 012 (84 454) 47 489 Fair value adjustments 42 430 (83 511) 19 754 12 864 Allowance for future rental escalations 10 012 22 822
5 007 (3 309) Unamortised upfront lease costs (5 329) 6 717 (117 000) (45 912) Unrealised deficit on interest rate swaps (63 818) (183 136)
— — Deferred taxation 4 018 66 571
2 031 494 2 042 626 Closing balance at 30 June 2010 2 113 788 2 126 475
Otherreserve (98 262) (98 262) Opening balance at 1 July 2009 (98 262) (98 262)
(98 262) (98 262) Closing balance at 30 June 2010 (98 262) (98 262)

Page 71
Annual Report 2010 Emira Property Fund
FUnD GRoUP
2009R’000
2010R’000
2010R’000
2009R’000
17 ReseRves (continued)Retainedearnings
(1 511) (1 511) Opening balance at 1 July 2009 (1 345) (1 345) 317 232 538 376 Profit before income tax charge 511 874 258 459
(493 925) (527 244) Distribution to participatory interest holders (527 244) (493 925) 84 454 (47 489) Fair value adjustments (42 430) 83 511
(19 754) (12 864) Allowance for future rental escalations (10 012) (22 822) (5 007) 3 309 Unamortised upfront lease costs 5 329 (6 717)
117 000 45 912 Unrealised deficit on interest rate swaps 63 818 183 136 — — STC on preference share dividends paid (1 335) (1 642)
(1 511) (1 511) Closing balance at 30 June 2010 (1 345) (1 345)
1 931 721 1 942 853 total reserves 2 014 181 2 026 868
The fair value reserve represents all fair value adjustments made in respect of investment properties, the listed property investment and derivative financial instruments. In terms of the Trust Deed of the Fund this reserve is not distributable to participatory interest holders.
The other reserve represents the charge which was made to the statement of comprehensive income in respect of the discount at which participatory interests were issued to the Fund’s BEE partners and vendors of properties, in prior years.
18 InteRest-beARInG Debt 120 000 160 000 FirstRand Bank 160 000 120 000
Floating seven-year access funding term with a capital repayment on termination on 31 May 2014. Interest is payable at prime less 225 basis points. This facility is secured, together with the 10-year funding term loan noted below, by a first mortgage bond over fixed property with a carrying value of R3,416 million.
645 027 646 353 Freestone Finance Company 646 353 645 027 650 000 650 000 CMBS notes issued to Rand Merchant Bank (RMB)
repayable on 28 March 2013. Various interest rate swap agreements held by the Fund were novated to RMB, resulting in an effective rate of 9,81%, inclusive of securitisation costs. The notes are secured by a first mortgage bond over fixed property with a carrying value of R1,936 million.
650 000 650 000
(4 973) (3 647) Less: Unamortised securitisation costs (3 647) (4 973)

Page 72
Annual Report 2010 Emira Property Fund
Notes to the financial statements (continued)for the year ended 30 June 2010
FUnD GRoUP
2009R’000
2010R’000
2010R’000
2009R’000
18 InteRest-beARInG Debt (continued) 112 838 287 780 FirstRand Bank Limited 287 780 112 838 114 475 289 475 Floating rate 10-year funding term with a capital
repayment on termination, on 30 March 2019. Interest is payable at three-month JIBAR plus 153 basis points. This loan, together with the seven-year access funding term loan noted above, is secured by a first mortgage bond over fixed property with a carrying value of R3,416 million.
289 475 114 475
(1 637) (1 695) Less: Unamortised structuring fee (1 695) (1 637) (1 740) (1 066) Amortisedborrowingcost (1 066) (1 740) (2 393) (1 740) Opening balance (1 740) (2 393)
(27) — Costs capitalised to borrowings — (27) 680 674 Less: Amounts amortised 674 680
Preference shares issued to Nedbank Limited redeemable up to five years after issue i.e. on 31 January 2012.
90 000 90 000
Preference shares issued to Nedbank Limited redeemable up to five years after issue i.e. on 11 September 2013
110 000 110 000
Freestone Finance Company 498 596 497 191 CMBS notes repayable on 18 June 2011. An interest rate swap has been entered into for seven years, which when taking the securitisation costs into account, gives an effective rate of 9,20% per annum. The notes are secured by a first mortgage bond over fixed property with a carrying value of R1,644 million.
500 000 500 000
Less: Unamortised securitisation costs (1 404) (2 809)
876 125 1 093 067 1 791 663 1 573 316
Less:Short-termportionofinterest-bearingdebt
Freestone Finance Company (498 596) —
CMBS notes repayable on 18 June 2011.
876 125 1 093 067 total interest-bearing debt 1 293 067 1 573 316
The carrying amount of the interest-bearing debt approximates its fair value.
DebtfundingIn terms of the Trust Deed, the Fund’s aggregated indebtedness may not exceed an amount equal to 30% of the gross value of the underlying assets of the Fund. At 30 June 2010, the aggregate indebtedness amounted to 22,1% of the gross value of the underlying assets. As at 30 June 2010 Emira had a total debt facility available of R2,257 million.
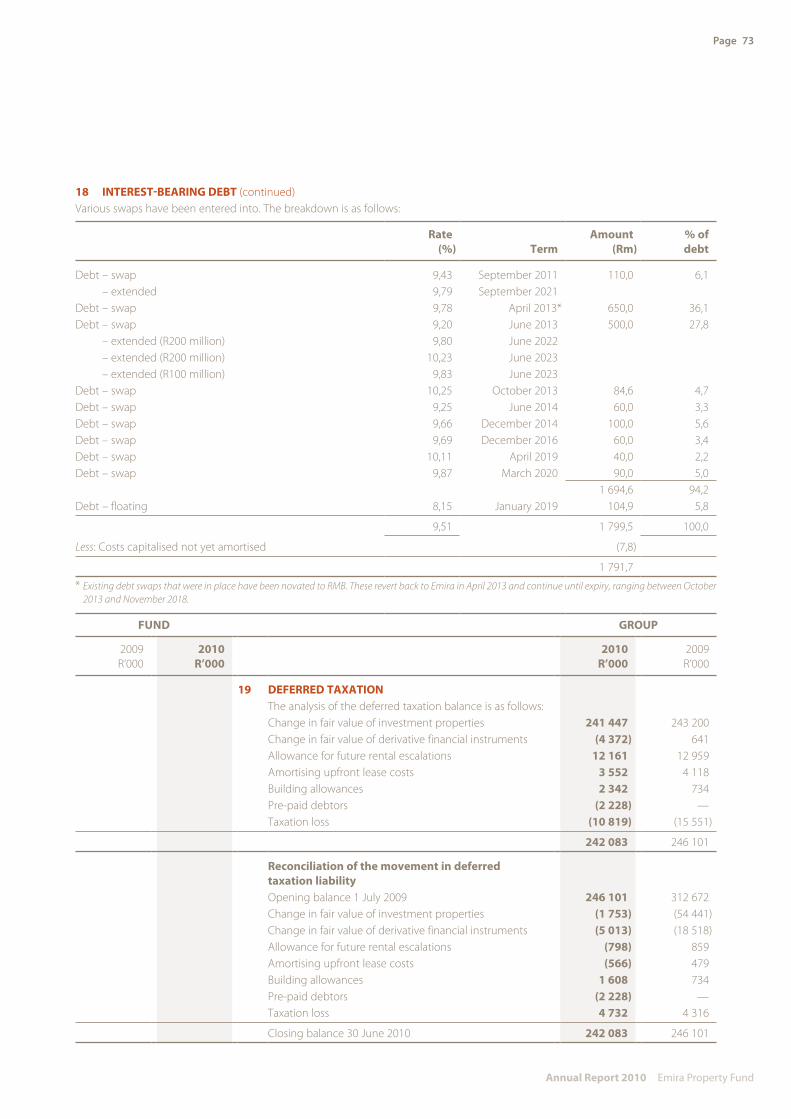
Page 73
Annual Report 2010 Emira Property Fund
18 InteRest-beARInG Debt (continued)Various swaps have been entered into. The breakdown is as follows:
Rate (%) term
Amount (Rm)
% of debt
Debt – swap 9,43 September 2011 110,0 6,1 – extended 9,79 September 2021Debt – swap 9,78 April 2013* 650,0 36,1 Debt – swap 9,20 June 2013 500,0 27,8 – extended (R200 million) 9,80 June 2022 – extended (R200 million) 10,23 June 2023 – extended (R100 million) 9,83 June 2023Debt – swap 10,25 October 2013 84,6 4,7 Debt – swap 9,25 June 2014 60,0 3,3 Debt – swap 9,66 December 2014 100,0 5,6 Debt – swap 9,69 December 2016 60,0 3,4 Debt – swap 10,11 April 2019 40,0 2,2 Debt – swap 9,87 March 2020 90,0 5,0
1 694,6 94,2 Debt – floating 8,15 January 2019 104,9 5,8
9,51 1 799,5 100,0
Less: Costs capitalised not yet amortised (7,8)
1 791,7
* Existing debt swaps that were in place have been novated to RMB. These revert back to Emira in April 2013 and continue until expiry, ranging between October 2013 and November 2018.
FUnD GRoUP
2009R’000
2010R’000
2010R’000
2009R’000
19 DeFeRReD tAxAtIonThe analysis of the deferred taxation balance is as follows:Change in fair value of investment properties 241 447 243 200 Change in fair value of derivative financial instruments (4 372) 641 Allowance for future rental escalations 12 161 12 959 Amortising upfront lease costs 3 552 4 118 Building allowances 2 342 734 Pre-paid debtors (2 228) —Taxation loss (10 819) (15 551)
242 083 246 101
Reconciliation of the movement in deferred taxation liabilityOpening balance 1 July 2009 246 101 312 672 Change in fair value of investment properties (1 753) (54 441)Change in fair value of derivative financial instruments (5 013) (18 518)Allowance for future rental escalations (798) 859 Amortising upfront lease costs (566) 479 Building allowances 1 608 734 Pre-paid debtors (2 228) —Taxation loss 4 732 4 316
Closing balance 30 June 2010 242 083 246 101

Page 74
Annual Report 2010 Emira Property Fund
Notes to the financial statements (continued)for the year ended 30 June 2010
FUnD GRoUP
2009R’000
2010R’000
2010R’000
2009R’000
20 AccoUnts PAYAbLe 11 282 1 545 Trade payables 1 895 14 899 31 889 34 433 Tenant deposits 53 679 47 914 59 684 72 366 Accrued expenses 101 984 87 748 17 466 18 782 Pre-paid debtors 26 740 22 740
5 396 3 336 Value added tax 6 226 8 226 14 768 19 884 Other payables 24 833 18 100
140 485 150 346 215 357 199 627
140 485 150 346 Current 215 357 199 627
21 DeRIvAtIve FInAncIAL InstRUMentsNetfairvaluesofderivativeliabilitiesatthebalancesheetdatewere:
— 41 385 Interest rate swap contracts 57 001 —
— 41 385 57 001 —
Interest rate swapsThe notional principal amount of the outstanding interest rate swap contracts at 30 June 2010 was R1 694,6 million (2009: R1 574,6 million)
Refer to note 18 for details of the swap contracts.
22 notes to tHe stAteMents oF cAsH FLowsCashgeneratedfromoperations
317 232 538 376 Profit before income tax charge for the year adjusted for: 511 874 258 459 84 454 (47 489) Fair value adjustments (42 430) 83 511
(19 754) (12 864) Allowance for future rental escalations (10 012) (22 822) (5 007) 3 309 Unamortised upfront lease costs 5 329 (6 717)
75 810 97 155 Interest paid 156 570 138 268 (1 728) (3 065) Interest capitalised to cost of developments (3 065) (1 728)
117 000 45 912 Unrealised deficit on interest rate swaps 63 818 183 136 (128 473) (148 012) Finance income (5 484) (11 902)
10 071 8 058 Depreciation 9 704 11 198
449 605 481 380 Operating profit before working capital changes 686 304 631 403 (7 835) (10 079) Increase in accounts receivable (10 953) (10 219)
26 292 9 861 Increase in accounts payable excluding STC 15 918 43 317
468 062 481 162 cash generated from operations 691 269 664 501
Distribution to participatory interest holders (235 075) (255 914) Distribution payable at 1 July 2009 (255 914) (235 075) (493 925) (527 244) Distribution for the year (527 244) (493 925) 255 914 274 354 Distribution payable at 30 June 2010 274 354 255 914
(473 086) (508 804) Distribution paid to participatory interest holders (508 804) (473 086)
taxation paidTaxation liability at 1 July 2009 (837) (423)Movement in statement of comprehensive income – STC (1 335) (1 642)Taxation liability at 30 June 2010 649 837
Taxation paid for the year (1 523) (1 228)
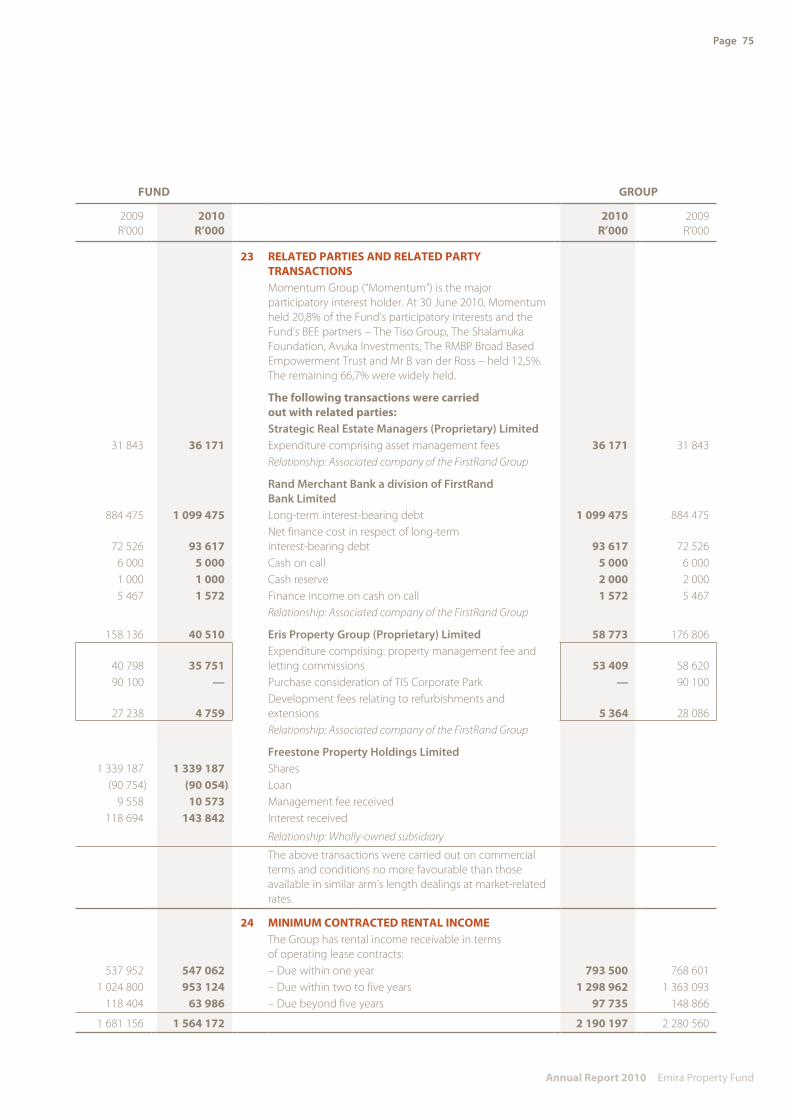
Page 75
Annual Report 2010 Emira Property Fund
FUnD GRoUP
2009R’000
2010R’000
2010R’000
2009R’000
23 ReLAteD PARtIes AnD ReLAteD PARtY tRAnsActIonsMomentum Group (“Momentum”) is the major participatory interest holder. At 30 June 2010, Momentum held 20,8% of the Fund’s participatory interests and the Fund’s BEE partners – The Tiso Group, The Shalamuka Foundation, Avuka Investments, The RMBP Broad Based Empowerment Trust and Mr B van der Ross – held 12,5%. The remaining 66,7% were widely held.
the following transactions were carried out with related parties:Strategic Real Estate Managers (Proprietary) Limited
31 843 36 171 Expenditure comprising asset management fees 36 171 31 843 Relationship: Associated company of the FirstRand Group
Rand Merchant Bank a division of FirstRand Bank Limited
884 475 1 099 475 Long-term interest-bearing debt 1 099 475 884 475
72 526 93 617 Net finance cost in respect of long-term interest-bearing debt 93 617 72 526
6 000 5 000 Cash on call 5 000 6 000 1 000 1 000 Cash reserve 2 000 2 000 5 467 1 572 Finance income on cash on call 1 572 5 467
Relationship: Associated company of the FirstRand Group
158 136 40 510 Eris Property Group (Proprietary) Limited 58 773 176 806
40 798 35 751 Expenditure comprising: property management fee and letting commissions 53 409 58 620
90 100 — Purchase consideration of TIS Corporate Park — 90 100
27 238 4 759 Development fees relating to refurbishments and extensions 5 364 28 086 Relationship: Associated company of the FirstRand Group
Freestone Property Holdings Limited 1 339 187 1 339 187 Shares
(90 754) (90 054) Loan 9 558 10 573 Management fee received
118 694 143 842 Interest received
Relationship: Wholly-owned subsidiary
The above transactions were carried out on commercial terms and conditions no more favourable than those available in similar arm’s length dealings at market-related rates.
24 MInIMUM contRActeD RentAL IncoMeThe Group has rental income receivable in terms of operating lease contracts:
537 952 547 062 – Due within one year 793 500 768 601 1 024 800 953 124 – Due within two to five years 1 298 962 1 363 093
118 404 63 986 – Due beyond five years 97 735 148 866
1 681 156 1 564 172 2 190 197 2 280 560
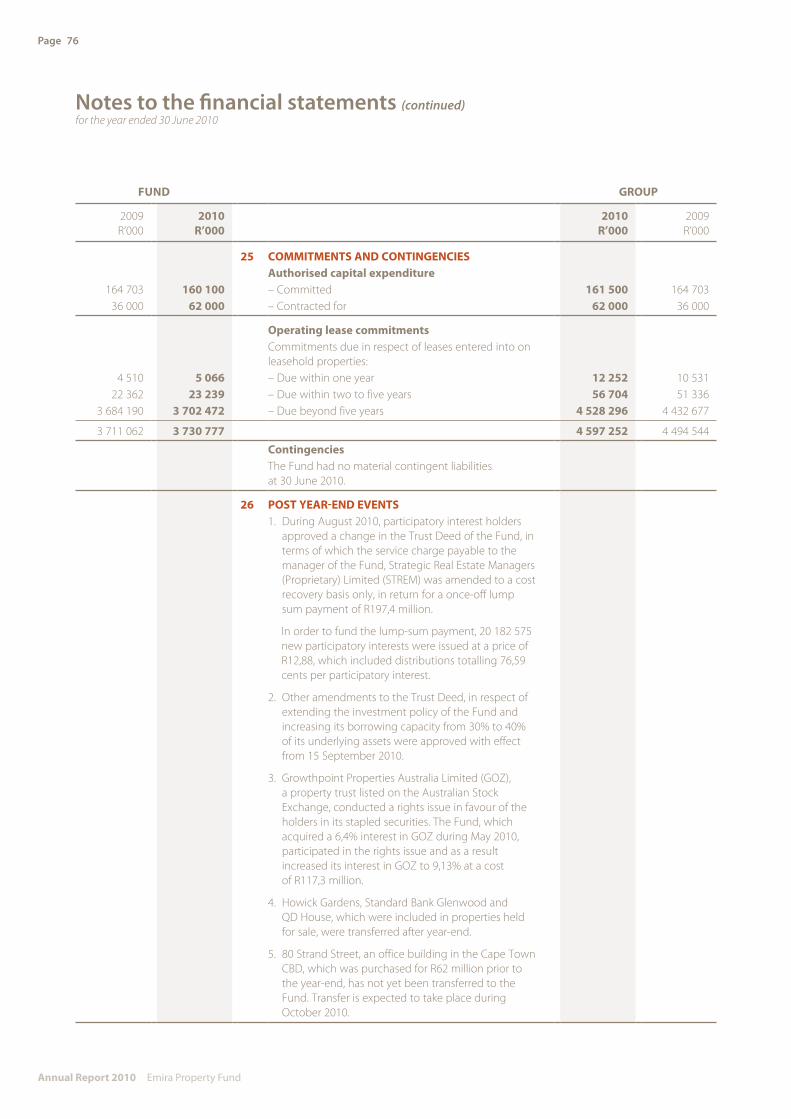
Page 76
Annual Report 2010 Emira Property Fund
Notes to the financial statements (continued)for the year ended 30 June 2010
FUnD GRoUP
2009R’000
2010R’000
2010R’000
2009R’000
25 coMMItMents AnD contInGencIesAuthorised capital expenditure
164 703 160 100 – Committed 161 500 164 703 36 000 62 000 – Contracted for 62 000 36 000
operating lease commitmentsCommitments due in respect of leases entered into on leasehold properties:
4 510 5 066 – Due within one year 12 252 10 531 22 362 23 239 – Due within two to five years 56 704 51 336
3 684 190 3 702 472 – Due beyond five years 4 528 296 4 432 677
3 711 062 3 730 777 4 597 252 4 494 544
contingenciesThe Fund had no material contingent liabilities at 30 June 2010.
26 Post YeAR-enD events1. During August 2010, participatory interest holders
approved a change in the Trust Deed of the Fund, in terms of which the service charge payable to the manager of the Fund, Strategic Real Estate Managers (Proprietary) Limited (STREM) was amended to a cost recovery basis only, in return for a once-off lump sum payment of R197,4 million.
In order to fund the lump-sum payment, 20 182 575 new participatory interests were issued at a price of R12,88, which included distributions totalling 76,59 cents per participatory interest.
2. Other amendments to the Trust Deed, in respect of extending the investment policy of the Fund and increasing its borrowing capacity from 30% to 40% of its underlying assets were approved with effect from 15 September 2010.
3. Growthpoint Properties Australia Limited (GOZ), a property trust listed on the Australian Stock Exchange, conducted a rights issue in favour of the holders in its stapled securities. The Fund, which acquired a 6,4% interest in GOZ during May 2010, participated in the rights issue and as a result increased its interest in GOZ to 9,13% at a cost of R117,3 million.
4. Howick Gardens, Standard Bank Glenwood and QD House, which were included in properties held for sale, were transferred after year-end.
5. 80 Strand Street, an office building in the Cape Town CBD, which was purchased for R62 million prior to the year-end, has not yet been transferred to the Fund. Transfer is expected to take place during October 2010.

Page 77
Annual Report 2010 Emira Property Fund
27 seGMent InFoRMAtIon The Fund’s activities are divided into three main categories namely:Office – Comprises commercial propertiesRetail – Comprises shopping centres Industrial – Comprises industrial properties
sectoral segmentsofficeR’000
RetailR’000
IndustrialR’000
Adminis- trative and
corporateR’000
totalR’000
June 2010Revenue 510 188 463 773 188 218 1 162 179 Revenue 511 019 455 785 185 363 1 152 167 Allowance for future rental escalations (831) 7 988 2 855 10 012 Segmental resultOperating profit 319 994 266 460 136 776 (41 947)* 681 283 Other informationDepreciation 7 152 1 930 622 9 704 Investment properties 3 696 931 2 846 316 1 339 683 7 882 930 Investment properties held for sale 227 100 69 739 50 200 347 039 Change in fair value of investment properties 18 137 21 631 (107) 39 661
June 2009Revenue 485 109 423 794 173 785 1 082 688 Revenue 477 152 415 700 167 014 1 059 866 Allowance for future rental escalations 7 957 8 094 6 771 22 822 Segmental resultOperating profit 305 783 258 132 122 662 (36 833) 649 744 Other informationDepreciation 8 039 2 120 1 039 11 198 Investment properties 3 679 586 2 732 279 1 306 212 7 718 077 Investment properties held for sale 217 500 89 300 55 500 362 300
* Includes management expenses of R36,171 million and general Fund expenses of R5,776 million. No segment analysis of liabilities and the related interest payable has been presented as liabilities cannot be linked to specific properties.
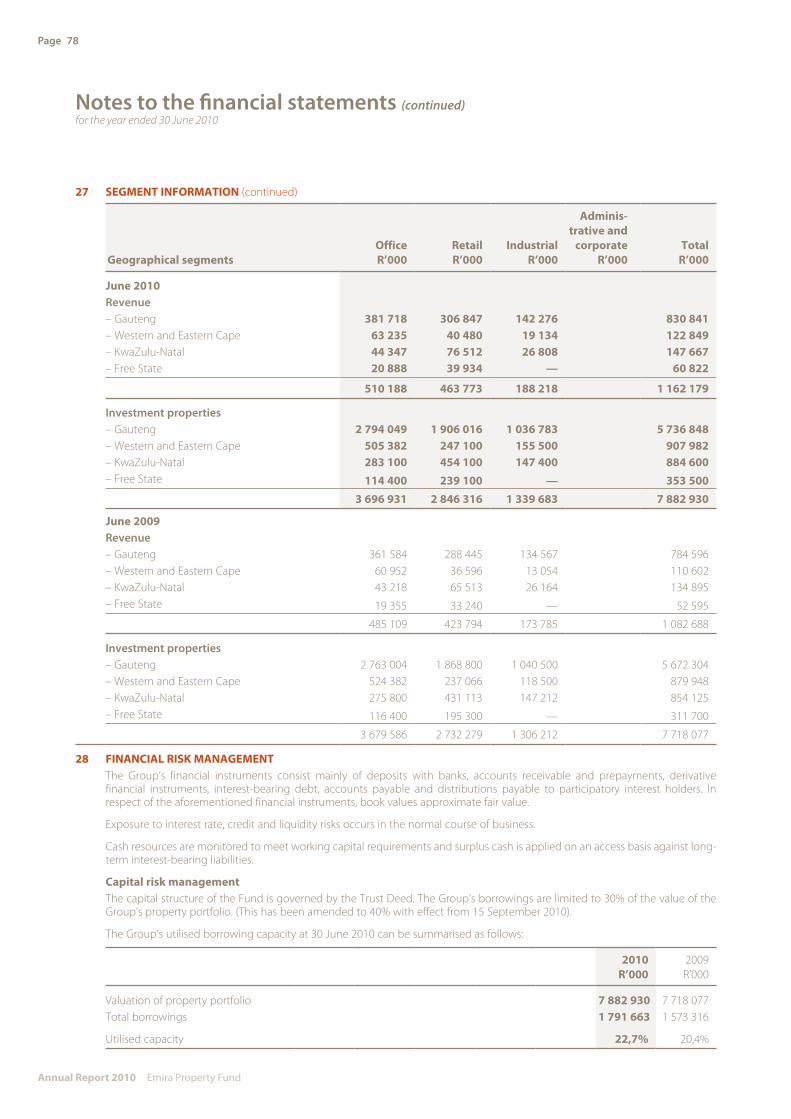
Page 78
Annual Report 2010 Emira Property Fund
Notes to the financial statements (continued)for the year ended 30 June 2010
27 seGMent InFoRMAtIon (continued)
Geographical segmentsofficeR’000
RetailR’000
IndustrialR’000
Adminis- trative and
corporateR’000
totalR’000
June 2010Revenue– Gauteng 381 718 306 847 142 276 830 841 – Western and Eastern Cape 63 235 40 480 19 134 122 849 – KwaZulu-Natal 44 347 76 512 26 808 147 667 – Free State 20 888 39 934 — 60 822
510 188 463 773 188 218 1 162 179
Investment properties– Gauteng 2 794 049 1 906 016 1 036 783 5 736 848 – Western and Eastern Cape 505 382 247 100 155 500 907 982 – KwaZulu-Natal 283 100 454 100 147 400 884 600 – Free State 114 400 239 100 — 353 500
3 696 931 2 846 316 1 339 683 7 882 930
June 2009Revenue– Gauteng 361 584 288 445 134 567 784 596 – Western and Eastern Cape 60 952 36 596 13 054 110 602 – KwaZulu-Natal 43 218 65 513 26 164 134 895 – Free State 19 355 33 240 — 52 595
485 109 423 794 173 785 1 082 688
Investment properties– Gauteng 2 763 004 1 868 800 1 040 500 5 672 304 – Western and Eastern Cape 524 382 237 066 118 500 879 948 – KwaZulu-Natal 275 800 431 113 147 212 854 125 – Free State 116 400 195 300 — 311 700
3 679 586 2 732 279 1 306 212 7 718 077
28 FInAncIAL RIsk MAnAGeMentThe Group’s financial instruments consist mainly of deposits with banks, accounts receivable and prepayments, derivative financial instruments, interest-bearing debt, accounts payable and distributions payable to participatory interest holders. In respect of the aforementioned financial instruments, book values approximate fair value.
Exposure to interest rate, credit and liquidity risks occurs in the normal course of business.
Cash resources are monitored to meet working capital requirements and surplus cash is applied on an access basis against long-term interest-bearing liabilities.
capital risk managementThe capital structure of the Fund is governed by the Trust Deed. The Group’s borrowings are limited to 30% of the value of the Group’s property portfolio. (This has been amended to 40% with effect from 15 September 2010).
The Group’s utilised borrowing capacity at 30 June 2010 can be summarised as follows:
2010R’000
2009R’000
Valuation of property portfolio 7 882 930 7 718 077 Total borrowings 1 791 663 1 573 316
Utilised capacity 22,7% 20,4%

Page 79
Annual Report 2010 Emira Property Fund
28 FInAncIAL RIsk MAnAGeMent (continued)Market riskMarket risk is the risk that the fair value or future cash flows of a financial instrument will fluctuate because of changes in market prices. The Group’s market risks arise from changes in foreign currency exchange rates and interest rates. The Group enters into interest rate swap agreements to mitigate the risk of rising interest rates as set out in note 18.
Foreign currency risk managementThe Group’s exposure to exchange rate fluctuations arises through the investment in a listed foreign asset.
The following table details the Group’s sensitivity to a 10% increase and decrease in the rand against the Australian dollar. 10% is the sensitivity rate used when reporting foreign currency risk internally to key management personnel and represents management’s assessment of the reasonably possible change in foreign exchange rates.
Increase Decrease
2010R’000
2009R’000
2010R’000
2009R’000
Profit or loss 11 967 — (11 967) —Investment in listed property investments 11 967 — (11 967) —
Interest rate risk managementThe Group’s exposure to interest rates on financial instruments at the date of the statement of financial position set out in note 21.
Interest rates are constantly monitored and appropriate steps are taken to ensure that the Group’s exposure to interest rate fluctuations is limited. Interest rates have been fixed for extended periods ranging from 2013 to 2023. The average rate of interest at 30 June 2010 (applicable to the fixed interest rate agreements) was 9,51% (2009: 9,61%).
At 30 June 2010, 5,8% of Emira’s debt was subject to a variable or floating interest rate and was not covered by an interest rate swap agreement. An increase in the prime interest rate of 1% per annum would result in an increase in interest payable, of R1,1 million per annum, in respect of the floating portion of the Group’s debt.
credit risk managementCredit risk is limited to the carrying amount of financial assets at the balance sheet date.
Potential areas of credit risk consist of trade receivables and short-term cash investments. Trade receivables consist of a large, widespread tenant base. All specific doubtful debts have been impaired and at year-end management did not consider there to be any material credit risk exposure that was not already covered by an impairment adjustment.
The impairment adjustment at 30 June 2010 was R24,7 million (2009: R18,5 million) net of tenants’ deposits and guarantees held as security. The Group held cash deposits and guarantees with a fair value of R92,3 million at 30 June 2010 (2009: R79,6 million).
The specifically impaired receivables relate to tenants who have either been handed over for non-payment, or have vacated the premises.
It is expected that a portion of the specifically impaired receivables will be recovered.
The allowance for impaired receivables and receivables written off are included in property expenses. Amounts charged to the allowance will be written off when all avenues for recovery have been exhausted and there is no expectation that any further cash will be received.
At 30 June 2010 no geographic area, rental sector or size of tenant had been identified as a specific credit risk.
Receivables past due but not impairedReceivables are considered to be “past due” when they are uncollected one day or more beyond their contractual due date.
As at 30 June 2010, trade receivables of R34,4 million (2009: R21,7 million) were considered past due but not impaired.
These include varied tenants with no recent history of payment default.

Page 80
Annual Report 2010 Emira Property Fund
Notes to the financial statements (continued)for the year ended 30 June 2010
28 FInAncIAL RIsk MAnAGeMent (continued)
Liquidity risk managementLiquidity risk is the risk that the Group will be unable to meet its financial commitments. The risk is minimised by holding cash balances and by a floating loan facility.
The Group monitors liquidity risk by regularly monitoring forecast cash flows. The Group will utilise its undrawn loan facilities in order to meet its short-term cash flow obligations. Negotiations are taking place regarding the financing of the repayment of the CMBS notes, in June 2011, of R500 million.
The following table details the maturity of financial assets and liabilities and is used by management to manage liquidity risks.
The amounts disclosed in the below table are the contractual undiscounted cash flows. Undiscounted cash flows in respect of balances due within one year or less generally equal their carrying amounts in the statement of financial position as the impact of discounting is not significant.
The fair value of the derivative financial instruments fluctuates in line with interest rate movements. This value will reduce to nil on expiry date.
weightedaverage
effectiveinterest
rate%
1 yearor lessR’000
1 – 5 yearsR’000
More than5 years
R’000total
R’000
Year ended 30 June 2010Financial assetsListed property investment 119 667 119 667 Accounts receivable 62 845 62 845 Cash and cash equivalents 6,0 – 7,0 40 681 40 681
Total financial assets 103 526 119 667 — 223 193
Financial liabilitiesRedeemable preference shares 9,19 200 000 200 000 Interest-bearing debt 9,51 500 000 1 091 663 1 591 663 Accounts payable 215 357 215 357 Derivative financial instruments 57 001 57 001 Distributions payable to participatory interest holders 274 354 274 354
Total financial liabilities 1 046 712 1 291 663 — 2 338 375
Year ended 30 June 2009Financial assetsAccounts receivable 51 892 51 892 Derivative financial instruments 6 817 6 817 Cash and cash equivalents 7,0 – 11,5 36 524 36 524
Total financial assets 95 233 — — 95 233
Financial liabilitiesRedeemable preference shares 9,69 200 000 200 000 Interest-bearing debt 9,61 1 373 316 1 373 316 Accounts payable 199 627 199 627 Distributions payable to participatory interest holders 255 914 255 914
Total financial liabilities 455 541 1 573 316 — 2 028 857

Page 81
Annual Report 2010 Emira Property Fund
28 FInAncIAL RIsk MAnAGeMent (continued)equity price riskThe listed property investment of R119 667 000 (2009: Rnil) is subject to equity price risk. It is reflected at fair value based on the quoted bid price at 30 June 2010, of AUD1,80. The following table details the Group’s sensitivity to a 10% increase or decrease in the quoted price of the listed property investment on the Australian Stock Exchange.
2010R’000
2010R’000
2009R’000
2009R’000
10% 10% 10% 10% Increase Decrease Increase Decrease
Listed property investment 11,967 (11,967) — —
cash and cash equivalentsIt is Group policy to deposit short-term cash investments with FirstRand Bank Limited, which has been given an A2 rating by Moody’s Investor Services.
Fair value estimationEffective 1 July 2009, the Group adopted the amendment to IFRS 7 for financial instruments that are measured in the statement of financial position at fair value, this requires disclosure of fair value measurements by level of the following fair value measurement hierarchy:– Quoted prices (unadjusted) in active markets for identical assets or liabilities (level 1).– Inputs other than quoted prices included within level 1 that are observable for the asset or liability, either directly (that is, as
prices) or indirectly (that is, derived from prices) (level 2).– Inputs for the asset or liability that are not based on observable market data (that is, unobservable inputs) (level 3).
The following table presents the Group’s assets and liabilities that are measured at fair value at 30 June 2010.
R’000 Level 1 Level 2 Level 3total
balance
AssetsFinancial assets at fair value through profit or loss– Listed property investment 119 667 119 667
total assets 119 667 — — 119 667
LiabilitiesFinancial liabilities at fair value through profit or loss– Derivative financial instruments 57 001 57 001
total liabilities — 57 001 — 57 001
The fair value of financial instruments traded in active markets is based on quoted market prices at the date of the statement of financial position. A market is regarded as active if quoted prices are readily and regularly available from an exchange, dealer, broker, industry group, pricing service, or regulatory agency, and those prices represent actual and regularly occurring market transactions on an arm’s length basis. The quoted market price used for financial assets held by the Group is the current bid price. These instruments are included in level 1. The instrument included in level 1 comprises an investment in a property trust, listed on the Australian Stock Exchange (ASX), classified as trading security.
The fair value of financial instruments that are not traded in an active market (for example, over-the-counter derivatives) is determined by using valuation techniques. These valuation techniques maximise the use of observable market data where it is available and rely as little as possible on entity specific estimates. If all significant inputs required to fair value an instrument are observable, the instrument is included in level 2.
If one or more of the significant inputs is not based on observable market data, the instrument is included in level 3.
Specific valuation techniques used to value financial instruments include:– Quoted market prices or dealer quotes for similar instruments.– The fair value of interest rate swaps is calculated as the present value of the estimated future cash flows based on
observable yield curves.

Page 82
Annual Report 2010 Emira Property Fund
Notes to the financial statements (continued)for the year ended 30 June 2010
29 PoRtFoLIo sUMMARYsectoral profile
office Retail Industrial total
% of GLA 37,0 31,0 32,0 100,0
weighted average lease escalation (%) 9,3 8,0 8,9
Lease expiry profile (% of revenue)Year 1 16,1 9,7 4,6 30,4Year 2 10,6 7,0 2,9 20,5Year 3 16,9 7,2 2,9 27,0Year 4 3,0 3,5 2,1 8,6Year 5+ 3,5 6,8 3,2 13,5
50,1 34,2 15,7 100,0
Lease expiry profile (% of GLA)Vacant 5,9 1,7 1,6 9,2Year 1 12,2 7,2 8,8 28,2Year 2 7,5 5,5 5,6 18,6Year 3 6,5 5,2 5,2 16,9Year 4 2,1 3,8 5,9 11,8Year 5+ 2,7 7,9 4,7 15,3
36,9 31,3 31,8 100,0
vacancy profile (% of GLA) 16,2 5,3 5,1 9,2
Geographical profile
Gauteng
western and
easterncape Free state
kwaZulu-natal total
% of GLA 70,1 12,4 4,5 13,0 100,0 Average annualised yield achieved by the portfolio was 9,2%.
tenant profile
Grade A Grade b Grade c total
% of GLA 44,0 21,0 35,0 100,0
Tenants have been graded as follows:"A" grade: Large national tenants, large listed tenants, government and major franchisees. These include, inter alia, Absa Bank,
Afrox, the Department of Labour, Edgars, FirstRand Bank, JD Group, Pepkor, Pick n Pay Stores, Shell, the Standard Bank Group, Ster-Kinekor, Truworths International and Virgin Active.
"B" grade: National tenants, listed tenants, franchisees and medium to large professional firms. These include, inter alia, Afgri, Builders Express, Debonairs Pizza, Fishaways, John Dory’s, Mikes Kitchen, Postnet, Rage Distribution, Torga Optical, UCS Group, Vodacom, Young & Rubicam and Wimpy.
"C" grade: Other tenants comprise all other tenants that do not fall into the above two categories.

Page 83
Annual Report 2010 Emira Property Fund
30 PARtIcIPAtoRY InteRest (PI) HoLDeRs’ AnALYsIs
number ofholders
% ofholders
number ofparticipatory
interests% of
capital
Directors’ holdings 9 0,24 14 230 947 2,92 Strategic holdings (more than 10%) 1 0,03 101 425 215 20,79 Empowerment partners excluding directors’ holdings 5 0,13 48 372 686 9,91 Non-public 15 0,40 164 028 848 33,62 Public 3 758 99,60 323 798 806 66,38
Totals 3 773 100,00 487 827 654 100,00
Distribution of PI holdersBanks 22 0,58 6 115 134 1,25 Close corporations 34 0,90 1 183 437 0,24 Empowerment 5 0,13 60 880 955 12,48 Endowment funds 125 3,31 8 682 393 1,78 Individuals 2 383 63,16 17 959 385 3,68 Insurance companies 41 1,09 95 713 713 19,62 Investment companies 20 0,53 34 685 527 7,11 Medical schemes 8 0,21 511 289 0,11 Mutual funds 152 4,03 154 087 266 31,59 Nominees and trusts 731 19,38 17 228 403 3,53 Other corporations 22 0,58 731 930 0,15 Private companies 84 2,23 5 192 910 1,06 Public companies 1 0,03 120 000 0,03 Retirement funds 145 3,84 84 735 312 17,37
Totals 3 773 100,00 487 827 654 100,00
Range analysis at 30 June 20101 – 1 000 354 9,38 198 446 0,04 1 001 – 10 000 2 225 58,97 10 656 690 2,18 10 001 – 100 000 911 24,15 26 422 377 5,42 100 001 – 1 000 000 217 5,75 68 798 491 14,10 Over 1 000 000 66 1,75 381 751 650 78,26
Totals 3 773 100,00 487 827 654 100,00
The following holders of PIs hold, beneficially directly or indirectly, at 30 June 2010, in excess of 5% of the issued participatory interest capital:HolderMomentum Group 101 425 215 20,79 Tiso Group 42 271 468 8,67
List of managers managing in excess of 5% of the issued participatory interest capitalManagerSTANLIB 54 618 482 11,20

Page 84
Annual Report 2010 Emira Property Fund
Notes to the financial statements (continued)for the year ended 30 June 2010
30 PARtIcIPAtoRY InteRest (PI) HoLDeRs’ AnALYsIs At 30 JUne 2010 (continued)
The holdings of the directors of STREM in the participatory interests of the Fund at 30 June 2010 were:
Director
beneficialdirect2010
beneficialindirect
2010
Held by associates
2010total 2010
beneficialdirect2009
beneficialindirect
2009
Held by associates
2009total2009
executive directorsWarren Schultze 391 000 391 000 391 000 391 000James Templeton 349 800 349 800 349 800 349 800Peter Thurling 32 000 188 000 220 000 32 000 188 000 220 000non-executive directorsMichael Aitken 20 000 288 000 308 000 20 000 288 000 308 000Liliane Barnard (Resigned 5 August 2009) 2 049 950 2 049 950Bryan Kent 413 878 413 878 413 878 413 878Nocawe Makiwane 1 511 133 1 511 133 1 511 133 1 511 133Thys Neser 20 000 20 000 40 000 20 000 20 000 40 000Nkululeko Sowazi 7 820 221 7 820 221 7 820 221 7 820 221Ben van der Ross 3 176 915 3 176 915 3 176 915 3 176 915
totals 401 800 13 521 147 308 000 14 230 947 401 800 13 521 147 2 357 950 16 280 897
Since the end of the financial year to the date of this report, the interests of directors have remained unchanged.

Page 85
Annual Report 2010 Emira Property Fund
31 PRoPeRtY LIstInG (IncLUDInG new AcqUIsItIons)
type Property Location Major tenant GLA
(m2)
30 June2010
valuationR
weighted average
gross rent/m² (incl parking)
% of sector
% of portfolio
Office 100 on Armstrong# 100 Armstrong Avenue, Forest Park La Lucia Ridge, Durban
Imperial Bank (Pty) Limited, Nurturing Orphans of Aids for Humanity, Momentum Group Limited, Glaxosmithkline SA (Pty) Limited
2 871 31 700 000 107,62 0,9 0,4
Office 1059 Schoeman Street 1059 Schoeman Street, Hatfield SABC Limited, United Nations Office for Drug Control & Crime Prevention, The Embassy of Ireland, Khuthele Projects (Pty) Limited
6 047 55 500 000 96,83 1,5 0,7
Office 12 Baker Street* 12 Baker Street, Rosebank Sasol Group Services (Pty) Limited 4 636 45 300 000 93,13 1,2 0,6Office 122 Pybus Road# 122 Pybus Road, Sandton Rennies Travel (Pty) Limited, SBT Juul
South Africa, Cloudberry Investments 13 (Pty) Limited, Bombela Civils Joint Venture (Pty) Limited, Gecamines
5 340 33 209 000 62,64 0,9 0,4
Office 2 Frosterley Park* 2 Frosterley Crescent, La Lucia Ridge, Umhlanga Rocks, Durban
Telesure Group Services (Pty) Limited 2 312 28 200 000 93,13 0,8 0,4
Office 2 Sturdee Avenue* 2 Sturdee Avenue, Rosebank Sasol Group Services (Pty) Limited 5 603 53 100 000 93,13 1,4 0,7Office 267 West# 267 West Avenue, Centurion Afgri Capital, a division of Afgri
Operations Limited, FirstRand Bank Limited, FNB Life
9 799 78 500 000 103,50 2,1 1,0
Office Albury Park Magalieszicht Avenue, Dunkeld West, Sandton
The Resolve Group (Pty) Limited, Northam Platinum Limited, Pin Point One Human Resources (Pty) Limited, Bouwers Intellectual Property Attorney, Trilion Video Eight (Pty) Limited
8 107 72 900 000 86,27 2,0 0,9
Office Bank Forum 337 Veale Street, New Muckleneuk Pretoria
Newtons Incorporated, Nedbank Limited, Bild Architects, VFS Visa Processing (SA) (Pty) Limited, Finbond Property Finance Limited, Afrilink Leisuretainment (Pty) Limited, SA Home Loans
7 466 70 200 000 92,39 1,9 0,9
Office Boundary Terraces 1 Mariendahl Lane, Newlands Cape Town
ASISA, Pinnacle Point Investments (Pty) Limited, Resafrica (Pty) Limited, RMB Asset Management (Pty) Limited, Dayspring Holdings SA (Pty) Limited
8 211 106 000 000 98,15 2,9 1,3
Office Braamfontein Centre 23 Jorissen Street, Braamfontein Pick n Pay, Centre for the Study of Violence & Reconciliation, The Ford Foundation, T & T Appointments, Spectrium Consulting (Pty) Limited
20 776 121 600 000 69,41 3,3 1,5
Office Bradenham Hall# Mellis Avenue, Rivonia Millward Brown SA (Pty) Limited, QAD Software South Africa (Pty) Limited, Strats Solutions CC, IFS Consulting (Pty) Limited
4 569 42 169 000 73,99 1,1 0,5
Office Brooklyn Office Park# 105 Nicolson Street, Brooklyn Mazars Moores Rowland, Discovery Health, KMG and Associates Inc, Austrian Embassy, Mosela Rating Agency, Pracmed, Cassells Accountants Incorporated
5 364 40 191 000 74,52 1,1 0,5
* Single tenant – weighted average for all single-tenant buildings in office sector – R93,13/m².# Independently valued at 30 June 2010.

Page 86
Annual Report 2010 Emira Property Fund
31 PRoPeRtY LIstInG (IncLUDInG new AcqUIsItIons) (continued)
type Property Location Major tenant GLA
(m2)
30 June2010
valuationR
weighted average
gross rent/m² (incl parking)
% of sector
% of portfolio
Office Century Gate# Cnr Bosmandam Road and Century Drive, Century City
Med-e-Mass (Pty) Limited, Imperial Online, Academy of Advanced Technology (Pty) Limited
1 366 8 200 000 49,54 0,2 0,1
Office Chiappini House 26 Chiappini Street, Cape Town Icicle Investments (Pty) Limited, Diamond’s Discount Liquor (Pty) Limited, The Big Picture Company, Hey Papa Legend CC
1 020 10 300 000 84,26 0,3 0,1
Office Ciros House 41A Homestead Avenue, Edenburg
Vacant 1 838 8 700 000 — 0,2 0,1
Office CRB House Cnr Kramer & Desmond Streets Kramerville
St Leger & Viney (Pty) Limited, XDSL Trading 561 (Pty) Limited, Woodlam (Pty) Limited, Sol Danka (Pty) Limited
5 940 25 500 000 44,79 0,7 0,3
Office Dalefern# 284 Oak Avenue, Ferndale Only the Best (Pty) Limited, Primedia @ Home (Pty) Limited, Population Council, Health Science Academy (Pty) Limited, Orica South Africa (Pty) Limited, Khetha Staffing Services (Pty) Limited
3 787 20 500 000 66,33 0,6 0,3
Office Deloitte*# Cnr Fehrsen Street & Waterkloof Road, Brooklyn
Deloitte and Touche 4 094 42 108 000 93,13 1,1 0,5
Office Derby Downs# 9 Derby Place and 4 Sookhai Place Derby Downs
Lafarge South Africa (Pty) Limited, McCarthy Limited, Tarsus Technologies (Pty) Limited, Tradebridge (Pty) Limited
2 205 19 800 000 87,37 0,5 0,3
Office Discovery Health PTA* Oak Road, Centurion Discovery Health (Pty) Limited 3 863 42 600 000 93,13 1,2 0,5Office Dorbyl Parktown# 16 Jan Smuts Avenue, Parktown Pyromet (Pty) Limited 2 346 27 978 000 99,34 0,8 0,4Office Dresdner House 2 North Road, Dunkeld West Interact Research Design and
Training CC 834 9 500 000 63,24 0,3 0,1
Office East Coast Radio House# 314/7 Umhlanga Rocks Drive Umhlanga Rocks
East Coast Radio (Pty) Limited, Strauss Daly Inc, Absa Bank Limited, Dimension Data (Pty) Limited, IT Careers (Pty) Limited
6 804 54 300 000 81,01 1,5 0,7
Office East Rand Junction# Cnr Pond & Frank Streets, Boksburg
Hammond Pole Inc, Afgri Operations Limited, WesBank, Virtual Card Aquiring (Pty) Limited
6 710 47 000 000 73,95 1,3 0,6
Office Epsom Downs Office Park#
13 Sloane Street, Bryanston Angor Property Specialists (Pty Limited, Modernarch Offices (Pty) Limited, Davbel CC, WBHO Construction (Pty) Limited, Foster-Mellar (Pty) Limited, Pra Pharmaceuticals SA
9 552 81 813 000 69,05 2,2 1,0
Office Faerie Glen 291 Sprite Avenue, Faerie Glen Softline VIP, FirstRand Bank Limited, South Africa Local Government Association, WesBank, Sportron International
10 324 131 200 000 120,67 3,5 1,7
Office Fleetway House 17 Martin Hammerschlag Way Cape Town
Management Computer Services, Print Active CC, The Property Administrators Cape (Pty) Limited, M & S Shipping, Cape Star Diamond CC, Academy of Maritime Medicine CC
7 103 36 300 000 47,62 1,0 0,5
* Single tenant – weighted average for all single-tenant buildings in office sector – R93,13/m².# Independently valued at 30 June 2010.
Notes to the financial statements (continued)for the year ended 30 June 2010
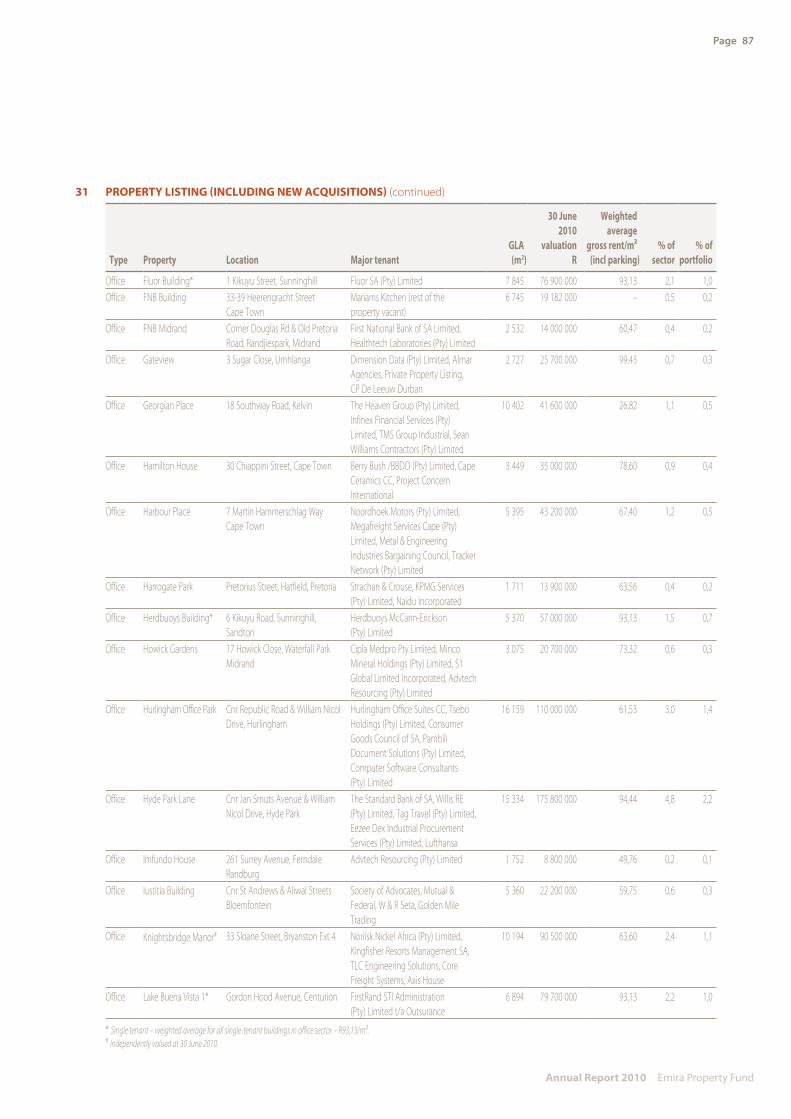
Page 87
Annual Report 2010 Emira Property Fund
31 PRoPeRtY LIstInG (IncLUDInG new AcqUIsItIons) (continued)
type Property Location Major tenant GLA
(m2)
30 June2010
valuationR
weighted average
gross rent/m² (incl parking)
% of sector
% of portfolio
Office Fluor Building* 1 Kikuyu Street, Sunninghill Fluor SA (Pty) Limited 7 845 76 900 000 93,13 2,1 1,0Office FNB Building 33-39 Heerengracht Street
Cape TownMariams Kitchen (rest of the property vacant)
6 745 19 182 000 – 0,5 0,2
Office FNB Midrand Corner Douglas Rd & Old Pretoria Road, Randjiespark, Midrand
First National Bank of SA Limited, Healthtech Laboratories (Pty) Limited
2 532 14 000 000 60,47 0,4 0,2
Office Gateview 3 Sugar Close, Umhlanga Dimension Data (Pty) Limited, Almar Agencies, Private Property Listing, CP De Leeuw Durban
2 727 25 700 000 99,43 0,7 0,3
Office Georgian Place 18 Southway Road, Kelvin The Heaven Group (Pty) Limited, Infinex Financial Services (Pty) Limited, TMS Group Industrial, Sean Williams Contractors (Pty) Limited
10 402 41 600 000 26,82 1,1 0,5
Office Hamilton House 30 Chiappini Street, Cape Town Berry Bush /BBDO (Pty) Limited, Cape Ceramics CC, Project Concern International
3 449 35 000 000 78,60 0,9 0,4
Office Harbour Place 7 Martin Hammerschlag Way Cape Town
Noordhoek Motors (Pty) Limited, Megafreight Services Cape (Pty) Limited, Metal & Engineering Industries Bargaining Council, Tracker Network (Pty) Limited
5 395 43 200 000 67,40 1,2 0,5
Office Harrogate Park Pretorius Street, Hatfield, Pretoria Strachan & Crouse, KPMG Services (Pty) Limited, Naidu Incorporated
1 711 13 900 000 63,56 0,4 0,2
Office Herdbuoys Building* 6 Kikuyu Road, Sunninghill, Sandton
Herdbuoys McCann-Erickson (Pty) Limited
5 370 57 000 000 93,13 1,5 0,7
Office Howick Gardens 17 Howick Close, Waterfall Park Midrand
Cipla Medpro Pty Limited, Minco Mineral Holdings (Pty) Limited, S1 Global Limited Incorporated, Advtech Resourcing (Pty) Limited
3 075 20 700 000 73,32 0,6 0,3
Office Hurlingham Office Park Cnr Republic Road & William Nicol Drive, Hurlingham
Hurlingham Office Suites CC, Tsebo Holdings (Pty) Limited, Consumer Goods Council of SA, Pambili Document Solutions (Pty) Limited, Computer Software Consultants (Pty) Limited
16 159 110 000 000 61,53 3,0 1,4
Office Hyde Park Lane Cnr Jan Smuts Avenue & William Nicol Drive, Hyde Park
The Standard Bank of SA, Willis RE (Pty) Limited, Tag Travel (Pty) Limited, Eezee Dex Industrial Procurement Services (Pty) Limited, Lufthansa
15 334 175 800 000 94,44 4,8 2,2
Office Imfundo House 261 Surrey Avenue, Ferndale Randburg
Advtech Resourcing (Pty) Limited 1 752 8 800 000 49,76 0,2 0,1
Office Iustitia Building Cnr St Andrews & Aliwal Streets Bloemfontein
Society of Advocates, Mutual & Federal, W & R Seta, Golden Mile Trading
5 360 22 200 000 59,75 0,6 0,3
Office Knightsbridge Manor# 33 Sloane Street, Bryanston Ext 4 Norilsk Nickel Africa (Pty) Limited, Kingfisher Resorts Management SA, TLC Engineering Solutions, Core Freight Systems, Axis House
10 194 90 500 000 63,60 2,4 1,1
Office Lake Buena Vista 1* Gordon Hood Avenue, Centurion FirstRand STI Administration (Pty) Limited t/a Outsurance
6 894 79 700 000 93,13 2,2 1,0
* Single tenant – weighted average for all single-tenant buildings in office sector – R93,13/m².# Independently valued at 30 June 2010.

Page 88
Annual Report 2010 Emira Property Fund
Notes to the financial statements (continued)for the year ended 30 June 2010
31 PRoPeRtY LIstInG (IncLUDInG new AcqUIsItIons) (continued)
type Property Location Major tenant GLA
(m2)
30 June2010
valuationR
weighted average
gross rent/m² (incl parking)
% of sector
% of portfolio
Office Lincoln Wood Office Park#
6 & 8 Woodlands Drive, Woodmead
African Legend Indigo (Pty) Limited, Intersite Property Management Services (Pty) Limited, ZTE Corporation SA, Reunert Management Services Limited
10 911 109 690 000 83,87 3,0 1,4
Office Linkview 260 Kent Avenue, Ferndale Randburg
Aqua Engineering SA (Pty) Limited, Aqua Earth Consulting CC, Siyaka Holdings (Pty) Limited
1 524 7 200 000 62,97 0,2 0,1
Office Lone Creek# 21 Mac Mac Road & Howick Close Waterfall Park, Midrand
Cement and Concrete Institute, End User Finance, Regional Tourism Organisation of Southern Africa, Batseta Consulting CC, B2B Placements CC, Cedar Point Trading 308 (Pty) Limited, Leonard Cheshire International SA
5 659 40 500 000 65,81 1,1 0,5
Office Lynnridge Mews# 22 Hibiscus Street, Lynnwood Ridge
SA National Tutor Services, Phakama Funeral Society, Freeworld Travel (Pty) Limited
3 533 19 139 000 45,28 0,5 0,2
Office Menlyn 116 Lois Avenue, Menlyn Absa Bank Limited, The Standard Bank of South Africa Limited, First National Asset Management and Trust Company, FirstRand Bank Limited, Discovery Health (Pty) Limited, Liberty Group Limited
9 852 103 000 000 98,49 2,8 1,3
Office Midrand Business Park 563 Main Road, Halfway House Midrand
Rentcorp Africa Technical, Construction Education & Training Authority, Ngubane & Co Management Consultants (Pty) Limited, Postnet Southern Africa (Pty) Limited, Celtrac (Pty) Limited
13 373 57 900 000 39,09 1,6 0,7
Office Momentum House# 125 Florence Nzama Street, Durban
Grafton Everest, Tshwane University of Technology, Larson Burton & Falconer Inc, Push to Talk Africa (Pty) Limited, Mkyaya Security & Protection Services (Pty) Limited
6 249 41 700 000 61,23 1,1 0,5
Office Newlands Terraces 8 Boundary Road, Newlands UCS Solutions (Pty) Limited, The Western Province Rugby Football Union, Taquanta Asset Management (Pty) Limited
4 251 70 800 000 124,37 1,9 0,9
Office Nimas House# No. 5 The Boulevard, Westway Office Park, Westville
Metropolitan Health Corporate (Pty) Limited, Uniclox (Pty) Limited, Dr Shirish Bhaga
1 372 18 400 000 128,83 0,5 0,2
Office Olivedale Office Park Cnr Olive & Lima Street, Olivedale Randburg
CRS Holdings, DNA Telesales CC, Birthday Suit Corporate Gifts CC, Associated Neural Technologies CC & Interact Accounting Services CC
3 227 17 300 000 61,92 0,5 0,2
Office Omni Centre 73 Aliwal Street, Bloemfontein Free State Province Dept of Education, Metropolitan Health Corporate, MM & Associates Consulting Engineers
5 447 22 500 000 34,64 0,6 0,3
* Single tenant – weighted average for all single-tenant buildings in office sector – R93,13/m²# Independently valued at 30 June 2010

Page 89
Annual Report 2010 Emira Property Fund
31 PRoPeRtY LIstInG (IncLUDInG new AcqUIsItIons) (continued)
type Property Location Major tenant GLA
(m2)
30 June2010
valuationR
weighted average
gross rent/m² (incl parking)
% of sector
% of portfolio
Office Oracle House*# 500 Smuts Drive, Halfway House Midrand
Department of Public Works, Vodacom Service Provider Company (Pty) Limited
5 922 70 000 000 93,13 1,9 0,9
Office Podium House 43 Ingersol Road, Lynwood Glen Pretoria
Vacant 4 832 23 700 000 — 0,6 0,3
Office Rentworks 48 Grosvenor Road, Bryanston Rentworks Africa (Pty) Limited, Amadeus Global Travel Distribution Southern Africa (Pty) Limited
3 027 39 850 000 115,83 1,1 0,5
Office Rigel Park*# 446 Rigel Avenue, Erasmusrand Pretoria
Vacant 4 417 45 140 000 93,13 1,2 0,6
Office Riverworld Park 42 Homestead Road, Edenburg The Jupiter Drawing Room (Pty) Limited, Aptus Integrated Solutions, Dunamis Financial Services (Pty) Limited
5 154 37 600 000 83,03 1,0 0,5
Office Sandgate Park# 16 Desmond Street, Eastgate Griffiths & Griffiths CC, Four Moons Trading CC, Sellutions (Pty) Limited, Nicci Boutiques CC, Defence Concepts South Africa (Pty) Limited, John Anthony Ford, Sanlam Limited
12 120 59 000 000 51,57 1,6 0,7
Office Southern Life Plaza 41 Maitland Street, Bloemfontein Free State Legislature, FirstRand Bank Limited
10 697 69 700 000 76,08 1,9 0,9
Office Spoor & Fisher 11* Building 11, Highgrove Office Park Oak Road, Centurion
S and F Management Services (Pty) Limited
4 055 43 400 000 93,13 1,2 0,6
Office Spoor & Fisher 13* Building 13, Highgrove Office Park Oak Road, Centurion
S and F Management Services (Pty) Limited
2 216 23 000 000 93,13 0,6 0,3
Office Strathmore Park# 305 Musgrave Road, Durban Vox Orion (Pty) Limited, Crawford & Co SA (Pty) Limited, HT Insurance Brokers (Pty) Limited, SA Biomedical (Pty) Limited, Positive Packaging Industries SA (Pty) Limited
3 727 31 300 000 97,28 0,8 0,4
Office Sturdee House 9 Sturdee Avenue, Rosebank Netcare Hospitals (Pty) Limited, RA Hellman & Company
1 695 16 200 000 100,36 0,4 0,2
Office The Avenues North 6 Mellis Road, Edenburg, Sandton Connection Group Holdings Limited, Bytes Technology Group Limited, Brand Soldiers CC
3 471 30 700 000 90,47 0,8 0,4
Office The Gables# 320 Duncan Street, Hatfield Pretoria
Securicor (SA) (Pty) Limited, G4S Secure Solutions (SA) (Pty) Limited
2 851 25 962 000 91,79 0,7 0,3
Office The Pinnacle 2 Burg Street, Cape Town Grant Thornton, Cape Town Tourism, Independent Development Trust, Kelly Group Limited, Old Mutual Life Assurance Company SA Limited, Apache Spur Steak Ranch
11 625 100 000 000 86,93 2,7 1,3
Office Tuinhof 265 West Avenue, Centurion Trans Caledon Tunnel Authority, FirstRand Bank Limited, Internex Engineering & Management Consulting (Pty) Limited, Quality Business Consultants
9 182 72 800 000 100,52 2,0 0,9
Office UNDP House* Cnr Leeukop & Naivasha Roads Sunninghill, Sandton
United Nations Development Programme
4 585 50 400 000 93,13 1,4 0,6
* Single tenant – weighted average for all single-tenant buildings in office sector – R93,13/m².# Independently valued at 30 June 2010.

Page 90
Annual Report 2010 Emira Property Fund
Notes to the financial statements (continued)for the year ended 30 June 2010
31 PRoPeRtY LIstInG (IncLUDInG new AcqUIsItIons) (continued)
type Property Location Major tenant GLA
(m2)
30 June2010
valuationR
weighted average
gross rent/m² (incl parking)
% of sector
% of portfolio
Office WesBank House 21 Riebeek Street, Cape Town Department of Labour, WesBank, Reuters SA, Ian Rubin’s Liquorland
8 693 76 400 000 92,99 2,1 1,0
Office Westway 17 The Boulevard, Westway Office Park, Westville
First National Asset Management & Trust Company, FNB Personal Banking Premier Division, Emmanuel Staffing Services (Pty) Limited, Davis Langdon Africa (Pty) Limited
2 277 32 000 000 124,11 0,9 0,4
Office Woodmead Office Park# 140 & 145 Western Services Road Woodmead
DBT Technologies (Pty) Limited, ECI Africa Consulting (Pty) Limited, SIMPROSS, Cummins South Africa (Pty) Limited, Musgrave Agencies CC
17 514 163 100 000 67,02 4,4 2,1
Subtotal Office 447 289 3 696 931 000 76,09 100 47# Independently valued at 30 June 2010.
Retail Bizana Shopping Centre Main Road, Bizana Boxer Superstores, Barnetts, Pep, Power Factory Shop, KFC Bizana, Discom, Express Stores
4 865 15 000 000 49,11 0,5 0,2
Retail Boskruin Shopping Centre#
Cnr President Fouché & Hawken Avenue, Bromhof
Woolworths (Pty) Limited, Boskruin Village Hardware Centre, Luigi’s Pizzeria, Keg & Countryman, Medicare Pharmacy, CNA
6 752 95 500 000 117,35 3,4 1,2
Retail Brandwag# Melville Drive, Brandwag, Bloemfontein
Pick n Pay Retailers (Pty) Limited, Engen Petroleum Limited, FNB Learning, First National Bank of SA Limited, Pepkor Retail Limited, Baby Boom Toy Boom, Mellin & Partners, Catch 22
12 253 109 000 000 84,27 3,8 1,4
Retail Central Square Idutywa Cnr Bell Street & Kiddell, King & Richards Roads, Idutywa
Pep Stores, Buzi Cash & Carry, Dunns, Power Factory Shop, Carelishelf Investments, Bao Cheng Trading CC, Thekwini Stores
4 024 19 800 000 53,85 0,7 0,3
Retail Centurion Discount Centre
1289 Heuwel Avenue, Centurion Fabric & Décor, Creative Costumes and Masks, Angling Africa Fishing Tackle Centurion CC
2 049 9 600 000 28,03 0,3 0,1
Retail Cofimvaba Shopping Centre
Main Road, Cofimvaba Boxer Superstores, Discom, Ellerines Furnishers, Lewis Stores, Empire Furniture & Hardware
4 938 22 200 000 57,70 0,8 0,3
Retail Cresta Corner# Cnr Beyers Naudé Drive & Pendoring Street, Cresta
Virgin Active (Pty) Limited, Audi Centre Northcliff
8 469 50 520 000 64,61 1,8 0,6
Retail Dundee Boulevard Karel Landsman Street, Dundee Pick n Pay Retailers, Edcon (Pty) Limited, Woolworths, Truworths, Milady’s, Talana Bottle Store
6 749 28 400 000 57,45 1,0 0,4
Retail Epsom Downs Shopping Centre
13 Sloane Street, Bryanston Pick n Pay, Woolworths (Pty) Limited, Nedbank Limited, Mica Hardware, Kentucky Fried Chicken, Ricardo Fabre Restaurants
6 747 65 700 000 99,24 2,3 0,8
* Single tenant – weighted average for all single-tenant buildings in retail sector – R58,41/m².# Independently valued at 30 June 2010.

Page 91
Annual Report 2010 Emira Property Fund
31 PRoPeRtY LIstInG (IncLUDInG new AcqUIsItIons) (continued)
type Property Location Major tenant GLA
(m2)
30 June2010
valuationR
weighted average
gross rent/m² (incl parking)
% of sector
% of portfolio
Retail Flagstaff Shopping Centre
Main Road, Flagstaff Engen Petroleum Limited, Boxer Superstores, Blue Sky Import & Export, The Standard Bank, Bawinile Thando Supermarket
4 030 12 500 000 32,91 0,4 0,2
Retail Gateway# 1319 Pretoria Street, Hatfield McDonalds SA (Pty) Limited, Kentucky Fried Chicken, Hatfield Liquor CC
1 763 16 332 000 119,85 0,6 0,2
Retail Gift Acres# 441 Queens Crescent, Lynnwood Ridge, Pretoria
Woolworths (Pty) Limited, Younique (Pty) Limited, Cheeky Monkey Bar, Liquor City Lynnwood, Mimmo’s Gift Acres, Kanhym Varsvleis Deli, Universal Paints, Kentucky Fried Chicken
8 982 65 239 000 83,25 2,3 0,8
Retail Granada Square 16 Chartwell DriveUmhlanga Rocks
Woolworths, Absa Bank, John Dory’s Fish & Grill, Independent Management & Projects (Pty) Limited, Creative Beads, Europa Umhlanga, Microsoft (SA)
7 161 88 400 000 93,18 3,1 1,1
Retail Greytown Centre Bell Street, Greytown Shoprite Checkers (Pty) Limited, Pepkor Retail Limited, Dunn’s, Kentucky Fried Chicken, Capitec Bank Limited
2 272 9 100 000 46,78 0,3 0,1
Retail Home Centre 2 Ilala Avenue, Springfield Park Durban
Builders Express, B & J Meltz (Proprietary) Limited, Geen & Richards, Furniture City Home Centre, Fruit and Veg City Holdings (Pty) Limited, Greg’s Bedding CC, Outdoor Warehouse
17 648 105 400 000 77,66 3,7 1,3
Retail Ingwavuma Shopping Centre
Main Road, Ingwavuma Supatrade Spa, Ellerine Furnishers, Pepkor Retail (Pty) Limited, Ithala Bank
4 886 23 800 000 53,01 0,8 0,3
Retail Kokstad Shopping Centre
Main Street, Kokstad Rhino Cash & Carry, Edcon (Pty) Limited, Barnetts, Price & Pride, Jwayelani Butchery, Joshua Doore
9 196 37 500 000 46,84 1,3 0,5
Retail Kokstad Boxers* Main Street, Kokstad Boxer Superstores (Pty) Limited 1 837 5 700 000 58,41 0,2 0,1Retail Kosmos Woonstelle# 1 Wannenberg Street, Brandwag
Bloemfontein28 Residential Apartments — 5 100 000 1659,52 per unit 0,2 0,1
Retail Linksfield Road# Linksfield Road, Linksfield Woolworths (Pty) Limited, Regal Palace Chinese Restaurant, Canoa Restaurant, Nike SA (Pty) Limited, Linksfield Pharmacy
4 090 34 500 000 88,72 1,2 0,4
Retail Lynnridge Mall 273 Freesia Street, Lynnwood Ridge, Pretoria
Pick n Pay Stores Limited, Mr Price Group Limited, Absa Bank Limited, Kraal Products CC, The Standard Bank of South Africa Limited, Jimnets Arts and Crafts, Clicks, Lion Bridge
14 220 156 400 000 111,76 5,5 2,0
Retail Market Square# Beacon Way, Plettenberg Bay Pick n Pay Family Store, Woolworths (Pty) Limited, Wellness World, Pepkor Retail Limited, Mr Price Group Limited, Edcon (Pty) Limited, Yellow Wood Spur, Barracloughs Radio Eelctric (Pty) Limited
13 425 109 000 000 78,58 3,8 1,4
Retail Matatiele Centre Station Road, Matatiele Rhino Cash & Carry, Matatiele Power Stores, Pep Stores, Edcon (Pty) Limited, Natal Fashion Wear, Ideals
7 272 35 000 000 63,34 1,2 0,4
* Single tenant – weighted average for all single-tenant buildings in retail sector – R58,41/m².# Independently valued at 30 June 2010.

Page 92
Annual Report 2010 Emira Property Fund
Notes to the financial statements (continued)for the year ended 30 June 2010
31 PRoPeRtY LIstInG (IncLUDInG new AcqUIsItIons) (continued)
type Property Location Major tenant GLA
(m2)
30 June2010
valuationR
weighted average
gross rent/m² (incl parking)
% of sector
% of portfolio
Retail Midrand Motor City 1081 Main Road, Midrand Midrand Action Sports CC, Dent Doctor, Dekra Automotive (Pty) Limited, Midrand Speedy Tyre & Exhaust
8 400 28 200 000 36,71 1,0 0,4
Retail Montana Value Centre 1151 Tibouchina Street, Montana Ext 59
Moresport (Pty) Limited, Vaal Tyre Centre Holdings (Pty) Limited, Ellerines Furnishers (Pty) Limited, Linen For You CC, Hire All (Pty) Limited
9 717 42 400 000 39,08 1,5 0,5
Retail Mutual Mews 333 Rivonia Boulevard, Edenburg Glyda Enterprises CC, African Bank, T & T Appointments, Beverley Johnson Hair CC
1 596 12 600 000 114,96 0,4 0,2
Retail Nongoma Centre Sizwe Road, Nongoma King Super Store, Supatrade Spar, Jet Stores, Price ‘n Pride, Pep Stores, Fashion World
9 061 33 500 000 46,53 1,2 0,4
Retail Nqutu Cnr Manzolwandle & Hlube Roads Nqutu
Boxer Superstores, Town Talk, Power Stores, Chinese Store
3 893 18 000 000 56,31 0,6 0,2
Retail Old Acre Plaza Cnr Victoria & Wilson Streets Dundee
Pop In Supermarket, Shell SA Marketing (Pty) Limited, Edcon (Pty) Limited, Ackermans, Pep, Dunns
6 077 25 200 000 50,41 0,9 0,3
Retail Park Boulevard Retail Centre
11 Brownsdrift Road, Riverside Durban North
Connoisseur Electronics, On Tap, TOMS Sound & Music, Metcash Trading Africa, Etchings, Kaqala Trading (Pty) Limited
5 207 31 000 000 64,23 1,1 0,4
Retail Quagga Centre# Cnr Church & West Streets, Pretoria West
Shoprite Checkers (Pty) Limited, Pick n Pay Stores Limited, Woolworths (Pty) Limited, FirstRand Bank Limited, Edgars Consolidated Stores Limited, Absa Props Gauteng North, The Standard Bank of SA, New Clicks South Africa (Pty) Limited, Mr Price Group Limited, Pepkor Retail Limited
29 748 258 000 000 76,70 9,1 3,3
Retail Randridge Mall Cnr John Vorster Drive & Kayburne Road, Randpark Ridge
Pick n Pay Tvl (Pty) Limited, Dis-Chem, Pep Stores, Randridge Medicine Centre, Truworths, Nedbank, Absa Bank, Cats Café
22 624 207 825 000 65,28 7,3 2,6
Retail Southern Sentrum# Benade Drive, Fichardt Park Bloemfontein
Pick n Pay Stores, Shell SA Marketing (Pty) Limited, First National Bank, Cash Crusaders, Absa Bank, Clicks
21 224 125 000 000 52,48 4,4 1,6
Retail Standard Bank Glenwood*
88 Brand Street, Glenwood, Durban
Standard Bank of South Africa Limited 368 4 500 000 58,41 0,2 0,1
Retail The Colony Centre 345 Jan Smuts Avenue, Craighall Park
Baby City, Worldwide Sports Marketing & Advertising, JDI Consultants, Sing Fei Chinese Restaurant CC, Monterry Spur
7 273 69 700 000 106,17 2,4 0,9
Retail The Tramshed 288 Van der Walt Street, Pretoria Pick n Pay Stores Limited, Virgin Active South Africa (Pty) Limited, The Government of the Republic of South Africa, SA Post Office, Discom Tramshed
12 132 78 800 000 71,81 2,8 1,0
* Single tenant – weighted average for all single-tenant buildings in retail sector – R58,41/m².# Independently valued at 30 June 2010.

Page 93
Annual Report 2010 Emira Property Fund
31 PRoPeRtY LIstInG (IncLUDInG new AcqUIsItIons) (continued)
type Property Location Major tenant GLA
(m2)
30 June2010
valuationR
weighted average
gross rent/m² (incl parking)
% of sector
% of portfolio
Retail Tin Roof Cnr Madeira & Callaway Streets Umtata
Transkei Yamaha, Shoprite Checkers (U-Save), Hungry Lion Fast Foods, Sure Bank
2 175 12 600 000 41,83 0,4 0,2
Retail Tokai Shopping Centre 20 Malibongwe Drive, Ferndale Randburg
Dros Restaurant Randburg CC, Kumnandi Food Company (Pty) Limited, Oriental Curries Restaurant, Mr Video
2 748 18 200 000 80,01 0,6 0,2
Retail Umhlanga Centre 189 Ridge Road, Umhlanga Rocks Buxtons Spar, Il Gusto Ristorante, Mews Pharmacy, Fabulous Bride, Closeout, Soukop & Assoc
5 816 43 600 000 89,50 1,5 0,6
Retail Umzimkulu Centre Cnr National and Franklin Roads Umzimkulu
Rhino Cash & Carry, Barnetts, Pep Stores, Ellerines, Dunns
5 410 21 000 000 53,62 0,7 0,3
Retail Wonderpark Shopping Centre
Cnr Old Brits Road & Heinrich Avenue, Karenpark
Pick n Pay Stores Limited, Masstores (Pty) Limited (Game), Virgin Active South Africa (Pty) Limited, Builders Express, Edcon (Pty) Limited (Edgars), Pepcor Retail Limited, Cashbuild South Africa (Pty) Limited, Woolworths, Chevron SA (Pty) Limited, Ster Kinekor Films, Foschini Retail Group, Mr Price Group Limited
63 360 601 500 000 81,04 21,1 7,6
Retail WorldWear Fashion Mall Cnr Beyers Naudé Drive & Wilsson Road, Fairland
Mr Price Group Limited, Pick n Pay (Pty) Limited, The Pro Shop, Seemann’s Quality Meat, Adidas SA (Pty) Limited, JB Rivers, Col’cacchio Pizzeria, FTV Café
14 186 95 000 000 89,59 3,3 1,2
Subtotal Retail 384 640 2 846 316 000 72,77 100 36
* Single tenant – weighted average for all single-tenant buildings in retail sector – R58,41/m².# Independently valued at 30 June 2010.
Industrial 8 Grader Road* 8 Grader Road, Spartan AIC Chemicals (Pty) Limited 3 437 10 300 000 35,03 0,8 0,1Industrial Admiral House 151 Lechwe Street, Corporate Park
South, Randjiespark Ext 7, MidrandMega Packaging, Kaira Technologies (Pty) Limited, Ne Channel Trading CC, BI Planning Services (Pty) Limited
4 460 23 600 000 47,87 1,8 0,3
Industrial Aeroport – Fulcrum* 96 Loper Avenue, Spartan Ext 2 Kempton Park
Sturrock & Robson Industries (Pty) Limited
3 805 14 100 000 35,03 1,1 0,2
Industrial Aeroport – Grenco*# 98 Loper Avenue, Spartan Ext 2 Kempton Park
Grenco (SA) (Pty) Limited 1 672 7 603 000 35,03 0,6 0,1
Industrial Arjo Wiggins– Mahogany Ridge*
1 Monte Carlo Road, Mahogany Ridge, Pinetown
Antalis (Pty) Limited 6 907 28 300 000 35,03 2,1 0,4
Industrial Barracuda# 82 Lechwe Street, Sage Corporate Park, Randjiespark Ext 70, Midrand
Cambridge Property Holdings (Pty) Limited, OBC Group (Pty) Limited, McCarthy Limited, Maxxis Auto (Pty) Limited
6 524 24 987 000 34,91 1,9 0,3
Industrial Cambridge Park# 22 Witkoppen Road, Paulshof ITEC SA, ITEC North (Pty) Limited, Danfoss (Pty) Limited, Puma South Africa, Netflorist (Pty) Limited
12 788 51 500 000 38,57 3,8 0,7
* Single tenant – weighted average for all single-tenant buildings in industrial sector – R35,03/m².# Independently valued at 30 June 2010.

Page 94
Annual Report 2010 Emira Property Fund
31 PRoPeRtY LIstInG (IncLUDInG new AcqUIsItIons) (continued)
type Property Location Major tenant GLA
(m2)
30 June2010
valuationR
weighted average
gross rent/m² (incl parking)
% of sector
% of portfolio
Industrial Crocker Road Industrial Park
Cnr Peddie & Crocker Roads Wadeville
Edwards & Buckley Systems (Pty) Limited, George John Rubenstein, Gasket Man CC, Plasmar Packaging, Hencetrading 1033 (Pty) Limited
9 883 19 400 000 25,38 1,4 0,2
Industrial Defy Appliances* Cnr Mimetes Rd & Kruger St, Denver
Defy Appliances Limited 10 100 25 500 000 35,03 1,9 0,3
Industrial Electrocom 20 Indianapolis Crescent, Kyalami Park, Midrand
RS Components Limited, VWV Group (Pty) Limited
3 856 14 500 000 31,98 1,1 0,2
Industrial Epping Warehouse (WGA)#
3A Bofors Circle, Epping Industria 2
Nampak Products Limited, Auto Part Distributors (Pty) Limited, Santam
25 076 67 300 000 22,09 5,0 0,9
Industrial Evapco*# Cnr Quality and Barlow Streets Isando
Evapco SA (Pty) Limited 5 753 21 944 000 35,03 1,6 0,3
Industrial Executive City 81 Industrial Road, Kya Sands Blue Chip Lubricants (Pty) Limited, Sensient Colors South Africa (Pty) Limited, Shimba Marketing Distribution Promotion CC, Detonate Hardware Solutions CC
4 558 15 000 000 32,10 1,1 0,2
Industrial Flexitainer# 59 Lechwe Street, Sage Corporate Park, Randjiespark Ext 74, Midrand
Bridging Technologies South Africa (Pty) Limited
1 714 6 096 000 36,40 0,5 0,1
Industrial Fosa Park*# 570 Inanda Road, Durban Adcock Ingram Healthcare (Pty) Limited
4 200 16 700 000 35,03 1,2 0,2
Industrial Freeway Park Cnr Berkley & Upper Camp Roads Ndabeni, Maitland
Torga Optical (Pty) Limited, Southern Canned Products (Pty) Limited, Advanced Material Technology, Hestico (Pty) Limited, Letmerepair CC, Three-D Agencies (Pty) Limited
7 935 35 600 000 54,29 2,7 0,5
Industrial Goodyear Tycon*# 14 Cochrane Avenue, Epping Industria 1
Springs Car Wholesalers CC 5 870 15 600 000 35,03 1,2 0,2
Industrial Greenfields 1451 Chris Hani Road, Redhill Durban
AB Movers KZN CC, Media Film Services SA (Pty) Limited, Alvin Dudley Meyer, VIVA International (Pty) Limited, Rose Nina Trading, Betting World (Pty) Limited
9 398 32 500 000 34,69 2,4 0,4
Industrial Highway Business Park-IST*
36 Park Avenue North Rooihuiskraal, Centurion
Westinghouse Electric South Africa (Pty) Limited
2 362 15 900 000 35,03 1,2 0,2
Industrial Highway-Ceramic World*
95 Park Avenue North Rooihuiskraal, Centurion
Ceramic World 2 369 8 100 000 35,03 0,6 0,1
Industrial Highway-National TT* 95 Park Avenue North Rooihuiskraal, Centurion
Iliad Africa Trading (Pty) Limited 1 616 5 700 000 35,03 0,4 0,1
Industrial Highway-Outdoor Warehouse*
95 Park Avenue North Rooihuiskraal, Centurion
Patels Ceramics (Potchefstroom) (Pty) Limited
1 523 5 800 000 35,03 0,4 0,1
Industrial Highway-Productive Systems*
95 Park Avenue North Rooihuiskraal, Centurion
Productive Systems (Pty) Limited 2 093 9 300 000 35,03 0,7 0,1
Industrial Industrial Village Jet Park#
Cnr Kelly & Estee Ackerman Roads Jet Park
Rene Turck & Associates (Pty) Limited, Humulani Marketing (Pty) Limited, New Deal Trading, Joint Venture Pump Services (Pty) Limited
11 613 36 500 000 30,72 2,7 0,5
* Single tenant - weighted average for all single-tenant buildings in industrial sector – R35,03/m².# Independently valued at 30 June 2010.
Notes to the financial statements (continued)for the year ended 30 June 2010

Page 95
Annual Report 2010 Emira Property Fund
31 PRoPeRtY LIstInG (IncLUDInG new AcqUIsItIons) (continued)
type Property Location Major tenant GLA
(m2)
30 June2010
valuationR
weighted average
gross rent/m² (incl parking)
% of sector
% of portfolio
Industrial Industrial Village Kya Sands
Cnr Elsecar & Barnie Streets Kya Sands
LGB Distributors CC, Poli-Film South Africa (Pty) Limited, Redline Logistics Project Management, Beau Concepts, Bandit Signs CC, Poly Injection Mould Making Services
16 659 45 600 000 26,24 3,4 0,6
Industrial Industrial Village Rustivia 6 Rover Street, Elandsfontein Germiston
ISO Bearings CC, Nobel Brands (Pty) Limited, Level Productions CC, In Line Trading 112 (Pty) Limited, Major Tech (Pty) Limited
9 854 26 900 000 28,33 2,0 0,3
Industrial Isando – Unitrans 20 Anvil Road, IsandoKempton Park
Joshua Doore Warehouse, GMG Power SA (Pty) Limited
12 250 28 300 000 11,17 2,1 0,4
Industrial Johnson & Johnson* 1 Medical Road, Randjiespark Ext 41, Midrand
Johnson & Johnson Medical (Pty) Limited
3 472 15 500 000 35,03 1,2 0,2
Industrial Midline Business Park Cnr Richards Drive & Le Roux Road Midrand
Coated Fabrics (SA) (Pty) Limited, Millington Steel & Alloys CC, Niser Composites SA (Pty) Limited, Flintgroup South Africa (Pty) Limited
12 573 39 900 000 29,50 3,0 0,5
Industrial Mitek South Africa*# 754 16th Road, Randjiespark Midrand
Mitek South Africa (Pty) Limited 6 604 28 906 000 35,03 2,2 0,4
Industrial Morgan Creek*# 38 Mahogany Road, Mahogany Ridge, Pinetown
Simba (Pty) Limited 4 644 17 300 000 35,03 1,3 0,2
Industrial Nampak Building* Nicolson Street, Denver Nampak Cartons & Labels Limited 24 880 18 000 000 35,03 1,3 0,2Industrial New Zealand Milk
Products*Cnr 16th and Douglas Roads Randjiespark, Midrand
Ceva Animal Health (Pty) Limited 2 756 13 900 000 35,03 1,0 0,2
Industrial One Highveld# 5 Bellingham Street, Centurion Spero Sensors and Instruments (Pty) Limited, V-Custom Cycles, Bass, Eclipse Infrastructure Solutions (Pty) Limited, Pro Angling Equipment CC, The Traditional Fish & Chips (Pty) Limited
5 932 25 650 000 45,87 1,9 0,3
Industrial Portion 130 Spartan 34-36 Director Road, Aeroport Spartan
Gallagher Power Fence (SA) (Pty) Limited, Bearing Man Limited t/a Sealco
1 715 6 700 000 23,98 0,5 0,1
Industrial QD House* 91-94 Silverstone Crescent, Kyalami
QD Group (Pty) Limited 3 470 14 900 000 35,03 1,1 0,2
Industrial Rep-Props 12-14 Winnipeg Avenue, Aeroport LUD Logistics (Pty) Limited, Masterguard Fabric Protection Africa (Pty) Limited, Freight-X Cargo Solutions CC, General Pneumatics Natal (Pty) Limited
1 640 6 600 000 37,79 0,5 0,1
Industrial RTT Acsa Park* Cnr Taljaard & Springbok Streets Bardene
Fuel Logistics Group (Pty) Limited 46 673 253 000 000 35,03 18,9 3,2
Industrial RTT Continental* Cnr Springbok & Jones Streets Bardene
Fuel Logistics Group (Pty) Limited 12 921 45 400 000 35,03 3,4 0,6
Industrial Siliconics*# Cnr Precision & Staal RoadsKya Sands
Control Techniques SA (Pty) Limited 1 452 5 297 000 35,03 0,4 0,1
Industrial Starsky House* 9 Dartfield Street, Kramerville Christ Embassy (Pty) Limited 2 450 7 000 000 35,03 0,5 0,1
* Single tenant - weighted average for all single-tenant buildings in industrial sector – R35,03/m².# Independently valued at 30 June 2010.

Page 96
Annual Report 2010 Emira Property Fund
31 PRoPeRtY LIstInG (IncLUDInG new AcqUIsItIons) (continued)
type Property Location Major tenant GLA
(m2)
30 June2010
valuationR
weighted average
gross rent/m² (incl parking)
% of sector
% of portfolio
Industrial Steiner Services* Loper Road, AeroportKempton Park
Steiner Services (Pty) Limited 4 804 17 900 000 35,03 1,3 0,2
Industrial Taylor Blinds 10 Hoist Street, Montague Gardens
Odyssey House (Pty) Limited t/a Taylor Blinds CT
7 794 37 000 000 41,28 2,8 0,5
Industrial Technohub# Corporate Park NorthRoan Crescent, Midrand
Technology Integrated Solutions, Paramount Logistics Corporation SA, Vodacom Services Provider Company (Pty) Limited
15 171 77 500 000 42,72 5,8 1,0
Industrial The Wolds A 82 Intersite AvenueUmgeni Business Park, Umgeni
Datanet Infrastructure Group (Pty) Limited, TNT Express Worldwide SA (Pty) Limited, Prozak Electronic World Durban CC
1 770 4 700 000 44,41 0,4 0,1
Industrial The Wolds B# 56 Intersite AvenueUmgeni Business Park, Umgeni
Heidelberg Graphic Systems SA (Pty) Limited, BID Industrial Holdings (Pty) Limited
1 886 2 000 000 47,81 0,1 0,0
Industrial Umgeni Road A* 98-102 Intersite AvenueUmgeni Business Park, Umgeni
Ubunye Uniforms (Pty) Limited 6 021 5 000 000 35,03 0,4 0,1
Industrial Umgeni Road B 19-23 Intersite AvenueUmgeni Business Park, Umgeni
Pharmaceutical Health Distributors, Barrows Design & Manufacturing (Pty) Limited, Jeevan’s Sarrie Centre (Pty) Limited
12 559 10 000 000 45,15 0,7 0,1
Industrial Universal Print House* 72 Stanhope Place, Briardene Durban North
Universal Print Group (Pty) Limited 13 384 30 900 000 35,03 2,3 0,4
Industrial Wadeville Industrial Village
6 Crocker Road, Wadeville Germiston
Multisurge CC, Zippel Filing and Storage Systems (Pty) Limited, Ferobrake Wadeville, Omeme Electrical Unity, Plan it Safety CC
2 384 33 900 000 27,32 2,5 0,4
Industrial Xpanda 918 Morkels Close, Halfway House Midrand
TCS John Huxley Africa (Pty) Limited, Spray Nozzle (Pty) Limited
830 10 100 000 44,91 0,8 0,1
Subtotal Industrial 386 061 1 339 683 000 33,50 100 17
Total investment properties 1 217 990 7 882 930 000 100
* Single tenant - weighted average for all single-tenant buildings in industrial sector – R35,03/m².# Independently valued at 30 June 2010.
Notes to the financial statements (continued)for the year ended 30 June 2010
Page 97
Annual Report 2010 Emira Property Fund
Strategic Real Estate Managers (Proprietary) Limited (“STREM”)Statement of directors’ responsibilities
Certificate by Company Secretary
The directors are responsible for the preparation, integrity, and fair presentation of the financial statements of Strategic Real Estate Managers (Proprietary) Limited. The financial statements presented on pages 99 to 107 have been prepared in accordance with International Financial Reporting Standards (“IFRS”), and include amounts based on judgements and estimates made by management.
The directors consider that in preparing the financial statements they have used the most appropriate accounting policies, consistently applied and supported by reasonable and prudent judgements and estimates, and that all statements of International Financial Reporting Standards that they consider to be applicable have been followed.
The directors are satisfied that the information contained in the financial statements fairly presents the results of operations for the year and the financial position of the company at year-end. The directors also prepared the other information included in the annual report and are responsible for both its accuracy and its consistency with the financial statements.
The directors have responsibility for ensuring that accounting records are kept. The accounting records should disclose with reasonable accuracy the financial position of the company to enable the directors to ensure that the financial statements comply with the relevant legislation.
Strategic Real Estate Managers (Proprietary) Limited operated in a well-established control environment, which is well documented and regularly reviewed. This incorporates risk management and internal control procedures, which are designed to provide reasonable, but not absolute, assurance that assets are safeguarded and the risks facing the business are being controlled.
The going-concern basis has been adopted in preparing the financial statements. The directors have no reason to believe that the company will not be a going concern in the foreseeable future, based on forecasts and available cash resources. These financial statements support the viability of the company.
The company’s external auditor, PricewaterhouseCoopers Incorporated, audited the financial statements, and their report is presented on page 98.
The financial statements were approved by the board of directors on 30 September 2010 and are signed on its behalf:
BJ van der Ross JWA Templeton Chairman ChiefExecutiveOfficer
We declare that to the best of our knowledge, for the year ended 30 June 2010, the company has lodged with the Registrar of Companies all such returns as are required of a public company in terms of section 268G(d) of the Companies Act, 1973, as amended and all such returns are true, correct and up to date.
ME Harris CompanySecretary

Page 98
Annual Report 2010 Emira Property Fund
Strategic Real Estate Managers (Proprietary) Limited (“STREM”)Report of the independent auditor
InDePenDent AUDItoR’s RePoRt to tHe MeMbeRs oF stRAteGIc ReAL estAte MAnAGeRs (PRoPRIetARY) LIMIteDWe have audited the annual financial statements of Strategic Real Estate Managers (Proprietary) Limited, which comprise the statement of financial position as at 30 June 2010, and the statements of comprehensive income, changes in equity and cash flows for the year then ended, and a summary of significant accounting policies and other explanatory notes, and the directors’ report, as set out on pages 99 to 107.
Directors’ responsibility for the financial statementsThe company’s directors are responsible for the preparation and fair presentation of these financial statements in accordance with International Financial Reporting Standards and in the manner required by the Companies Act of South Africa. This responsibility includes: designing, implementing and maintaining internal control relevant to the preparation and fair presentation of financial statements that are free from material misstatement, whether due to fraud or error; selecting and applying appropriate accounting policies; and making accounting estimates that are reasonable in the circumstances.
Auditor’s responsibilityOur responsibility is to express an opinion on these financial statements based on our audit. We conducted our audit in accordance with International Standards on Auditing. Those standards require that we comply with ethical requirements and plan and perform the audit to obtain reasonable assurance whether the financial statements are free from material misstatement.
An audit involves performing procedures to obtain audit evidence about the amounts and disclosures in the financial statements. The procedures selected depend on the auditor’s judgement, including the assessment of the risks of material misstatement of the financial statements, whether due to fraud or error. In making those risk assessments, the auditor considers internal control relevant to the entity’s preparation and fair presentation of the financial statements in order to design audit procedures that are appropriate in the circumstances, but not for the purpose of expressing an opinion on the effectiveness of the entity’s internal control. An audit also includes evaluating the appropriateness of accounting policies used and the reasonableness of accounting estimates made by management, as well as evaluating the overall presentation of the financial statements.
We believe that the audit evidence we have obtained is sufficient and appropriate to provide a basis for our audit opinion.
opinionIn our opinion, the financial statements present fairly, in all material respects, the financial position of Strategic Real Estate Managers (Proprietary) Limited as at 30 June 2010, and its financial performance and its cash flows for the year then ended in accordance with International Financial Reporting Standards and in the manner required by the Companies Act of South Africa.
PricewaterhouseCoopers Inc.Director:NMtetwaRegisteredAuditor
Johannesburg30 September 2010

Page 99
Annual Report 2010 Emira Property Fund
Strategic Real Estate Managers (Proprietary) Limited (“STREM”)Directors’ reportfor the year ended 30 June 2010
nAtURe oF bUsInessThe company continued with its business as the manager of Emira Property Fund in terms of the Collective Investment Schemes Control Act.
GeneRAL RevIewThe results for the year under review are reflected in the accompanying annual financial statements.
sHARe cAPItALDetails of the authorised and issued share capital of the company appear in note 3 to the financial statements.
DIvIDenDsNo dividends were paid by the company during the year under review.
execUtIve DIRectoRsWK SchultzeJWA TempletonPJ Thurling
non-execUtIve DIRectoRsBJ van der Ross (Chairman)MS AitkenBH Kent (appointed as lead independent director on 20 May 2010)NE MakiwaneV Mahlangu (appointed 24 June 2010)W McCurrieMSB NeserNL Sowazi
coMPAnY secRetARYDA Isserow resigned as Company Secretary on 16 February 2010 and ME Harris was appointed in her stead.
Post YeAR-enD eventsWith effect from 15 September 2010, following the approval of the Registrar of Collective Investment Schemes, Emira’s Trust Deed was amended with the result that the service charge payable to the company is calculated on a cost recovery basis only, in return for the receipt by the company, of a lump sum payment of R197 400 000.
ReGIsteReD ADDRess3 Gwen LaneSandton Central2196
PostAL ADDRessPO Box 786130Sandton2146
AUDItoRPricewaterhouseCoopers Inc.
bAnkeRsFirst National Bank Limited
ReGIstRAtIon nUMbeR1997/020911/07

Page 100
Annual Report 2010 Emira Property Fund
Strategic Real Estate Managers (Proprietary) Limited (“STREM”)Statement of financial positionas at 30 June 2010
Statement of comprehensive incomefor the year ended 30 June 2010
Notes2010
R2009
R
Assetscurrent assetsAccounts receivable 2 3 841 543 3 290 025 Deferred tax asset 7 99 625 83 731 Taxation 7 — 13 434 Cash at bank 14 552 733 5 753 483
total assets 18 493 901 9 140 673
eqUItY AnD LIAbILItIescapital and reservesShare capital 3 300 300 Share premium 3 29 999 910 29 999 910 Non-distributable reserve (29 915 762) (29 915 762)Retained earnings 218 523 164 519
Shareholders’ funds 302 971 248 967 Long-term liabilitiesShareholders’ loans 4 2 500 000 —current liabilitiesTerm loan 5 808 958 754 222 Accounts payable 6 14 690 032 8 137 484 Taxation payable 7 191 940 —
18 190 930 8 891 706
total equity and liabilities 18 493 901 9 140 673
Notes2010
R2009
R
Turnover 36 170 562 31 843 073
Operating loss 8 (333 669) (727 307)Net interest income 9 578 054 642 430
Net profit/(loss) for the year before income tax expense 244 385 (84 877)Income tax expense 10 (190 381) 27 654
Profit/(loss) for the year attributable to equity holders 54 004 (57 223)
Total comprehensive income/(loss) attributable to equity holders 54 004 (57 223)
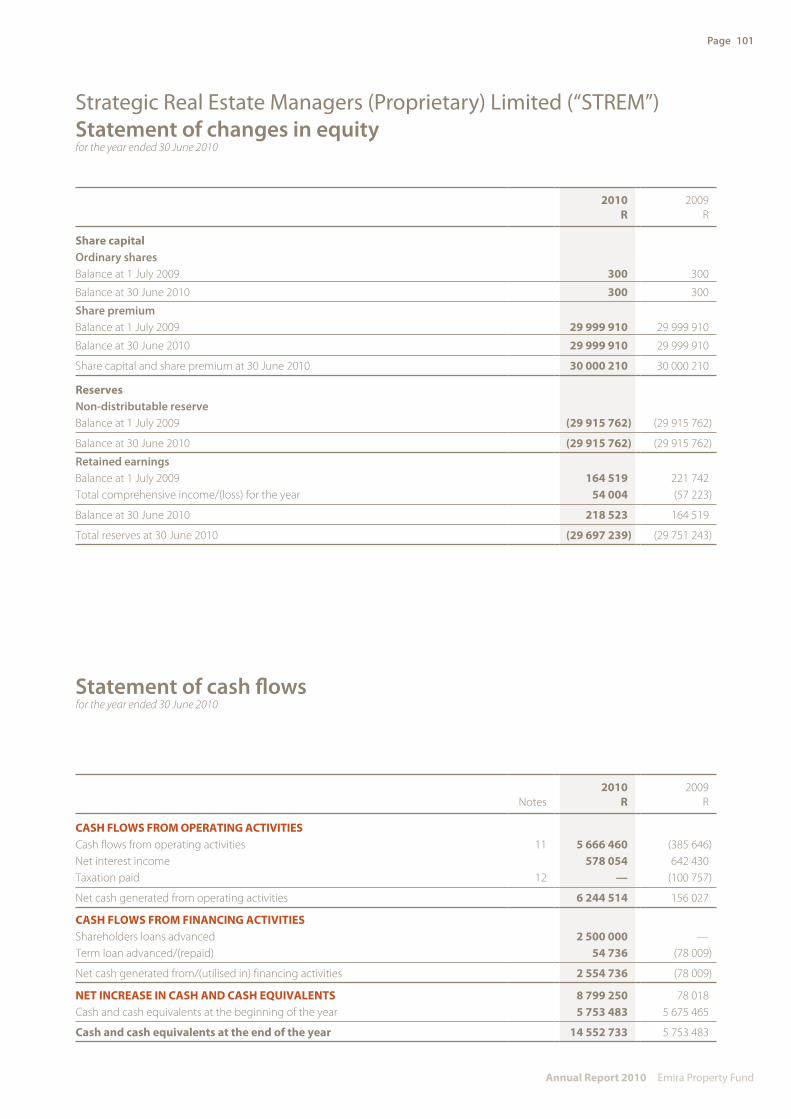
Page 101
Annual Report 2010 Emira Property Fund
Strategic Real Estate Managers (Proprietary) Limited (“STREM”)Statement of changes in equityfor the year ended 30 June 2010
Statement of cash flowsfor the year ended 30 June 2010
2010R
2009R
share capitalOrdinary sharesBalance at 1 July 2009 300 300
Balance at 30 June 2010 300 300
Share premiumBalance at 1 July 2009 29 999 910 29 999 910
Balance at 30 June 2010 29 999 910 29 999 910
Share capital and share premium at 30 June 2010 30 000 210 30 000 210
ReservesNon-distributable reserveBalance at 1 July 2009 (29 915 762) (29 915 762)
Balance at 30 June 2010 (29 915 762) (29 915 762)
Retained earningsBalance at 1 July 2009 164 519 221 742 Total comprehensive income/(loss) for the year 54 004 (57 223)
Balance at 30 June 2010 218 523 164 519
Total reserves at 30 June 2010 (29 697 239) (29 751 243)
Notes2010
R2009
R
cAsH FLows FRoM oPeRAtInG ActIvItIesCash flows from operating activities 11 5 666 460 (385 646)Net interest income 578 054 642 430 Taxation paid 12 — (100 757)
Net cash generated from operating activities 6 244 514 156 027
cAsH FLows FRoM FInAncInG ActIvItIesShareholders loans advanced 2 500 000 —Term loan advanced/(repaid) 54 736 (78 009)
Net cash generated from/(utilised in) financing activities 2 554 736 (78 009)
net IncReAse In cAsH AnD cAsH eqUIvALents 8 799 250 78 018 Cash and cash equivalents at the beginning of the year 5 753 483 5 675 465
cash and cash equivalents at the end of the year 14 552 733 5 753 483

Page 102
Annual Report 2010 Emira Property Fund
Strategic Real Estate Managers (Proprietary) Limited (“STREM”)Notes to the financial statementsfor the year ended 30 June 2010
1 AccoUntInG PoLIcIes basis of presentation The financial statements have been prepared in accordance with International Financial Reporting Standards (IFRS) and the
Companies Act of South Africa.
Various new and amended international financial reporting standards and interpretations have been issued.
The following standards, amendments and interpretations, which became effective in 2010, are of relevance to the Company:
Standard/interpretation Content
Applicable for financial years beginning on/after
IAS 1 Presentation of Financial Statements 1 January 2009IAS 23 Borrowing costs 1 January 2009
Interpretationsandamendmentstostandardsbecomingeffectiveinthecurrentfinancialyearbutnotrelevanttothecompany.
Standard/interpretation Content
Applicable for financial years beginning on/after
IFRS 1* First-time Adoption of International Financial Reporting Standards 1 July 2009
Standards, amendments and interpretations that are not yet effective and not expected to have significant impact on thecompany’sfinancialstatements.
Standard/interpretation Content
Applicable for financial years beginning on/after
IAS 24* Related Party Disclosures 1 January 2009Amendments IFRS 1* Additional Exemptions for First-time Adopters 1 July 2010
* Not expected to be relevant to the company.
The financial statements are prepared on the historical cost basis and incorporate the following accounting policies which are consistent with those applied in the previous year.
The financial statements are prepared on a going-concern basis.
1.1 turnover Turnover comprises management fees received from Emira Property Fund accounted for on the accrual basis as services are
performed. The fees are based on the substance of the management agreement.
1.2 Accounts payable Trade payables are carried at the fair value of the consideration to be paid in future for goods or services that have been received.
1.3 cash and cash equivalents Cash and cash equivalents are carried in the balance sheet at cost. For the purposes of the cash flow statement, cash and cash
equivalents comprise cash on hand and deposits held at call with banks.
1.4 Accounts receivable Trade receivables are initially recognised at fair value and subsequently at amortised cost. A provision for impairment of trade
receivables is established when there is objective evidence that the company will not be able to collect all amounts due according to the original term of the receivables. The amount of the provision is the difference between the carrying amount and the recoverable amount, being the present value of the expected cash flows, discounted at the market rate of interest for similar borrowers.
1.5 taxation Taxation is provided at current rates on net income before tax for the year after taking into account income and expenditure,
which are not subject to taxation.
1.6 Intangible assets and impairment losses Intangible assets are initially measured at cost if acquired separately or at fair value if acquired as part of a business combination.
Intangible assets are amortised over their estimated useful life on a straight-line basis. The estimated useful lives and residual values are reviewed annually. Impairment losses are recognised as an expense in the income statement.
1.7 borrowings Interest-bearing borrowings are recognised initially at fair value, less attributable transaction costs. Subsequent to initial
recognition, they are measured at amortised cost using the effective interest rate method.

Page 103
Annual Report 2010 Emira Property Fund
2010R
2009R
2 AccoUnts ReceIvAbLeTrade receivables 3 233 637 2 714 062 Other receivables 607 906 575 963
3 841 543 3 290 025
Due within one year 3 841 543 3 290 025 The carrying values of accounts receivable approximate their fair value.
3 sHARe cAPItALAuthorisedOrdinary shares4 000 ordinary shares of R1 each 4 000 4 000
IssuedOrdinary shares300 shares of R1 each (2009: 300 shares of R1 each) 300 300 Share premium 29 999 910 29 999 910
30 000 210 30 000 210
4 sHAReHoLDeRs’ LoAns 2 500 000 —The loans are unsecured, have no fixed date of repayment and bear interest at rates to be agreed from time to time. The carrying value of the loans approximate their fair value.
5 teRM LoAnOwing to:Eris Investment Holdings (Proprietary) Limited 808 958 754 222
The loan is unsecured and has no fixed terms of repayment and interest is payable at rates agreed from time to time.
6 AccoUnts PAYAbLeTrade payables 349 147 170 857 Accrued expenses 14 340 885 7 966 628
14 690 032 8 137 485
Payable within one year 14 690 032 8 137 485
7 tAxAtIonsA normal taxationBalance at 1 July 2009 13 434 (76 261)Payments made — 100 757 Prior-period adjustment 901 —Income statement movement (206 275) (11 062)
balance at 30 June 2010 (191 940) 13 434
Deferred taxationBalance at 1 July 2009 83 731 45 015 Income statement movement 15 894 38 716
balance at 30 June 2010 99 625 83 731
Deferred taxation comprises timing differences in respect of provision for leave pay.

Page 104
Annual Report 2010 Emira Property Fund
Strategic Real Estate Managers (Proprietary) Limited (“STREM”)Notes to the financial statements (continued)for the year ended 30 June 2010
2010R
2009R
8 oPeRAtInG LossThe following items have been charged in arriving at operating loss:Management fee paid to Eris Investment Holdings (Proprietary) Limited 19 000 000 16 433 400 Management fee paid to Corovest Property Group Holdings (Proprietary) Limited 3 360 000 2 900 000 Audit fees – current year 58 992 55 440
Directors’ emoluments:
executive directorsBasic
salary
Contributionsto defined
contributionplans
Annual bonus Total
2010JWA Templeton (CEO) 888 982 231 152 1 920 000 3 040 134PJ Thurling (CFO) 1 196 198 211 338 250 000 1 657 536Total 2 085 180 442 490 2 170 000 4 697 670
2009JWA Templeton (CEO) 799 112 194 313 1 920 000 2 913 425
PJ Thurling (CFO) 1 115 112 193 576 250 000 1 558 688
Total 1 914 224 387 889 2 170 000 4 472 113
non-executive directors
Fees forservices as
directors2010
Fees forservices as
directors2009
BJ van der Ross (Chairman) 175 500 163 000
MS Aitken 129 000 120 000
LS Barnard (Resigned 5 August 2009) — 185 000
BH Kent (Chairman of the audit committee) 211 000 185 000
V Mahlangu (Appointed 24 June 2010) 46 750 —
NL Sowazi 129 000 120 000
NE Makiwane 187 000 174 000
W McCurrie 129 000 60 000
MSB Neser 129 000 120 000
Total 1 136 250 1 127 000

Page 105
Annual Report 2010 Emira Property Fund
2010R
2009R
9 net InteRest IncoMeInterest received 632 790 724 306 Interest paid (54 736) (81 876)
578 054 642 430
10 IncoMe tAx exPenseSouth African normal taxation – current 206 275 11 062 Deferred taxation (15 894) (38 716)
190 381 (27 654)
tax rate reconciliation % % Standard rate 28,00 28,00 Permanent differences 49,90 5,86 Prior period adjustments — (1,28)
Effective rate of taxation 77,90 32,58
11 notes to tHe stAteMent oF cAsH FLowscash generated from/(utilised in) operationsNet profit/(loss) for the year before income tax expense 244 385 (84 877)Net interest income (578 054) (642 430)
Prior period tax adjustment (note 12) (901) —
Operating loss before working capital changes (334 570) (727 307)Increase in accounts receivable (551 518) (504 144)Increase in accounts payable 6 552 548 845 805
5 666 460 (385 646)
12 tAxAtIon PAIDBalance owing at 1 July 2009 13 434 (76 261)Prior period adjustments 901 —Taxation charge for the year (206 275) (11 062)Balance owing at 30 June 2010 191 940 (13 434)
Taxation paid for the year — (100 757)

Page 106
Annual Report 2010 Emira Property Fund
Strategic Real Estate Managers (Proprietary) Limited (“STREM”)Notes to the financial statements (continued)for the year ended 30 June 2010
13 FInAncIAL RIsk MAnAGeMentThe company’s financial instruments consist mainly of deposits with a bank, accounts receivable, a term loan from a shareholder and accounts payable. In respect of the abovementioned financial instruments, book values approximate fair value. Exposure to interest rate, credit and liquidity risks occurs in the normal course of business.
weightedaverage
effectiveinterest rate
%
1 yearor less
R1 – 5 years
R
More than5 years
Rtotal
R
Year ended 30 June 2010Financial assetsAccounts receivable 3 841 543 3 841 543 Cash at bank 6,0 14 552 733 14 552 733
Total financial assets 18 394 276 18 394 276
Financial liabilitiesTerm loan 6,0 808 958 808 958 Accounts payable 14 690 032 14 690 032
Total financial liabilities 14 690 032 808 958 15 498 990
Year ended 30 June 2009Financial assetsAccounts receivable 3 290 025 3 290 025 Cash at bank 10,0 5 753 483 5 753 483
Total financial assets 9 043 508 9 043 508
Financial liabilitiesTerm loan 10,0 754 222 754 222 Accounts payable 8 137 484 8 137 484
Total financial liabilities 8 137 484 754 222 8 891 706
Interest rate risk managementExposure to interest risk is considered minimal. Interest paid on the term loan from a shareholder is equivalent to the interest earned on the call deposit at Rand Merchant Bank.
credit risk managementCredit risk is considered to be minimal. Trade receivables consist of the asset management fee due by Emira Property Fund.
Liquidity risk managementCash flows are monitored on a monthly basis to ensure that cash resources are adequate to meet funding requirements.

Page 107
Annual Report 2010 Emira Property Fund
2010R
2009 R
14 ReLAteD PARtY tRAnsActIonsThe company is controlled by FirstRand Asset Management (Proprietary) Limited, which owns 70% of the company’s shares, the other 30% being owned equally by Eris Investment Holdings (Proprietary) Limited and Corovest Property Group Holdings (Proprietary) Limited. The ultimate parent of the company is FirstRand Limited.
Income received from Group companiesEmira Property Fund (associate of parent) – asset management fees 36 170 652 31 843 073Rand Merchant Bank a division of FirstRand Bank Limited (associate of parent) – interest received 632 790 724 306
36 803 442 32 567 379
expenses paid to Group companiesEris Investment Holdings (Proprietary) Limited (shareholder) – management fees 19 000 000 16 433 400– interest paid 54 736 81 876Corovest Property Group Holdings (Proprietary) Limited (shareholder)– management fees 3 360 000 2 900 000
22 414 736 19 415 276
Inter-Group balancesEris Investment Holdings (Proprietary) Limited (shareholder) – term loan 808 958 754 222– term loan 2 125 000 —Corovest Property Group Holdings (Proprietary) Limited (shareholder)– term loan 375 000 —Rand Merchant Bank a division of FirstRand Bank Limited (associate of parent) – bank balances 14 552 733 5 753 483
15 Post YeAR-enD eventsWith effect from 15 September 2010, following the approval of the Registrar of Collective Investment Schemes, Emira’s Trust Deed was amended with the result that the service charge payable to the company is calculated on a cost recovery basis only, in return for the receipt by the company, of a lump sum payment of R197 400 000.

Page 108
Annual Report 2010 Emira Property Fund
Strategic Real Estate Managers (Proprietary) Limited (“STREM”)Notice of annual general meeting
eMIRA PRoPeRtY FUnD(Participatory interest code: EMI, ISIN: ZAE000050712)(“Emira” or “the Fund”)
Notice is hereby given that the seventh annual general meeting of the members of Emira will be held in the boardroom, Third Floor, 3 Gwen Lane, Sandton at 14:00 on Tuesday, 16 November 2010 for the purposes of considering, and if deemed fit, passing with or without modification the resolutions set out below:
1 oRDInARY ResoLUtIons1.1 ordinary resolution number 1 ”Resolved that the annual financial statements for the financial year ended 30 June 2010 including the management company’s
report and the report of the auditors thereon be received, considered and approved.”
1.2 ordinary resolution number 2 To reappoint PricewaterhouseCoopers Inc. as the auditor of the Fund and N Mtetwa as the individual designated auditor of the
Fund for the 2011 financial year until the next annual general meeting.
1.3 ordinary resolution number 3 “Resolved that the directors of Strategic Real Estate Managers (Proprietary) Limited (the manager of Emira) are hereby authorised,
by way of a renewable general authority, to issue participatory interests in the authorised but unissued capital of the Fund for cash, as and when they in their discretion deem fit, subject to the Trust Deed of the Fund and the Listings Requirements of the JSE Limited (“JSE”), when applicable provided that:
• this general authority shall be valid until the Fund’s next annual general meeting or for 15 months after the date on which this authority is granted, whichever period is the shorter;
• the participatory interests must be of a class already in issue, or where this is not the case, must be limited to such securities or rights that are convertible into a class already in issue;
• a press announcement giving full details, in accordance with the JSE Listings Requirements including the impact on net asset value and earnings per participatory interest, will be published at the time of any issue representing, on a cumulative basis within one financial year, 5% or more of the number of participatory interests prior to the issue;
• issues in terms of this authority will not in the aggregate in any one financial year exceed 10% of the number of the Fund’s participatory interests already in issue of that class, as calculated in accordance with the JSE Listings Requirements;
• in determining the price at which an issue of participatory interests will be made in terms of this authority, the maximum discount permitted will be 10% of the weighted average traded price of the participatory interests measured over the 30 business days prior to the date that the price of the participatory interests are agreed between Emira and the party subscribing for the securities; and
• any such issue will only be made to public participatory interest holders as defined in the JSE Listings Requirements and not to related parties.
The approval of a 75% majority of the votes cast in favour of such resolution by participatory interest holders present or represented
by proxy at this annual general meeting is required for this ordinary resolution to become effective.”
2 sPecIAL ResoLUtIon2.1 special resolution number 1 “Resolved that the directors of Strategic Real Estate Managers (Proprietary) Limited, be hereby authorised by way of a renewable
general authority, to approve the repurchase of its own participatory interests by the Fund as and when they in their discretion deem fit, subject to the Trust Deed of the Fund and the JSE Listings Requirements, when applicable, provided that:
• this general authority shall be valid until the Fund’s next annual general meeting or for 15 months from the date of the passing of this resolution, whichever period is shorter;
• the repurchase of participatory interests will be effected through the order book operated by the JSE trading system and done without any prior understanding or arrangement between the Fund and the counterparty (reported trades are prohibited);
• an announcement complying with the JSE Listings Requirements be published by the Fund when (i) the Fund has cumulatively repurchased 3% of the participatory interests in issue as at the time the general authority was given (“the initial number”) and (ii) for each 3% in aggregate of the initial number of participatory interests acquired thereafter by the Fund;
• the general repurchase by the Fund of its own participatory interests shall not in the aggregate in any one financial year exceed 20% of the Fund’s issued capital of that class as at the beginning of the financial year (or 10% in the case of a subsidiary);
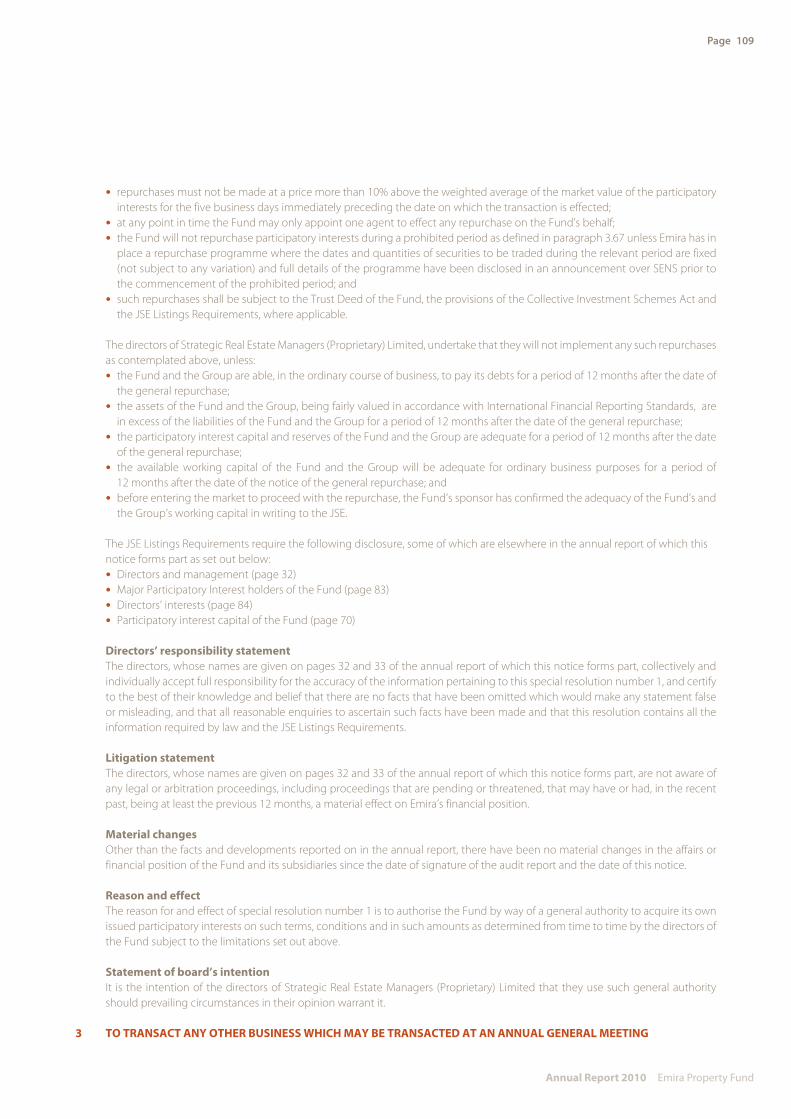
Page 109
Annual Report 2010 Emira Property Fund
• repurchases must not be made at a price more than 10% above the weighted average of the market value of the participatory interests for the five business days immediately preceding the date on which the transaction is effected;
• at any point in time the Fund may only appoint one agent to effect any repurchase on the Fund’s behalf; • the Fund will not repurchase participatory interests during a prohibited period as defined in paragraph 3.67 unless Emira has in
place a repurchase programme where the dates and quantities of securities to be traded during the relevant period are fixed (not subject to any variation) and full details of the programme have been disclosed in an announcement over SENS prior to the commencement of the prohibited period; and
• such repurchases shall be subject to the Trust Deed of the Fund, the provisions of the Collective Investment Schemes Act and the JSE Listings Requirements, where applicable.
The directors of Strategic Real Estate Managers (Proprietary) Limited, undertake that they will not implement any such repurchases
as contemplated above, unless: • the Fund and the Group are able, in the ordinary course of business, to pay its debts for a period of 12 months after the date of
the general repurchase; • the assets of the Fund and the Group, being fairly valued in accordance with International Financial Reporting Standards, are
in excess of the liabilities of the Fund and the Group for a period of 12 months after the date of the general repurchase; • the participatory interest capital and reserves of the Fund and the Group are adequate for a period of 12 months after the date
of the general repurchase; • the available working capital of the Fund and the Group will be adequate for ordinary business purposes for a period of
12 months after the date of the notice of the general repurchase; and • before entering the market to proceed with the repurchase, the Fund’s sponsor has confirmed the adequacy of the Fund’s and
the Group’s working capital in writing to the JSE. The JSE Listings Requirements require the following disclosure, some of which are elsewhere in the annual report of which this
notice forms part as set out below: • Directors and management (page 32) • Major Participatory Interest holders of the Fund (page 83) • Directors’ interests (page 84) • Participatory interest capital of the Fund (page 70)
Directors’ responsibility statement The directors, whose names are given on pages 32 and 33 of the annual report of which this notice forms part, collectively and
individually accept full responsibility for the accuracy of the information pertaining to this special resolution number 1, and certify to the best of their knowledge and belief that there are no facts that have been omitted which would make any statement false or misleading, and that all reasonable enquiries to ascertain such facts have been made and that this resolution contains all the information required by law and the JSE Listings Requirements.
Litigation statement The directors, whose names are given on pages 32 and 33 of the annual report of which this notice forms part, are not aware of
any legal or arbitration proceedings, including proceedings that are pending or threatened, that may have or had, in the recent past, being at least the previous 12 months, a material effect on Emira’s financial position.
Material changes Other than the facts and developments reported on in the annual report, there have been no material changes in the affairs or
financial position of the Fund and its subsidiaries since the date of signature of the audit report and the date of this notice.
Reason and effect The reason for and effect of special resolution number 1 is to authorise the Fund by way of a general authority to acquire its own
issued participatory interests on such terms, conditions and in such amounts as determined from time to time by the directors of the Fund subject to the limitations set out above.
statement of board’s intention It is the intention of the directors of Strategic Real Estate Managers (Proprietary) Limited that they use such general authority
should prevailing circumstances in their opinion warrant it.
3 to tRAnsAct AnY otHeR bUsIness wHIcH MAY be tRAnsActeD At An AnnUAL GeneRAL MeetInG
Page 110
Annual Report 2010 Emira Property Fund
Administration information
ReGIsteReD ADDRess3 Gwen LaneSandton2196 PO Box 786130, Sandton, 2146
Asset MAnAGeRStrategic Real Estate Managers (Pty) Limited3 Gwen LaneSandton2196 PO Box 786130, Sandton, 2146
PRoPeRtY MAnAGeREris Property Group (Pty) Limited3 Gwen LaneSandton2196 PO Box 786130, Sandton, 2146
tRUsteeAbsa Bank Limited11 Diagonal StreetJohannesburg2001PO Box 42010, Fordsburg, 2033
MeRcHAnt bAnk AnD sPonsoRRand Merchant Bank, a division of FirstRand Bank Limited1 Merchant PlaceFredman DriveSandton2196 PO Box 786273, Sandton, 2146
tRAnsFeR secRetARIes Computershare Investor Services (Pty) Limited70 Marshall StreetJohannesburg2001 PO Box 61051, Marshalltown, 2107
AUDItoRPricewaterhouseCoopers Inc.2 Eglin RoadSunninghill2157 Private Bag X36, Sunninghill, 2157
bAnkeRsFirstRand Bank Limited t/a First National BankWierda ValleySandton OutletWierda Valley 2196PO Box 787428, Sandton, 2146
AttoRneYs DLA Cliffe Dekker Hofmeyr Inc6 Sandown Valley CrescentSandownSandton2196 Private Bag X40, Benmore, 2010

Page 111
Annual Report 2010 Emira Property Fund
Form of proxy
EmiRA PRoPERty Fund(Participatory interest code: EMI)ISIN: ZAE000050712)
(“Emira” or “the Fund”)
FoRm oF PRoxy
this form of proxy is only for use by:
• registered members who have not yet dematerialised their Emira participatory interests; and
• registered members who have already dematerialised their Emira participatory interests and are registered in their own names in the Fund’s sub-register.
For completion by the aforesaid registered members of Emira and who are unable to attend the seventh annual general meeting of the Fund to be held in the boardroom, Third Floor, 3 Gwen Lane, Sandton at 14:00 on Tuesday, 16 November 2010 (“the annual general meeting”).
I/We (name/s in block letters)
Of (address)
Being the registered holder/s of participatory interests in Emira, as at
Hereby appoint (see instruction 1 overleaf)1. or failing him/her,
2. or failing him/her
3. the Chairman of the annual general meeting, as my/our proxy to attend, speak and vote for me/us and on my behalf or abstain from voting at the annual general meeting of the Fund and at any adjournment thereof, as follows (see note 2 and instruction 2 overleaf):
oRdinARy REsolutions FoR AGAinst ABstAin
1.1 To receive, consider and adopt the annual financial statements for the financial year ended 30 June 2010
1.2 To reappoint PricewaterhouseCoopers Inc. as auditor of the Fund and N Mtetwa as the individual designated auditor of the Fund
1.3 To vote on a general authority to issue participatory interests for cash
sPEciAl REsolution numBER 1
2.1 To vote on a general authority to repurchase participatory interests
Signed at on 2010
Signature(s)
Assisted by (where applicable)
Please read notes and instructions overleaf
Page 112
Annual Report 2010 Emira Property Fund
Notes
1. A participatory interest holder entitled to attend and vote at the meeting may appoint a proxy to speak and vote in this capacity. A proxy need not be a participatory interest holder of the Fund. Proxy forms should be forwarded to reach the Fund’s transfer secretary Computershare Investor Services (Proprietary) Limited, Ground Floor, 70 Marshall Street, Johannesburg, 2001 (PO Box 61051, Marshalltown, 2107) by no later than 14:00 on Friday, 12 November 2010. The appointment of a proxy will not preclude a participatory interest holder from attending the meeting.
2. A participatory interest holder may insert the name of a proxy or alternative proxy of the ordinary participatory interest holder’s choice in the space provided with or without deleting “the Chairman of the annual general meeting”. The participatory interest holder must initial any such deletion. The person whose name appears first on the form of proxy and has not been deleted will be entitled to act as a proxy to the exclusion of those whose names follow.
3. A participatory interest holder’s instructions to the proxy must be indicated by the insertion of the relevant number of votes exercisable by that participatory interest holder in the appropriate space provided. Failure to comply with the above will be deemed to authorise the Chairman of the annual general meeting, if he/she is an authorised proxy, to vote in favour of the resolutions, or any other proxy to vote or abstain from voting at the annual general meeting as he/she deems fit, in respect of the participatory interest holder’s vote exercisable thereat. A participatory interest holder or his/her proxy is not obliged to use all the votes exercisable by the participatory interest holder or by his/her proxy, but the total of votes cast and in respect whereof abstention is recorded may not exceed the total of the votes exercisable by the participatory interest holder or his/her proxy.
4. An alteration or correction must be initialled by the signatory/ies.
5. Documentary evidence establishing the authority of a person signing this form of proxy in a representative capacity must be attached to this form unless previously recorded by the transfer secretaries of the Fund or waived by the Chairman of the annual general meeting.
6. His/her parent or guardian, as applicable, must assist a minor or any other persona under legal incapacity unless the relevant documents establishing his/her capacity are produced or have been registered by the Fund.
7. The completion and lodging of this form will not preclude the relevant ordinary participatory interest holder from attending the annual general meeting and speaking and voting in person thereat to the exclusion of any proxy appointed in terms hereof, should such participatory interest holder wish to do so.
8. The Chairman of the annual general meeting may accept or reject a proxy which is completed and/or received other than in accordance with the instructions, provided that he/she shall not accept a proxy unless he/she is satisfied as to the manner in which a participatory interest holder wishes to vote.
9. If participatory interest holders have dematerialised their participatory interests with a CSDP or broker, other than own name dematerialised participatory interest holders, they must arrange with the CSDP or broker concerned to provide them with the necessary authorisation to attend the general meeting and vote thereat, or the participatory interest holders concerned must instruct their CSDP or broker as to how they wish to vote in this regard. This must be done in terms of the agreement entered into between the participatory interest holders and the CSDP or broker concerned.

BASTION GRAPHICS

www.emira.co.zaEmira Property Fund3 Gwen LaneSandton Central2196
East Coast Radio House
Market Square
RTT Acsa Park
EMIRA
Property Fund annual report 2010