The Daft.ie Rental Report - c0.dmstatic.com fileThe Daft.ie Rental Report An analysis of recent...
10
The Daft.ie Rental Report An analysis of recent trends in the Irish rental market for 2015 Q1
Transcript of The Daft.ie Rental Report - c0.dmstatic.com fileThe Daft.ie Rental Report An analysis of recent...

The Daft.ie Rental ReportAn analysis of recent trends in the Irishrental market for 2015 Q1
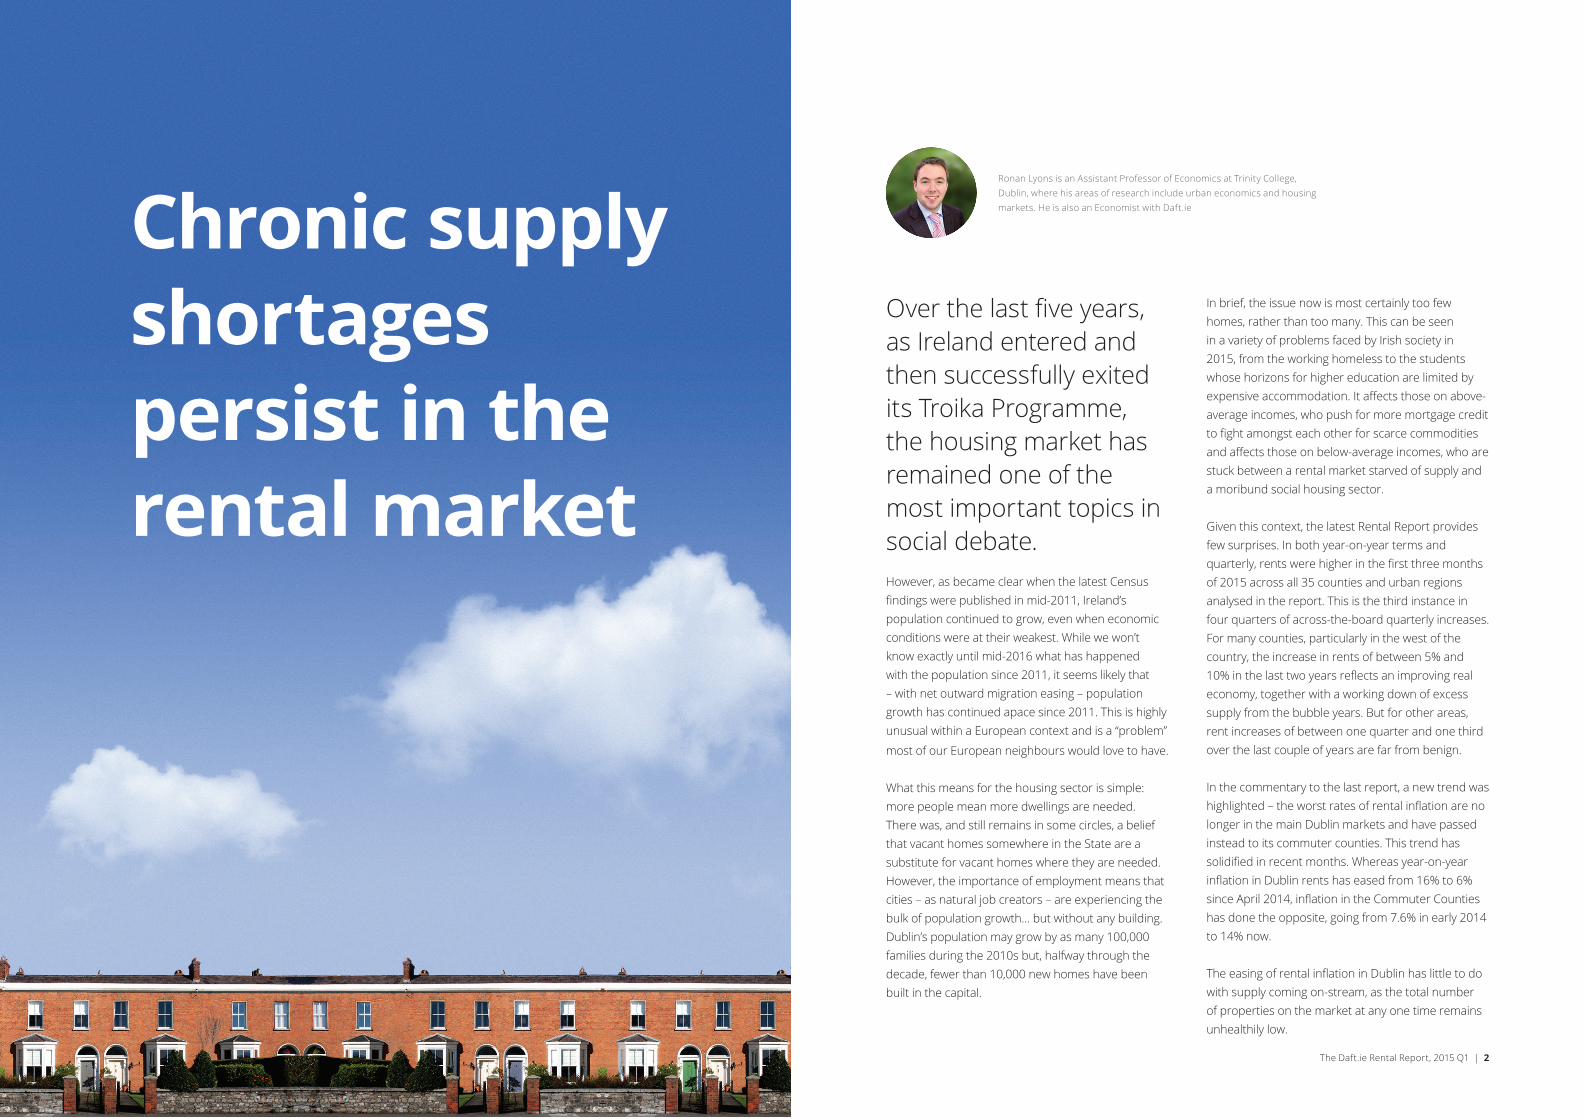
Over the last five years, as Ireland entered and then successfully exited its Troika Programme, the housing market has remained one of the most important topics in social debate.However, as became clear when the latest Census findings were published in mid-2011, Ireland’s population continued to grow, even when economic conditions were at their weakest. While we won’t know exactly until mid-2016 what has happened with the population since 2011, it seems likely that – with net outward migration easing – population growth has continued apace since 2011. This is highly unusual within a European context and is a “problem”
most of our European neighbours would love to have.
What this means for the housing sector is simple: more people mean more dwellings are needed. There was, and still remains in some circles, a belief that vacant homes somewhere in the State are a substitute for vacant homes where they are needed. However, the importance of employment means that cities – as natural job creators – are experiencing the bulk of population growth… but without any building. Dublin’s population may grow by as many 100,000 families during the 2010s but, halfway through the decade, fewer than 10,000 new homes have been built in the capital.
In brief, the issue now is most certainly too few homes, rather than too many. This can be seen in a variety of problems faced by Irish society in 2015, from the working homeless to the students whose horizons for higher education are limited by expensive accommodation. It affects those on above-average incomes, who push for more mortgage credit to fight amongst each other for scarce commodities and affects those on below-average incomes, who are stuck between a rental market starved of supply and a moribund social housing sector.
Given this context, the latest Rental Report provides few surprises. In both year-on-year terms and quarterly, rents were higher in the first three months of 2015 across all 35 counties and urban regions analysed in the report. This is the third instance in four quarters of across-the-board quarterly increases. For many counties, particularly in the west of the country, the increase in rents of between 5% and 10% in the last two years reflects an improving real economy, together with a working down of excess supply from the bubble years. But for other areas, rent increases of between one quarter and one third over the last couple of years are far from benign.
In the commentary to the last report, a new trend was highlighted – the worst rates of rental inflation are no longer in the main Dublin markets and have passed instead to its commuter counties. This trend has solidified in recent months. Whereas year-on-year inflation in Dublin rents has eased from 16% to 6% since April 2014, inflation in the Commuter Counties has done the opposite, going from 7.6% in early 2014 to 14% now.
The easing of rental inflation in Dublin has little to do with supply coming on-stream, as the total number of properties on the market at any one time remains unhealthily low.
Chronic supply shortages persist in the rental market
Ronan Lyons is an Assistant Professor of Economics at Trinity College, Dublin, where his areas of research include urban economics and housing markets. He is also an Economist with Daft.ie
The Daft.ie Rental Report, 2015 Q1 | 2

The average number on the market at any one time 2006-2010 was just below 5,000. The current figure is one third of that, and this is a level that has pertained for the bulk of the last 18 months. Whereas 2011 saw almost 60,000 rental properties listed over the course of the year – a little over half of all rental properties in the capital – the last 12 months have seen just 35,000 listed.
As recently as 2006, more than two thirds of Dublin rental properties were listed that year (and almost half of all rental properties nationwide). Even taking the 2011 Census for the stock of rental properties – which is likely to be a conservative estimate of the base – the figure is now less than one third for Dublin and closer to one quarter nationwide. One of the trade-offs for ownership is less mobility, but this is voluntary. In a labour market where mobility matters, we have ended up with a rental market where tenants are afraid to move.
As I have noted on a number of occasions before, the solution to the lack of accommodation is not a cap on rents. This tackles the symptom, not the cause. The solution is to address the high cost of
building new homes, whether apartments or houses. Even in a world with free capital (i.e. no profit) and free land, the break-even rent associated with a two-bedroom apartment in Dublin is roughly €1,500 a month. A household earning €45,000 a year can sustainably pay no more than €1,000 a month on its accommodation.
Given the hugely important social and competitiveness implications of the cost of accommodation, it is clear that Ireland – and the greater Dublin area in particular – has a problem: the cost of building homes no longer bears any relation to the real economy. For policymakers, the first step in solving a problem is admitting you have one.
3 | The Daft.ie Rental Report, 2015 Q1
Stock of Properties to Rent
Stock (lhs) Inflow (rhs) Outflow (rhs)
0
2007 2008 2009 2010 2011 2012 2013 2014 2015
5000
10000
15000
20000
25000
8.2%(Year-on-Year change in average rent nationwide)
Rents Rise Nationally
2006 2007 2008 2009 2010 2011 2012 2013 2014 2015
January 119.1 129.1 128.9 117.1 101.8 99.4 99.2 101.5 109.6 119.4
February 119.5 130.6 126.3 114.6 101.3 99.8 99.4 101.7 111.0 119.9
March 120.0 132.4 124.9 112.2 101.2 99.5 99.3 102.6 112.6 121.1
April 121.2 132.8 124.3 110.2 100.5 99.4 99.1 102.6 113.8 121.7
May 121.9 134.5 126.2 108.7 100.6 99.1 99.0 103.6 114.3 -
June 122.4 135.1 125.0 107.1 99.9 98.8 99.0 103.6 115.2 -
July 123.5 135.5 124.8 105.7 99.8 99.3 99.9 103.7 115.5 -
August 126.6 133.8 127.2 105.8 100.9 100.3 100.8 105.9 116.6 -
September 128.4 134.3 126.4 104.7 100.5 99.6 101.0 106.6 118.0 -
October 129.1 134.0 123.6 103.2 100.1 99.1 100.9 107.4 118.9 -
November 127.3 128.0 120.4 101.3 98.7 98.5 101.3 108.5 118.6 -
December 127.1 128.1 117.3 100.3 98.4 98.9 100.9 108.8 118.7 -
Daft.ie National Rental Index(2012 average = 100)
4 | The Daft.ie Rental Report, 2015 Q1

Cork City€911 | 7.5%
Limerick City€718 | 6.8%
Galway City€889 | 7.4%
Waterford City€634 | 5.6%
NationwideAverage rent by region and Y-on-Y change
DublinAverage rent and Y-on-Y change
North County€1,156 | 8.7%
South County€1,528 | 6.0%
West€1,179 | 9.5%
South City€1,446 | 7.4%
City Centre€1,419 | 10.1%
North City€1,293 | 9.2%
MN€5521.2%
CN€5035.9%
WH€6408.8%
LD€4777.8%
LH€72812.0%
MH€83814.6%
KE€98115.0%
WW€1,04612.8%
WX€6335.4%
CW€6173.5%
KK€70410.7%
LS€61811.7%
OY€6137.9%
G€60610.7%
MO€5493.6%
SO€6024.4%
DL€5093.2%
RN€5525.3%
LM€4265.7%
CE€5714.0%
T€5972.9%
L€6093.9%
C€6676.7%
KY€6114.0%
W€5844.6%
The Daft.ie Rental Report, 2015 Q1 | 65 | The Daft.ie Rental Report 2015 Q1

Snapshot of Rents NationwideAverage rents across Ireland, by postcode region and bedroom number Quarter 1 2015
The Daft.ie Rental Report, 2015 Q1 | 87 | The Daft.ie rental Report, 2015 Q1
Location 1-bed 2-bed 3-bed 4-bed 5-bed
Dublin 1 €1,109 €1,456 €1,833 * *
Dublin 2 €1,257 €1,713 €2,311 * *
Dublin 3 €972 €1,335 €1,674 €2,000 *
Dublin 4 €1,258 €1,757 €2,566 €3,359 €4,975
Dublin 5 €912 €1,314 €1,413 €1,556 *
Dublin 6 €1,008 €1,489 €2,226 €2,806 *
Dublin 6W €986 €1,426 €1,720 €2,491 €3,000
Dublin 7 €963 €1,306 €1,506 €1,616 €1,992
Dublin 8 €1,012 €1,342 €1,687 €2,300 *
Dublin 9 €927 €1,259 €1,506 €1,809 €2,200
Dublin 10 €900 €1,163 €1,149 * *
Dublin 11 €945 €1,196 €1,350 * *
Dublin 12 €974 €1,259 €1,466 €1,625 *
Dublin 13 €985 €1,256 €1,420 €1,841 €2,000
Dublin 14 €1,130 €1,478 €1,818 €2,615 €3,500
Dublin 15 €1,037 €1,262 €1,271 €1,330 *
Dublin 16 €1,082 €1,369 €1,624 €1,973 *
Dublin 17 €1,000 €1,216 * * *
Dublin 18 €1,138 €1,457 €1,734 €2,451 €2,761
Dublin 20 €976 €1,278 €1,361 * *
Dublin 22 €1,003 €1,155 €1,139 €1,329 *
Dublin 24 €923 €1,159 €1,281 €1,480 €1,900
North Co Dublin €942 €1,141 €1,329 €1,572 €3,300
South Co Dublin €1,170 €1,512 €1,993 €2,646 €3,291
West Dublin €990 €1,073 €1,222 €1,377 *
Cork City €705 €898 €1,014 €1,265 €1,465
Galway City €617 €831 €943 €1,034 €1,199
Limerick City €515 €679 €782 €936 €1,116
Waterford City €468 €535 €683 €767 €1,419
Dublin Commuter Counties €658 €842 €934 €1,155 €1,401
West Leinster €444 €541 €649 €716 €861
South-East Leinster €473 €573 €675 €729 €860
Munster €439 €553 €671 €728 €799
Connacht €399 €486 €621 €665 €716
Ulster €371 €437 €565 €613 €661
What can I ask for? Can I afford it?

The Daft.ie Rental Report, 2015 Q1 | 109 | The Daft.ie rental Report, 2015 Q1
1 Bedroom 2 Bedrooms 3 Bedrooms 4 Bedrooms 5 Bedrooms
Location / Bedroom # Mortgage (4.3%)
Mortgage +2%
Current Rent
Mortgage (4.3%)
Mortgage +2%
Current Rent
Mortgage (4.3%)
Mortgage +2%
Current Rent
Mortgage (4.3%)
Mortgage +2%
Current Rent
Mortgage (4.3%)
Mortgage +2%
Current Rent
Dublin City Centre €789 €987 €1,127 €954 €1,193 €1,360 €929 €1,162 €1,690 * * * * * *
North Dublin City €619 €774 €922 €899 €1,124 €1,113 €1,290 €1,613 €1,383 €1,886 €2,359 €1,697 €2,112 €2,642 €2,085
South Dublin City €767 €960 €1,058 €1,164 €1,456 €1,278 €1,499 €1,875 €1,588 €2,212 €2,767 €1,948 €2,674 €3,345 €2,393
North Dublin County €659 €824 €796 €821 €1,026 €961 €1,103 €1,379 €1,194 €1,749 €2,187 €1,465 €2,890 €3,614 €1,800
South Dublin County €943 €1,180 €1,071 €1,261 €1,577 €1,293 €1,407 €1,760 €1,606 €2,575 €3,221 €1,971 €2,835 €3,546 €2,421
West Dublin County €504 €630 €804 €748 €935 €971 €1,024 €1,281 €1,207 €1,513 €1,893 €1,481 €2,178 €2,724 €1,819
Cork City €392 €491 €665 €590 €738 €764 €839 €1,049 €914 €1,237 €1,547 €1,068 €1,507 €1,886 €1,343
Galway City €464 €581 €624 €615 €769 €717 €728 €911 €858 €1,060 €1,325 €1,002 €1,376 €1,721 €1,260
Limerick City €325 €407 €505 €355 €444 €580 €554 €693 €694 €843 €1,055 €811 €1,462 €1,829 €1,020
Waterford City €309 €387 €451 €330 €412 €517 €430 €537 €619 €756 €945 €723 €1,000 €1,251 €910
Dublin Commuter Counties €484 €605 €637 €594 €743 €733 €801 €1,002 €868 €1,208 €1,511 €997 €1,598 €1,999 €1,060
West Leinster €266 €332 €411 €336 €420 €473 €461 €577 €560 €720 €901 €643 €906 €1,133 €684
South-East Leinster €346 €432 €450 €376 €470 €519 €543 €680 €614 €904 €1,130 €705 €1,183 €1,480 €750
Munster €461 €576 €430 €393 €492 €486 €554 €692 €595 €913 €1,142 €654 €1,122 €1,403 €691
Connaught/Ulster €390 €487 €399 €367 €459 €447 €436 €545 €559 €642 €803 €598 €920 €1,151 €663
Current mortgage repayments based off the following parameters: 4.3% variable mortgage, for a term of 30 years, with 85% LTV
Location / Bedroom # Average Y-o-YChange
1-bed Y-o-YChange
2-bed Y-o-YChange
3-bed Y-o-YChange
4-bed Y-o-YChange
5-bed Y-o-YChange
Dublin City Centre 8.0% -0.6% 7.5% -0.1% 8.1% -0.6% 9.3% -2.2% * * * *
North Dublin City 6.1% -0.5% 7.5% -0.6% 7.0% -0.4% 5.7% -0.4% 4.8% -1.1% 5.2% -0.3%
South Dublin City 6.6% 0.0% 7.1% -0.2% 6.6% -0.5% 6.6% 0.2% 5.8% 0.4% 7.0% -0.6%
North Dublin County 6.1% -0.5% 7.2% -1.7% 7.1% -0.5% 6.2% -0.3% 4.7% -0.4% 5.0% -2.4%
South Dublin County 5.7% 0.2% 5.9% -1.0% 5.8% -0.3% 6.1% 0.7% 4.6% -0.1% 5.4% 1.1%
West Dublin County 6.7% -0.2% 9.2% -0.5% 8.1% -0.5% 6.5% -0.2% 5.3% -0.1% 4.8% -0.3%
Dublin Commuter Counties 5.7% -0.5% 6.8% -2.3% 7.2% -0.7% 5.9% -0.6% 5.0% 0.0% 4.4% -1.1%
West Leinster 6.1% 0.2% 8.3% 2.6% 8.1% -0.4% 7.1% 0.0% 5.1% 0.1% 4.8% 0.8%
South-East Leinster 5.3% -0.2% 6.8% -0.2% 7.7% -0.1% 6.3% -0.2% 4.1% -0.3% 3.7% -0.3%
Munster 5.2% -0.1% 4.8% -1.2% 7.1% -0.3% 6.1% 0.0% 4.1% -0.2% 3.7% -0.1%
Cork City 6.1% -0.1% 9.0% 0.2% 7.7% -0.2% 6.1% -0.2% 5.2% 0.1% 4.9% 0.1%
Limerick City 7.0% 0.0% 8.0% -0.3% 9.7% 1.4% 7.1% -0.6% 5.7% 0.6% 3.8% -1.3%
Waterford City 7.3% 0.9% 7.4% 5.1% 8.2% -1.0% 8.2% 1.2% 5.3% 1.2% 6.8% 1.4%
Connaught/Ulster 5.7% -0.1% 5.1% -1.1% 6.8% -0.3% 7.3% 0.0% 5.3% 0.2% 4.0% -0.5%
Galway City 6.3% 0.2% 7.0% -0.6% 7.0% -0.6% 7.0% 0.3% 5.3% -0.2% 5.2% 2.7%
Average 5.7% -0.2% 6.6% -0.5% 7.2% -0.4% 6.4% -0.1% 4.8% 0.0% 4.2% -0.2%
First-time Buyer & Investor Information
Mortgage versus rent comparison
Investor information: Snapshot of gross yields across the country
Snapshot of gross yields across the country (year-on-year change, in percentage points)
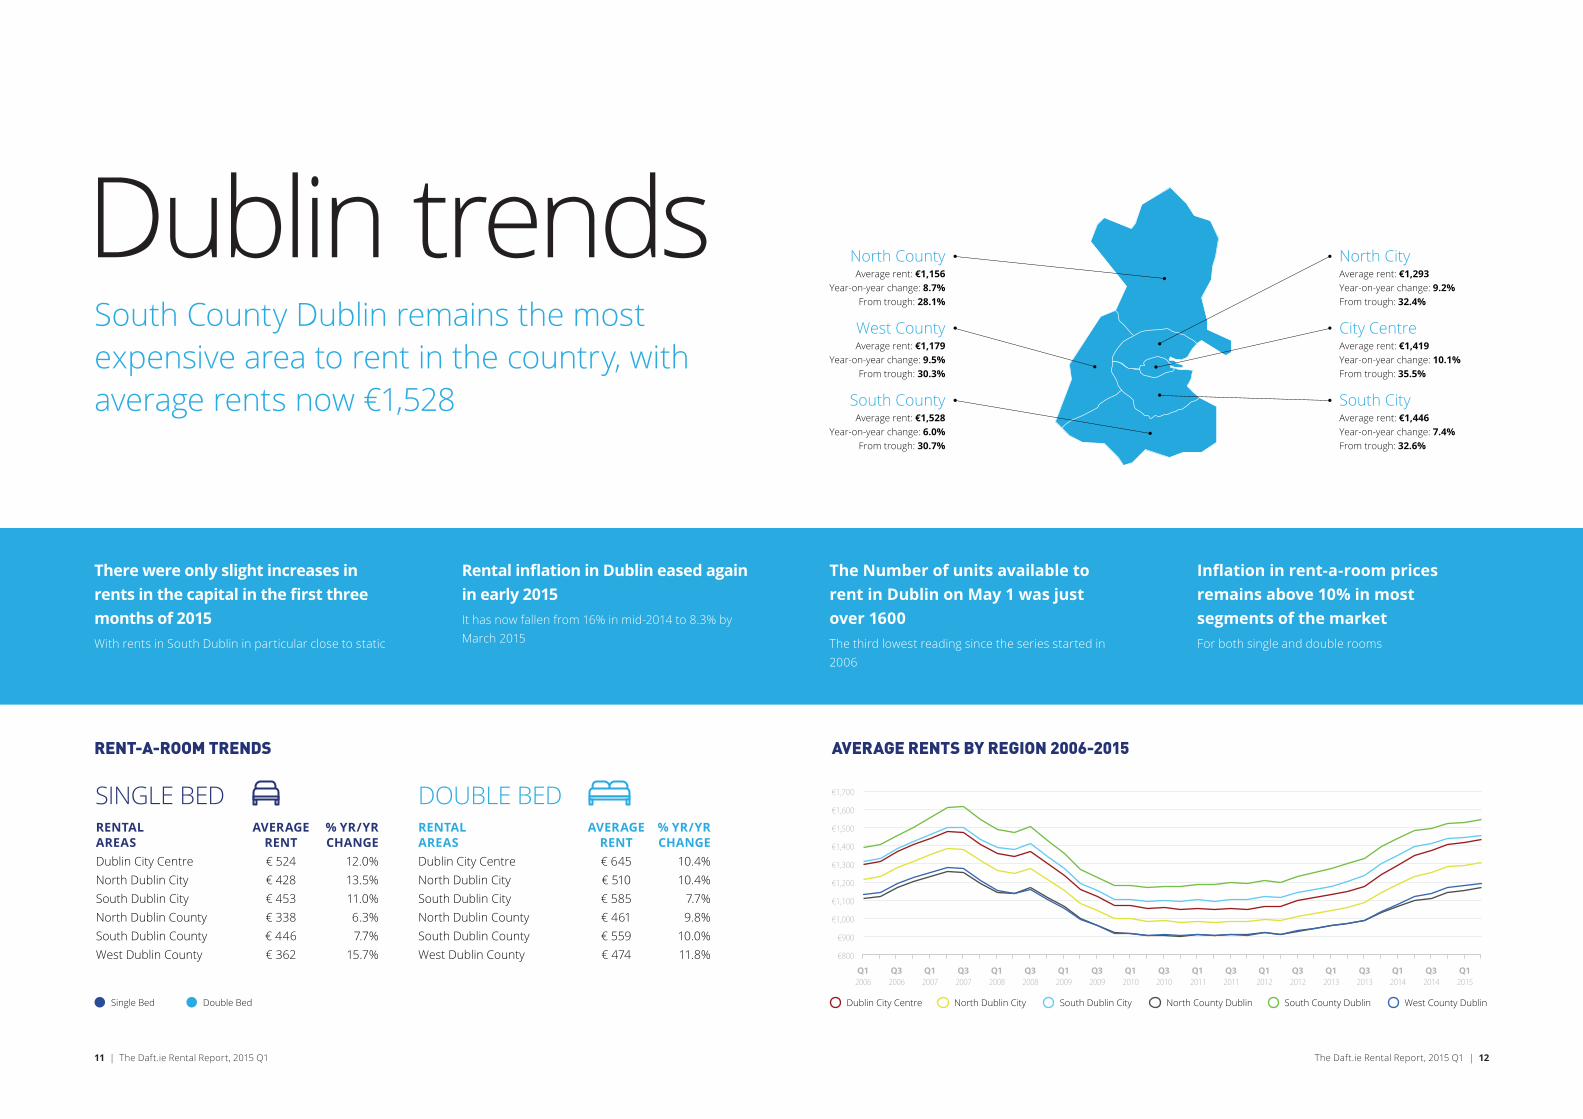
Dublin trendsSouth County Dublin remains the most expensive area to rent in the country, with average rents now €1,528
North CityAverage rent: €1,293Year-on-year change: 9.2%From trough: 32.4%
City CentreAverage rent: €1,419Year-on-year change: 10.1%From trough: 35.5%
South CityAverage rent: €1,446Year-on-year change: 7.4%From trough: 32.6%
North CountyAverage rent: €1,156
Year-on-year change: 8.7%From trough: 28.1%
West CountyAverage rent: €1,179
Year-on-year change: 9.5%From trough: 30.3%
South CountyAverage rent: €1,528
Year-on-year change: 6.0%From trough: 30.7%
Single Bed Double Bed
SINGLE BED DOUBLE BEDRENTALAREASDublin City CentreNorth Dublin CitySouth Dublin CityNorth Dublin CountySouth Dublin CountyWest Dublin County
AVERAGERENT€ 524€ 428€ 453€ 338€ 446€ 362
% YR/YRCHANGE
12.0%13.5%11.0%6.3%7.7%
15.7%
RENTALAREASDublin City CentreNorth Dublin CitySouth Dublin CityNorth Dublin CountySouth Dublin CountyWest Dublin County
AVERAGERENT€ 645€ 510€ 585€ 461€ 559€ 474
% YR/YRCHANGE
10.4%10.4%
7.7%9.8%
10.0%11.8%
RENT-A-ROOM TRENDS
Dublin City Centre North Dublin City South Dublin City North County Dublin South County Dublin West County Dublin
€800
€900
€1,000
€1,100
€1,200
€1,300
€1,400
€1,500
€1,600
€1,700
2006 Q1
2006 Q3
2007 Q1
2007 Q3
2008 Q1
2008 Q3
2009 Q1
2009 Q3
2010 Q1
2010 Q3
2011 Q1
2011 Q3
2012 Q1
2012 Q3
2013 Q1
2013 Q3
2014 Q1
2014 Q3
2015 Q1
AVERAGE RENTS BY REGION 2006-2015
The Daft.ie Rental Report, 2015 Q1 | 1211 | The Daft.ie Rental Report, 2015 Q1
Rental inflation in Dublin eased again in early 2015It has now fallen from 16% in mid-2014 to 8.3% by March 2015
The Number of units available to rent in Dublin on May 1 was just over 1600The third lowest reading since the series started in 2006
Inflation in rent-a-room prices remains above 10% in most segments of the marketFor both single and double rooms
There were only slight increases in rents in the capital in the first three months of 2015With rents in South Dublin in particular close to static

Other citiesCork City remains the most expensive city to rent in outside the capital with average rents now €911
Galway CityAverage rent: €889
Year-on-year change: 7.4%From trough: 16.9%
Limerick CityAverage rent: €718
Year-on-year change: 6.8%From trough: 12.5%
Waterford CityAverage rent: €634Year-on-year change: 5.6%From trough: 7.3%
Cork CityAverage rent: €911Year-on-year change: 7.5%From trough: 16.4%
Single Bed Double Bed
SINGLE BED DOUBLE BEDRENTALAREASCork City CentreCork City SuburbsGalway City CentreGalway City SuburbsWaterford City CentreLimerick City Centre
AVERAGERENT€ 320€ 303€ 309€ 285€ 233€ 249
% YR/YRCHANGE
11.1%9.8%2.0%
10.5%-5.3%11.7%
RENTALAREASCork City CentreCork City SuburbsGalway City CentreGalway City SuburbsWaterford City CentreLimerick City Centre
AVERAGERENT€ 387€ 365€ 367€ 324€ 285€ 296
% YR/YRCHANGE
6.0%8.6%5.8%3.8%2.5%
10.4%
RENT-A-ROOM TRENDS
Cork City Galway City Limerick City Waterford City
€500
€600
€700
€800
€900
€1,000
€1,100
€1,200
2006 Q1
2006 Q3
2007 Q1
2007 Q3
2008 Q1
2008 Q3
2009 Q1
2009 Q3
2010 Q1
2010 Q3
2011 Q1
2011 Q3
2012 Q1
2012 Q3
2013 Q1
2013 Q3
2014 Q1
2014 Q3
2015 Q1
AVERAGE RENTS BY REGION 2006-2015
The Daft.ie Rental Report, 2015 Q1 | 1413 | The Daft.ie Rental Report, 2015 Q1
Compared to their lowest points in 2010 and 2011, Cork and Galway rents are over 16% higherIn Limerick and Waterford they are 13% and 7% higher
The number of units available to rent on May 1 across the four cities was less than 600The tightest the market has been since 2007
Across the four cities, rent-a-room prices are typically between 5% and 10% higherWith the largest increases in Limerick
Having fallen slightly in the final quarter of 2014, rents in all four cities outside Dublin rose by 2%In the first three months of 2015

ElsewhereRents continue to rise in the Dublin commuter counties climbing 13.9% year-on-year
UlsterAverage rent: €516Year-on-year change: 3.4%From trough: 3.4%
Dublin Commuter CountiesAverage rent: €911Year-on-year change: 13.9%From trough: 24.7%
South-East LeinsterAverage rent: €651Year-on-year change: 6.7%From trough: 9.6%
ConnachtAverage rent: €567
Year-on-year change: 6.3%From trough: 6.3%
West LeinsterAverage rent: €603
Year-on-year change: 9.2%From trough: 13.7%
MunsterAverage rent: €621
Year-on-year change: 4.8%From trough: 7.4%
Single Bed Double Bed
RENT-A-ROOM TRENDS
SINGLE BED DOUBLE BEDRENTALAREASDublin Commuter CountiesWest LeinsterSouth-East LeinsterMunsterConnachtUlster
AVERAGERENT€ 325€ 242€ 266€ 246€ 231€ 206
% YR/YRCHANGE
9.3%14.9%
4.4%13.8%
6.4%4.1%
RENTALAREASDublin Commuter CountiesWest LeinsterSouth-East LeinsterMunsterConnachtUlster
AVERAGERENT€ 385€ 272€ 307€ 274€ 263€ 249
% YR/YRCHANGE
9.1%4.6%9.6%6.9%
-0.7%2.2%
Dublin Comm. Counties West Leinster South-East Leinster Munster Connacht Ulster
€400
€500
€600
€700
€800
€900
€1,000
€1,100
2006 Q1
2006 Q3
2007 Q1
2007 Q3
2008 Q1
2008 Q3
2009 Q1
2009 Q3
2010 Q1
2010 Q3
2011 Q1
2011 Q3
2012 Q1
2012 Q3
2013 Q1
2013 Q3
2014 Q1
2014 Q3
2015 Q1
AVERAGE RENTS BY REGION 2006-2015
The Daft.ie Rental Report Q1, 2015 | 1615 | The Daft.ie Rental Report Q1, 2015
For the second quarter in a rowAnnual rental inflation in the commuter counties exceeds that in the capital (14% vs 8%)
There were just 2,100 units available to rent outside the cities on May 1stThe tightest the market has been in eight years
Rent-a-room prices remain stable in Connacht-UlsterBut have risen by up to 10% elsewhere outside the cities
The pattern of rent increases has continued in recent monthsWith Dublin’s Commuter Counties seeing the largest increases and rural counties seeing much smaller increases

Over the last 10 years, Daft.ie has collected a vast amount of data on the Irish property market. In 2011 alone, over 260,000 properties were advertised on the site.About the ReportThe goal of the Daft Report is to use this information to help all actors in the property market make informed decisions about buying and selling. In addition, because it is freely available, the Daft Report can help inform the media, the general public and policymakers about the latest developments in the property market.
The Daft.ie Rental Report was launched in 2005. It has already become the definitive barometer of the Irish rental market and is being used by the Central Bank, mortgage institutions, financial analysts and the general public alike. The Daft.ie House Price report is Ireland’s longest-running house price report, combining information from the Daft.ie archives with data from Ireland’s Residential Property Price Register.
Together, the two reports give house-hunters and investors more information to help them make their decisions. These twin reports mean that Daft is the only objective monitor of trends in both rental and sales markets on a monthly basis, making the report an essential barometer for anyone with an interest in the Irish property market.
Methodology and Sample SizeThe statistics are based on properties advertised on Daft.ie for a given period. The regressions used are hedonic price regressions, accounting for all available and measurable attributes of properties, with a Cooks Distance filter for outliers.
The average monthly sample size for lettings properties is over 10,000. Indices are based on standard methods, holding the mix of characteristics constant, with the annual average of 2012 used as the base. For more on the methodology, please see www.daft.ie/research.
About Daft.ieDaft.ie is Ireland’s largest property website with over 2.19 million unique users of the site generating over 220 million page impressions each month.
Daft analysis & insights based on in-depth data on over 1.6m property rental listings gathered over 10 years.Daft.ie is Ireland’s largest property website.Daft Media’s property websites include daft.ie, rent.ie, let.ie and property.ie.
DisclaimerThe Daft.ie Report is prepared from information that we believe is collated with care, but we do notmake any statement as to its accuracy or completeness. We reserve the right to vary our methodology and to edit or discontinue the indices, snapshots or analysis at any time for regulatoryor other reasons. Persons seeking to place reliance on any information contained in this report for their own or third party commercial purposes do so at their own risk.
CreditsEconomic Analysis: Ronan LyonsMarketing and Communications: Martin ClancyLayout and Design: Dara Gannon
Coming next:
The Daft.ie House Price Report 2015 Q2, in early July 2015.The Daft.ie House Price Report will be published in early July 2015 and will provide a detailed regional analysis of asking prices and transaction prices as well as all the usual indices, snapshots, trends and regional analysis, providing the public with Ireland’s most up-to-date information on the housing market.
All data is Copyright © Daft Media Limited. The information contained in this report may only be reproduced if the source is clearly credited. Please contact Daft.ie on 01-4218700 for further information.
17 | The Daft.ie Rental Report, 2015