The Daft.ie Rental Reportstatic.rasset.ie/documents/news/daft-rental-report-q1-2013.pdf · Dublin...
12
Introduction by Ronan Lyons, Economist with Daft.ie The Daft.ie Rental Report An analysis of recent trends in the Irish rental market 2013 Q1
Transcript of The Daft.ie Rental Reportstatic.rasset.ie/documents/news/daft-rental-report-q1-2013.pdf · Dublin...
Introduction by Ronan Lyons, Economist with Daft.ie
The Daft.ie Rental ReportAn analysis of recent trends in the Irish rental market
2013 Q1

IntroductionIntroduction by Ronan Lyons, Economist with Daft.ie
Rent inflation a clear signal of supply constraints
2 | The Daft.ie Rental Report - 2013 Q1
Ireland’s property market continues to fragment along urban and rural lines. The most recent Daft.ie
House Price report outlined how asking prices in Dublin were up year-on-year for the first time since
2007, while outside Dublin, prices were over 10% lower than a year previously. Much the same trend is
evident from the rental market, outlined in this report, with rents in Dublin 5% higher than a year ago
but static elsewhere. The average monthly rent in Dublin is now €77 higher than it was in late 2010 –
that’s almost €1,000 extra a year.
The reason for these varying trends is supply. Looking at the rental market in Dublin, there are now
fewer properties available to rent than at any point since early 2007, when rents were rising at double-
digit rates. Whereas this time last year, a renter in the capital would have over 4,000 units to choose
from – or indeed over 7,000 to choose from in 2009 – currently, there are fewer than 2,000 homes on
the market in the capital.
At the same time, there is talk of a glut of housing in Ireland. The focus of what we talk about, when we
talk of Ireland’s property glut, is the “ghost estate”. According to the Department of the Environment,
Ireland’s 3,000 or so ghost estates contain 180,000 units, thus it is hard to conceive of a shortage
of accommodation. But it is important to look at what is being measured with those numbers. Of
the 180,000 units, roughly half are occupied, while the bulk of the remainder are only at planning
permission stage.
Indeed, of the 50,000 units in ghost estates in Dublin, less than 10% are complete and vacant (700
houses and 4,000 apartments), while the same number again are partially complete. Roughly speaking
then, for all Ireland’s ghost estate worries, when it comes to the capital, there are at most 5,000 homes
lying vacant in ghost estates, with another 5,000 units potentially able to come on to the market within
the next 18 months with some work. About 90% of these units are apartments, suggesting that when
they do come to the market, it will be to the rental market, rather than the sales market.
How does this compare to demand? Would 5,000 extra units both this year and next flood the rental
market? The graph overleaf shows the average number of units rented out by region, during 2012. In
Dublin, typically about 4,300 units were rented out each month – but only 4,200 were listed, eating
away at the stock of supply. The result is that now the supply on the market in Dublin is less than half
that required to meet a month’s demand. In other cities, supply and demand are roughly equal, while
elsewhere in the country, particularly outside Leinster, there is still more supply than demand.
After over five years of a relatively one-dimensional analysis of oversupply, it is time for policymakers
to add some nuance, both by region and by type. We know from the Census that there is something in
the region of 300,000 empty dwellings in the country. But we also know from the Department of the
Environment that at most 35,000 of those are in ghost estates.
Continued on next page >
Ronan Lyons is an economic researcher based at Balliol College, Oxford, where he lectures and is undertaking his doctorate in urban economics. He is also Economist with Daft.ie

Therefore, Ireland’s oversupply problem is overwhelmingly a problem of one-offs. And one-offs are
disproportionately a rural phenomenon. Between 10% and 15% of all dwellings in rural Munster,
Connacht and Ulster are empty one-offs. In contrast, the same category constitutes approximately
3% of residences in Dublin.
It is sometimes argued that whereas Dublin may not be blighted with over-supply, instead of
building again, we can get people to sprawl into its commuter counties. There are unfortunately
two limitations to that argument. Firstly, evidence from the housing market suggests that while
people were happy to commute an extra hour a day in the boom and pay the same price – as they
would benefit from rising house prices – the same logic does not apply today. An extra half hour
each way is associated with a 10% discount on prices, everything else being equal.
And secondly, even then, it is not clear that there are that many units available in Dublin’s commuter
counties. Physical geography can be deceptive – the four traditional commuter counties may
be large but they contain only half the dwellings of the capital. Including one-offs, Dublin has
approximately 23,000 houses that are either vacant, partially built or not-yet-started but with
planning permission. All four commuter counties have only a further 24,000.
Dublin is a city where about 10,000 new households are formed every year, according to statistics
on first-time births. New properties coming on the market through aging and executor sales
probably total less than 4,000 a year, while the current rate of completions in the capital is about
1,000. The maths simply don’t stack up – to avoid potentially harmful spikes in prices and rents in
the capital in the near future, new supply will be needed.
Introduction (cont’d)Introduction by Ronan Lyons, Economist with Daft.ie
Rent inflation a clear signal of supply constraints
3 | The Daft.ie Rental Report - 2013 Q1
Estimates of rental supply and demand, by region
0
500
1000
1500
2000
2500
3000
3500
4000
4500
Dublin Other Leinster Munster Conn-U
5000
2012 average monthly demand 2013 supply (April)
4 | The Daft.ie Rental Report - 2013 Q1
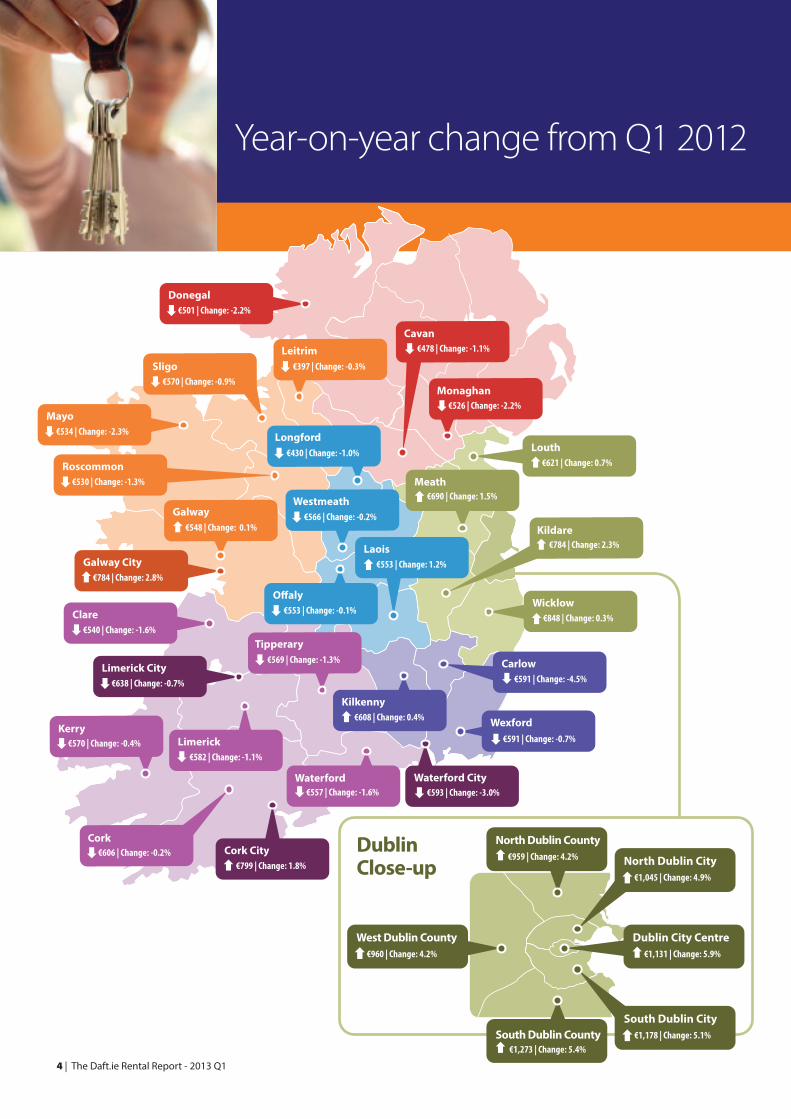
Year-on-year change from Q1 2012
€784 | Change: 2.3%
€566 | Change: -0.2%Galway€548 | Change: 0.1%
Sligo€570 | Change: -0.9%
€397 | Change: -0.3%
€526 | Change: -2.2%
€478 | Change: -1.1%
€430 | Change: -1.0%
Kerry€570 | Change: -0.4%
€569 | Change: -1.3%
Cork€606 | Change: -0.2%
Waterford
Meath€690 | Change: 1.5%
Cork City€799 | Change: 1.8%
Laois€553 | Change: 1.2%
O�aly€553 | Change: -0.1%
Limerick€582 | Change: -1.1%
Kilkenny€608 | Change: 0.4%
Waterford City
Galway City€784 | Change: 2.8%
Mayo€534 | Change: -2.3%
Donegal€501 | Change: -2.2%
Roscommon€530 | Change: -1.3%
Limerick City€638 | Change: -0.7%
Clare€540 | Change: -1.6%
Wicklow€848 | Change: 0.3%
Louth€621 | Change: 0.7%
Dublin City Centre€1,131 | Change: 5.9%
West Dublin County€960 | Change: 4.2%
North Dublin CountyDublinClose-up
€959 | Change: 4.2%
€1,306 | Change: 1.3%
North Dublin City€1,045 | Change: 4.9%
South Dublin City€1,178 | Change: 5.1%
Wexford€591 | Change: -0.7%
Carlow€591 | Change: -4.5%
Kildare
Westmeath
Leitrim
Monaghan
Cavan
Longford
Tipperary
€557 | Change: -1.6% €593 | Change: -3.0%
South Dublin County €1,273 | Change: 5.4%
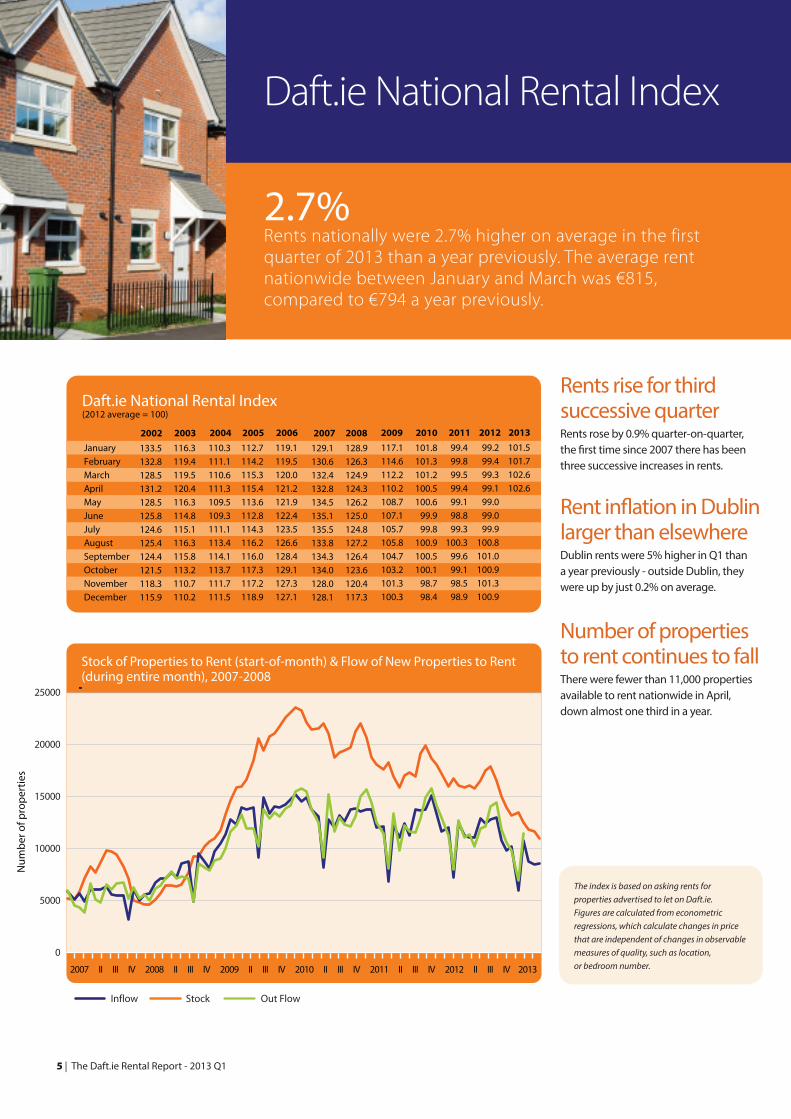
Rents rise for third successive quarter Rents rose by 0.9% quarter-on-quarter, the first time since 2007 there has been three successive increases in rents.
Rent inflation in Dublin larger than elsewhere Dublin rents were 5% higher in Q1 than a year previously - outside Dublin, they were up by just 0.2% on average.
Number of properties to rent continues to fallThere were fewer than 11,000 properties available to rent nationwide in April, down almost one third in a year.
-15.5
Daft.ie National Rental Index
2.7%Rents nationally were 2.7% higher on average in the first quarter of 2013 than a year previously. The average rent nationwide between January and March was €815, compared to €794 a year previously.
5 | The Daft.ie Rental Report - 2013 Q1
Daft.ie National Rental Index(2012 average = 100)
JanuaryFebruaryMarchAprilMayJuneJulyAugustSeptemberOctoberNovemberDecember
2002133.5132.8128.5131.2128.5125.8124.6125.4124.4121.5118.3115.9
2007129.1130.6132.4132.8134.5135.1135.5133.8134.3134.0128.0128.1
2008128.9126.3124.9124.3126.2125.0124.8127.2126.4123.6120.4117.3
116.3119.4119.5120.4116.3114.8115.1116.3115.8113.2110.7110.2
2003110.3111.1110.6111.3109.5109.3111.1113.4114.1113.7111.7111.5
2004112.7114.2115.3115.4113.6112.8114.3116.2116.0117.3117.2118.9
2005119.1119.5120.0121.2121.9122.4123.5126.6128.4129.1127.3127.1
2006 2010101.8101.3101.2100.5100.6
99.999.8
100.9100.5100.1
98.798.4
2009117.1114.6112.2110.2108.7107.1105.7105.8104.7103.2101.3100.3
201199.499.899.599.499.198.899.3
100.399.699.198.598.9
201299.299.499.399.199.099.099.9
100.8101.0100.9101.3100.9
2013101.5101.7102.6102.6
Stock of Properties to Rent (start-of-month) & Flow of New Properties to Rent (during entire month), 2007-2008
Stock Out FlowInflow
0
5000
10000
15000
20000
25000
2007 II III IV 2008 II III IV 2009 II III IV 2010 II III IV 2011 II III IV 2012 II III IV 2013
Num
ber o
f pro
pert
ies
The index is based on asking rents for properties advertised to let on Daft.ie. Figures are calculated from econometric regressions, which calculate changes in price that are independent of changes in observable measures of quality, such as location, or bedroom number.

6 | The Daft.ie Rental Report - 2013 Q1
Daft.ie Snapshot of RentNationwide
What can I ask for? Can I afford it?Average rents across Ireland, by postcode/region and bedroom number, Quarter 1, 2013
Daft.ie Snapshot of Rents Nationwide 1bed 2bed 3bed 4bed 5bed
Dublin 1Dublin 2Dublin 3Dublin 4Dublin 5Dublin 6Dublin 6WDublin 7Dublin 8Dublin 9Dublin 10Dublin 11Dublin 12Dublin 13Dublin 14Dublin 15Dublin 16Dublin 17Dublin 18Dublin 20Dublin 22Dublin 24North Co DublinSouth Co DublinWest DublinCork CityGalway CityLimerick CityWaterford CityDublin Commuter CountiesWest LeinsterSouth-East LeinsterMunsterConnaught Ulster
€920€993€800€1,037€754€798€798€733€791€748€783€762€745€784€945€873€882*€962€951€859€746€769€918€758€598€562€434€415€552€409€430€416€381€359
€1,104€1,264€1,038€1,483€1,044€1,194€1,255€1,014€1,065€973€879€919€968€1,001€1,245€977€1,172€908€883€1,014€915€921€917€1,259€889€777€754€583€517€682€487€536€514€461€426
€1,625€1,785€1,368€2,180€1,160€1,608€1,416€1,233€1,298€1,229€963€1,104€1,125€1,187€1,578€1,019€1,292€1,038€782€1,021€914€1,043€1,091€1,662€1,019€865€824€723€640€760€592€631€635€597€558
**€1,736€3,571€1,377€2,203€2,182€1,483€1,524€1,409€920€1,168€1,269€1,483€1,795€1,071€1,651€1,179€721€1,032€960€1,234€1,286€2,242€1,097€1,042€896€813€694€888€636€680€701€644€603
***€4,700€1,373€3,322€3,454€1,699€1,342€1,620*€1,513*€2,093€2,451€1,876€2,210*€845**€1,149€1,681€2,807€1,034€1,346€1,085€1,093€839€1,085€707€744€778€706€654

Trends in Rents Across DublinFrom Quarter 1, 2006 to Quarter 1, 2013
7 | The Daft.ie Rental Report - 2013 Q1
Rent-a-room income trends
AreaAverage
rent% Yr/yr change
Averagerent
% Yr/yr change
Dublin City Centre
North Dublin City
South Dublin City
North Co. Dublin
South Co. Dublin
West Co. Dublin
€ 413
€ 336
€ 380
€ 290
€ 382
€ 288
2.2%
5.0%
5.3%
3.9%
3.8%
-0.3%
€ 516
€ 419
€ 494
€ 382
€ 470
€ 386
2.2%
4.0%
3.6%
3.5%
3.8%
2.4%
Vacancy1.1
3.4
1.9
7.2
4.8
5.2
Single Room Double Room
Average rents by region, 2006 - 2013
Dublin City Centre North Dublin City South Dublin City North County Dublin South County Dublin West County Dublin
2006 Q2 Q3 Q4 2007 Q2 Q3 Q4 2008 Q2 Q3 Q4 2009 Q2 Q3 Q4 2010 Q2 Q3 Q4 2011 Q2 Q3 Q4 2012 Q2 Q3 Q4 2013
€800
€900
€1,000
€1,100
€1,200
€1,300
€1,400
€1,500
€1,600
€1,700
West County DublinAverage rent: €960Year-on-year change: 4.2%Quarter-on-quarter change: 1.4%Change from peak: -25.2%
North County DublinAverage rent: €959Year-on-year change: 4.2%Quarter-on-quarter change: 1.5%Change from peak: -23.8%
Dublin City CentreAverage rent: €1,131Year-on-year change: 5.9%Quarter-on-quarter change: 1.2%Change from peak: -23.5%
North Dublin CityAverage rent: €1,045Year-on-year change: 4.9%Quarter-on-quarter change: 1.6%Change from peak: -24.6%
South County DublinAverage rent: €1,273Year-on-year change: 5.4%Quarter-on-quarter change: 1.8%Change from peak: -21.1%
South Dublin CityAverage rent: €1,178 Year-on-year change: 1.6%Quarter-on-quarter change: 5.1%Change from peak: -21.6%
Fewer than 2,000 Dublin properties were available to rent in April, the lowest number of any period in the last 8 years apart from February to April 2007.
Rent-a-room costs are rising throughout the capital, with rates up 4-5% for many segments.
In South County Dublin, rents are now almost 10% above levels two years ago.
Rent inflation in all parts of Dublin is above 4% and as high as 6% in central areas.

Trends in Rents in Other CitiesFrom Quarter 1, 2006 to Quarter 1, 2013
8 | The Daft.ie Rental Report - 2013 Q1
Cork City Galway City Limerick City Waterford City
2006 Q2 Q3 Q4 2007 Q2 Q3 Q4 2008 Q2 Q3 Q4 2009 Q2 Q3 Q4 2010 Q2 Q3 Q4 2011 Q2 Q3 Q4 2012 Q2 Q3 Q4
Average Rents by region Other Cities, 2006 - 2013
2006 Q2 Q3 Q4 2007 Q2 Q3 Q4 2008 Q2 Q3 Q4 2009 Q2 Q3 Q4 2010 Q2 Q3 Q4 2011 Q2 Q3 Q4 2012 Q2 Q3 Q4 2013
€500
€600
€700
€800
€900
€1,000
€1,100
€1,200
Rent-a-room income trends
AreaAverage
rent% Yr/yr change
Averagerent
% Yr/yr change
Cork City Centre
Cork City Suburbs
Cork Commuter Towns
Galway City Centre
Galway City Suburbs
Limerick City Centre
Limerick City Suburbs
Waterford City Centre
€ 290
€ 264
€ 256
€ 291
€ 259
€ 228
€ 213
€ 222
5.8%
6.9%
7.1%
1.0%
2.4%
-2.1%
-7.0%
-7.1%
€ 354
€ 318
€ 309
€ 331
€ 304
€ 273
€ 261
€ 259
4.7%
0.6%
0.7%
-0.9%
0.7%
-1.4%
-0.4%
1.2%
Vacancy13.4
7.8
10.3
4.8
6.9
20.2
12.4
26.8
Single Room Double Room
Cork City
Galway City
Limerick CityWaterford CityAverage rent: €638
Year-on-year change: -0.7%Quarter-on-quarter change: -0.1%Change from peak: -26.1%
Average rent: €593Year-on-year change: -3.0%Quarter-on-quarter change: -0.8%Change from peak: -29.6%
Average rent: €784Year-on-year change: 2.8%Quarter-on-quarter change: 0.6%Change from peak: -18.5%
Average rent: €799Year-on-year change: 1.8%Quarter-on-quarter change: 0.2%Change from peak: -26.1%
A split still remains between the markets of Cork and Galway, where rents are rising, and Limerick and Waterford, where they are falling.
The fall from the peak in Waterford is almost 30%, while in Galway, rents are down less than 20% from 2007 levels.
Across the four cities, there were 1,400 properties available to rent in April, down from 1,700 a year previously.
The cost of a single room in Cork is up 6-7% in the last year, while in Limerick and Waterford, it is falling.
Trends in rents-rest of the CountryFrom Quarter 1, 2006 to Quarter 1, 2013
9 | The Daft.ie Rental Report - 2013 Q1
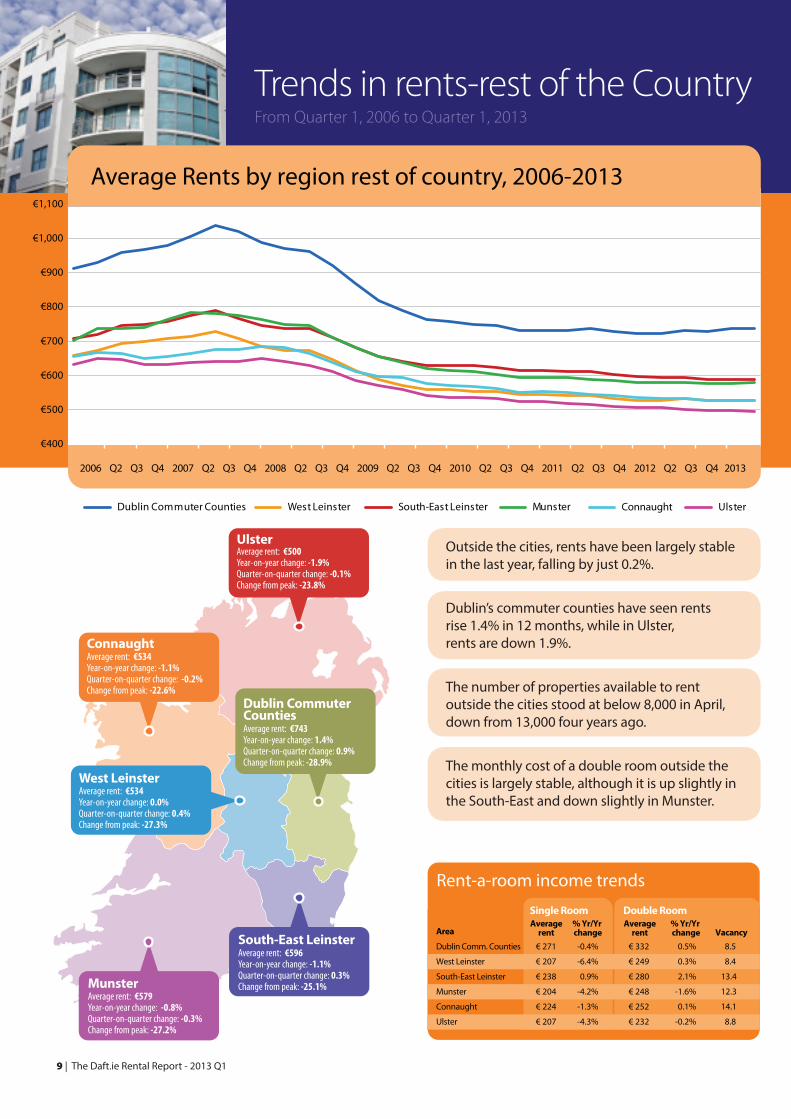
Average Rents by region rest of country, 2006-2013
Dublin Commuter Counties West Leinster South-East Leinster Munster Connaught Ulster
€400
€500
€600
€700
€800
€900
€1,000
€1,100
2006 Q2 Q3 Q4 2007 Q2 Q3 Q4 2008 Q2 Q3 Q4 2009 Q2 Q3 Q4 2010 Q2 Q3 Q4 2011 Q2 Q3 Q4 2012 Q2 Q3 Q4 2013
Rent-a-room income trends
AreaAverage
rent% Yr/Yr change
Averagerent
% Yr/Yr change
Dublin Comm. Counties
West Leinster
South-East Leinster
Munster
Connaught
Ulster
€ 271
€ 207
€ 238
€ 204
€ 224
€ 207
-0.4%
-6.4%
0.9%
-4.2%
-1.3%
-4.3%
€ 332
€ 249
€ 280
€ 248
€ 252
€ 232
0.5%
0.3%
2.1%
-1.6%
0.1%
-0.2%
Vacancy 8.5
8.4
13.4
12.3
14.1
8.8
Single Room Double Room
South-East LeinsterAverage rent: €596Year-on-year change: -1.1%Quarter-on-quarter change: 0.3%Change from peak: -25.1%Munster
Average rent: €579Year-on-year change: -0.8%Quarter-on-quarter change: -0.3%Change from peak: -27.2%
Connaught Average rent: €534Year-on-year change: -1.1%Quarter-on-quarter change: -0.2%Change from peak: -22.6%
UlsterAverage rent: €500Year-on-year change: -1.9%Quarter-on-quarter change: -0.1%Change from peak: -23.8%
West LeinsterAverage rent: €534Year-on-year change: 0.0%Quarter-on-quarter change: 0.4%Change from peak: -27.3%
Dublin CommuterCountiesAverage rent: €743Year-on-year change: 1.4%Quarter-on-quarter change: 0.9%Change from peak: -28.9%
Outside the cities, rents have been largely stable in the last year, falling by just 0.2%.
Dublin’s commuter counties have seen rents rise 1.4% in 12 months, while in Ulster, rents are down 1.9%.
The number of properties available to rent outside the cities stood at below 8,000 in April, down from 13,000 four years ago.
The monthly cost of a double room outside the cities is largely stable, although it is up slightly in the South-East and down slightly in Munster.
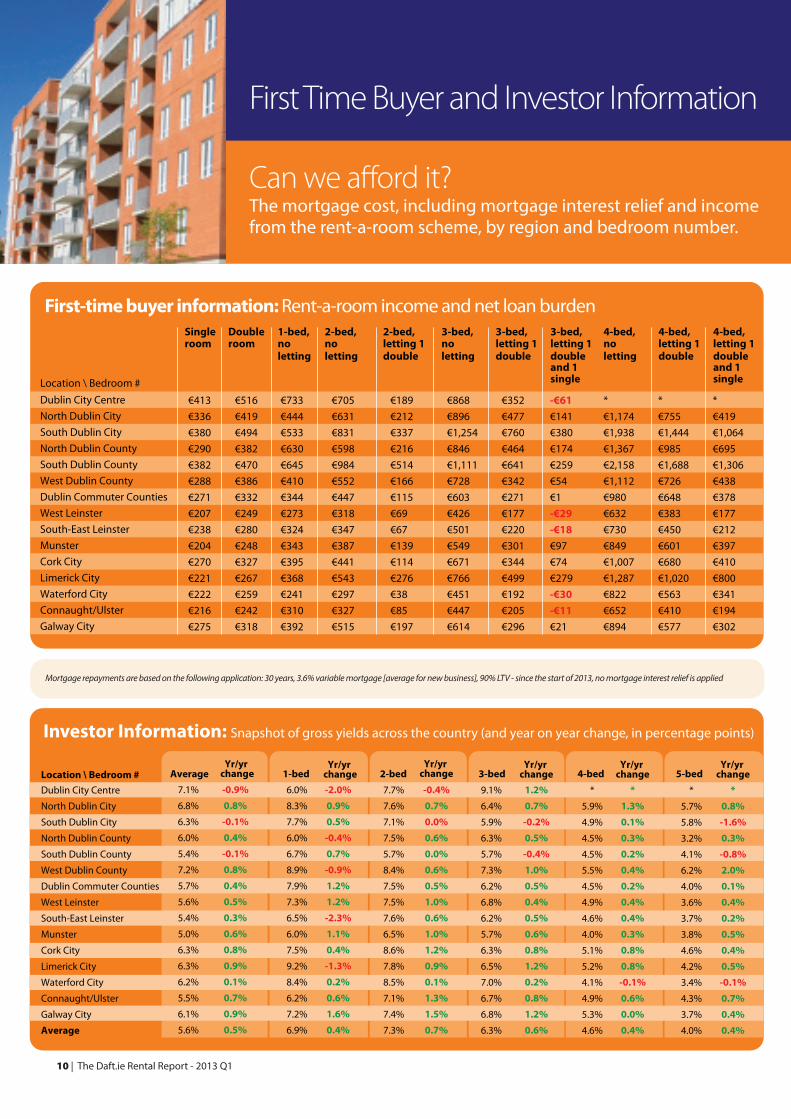
First Time Buyer and Investor Information
Can we afford it?The mortgage cost, including mortgage interest relief and income from the rent-a-room scheme, by region and bedroom number.
10 | The Daft.ie Rental Report - 2013 Q1
Investor Information: Snapshot of gross yields across the country (and year on year change, in percentage points)
Location \ Bedroom # AverageYr/yr
change 1-bed 2-bed 3-bed 4-bed 5-bed
Dublin City Centre
North Dublin City
South Dublin City
North Dublin County
South Dublin County
West Dublin County
Dublin Commuter Counties
West Leinster
South-East Leinster
Munster
Cork City
Limerick City
Waterford City
Connaught/Ulster
Galway City
Average
7.1%
6.8%
6.3%
6.0%
5.4%
7.2%
5.7%
5.6%
5.4%
5.0%
6.3%
6.3%
6.2%
5.5%
6.1%
5.6%
-0.9%
0.8%
-0.1%
0.4%
-0.1%
0.8%
0.4%
0.5%
0.3%
0.6%
0.8%
0.9%
0.1%
0.7%
0.9%
0.5%
6.0%
8.3%
7.7%
6.0%
6.7%
8.9%
7.9%
7.3%
6.5%
6.0%
7.5%
9.2%
8.4%
6.2%
7.2%
6.9%
-2.0%
0.9%
0.5%
-0.4%
0.7%
-0.9%
1.2%
1.2%
-2.3%
1.1%
0.4%
-1.3%
0.2%
0.6%
1.6%
0.4%
7.7%
7.6%
7.1%
7.5%
5.7%
8.4%
7.5%
7.5%
7.6%
6.5%
8.6%
7.8%
8.5%
7.1%
7.4%
7.3%
-0.4%
0.7%
0.0%
0.6%
0.0%
0.6%
0.5%
1.0%
0.6%
1.0%
1.2%
0.9%
0.1%
1.3%
1.5%
0.7%
9.1%
6.4%
5.9%
6.3%
5.7%
7.3%
6.2%
6.8%
6.2%
5.7%
6.3%
6.5%
7.0%
6.7%
6.8%
6.3%
1.2%
0.7%
-0.2%
0.5%
-0.4%
1.0%
0.5%
0.4%
0.5%
0.6%
0.8%
1.2%
0.2%
0.8%
1.2%
0.6%
*
5.9%
4.9%
4.5%
4.5%
5.5%
4.5%
4.9%
4.6%
4.0%
5.1%
5.2%
4.1%
4.9%
5.3%
4.6%
*
1.3%
0.1%
0.3%
0.2%
0.4%
0.2%
0.4%
0.4%
0.3%
0.8%
0.8%
-0.1%
0.6%
0.0%
0.4%
*
5.7%
5.8%
3.2%
4.1%
6.2%
4.0%
3.6%
3.7%
3.8%
4.6%
4.2%
3.4%
4.3%
3.7%
4.0%
*
0.8%
-1.6%
0.3%
-0.8%
2.0%
0.1%
0.4%
0.2%
0.5%
0.4%
0.5%
-0.1%
0.7%
0.4%
0.4%
Yr/yr change
Yr/yr change
Yr/yr change
Yr/yr change
Yr/yr change
First-time buyer information: Rent-a-room income and net loan burden
Location \ Bedroom #
Single room
Double room
1-bed, no letting
2-bed, no letting
3-bed, no letting
4-bed, no letting
2-bed, letting 1 double
3-bed, letting 1 double
3-bed, letting 1 double and 1 single
Dublin City Centre
North Dublin City
South Dublin City
North Dublin County
South Dublin County
West Dublin County
Dublin Commuter Counties
West Leinster
South-East Leinster
Munster
Cork City
Limerick City
Waterford City
Connaught/Ulster
Galway City
€413
€336
€380
€290
€382
€288
€271
€207
€238
€204
€270
€221
€222
€216
€275
€516
€419
€494
€382
€470
€386
€332
€249
€280
€248
€327
€267
€259
€242
€318
€733
€444
€533
€630
€645
€410
€344
€273
€324
€343
€395
€368
€241
€310
€392
€705
€631
€831
€598
€984
€552
€447
€318
€347
€387
€441
€543
€297
€327
€515
€189
€212
€337
€216
€514
€166
€115
€69
€67
€139
€114
€276
€38
€85
€197
€868
€896
€1,254
€846
€1,111
€728
€603
€426
€501
€549
€671
€766
€451
€447
€614
€352
€477
€760
€464
€641
€342
€271
€177
€220
€301
€344
€499
€192
€205
€296
-€61€141
€380
€174
€259
€54
€1
-€29-€18€97
€74
€279
-€30-€11€21
4-bed, letting 1 double
4-bed, letting 1 double and 1 single
*
€1,174
€1,938
€1,367
€2,158
€1,112
€980
€632
€730
€849
€1,007
€1,287
€822
€652
€894
*
€755
€1,444
€985
€1,688
€726
€648
€383
€450
€601
€680
€1,020
€563
€410
€577
*
€419
€1,064
€695
€1,306
€438
€378
€177
€212
€397
€410
€800
€341
€194
€302
Mortgage repayments are based on the following application: 30 years, 3.6% variable mortgage [average for new business], 90% LTV - since the start of 2013, no mortgage interest relief is applied
About the Report
Over the last 10 years, Daft.ie has collected a vast amount of data on the Irish property market. In 2011 alone, more than 260,000 properties were advertised on the site.
The goal of the Daft Report is to use this information to help all actors in the property market make informed decisions about buying and selling. In addition, because it is freely available, the Daft Report can help inform the media, the general public and policymakers about the latest developments in the property market. The Daft.ie Rental Report was launched in 2005. It has already become the definitive barometer of the Irish rental market and is being used by the Central Bank, mortgage institutions, financial analysts and the general public alike. Since its introduction at the start of 2006, the Daft.ie Asking Price Index is also being recognised as the earliest available reliable indicator of developments in house prices in Ireland. This is the Daft.ie Rental Report, the partner to the Daft.ie House Price Report issued last month. Together, they give house-hunters and investors more information to help them make their decisions. These twin reports mean that Daft is the only objective monitor of trends in both rental and sales markets on a monthly basis, making the report an essential barometer for anyone with an interest in the Irish property market.
Methodology and Sample SizeThe statistics are based on properties advertised on Daft.ie for a given period. The regressions used are hedonic price regressions, accounting for all available and measurable attributes of properties, with a Cooks Distance filter for outliers. The average monthly sample size for lettings properties is over 10,000. Indices are based on standard methods, holding the mix of characteristics constant, with the annual average of 2007 used as the base. For more on the methodology, please see www.daft.ie/research.
About Daft.ieDaft.ie is Ireland’s largest property website. The latest audited report from ABC (Sep 2011) shows monthly traffic of 130 million page impressions (pages of information received) and 1.976 million unique users per month across Daft Media’s property websites (daft.ie, rent.ie, let.ie, property.ie). This makes Daft.ie the biggest property website in Ireland across all demographics.
11 | The Daft.ie Rental Report - 2013 Q1

DisclaimerThe Daft.ie Report is preparedfrom information that we believeis collated with care, but we do notmake any statement as to its accuracyor completeness. We reserve the rightto vary our methodology and to editor discontinue the indices, snapshotsor analysis at any time for regulatoryor other reasons. Persons seeking toplace reliance on any informationcontained in this report for their ownor third party commercial purposesdo so at their own risk.
CreditsEconomic Analysis:Ronan Lyons Marketing & Communications: Kieran Harte Layout and Editing:Ciara Mulvany
All data is Copyright © Daft MediaLimited. The information contained inthis report may only be reproduced ifthe source is clearly credited.Please contact Daft.ie on 01-4218700for further information.
Coming Next…
The Daft.ie House Price Report 2013 Q2 In early July 2013 The Daft.ie House Price Report will be published in early July 2013 and will provide a detailed regional analysis of asking prices and transaction prices as well as all the usual indices, snapshots, trends and regional analysis, providing the public with Ireland’s most up-to-date information on the housing market.