The Daft.ie Rental Report · Introduction by Geoff Tucker, Economist, Hooke & MacDonald The Daft.ie...
12
Introduction by Geoff Tucker, Economist, Hooke & MacDonald The Daft.ie Rental Report An analysis of recent trends in the Irish rental market March 2007
Transcript of The Daft.ie Rental Report · Introduction by Geoff Tucker, Economist, Hooke & MacDonald The Daft.ie...

Introduction by Geoff Tucker, Economist, Hooke & MacDonald
The Daft.ie Rental ReportAn analysis of recent trends in the Irish rental market
March 2007

IntroductionGeoff Tucker, Economist, Hooke & MacDonald
Strong Growth in Rents Points to Stable Irish Property Market
2 | The Daft.ie Rental Report - March 2007
With the spring buying and selling season well under way, one thing remains clear – the Irish
property market is in rude health and continues to defy sensationalist reports of an imminent
downturn. As each week goes by, activity steadily gathers pace with the number of enquiries,
viewings and sales rising on the back of strong demand from all purchaser types, whether
they are buying their first home, trading-up, down-sizing or investing. The property market
has now entered a new period of stability and moderation, which is good news for everyone
concerned, especially first-time buyers.
The latest analysis of the rental market contained in this edition of the Daft Report shows
rental values continuing to increase steadily right across the country, with the annual rate
of growth reaching 10.5 per cent in February 2007 – the fastest growth rate since the index
started tracking rents back at the beginning of 2002. Rental values have been increasing since
the end of 2004, though it wasn’t until the middle of last year that the pace of growth really
picked up and reached double figures.
It comes as no surprise to see the biggest jump in rents over the last twelve months occurring
in Dublin 2. Here the average rent for a one bedroom home increased by 24.3 per cent to
€1,234 per month and by 19.7 per cent to €1,679 per month for a two bedroom home. Two
bedroom homes in Dublin 18 also registered a significant jump in rental values, rising by 18.8
per cent to €1,574 per month. This post code includes locations such as Sandyford, Stepaside,
Kilternan and Carrickmines that benefit from being close to major centres of employment and
good transportation links that provide easy access to the city centre.
The increase in rental values reflects a variety of factors at work, but is primarily due to the
strength of tenant demand, which is linked to the sustained growth in population and high
levels of inward migration, especially in Dublin. Alongside this, supply constraints in some key
urban locations have led to further upward pressure on rents while the substantially improved
quality of product on offer, with modern, well fitted-out apartments replacing the traditional
older bedsits/flats, has also had its effect.
Continued on next page >
IntroductionGeoff Tucker, Economist, Hooke & MacDonald
Strong Growth in Rents Points to Stable Irish Property Market
3 | The Daft.ie Rental Report - March 2007
The strong performance in the rental market has continued to encourage investors to purchase residential
property. In the new homes market investors account for just over one-quarter of all purchasers, compared
to around 20 per cent only two years ago. The continuing presence of investors is a major vote of confidence
for the Irish residential market. The investor plays a vital role in the residential market, supplying much
needed accommodation to the private rented sector, which accounts for approximately one-in-nine private
households nationally and one-in-five in Dublin.
Yields on residential property (the annual rental income generated as a proportion of the overall property
value) have increased for almost all accommodation types in Dublin during the past six months, reflecting
the growth in rents and very little change in property values. Changes in yields outside Dublin tend to vary
depending on location, increasing for most accommodation types in Galway City and falling in Limerick City.
Yet for most investors, long-term capital gain is the primary objective, with many planning to use their
property investment to fund their retirement or as a nest-egg for their children. Figures from Hooke &
MacDonald confirm this and show that three quarters of investors purchasing new homes last year plan to
hold on to their property for more than five years and half for more than ten years. Therefore, the prospect of a
couple of years of single-digit growth rates in the Irish residential property market is unlikely to deter investors
and is in fact far more sustainable in the long run.
Investors rate rental potential, access to public transport and potential for long-term capital appreciation
as the most important factors influencing their choice of property. As a result, it is not surprising to see the
majority investors purchasing properties in city centre areas – the traditional core of the rental market – or
in suburban locations that are along key public transport routes and are easily accessible to major centres of
employment.
The growth in rental values is expected to continue throughout 2007, rising by an average of 10 per cent this
year, primarily driven by the demand for good quality accommodation. This, along with the final wave of SSIAs
to be released later in the year, will ensure that investor activity remains strong right through the remainder of
the year.
Continued on next page >

IntroductionGeoff Tucker, Economist, Hooke & MacDonald
Strong Growth in Rents Points to Stable Irish Property Market
4 | The Daft.ie Rental Report - March 2007
The Daft Report also highlights the importance of the rental market in helping first-time buyers reduce their
monthly mortgage repayments through renting out a room. Figures from Hooke & MacDonald show that
one in every four first-time buyers purchasing a new home last year planned to rent out a room, including
40 per cent for first-time buyers purchasing on their own. Given the current upward trend in rental values, an
increase in the Rent-a-room Scheme income limit to €1,000 per month (currently €635 per month) would be
an appropriate policy response and should be implemented as soon as possible.
Finally, this edition of the Daft Report provides a snapshot of new home prices for the first time, of which there
are currently over 25,000 units available in over 3,000 developments on the Daft.ie website. There is some
variation in prices between the new and second-hand markets, though this in part can be explained by the
varying degree of the quality of stock in the second-hand market and the fact that the majority of new homes
are exempt from stamp duty provided the purchaser plans to live in it. This is one of the many reasons new
homes are so popular with first-time buyers.
In the region of 80,000 new homes will be built across the country this year and while this represents a
reduction on last year’s figure, it is still a remarkable level of output. The favourable economic outlook
– sustained levels of job creation, strong wage growth, maturing SSIAs, buoyant consumer spending – and the
continued increase in population will ensure demand remains strong. Average price growth of 5 per cent looks
likely this year, which is a far more sustainable rate of increase than the double-digit growth rates of last year.
Even after taking into account the last two recent interest rate increases, affordability for first-time buyers
actually improved in the first couple of months of 2007, thanks in large part to the changes in mortgage
interest relief for first-time buyers announced in Budget 2007. The benign outlook for interest rates in the year
ahead, with at most one more rise expected before the ECB will put rates on hold for an extended period, and
the more moderate pace of price growth should see affordability improve again in the latter half of 2007.
To sum up, the residential property market is performing well, particularly when compared to spring 2004 and
2005 rather than the overheated market environment dominated by spiralling prices in spring 2006. Bricks and
mortar have consistently proved to be a reliable long-term investment – nothing has changed in this respect.

Rents Returnto 2002 The nation-wide average rent stood at €1,334, its highest level since January 2002.
Paying for your En-suite
Two bedroom properties with an en suite master bedroom have rents on average €90 more than their one-bathroomed counterparts, up from €80 a year ago.
Daft.ie National Rates Index
10.5%
The average rent in Ireland increased by 10.5% between February 2006 and February 2007. This was the highest year-on-year rate of increase since the index started in 2002.
5 | The Daft.ie Rental Report - March 2007
Daft.ie National Rental Index(Base: 2005 = 100)
2002 2003 2004 2005 2006 2007January 115.6 101.2 95.7 97.7 103.3 112.9February 113.5 102.0 94.9 97.5 102.6 113.4March 109.6 102.3 94.6 98.6 102.8April 111.6 102.7 95.0 98.4 102.9May 111.7 101.3 95.4 99.0 105.0June 110.1 100.5 95.8 99.0 105.8July 108.5 100.4 96.9 99.9 107.1August 108.1 100.3 97.9 100.4 109.4September 107.1 99.9 98.5 100.2 110.4October 105.1 97.9 98.4 102.0 112.4November 103.3 96.6 97.6 102.9 112.5December 101.0 95.9 97.2 104.4 113.0
Year-on-year percentage change in average rents
-10.0%
-8.0%
-6.0%
-4.0%
-2.0%
0.0%
2.0%
4.0%
6.0%
8.0%
10.0%
12.0%
J F M A M J J A S O N D J F M A M J J A S O N D J F M A M J J A S O N D J F
2004 2005 2006
May 2004
Rents begin their recovery the same
month that Ireland opens it gates to the
new EU member states.
The index is based on asking rents for proper-ties advertised to let on Daft.ie. Figures are calculated from econometric regressions, which calculate changes in price that are independent of changes in observable mea-sures of quality, such as location, or bedroom number.

Trends in rents across the country From quarter 1 2004 to quarter 1 2007
6 | The Daft.ie Rental Report - March 2007
Cities the big gainers Rents have increased steadily over the last 3 years and perhaps not surprisingly this has been driven by the cities. Rents in Dublin are almost 20% higher than at the start of 2004, rents in Cork 23% higher, while average rents in Galway and Limerick have increased by 21% and 17% respectively.
1beds, Dublin 2 24.3%
2beds, Dublin 2 19.7%
2beds, Dublin 18 18.8%
3beds, Dublin 15 17.2%
3beds, Dublin 4 17.2%
Biggest Gainers
1beds, Dublin 7 4.3%
2beds, Dublin 13 5.1%
2beds, Dublin 7 5.4%
3beds, Dublin 24 6.3%
2beds, Dublin 11 6.7%
Slowest Growers
1beds, Dublin 2 24.3%
2beds, Dublin 2 19.7%
2beds, Dublin 18 18.8%
3beds, Dublin 15 17.2%
3beds, Dublin 4 17.2%
Biggest Gainers
1beds, Dublin 7 4.3%
2beds, Dublin 13 5.1%
2beds, Dublin 7 5.4%
3beds, Dublin 24 6.3%
2beds, Dublin 11 6.7%
Slowest Growers
Growing market in the commuter counties The other strong growth segment has been the commuter counties – Meath, Kildare, Louth and Wicklow – where rents have increased 16.4% in the last three years. Half of this increase has been in the last 12 months.
Dublin
Limerick
Commuter Counties
Rest of Munster
West Leinster
Galway
SE Leinster
Rest of Conn/Ulster
Cork
Trends in rents across the countryFrom quarter 1 2004 to quarter 1 2007
€400
€600
€800
€1,000
€1,200
€1,400
2004Q1
2004Q2
2004Q3
2004Q4
2005Q1
2005Q2
2005Q3
2005Q4
2006Q1
2006Q2
2006Q3
2006Q4
2007Q1
For the trends graph, Dublin Commuter Towns include Celbridge, Naas, Leixlip, Bray, Maynooth and Greystones. Commuter Counties include Louth, Meath, Kildare and Wicklow but excludes the aforementioned commuter towns. West Leinster includes Longford, Offaly, Laois and Westmeath. South East Leinster includes Carlow, Kilkenny and Wexford. Munster excludes Cork and Limerick. Connacht/Ulster excludes Galway, and only includes counties within the Republic.
7 | The Daft.ie Rental Report - March 2007
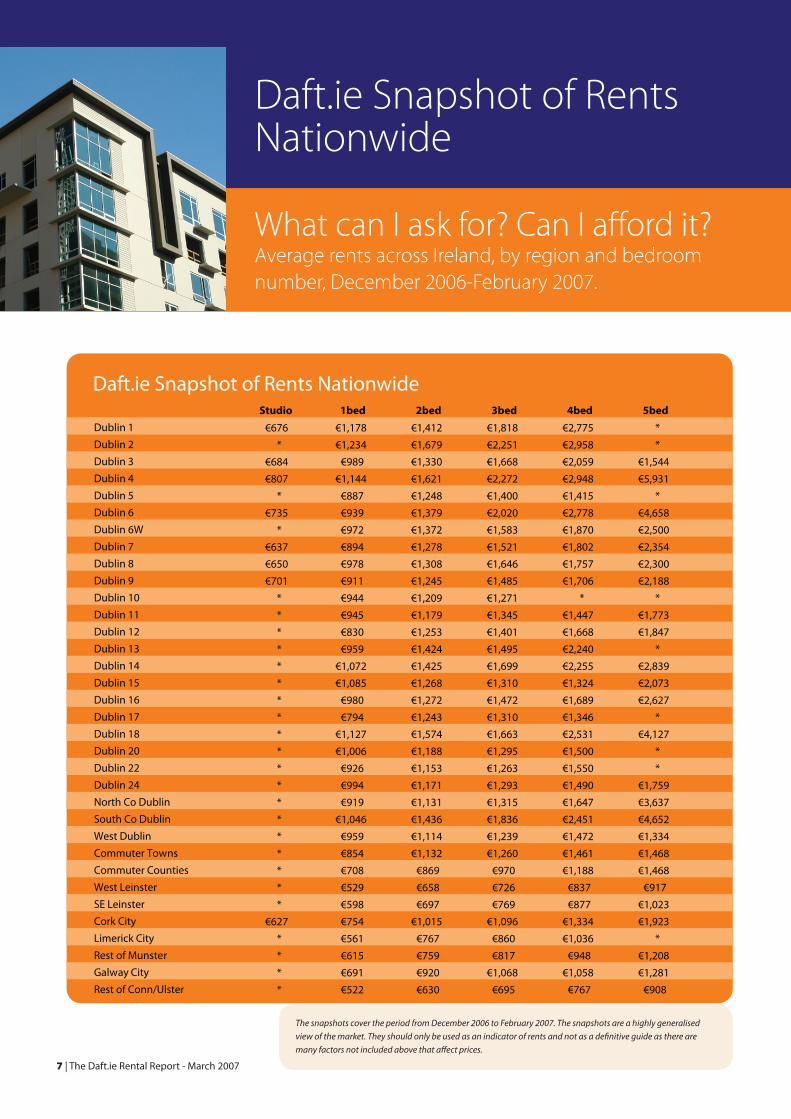
Daft.ie Snapshot of Rents NationwideStudio 1bed 2bed 3bed 4bed 5bed
Dublin 1 €676 €1,178 €1,412 €1,818 €2,775 *Dublin 2 * €1,234 €1,679 €2,251 €2,958 *Dublin 3 €684 €989 €1,330 €1,668 €2,059 €1,544Dublin 4 €807 €1,144 €1,621 €2,272 €2,948 €5,931Dublin 5 * €887 €1,248 €1,400 €1,415 *Dublin 6 €735 €939 €1,379 €2,020 €2,778 €4,658Dublin 6W * €972 €1,372 €1,583 €1,870 €2,500Dublin 7 €637 €894 €1,278 €1,521 €1,802 €2,354Dublin 8 €650 €978 €1,308 €1,646 €1,757 €2,300Dublin 9 €701 €911 €1,245 €1,485 €1,706 €2,188Dublin 10 * €944 €1,209 €1,271 * *Dublin 11 * €945 €1,179 €1,345 €1,447 €1,773Dublin 12 * €830 €1,253 €1,401 €1,668 €1,847Dublin 13 * €959 €1,424 €1,495 €2,240 *Dublin 14 * €1,072 €1,425 €1,699 €2,255 €2,839Dublin 15 * €1,085 €1,268 €1,310 €1,324 €2,073Dublin 16 * €980 €1,272 €1,472 €1,689 €2,627Dublin 17 * €794 €1,243 €1,310 €1,346 *Dublin 18 * €1,127 €1,574 €1,663 €2,531 €4,127Dublin 20 * €1,006 €1,188 €1,295 €1,500 *Dublin 22 * €926 €1,153 €1,263 €1,550 *Dublin 24 * €994 €1,171 €1,293 €1,490 €1,759North Co Dublin * €919 €1,131 €1,315 €1,647 €3,637South Co Dublin * €1,046 €1,436 €1,836 €2,451 €4,652West Dublin * €959 €1,114 €1,239 €1,472 €1,334Commuter Towns * €854 €1,132 €1,260 €1,461 €1,468Commuter Counties * €708 €869 €970 €1,188 €1,468West Leinster * €529 €658 €726 €837 €917SE Leinster * €598 €697 €769 €877 €1,023Cork City €627 €754 €1,015 €1,096 €1,334 €1,923Limerick City * €561 €767 €860 €1,036 *Rest of Munster * €615 €759 €817 €948 €1,208Galway City * €691 €920 €1,068 €1,058 €1,281Rest of Conn/Ulster * €522 €630 €695 €767 €908
Daft.ie Snapshot of Rents Nationwide
What can I ask for? Can I afford it? Average rents across Ireland, by region and bedroom number, December 2006-February 2007.
The snapshots cover the period from December 2006 to February 2007. The snapshots are a highly generalised view of the market. They should only be used as an indicator of rents and not as a definitive guide as there are many factors not included above that affect prices.

Mortgage Affordability Calculator
Can we afford it?
The mortgage cost, including mortgage interest relief and income from the rent-a-room scheme, by region and bedroom number
8 | The Daft.ie Rental Report - March 2007
Mortgage Repayments (35 yrs, ECB tracker +1.1%, 92% LTV), including mortgage interest relief, based on a joint mortgage
After mortgage interest relief and rent-a-room income for 2/3/4 beds
Rent-a-Room Income:What Does Your Spare Room Get You?
Loan burden
Location \ Bedroom # 1-bed 2-bed 3-bed 4-bed
Dublin City Centre €1,269 €1,685 €2,740 *North Dublin City €1,139 €1,456 €1,726 €2,785South Dublin City €1,205 €1,701 €1,675 €2,598North Dublin County €1,089 €1,250 €1,544 €2,338South Dublin County €1,679 €2,014 €2,552 €3,944West Dublin County €1,037 €1,244 €1,417 €1,966Dublin Commuter Towns €1,279 €1,346 €1,835 €2,387Dublin Commuter Counties €981 €1,065 €1,243 €1,648West Leinster €790 €844 €963 €1,303South-East Leinster €868 €906 €1,098 €1,472Munster €795 €871 €1,061 €1,377Cork City €1,018 €1,110 €1,316 €1,799Limerick City €725 €745 €979 €1,229Connaught/Ulster €685 €732 €914 €1,152Galway City €1,018 €1,164 €1,280 €1,540
Location \ Bedroom # Double roomIncome from
1-bed 2-bed 3-bed 4-bedDublin City Centre €598 €1,269 €1,087 €2,142 *North Dublin City €501 €1,139 €955 €1,225 €2,284South Dublin City €540 €1,205 €1,161 €1,135 €2,058North Dublin County €452 €1,089 €798 €1,092 €1,886South Dublin County €550 €1,679 €1,464 €2,002 €3,394West Dublin County €443 €1,037 €801 €974 €1,523Dublin Commuter Towns €413 €1,279 €933 €1,422 €1,974Dublin Commuter Counties €384 €981 €681 €859 €1,264West Leinster €283 €790 €561 €680 €1,020South-East Leinster €305 €868 €601 €793 €1,167Munster €283 €795 €588 €778 €1,094Cork City €373 €1,018 €737 €943 €1,426Limerick City €281 €725 €464 €698 €948Connaught/Ulster €279 €685 €453 €635 €873Galway City €342 €1,018 €822 €938 €1,198
July/August 2006January/February 2007 % ChangeLocation
Dublin City Centre €598€562 6.4%North Dublin City €501€466 7.5%South Dublin City €540€510 5.9%North Dublin County €452€425 6.4%South Dublin County €550€512 7.4%West Dublin County €443€425 4.2%Dublin Commuter Towns €413€396 4.3%Dublin Commuter Counties €384€367 4.6%West Leinster €283€280 1.1%South-East Leinster €305€302 1.0%Munster €283€273 3.7%Cork City €373€346 7.8%Limerick City €281€277 1.4%Connaught/Ulster €279€269 3.7%Galway City €342€348 -1.7%
North Dublin most affordable
Based on the assumptions in the tables, if you can
afford €1,000 a month in mortgage repayments and
want to live in the greater Dublin area, look for 2-
bedroom properties in north Dublin city or county.
West Dublin for 3-beds
Those looking for a bit more space and the third
room should check out three-bedroom properties
in West Dublin, where the average loan burden
after interest relief and renting out a double room
is just €974.

Mortgage Affordability Calculator
Rent-a-Room Income:
Average income for double room, accommodation sharing.
9 | The Daft.ie Rental Report - March 2007
Rent-a-Room gains mirror lettings
Rent-a-room is an increasingly
popular way of easing the
burden of mortgage repayments.
Increases in demand have more
than matched those in supply,
though, particularly throughout
the greater Dublin area and in
Cork city.
Mortgage Repayments (35 yrs, ECB tracker +1.1%, 92% LTV), including mortgage interest relief, based on a joint mortgage
After mortgage interest relief and rent-a-room income for 2/3/4 beds
Rent-a-Room Income:What Does Your Spare Room Get You?
Loan burden
Location \ Bedroom # 1-bed 2-bed 3-bed 4-bed
Dublin City Centre €1,269 €1,685 €2,740 *North Dublin City €1,139 €1,456 €1,726 €2,785South Dublin City €1,205 €1,701 €1,675 €2,598North Dublin County €1,089 €1,250 €1,544 €2,338South Dublin County €1,679 €2,014 €2,552 €3,944West Dublin County €1,037 €1,244 €1,417 €1,966Dublin Commuter Towns €1,279 €1,346 €1,835 €2,387Dublin Commuter Counties €981 €1,065 €1,243 €1,648West Leinster €790 €844 €963 €1,303South-East Leinster €868 €906 €1,098 €1,472Munster €795 €871 €1,061 €1,377Cork City €1,018 €1,110 €1,316 €1,799Limerick City €725 €745 €979 €1,229Connaught/Ulster €685 €732 €914 €1,152Galway City €1,018 €1,164 €1,280 €1,540
Location \ Bedroom # Double roomIncome from
1-bed 2-bed 3-bed 4-bedDublin City Centre €598 €1,269 €1,087 €2,142 *North Dublin City €501 €1,139 €955 €1,225 €2,284South Dublin City €540 €1,205 €1,161 €1,135 €2,058North Dublin County €452 €1,089 €798 €1,092 €1,886South Dublin County €550 €1,679 €1,464 €2,002 €3,394West Dublin County €443 €1,037 €801 €974 €1,523Dublin Commuter Towns €413 €1,279 €933 €1,422 €1,974Dublin Commuter Counties €384 €981 €681 €859 €1,264West Leinster €283 €790 €561 €680 €1,020South-East Leinster €305 €868 €601 €793 €1,167Munster €283 €795 €588 €778 €1,094Cork City €373 €1,018 €737 €943 €1,426Limerick City €281 €725 €464 €698 €948Connaught/Ulster €279 €685 €453 €635 €873Galway City €342 €1,018 €822 €938 €1,198
July/August 2006January/February 2007 % ChangeLocation
Dublin City Centre €598€562 6.4%North Dublin City €501€466 7.5%South Dublin City €540€510 5.9%North Dublin County €452€425 6.4%South Dublin County €550€512 7.4%West Dublin County €443€425 4.2%Dublin Commuter Towns €413€396 4.3%Dublin Commuter Counties €384€367 4.6%West Leinster €283€280 1.1%South-East Leinster €305€302 1.0%Munster €283€273 3.7%Cork City €373€346 7.8%Limerick City €281€277 1.4%Connaught/Ulster €279€269 3.7%Galway City €342€348 -1.7%
Pushing the tax threshold
Income from a double-room in
Dublin city centre is now close to
the tax threshold, at €600. Those
who need a room in Dublin and
are prepared to commute can
get a double-room in one of the
commuter towns for €413.

Investors Information
Average prices in new developments and yields around the country
10 | The Daft.ie Rental Report - March 2007
New Developments
Second-hand properties
Snapshot of yields
Change since August 2006
Location \ Bedroom # 1-bed 2-bed 3-bed 4-bed
Dublin City Centre €373,333 €490,000 * *North Dublin City €320,000 €353,000 €405,000 *South Dublin City €391,000 €543,125 €516,750 *North Dublin County €295,000 €315,000 €409,750 €600,000South Dublin County €365,000 €540,000 €672,500 €1,400,000West Dublin County €286,000 €375,000 €393,500 €565,000Commuter Towns & Counties €275,000 €355,000 €367,059 €426,667West Leinster €215,000 €279,385 €300,512 €339,573South-East Leinster €222,494 €236,687 €260,656 €373,375Munster €156,064 €202,800 €242,408 €354,531Cork City €245,000 €347,125 €334,684 €411,684Limerick City €165,000 €195,000 €264,833 €324,763Connaught/Ulster €193,000 €197,313 €231,500 €286,115Galway City €240,000 €262,150 €284,500 €340,000
1-bed 2-bed 3-bed 4-bed
€314,457 €436,706 €618,100 *€304,377 €429,235 €483,949 €847,235€341,494 €456,857 €512,008 €800,654€293,312 €338,360 €414,893 €657,658€413,500 €516,622 €772,625 €1,107,281€274,074 €331,865 €375,087 €514,038€281,055 €302,929 €345,410 €469,009€234,571 €242,793 €261,178 €357,210€351,513 €210,297 €245,233 €350,194€207,686 €214,966 €250,503 €349,912€317,420 €252,925 €316,654 €436,238€156,800 €184,727 €229,178 €363,571€182,627 €184,708 €217,239 €286,457€230,305 €265,683 €257,640 €323,849
Location \ Bedroom # 1-bed 2-bed 3-bed 4-bed 5-bed Average
Dublin City Centre 3.7% 4.0% 3.6% * * 3.8%
North Dublin City 3.4% 3.8% 3.8% 3.0% 2.5% 3.6%
South Dublin City 3.5% 3.7% 4.3% 3.7% 4.3% 3.9%
North Dublin County 3.6% 3.9% 3.6% 3.3% 3.3% 3.6%
South Dublin County 2.8% 3.2% 3.2% 3.7% 4.3% 3.4%
West Dublin County 3.9% 4.0% 3.8% 3.5% 3.0% 3.8%
Dublin Commuter Towns 2.7% 3.5% 3.0% 3.2% 2.1% 3.1%
Dublin Commuter Counties 3.0% 3.5% 3.3% 3.2% 3.1% 3.3%
West Leinster 2.9% 3.3% 3.2% 2.8% 2.6% 2.9%
South-East Leinster 2.1% 3.3% 3.0% 2.6% 3.0% 2.8%
Munster 2.7% 3.6% 3.2% 3.0% 3.0% 3.1%
Cork City 2.5% 3.9% 3.5% 3.4% 2.8% 3.4%
Limerick City 3.3% 4.6% 3.8% 3.8% 3.3% 3.9%
Connaught/Ulster 2.6% 3.5% 3.1% 2.8% 3.0% 3.0%
Galway City 2.9% 3.3% 3.4% 3.2% 2.4% 3.2%Average 3.0% 3.6% 3.4% 3.0% 2.9% 3.2%
Dublin City Centre 0.31% 0.44% 0.18% 0.35%
North Dublin City 0.27% 0.48% 0.51% 0.32% 0.46% 0.46%
South Dublin City 0.39% 0.25% 0.25% 0.04% 1.51% 0.29%
North Dublin County -0.09% 0.13% 0.18% 0.48% 0.65% 0.24%
South Dublin County 0.01% 0.38% 0.34% 1.04% 1.75% 0.59%
West Dublin County 0.34% 0.25% 0.15% 0.13% 0.58% 0.19%
Dublin Commuter Towns 0.31% -0.07% -0.33% 0.30% -0.73% -0.13%
Dublin Commuter Counties -0.48% 0.03% 0.00% 0.29% 0.34% 0.12%
West Leinster -0.54% -0.09% 0.00% 0.06% -0.18% -0.04%
South-East Leinster 0.08% -0.26% -0.24% -0.04% 0.45% -0.06%
Munster 0.03% -0.12% -0.23% 0.13% 0.32% -0.02%
Cork City -0.62% 0.53% 0.09% 0.33% -0.79% 0.11%
Limerick City -0.36% 0.46% -0.21% -0.03% -0.36% -0.05%
Connaught/Ulster -0.22% 0.06% -0.28% 0.12% 0.27% 0.03%
Galway City 0.22% 0.27% 0.37% 0.06% -0.15% 0.18%Average -0.06% 0.10% -0.04% 0.14% 0.20% 0.07%
Stamp duty having its impact on prices in new developments
Average prices for new developments,
particularly in Dublin, are higher
than the average for their segment,
reflecting perhaps the wedge that
stamp duty is placing between price
paid and price received.
New Developments
Second-hand properties
Snapshot of yields
Change since August 2006
Location \ Bedroom # 1-bed 2-bed 3-bed 4-bed
Dublin City Centre €373,333 €490,000 * *North Dublin City €320,000 €353,000 €405,000 *South Dublin City €391,000 €543,125 €516,750 *North Dublin County €295,000 €315,000 €409,750 €600,000South Dublin County €365,000 €540,000 €672,500 €1,400,000West Dublin County €286,000 €375,000 €393,500 €565,000Commuter Towns & Counties €275,000 €355,000 €367,059 €426,667West Leinster €215,000 €279,385 €300,512 €339,573South-East Leinster €222,494 €236,687 €260,656 €373,375Munster €156,064 €202,800 €242,408 €354,531Cork City €245,000 €347,125 €334,684 €411,684Limerick City €165,000 €195,000 €264,833 €324,763Connaught/Ulster €193,000 €197,313 €231,500 €286,115Galway City €240,000 €262,150 €284,500 €340,000
1-bed 2-bed 3-bed 4-bed
€314,457 €436,706 €618,100 *€304,377 €429,235 €483,949 €847,235€341,494 €456,857 €512,008 €800,654€293,312 €338,360 €414,893 €657,658€413,500 €516,622 €772,625 €1,107,281€274,074 €331,865 €375,087 €514,038€281,055 €302,929 €345,410 €469,009€234,571 €242,793 €261,178 €357,210€351,513 €210,297 €245,233 €350,194€207,686 €214,966 €250,503 €349,912€317,420 €252,925 €316,654 €436,238€156,800 €184,727 €229,178 €363,571€182,627 €184,708 €217,239 €286,457€230,305 €265,683 €257,640 €323,849
Location \ Bedroom # 1-bed 2-bed 3-bed 4-bed 5-bed Average
Dublin City Centre 3.7% 4.0% 3.6% * * 3.8%
North Dublin City 3.4% 3.8% 3.8% 3.0% 2.5% 3.6%
South Dublin City 3.5% 3.7% 4.3% 3.7% 4.3% 3.9%
North Dublin County 3.6% 3.9% 3.6% 3.3% 3.3% 3.6%
South Dublin County 2.8% 3.2% 3.2% 3.7% 4.3% 3.4%
West Dublin County 3.9% 4.0% 3.8% 3.5% 3.0% 3.8%
Dublin Commuter Towns 2.7% 3.5% 3.0% 3.2% 2.1% 3.1%
Dublin Commuter Counties 3.0% 3.5% 3.3% 3.2% 3.1% 3.3%
West Leinster 2.9% 3.3% 3.2% 2.8% 2.6% 2.9%
South-East Leinster 2.1% 3.3% 3.0% 2.6% 3.0% 2.8%
Munster 2.7% 3.6% 3.2% 3.0% 3.0% 3.1%
Cork City 2.5% 3.9% 3.5% 3.4% 2.8% 3.4%
Limerick City 3.3% 4.6% 3.8% 3.8% 3.3% 3.9%
Connaught/Ulster 2.6% 3.5% 3.1% 2.8% 3.0% 3.0%
Galway City 2.9% 3.3% 3.4% 3.2% 2.4% 3.2%Average 3.0% 3.6% 3.4% 3.0% 2.9% 3.2%
Dublin City Centre 0.31% 0.44% 0.18% 0.35%
North Dublin City 0.27% 0.48% 0.51% 0.32% 0.46% 0.46%
South Dublin City 0.39% 0.25% 0.25% 0.04% 1.51% 0.29%
North Dublin County -0.09% 0.13% 0.18% 0.48% 0.65% 0.24%
South Dublin County 0.01% 0.38% 0.34% 1.04% 1.75% 0.59%
West Dublin County 0.34% 0.25% 0.15% 0.13% 0.58% 0.19%
Dublin Commuter Towns 0.31% -0.07% -0.33% 0.30% -0.73% -0.13%
Dublin Commuter Counties -0.48% 0.03% 0.00% 0.29% 0.34% 0.12%
West Leinster -0.54% -0.09% 0.00% 0.06% -0.18% -0.04%
South-East Leinster 0.08% -0.26% -0.24% -0.04% 0.45% -0.06%
Munster 0.03% -0.12% -0.23% 0.13% 0.32% -0.02%
Cork City -0.62% 0.53% 0.09% 0.33% -0.79% 0.11%
Limerick City -0.36% 0.46% -0.21% -0.03% -0.36% -0.05%
Connaught/Ulster -0.22% 0.06% -0.28% 0.12% 0.27% 0.03%
Galway City 0.22% 0.27% 0.37% 0.06% -0.15% 0.18%Average -0.06% 0.10% -0.04% 0.14% 0.20% 0.07%

About the Report
Over the last 10 years, Daft.ie has collected a vast amount of data on the Irish property market. In 2006 alone, more than 315,000 properties were advertised on the site.
The goal of the Daft Report is to use this information to help all actors in the property
market make informed decisions about buying and selling. In addition, because it is
freely available, the Daft Report can help inform the media, the general public and
policymakers about the latest developments in the property market.
The Daft Report is now over two years old. It has already become the definitive barometer
of the Irish rental market and is being used by the Central Bank, mortgage institutions,
financial analysts and the general public alike. Since its introduction in one year ago,
the Daft.ie Asking Price Index is also being recognised as the earliest available reliable
indicator of developments in house prices in Ireland.
This is the Daft.ie Rental Report, the partner to the Daft.ie Sales Report launched last
month. Together, they give house-hunters and investors more information to help them
make their decisions. These twin reports mean that Daft is the only objective monitor
of trends in both rental and sales markets on a monthly basis, making the report an
essential barometer for anyone with an interest in the Irish property market.
Methodology and Sample SizeThe statistics are based on properties advertised on Daft.ie for a given period. The regressions used are hedonic price regressions, accounting for all available and measurable attibutes of properties and only coefficients with a very high degree of statistical significance (p < 0.001) are used.
The average monthly sample size for sales during 2006 was over 13,000. Indices are based on standard methods, holding the mix of characteristics constant, with the annual average of 2005 used as the base. A working paper on the methodologies employed in both rental and sales markets will be published on the Daft.ie website in May 2007.
CirculationWe are pleased to announce that the average readership of the 2006 reports was over 43,000 people.
About Daft.ieDaft.ie is Ireland’s biggest website* with almost 600,000 unique visitors a month and in excess of 65,000 properties on the website at any one time. In the last year traffic to Daft.ie has tripled. The majority of the growth has been for first-time-buyer properties and investment properties both home and abroad.
Although started in 1997 as a lettings website, in recent years Daft has grown up with its audience. This is because the people who were renting in 1997 have become the people buying in 2006. Over the last 12 months there has been a major shift in our visitor demographics. At present over 60% of all visitors to Daft are interested in purchasing property as opposed to renting.
Further to the move into residential sales, Daft recently launched an overseas property section which now boasts over 15,000 properties from around the world. This international initiative saw Daft being named as one of the top five e-businesses in the world by the UN at the 2005 World Information Society Summit in Tunisia.
* ABC Certified, November 2006
11 | The Daft.ie Rental Report - March 2007

DisclaimerThe Daft.ie Report is prepared from information that we believe is collated with care, but we do not make any statement as to its accuracy or completeness. We reserve the right to vary our methodology and to edit or discontinue the indices, snapshots or analysis at any time for regulatory or other reasons. Persons seeking to place reliance on any information contained in this report for their own or third party commercial purposes do so at their own risk.
CreditsEconomic Analysis:Ronan Lyons
Layout and Editing:Derek Jones | Flavour 9 Design
All data is Copyright © Daft Media Limited. The information contained in this report may only be reproduced if the source is clearly credited.Please contact Daft.ie on 01-6795040 for further information.
Coming Next…
The Daft.ie House Price Report, Quarter 1 2007 in early AprilThe Daft.ie House Price Report will be published in early April and will include all the usual indices, snapshots, trends and rental yield analysis, providing the public with Ireland’s most up-to-date information on the housing market.