The Current and Future State of Solar - RESNET · SolarCity Confidential Slide 2 Solar Trends and...
35
The Current and Future State of Solar Walter Cuculic SolarCity - National Sales Manager Builder Program
Transcript of The Current and Future State of Solar - RESNET · SolarCity Confidential Slide 2 Solar Trends and...

The Current and Future State of Solar
Walter Cuculic
SolarCity - National Sales Manager Builder Program

SolarCity Confidential Slide 2
Solar Trends and Market Overview and Trends
Residential Markets
3rd Party Ownership
Which builders are using solar and why?
What differentiate Solar Integrators
SolarCity – Who are we?
Agenda

SolarCity Confidential Slide 3
There are nearly 143,000 solar workers in the U.S., a 13.2
percent increase over employment totals in 2011
In 2013 a new solar project was installed every 4 mins
The U.S. installed 930 megawatts (MW) of photovoltaics (PV)
in Q3 2013, up 20 percent over Q2 2013 and 35 percent over
Q3 2012. Equal to about 130,000 homes.
This represents the second largest quarter in the history of the
U.S. solar market and the largest quarter ever for residential
PV installations.
Solar trends – US PV Installations

SolarCity Confidential Slide 4
The solar industry has grown 50% year over year

SolarCity Confidential Slide 5
In 2013 the US likely for the first time in more than 15 years
installed more solar capacity than world leader Germany.
Solar trends – US PV Installations

SolarCity Confidential Slide 6
While the utility solar sector represented more than half of new
PV capacity installed, the residential market showed significant
growth and posted the segment’s largest quarter in history with
186 MW installed.
Blended average PV system prices fell 4.2% in Q3 2013
compared to the previous quarter, reaching a new low of
$3.00/W (utility, commercial and residential)
We forecast that the U.S. will have installed a total of 4.3 GW
of new PV in 2013, up 27% over 2012. Approximately 10 GW
total installed capacity.
Solar trends – US PV Installations

SolarCity Confidential Slide 7
The residential market continues to see the most rapid growth
of any segment in the U.S. solar market.
Through Q3, residential PV installations were up 45% year-
over-year and we anticipate further expansion to 52% by the
end of Q4.
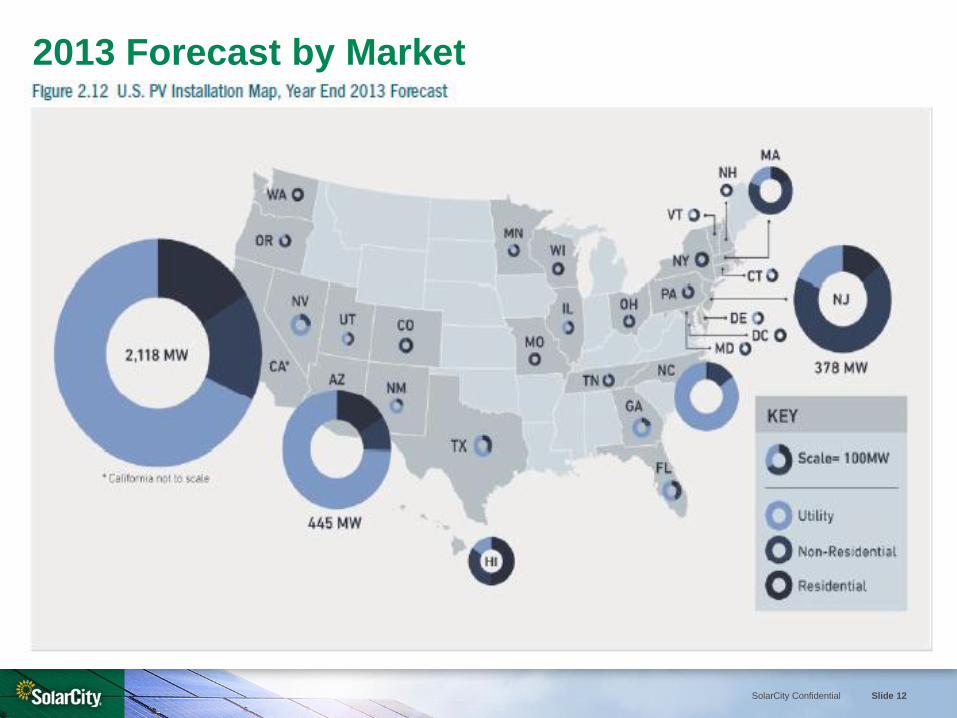
The economics of residential solar are highly attractive in a
number of states today (most notably California, Hawaii, and
Arizona), but the Northeast (MA, CT, NY) and Mid-Atlantic (NJ,
MD, DE) markets also provide good economics.
Solar trends – US PV Installations

SolarCity Confidential Slide 8
After a slight downturn in Q2 2013, the residential market
resumed its steady incremental quarterly growth in Q3.
Nearly 31,000 individual residential installations were
completed in the third quarter, bringing the cumulative total in
the U.S. to 360,280.
In 2013, it is forecasted approximately 115,000 residential
installation will be completed.
20 of the 28 state markets we track grew on a quarterly basis.
Solar trends – US PV Installations…continued

SolarCity Confidential Slide 9
#1 - California installed 98.8 MW of residential PV in Q3, up
22% over last quarter and more than 50% of all residential
solar.
#2 - Arizona installed 16.9 MW of residential PV, up 11%
quarter-over-quarter, amidst uncertainty surrounding net
energy metering and a lack of new state-level incentives.
This accounted for 9% of all residential solar.
#3 – Hawaii installed 16 MW of residential PV, down 25%
from their peak mainly due to oversaturation of the grid.
Solar trends – US PV Installations…continued

SolarCity Confidential Slide 10
Solar Growth by Segment
186 MW were installed in Q3 of 2013 for residential – up 45% over 2012
SolarCity Confidential Slide 11
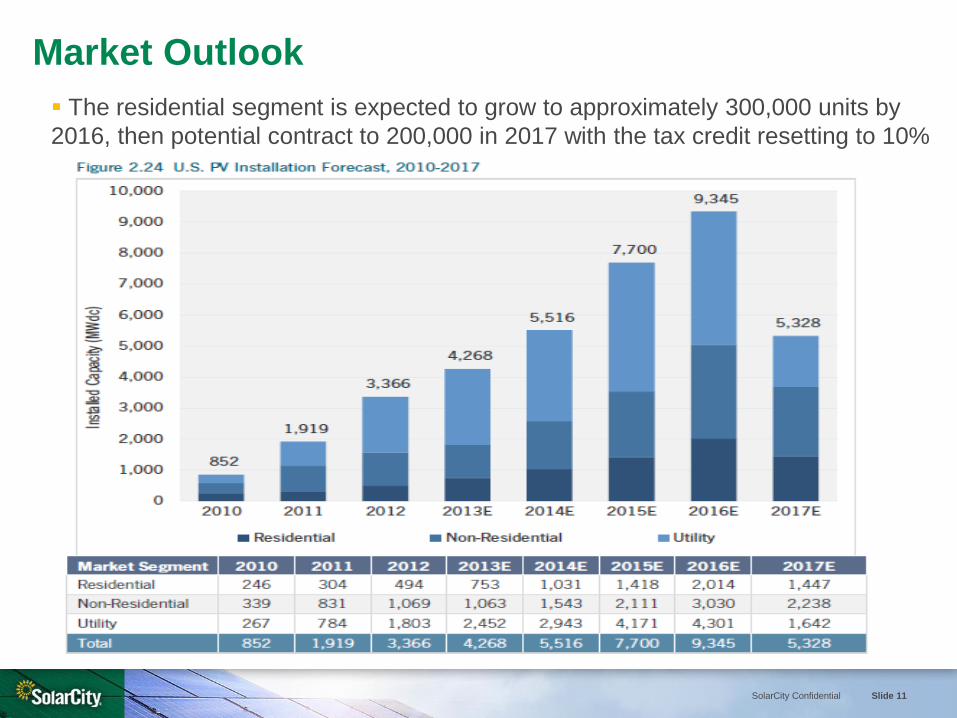
Market Outlook
The residential segment is expected to grow to approximately 300,000 units by
2016, then potential contract to 200,000 in 2017 with the tax credit resetting to 10%
SolarCity Confidential Slide 12
2013 Forecast by Market

SolarCity Confidential Slide 13
California Installation with / without incentives

SolarCity Confidential Slide 14
3rd Party Ownership by State

SolarCity Confidential Slide 15
In most markets, third-party-owned (TPO) residential PV systems continue to prove an attractive option for many homeowners.
Arizona, California, and Massachusetts saw TPO market share rebound in Q3 2013.
As the TPO residential space matures in the midst of competing financial products, there are a number of companies that have emerged as market leaders.
These companies are increasing the rate at which they deploy systems, which allows for the negotiation of better equipment supply contracts and access to lower cost of capital, which is critical as state-level incentives are threatened or face expiration in some states.
3rd Party Ownership…….continue

SolarCity Confidential Slide 16
A factor that will impact the viability of the TPO business model is the role utilities will play in the DG market.
It is possible that utilities may enter the residential PV market, offering existing customers discounts on retail rates by owning and operating residential systems themselves.
Some utilities have already invested in project finance funds created by TPO providers or have directly invested equity in these companies, but generally through the utilities’ unregulated independent power producer (IPP) arms.
Utility investment in DG provides more opportunities for market growth across the U.S. because of utilities’ access to and business relationships with existing customers.
3rd Party Ownership…….continue

SolarCity Confidential Slide 17
$0 Down Lease
• Generally available in CA, AZ, CO, HI, OR, MD, DE, DC, NJ, MA, and CT
• $0 money down - Monthly payments by homeowner
• Tax Credits and Incentives are passed through to homeowner
• Added benefit of depreciation expense
• Term usually 20 years
PrePaid Lease (20 Year)
• Typically, 50% less than cash purchase
• Tax Credits and Incentives are passed through to homeowner
• Added benefit of depreciation expense
• Term usually 20 years
Cash Purchase
• 10-30% savings
• Has become a small % of solar deployment
3rd Party Ownership…….continue
SolarCity Confidential Slide 18
Pricing
Module pricing climbed to levels of around $0.75 /W in Q3 2013 from
$0.70 / W.
From Q3 2012 to Q3 2013, residential system prices fell 9.7% percent,
from $5.22/W to $4.72/W (price to consumer).
Quarter-over-quarter, installed costs declined by 2% percent. Installed
prices came down in most major residential markets including California,
Arizona, and New Jersey.
Residential prices vary significantly from state to state, in part due to the
relative maturity of each state’s solar market.

SolarCity Confidential Slide 19
Pricing…..continued

SolarCity Confidential Slide 20
Pricing……continued

SolarCity Confidential Slide 21
US versus Germany installed pricing

SolarCity Confidential Slide 22
US versus Germany installed pricing
SolarCity Confidential Slide 23
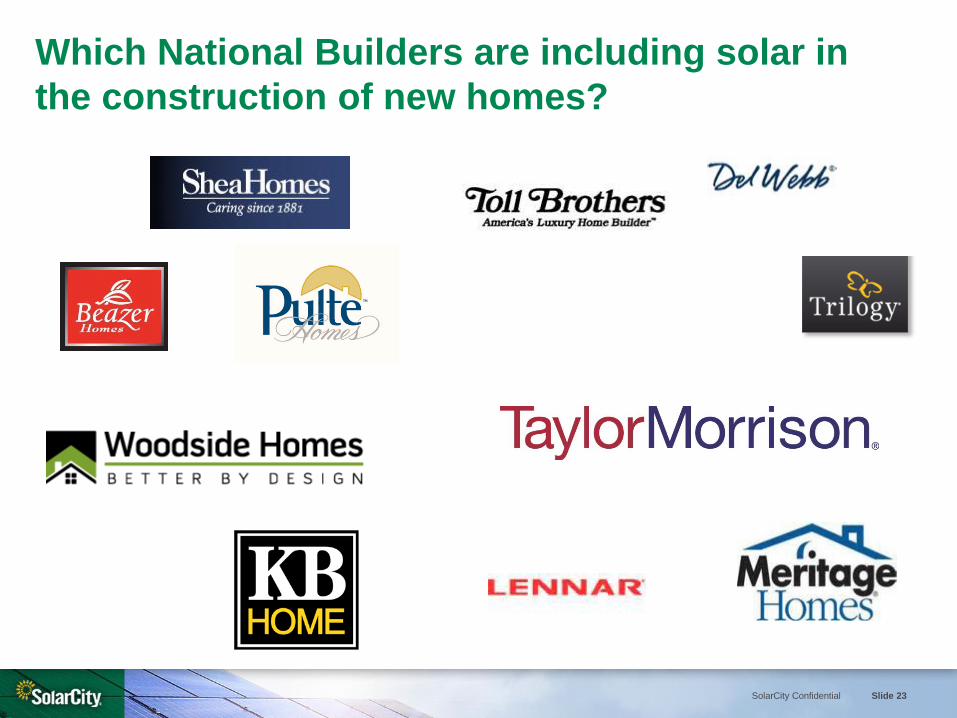
Which National Builders are including solar in
the construction of new homes?

SolarCity Confidential Slide 24
SheaXero – the “No Electric Bill” Home
- Shea Homes partnered with SolarCity last year to launch SheaXero, a net zero energy home
- In just one year, SheaXero has generated more than $10 Million in savings homeowners
- SheaXero offered in 5 states - Arizona, California, Florida, Nevada and Washington
- Have completed 2,000 SheaXero homes in less than 2 years

SolarCity Confidential Slide 25
Differentiates their communities from other builders and the existing home resale market
The retrofit market demonstrates the demand
Solar homes sell faster & for more money than comparable non-solar homes
Higher pride of home ownership and lower cost of operation
Easy to add on to existing design – no modifications to roof or electrical panel
Energy Packages make the most sense Aesthetically & Financially when you design & build them into the construction & mortgage of the home
Why is solar growing so rapidly with new home
construction?

SolarCity Confidential Slide 26
Benefits of Solar to Home Builders & Buyers
Homes sell faster with solar - Increased Volume
Solar homes sold 20% faster than the equivalent non-solar
Buyers are more interested in solar when it was-preinstalled
88% of homebuyers are looking for energy efficient features on their new home1
Homes with solar sell for higher prices – Increased Sales $$
Solar homes sold for 17% more than similar homes without solar
More satisfied customers – Increased Customer Satisfaction
Homeowners with solar typically have lower monthly energy costs which results
in higher satisfaction
1 - http://www.ilsr.org/homes-solar-sell-faster-and-more/, http://www.nrel.gov/docs/fy07osti/38304-01.pdf
2- Berkeley Labs report - An Analysis of the Effects of Residential
Photovoltaic Energy

SolarCity Confidential Slide 27
Solar Adds Value – Perception Matters
Immediate Savings
Fixed long term costs
$2.30 to $2.60 per watt
Appraisal Tools
Higher costs
Escalating Utility Bills
$12K to $17K per house

SolarCity Confidential Slide 28
Why Go Solar Now
Home solar is rapidly becoming “The New Normal” • 20-25% of all new homes in CA had solar 2013
• 10% of all new homes in AZ had solar in 2013
• Q3 2012 represents the US best solar install rate on record to date1
Solar is more affordable than ever • Financing options can make solar cost less than you pay the utility
• Adding the prepaid lease to the total home price, and the buyers
include it in their mortgage, they are immediately cash flow positive with
utility savings
1 - http://www.seia.org/research-resources/solar-industry-data

SolarCity Confidential Slide 29
Solar Installers
SolarCity installed ~ 33% of all solar systems in Q3 2013
Vivint installed ~ 8% and Verengo installed approximate 4%

SolarCity Confidential Slide 30
Product and Services
‒ Cash
‒ $0 Down Lease
‒ Full Prepaid Lease
Products
‒ Solar Thermal / Solar PV
‒ High Efficiency Panels
‒ Micro-inverter versus Single String Inverters
Sales Strategies
‒ Buying Solar vs. Buying Energy
What differentiates Solar Providers?

SolarCity Confidential Slide 31
Maintenance, Monitoring and Performance Guarantee
‒ Does Homeowner have access to monitoring?
‒ Does solar Integrator perform maintenance and monitoring?
‒ What level of customer care is provided by solar integrator?
‒ Is there a performance guarantee?
What differentiates Solar Providers?

SolarCity Confidential Slide 32
Largest National Footprint- We work where you work
Multiple Solutions to offer: Lease / Purchase
Dedicated Team of resources for our Builder Partners
One Stop Shop
Installation
Financinge,
Marketing
Sales Training
Monitoring and On-going Maintenance
Customer Service
A Value Proposition that works!
SolarCity’s Builder Program

SolarCity Confidential Slide 33
Leader in Clean Energy Services
1 in 3 Solar Homes are powered by SolarCity
Providing electricity to more than 100,000 buildings
Database of 1000+ municipalities and utilities
thousands of markets nationwide
Trusted by major national brands
Over 4,000 Employees and growing
>$3 Billion Raised in Structured Financing
+18 states, Puerto Rico and Washington DC
About SolarCity - Industry Experts
SolarCity Confidential Slide 34
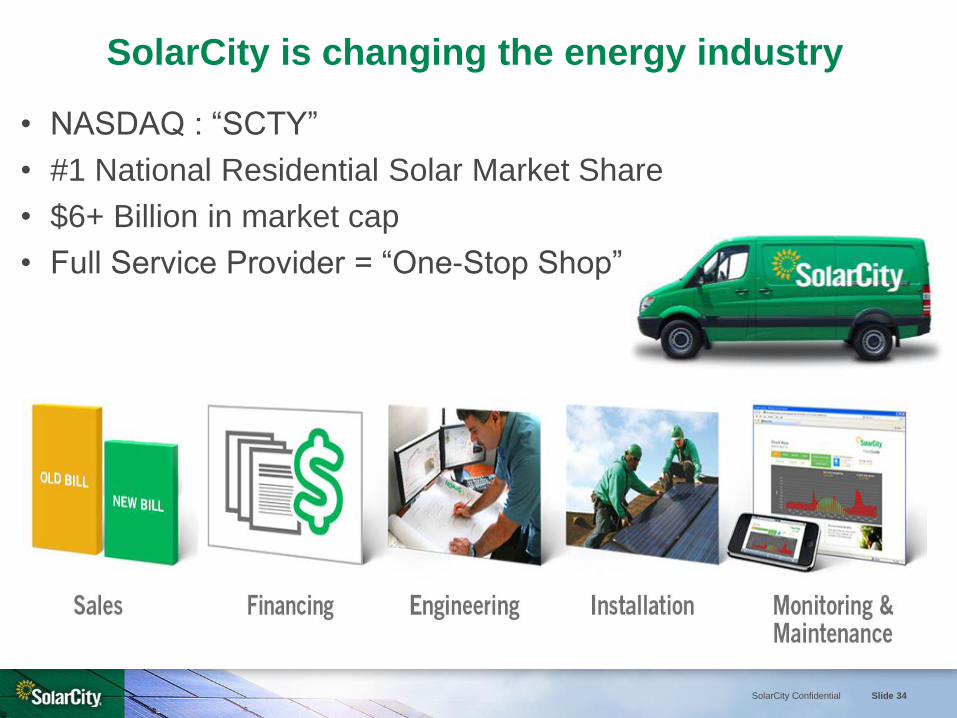
SolarCity is changing the energy industry
• NASDAQ : “SCTY”
• #1 National Residential Solar Market Share
• $6+ Billion in market cap
• Full Service Provider = “One-Stop Shop”

SolarCity Confidential Slide 35
SolarCity Locations & Regional Operations Centers Upcoming Markets: Missouri and Georgia