TEST STATISTICS FOR COMPARING TWO …issue-3/pdfs/0_BE_AN_DE_PA_.pdfQuantitative Methods Inquires 1...
14
Quantitative Methods Inquires 1 TEST STATISTICS FOR COMPARING TWO PROPORTIONS WITH PARTIALLY OVERLAPPING SAMPLES Ben DERRICK 1 PhD Candidate University of the West of England, Bristol E-mail: Anselma DOBSON-MCKITTRICK 2 University of the West of England, Bristol E-mail: Deirdre TOHER 3 PhD, Senior Lecturer University of the West of England, Bristol E-mail: Paul WHITE 4 PhD, Associate professor University of the West of England, Bristol E-mail: [email protected] Abstract Standard tests for comparing two sample proportions of a dichotomous dependent variable where there is a combination of paired and unpaired samples are considered. Four new tests are introduced and compared against standard tests and an alternative proposal by Choi and Stablein (1982). The Type I error robustness is considered for each of the test statistics. The results show that Type I error robust tests that make use of all the available data are more powerful than Type I error robust tests that do not. The Type I error robustness and the power among tests introduced in this paper using the phi correlation coefficient is comparable to that of Choi and Stablein (1982). The use of the test statistics to form confidence intervals is considered. A general recommendation of the best test statistic for practical use is made. Key words: Partially overlapping samples, Partially matched pairs, Partially correlated data, Equality of proportions 1. Introduction Tests for comparing two sample proportions of a dichotomous dependent variable with either two independent or two dependent samples are long established. Let 1 and 2 be the proportions of interest for two populations or distributions. The hypothesis being tested is 2 1 0 : H against 2 1 1 : H . However, situations arise where a data set comprises a combination of both paired and unpaired observations. In these cases, within a sample there
-
Upload
hoanghuong -
Category
Documents
-
view
215 -
download
0
Transcript of TEST STATISTICS FOR COMPARING TWO …issue-3/pdfs/0_BE_AN_DE_PA_.pdfQuantitative Methods Inquires 1...
Quantitative Methods Inquires
1
TEST STATISTICS FOR COMPARING TWO PROPORTIONS
WITH PARTIALLY OVERLAPPING SAMPLES
Ben DERRICK1
PhD Candidate
University of the West of England, Bristol
E-mail:
Anselma DOBSON-MCKITTRICK2
University of the West of England, Bristol
E-mail:
Deirdre TOHER3
PhD, Senior Lecturer
University of the West of England, Bristol
E-mail:
Paul WHITE4
PhD, Associate professor
University of the West of England, Bristol
E-mail: [email protected]
Abstract
Standard tests for comparing two sample proportions of a dichotomous dependent variable
where there is a combination of paired and unpaired samples are considered. Four new tests
are introduced and compared against standard tests and an alternative proposal by Choi and
Stablein (1982). The Type I error robustness is considered for each of the test statistics. The
results show that Type I error robust tests that make use of all the available data are more
powerful than Type I error robust tests that do not. The Type I error robustness and the power
among tests introduced in this paper using the phi correlation coefficient is comparable to that
of Choi and Stablein (1982). The use of the test statistics to form confidence intervals is
considered. A general recommendation of the best test statistic for practical use is made.
Key words: Partially overlapping samples, Partially matched pairs, Partially correlated
data, Equality of proportions
1. Introduction
Tests for comparing two sample proportions of a dichotomous dependent variable with
either two independent or two dependent samples are long established. Let 1 and 2 be the
proportions of interest for two populations or distributions. The hypothesis being tested is
210 : H against 211 : H . However, situations arise where a data set comprises a
combination of both paired and unpaired observations. In these cases, within a sample there
Quantitative Methods Inquires
2
are, say a total of ‘ 12n ’ observations from both populations, a total of ‘ 1n ’ observations only
from population one, and a total of ‘ 2n ’ observations only from population two. The hypothesis
being tested is the same as when either two complete independent samples or two complete
dependent samples are present. This situation with respect to comparing two means has been
treated poorly in the literature (Martinez-Camblor et al, 2012). This situation with respect to
comparing proportions has similarly been poorly treated.
Early literature in this area with respect to comparing proportions, refers to paired
samples studies in the presence of incomplete data (Choi and Stablein, 1982; Ekbohlm,
1982), or missing data (Bhoj, 1978). These definitions have connotations suggesting that
observations are missing only by accident. Recent literature for this scenario refers to partial-
ly matched pairs (Samawi and Vogel, 2011), however this terminology may be construed as
the pairs themselves not being directly matched. Alternatively, the situation outlined can be
referred to as part of the ‘partially overlapping samples framework’ (Martinez-Camblor et al,
2012). This terminology is more appropriate to cover scenarios where paired and independ-
ent samples may be present by accident or design. Illustrative scenarios where partially over-
lapping samples may arise by design include:
i) Where the samples are taken from two groups with some common ele-
ment. For example, in education, when comparing the pass rate for two op-
tional modules, where a student may take one or both modules.
ii) Where the samples are taken at two points in time. For example, an annual
survey of employee satisfaction will include new employees that were not
employed at time point one, employees that left after time point one and
employees that remained in employment throughout.
iii) When some natural pairing occurs. For example, a survey taken comparing
views of males and females, there may be some matched pairs ‘couples’
and some independent samples ‘single’.
Repeated measures designs can have compromised internal validity through famili-
arity (e.g. learning, memory or practise effects). Likewise, a matched design can have com-
promised internal validity through poor matching. However, if a dependent design can avoid
extraneous systematic bias, then paired designs can be advantageous when contrasted with
between subjects or independent designs. The advantages of paired designs arise by each
pair acting as its own control helping to have a fair comparison. This allows differences or
changes between the two samples to be directly examined (i.e. focusing directly on the phe-
nomenon of interest). This has the result of removing systematic effects between pairs. This
leads to increased power or a reduction in the sample size required to retain power com-
pared with the alternative independent design. Accordingly, a method of analysis for partial-
ly overlapping samples that takes into account any pairing, but does not lose the unpaired
information, would be beneficial.
Historically, when analysing partially overlapping samples, a practitioner will
choose between discarding the paired observations or discarding the independent observa-
tions and proceeding to perform the corresponding ‘standard’ test. It is likely the decision
will be based on the sample sizes of the independent and paired observations. Existing
‘standard’ approaches include:
Option 1: Discarding all paired observations and performing Pearson’s Chi square
test of association on the unpaired data.
Quantitative Methods Inquires
3
Option 2: Discarding all unpaired observations and performing McNemar’s test on
the paired data.
Option 3: Combining p-values of independent tests for paired and unpaired data.
This can be done by applying Fisher’s inverse Chi square method or Tippett’s test. These
approaches make use of all of the available data. These techniques were considered by Sa-
mawi and Vogel (2011) and are shown to be more powerful than techniques that discard
data. However, it should be noted that the authors did not consider Type I error rates.
Other ad-hoc approaches for using all available data include randomly pairing any
unpaired observations, or treating all observations as unpaired ignoring any pairing. These
ad-hoc approaches are clearly incorrect practice and further emphasise the need for re-
search into statistically valid approaches.
Choi and Stablein (1982) performed a small simulation study to consider standard
approaches and ultimately recommended an alternative test making use of all the available
data as the best practical approach. This alternative proposal uses one combined test statistic
weighting the variance of the paired and independent samples, see Section 3.2 for defini-
tion. The authors additionally considered an approach using maximum likelihood estimators
for the proportions. This approach was found to be of little practical benefit in terms of Type I
error rate or power. Others have also considered maximum likelihood approaches. For ex-
ample Thomson (1995) considered a similar procedure, using maximum likelihood estima-
tors, and found the proposed procedure to perform similarly to that of Choi and Stablein
(1982). It was noted by Choi and Stablein (1982) that given the additional computation, the
maximum likelihood solution would not be a practical solution.
Tang and Tang (2004) proposed a test procedure which is a direct adaption of the
best practical approach proposed by Choi and Stablein (1982). This adaption is found to be
not Type I error robust in scenarios considered when 1n + 2n + 122n = 20. The test pro-
posed by Choi and Stablein (1982) is found to be Type I error robust in this scenario. The
literature reviewed suggests that a solution to the partially overlapping samples case will
have to outperform the best practical solution by Choi and Stablein (1982). Tang and Tang
(2004, p.81) concluded that, ‘there may exist other test statistics which give better asymptotic
or unconditional exact performance’.
In this paper, we introduce four test statistics for comparing the difference between
two proportions with partially overlapping samples. These test statistics are formed so that
no observations are discarded. The statistics represent the overall difference in proportions,
divided by the combined standard error for the difference.
This paper will explore test statistics for testing 0H , in the presence of partially
overlapping samples. In Section 2, existing ‘standard’ approaches and variants of are de-
fined. In Section 3, our alternative proposals making use of all the available data are then
introduced, followed by the most practical proposal of Choi and Stablein (1982).
In Section 4, a worked example applying all of the test statistics is given, followed
by the simulation design in Section 5.
In Section 6.1, for all of the test statistics, the Type I error robustness is assessed
when 0H is true. This is measured using Bradley’s (1978) liberal criteria. This criteria states
that the Type I error rate should be between nominal 0.5 nominal .
There is no standard criteria for quantifying when a statistical test can be deemed
powerful. The objective is to maximise the power of the test subject to preserving the Type I
Quantitative Methods Inquires
4
error rate nominal . If Type I error rates are not equal it is not possible to correctly compare
the power of tests. The preferred test where Type I error rates are not equal should be the
one with the Type I error rate closest to nominal (Penfield 1994). In Section 6.2, power will be
considered under 1H for the test statistics that meet Bradley’s liberal criteria.
There is frequently too much focus on hypothesis testing. Confidence intervals may
be of more practical interest (Gardner and Altman 1986). Confidence intervals allow insight
into the estimation of a difference and the precision of the estimate. In Section 6.3, the cov-
erage of the true difference under 1H within 95% confidence intervals is considered. This is
considered only for the most powerful test statistics that are Type I error robust.
2. Definition of standard test statistics
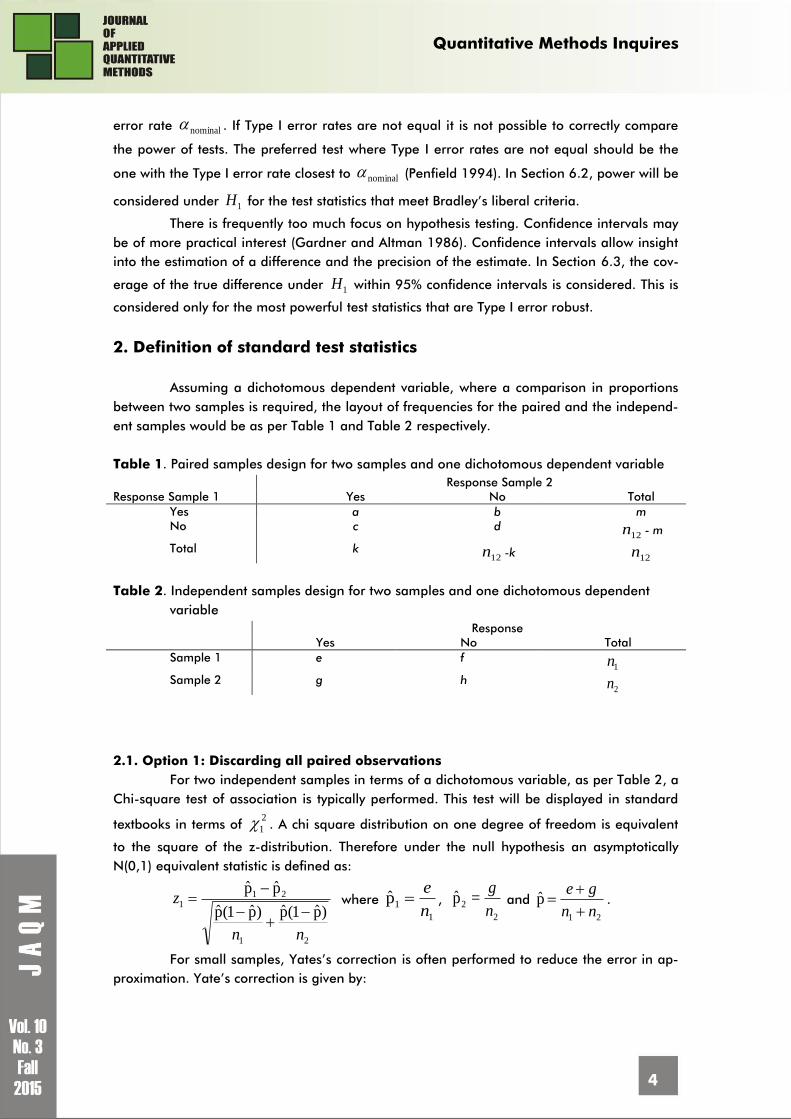
Assuming a dichotomous dependent variable, where a comparison in proportions
between two samples is required, the layout of frequencies for the paired and the independ-
ent samples would be as per Table 1 and Table 2 respectively.
Table 1. Paired samples design for two samples and one dichotomous dependent variable
Response Sample 1
Response Sample 2
Yes No Total
Yes a b m
No c d
12n - m
Total k
12n -k 12n
Table 2. Independent samples design for two samples and one dichotomous dependent
variable
Response
Yes No Total
Sample 1 e f
1n
Sample 2 g h
2n
2.1. Option 1: Discarding all paired observations
For two independent samples in terms of a dichotomous variable, as per Table 2, a
Chi-square test of association is typically performed. This test will be displayed in standard
textbooks in terms of 2
1 . A chi square distribution on one degree of freedom is equivalent
to the square of the z-distribution. Therefore under the null hypothesis an asymptotically
N(0,1) equivalent statistic is defined as:
21
211
)p̂1(p̂)p̂1(p̂
p̂p̂
nn
z
where
1
1p̂n
e ,
2
2 =p̂n
g and
21
p̂nn
ge
.
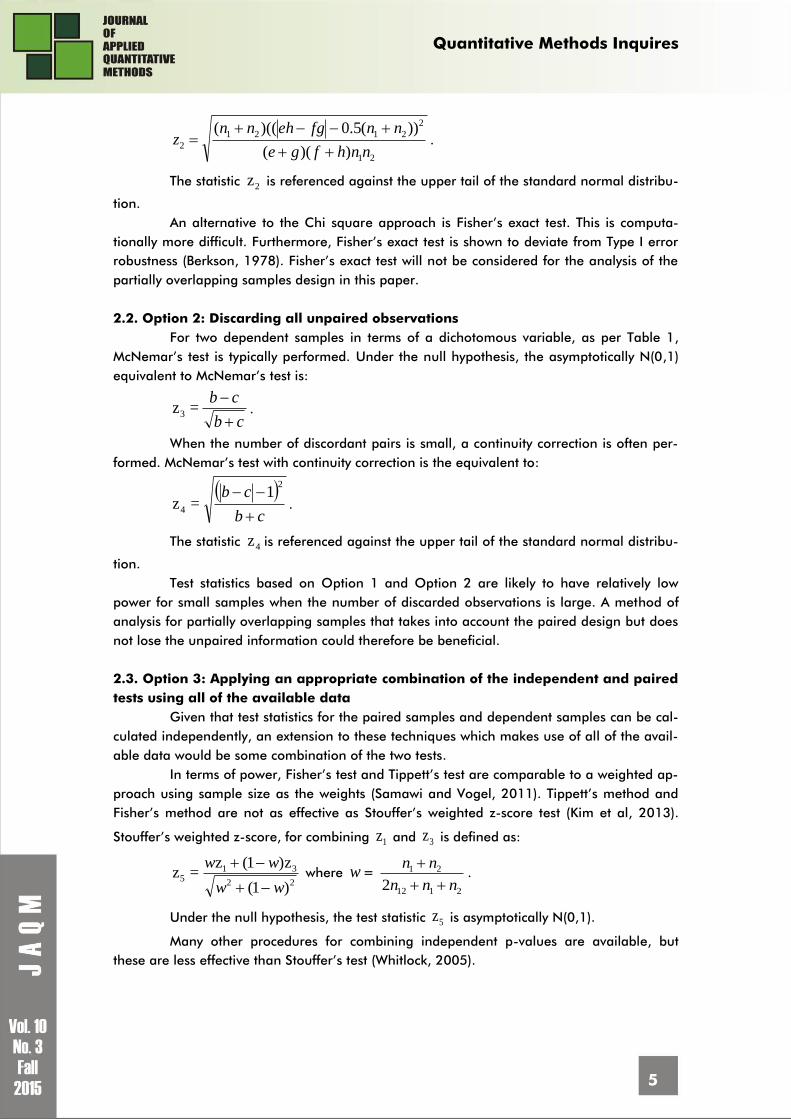
For small samples, Yates’s correction is often performed to reduce the error in ap-
proximation. Yate’s correction is given by:
Quantitative Methods Inquires
5
21
2
2121
2))((
))(5.0)(((
nnhfge
nnfgehnnz
.
The statistic 2z is referenced against the upper tail of the standard normal distribu-
tion.
An alternative to the Chi square approach is Fisher’s exact test. This is computa-
tionally more difficult. Furthermore, Fisher’s exact test is shown to deviate from Type I error
robustness (Berkson, 1978). Fisher’s exact test will not be considered for the analysis of the
partially overlapping samples design in this paper.
2.2. Option 2: Discarding all unpaired observations
For two dependent samples in terms of a dichotomous variable, as per Table 1,
McNemar’s test is typically performed. Under the null hypothesis, the asymptotically N(0,1)
equivalent to McNemar’s test is:
cb
cb
=z3 .
When the number of discordant pairs is small, a continuity correction is often per-
formed. McNemar’s test with continuity correction is the equivalent to:
cb
cb
2
4
1=z .
The statistic 4z is referenced against the upper tail of the standard normal distribu-
tion.
Test statistics based on Option 1 and Option 2 are likely to have relatively low
power for small samples when the number of discarded observations is large. A method of
analysis for partially overlapping samples that takes into account the paired design but does
not lose the unpaired information could therefore be beneficial.
2.3. Option 3: Applying an appropriate combination of the independent and paired
tests using all of the available data
Given that test statistics for the paired samples and dependent samples can be cal-
culated independently, an extension to these techniques which makes use of all of the avail-
able data would be some combination of the two tests.
In terms of power, Fisher’s test and Tippett’s test are comparable to a weighted ap-
proach using sample size as the weights (Samawi and Vogel, 2011). Tippett’s method and
Fisher’s method are not as effective as Stouffer’s weighted z-score test (Kim et al, 2013).
Stouffer’s weighted z-score, for combining 1z and 3z is defined as:
22
315
)1(
z)1(z=z
ww
ww
where w =
2112
21
2 nnn
nn
.
Under the null hypothesis, the test statistic 5z is asymptotically N(0,1).
Many other procedures for combining independent p-values are available, but
these are less effective than Stouffer’s test (Whitlock, 2005).
Quantitative Methods Inquires
6
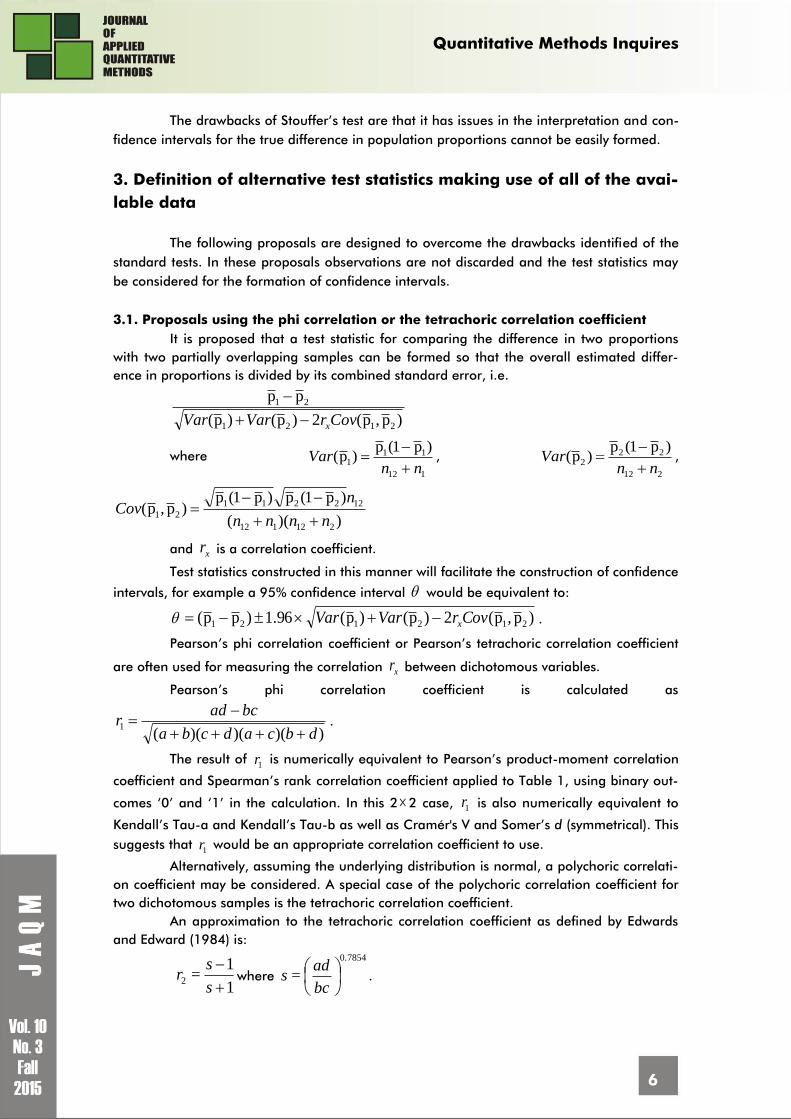
The drawbacks of Stouffer’s test are that it has issues in the interpretation and con-
fidence intervals for the true difference in population proportions cannot be easily formed.
3. Definition of alternative test statistics making use of all of the avai-
lable data
The following proposals are designed to overcome the drawbacks identified of the
standard tests. In these proposals observations are not discarded and the test statistics may
be considered for the formation of confidence intervals.
3.1. Proposals using the phi correlation or the tetrachoric correlation coefficient
It is proposed that a test statistic for comparing the difference in two proportions
with two partially overlapping samples can be formed so that the overall estimated differ-
ence in proportions is divided by its combined standard error, i.e.
)p,p(2)p()p(
pp
2121
21
CovrVarVar x
where
112
111
)p1(p)p(
nnVar
,
212
222
)p1(p)p(
nnVar
,
))((
)p1(p)p1(p)p,p(
212112
122211
21nnnn
nCov
and xr is a correlation coefficient.
Test statistics constructed in this manner will facilitate the construction of confidence
intervals, for example a 95% confidence interval would be equivalent to:
)p,p(2)p()p(96.1)pp( 212121 CovrVarVar x .
Pearson’s phi correlation coefficient or Pearson’s tetrachoric correlation coefficient
are often used for measuring the correlation xr between dichotomous variables.
Pearson’s phi correlation coefficient is calculated as
))()()((1
dbcadcba
bcadr
.
The result of 1r is numerically equivalent to Pearson’s product-moment correlation
coefficient and Spearman’s rank correlation coefficient applied to Table 1, using binary out-
comes ‘0’ and ‘1’ in the calculation. In this 22 case, 1r is also numerically equivalent to
Kendall’s Tau-a and Kendall’s Tau-b as well as Cramér's V and Somer’s d (symmetrical). This
suggests that 1r would be an appropriate correlation coefficient to use.
Alternatively, assuming the underlying distribution is normal, a polychoric correlati-
on coefficient may be considered. A special case of the polychoric correlation coefficient for
two dichotomous samples is the tetrachoric correlation coefficient.
An approximation to the tetrachoric correlation coefficient as defined by Edwards
and Edward (1984) is:
1
1=2
s
sr where
0.7854
=
bc
ads .
Quantitative Methods Inquires
7
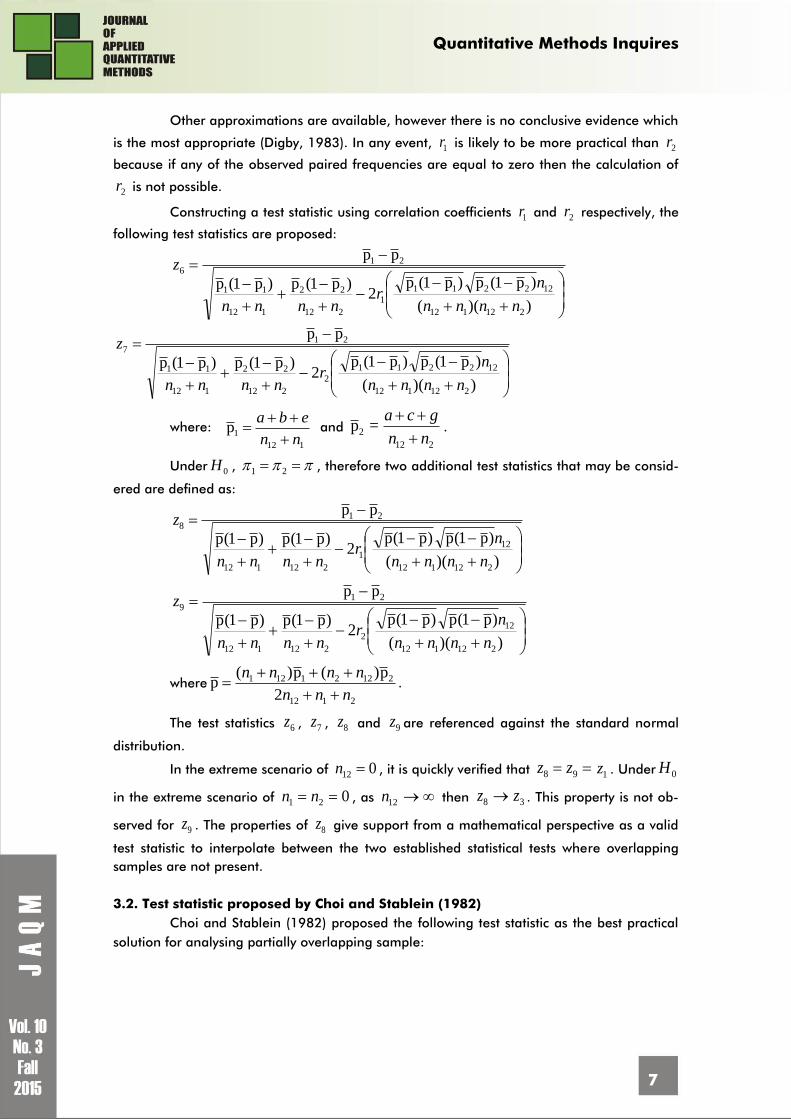
Other approximations are available, however there is no conclusive evidence which
is the most appropriate (Digby, 1983). In any event, 1r is likely to be more practical than 2r
because if any of the observed paired frequencies are equal to zero then the calculation of
2r is not possible.
Constructing a test statistic using correlation coefficients 1r and 2r respectively, the
following test statistics are proposed:
))((
)p1(p)p1(p2
)p1(p)p1(p
pp
212112
122211
1
212
22
112
11
216
nnnn
nr
nnnn
z
))((
)p1(p)p1(p2
)p1(p)p1(p
pp
212112
122211
2
212
22
112
11
217
nnnn
nr
nnnn
z
where:
112
1pnn
eba
and
212
2 =pnn
gca
.
Under 0H , 21 , therefore two additional test statistics that may be consid-
ered are defined as:
))((
)p1(p)p1(p2
)p1(p)p1(p
pp
212112
121
212112
218
nnnn
nr
nnnn
z
))((
)p1(p)p1(p2
)p1(p)p1(p
pp
212112
122
212112
219
nnnn
nr
nnnn
z
where
2112
21221121
2
p)(p)(p
nnn
nnnn
.
The test statistics 6z , 7z , 8z and 9z are referenced against the standard normal
distribution.
In the extreme scenario of 012 n , it is quickly verified that 98 zz1z . Under 0H
in the extreme scenario of 021 nn , as 12n then 38 zz . This property is not ob-
served for 9z . The properties of 8z give support from a mathematical perspective as a valid
test statistic to interpolate between the two established statistical tests where overlapping
samples are not present.
3.2. Test statistic proposed by Choi and Stablein (1982)
Choi and Stablein (1982) proposed the following test statistic as the best practical
solution for analysing partially overlapping sample:
Quantitative Methods Inquires
8
Dnnnn
z
2)1()1(
)p1(p
pp
12
2
2
2
2
2
12
2
1
1
2
1
2110
where
121
11
nn
n
,
122
22
nn
n
and
12
2
21 )p)(1)(1(
n
pD a
.
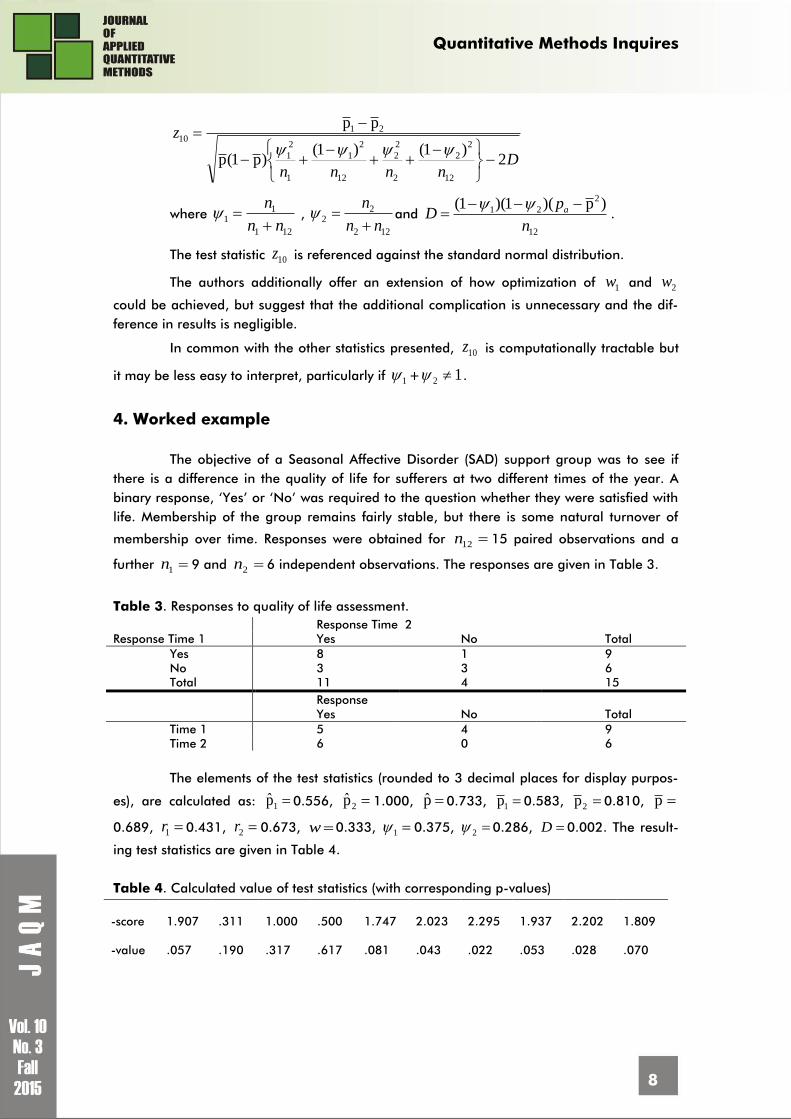
The test statistic 10z is referenced against the standard normal distribution.
The authors additionally offer an extension of how optimization of 1w and 2w
could be achieved, but suggest that the additional complication is unnecessary and the dif-
ference in results is negligible.
In common with the other statistics presented, 10z is computationally tractable but
it may be less easy to interpret, particularly if 1 + 12 .
4. Worked example
The objective of a Seasonal Affective Disorder (SAD) support group was to see if
there is a difference in the quality of life for sufferers at two different times of the year. A
binary response, ‘Yes’ or ‘No’ was required to the question whether they were satisfied with
life. Membership of the group remains fairly stable, but there is some natural turnover of
membership over time. Responses were obtained for 12n 15 paired observations and a
further 1n 9 and 2n 6 independent observations. The responses are given in Table 3.
Table 3. Responses to quality of life assessment.
Response Time 2
Response Time 1 Yes No Total
Yes 8 1 9
No 3 3 6
Total 11 4 15
Response
Yes No Total
Time 1 5 4 9
Time 2 6 0 6
The elements of the test statistics (rounded to 3 decimal places for display purpos-
es), are calculated as: 1p̂ 0.556, 2p̂ 1.000, p̂ 0.733, 1p 0.583, 2p 0.810, p
0.689, 1r 0.431, 2r 0.673, w 0.333, 1 0.375, 2 0.286, D 0.002. The result-
ing test statistics are given in Table 4.
Table 4. Calculated value of test statistics (with corresponding p-values)
z
-score
-
1.907
1
.311
-
1.000
0
.500
-
1.747
-
2.023
-
2.295
-
1.937
-
2.202
-
1.809
p
-value
0
.057
0
.190
0
.317
0
.617
0
.081
0
.043
0
.022
0
.053
0
.028
0
.070
Quantitative Methods Inquires
9
At the 5% significance level, whether 0H is rejected depends on the test per-
formed. It is of note that the significant differences arise only with tests introduced in this
paper, 6z , 7z and 9z .
Although the statistical conclusions differ for this particular example, the numeric
difference between many of the tests is small. To consider further the situations where differ-
ences between the test statistics might arise, simulations are performed.
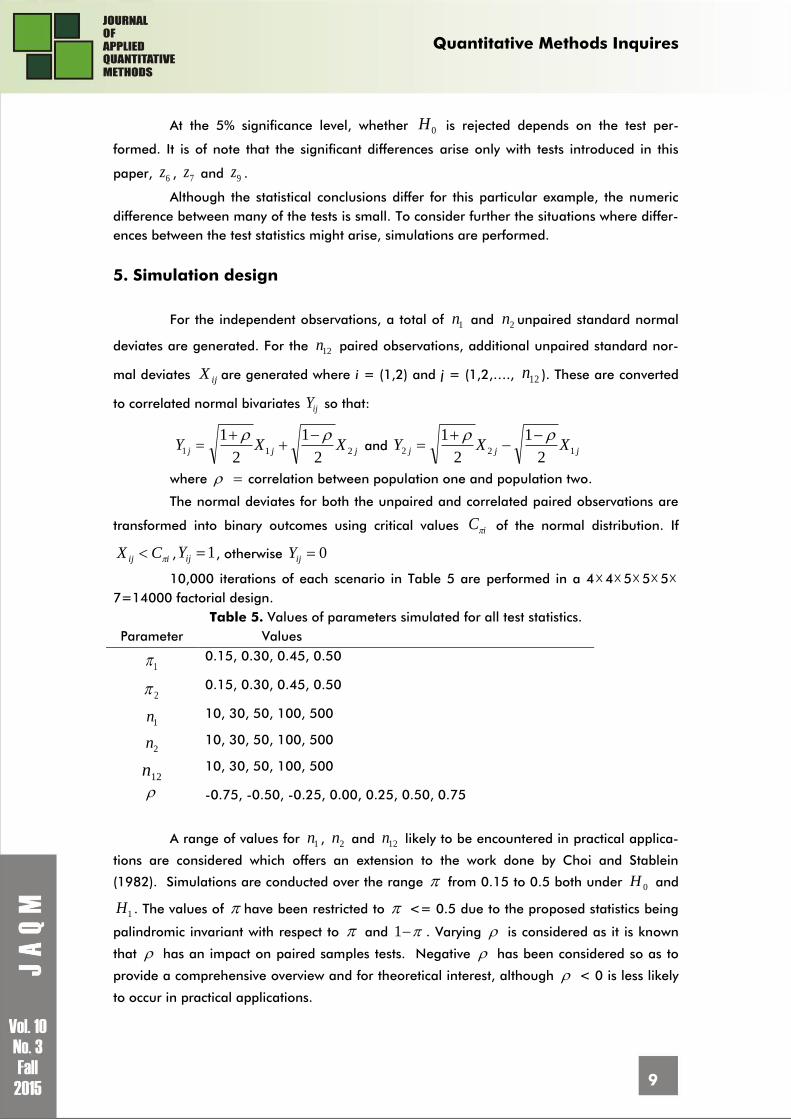
5. Simulation design
For the independent observations, a total of 1n and 2n unpaired standard normal
deviates are generated. For the 12n paired observations, additional unpaired standard nor-
mal deviates ijX are generated where i = (1,2) and j = (1,2,…., 12n ). These are converted
to correlated normal bivariates ijY so that:
jY1 jj XX 212
1
2
1
and jY2 jj XX 12
2
1
2
1
where correlation between population one and population two.
The normal deviates for both the unpaired and correlated paired observations are
transformed into binary outcomes using critical values iC of the normal distribution. If
iij CX , 1ijY , otherwise 0ijY
10,000 iterations of each scenario in Table 5 are performed in a 445557=14000 factorial design.
Table 5. Values of parameters simulated for all test statistics.
Parameter Values
1 0.15, 0.30, 0.45, 0.50
2 0.15, 0.30, 0.45, 0.50
1n 10, 30, 50, 100, 500
2n 10, 30, 50, 100, 500
12n 10, 30, 50, 100, 500
-0.75, -0.50, -0.25, 0.00, 0.25, 0.50, 0.75
A range of values for 1n , 2n and 12n likely to be encountered in practical applica-
tions are considered which offers an extension to the work done by Choi and Stablein
(1982). Simulations are conducted over the range from 0.15 to 0.5 both under 0H and
1H . The values of have been restricted to <= 0.5 due to the proposed statistics being
palindromic invariant with respect to and 1 . Varying is considered as it is known
that has an impact on paired samples tests. Negative has been considered so as to
provide a comprehensive overview and for theoretical interest, although < 0 is less likely
to occur in practical applications.
Quantitative Methods Inquires
10
Two sided tests with nominal 0.05 is used in this study. For each combination of
10,000 iterations, the percentage of p-values below 0.05 is calculated to give the Type I
error rate . The Type I error rate under 0H , for each combination considered in the simu-
lation design, should be between 0.025 and 0.075 to meet Bradley’s liberal criteria and to
be Type I error robust.
All simulations are performed in R.
6. Simulation Results
A comprehensive set of results with varying independent and paired sample sizes,
correlation, and proportions was obtained as outlined in Section 5.
6.1. Type I error rates
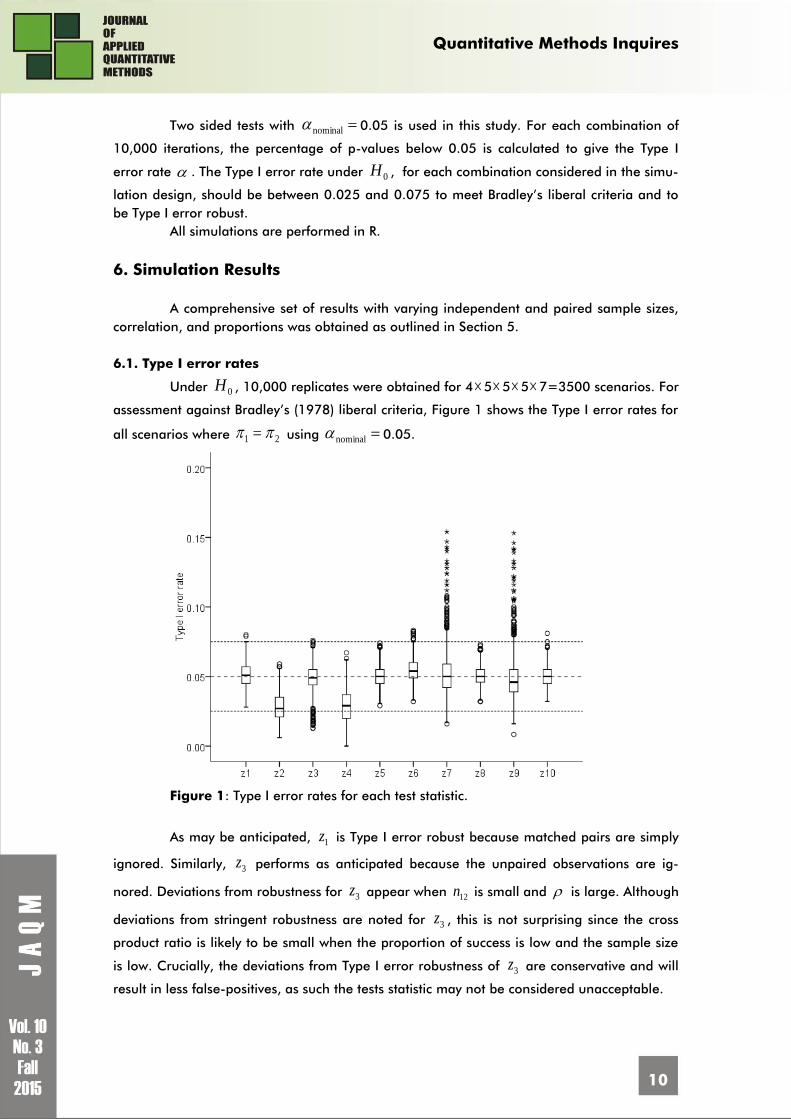
Under 0H , 10,000 replicates were obtained for 45557=3500 scenarios. For
assessment against Bradley’s (1978) liberal criteria, Figure 1 shows the Type I error rates for
all scenarios where 1 2 using nominal 0.05.
Figure 1: Type I error rates for each test statistic.
As may be anticipated, 1z is Type I error robust because matched pairs are simply
ignored. Similarly, 3z performs as anticipated because the unpaired observations are ig-
nored. Deviations from robustness for 3z appear when 12n is small and is large. Although
deviations from stringent robustness are noted for 3z , this is not surprising since the cross
product ratio is likely to be small when the proportion of success is low and the sample size
is low. Crucially, the deviations from Type I error robustness of 3z are conservative and will
result in less false-positives, as such the tests statistic may not be considered unacceptable.
Quantitative Methods Inquires
11
The corrected statistics, 2z and 4z , generally give Type I error rates below the nom-
inal alpha, particularly with small sample sizes. Ury and Fleiss (1980) found that 1z is Type I
error robust even with small samples, however applying Yate’s correction is not Type I error
robust and gives Type I error rates less than the nominal alpha. It is therefore concluded that
2z and 4z do not provide a Type I error robust solution.
The statistics using the phi correlation coefficient, 6z and 8z , are generally liberal
robust. For 6z there is some deviation from the nominal Type I error rate. The deviations
occur when min{ 1n , 2n , 12n } is small, max{ 1n , 2n , 12n } min{ 1n , 2n , 12n } is large and 0 .
In these scenarios the effect of this is that 6z is not liberal robust and results in a high likeli-
hood of false-positives. It is therefore concluded that 6z does not universally provide a Type I
error robust solution to the partially overlapping samples situation.
The statistics using the tetrachoric correlation coefficient, 7z and 9z , have more
variability in Type I errors than the statistics that use the phi correlation coefficient. The sta-
tistics using the tetrachoric correlation coefficient inflate the Type I error when 25.0 and
12n is large. When min{ 1n , 2n , 12n } is small the test statistic is conservative. A test statistic that
performs consistently would be favoured for practical use. It is therefore concluded that 7z
and 9z do not provide a Type I error robust solution to the partially overlapping samples
situation.
Three statistics making use of all of the available data, 5z , 8z and 10z , demon-
strate liberal robustness across all scenarios. Analysis of Type I error rates show near identi-
cal boxplots to Figure 1 when each of the parameters are considered separately. This means
these statistics are Type I error robust across all combinations of sample sizes and correlation
considered.
6.2. Power
The test statistics 2z , 4z , 6z , 7z and 9z are not Type I error robust. Therefore only
1z , 3z , 5z , 8z and 10z are considered for their power properties (where 1H is true). Table 6
summarises the power properties where 1 0.5.
Table 6. Power averaged over all sample sizes.
1 2
1z 3z 5z 8z 10z
0.5 0.45
0
0.095
0.173 0.208 0.221 0.221
0 0.133 0.168 0.186 0.186
0 0.112 0.150 0.166 0.166
0.5 0.3
0
0.509
0.653 0.807 0.856 0.855
0 0.569 0.772 0.828 0.827
0 0.508 0.746 0.801 0.801
0.5 0.15
0
0.843
0.874 0.975 0.989 0.989
0 0.834 0.970 0.985 0.986
0 0.795 0.966 0.980 0.982
Quantitative Methods Inquires
12
For each of the test statistics, as the correlation increases from -0.75 through to
0.75 the power of the tests increase. Similarly, as sample sizes increase the power of the test
increases.
Clearly, 5z is more powerful than the other standard tests 1z and 3z , but it is not
as powerful as the alternative methods that make use of all the available data.
The power of 8z and 10z are comparable. Separate comparisons of 8z and 10z in-
dicates that the two statistics are comparable across the factorial combinations in the simula-
tion design. Either test statistic could reasonably be used for hypothesis testing in the partial-
ly overlapping samples case.
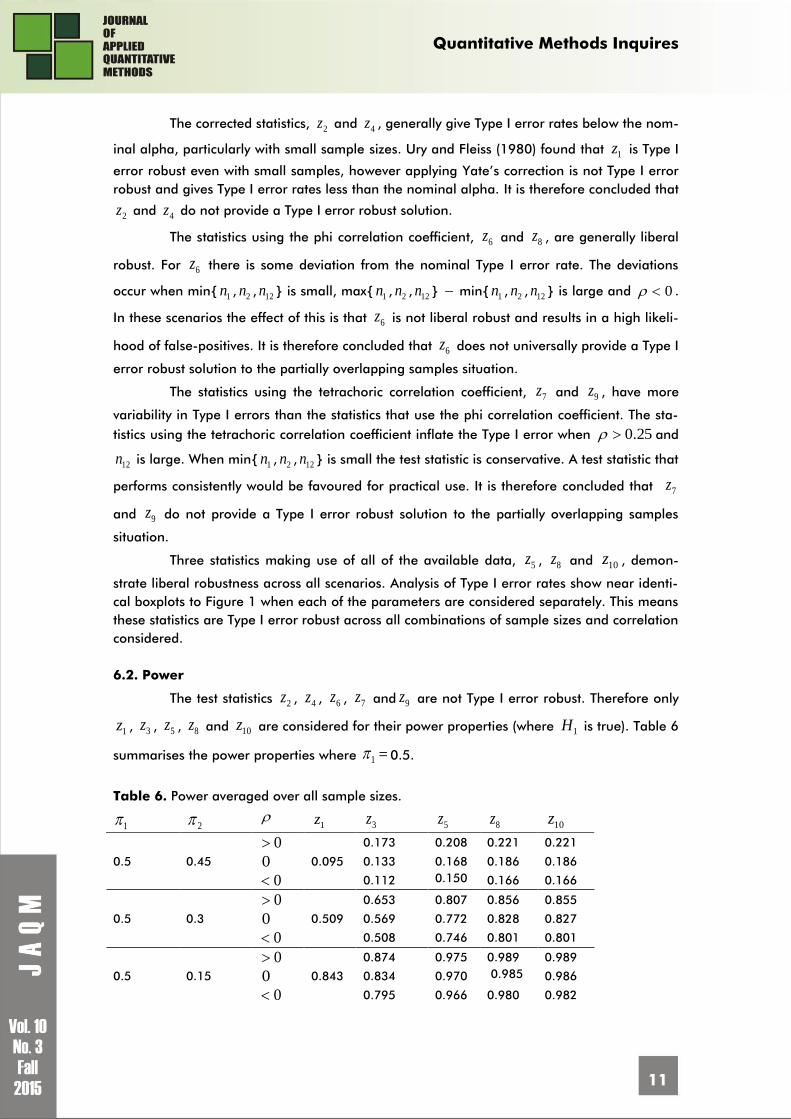
6.3. Confidence interval coverage
For 8z and 10z , the coverage of the true difference of population proportions with-
in 95% confidence intervals has been calculated as per the simulation design in Table 5
where 1 2 . The results are summarised in Figure 2.
Figure 2: Percentage of iterations where the true difference is within the confidence interval.
Both 8z and 10z demonstrate reasonable coverage of the true population differ-
ence 21 . However, Figure 2 shows that 8z more frequently performs closer to the de-
sired 95% success rate. Taking this result into account, when the objective is to form a confi-
dence interval, 8z is recommended as the test statistic of choice in the partially overlapping
samples case.
Quantitative Methods Inquires
13
7. Conclusion
Partially overlapping samples may occur by accident or design. Standard approach-
es for analysing the difference in proportions for a dichotomous variable with partially over-
lapping samples often discard some available data. If there is a large paired sample or a
large unpaired sample, it may be reasonable in a practical environment to use the corre-
sponding standard test. For small samples, the test statistics which discard data have inferior
power properties to tests statistics that make use of all the available data. These standard
approaches and other ad-hoc approaches identified in this paper are less than desirable.
Combining the paired and independent samples z-scores using Stouffer’s method is
a more powerful standard approach, but leads to complications in interpretation, and does
not readily extend to the creation of confidence intervals for differences in proportions. The
tests introduced in this paper, as well as the test outlined by Choi and Stablein (1982) are
more powerful than the test statistics in ‘standard’ use.
The alternative tests introduced in this paper, 6z , 7z , 8z and 9z , overcome the in-
terpretation barrier, in addition confidence intervals can readily be formed.
Tests introduced using the phi correlation coefficient, 6z and 8z , are more robust
than the equivalent tests introduced using the tetrachoric correlation coefficient, 7z and 9z .
The most powerful tests that are Type I error robust are 8z and 10z . The empirical
evidence suggests that 8z is better suited for forming confidence intervals for the true popu-
lation difference than 10z . Additionally, 8z has relative simplicity in calculation, strong
mathematical properties and provides ease of interpretation. In conclusion, 8z is recom-
mended as the best practical solution to the partially overlapping samples framework when
comparing two proportions.
References
1. Berkson J. In dispraise of the exact test, Journal of Statistic Planning and Inference. 2,
1978, pp. 27–42.
2. Bhoj D. Testing equality of means of correlated variates with missing observations
on both responses, Biometrika. 1978; 65:225-228.
3. Bradley JV. Robustness? British Journal of Mathematical and Statistical Psychology. 31(2),
1978, pp.144-152.
4. Choi SC, Stablein DM. Practical tests for comparing two proportions with incomplete data.
Applied Statistics. 1982; 31:256-262.
5. Digby PG. Approximating the tetrachoric correlation coefficient. Biometrics. 1983;
pp. 753-757.
6. Edwards JH, Edwards AWF, Approximating the tetrachoric correlation coefficient.
Biometrics. 40(2), 1984, 563.
7. Ekbohm G., On testing the equality of proportions in the paired case with incom-
plete data. Psychometrika. 47(1), 1982, pp. 115-118.
8. Gardner MJ, Altman DG, Confidence intervals rather than p values: estimation ra-
ther than hypothesis testing. BMJ.292(6522), 1986, pp. 746-750.
Quantitative Methods Inquires
14
9. Kim SC, Lee SJ, Lee WJ, Yum YN, Kim JH, Sohn S, Park JH, Jeongmi L, Johan Lim, Kwon
SW., Stouffer’s test in a large scale simultaneous hypothesis testing.
Plos one. 8(5):e63290, 2013
10. Martinez-Camblor P, Corral N, De la Hera JM., Hypothesis test for paired samples in
the presence of missing data. Journal of Applied Statistics. 40(1), 2012, pp.
76-87.
11. Penfield DA. Choosing a two-sample location test. Journal of Experimental Education.
62(4), 1994, 343-360.
12. R Core Team, R: A language and environment for statistical computing. R Founda-
tion for Statistical Computing, Vienna, Austria. www.R-project.org. 2014; ver-
sion 3.1.2.
13. Samawi HM, Vogel R., Tests of homogeneity for partially matched-pairs data. Sta-
tistical Methodology. 8(3), 2011, pp. 304-313.
14. Tang ML, Tang NS., Exact tests for comparing two paired proportions with incom-
plete data. Biometrical Journal. 46(1), 2004, pp. 72-82.
15. Thomson PC., A hybrid paired and unpaired analysis for the comparison of pro-
portions. Statistics in Medicine. 14, 1995, pp. 1463-1470.
16. Ury HK, Fleiss JL., On approximate sample sizes for comparing two independent
proportions with the use of Yates' correction. Biometrics. 1980, pp. 347-
351.
17. Whitlock MC., Combining probability from independent tests: the weighted z-
method is superior to Fisher's approach. Journal of Evolutionary Biology.
18(5), 2005, pp. 1368-1373.
1 Ben holds a first class honours degree in accounting and statistics and completed his masters in biometry with
distinction at the University of Reading. He has previously worked in clinical research, business management
information, training, and quality control. Ben is a full-time lecturer at the University of the West of England, Bristol
with a teaching portfolio in statistical modelling, times series analysis, and in applications in the business sciences.
He is undertaking doctoral work on the analysis of partially overlapping samples and is an active member of the
consultancies arranged through the Applied Statistics group.
2 Anselma has graduated from the University of the West of England, 2015, with first class honours in mathematics
and statistics and was a recipient of the IMA (Institute of Mathematics and Its Applications) student prize. She op-
tionally completed a full-year sandwich placement at the Office for National Statistics, where she worked collabora-
tively in methodological research most notably publishing papers in support of the Johnson Review of Consumer
Price Indices
3 Dr Deirdre Toher holds at PhD in applied statistics from Trinity College Dublin and is a senior lecturer in statistics
at the University of the West of England. Deirdre is an active member of the Applied Statistics group working collab-
oratively in a wide range of diverse multi-disciplinary teams such as in disease profiling using high dimensional
sensor data, providing methodological support to medical researchers, design and analysis of large scale national
surveys, and the analysis of complex data such as experimental interventions in domestic water consumption. Deir-
dre is a Fellow of the Higher Education Academy, a fellow of the Royal Statistical Society (RSS), a Statistical Ambas-
sador for the RSS, and trainer for the RSS Science Journalism Programme.
4 Paul holds a PhD in pure and applied statistics. He is an associate professor in applied statistics and is the acade-
mic lead for the Applied Statistics Group at the University of the West of England. He has a wide range of under-
graduate and postgraduate teaching across the University as well as providing PhD supervisory support in quantita-
tive investigations. He has worked on over 100 projects in economics, psychology, health, and the bio- and medical
sciences, as well as being a member of research ethics committees, data monitoring committees, and reviewer of
grant applications.