Comparing Systems Using Sample Data - Computer …hzhang/courses/7290/Lectures/10 -...
52
Comparing Systems Using Sample Data Hongwei Zhang Performance Evaluation: Hongwei Zhang http://www.cs.wayne.edu/~hzhang Acknowledgement: this lecture is partially based on the slides of Dr. Raj Jain. Statistics are like alienists --- they will testify for both side. --- Fiorello La Guardia
Transcript of Comparing Systems Using Sample Data - Computer …hzhang/courses/7290/Lectures/10 -...
Comparing Systems Using Sample Data
Hongwei Zhang
Performance Evaluation:
Hongwei Zhang
http://www.cs.wayne.edu/~hzhang
Acknowledgement: this lecture is partially based on the slides of Dr. Raj Jain.
Statistics are like alienists --- they will testify for both side.
--- Fiorello La Guardia
Outline
� Sample vs. Population
� Confidence Interval for The Mean
� Application & variations of CI
� Testing for a zero mean� Testing for a zero mean
� Comparing two alternatives
� One Sided Confidence Intervals
� Confidence Intervals for Proportions
� What confidence level to use
� Hypothesis testing vs. confidence interval
� Sample Size
Sample
� Old French word `essample‘
=> `sample' and `example'
A sample is only an example!A sample is only an example!
� One example ≠ theory
One sample ≠ Definite statement
Sample vs. population
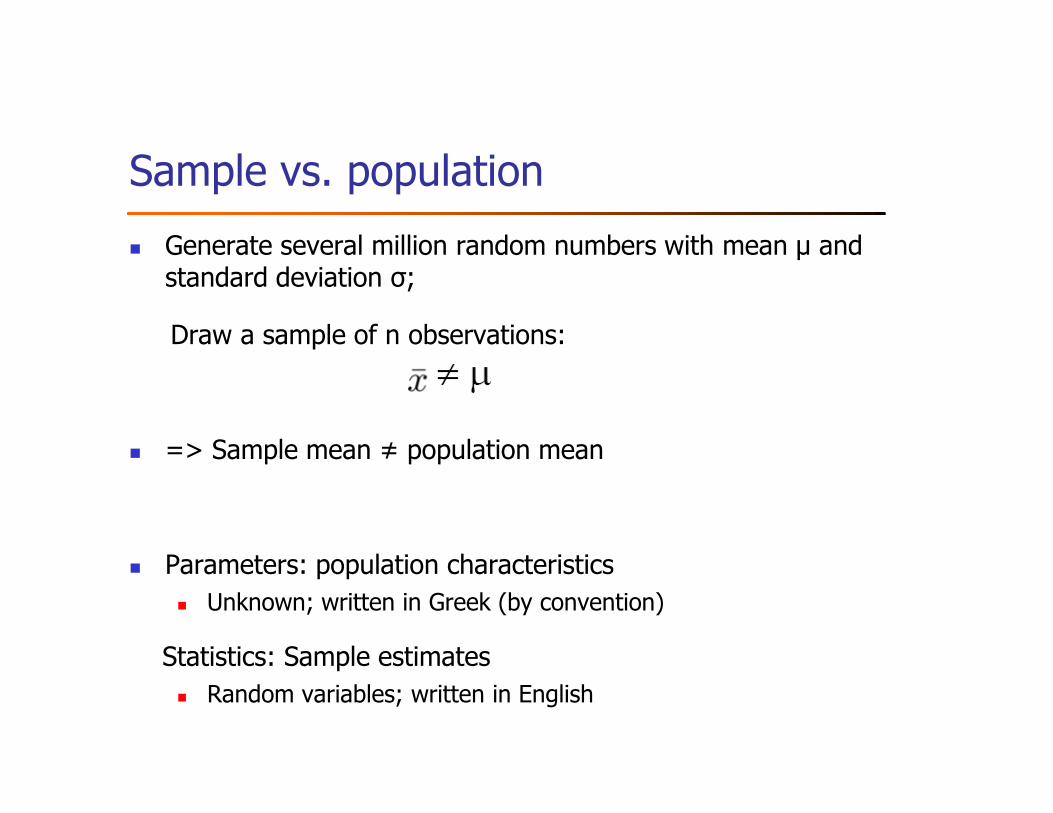
� Generate several million random numbers with mean µ and standard deviation σ;
Draw a sample of n observations:
� => Sample mean ≠ population mean
� Parameters: population characteristics
� Unknown; written in Greek (by convention)
Statistics: Sample estimates
� Random variables; written in English
Outline
� Sample vs. Population
� Confidence Interval for The Mean
� Application & variations of CI
� Testing for a zero mean� Testing for a zero mean
� Comparing two alternatives
� One Sided Confidence Intervals
� Confidence Intervals for Proportions
� What confidence level to use
� Hypothesis testing vs. confidence interval
� Sample Size
Confidence interval for µ
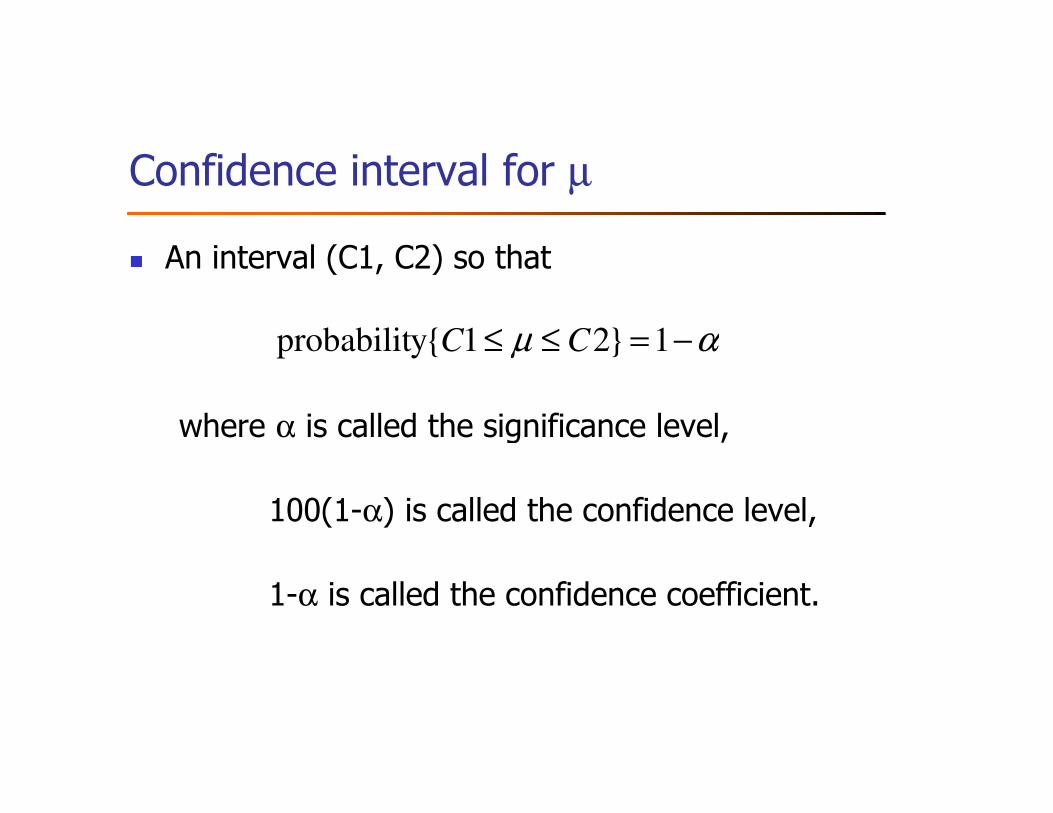
� An interval (C1, C2) so that
where α is called the significance level,
αµ −=≤≤ 1}21{yprobabilit CC
where α is called the significance level,
100(1-α) is called the confidence level,
1-α is called the confidence coefficient.
Determining confidence interval
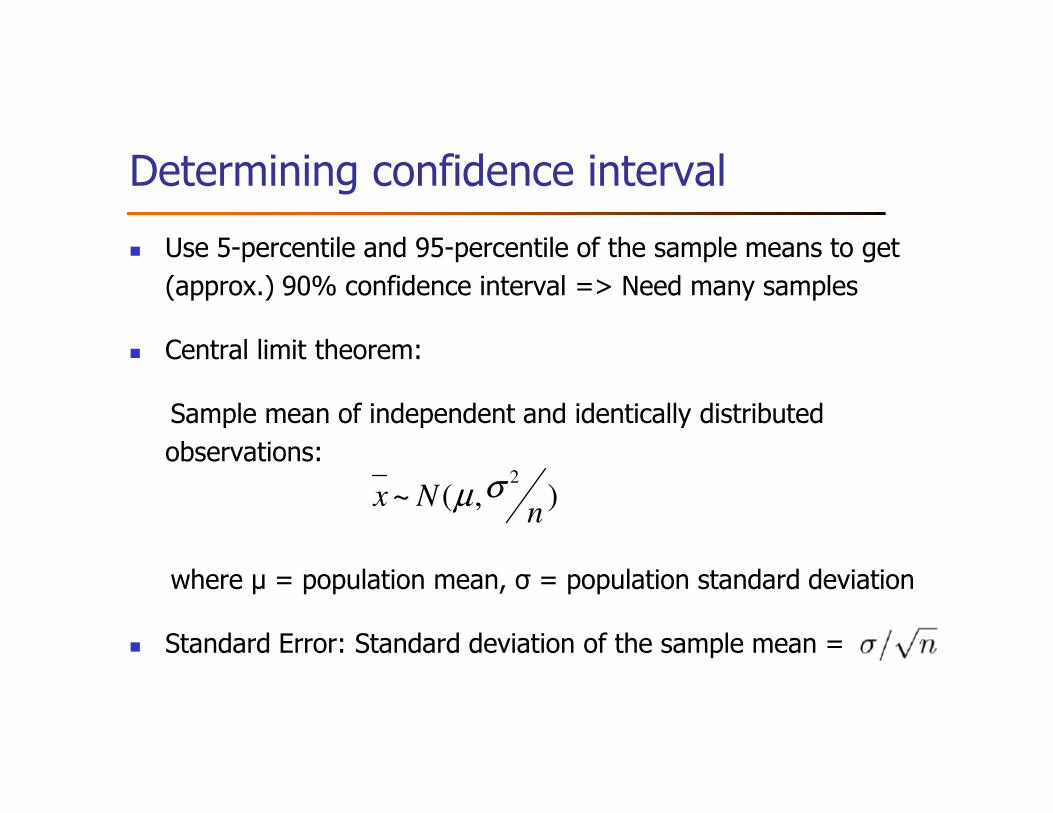
� Use 5-percentile and 95-percentile of the sample means to get
(approx.) 90% confidence interval => Need many samples
� Central limit theorem:
Sample mean of independent and identically distributed Sample mean of independent and identically distributed
observations:
where µ = population mean, σ = population standard deviation
� Standard Error: Standard deviation of the sample mean =
),(~2
nNx σµ

Determining confidence interval (contd.)
� 100(1-α)% confidence interval for µ:
� Why?
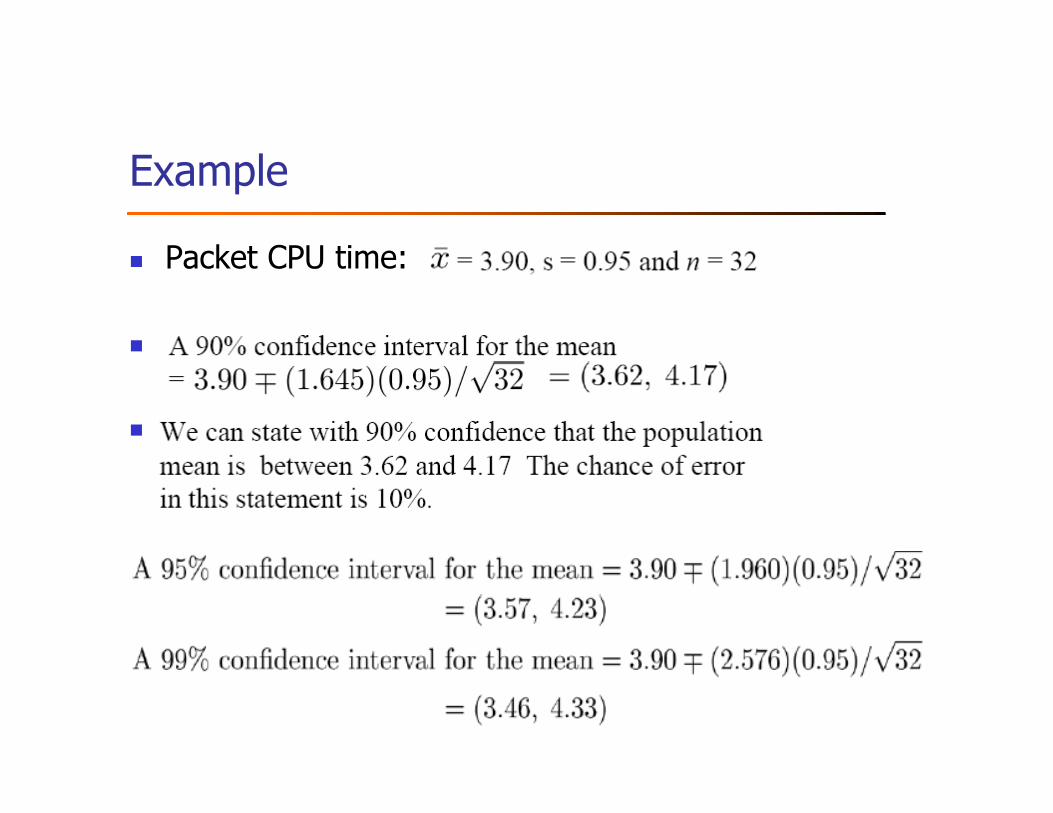
Example
� Packet CPU time:
�
�

Confidence interval: intuitive meaning
� If we take 100 samples and construct confidence
interval for each sample, the 90%-confidence interval
would include the population mean in 90 cases.
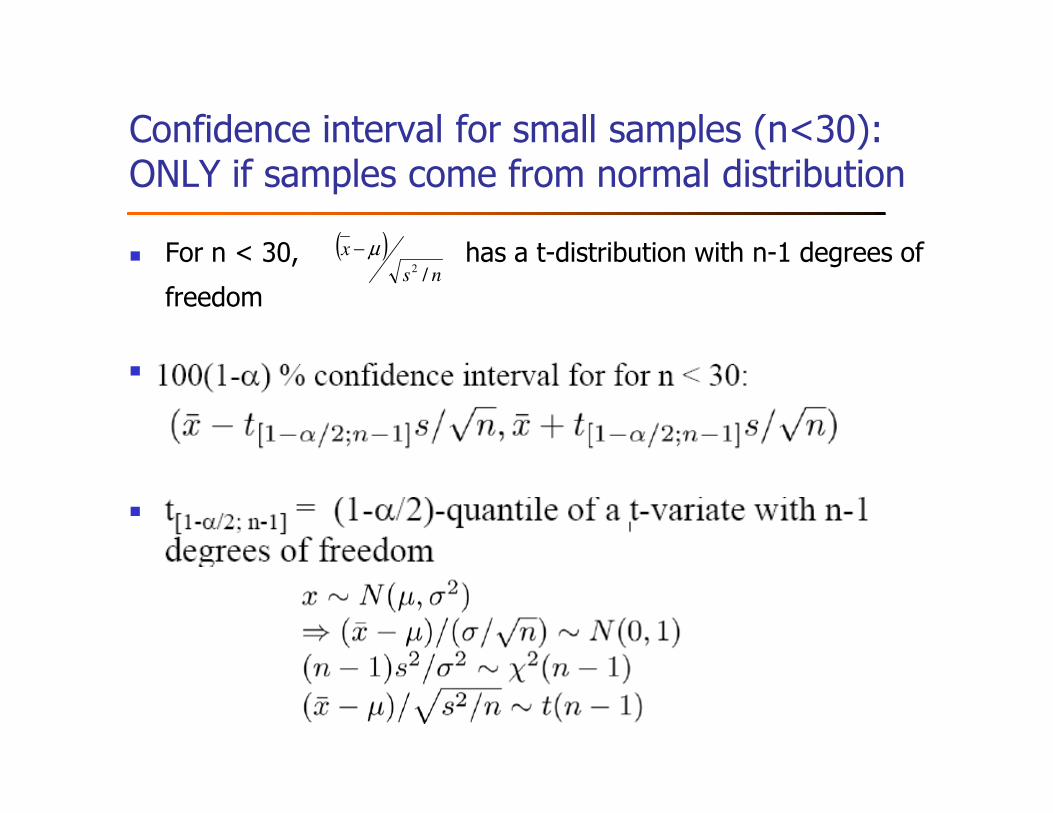
Confidence interval for small samples (n<30):ONLY if samples come from normal distribution
� For n < 30, has a t-distribution with n-1 degrees of
freedom
�
( )ns
x
/2
µ−
�
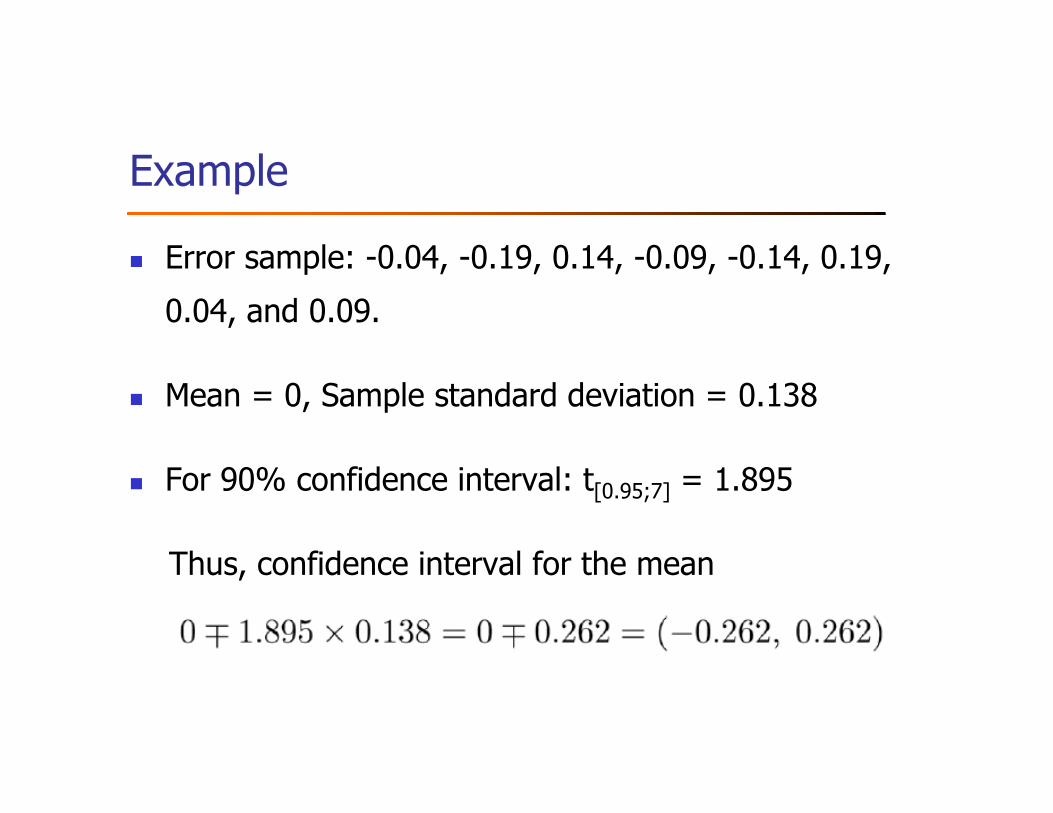
Example
� Error sample: -0.04, -0.19, 0.14, -0.09, -0.14, 0.19,
0.04, and 0.09.
� Mean = 0, Sample standard deviation = 0.138� Mean = 0, Sample standard deviation = 0.138
� For 90% confidence interval: t[0.95;7] = 1.895
Thus, confidence interval for the mean
Outline
� Sample vs. Population
� Confidence Interval for The Mean
� Application & variations of CI
� Testing for a zero mean� Testing for a zero mean
� Comparing two alternatives
� One Sided Confidence Intervals
� Confidence Intervals for Proportions
� What confidence level to use
� Hypothesis testing vs. confidence interval
� Sample Size
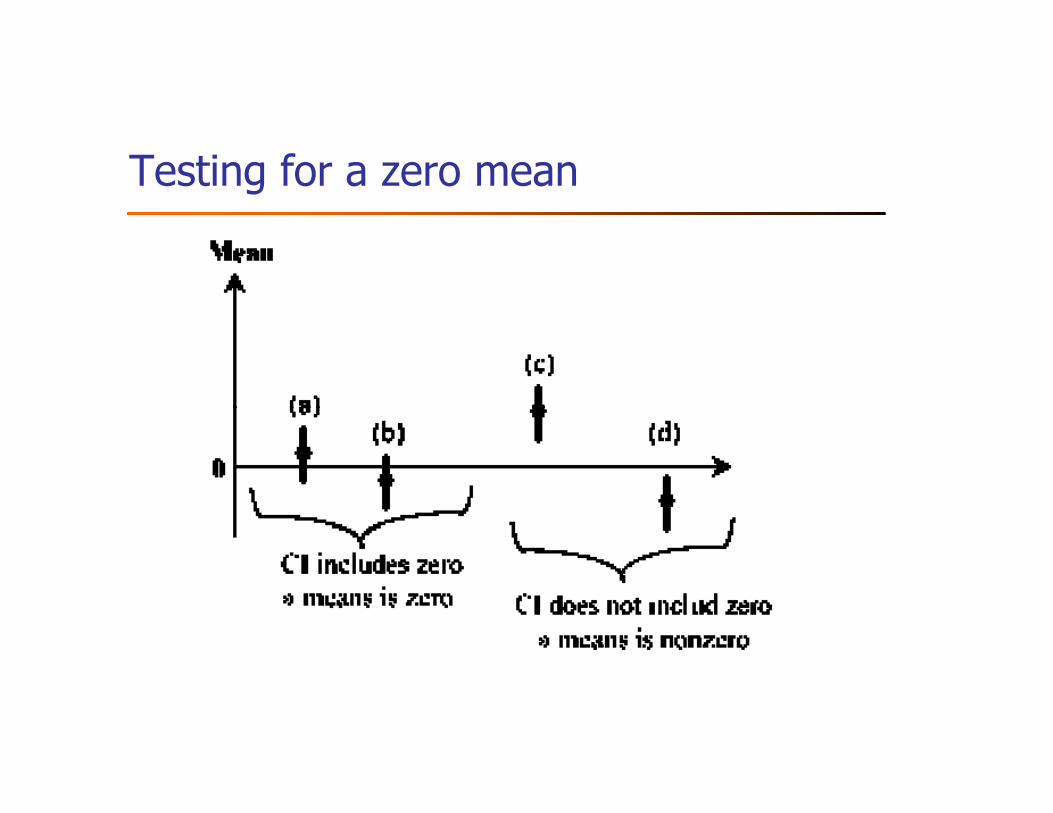
Testing for a zero mean

Example
� Difference in network processor times: {1.5, 2.6, -1.8, 1.3, -0.5, 1.7, 2.4}.
� Question: Can we say with 99% confidence that one is superior to the
other?
Sample size = n = 7; Mean = 7.20/7 = 1.03Sample size = n = 7; Mean = 7.20/7 = 1.03
Sample variance = (22.84 - 7.20*7.20/7)/6 = 2.57
Sample standard deviation = = 1.60
=> t[0.995; 6] = 3.70
Thus, 99% confidence interval = (-1.21, 3.27)

Example (contd.)
� Opposite signs => we cannot say with 99%
confidence that the mean difference is significantly
different from zero.
� Answer: They are same; or the difference is zero.

Another question: testing for a constant
� Difference in network processor times: {1.5, 2.6, -1.8, 1.3,
-0.5, 1.7, 2.4}. (note: same as the previous example)
� Question: Is the difference 1?� Question: Is the difference 1?
� 99% Confidence interval = (-1.21, 3.27)
� Yes: The difference is 1.
Outline
� Sample vs. Population
� Confidence Interval for The Mean
� Application & variations of CI
� Testing for a zero mean� Testing for a zero mean
� Comparing two alternatives
� One Sided Confidence Intervals
� Confidence Intervals for Proportions
� What confidence level to use
� Hypothesis testing vs. confidence interval
� Sample Size

Comparing two alternatives: Paired vs. unpaired observations
� Paired: one-to-one correspondence between the i-th
test of system A and the i-th test on system B
� Example: Performance on i-th workload
Use confidence interval of the difference� Use confidence interval of the difference
� Unpaired: No correspondence
� Example: n people on System A, m on System B
� Need more sophisticated method
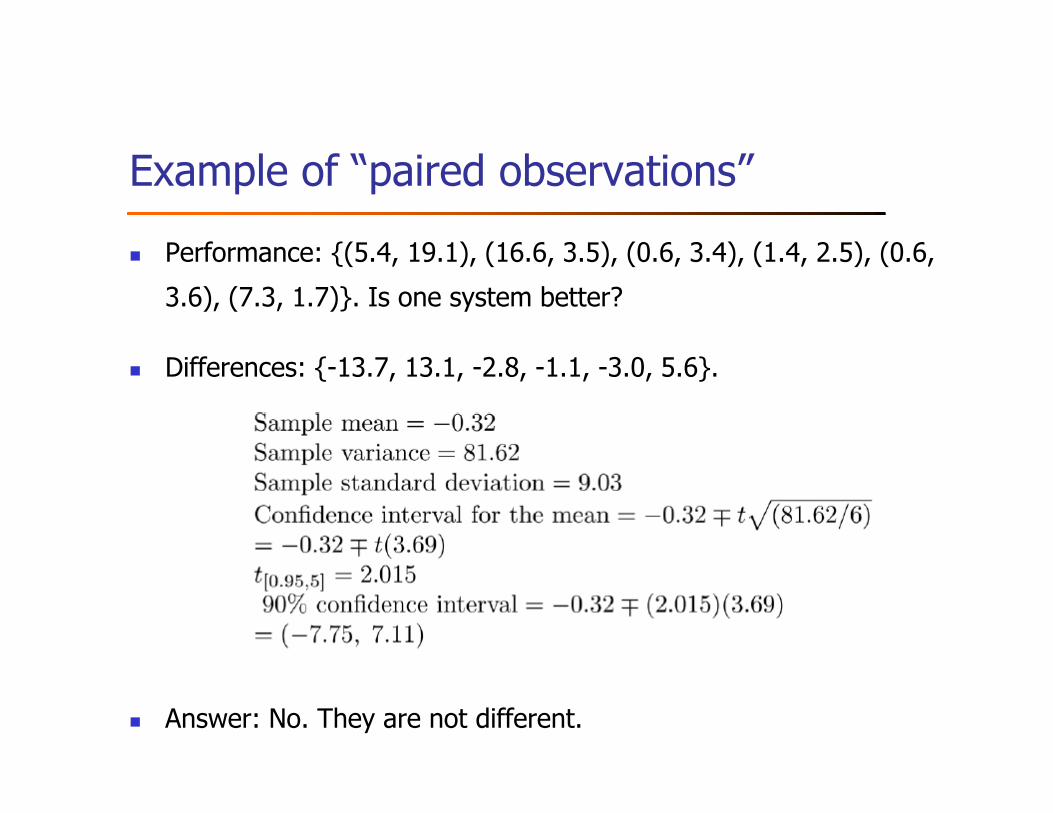
Example of “paired observations”
� Performance: {(5.4, 19.1), (16.6, 3.5), (0.6, 3.4), (1.4, 2.5), (0.6,
3.6), (7.3, 1.7)}. Is one system better?
� Differences: {-13.7, 13.1, -2.8, -1.1, -3.0, 5.6}.
� Answer: No. They are not different.

Unpaired observations: t-test
� Compute the sample means:
� Compute the sample standard deviations:

Unpaired observations (contd.)
� Compute the mean difference:
� Compute the standard deviation of the mean difference:
� Compute the effective number of degrees of freedom:
� Compute the confidence interval for the mean difference:
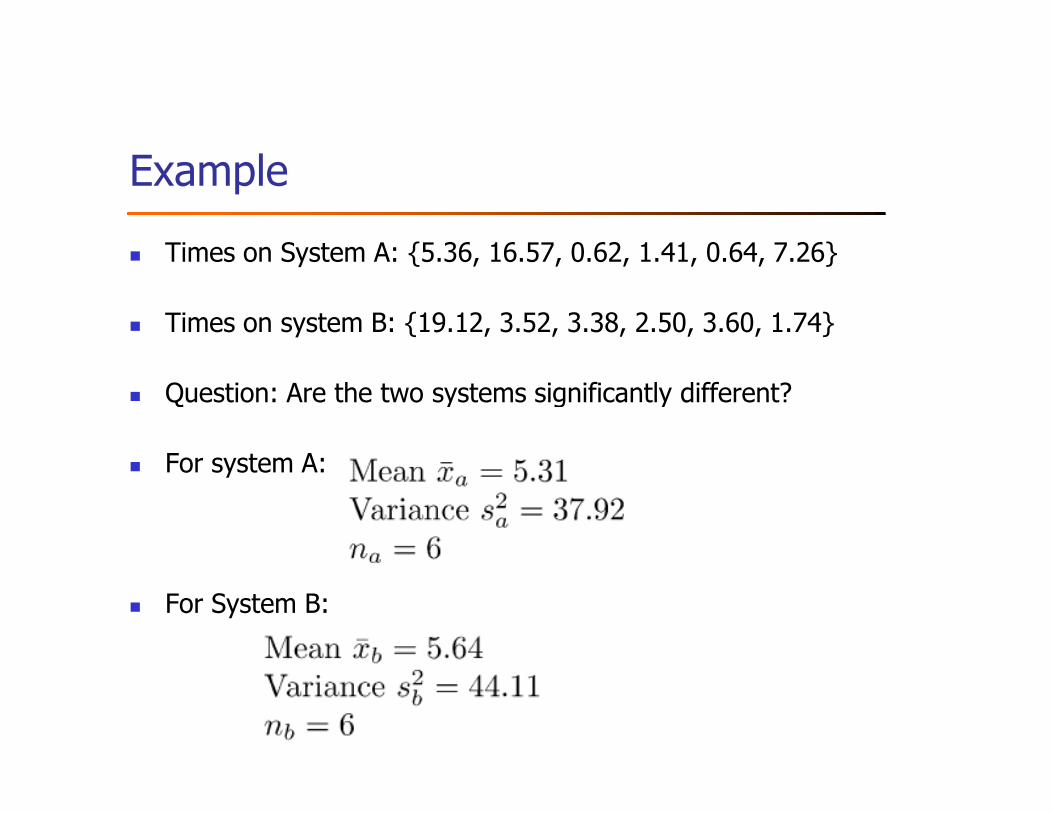
Example
� Times on System A: {5.36, 16.57, 0.62, 1.41, 0.64, 7.26}
� Times on system B: {19.12, 3.52, 3.38, 2.50, 3.60, 1.74}
� Question: Are the two systems significantly different?Question: Are the two systems significantly different?
� For system A:
� For System B:
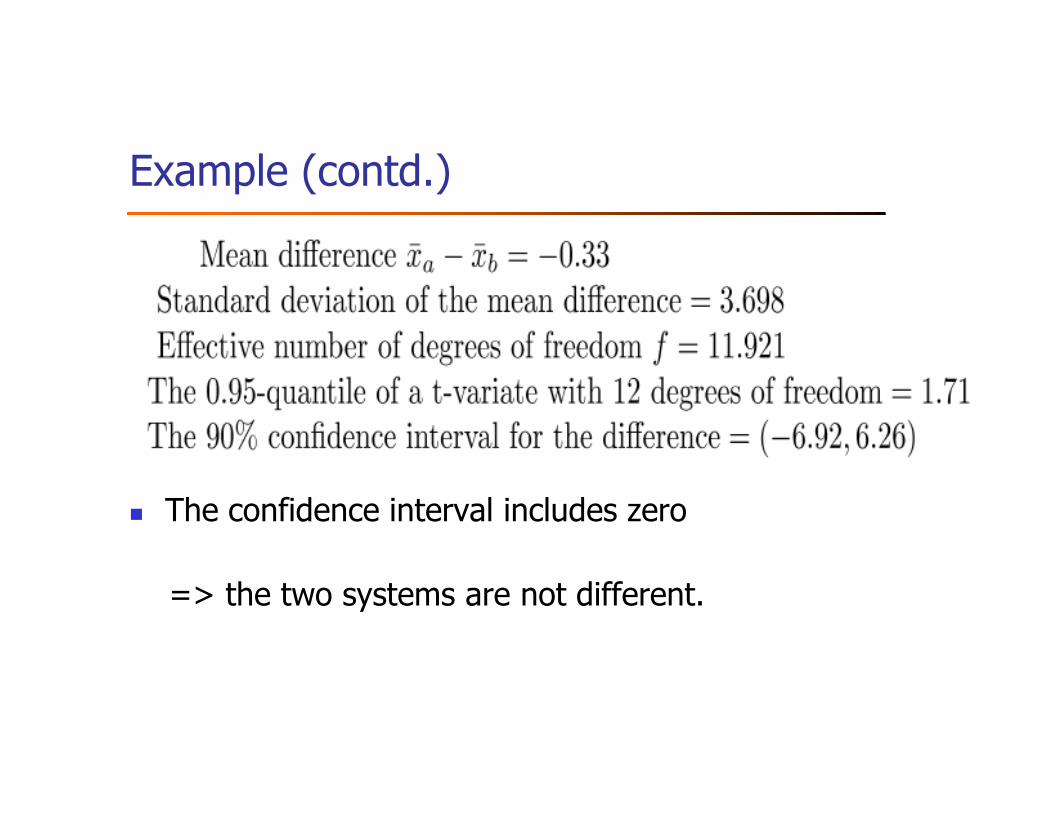
Example (contd.)
� The confidence interval includes zero
=> the two systems are not different.

Approximate visual test

Example
� Times on System A: {5.36, 16.57, 0.62, 1.41, 0.64, 7.26}
Times on system B: {19.12, 3.52, 3.38, 2.50, 3.60, 1.74}
t[0.95, 5] = 2.015
� The 90% confidence interval for the mean of A = 5.31 ∓ (2.015) = � The 90% confidence interval for the mean of A = 5.31 ∓ (2.015) =
(0.24, 10.38)
The 90% confidence interval for the mean of B = 5.64 ∓ (2.015) =
(0.18, 11.10)
� Confidence intervals overlap and the mean of one falls in the
confidence interval for the other.
� Two systems are not different at this level of confidence.

Small samples, and they do not come from normal distribution?
� Non-parametric methods
Reference: � Reference:
M. Hollander, D. A. Wolfe, “Nonparametric Statistical Methods”,
2nd edition, Wiley, 1999

Outline
� Sample vs. Population
� Confidence Interval for The Mean
� Application & variations of CI
� Testing for a zero mean� Testing for a zero mean
� Comparing two alternatives
� One Sided Confidence Intervals
� Confidence Intervals for Proportions
� What confidence level to use
� Hypothesis testing vs. confidence interval
� Sample Size
One sided confidence interval
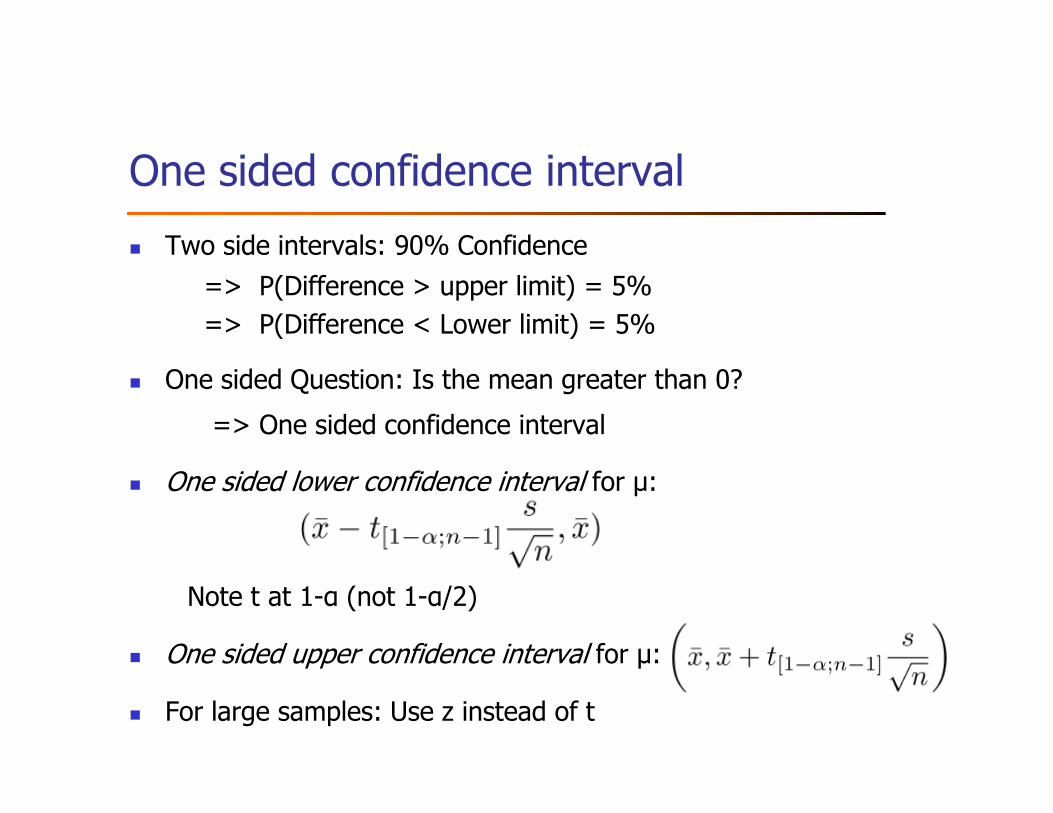
� Two side intervals: 90% Confidence
=> P(Difference > upper limit) = 5%
=> P(Difference < Lower limit) = 5%
� One sided Question: Is the mean greater than 0?
=> One sided confidence interval
� One sided lower confidence interval for µ:
Note t at 1-α (not 1-α/2)
� One sided upper confidence interval for µ:
� For large samples: Use z instead of t

Example

Example (contd.)

Outline
� Sample vs. Population
� Confidence Interval for The Mean
� Application & variations of CI
� Testing for a zero mean� Testing for a zero mean
� Comparing two alternatives
� One Sided Confidence Intervals
� Confidence Intervals for Proportions
� What confidence level to use
� Hypothesis testing vs. confidence interval
� Sample Size

Confidence intervals for proportions
� Proportion = probabilities of various categories
� E.g., P(error)=0.01, P(No error)=0.99
� n1 of n observations are of type 1 =>
Assumed Normal approximation of Binomial distribution
� Valid only if np≥ 10.
� If np < 10, computation is complex and need to use binomial tables;
cannot use t-values
CI for proportions (contd.)
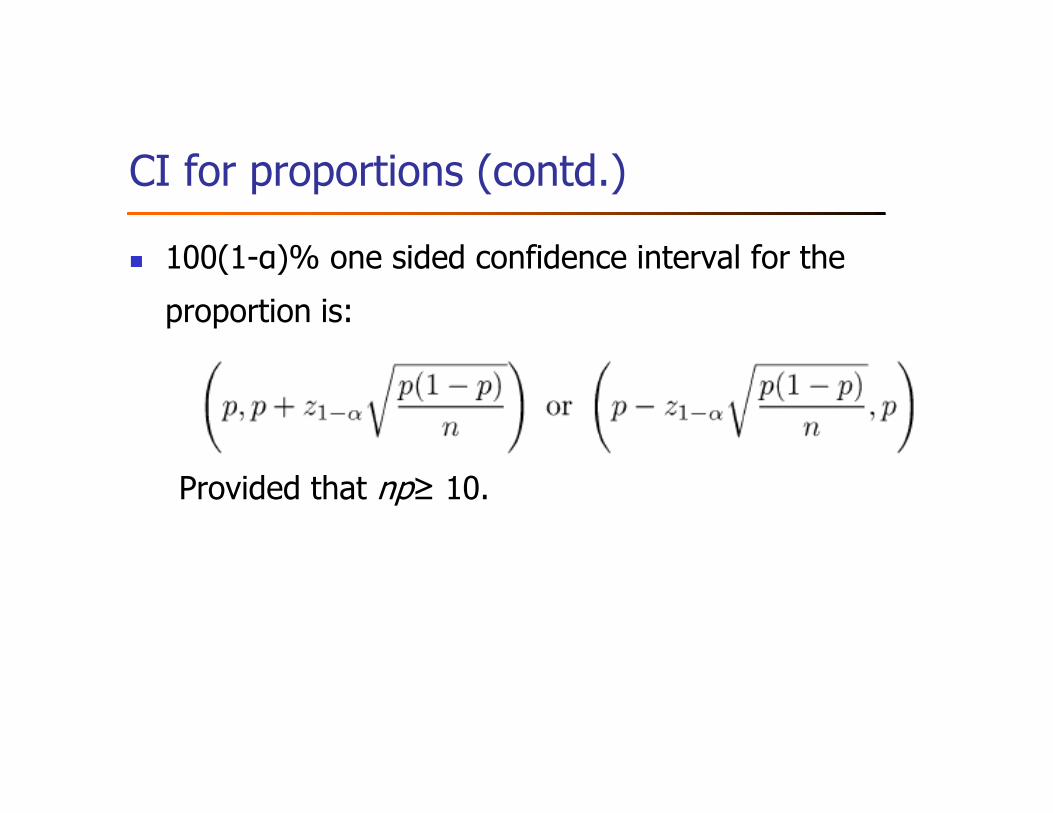
� 100(1-α)% one sided confidence interval for the
proportion is:
Provided that np≥ 10.

Example

Example (contd.)

Another example: test proportion for a constant

Outline
� Sample vs. Population
� Confidence Interval for The Mean
� Application & variations of CI
� Testing for a zero mean� Testing for a zero mean
� Comparing two alternatives
� One Sided Confidence Intervals
� Confidence Intervals for Proportions
� What confidence level to use
� Hypothesis testing vs. confidence interval
� Sample Size

What confidence level to use?
� Need not always be 90% or 95% or 99%
� Base on the loss of drawing wrong conclusions and the gain of
drawing correct conclusions
Low loss => Low confidence level is fine� Low loss => Low confidence level is fine
� E.g., lottery of 5 Million with probability 10-7;
90% confidence => buy nine million tickets (each ticket costs $1);
0.01% confidence level is fine.
� 50% confidence level may or may not be too low;
99% confidence level may or may not be too high

Outline
� Sample vs. Population
� Confidence Interval for The Mean
� Application & variations of CI
� Testing for a zero mean� Testing for a zero mean
� Comparing two alternatives
� One Sided Confidence Intervals
� Confidence Intervals for Proportions
� What confidence level to use
� Hypothesis testing vs. confidence interval
� Sample Size
Hypothesis testing vs. confidence intervals
� Closely related
� E.g., If the value of the parameter specified by the null hypothesis
is contained in the 95% confidence interval, then the null
hypothesis cannot be rejected at the 0.05 level. If the value hypothesis cannot be rejected at the 0.05 level. If the value
specified by the null hypothesis is not in the interval then the null
hypothesis can be rejected at the 0.05 level.

Hypothesis testing vs. confidence intervals (contd.)
� Confidence interval provides more information
� Hypothesis test = yes-no decision
� Confidence interval also provides possible range
� Narrow confidence interval => high degree of precision; Wide confidence interval => Low precisionWide confidence interval => Low precision
� Example: (-100,100) => No difference; (-1,1) => No difference
� Confidence intervals tell us not only what to say but also how loudly to say it
� CI is easier to explain to decision makers
� CI is more useful.
� E.g., parameter range (100, 200) vs. Probability of (parameter = 110) < 3%

Outline
� Sample vs. Population
� Confidence Interval for The Mean
� Application & variations of CI
� Testing for a zero mean� Testing for a zero mean
� Comparing two alternatives
� One Sided Confidence Intervals
� Confidence Intervals for Proportions
� What confidence level to use
� Hypothesis testing vs. confidence interval
� Sample Size
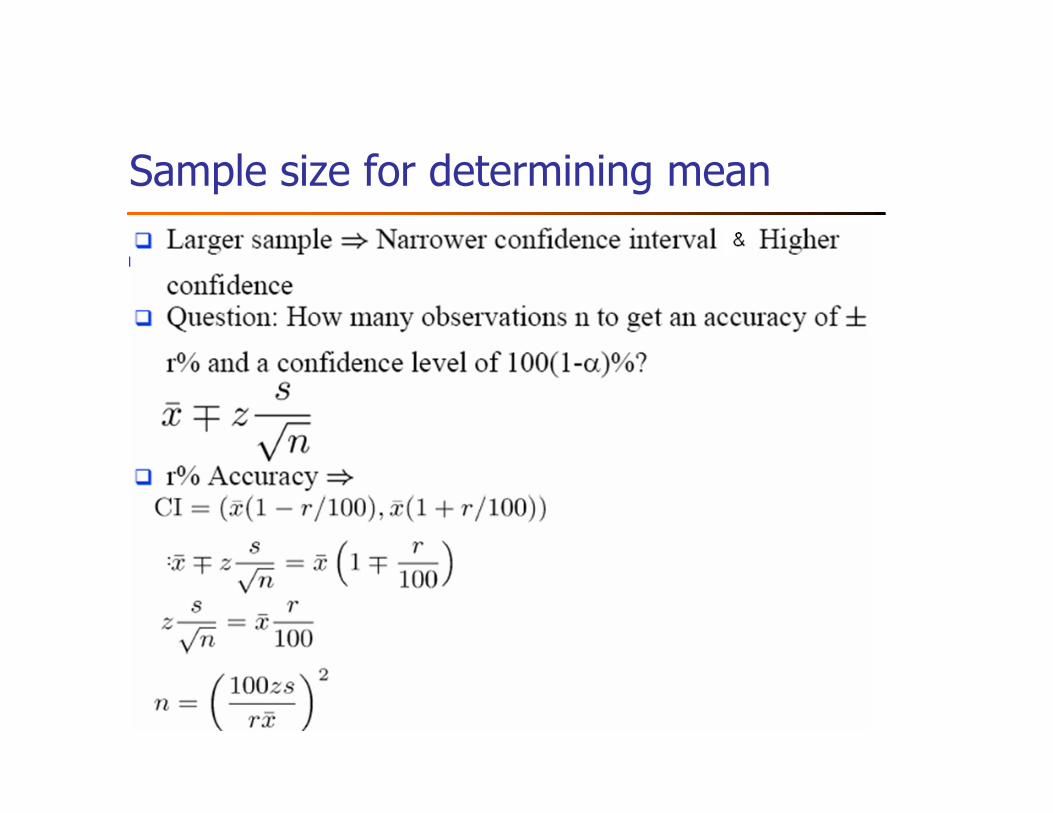
Sample size for determining mean

Example
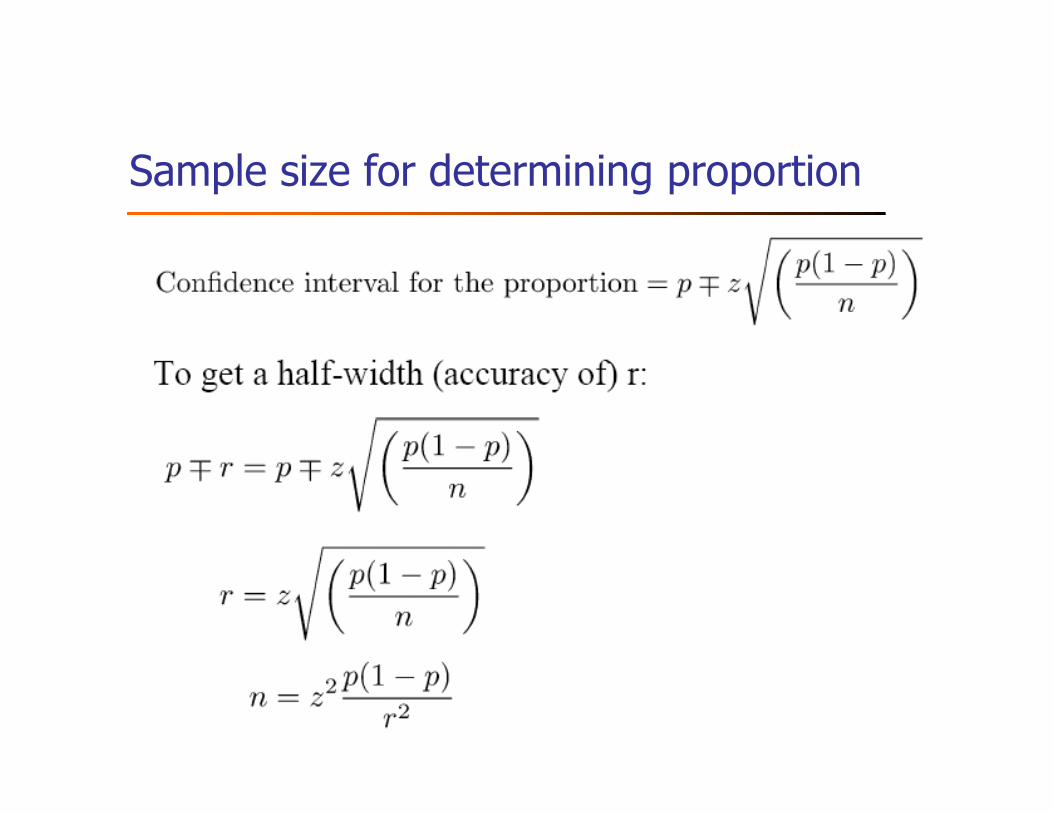
Sample size for determining proportion

Example

Sample size for comparing two alternatives: non-overlapping CIs
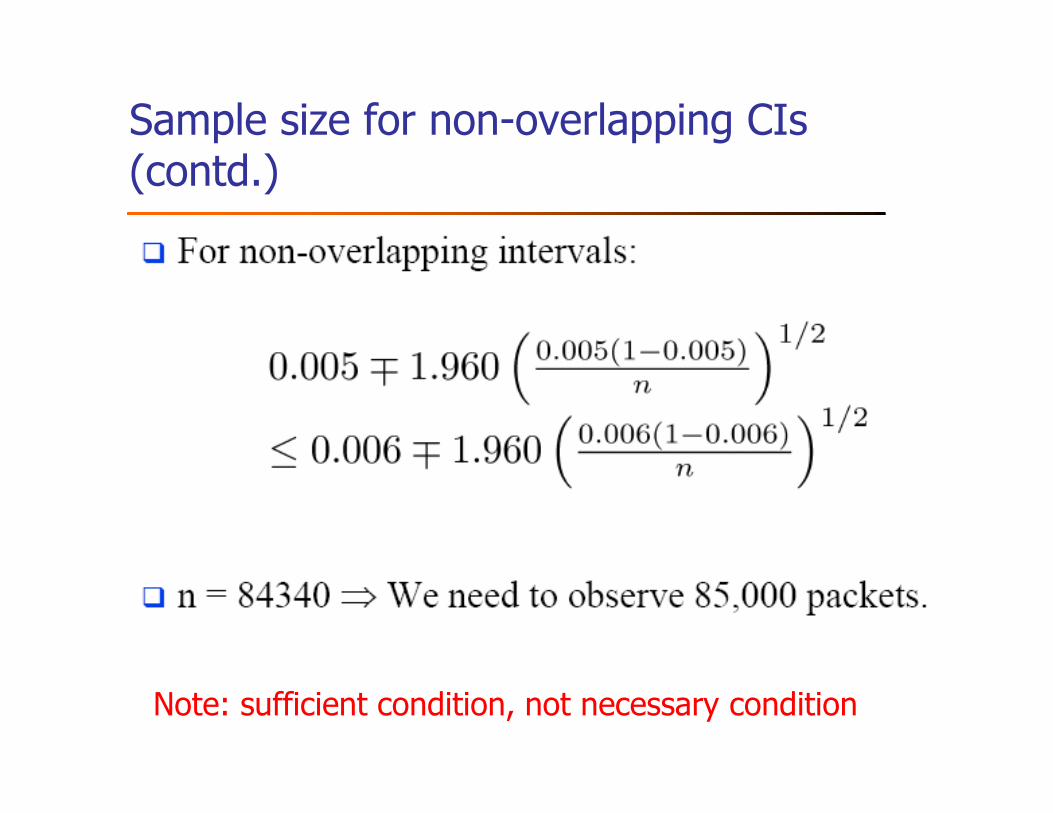
Sample size for non-overlapping CIs (contd.)
Note: sufficient condition, not necessary condition
Summary
� Sample vs. Population
� Confidence Interval for The Mean
� Application & variations of CI
� Testing for a zero mean� Testing for a zero mean
� Comparing two alternatives
� One Sided Confidence Intervals
� Confidence Intervals for Proportions
� What confidence level to use
� Hypothesis testing vs. confidence interval
� Sample Size

Homework#4
1. (100 points) The number of disk I/O’s performed by a
number of programs were measured as follows:
{23,33,14,15,42,28,33,45,23,34,39,21,36,23,34,36,25,9,
11,19,35,24,31,29,16,23,34,24,38,15,13,35,28}. 11,19,35,24,31,29,16,23,34,24,38,15,13,35,28}.
� What is the 10-percentile and 90-percentile from the sample?
� What is the mean number of disk I/Os per program?
� What is the 90% confidence interval for the mean?
� What fraction of programs make less than or equal to 25 I/Os
and what is the 95% confidence interval for the fraction?
� What is the one sided 90% confidence interval for the mean?