tesi Roberta Siviero - Unifeeprints.unife.it/415/2/tesi Roberta Siviero.pdf · note proprietà...
68
1 ABSTRACT The rapid response of mitochondria to cellular Ca 2+ signals depends on their close proximity to the ER, allowing them to sense microdomains of high [Ca 2+ ] meeting the low affinity of the mitochondrial Ca 2+ uniporter (MCU) of the inner membrane. Recent work has demonstrated that the subcellular fraction denominated Mitochondria-Associated Membranes (MAMs) may correspond to this signaling domain, as in electron micrographs it shows the apposition of the two organelles and it is enriched in Ca 2+ channels and regulatory proteins. The Transforming Growth Factor-β (TGF-β) family consists of more than 30 different but structurally related polypeptides, which are known to have crucial roles in the regulation of cell proliferation, differentiation and apoptosis. The downstream effectors of TGF-β signaling are intracellular proteins called Smads that hetero-oligomerize after phosphorylation and subsequently migrate into the nucleus to influence gene expression. While much progress has been made in understanding TGF-β regulation of gene expression, the subcellular distribution of Smad proteins and their nuclear- independent activity are still incompletely understood. We have investigated the effect of the TGF-β signaling on intracellular Ca 2+ homeostasis. The results showed that Smad2/3, both in HeLa cells and in liver preparations, are present in mitochondria, with a specific enrichment in the MAM fraction. Such a distribution may underlie a direct, transcription-independent role in the modulation of the ER/mitochondria Ca 2+ cross-talk. This possibility has been directly investigated using aequorin-based recombinant probes targeted to the mitochondria, the ER and the cytosol. Specifically, we observed that treatment with inhibitors of the TGF-β receptor family, such as SB431542 and Dorsomorphin (Compound C) reduces agonist-dependent increases of mitochondrial Ca 2+ concentration [Ca 2+ ] m , while leaving the cytosolic responses unaffected. The effects were observed also upon inhibition of protein
Transcript of tesi Roberta Siviero - Unifeeprints.unife.it/415/2/tesi Roberta Siviero.pdf · note proprietà...

1
ABSTRACT
The rapid response of mitochondria to cellular Ca2+
signals depends on their close
proximity to the ER, allowing them to sense microdomains of high [Ca2+
] meeting the low affinity
of the mitochondrial Ca2+
uniporter (MCU) of the inner membrane. Recent work has demonstrated
that the subcellular fraction denominated Mitochondria-Associated Membranes (MAMs) may
correspond to this signaling domain, as in electron micrographs it shows the apposition of the two
organelles and it is enriched in Ca2+
channels and regulatory proteins. The Transforming Growth
Factor-β (TGF-β) family consists of more than 30 different but structurally related polypeptides,
which are known to have crucial roles in the regulation of cell proliferation, differentiation and
apoptosis. The downstream effectors of TGF-β signaling are intracellular proteins called Smads
that hetero-oligomerize after phosphorylation and subsequently migrate into the nucleus to
influence gene expression. While much progress has been made in understanding TGF-β
regulation of gene expression, the subcellular distribution of Smad proteins and their nuclear-
independent activity are still incompletely understood.
We have investigated the effect of the TGF-β signaling on intracellular Ca2+
homeostasis.
The results showed that Smad2/3, both in HeLa cells and in liver preparations, are present in
mitochondria, with a specific enrichment in the MAM fraction. Such a distribution may underlie a
direct, transcription-independent role in the modulation of the ER/mitochondria Ca2+
cross-talk.
This possibility has been directly investigated using aequorin-based recombinant probes targeted
to the mitochondria, the ER and the cytosol. Specifically, we observed that treatment with
inhibitors of the TGF-β receptor family, such as SB431542 and Dorsomorphin (Compound C)
reduces agonist-dependent increases of mitochondrial Ca2+
concentration [Ca2+
]m, while leaving
the cytosolic responses unaffected. The effects were observed also upon inhibition of protein
2
synthesis, thus ruling out the possibility that they are due to alterations of the expression levels of
Ca2+
transporters. The same effects were observed by shRNA silencing of Smads, thus involving
these TGF-β transducers in the mitochondrial effects. Work is currently under way to identify the
mechanism of the Ca2+
signalling alterations (intrinsic desensitization of the MCU, reduction of the
electrochemical driving force, etc.).
Altogether, these data demonstrate that also the TGF-β signaling pathway converges on
mitochondrial checkpoint, clustering intracellular transducers in critical signaling domains and
modulating Ca2+
loading and the sensitivity to growth-promoting and apoptotic challenges.

3
ABSTRACT (italiano)
La rapida risposta dei mitocondri ai segnali Ca2+
intracellulari dipende dalla loro prossimità al
Reticolo Endoplasmatica che permette loro di sentire microdomini caratterizzati da elevate
concentrazioni di Ca2+
che spiegano come questi organelli possano accumulare transitoriamente
grandi quantità di calcio nonostante sia nota la bassa affinità con cui il trasportatore mitocondriale
(MCU) sia in grado di muovere lo ione attraverso il doppio strato della membrana. Recentemente
è stato dimostrato che la frazione subcellulare denominata MAM (Mitochondrial Associated
Membrane) può corrispondere al dominio funzionale poiché in studi morfologici precedenti è
stata osservata la giustapposizione dei mitocondri al Reticolo Endoplasmatico e inoltre tali regioni
risultano arricchite di canali Ca2+
e proteine regolatrici. La famiglia del Transforming Growth
Factor-β (TGF-β) consiste in più di 30 membri diversi, polipeptidi strutturalmente correlati con
note proprietà regolatorie in processi cellulari come la proliferazione, il differenziamento e
l’apoptosi. Gli effettori a valle del TGF-β sono proteine chiamate Smads che etero-oligomerizzano
in seguito a fosforilazione e migrano nel nucleo dove regolano l’espressione genica. Mentre sono
stati fatti molti progressi verso la comprensione dell’attività nucleare del TGF-β, la distribuzione
subcellulare e l’attività nucleo-indipendente delle Smads risulta ancora piuttosto sconosciuta. In
questo lavoro è stato investigato il ruolo di TGF-β nell’omeostasi intracellulare del Ca2+
.
I risultati dimostrano una localizzazione subcellulare delle Smads nei mitocondri sia in HeLa che in
preparazioni da fegato di topo, mostrando un particolare arricchimento a livello delle MAMs.
Questa distribuzione può suggerire un ruolo trascrizione-indipendente di queste proteine nella
regolazione del cross-talk tra Reticolo Endoplasmatico e mitocondri. Tale ipotesi è stata testata
direttamente grazie all’utilizzo di sonde per il Ca2+
che sfruttano la tecnologia dell’aequorina,

4
targhettate in modo specifico ai mitocondri, al Reticolo Endoplasmatico e al cytosol. Precisamente
è stato osservato che l’utilizzo di inibitori di isoforme diverse del recettore per il TGF-β, come la
molecola SB431542 e Dorsomorphin (Compound C) riduce l’ingresso di calcio nei mitocondri,
lasciando inalterata la risposta nel cytosol. La stessa osservazione è stata fatta in presenza di un
inibitore della sintesi proteica, eliminando così la possibilità che tale effetto fosse il risultato di
un’alterazione nei livelli di espressione dei trasportatori mitocondriali del Ca2+
. Lo stesso effetto è
stato osservato mediante l’uso di ShRNA capaci di silenziare diverse isoforme di Smads.
La comprensione del meccanismo alla base dell’alterazione mitocondriale osservata è ancora in
fase di studio. I risultati di questo lavoro mostrano comunque che anche la cascata del segnale di
TGF-β converge al checkpoint mitocondriale regolando la distribuzione di trasduttori intracellulari
a livello di domini funzionali critici e modulando l’uptake di Ca2+
nella matrice mitocondriale e la
sensibilità degli organelli a segnali di tipo proliferativo o apoptotico

5
INTRODUCTION
Mitochondria: key regulators of intracellular calcium homeostasis
Mitochondria are intracellular organelles characterized by a double membrane and a circular
double-stranded DNA molecules. The double membrane is composed by a plain outer layer, which
allows the passage of ions and metabolites up to 5000 Da and the more selective inner membrane,
characterized by invaginations, the so called cristae. Between these two very different layers the
mitochondrial matrix is enclosed. The mitochondrial DNA is a 16.6 Kb molecule and it encodes 13
proteins all of which are known to be part of the mitochondrial Electron Transport Chain (mETC).
Thanks to their biosynthetic capacities mitochondria have central role in the supply of the high
amount of energy required for many different cellular functions such as hormones synthesis and
secretion, muscle contraction, proliferation, biomolecules synthesis and maintenance of ionic
gradient across the membrane. Substrates derived from other intracellular processes such as
glycolysis or the fatty acid metabolism, are converted to Acetyl-CoA which enters the Tricarboxilic
Acid Cycle TCA and its complete degradation is coupled with the production of NADH and FADH2.
These new molecules are the effective electron donors for the mETC which is composed of five
different complexes: complex I (NADH dehydrogenase), complex II (succinate dehydrogenase),
complex III (ubiquinol cytochrome c reductase), complex IV (cytochrome c oxidase) and complex V
that constitutes the F1F0-ATP synthase. While electrons are transferred from NADH and FADH2 to
these complexes, energy is stored as an electrochemical gradient across the inner membrane
which explains the existence of a negative mitochondrial membrane potential (-180mV against the
cytosol). The F1F0-ATP synthase can make the H+ cross the inner membrane to reenter the matrix
coupling the energy derived from the proton gradient with the phosphorylation of ADP into ATP
6
(according to the so called chemiosmotic principle). The new ATP molecules are now ready to
leave the mitochondria first from the inner membrane through the Adenine Nucleotide
Transferase (ANT) which exchanges it with ADP (to provide new substrate for the F1F0-ATP
synthase) and then through a mitochondrial channel of the outer membrane called VDAC.
In the last few decades many different groups are engaged in the comprehension of new roles for
mitochondria which have shown to be involved in other cellular mechanisms such as amino-acid
synthesis, lipid metabolism, reactive oxygen species production (ROS), cell death and, most
importantly for the present work, Ca2+
signaling. Therefore any mitochondrial dysfunction is at the
basis of pathological conditions like neurodegenerative diseases such as Alzheimer’s and
Parkinson’s, motoneuron disorders such as amyotrophic lateral sclerosis, autosomal dominant
optic atrophy, diabetes, ageing and cancer. Thus it is evident how much importance has the
understanding of the role of mitochondria in the cohordination of cytosolic and other subcellular
organelles signals.
Calcium signaling: a general overview
Ca2+
is one of the most described intracellular second messenger (Hajnoczky G., 2000) and this is
the reason why its cytosolic concentration [Ca2+
]c is taken under strict control by many different
pumps, channels, exchangers and binding proteins. Actually [Ca2+
]c is maintained around value of
100nM (while the extracellular [Ca2+
] is 1mM) by the activity of the Plasma membrane Ca2+
-ATPase
(PMCA) which pump Ca2+
outside the cells and of the Na+/Ca
2+ exchanger (NCX). The increased of
the intracellular [Ca2+
] is mainly due to its liberation from intracellular stores (Endoplasmic
Reticulum and Golgi apparatus) or the entry from the extracellular medium.
The most important intracellular Ca2+
store is the ER which is characterized by the presence on his
membrane of the IP3 Receptor (IP3R) a channel which exposes the binding site for IP3 on the

7
cytosol and forms a transmembrane channel across the ER membrane. Ca2+
is released from the ER
upon IP3R stimulation by IP3 that derives from the hydrolysis of phosphatidylinositol 4,5
bisphosphate (PIP2) carried out by Phospholipase C (PLC) which, in its turn, is activated by ligand
binding to G-coupled receptors on the plasma membrane. Intracellular store depletion activates
an inward current from the extracellular space, the so called capacitative Ca2+
entry (CCE) which
molecular mechanism has been recently explained, with the involvment of an ER Ca2+
sensing
protein (STIM) and a Ca2+
channel on the plasma membrane ORA1 (Oh-hora M. and Rao A., 2008).
Three classes of Ca2+
channel on the plasma membrane are also responsible of intracellular Ca2+
increased: the Voltage Operated Ca2+
channels (VOCs) which open following a decrease of
membrane potential (Bertolino M. and Llinas R.R., 1992), the Receptor Operated Ca2+
channels
(ROCs), also called ligand gated channels, which open following the binding of an external ligand
(McFadzean I. and Gibson A., 2002) and the Second Messenger Operated Channels (SMOCs) which
open following the binding of a second messenger on the inner surface of the membrane
(Meldolesi J. and Pozzan T., 1987). Ca2+
has to be rapidly removed once it has exerted its second
messenger function and mechanisms for its extrusion are PMCA and NCX but also pumps capable
to refill the intracellular stores such as Sarco-Endoplasmic Reticlum Ca2+
ATPases (SERCAs).
Mitochondria can rapidly accumulate Ca2+
thanks to the electrochemical gradient established by
the movement of protons across the inner mitochondrial membrane (IMM), however the
development of specific probes for the measurement of [Ca2+
] in the mitochondria revealed a
capacity of uptaking the ion much higher if compared with the affinity of [Ca2+
] transporter, this is
the reason why today it is generally accepted the idea of a strategic close proximity of a
mitochondrial fraction able to sense short but large [Ca2+
].

8
Mitochondria cohordinate Ca2+
signaling
By the end of 70’s mitochondria were thought to be intracellular Ca2+
stores, indeed according to
the chemosmotic theory these organelles could exploit the H+ electrochemical gradient to produce
ATP but also to accumulate cations into the matrix. Ca2+
transfer across the ion-impermeable
membrane is in fact not due to the activity of pumps or exchangers but it is mediated by a
“uniporter” which molecular identity has not been completely described yet and the
electrochemical potential gradient across the mitochondrial membrane (-180mV negative to the
cytosol) drives it (Gunter T.E., 1998). Moreover if Ca2+
accumulation into the matrix was due to
thermodynamic parameters, according to the Nerst equation, equilibrium would be reached only
when [Ca2+
] in the matrix reaches value 106
higher than in the cytosol.
Only a decade later, researchers discovered that the [Ca2+
]m was lower than expected, this notion
and the discovery of a new intracellular organelle the Endoplamic Reticulum (Streb H., 1983) made
evident that mitochondria were not a Ca2+
store.
At the end of the 80s the general idea was that mitochondria could not accumulate significant
amount of the cations considering the low affinity of their uniporter and the low values of the
[Ca2+
]c ,around 0.1 μM in normal conditions and 1-3 μM under stimulation.
Nevertheless three mitochondrial enzymes (pyruvate-, α-ketoglutarate and isocitrate
dehydrogenase) were regulated by Ca2+
oscillations but the demonstration of this idea had to wait
until the early 90s. Indeed the direct measurement of Ca2+
transients within the mitochondrial
compartment was possible only in 1990s, when Rizzuto and coworkers introduced the Ca2+
-
sensitive probe aequorin, which could be targeted to mitochondria and other intracellular
organelles. These studies demonstrates in many different cellular type that the mitochondrial
ability of uptaking Ca2+
was much more higher than expected (ranging from 10μM to 500μM).
9
Taking into consideration the low affinity of mitochondrial uniporter and the low concentration of
Ca2+
in the cytosol. This discrepancy lead the researchers to the formulation of the “hotspot
hypothesis” according to which mitochondria could sense microdomains of high [Ca2+
] achieved
through close proximity between a fraction of mitochondria and the ER.
The release of Ca2+
from the latter happens through the IP3 channels on its surface and this creates
a microenviroments where [Ca2+
] is much higher than that measured in the bulk cytosol (Rizzuto
R., 1993). Few years later a strong evidence in support of the “hotspot hypothesis” was that
collected by Griffiths and coworkers, who observed that in cardiac cells concentrations of Ca2+
chelator EGTA that could abolish Ca2+
cytosolic transient, could not inhibit Ca2+
transient into the
mitochondria, this experiment suggested that the distance was so small that the cations could
diffuse from ER to mitochondria more rapidly than it can be buffered by EGTA.
The idea of a cross-talk between the two organelles was recently demonstrated by fast single-cell
imaging with targeted Ca2+
sensitive GFPs (pericams and cameleons) and supported by the
observation that [Ca2+
]m spikes originates from a discrete number of sites and rapidly diffuse
through the mitochondrial network (Szabadkai G., 2004).
Endoplasmic Reticulum/mitochondria physical contacts: the MAMs microdomains
The existence of a subdomain of the ER (Endoplasmic Reticulum) that comes into transient contact
with mitochondrial outer membranes, has been deeply demonstrated in mammalian cells and
described as a functional site of the import of PS (Phosphatidylserine) into mitochondria (Vance
JE., 2008).
Close appositions between ER and mitochondria have been observed thanks to the analysis of
electron micrographs (EM) in fixed samples of many different cell types while experiments
performed in living cells by Rizzuto and coworkers had eventually confirmed the physical and

10
functional coupling of these two organelles, by labelling the two organelles with targeted spectral
variants of GFP (mtBFP and erGFP) (Rizzuto R., 1998). These experiments revealed the presence of
overlapping regions of the two organelles (thus establishing an upper limit of 100 nm for their
distance) and allowed to estimate the area of the contact sites as 5-20% of total mitochondrial
surface. More recently, electron tomography studies allowed to estimate an even smaller distance
(10-25 nm) and revealed the presence of trypsin-sensitive (hence proteinaceous) tethers between
the two membrane (Csordas A., 2006).
The specific mitochondrial regions showing close proximity to the ER cisternae are referred to as
MAMs (Mitochondrial Associated Membranes) (Vance JE., 1990) and being the headquarters of
lipid transfer contain several phospholipids and glycosphingolipid-synthesizing enzymes such as
Fatty Acid CoA ligase 4 (FACL) as well as those enzymes involved in PS synthesis pathway.
MAMs are also involved in rapid movement of Ca2+
ions between the two organelles, playing a
fundamental role in the coordination of ATP production through the activation of the
mitochondrial dehydrogenases as well as the activation of the cell death program (Berridge M. J.,
2002) .
The shaping of the ER-mitochondrial network can be affected by bounding proteins and
physiological ligands; recently Hajnoczky and coworkers demonstrated that exposure to TGFβ
affects Ca2+
transfer to the mitochondria.(Hajnoczky G., 2008).
Unfortunately, very few of the relevant scaffolding or signaling proteins of the ER/mitochondria
contacts have been identified, despite the growing interest on the topic. Nevertheless, novel
candidates have being rapidly isolated, and are under scrutiny. Thus it can be envisaged that the
molecular characterization will rapidly proceed thanks to the validation of biochemical approaches
for the isolation of ER/mitochondria contacts.

11
Indeed a known technical pitfall of subcellular fractionation, i.e. the “contamination” of the
mitochondrial fraction with ER vesicles, has been demonstrated to be due to the actual co-
segregation of stably associated mitochondrial and ER membranes. This has led to a more accurate
separation, by gradient centrifugations, of pure mitochondria from a “mitochondria-associated
membrane” (MAM). This is the fraction enriched in enzymes involved in lipid and glucose
metabolism and in signalling proteins (such as the IP3Rs), and thus representing the biochemical
counterpart of the ER/mitochondria units revealed in the signaling studies (Vance J.E., 1990). More
recently, the same subcellular fraction has been shown to contain as well Ca2+
signaling elements
of both organelles (Szabadkai G., 2007), thus supporting its central role in ER (or SR)/mitochondria
crosstalk .
The molecular scenario is gradually adding new information, and we will here cite a couple of
interesting examples, involving chaperones. The role of glucose-regulated protein 75 (grp75)
within the mitochondrial matrix as a molecular chaperone assisting the refolding of newly
imported proteins, was well established. It was then reported that a pool of grp75 is not imported
into the matrix, but has a cytosolic distribution. Previous works carried out in our lab identified, in
two hybrid screenings, grp75 as a VDAC interactor, and demonstrated that it can mediate the
molecular interaction of VDAC with the IP3R, allowing a positive regulation of mitochondrial Ca2+
uptake. This implies a sort of conformational coupling between the Ca2+
channels of the two
organelles, and highlights the importance of macromolecular complexes located in the MAM for
this functional interaction (Colombini M., 2004). The second interesting example is that of sigma-1,
a novel ER chaperone serendipitously identified in cellular distribution studies which shown to be
involved in the Ca2+
-mediated stabilization of IP3Rs. Sigma-1 receptor is normally localized in
MAM, bound to another ER chaperone (BiP). When the luminal Ca2+
concentration of the ER
drops, following the opening of IP3Rs, sigma-1 dissociates from BiP and binds to type 3 IP3R, thus
12
preventing its degradation by the proteasome. Thus, sigma-1 appears to be involved in
maintaining, from the ER luminal side, the integrity of the ER/mitochondrial Ca2+
cross-talk in
conditions (e.g. ER stress) that could impair signal transmission, and hence control of cellular
bioenergetics. In 2005, Simmen et al. reported the identification of a multifunctional sorting
protein PACS-2, that integrates ER-mitochondria and apoptosis signaling, depletion of this protein
causes mitochondrial fragmentation and uncoupling from ER, influencing Ca2+
homeostasis.
Moreover in response of apoptotic stimuli, PACS-2 has been demonstrated capable of inducing Bid
recruitment to mitochondria, event that leads to cytochrome c release and caspase 3 activation.
The dynamical interconnection between the two organelles involves a family of “mitochondria-
shaping proteins” such as the dynamin-related GTPase DRP1, required for the mitocondria-ER
fission, or the GTPase called Optic Atrophy 1 (OPA 1) crucial for the so called mitofusion. Along this
line, Scorrano and coworkers have recently pointed out the crucial role of the mitofusin (MFN 1
and 2), in particular the isophorm 2 is thought to be important for ER-mitochondrial interactions
engaging them both in homo and etero-complexes. (Scorrano L., 2008). They showed how the
distance of two organelles is increased where MFN 2 lacks and how it impairs mitochondrial Ca2+
uptake, giving solid evidence in support to the microdomains theory. Moreover the ER-
mitochondrial apposition performed by MFN 2 predispose mitochondria to high Ca2+
microdomains and the consequent overloading, leading eventually to apoptosis by excessive Ca2+
transfer.
Integration of the TGF-B pathway into the cellular signaling network
Transforming growth factor–β (TGF-β) is a secreted cytochine that exerts an amazing diversity of
biological effects including proliferation, differentiation, migration and apoptosis. The superfamily
of TGF-β proteins comprises more than thirty members, the most important being TGF-β itself,

13
bone morphogenetic proteins (BMPs), activins and differentiation growth factors (GDFs).
(Massaguè J. 1998).
Considering the limited assortment of transmembrane receptors and downstream signaling
molecules, the pivotal nature of TGF-β asks for a great flexibility of the signaling cascade, this is
achieved thanks to a complex network of mechanisms that control the activation of TGF-β in the
extracellular space to modulate transcriptional activation in the nucleus.
The variability of this pathway is generated by cell and tissue-specific composition, interaction of
receptors, signal transducers, DNA-binding partners and finally the cross-talk with regulators from
other pathways.
TGF-β signal transduction: the basics
Three human isoforms of TGF-β (TGF-β1, TGF-β2, TGF-β3) are synthesized as large precursor
which is processed to obtain the mature protein. Bioactive TGF-β homodimers signal through
transmembrane serine/threonine kinase receptors designated as TGF-β Receptor type I (TBRI) and
type II (TβRII) (Frazen P. 1993). Initial binding to the constitutively active TβRII is followed by
recruitment of TβRI into a heteromeric complex. Subsequent transphosphorylation of TβRI at the
serine rich region, the so called GS-box, is mediated by TβRII and leads to activaton of TβRI.
Interestingly TβRI activation is not due to an increase of actual kinase activity but is rather based
on the creation of a binding site for Smad proteins which represent the substrates for TβRI (Huse
M. 2001). A key determinant of TβRI-Smad interaction is represented by a region located in the
kinase domain of TβRI called L45-loop. Within the L45-loop four amino acids that differ in TGF-β
and BMP type I receptors, confer specificity for distinct Smad isoform and thus separate TGF-β and
BMP pathways (Persson U. 1998).
14
Smad proteins can be divided into three subfamilies: receptor-activated Smads (R-Smads)
including BMP-activated Smads (smad1, Smad5 and Smad8) and TGF-β activated Smads (Smad2
and Smad3), the common mediator Smad4 (Co-Smad) and finally the inhibitory Smad6 and Smad7
(I-Smads) (Heldin C.-H. 1997). TβRI causes R-Smad phosphorylation at the C-terminal SSXS-motif
which is conserved among all R-Smads thereby causing dissociation from the receptor and
heteromeric complex formation with Smad4 (Massaguè J. 2000). Smad complexes translocate to
the nucleus, assemble with specific DNA-binding co-factors and co-modulators to finally activate
transcription. The choice of target genes is thereby determined by the composition of the
transcriptional complex.
The Transforming growth factor-β signaling receptors
In mammals only five type II receptors and seven type I receptors have been identified for ligand
belonging to the large TGF-β superfamily. They all are transmembrane receptors that contain an
intracellular serine/threonine kinase domain.
The most described signaling receptors for TGF-β are TGF-β type II receptors (TGF-βRII) and the
TGF-β type I receptor (TGF-βRI). In addition, two other TGF-β binding proteins called betaglycan
(or TGF-βRIII) and endoglin are frequenty involved in formation of receptor complexes and
function predominantly in ligand presentation. However as shown in table 1, the repertoire of
TGF-β receptors is supplemented by other receptors or splice variants of the receptors that are
also capable of transducing signals in response to TGF-β. Thus, signal diversity may be generated
by different receptor combinations.
In addition to TGF-β RI , there are other type I receptors such as ALK1 and ALK2 that transmit
signals evoked by TGF-β. Pathological relevance is reflected by the linkage of mutations in both the
endoglin and the ALK1 gene to an autosomal dominant disorder named hereditary hemorrhagic

15
teleangiectasia (HHT). Moreover ALK1 plays an important role during vascular development. ALK2
is similar to ALK1 because it binds TGF-β following interaction with TGF-β receptor II and an
accessory receptor and conveys the signal via the BMP-Smads, Smad1 and Smad5 respectively (Lai
Y.T., 2000).
Referring to type II receptors, it has a splice variant, TβRII-B which contains an insertion of 25
aminoacids in the extracellular part of the receptor and shows functional differences. An
outstanding physiological relevance for TβRII-B expression is therefore predicted for tissue such as
bone, in which TGF-β2 represents the major TGF-β isoform.
The major TGF-β-binding molecule on most cell type is TβRIII also called betaglycan, it is a
transmembrane proteoglycan that is able to bind all three TGF-β isoforms via two independent
binding sites in the core protein. TβRIII exerts its function in presenting TGF-β2 to TGF-βRII which
shows only low intrinsic affinity for TGF-β2. In contrast to the facilitation of ligand access to the
receptors, the soluble secreted domain of TGF-βRIII has antagonistic effects through binding and
sequestering the ligand. The short cytoplasmic domain is rich in serines and threonines which
represents suitable sites for phosphorylation. Indeed a previous report describes that
phosphorylation of the cytoplasmic domain by autophosphorylated TGF-βRII initiates the release
of TGF-βRIII from the active signaling complex, consisting in TGF-βRI and II and the bound ligand.
A receptor variant that cross-regulates pathways of different members of the TGF-β family is
represented by BMP and activin membrane bound inhibitor, this inhibitor is a pseudoreceptor
similar to type I receptor apart from the lacking cytoplasmic kinase domain. Its capacity to
associate with various type I receptor prevents the formation of functional homodimeric type I
receptor complexes and thus causes abrogation of BMP as well as TGF-β and activin–mediated
signaling.

16
In conclusion the repertoire of signaling receptors gives rise to multiple hetero-oligomeric
receptor complexes and each of the involved receptor variants depicts a distinct expression
pattern, ligand isoform specificity and ligand affinity, thus expanding signal diversity.
Distribution of different receptors
The overall distribution of the TGF-β receptors is functional to the formation of different
oligomeric units. TβRI, TβRII, TβRIII have all been found as homo-oligomers already in the absence
of TGF-β (Henis Y.I., 1994), in addition heteromeric complexes consisting of TβRII, TβRIII could be
detected in absence and in presence of TGF-β. Based on their affinity for each other, a small but
detectable proportion of TβRI-TβRII heteromeric receptor complexes exists in unstimulated cells.
The fraction of these heteromeric complexes is significantly increased by ligand binding to TβRII
which causes subsequent recruitment of TβRI.
The resulting tetrameric complexes consist of two molecules each of TβRI and TβRII and represent
the actual signaling entity (Luo K., 1997). Homomeric receptor complexes are not sufficient to
propagate TGF-β responses but are considered to be functionally important for regulating
receptor kinase activity, as reported in the case of intermolecular autophosphorylation at multiple
serine residues of TβRII (Luo K., 1996).
The ligand binding to TGF-β receptor triggers not only signaling but also initiates internalization of
both ligand and receptor, in fact in absence of TGF-β, receptors are constantly internalized and
recycled back to the membrane. Various proteins have been identified as capable of regulating
TGF-β signaling. The basal receptor activity is kept under tight control by immunophilin FKBP12
(Wang T.1994), by binding the unphosphorylated GS-box of TβRI, FKBP12 stabilizes a conformation
of TGF-βRI that is incapable of getting transphosphorylation by TGF-ΒR II thus preventing ligand-
independent signaling. Ligand binding to TGF-βRII however induces conformational changes that

17
lead to displacement of FKBP12 and subsequent TGF-βR I activation by TGF-βR II (Huse M., 2001).
Smad Anchor for Receptor Activation SARA has a binding domain for R-Smads and the C-terminal
part which directly interacts with the activated TGF-ΒR I. The cooperative binding of SARA proteins
enables the Smads phosphorylation by TGF-βR I which is followed by the dissociation of them from
SARA and formation of heteromeric complex with Smad4.
The Disabled-2 protein Dab2 (Hocevar B.A., 2001) facilitates TGF-β signaling by bridging the
receptors complex to the Smad proteins thanks to its N-terminal phosphotyrosine binding site PTB
that is likely to allow association to the MH2 domain of Smad2 and Smad3.
The TβRI-Associated Protein-1 TRAP-1 associates with Smad4 attracting the co-Smads to the
vicinity of receptors thus facilitating heteromeric complex formation between activated R-Smads
and Smad4.
Negative regulation of TGF-β signaling is achieved by the inhibitory Smad7 (Nakao A., 1997),
serine/threonine kinase receptor-associated protein STRAP or the Smad ubiquitination regulatory
factors Smurf1 and 2. Smad7 lacks the SSXS-motif and so it is not a substrate for TβRI but it stably
interacts with the activated receptor thereby competing with other R-Smads. STRAP was described
to interact with both TβRI and TβRII and stabilizes the binding between TβRI and Smad7. Smurf
proteins are bridged to the receptor by Smad7 and the ubiquitination of Smad7 leads to
subsequent proteasomal and lysosomal degradation of the complex containing Smad7 and the
TβRs.
Downstream effectors of TGF-β pathway: the Smad proteins
Smad proteins are so far the only known substrate for TβRs capable of transmitting the signal
directly from the receptors to the nuclear transcriptional machinery.

18
Members of Smad family can be subdivide on the basis of their structural and functional
properties: i) receptor activated Smads (R-Smads: Smad1, Smad5 and Smad8 (BMP activated);
Smad2 and Smad3 (TGF-β activated) that become phosphorylated by type I receptors, ii) common
mediator Smad (Co-Smad: Smad4) which oligomerizes with R-Smads and iii) the inhibitory Smads
(I-Smads: Smad6 and Smads7) which antagonize TGF-β or BMP signals by competing with R-Smads
for type I receptor activation (Massaguè J., 1998).
The overall structure of R-Smads and Co-Smads comprises the highly conserved N-terminal Mad
homology 1 domain, MH1, and the C-terminal Mad homology 2 domain, MH2, which form
globular structures, I-Smads contain the conserved MH2 domain but show little similarity in the N-
terminal (Itoh S., 2000). Smad proteins have no intrinsic enzymatic activity and exert their role
exclusively by protein-protein or DNA-protein interactions. The MH1 domain mediates
autoinhibition by physically interacting with the MH2 domain, impeding its function in the absence
of ligand, moreover the MH1 domain is necessary also for the ability to bind directly to DNA. The
crystal structure of Smad proteins reveal that MH1 domain contains the hairpin-loop which is
responsible for binding the DNA helix (Shi Y., 1998). Protein-protein interactions with transcription
factors such as ATF2, c-Jun, SP1 or TFE3 are also mediated by MH1. This is the domain containing
the nuclear localization signal NLS, for instance phosphorylation of Smad3 causes conformational
changes that exposes its NLS-like motif allowing interaction with importin-β and recognition by the
nuclear import machinery. Ligand-induced release of SARA unmasks the NLS motif and leads to
Smad nuclear translocation by a mechanism independent of importin-β but requiring the MH2
domain.
The cytoplasmic localization of Smad4 is based on active nuclear export signal NES, its nuclear
entry presupposes inactivation of NES which is achieved by hetero-oligomerization with R-Smads
(Pierreux C.E., 2000).

19
Recent publications suggest that Smad1 and Smad2 upon ligand induced phosphorylation
assemble to form a homotrimer which is stabilized by the MH2 domain of the neighbouring
monomer, however formation of heterotrimer is energetically favoured over the homotrimer
formation.
TGF-β induced activation of TGF-βRI is followed by transient interaction between TGF-βRI and R-
Smads which are phosphorylated in the last two serine residues within the C-terminal SSXS-motif,
consequently Smad proteins are released from their retention such as SARA, as well as TGF-βRI
and the affinity for Smad4 is increased. Several lines of evidence show that Smads are the
substrates also for the ERK subfamily of MAP kinases which are activated by the hepatocyte
growth factors or epidermal growth factors. Nuclear accumulation of Smad2 was demonstrated to
be affected by Ca2+
-calmodulin-dependent protein kinase II which triggers phosphorylation of
several serine residues of Smad proteins (Wicks S.J., 2000). Protein Kinase C activated by TGF-β,
provides a negative feedback by phosphorylating specific serine residues in the MH1 domain of
Smad3 thus precluding its ability to bind the DNA. Further cytoplasmic kinases mediating Smad
phosphorylation is the c-Jun N-terminal kinase JNK. TGF-β stimulates JNK and it leads to the
phosphorylation of Smad3 at sites other than the SSXS motif, facilitating the following
phosphorylation by TGF-βR I.
Several proteins negatively regulate TGF-β signaling , first of all inhibitory Smads rapidly induced
by TGF-β, block phosphorylation of Smads, second Smad binding proteins and transcriptional co-
repressors, third the Smurf proteins that target Smads for degradation, however the most obvious
mechanism is the dephosphorylation of R-Smads after prolonged TGF-β stimulation.

20
TGF-β and Mitochondrial function
A functional relationship between TGF-β signaling and mitochondria has already been established
by many different groups, for instance in regulating the intrinsic pathway of apoptosis. Gottfried et
al. demonstrated that ARTS, a proapoptotic protein localized in the mitochondria, is essential for
TGF-β-induced programmed cell death (Gottfried Y., 2004). In epithelial cell it has been observed
that TGF-β treatment causes generation of reactive oxygen species and the consequent loss of
mitochondrial membrane potential (Δψ) which leads to activate the programmed cell death
(Wang F., 2008). Clybouw et al. in 2008 showed that in early stages of tumor progression, TGF-β
mediates apoptosis of epithelial and hepatocyte cells by leading Bim (a proapoptotic member of
the BH3-only proteins) at the mitochondrial surface where it associates with Bcl-2 or Bcl-xL. The
sequestration of these prosurvival members of the Bcl-2 family by Bim allows the activation of the
apoptotic regulators Bax and Bak (Clybouw C., 2008). Moreover mutations in specific TGF-β family
members proved to be linked to altered mitochondrial energy metabolism and oxygen
consumption rate. (Liunan L., 2009).
Recently a new potential role has been demonstrated for TGF-β in the impairment of normal
mobilization of intracellular Ca2+
stores (McGowan T.A., 2000), prior studies showed the reduction
in IP3R1 Ca2+
release in diabetic aortic and proglomerular smooth muscle cells which is indeed
mediated by TGF-β (Sharma K., 2003). Thus the impairment of vascular cell dysfunction has been
directly linked to the IP3 –cytoplasmic Ca2+
signaling.
A key aspect of endoplasmic reticulum (ER) Ca2+
release is its coupling with the mitochondria
(Rizzuto R. and Pozzan T., 2006) and Ca2+
mobilized through the IP3 receptors or ryanodine
receptors is effectively transferred to the mitochondria and stimulates, in the mitochondrial
matrix, the ATP production.

21
Mitochondrial Ca2+
uptake exerts positive and negative feedback effects on the IP3 receptor-
mediated ER Ca2+
mobilization and affects SERCA pump-mediated ER Ca2+
reuptake. Moreover
mitochondrial Ca2+
uptake regulates the mitochondrial phase of cell death, thus a well described
binding between Ca2+
overload in the mitochondrial matrix and the activation of the apoptotic
process has been already understood. Since TGF-β has been implicated as a key factor in many
cellular processes, many different groups have been doing great efforts to understand the
mechanism by which TGF-β may affect ER-mitochondrial communication.

22
AIMS
In the present study we observed a close relationship between the presence of the downstream
effectors of TGF-β cascade in specific mitochondrial functional sites and the shaping of
mitochondrial calcium homeostasis. Mitochondria can sense microdomains of high [Ca2+
] thanks
to their close proximity to the ER. Recent work has demonstrated that the subcellular fraction
denominated Mitochondria-Associated Membranes (MAMs) may correspond to this signaling
domain which happen to be enriched in Ca2+
channels and regulatory proteins. The Transforming
growth factor-β is known to have crucial roles in the regulation of cell proliferation, differentiation
and apoptosis. The downstream effectors of TGF-β signaling are intracellular proteins called Smads
that hetero-oligomerize after phosphorylation and subsequently migrate into the nucleus to
influence gene expression. While much progress has been made in understanding TGF-β
regulation of gene expression, the subcellular distribution of Smad proteins and their nuclear-
independent activity are still incompletely understood.
We have investigated the effect of the TGF-β signaling on intracellular Ca2+
homeostasis. The
results showed that Smad2/3, both in HeLa cells and in liver preparations, are present in
mitochondria, with a specific enrichment in the MAM fraction. Such a distribution may underlie a
direct, transcription-independent role in the modulation of the ER/mitochondria Ca2+
cross-talk.
This possibility has been directly investigated using aequorin-based recombinant probes targeted
to the mitochondria, the ER and the cytosol. Specifically, we observed that treatment with
inhibitors of the TGF-β receptor family, such as SB431542 and Dorsomorphin (Compound C)
reduces agonist-dependent increases of mitochondrial Ca2+
concentration [Ca2+
]m, while leaving

23
the cytosolic responses unaffected. The effects were observed also upon inhibition of protein
synthesis, thus ruling out the possibility that they are due to alterations of the expression levels of
Ca2+
transporters. The same effects were observed by shRNA silencing of Smads, thus involving
these TGF-β transducers in the mitochondrial effects. Work is currently under way to identify the
mechanism of the Ca2+
signalling alterations (intrinsic desensitization of the MCU, reduction of the
electrochemical driving force, etc.).
Altogether, these data demonstrate that also the TGF-β signaling pathway converges on
mitochondrial checkpoint, clustering intracellular transducers in critical signaling domains and
modulating Ca2+
loading and the sensitivity to growth-promoting and apoptotic challenges.

24
MATERIALS AND METHODS
Aequorin: a Ca2+
sensitive probe
Aequorin is a 21 KDa protein isolated from jellyfish of the genus Aequorea which emits blue light
in presence of calcium ions. The aequorin originally purified from jellyfish is a mixture of different
isoforms called “heterogeneous aequorin” (Shimomura O., 1986). In its active form the
photoprotein includes an apoprotein and a covalently bound prosthetic group, coelenterazine.
When calcium ions bind to the three high affinity EF hand sites, coelenterazine is oxidized to
coelenteramide, with a concomitant release of carbon dioxide and emission of light.
Although this reaction is irreversible, in vitro an active aequorin can be obtained by incubating the
apoprotein with coelenterazine in the presence of oxygen and 2-mercaptoethanol. Reconstitution
of an active aequorin (expressed recombinantly) can be obtained also in living cells by simple
addition of coelenterazine to the medium. Coelenterazine is highly hydrophobic and has been
shown to permeate cell membranes of various cell types, ranging from the slime mold
Dictyostelium discoideum to mammalian cells and plants.
Different coelenterazine analogues have been synthesized that confer to the reconstituted protein
specific luminescence properties (Shimomura O., 1993). A few synthetic analogues of
coelenterazine are now commercially available from Molecular Probes.
The possibility of using aequorin as a calcium indicator is based on the existence of a well
characterized relationship between the rate of photon emission and the free Ca2+
concentration.
For physiological conditions of pH, temperature and ionic strength, this relationship is more than
quadratic in the range of [Ca2+
] 10-5
-10-7
M. The presence of 3 Ca2+
binding sites in aequorin is

25
responsible for the high degree of cooperativity, and thus for the steep relationship between
photon emission rate and [Ca2+
]. The [Ca2+
] can be calculated from the formula L/Lmax, where L is
the rate of photon emission at any instant during the experiment and Lmax is the maximal rate of
photon emission at saturating [Ca2+
]. The rate of aequorin luminescence is independent of [Ca2+
]
at very high (>10-4
M) and very low [Ca2+
] (< 10-7
M). However, as described below in more details,
it is possible to expand the range of [Ca2+
] that can be monitored with aequorin. Although
aequorin luminescence is not influenced either by K+ or Mg
2+ (which are the most abundant
cations in the intracellular environment and thus the most likely source of interference in
physiological experiments) both ions are competitive inhibitors of Ca2+
activated luminescence.
Aequorin photon emission can be also triggered by Sr2+
but its affinity is about 100 fold lower than
that of Ca2+
, while lanthanides have high affinity for the photoprotein (e.g. are a potential source
of artifacts in experiments where they are used to block Ca2+
channels). pH was also shown to
affect aequorin luminescence but at values below 7. Due to the characteristics described above,
experiments with aequorin need to be done in well-controlled conditions of pH and ionic
concentrations.
Recombinant aequorins. For a long time the only reliable way of introducing aequorin into living cells has been that of
microinjecting the purified protein. This procedure is time consuming and laborious and requires
special care in handling of the purified photoprotein. Alternative approaches (scrape loading,
reversible permeabilization, etc.) have been rather unsuccessful. The cloning of the aequorin gene
has opened the way to recombinant expression and thus has largely expanded the applications of
this tool for investigating Ca2+
handling in living cells. In particular, recombinant aequorin can be
expressed not only in the cytoplasm, but also in specific cellular locations by including specific
targeting sequencing in the engineered cDNAs. Extensive manipulations of the N-terminal of

26
aequorin have been shown not to alter the chemiluminescence properties of the photoprotein
and its Ca2+
affinity. On the other hand, even marginal alterations of the C-terminal either abolish
luminescence altogether or drastically increase Ca2+
independent photon emission. As
demonstrated by Watkins and Campbell, the C-terminal proline residue of aequorin is essential for
the long-term stability of the bound coelenterazine (Watkins N.J., and Campbell A.K., 1993). For
these reasons, all targeted aequorins synthesized in our laboratory include modifications of the
photoprotein in the N-terminal. Three targeting strategies have been adopted:
1. Inclusion of a minimal targeting signal sequence to the photoprotein cDNA. This strategy was
initially used to design the mitochondrial aequorin and was followed also to synthesize an
aequorin localized in the nucleus and in the lumen of the Golgi apparatus.
2. Fusion of the cDNA encoding aequorin to that of a resident protein of the compartments of
interest. This approach has been used to engineer aequorins localized in the sarcoplasmic
reticulum (SR), in the nucleoplasm and cytoplasm (shuttling between the two compartments
depending on the concentration of steroid hormones), on the cytoplasmic surface of the
endoplasmic reticulum (ER) and Golgi and in the subplasmalemma cytoplasmic rim.
3. Addition to the aequorin cDNA of sequences encoding for polypeptides that bind to
endogenous proteins. This strategy was adopted to localize aequorin in the ER lumen. We
routinely included in all the recombinant aequorins the HA1 epitope-tag that facilitates the
immunocytochemical localization of the recombinant protein in the cell.
Chimeric aequorin cDNAs Below we briefly describe the constructs produced in our laboratory. A few other constructs have
been produced in other laboratories and will not be dealt with in detail here.
Cytoplasm (cytAEQ): an unmodified aequorin cDNA encodes a protein that, in mammalian cells is
located in the cytoplasm and, given its small size, also diffuses into the nucleus. An alternative

27
construct is also available that is located on the outer surface of the ER and of the Golgi apparatus.
This construct was intended to drive the localization of aequorin to the inner surface of the plasma
membrane given that it derives from the fusion of the aequorin cDNA with that encoding a
truncated metabotropic glutamate receptor (mgluR1). The encoded chimeric protein, however,
remains trapped on the surface of the ER and Golgi apparatus, with the aequorin polypeptide
facing the cytoplasmic surface of these organelles. The cytoplasmic signal revealed by this chimeric
aequorin is indistinguishable from that of a cytoplasmic aequorin, but it has the advantage of
being membrane bound and excluded from the nucleus.
Mitochondria (mtAEQ): mtAEQ was the first targeted aequorin generated in the laboratory, which
has been successfully employed to measure [Ca2+
] of mitochondrial matrix of various cell types.
This construct includes the targeting presequence of subunit VIII of human cytochrome c oxidase
fused to the aequorin cDNA.
Endoplasmic Reticulum (erAEQ):The erAEQ includes the leader (L), the VDJ and Ch1 domains of an
Ig2b heavy chain fused at the N-terminal of aequorin. Retention in the ER depends on the
presence of the Ch1 domain that is known to interact with high affinity with the luminal ER protein
BiP.
To expand the range of Ca2+
sensitivity that can be monitored with the different targeted
aequorins we have also employed in many of our constructs a mutated form of the photoprotein
(asp119 → ala). This point mutation affects specifically the second EF hand motive of wild type
aequorin. The affinity for Ca2+
of this mutated aequorin is about 20 fold lower than that of the wild
type photoprotein. Chimeric aequorins with the mutated isoform are presently available for the
cytoplasm, the mitochondrial matrix, the ER and SR, the Golgi apparatus and the sub-
plasmamembrane region.

28
Cell preparation and transfection
Although in a few cases the aequorin cDNA has been microinjected, the most commonly employed
method to obtain expression of the recombinant protein is transfection. Different expression
plasmids have been employed, some commercially available (pMT2, pcDNAI and 3) other have
been kindly provided by colleagues. The calcium phosphate procedure is by far the simplest and
less expensive and it has been used successfully to transfect a number of cell lines, including HeLa,
L929, L cells, Cos 7, A7r5 and PC12 cells, as well as primary cultures of neurons and skeletal muscle
myotubes. Other transfection procedures have been also employed, such as liposomes, the “gene
gun” and electroporation. Viral constructs for some aequorins are also available (Alonso M.T.
1998; Rembold C.M., 1997). In this section we briefly describe the calcium phosphate procedure, a
simple and convenient transfection method for HeLa cells.
One day before the transfection step, HeLa cells mantained in Dulbecco Modified Eagle’s Medium
(DMEM) supplemented with 10% Fetal Bovine serum (FBS) are plated on a 13 mm round coverslip
at 30-50% confluence. Just before the transfection procedure, cells are washed with 1 ml of fresh
medium.
Calcium-Phosphate transfection procedure
The following stock solutions need to be prepared and conserved at -20°C until used: CaCl2 2.5 M,
HEPES Buffered Solution (HBS): NaCl 280mM, Hepes 50 mM, Na2HPO4 1.5 mM, pH 7.12, Tris-EDTA
(TE): Trizma-base 10mM, EDTA 1mM, pH 8.
All solutions are sterilized by filtration using 0.22 μm filters. For one coverslip, 5 μl of CaCl2 2.5 M
are added to the DNA dissolved in 45 μl of TE. Routinely, 4 μg of DNA are used to transfect one
coverslip. The solution is then mixed under vortex with 50 μl of HBS and incubated for 20 to 30
minutes at room temperature. The cloudy solution is then added directly to the cell monolayer.
18-24 hours after addition of the DNA, cells are washed with PBS (2 or 3 times until the excess

29
precipitate is completely removed). Using this protocol the transfected cells are usually between
30 and 50 %. Although an optimal transfection is obtained after an overnight incubation, we found
that a substantial aequorin expression, sufficient for most experimental conditions, is obtained
also with an incubation of only 6 hours with the Ca2+
-phosphate-DNA complex.
Reconstitution of functional aequorin
Once expressed, the recombinant aequorin must be reconstituted into the functional
photoprotein. This is accomplished by incubating cells with the synthetic coelenterazine for
variable periods of time (usually 1-3 hours) and under conditions of temperature and [Ca2+
] that
depend on the compartment investigated. Practically, coelenterazine is dissolved at 0.5 mM in
pure methanol as a 100X stock solution kept at - 80°C. This solution tolerates several freeze-thaw
cycles.
However, we recommend the supply of coelenterazine solution to be split into small aliquots (50
μl). Coelenterazine must be protected from light.
For compartments with low [Ca2+
] under resting conditions (cytosol and mitochondria) the cells
transfected with the appropriate recombinant aequorins are simply incubated at 37°C in fresh
DMEM medium supplemented with 1% FBS and 5 μM coelenterazine. Higher or lower
coelenterazine concentrations can be also used, if necessary. Good reconstitution is achieved with
1hour incubation, but an optimal reconstitution requires 2 hours.
For compartments endowed with high [Ca2+
] under resting conditions (ER), to obtain good
reconstitution and interpretable data it is first necessary to reduce the [Ca2+
] in the organelle,
otherwise aequorin would be immediately consumed after reconstitution and in steady state little
functional photoprotein would be present in cells. Depletion of Ca2+
from the organelles can be
achieved in different ways. Here we describe a simple protocols: cells are incubated at 37°C for 5
minutes in KRB solution (Krebs-Ringer modified buffer: 125 mM NaCl, 5mM KCl, 1mM Na3PO4,

30
1mM MgSO4, 5.5 mM glucose, 20 mM Hepes, pH 7.4) supplemented with 600 μM EGTA, 10 μM
ionomycin). After washing with KRB containing 100 μM EGTA and 5% bovine serum albumin, cells
are further incubated in the same medium supplemented with 5 μM coelenterazine for 1 hour,
but at 4°C.
Slight variations in these depletion protocols have been used both by our group and other
investigators. Here it is necessary to stress a few general aspect of the procedure: i) the more
efficient the Ca2+
depletion, the better the reconstitution; ii) some compartments (e.g. the Golgi
and in part the ER) can deeply morphologically altered by the Ca2+
depletion protocol. The
incubation at 4°C largely prevents these morphological changes, without altering the efficacy of
the reconstitution; iii) if ionophores or SERCA inhibitors are employed for depletion they must be
removed completely before starting the experiment. For this reason extensive washing of the cell
monolayer with Bovine Serum Albumin (BSA) is recommended at the end of the reconstitution
procedure.
Luminescence detection The aequorin detection system is derived from that described by Cobbold and Lee and is based on
the use of a low noise photomultiplier placed in close proximity (2-3 mm) of aequorin expressing
cells. The cell chamber, which is on the top of a hollow cylinder, is adapted to fit 13-mm diameter
coverslip. The volume of the perfusing chamber is kept to a minimum (about 200 μl). The chamber
is sealed on the top with a coverslip, held in place with a thin layer of silicon. Cells are continuosly
perfused via a peristaltic pump with medium thermostated via a water jacket at 37°C. The
photomultiplier (EMI 9789 with amplifier-discriminator) is kept in a dark box and cooled at 4°C.
During manipulations on the cell chamber, the photomultiplier is protected from light by a shutter.
During aequorin experiments, the shutter is opened and the chamber with cells is placed in close
proximity of the photomultiplier. The output of the amplifier-discriminator is captured by an
31
EMIC600 photon-counting board in an IBM compatible microcomputer and stored for further
analysis.
Ca2+ measurement
For the cells transfected with cytosolic, mitochondria or nuclear aequorins, the coverslip with the
transfected cells is transferred to the luminometer chamber and it is perfused with KRB saline
solution in presence of 1 mM CaCl2 to remove the excess coelenterazine. The stimuli or drugs to
test are added to the perfusing medium and reach the cells with a lag time that depends on the
rate of the flux and the length of the tubes. In order to make the stimulation more rapid and
homogeneous the rate of the peristaltic pump is set to its maximum speed. Under these
conditions we calculated that the whole monolayer is homogeneously exposed to the stimuli in 2
sec. At the end of the experiments, all the aequorin is discharged by permeabilizing the cells using
a hypotonic solution containing digitonin (100 μM) and CaCl2 (10 mM).
For erAEQ transfected cells, unreacted coelenterazine and drugs are removed by prolonged
perfusion (3-6 min) with a saline solution containing 600 μM EGTA and 2% BSA. BSA is then
removed from the perfusion buffer and the refilling of the compartments is started by perfusing
the medium containing 1mM CaCl2. To note that BSA increases luminescence background level.
We found that, despite the depletion protocol and the use of a low Ca2+
affinity aequorin mutant,
the rate of aequorin consumption upon Ca2+
refilling is so rapid that most aequorin is consumed in
30 sec and the calibration of the signal in terms of [Ca2+
] becomes unreliable. Two alternative
solutions to this problem have been developed, i) the use of Sr2+
as a Ca2+
surrogate and ii) the
reconstitution not with the wild type coelenterazine, but with the analogue coelenterazine n that
reduces the rate of aequorin photon emission at high [Ca2+
]. In the latter case [Ca2+
] between 10-4
and 10-3
M can be reliably calibrated (Robert V., 1998).
32
Conversion of the luminescent signal into [Ca2+]
To transform luminescence values into [Ca2+
] values, we have used the method described by Allen
and Blink. The method relies on the relationship between [Ca2+
] and the ratio between the light
intensity recorded in physiological conditions (L, counts/s) and that which would have been
reported if all the aequorin was instantaneously exposed to saturating [Ca2+
] (Lmax). Given that the
constant rate of aequorin consumption at saturating [Ca2+
] is 1.0 s-1
, a good estimate of Lmax can be
obtained from the total aequorin light output recorded from the cells after discharging all the
aequorin. This usually requires the addition of excess Ca2+
and detergents as shown in the previous
section. As aequorin is being consumed continuously, it must be stressed that, for calibration
purposes, the value of Lmax is not constant and decreases steadily during the experiment. The value
of Lmax to be used for [Ca2+
] calculations at every time point along the experiment should be
calculated as the total light output of the whole experiment minus the light output recorded
before that point.
The relationship between the ratio (L/Lmax) and [Ca2+
] has been modeled mathematically.
The model postulates that each of the Ca2+
binding sites has two possible states, T and R and that
light is emitted when all the sites are in the R state. Ca2+
is assumed to bind only in the R state.
This model contains three parameters: KR, the Ca2+
association constant, KTR= [T]/[R], and n, the
number of Ca2+
binding sites. The values we obtained for the recombinantly expressed aequorin
for each parameter are: KR = 7.23 106 M
-1, KTR = 120, n=3. The equation for the model provides
the algorithm we used to calculate the [Ca2+
] values at each point where Ratio is (L/Lmax)1/n.
Ca2+
(M) = Ratio + (Ratio x KTR)-1
KR – (Ratio x KR)

33
Imaging techniques
All imaging experiments were carried out on Zeiss Axiovert 200 inverted microscopes, equipped
with cooled CCD digital cameras. Z-series of images were acquired at 0.5 μm distance,
deconvolved using a custom-made algorithm and 3D reconstructed as described previously
(Carrington W.A., 1995; Rizzuto R., 1998b).
ATP measurements
Luciferase assay was carried out, as previously described. (Jouaville L. S. 1999). In brief, HeLa cells
(50,000-70,000 per coverslip) were transfected with mitochondrial targeted luciferase (mtLUC)
according to a standard calcium-phosphate procedure.
24 hours after transfection, the coverslip with the cells was transferred to the 37°C termostated
chamber of a luminometer and perfused with a Krebs Ringer Buffer containing: 125mM NaCl,
5mM KCl, 1mM Na3PO4, 1mM MgSO4, 20μM Luciferin, 20mM Hepes, 5,5 mM Glucose (pH7,4).
Luminescence is entirely dependent on the continuosly provided luciferin and proportional to its
concentration between 20 and 200 μM. After a preliminary phase of equilibration, during which
light emission of mitochondrial luciferase transfected cells was in the range of 14000-16000 cps
versus a background lower than 10 cps, cellular response was evoked by the agonist Histamine
100μM added to the perfusion medium.
Subcellular fractionation and proteomic analysis
HeLa cells and mouse liver were homogenized, and crude mitochondrial fraction (8,000g pellet)
was obtained. Mouse tissue was subjected to separation on a 30% self-generated Percoll gradient
as described previously (Vance J.E., 1990). A low-density band (denoted as MAM fraction) was
collected and analysed by immunoblotting. For SDS-PAGE analysis of MAM fraction proteins 10 μg
proteins were loaded on 10% SDS-polyacrilamyde gels. The antibodies used were: αIP3R3, isotype

34
specific monoclonal antibody, 1:1000, Cell Signaling; αVDAC2, 1:1000 Molecular Probe; Smad2/3
monoclonal antibody 1:1000, Cell Signaling, phospho-Smad3 1:1000 monoclonal antibody, Cell
Signaling; αActin 1:10000 Cell Signaling; Sigma Receptor 1, 1:1000 monoclonal antibody, Sigma.
The pSUPER RNAi system
In several organisms, introduction of double-stranded RNA has proven to be a powerful tool to
suppress gene expression through a process known as RNA interference. However, in most
mammalian cells this provokes a strong cytotoxic response. This non-specific effect can be
circumvented by use of synthetic short [21- to 22-nucleotide] interfering RNAs (siRNAs), which
can mediate strong and specific suppression of gene expression. However, this reduction in gene
expression is transient, which severely restricts its applications. To overcome this limitation, the
pSUPER RNAi system provides a mammalian expression vector that directs intracellular synthesis
of siRNA-like transcripts. The vector uses the polymerase-III H1-RNA gene promoter, as it produces
a small RNA transcript lacking a polyadenosine tail and has a well-defined start of transcription
and a termination signal consisting of five thymidines in a row (T5). Most important, the cleavage
of the transcript at the termination site is after the second uridine, yielding a transcript resembling
the ends of synthetic siRNAs, which also contain two 3’ overhanging T or U nucleotides. The
pSUPER RNAi System has been used to cause efficient and specific down-regulation of gene
expression, resulting in functional inactivation of the targeted genes. Stable expression of siRNAs
using this vector mediates persistent suppression of gene expression, allowing the analysis of loss-
of-function phenotypes that develop over longer periods of time. To effect the silencing of a
specific gene, the pSUPER vector is used in concert with a pair of custom oligonucleotides that
contain, among other features, a unique 19-nt sequence derived from the mRNA transcript of the
gene targeted for suppression (the “N-19 target sequence”).
35
The N-19 target sequence corresponds to the sense strand of the pSUPER-generated siRNA, which
in turn corresponds to a 19-nt sequence within the mRNA. In the mechanism of RNAi, the
antisense strand of the siRNA duplex hybridizes to this region of the mRNA to mediate cleavage of
the molecule. The technical procedure is summarized in the following paragraph.
>> Step One: Anneal Oligos
Two custom DNA oligonucleotides were dissolved in sterile, nuclease-free H2O to a concentration
of 3 mg/ml. The annealing reaction was assembled by mixing 1 μl of each oligo (forward and
reverse) with 48 μl annealing buffer (100 mM NaCl and 50 mM HEPES pH 7.4) and incubated at
90°C for 4 minutes, and then at 70°C for 10 minutes. Slowly the annealed oligos were cooled to
10°C.
>> Step Two: Linearize the Vector
1 μl of the pSUPER vector was linearized with Bgl II and Hind III restriction enzymes, then the
reaction was heat inactivated (raising the temperature to 65 or 80°C for 20 minutes). Following
digestion, purification of the linearized vector, on a 1% agarose gel, was performed to remove the
fragment, and to help to separate the prep from any undigested circular plasmid and to decrease
the background in ligation and transformation.
>> Step Three: Ligation into pSUPER Vector
For the ligation 2 μl of the annealed oligos, 1μl of T4 DNA ligase buffer, 1μl pSUPER vector, 5μl
nuclease-free H2O, and 1μl T4 DNA ligase were assembled and incubated overnight at room
temperature. A negative control cloning reaction was performed with the linearized vector alone
and no insert.
>>Step Four: Transformation in Bacteria
Recombinant pSUPER vector was transformed into competent cells. In order to monitor the
efficiency of the transformation steps, as a negative control, cells should also be transformed
either with a vector that has been ligated with a scrambled-base hairpin oligo, or with a circular
vector containing no oligo insert. Bacteria were grown in amp-agarose plates overnight (16-24
hrs), then colonies were chosen for additional cycle in an ampicilin broth. Finally we checked the
36
presence of positive clones by digesting with EcoRI and Hind III. After digestion, we determine our
results as follows:
Positive clone: vector with insert of 281 bp
Negative clone: vector with insert of 227 bp
In addition, the presence of the correct insert within recombinant pSUPER vector was confirmed
by sequencing prior to transfection in mammalian cells.
High-throughput assay based on a SiRNAs Library
A custom siRNA library targeting 750 human kinases with three fold redundancy was obtained
from Ambion Inc. and the three siRNA duplexes for each target were individually arrayed in 96-
well format. A stable clone of HeLa cells overexpressing mitochondrial targeted aequorin probe
was exploited. Cells were seeded on 96-well plates at density of 10000 cells per well and cultured
overnight at 37°C. 24 hours post-seeding cells were transfected with 50nM siRNA using
Lipofectamine 2000 reagent. Forty-eight hours after transfection, thanks to the MicroBeta
multiplate reader, cells were challenged with histamine 50μM and mitochondrial calcium
transients were measured.
37
RESULTS
High throughput screen of human kinases for the identification of new regulators of
mitochondrial calcium signaling
To establish the role of protein kinases in mitochondrial calcium signaling we designed a functional
assay based on RNA interference to perform a genetic screen using small interfering RNA (siRNA)
targeting the complete array of human kinases. HeLa cells were systematically co-transfected with
the mitochondrially targeted probe aequorin and siRNAs using a kinome library comprising 750
kinases at three fold redundancy. 48 hours post transfection HeLa cells were measured by the
multi detector system MicroBeta JET based on the biolumiscent reaction of Aequorin. The
aequorin photoprotein undergoes a bioluminescent reaction in the presence of calcium ions,
producing a flash of light at 469 nm. This wavelength correlates well with the maximum efficiency
of the photo-multiplier tubes used in the MicroBeta.
aequorin + Ca2+
–> apoaequorin + coelenteramide + CO2 + light (469nm)
The effect of each siRNA was compared with that of a validate one (VDAC2 siRNA) and that of a
scrambled sequence, both of them were transfected on each single plate and measured along with
the respective samples.

38
Figure 1
Fig. 1 MicroBeta® JET is a multi-detector instrument designed for liquid scintillation or luminescence detection of
samples in microplates, tubes or on filters. MicroBeta JET also includes one or more reagent injectors for measuring
prompt (or ‘flash’) reactions. Multi-detector versions of the instrument can have one or two Injector Modules installed
to measure one or two injection and counting sequences.
The single detector MicroBeta JET can have up to four Injector Modules.
Calcium transients were measured in HeLa cells, after reconstitution with the aequorin co-factor
coelenterazine, cells were challenged with histamine 100 μM and luminescence was measured
and converted in numbers representing the percentage of probe consumption after agonist
stimulation, this number was transformed in a percentage of variation of each sample compared
to the scrambled siRNA spotted on each plate and Library samples are shown in Table1. Table 1
contains proteins which the three siRNA sequences exert the same effect on mitochondrial
calcium uptake, 217 kinases, (28.9% of the entire array) among them the 4.1% shows an increasing
in calcium uptake more than 20% while the 37.8% reduces it more than 20% (Fig.2). For 186
(24.8%) human kinases only two siRNA sequences out of three showed consistent effects on
mitochondrial calcium signaling, the third one producing no effect at all. The last subgroup of 347

39
(46.26%) kinases consisted in those with no reproducible effect on calcium transients (data not
shown).
Table1
Plate_N° Row Col Symbol % varsiRNA/scrambled full_name locus_link_id
17 B 4 TLK1 -50.7 tousled-like kinase 1 9874 11 C 2 EPHB2 -48.0 EphB2 2048 11 C 1 EPHB1 -43.0 EphB1 2047
11 C 10 FGFR1 -42.4
fibroblast growth factor receptor 1 (fms-related tyrosine kinase 2, Pfeiffer syndrome) 2260
11 B 1 DDR1 -40.5 discoidin domain receptor family, member 1 780
11 H 3 TXK -40.2 TXK tyrosine kinase 7294 11 B 9 EPHA5 -39.7 EphA5 2044 11 C 4 EPHB4 -39.6 EphB4 2050
4 G 6 C14orf20 -39.4
chromosome 14 open reading frame 20 283629
9 A 4 STK4 -37.2 serine/threonine kinase 4 6789
11 B 4 EGFR -36.5
epidermal growth factor receptor (erythroblastic leukemia viral (v-erb-b) oncogene homolog, avian) 1956
12 H 10 ACVRL1 -36.2
activin A receptor type II-like 1 94
11 H 6 YES1 -36.2 v-yes-1 Yamaguchi sarcoma viral oncogene homolog 1 7525
11 B 11 EPHA8 -35.6 EphA8 2046
9 A 2 STK3 -35.0 serine/threonine kinase 3 (STE20 homolog, yeast) 6788
11 B 7 EPHA3 -34.9 EphA3 2042
11 B 2 DDR2 -34.1 discoidin domain receptor family, member 2 4921
7 B 4 CDKL2 -33.8 cyclin-dependent kinase-like 2 (CDC2-related kinase) 8999
7 C 6 ERK8 -33.7 225689 11 C 5 EPHB6 -33.2 EphB6 2051
9 A 1 STK25 -33.1 serine/threonine kinase 25 (STE20 homolog, yeast) 10494
11 B 6 EPHA2 -32.6 EphA2 1969
17 C 1 PRKWNK3 -31.6
protein kinase, lysine deficient 3 65267
16 G 5 NEK11 -31.4 NIMA (never in mitosis gene a)- related kinase 11 79858
11 B 3 STYK1 -31.3 55359
11 D 4 FLT1 -31.2
fms-related tyrosine kinase 1 (vascular endothelial growth factor/vascular permeability factor receptor) 2321
16 G 1 KIS -30.3 127933

40
16 D 7 ASB10 -30.3 ankyrin repeat and SOCS box-containing 10 136371
11 C 9 FER -30.2
fer (fps/fes related) tyrosine kinase (phosphoprotein NCP94) 2241
4 F 5 CAMK4 -30.2 calcium/calmodulin-dependent protein kinase IV 814
4 F 6 CASK -29.9
calcium/calmodulin-dependent serine protein kinase (MAGUK family) 8573
17 B 8 ULK1 -29.7 unc-51-like kinase 1 (C. elegans) 8408
11 C 3 EPHB3 -29.6 EphB3 2049
11 C 11 FGFR2 -29.4
fibroblast growth factor receptor 2 (bacteria-expressed kinase, keratinocyte growth factor receptor, craniofacial dysostosis 1, Crouzon syndrome, Pfeiffer syndrome, Jackson-Weiss syndrome) 2263
11 H 8 INSRR -29.4 insulin receptor-related receptor 3645
7 C 7 HIPK4 -28.9 homeodomain interacting protein kinase 4 147746
16 D 11 TP53RK -28.9 TP53 regulating kinase 112858
7 B 8 CLK2 -28.8 CDC-like kinase 2 1196
11 H 5 TYRO3 -28.5 TYRO3 protein tyrosine kinase 7301
21 B 3 PKLR -28.5 pyruvate kinase, liver and RBC 5313
11 B 5 EPHA1 -28.4 EphA1 2041
7 B 6 CDKL5 -28.0 cyclin-dependent kinase-like 5 6792
13 D 1 ZAK -28.0 51776 7 B 10 CLK4 -28.0 CDC-like kinase 4 57396
8 G 4 MAP3K8 -27.8
mitogen-activated protein kinase kinase kinase 8 1326
11 H 7 FES -27.4 feline sarcoma oncogene 2242
5 A 5 PRKAA1 -27.3
protein kinase, AMP-activated, alpha 1 catalytic subunit 5562
13 C 1 MAP3K13 -26.8
mitogen-activated protein kinase kinase kinase 13 9175
13 C 2 MAP3K7 -26.7
mitogen-activated protein kinase kinase kinase 7 6885
4 G 5 KIAA1811 -26.3 84446
11 D 10 IGF1R -26.2 insulin-like growth factor 1 receptor 3480
7 D 1 ICK -26.1 intestinal cell (MAK-like) kinase 22858
20 D 3 FLJ10842 -26.1 55750
16 H 5 PIK3R4 -25.9 phosphoinositide-3-kinase, regulatory subunit 4, p150 30849
11 D 2 FGFR4 -25.8 fibroblast growth factor receptor 4 2264

41
7 D 9 MAPK14 -25.1
mitogen-activated protein kinase 14 1432
16 D 9 BUB1 -25.1
BUB1 budding uninhibited by benzimidazoles 1 homolog (yeast) 699
7 B 7 CLK1 -25.0 CDC-like kinase 1 1195
4 H 7 MKNK1 -25.0 MAP kinase interacting serine/threonine kinase 1 8569
26 D 7 T3JAM -24.7 80342
7 A 8 CDK4 -24.4 cyclin-dependent kinase 4 1019
16 D 6 AAK1 -24.3 AP2 associated kinase 1 22848
4 F 8 CAMK1D -24.1
calcium/calmodulin-dependent protein kinase ID 57118
4 G 4 KIAA0999 -22.8 23387
20 B 6 CKB -22.7 creatine kinase, brain 1152
5 B 6 STK17B -22.4
serine/threonine kinase 17b (apoptosis-inducing) 9262
13 D 3 ANKK1 -22.4 ankyrin repeat and kinase domain containing 1 255239
5 B 7 STK22B -22.4
serine/threonine kinase 22B (spermiogenesis associated) 23617
5 G 1 CDC2L1 -22.3
cell division cycle 2-like 1 (PITSLRE proteins) 984
21 B 2 PRKD2 -22.2 25865
13 C 3 MFHAS1 -22.1
malignant fibrous histiocytoma amplified sequence 1 9258
16 G 7 NEK3 -22.0 NIMA (never in mitosis gene a)-related kinase 3 4752
13 C 11 TGFBR2 -22.0
transforming growth factor, beta receptor II (70/80kDa) 7048
11 C 8 ERBB4 -21.9
v-erb-a erythroblastic leukemia viral oncogene homolog 4 (avian) 2066
25 C 5 CDKN2D -21.5
cyclin-dependent kinase inhibitor 2D (p19, inhibits CDK4) 1032
5 B 3 SNRK -21.4 54861
4 F 2 CAMK2B -21.4
calcium/calmodulin-dependent protein kinase (CaM kinase) II beta 816
13 C 10 TGFBR1 -21.3
transforming growth factor, beta receptor I (activin A receptor type II-like kinase, 53kDa) 7046
5 A 6 PRKAA2 -21.2
protein kinase, AMP-activated, alpha 2 catalytic subunit 5563
5 C 7 LOC91807 -20.8 91807
11 D 5 FLT3 -20.7 fms-related tyrosine kinase 3 2322
17 B 3 TEX14 -20.0 testis expressed sequence 14 56155
7 B 9 CLK3 -19.8 CDC-like kinase 3 1198
17 A 3 PRKWNK2 -18.4
protein kinase, lysine deficient 2 65268
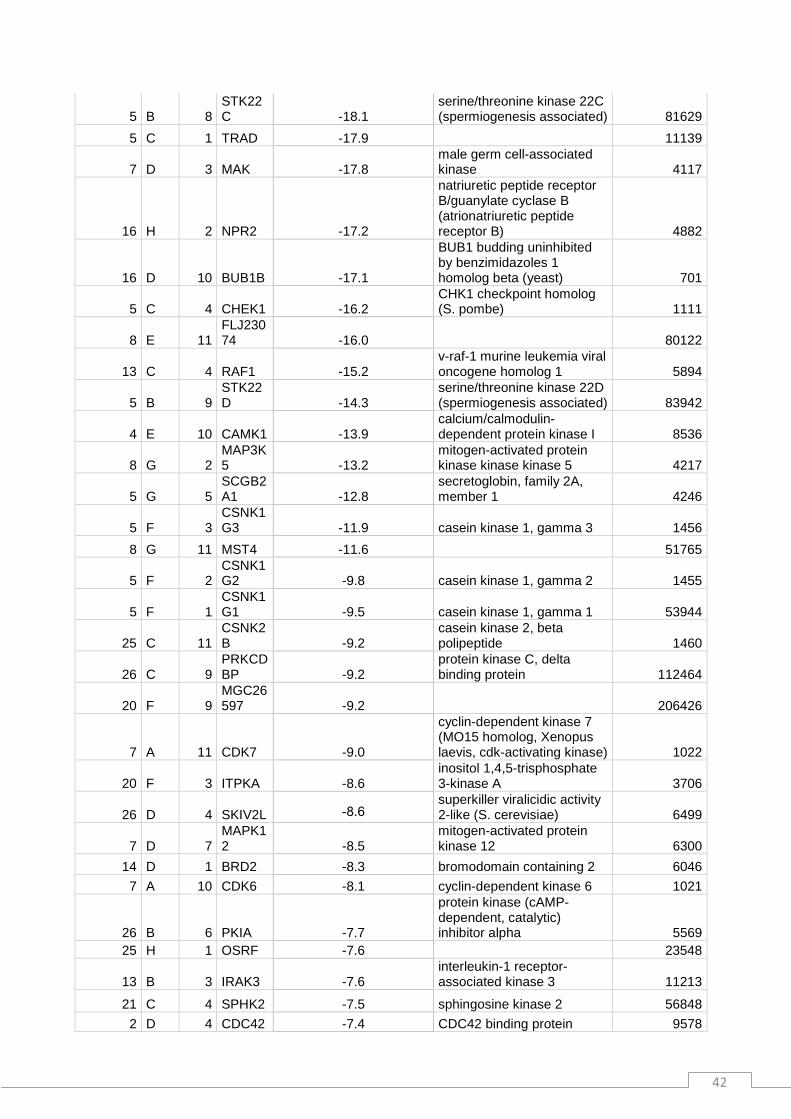
42
5 B 8 STK22C -18.1
serine/threonine kinase 22C (spermiogenesis associated) 81629
5 C 1 TRAD -17.9 11139
7 D 3 MAK -17.8 male germ cell-associated kinase 4117
16 H 2 NPR2 -17.2
natriuretic peptide receptor B/guanylate cyclase B (atrionatriuretic peptide receptor B) 4882
16 D 10 BUB1B -17.1
BUB1 budding uninhibited by benzimidazoles 1 homolog beta (yeast) 701
5 C 4 CHEK1 -16.2 CHK1 checkpoint homolog (S. pombe) 1111
8 E 11 FLJ23074 -16.0 80122
13 C 4 RAF1 -15.2 v-raf-1 murine leukemia viral oncogene homolog 1 5894
5 B 9 STK22D -14.3
serine/threonine kinase 22D (spermiogenesis associated) 83942
4 E 10 CAMK1 -13.9 calcium/calmodulin-dependent protein kinase I 8536
8 G 2 MAP3K5 -13.2
mitogen-activated protein kinase kinase kinase 5 4217
5 G 5 SCGB2A1 -12.8
secretoglobin, family 2A, member 1 4246
5 F 3 CSNK1G3 -11.9 casein kinase 1, gamma 3 1456
8 G 11 MST4 -11.6 51765
5 F 2 CSNK1G2 -9.8 casein kinase 1, gamma 2 1455
5 F 1 CSNK1G1 -9.5 casein kinase 1, gamma 1 53944
25 C 11 CSNK2B -9.2
casein kinase 2, beta polipeptide 1460
26 C 9 PRKCDBP -9.2
protein kinase C, delta binding protein 112464
20 F 9 MGC26597 -9.2 206426
7 A 11 CDK7 -9.0
cyclin-dependent kinase 7 (MO15 homolog, Xenopus laevis, cdk-activating kinase) 1022
20 F 3 ITPKA -8.6 inositol 1,4,5-trisphosphate 3-kinase A 3706
26 D 4 SKIV2L -8.6 superkiller viralicidic activity 2-like (S. cerevisiae) 6499
7 D 7 MAPK12 -8.5
mitogen-activated protein kinase 12 6300
14 D 1 BRD2 -8.3 bromodomain containing 2 6046
7 A 10 CDK6 -8.1 cyclin-dependent kinase 6 1021
26 B 6 PKIA -7.7
protein kinase (cAMP-dependent, catalytic) inhibitor alpha 5569
25 H 1 OSRF -7.6 23548
13 B 3 IRAK3 -7.6 interleukin-1 receptor-associated kinase 3 11213
21 C 4 SPHK2 -7.5 sphingosine kinase 2 56848
2 D 4 CDC42 -7.4 CDC42 binding protein 9578

43
BPB kinase beta (DMPK-like)
11 G 6 RYK -7.2 RYK receptor-like tyrosine kinase 6259
8 F 2 JIK -7.1 51347
25 G 2 MAPK8IP3 -6.6
mitogen-activated protein kinase 8 interacting protein 3 23162
17 A 1 RNASEL -6.6
ribonuclease L (2,5-oligoisoadenylate synthetase-dependent) 6041
8 F 3 MAP2K1 -6.3
mitogen-activated protein kinase kinase 1 5604
14 C 11 BCR -6.0 breakpoint cluster region 613
25 C 7 CIB2 -5.8 calcium and integrin binding family member 2 10518
2 F 8 PKN2 -5.8 protein kinase N2 5586
5 E 9 CSNK1A1 -5.7 casein kinase 1, alpha 1 1452
8 F 1 LYK5 -5.7 92335
11 E 6 KIT -5.4
v-kit Hardy-Zuckerman 4 feline sarcoma viral oncogene homolog 3815
8 H 2 MYO3B -5.3 myosin IIIB 140469
12 H 11 ACVR1C -5.1 activin A receptor, type IC 130399
26 B 2 PIK3R3 -5.1
phosphoinositide-3-kinase, regulatory subunit, polypeptide 3 (p55, gamma) 8503
17 B 6 TOPK -4.7 55872
13 C 6 RIPK2 -4.7 receptor-interacting serine-threonine kinase 2 8767
8 H 5 PAK2 -4.5 p21 (CDKN1A)-activated kinase 2 5062
7 B 11 CRK7 -4.2 51755
21 B 5 PMVK -4.1 phosphomevalonate kinase 10654
25 G 1 MAPK8IP2 -4.1
mitogen-activated protein kinase 8 interacting protein 2 23542
2 D 9 GRK5 -4.1 G protein-coupled receptor kinase 5 2869
5 F 8 VRK2 -4.1 vaccinia related kinase 2 7444
20 F 6 KHK -4.1 ketohexokinase (fructokinase) 3795
14 D 5 CABC1 -4.1 chaperone, ABC1 activity of bc1 complex like (S. pombe) 56997
25 E 9 LOC283846 -3.9 283846
14 D 11 HSPB8 -3.7 heat shock 22kDa protein 8 26353
13 C 7 RIPK3 -3.7 receptor-interacting serine-threonine kinase 3 11035
21 C 9 TPK1 -3.5 thiamin pyrophosphokinase 1 27010
13 B 7 LIMK2 -3.5 LIM domain kinase 2 3985
5 A 10 PSKH1 -3.2 protein serine kinase H1 5681
2 H 8 SGKL -3.1 serum/glucocorticoid regulated kinase-like 23678
26 B 4 PIP5K1C -3.1
phosphatidylinositol-4-phosphate 5-kinase, type I, 23396

44
gamma
2 D 8 GRK4 -2.9 G protein-coupled receptor kinase 4 2868
20 F 11 MRC2 -2.9 mannose receptor, C type 2 9902
13 A 2 RIPK4 -2.9 receptor-interacting serine-threonine kinase 4 54101
8 F 6 MAP2K4 -2.8
mitogen-activated protein kinase kinase 4 6416
7 F 2 CDK11 -2.7 cyclin-dependent kinase (CDC2-like) 11 23097
25 C 8 CIB3 -2.7 calcium and integrin binding family member 3 117286
8 H 1 MYO3A -2.6 myosin IIIA 53904
14 E 11 PRKDC -2.4
protein kinase, DNA-activated, catalytic polypeptide 5591
20 F 1 IHPK3 -2.4 inositol hexaphosphate kinase 3 117283
25 C 10 CRIM1 -2.3 cysteine-rich motor neuron 1 51232
26 B 3 PIP5K1B -2.3
phosphatidylinositol-4-phosphate 5-kinase, type I, beta 8395
17 B 5 TLK2 -2.3 tousled-like kinase 2 11011
26 B 5 PIP5KL1 -2.2
phosphatidylinositol-4-phosphate 5-kinase-like 1 138429
14 D 6 EEF2K -2.1 eukaryotic elongation factor-2 kinase 29904
13 A 3 ARAF1 -2.0 v-raf murine sarcoma 3611 viral oncogene homolog 1 369
20 F 5 ITPKC -1.9 inositol 1,4,5-trisphosphate 3-kinase C 80271
14 D 4 BRDT -1.9 bromodomain, testis-specific 676
8 F 4 MAP2K2 -1.7
mitogen-activated protein kinase kinase 2 5605
26 C 7 PRKCABP -1.4
protein kinase C, alpha binding protein 9463
20 G 2 NAGK -1.0 N-acetylglucosamine kinase 55577
7 D 11 MAPK6 -0.8 mitogen-activated protein kinase 6 5597
7 E 9 RAGE -0.6 renal tumor antigen 5891
26 C 5 PRKAR1B -0.6
protein kinase, cAMP-dependent, regulatory, type I, beta 5575
14 D 10 FRAP1 -0.5
FK506 binding protein 12-rapamycin associated protein 1 2475
2 E 8 PKN3 -0.4 protein kinase N3 29941
4 E 8 TRIB3 0.0 tribbles homolog 3 (Drosophila) 57761
2 F 7 PKN1 0.1 protein kinase N1 5585
20 H 10 PFKFB4 0.2
6-phosphofructo-2-kinase/fructose-2,6-biphosphatase 4 5210
26 A 9 PIK3CD 0.3
phosphoinositide-3-kinase, catalytic, delta polypeptide 5293
26 D 1 SCAP1 0.4 src family associated phosphoprotein 1 8631
20 B 11 DCK 0.5 deoxycytidine kinase 1633

45
2 E 7 PDPK1 0.7 3-phosphoinositide dependent protein kinase-1 5170
14 D 9 ADCK4 0.8 aarF domain containing kinase 4 79934
7 E 8 PRPF4B 1.0
PRP4 pre-mRNA processing factor 4 homolog B (yeast) 8899
20 D 5 FN3KRP 1.2 79672
26 A 2 PIK3AP1 1.2
phosphoinositide-3-kinase adaptor protein 1 118788
16 E 6 CSNK2A1 1.3
casein kinase 2, alpha 1 polypeptide 1457
21 C 2 RBKS 2.3 Ribokinase 64080
26 C 11 PRKRIR 2.8
protein-kinase, interferon-inducible double stranded RNA dependent inhibitor, repressor of (P58 repressor) 5612
14 E 10 PDK4 3.0 pyruvate dehydrogenase kinase, isoenzyme 4 5166
2 D 7 FLJ25006 3.1 124923
20 D 8 PIP5K2C 3.4
phosphatidylinositol-4-phosphate 5-kinase, type II, gamma 79837
26 B 11 PRKAB2 3.5
protein kinase, AMP-activated, beta 2 non-catalytic subunit 5565
14 D 7 FASTK 3.5 10922
2 F 2 PRKCB1 3.7 protein kinase C, beta 1 5579
20 F 8 LCK 4.3 lymphocyte-specific protein tyrosine kinase 3932
21 A 9 PIP5K1A 4.4
phosphatidylinositol-4-phosphate 5-kinase, type I, alpha 8394
13 A 6 BMPR2 4.5
bone morphogenetic protein receptor, type II (serine/threonine kinase) 659
7 E 11 STK23 4.9 serine/threonine kinase 23 26576
13 A 5 BMPR1B 5.2
bone morphogenetic protein receptor, type IB 658
8 H 7 PAK4 5.9 p21(CDKN1A)-activated kinase 4 10298
14 D 8 RIOK2 6.0 RIO kinase 2 (yeast) 55781
26 D 2 SH3KBP1 6.3
SH3-domain kinase binding protein 1 30011
16 E 7 CSNK2A2 6.5
casein kinase 2, alpha prime polypeptide 1459
13 A 4 BMPR1A 8.7
bone morphogenetic protein receptor, type IA 657
26 D 5 SKP2 8.9 S-phase kinase-associated protein 2 (p45) 6502
20 B 9 CKMT2 9.2 creatine kinase, mitochondrial 2 (sarcomeric) 1160
25 F 8 MAP3K7IP2 11.1
mitogen-activated protein kinase kinase kinase 7 interacting protein 2 23118
2 F 1 PRKCA 11.5 protein kinase C, alpha 5578
25 F 7 MAP3K 15.0 mitogen-activated protein 10454

46
7IP1 kinase kinase kinase 7 interacting protein 1
7 A 5 CDK10 15.8 cyclin-dependent kinase (CDC2-like) 10 8558
25 B 5 AKAP9 31.1 A kinase (PRKA) anchor protein (yotiao) 9 10142
25 B 4 AKAP8L 31.1
A kinase (PRKA) anchor protein 8-like 26993
25 D 11 IHPK2 32.9 inositol hexaphosphate kinase 2 51447
25 B 1 AKAP6 33.2 A kinase (PRKA) anchor protein 6 9472
2 F 4 PRKCE 37.6 protein kinase C, epsilon 5581
25 A 3 AKAP1 46.4 A kinase (PRKA) anchor protein 1 8165
20 E 9 HK2 49.6 hexokinase 2 3099
25 B 8 CALM1 72.9 calmodulin 1 (phosphorylase kinase, delta) 801
25 B 9 CALM2 130.0 calmodulin 2 (phosphorylase kinase, delta) 805
Table1. The table shows 217 kinases which RNAi produce an effect ranging from -50% to 130% on mitochondrial
calcium uptake. They are all the mean of the effect of three difference siRNA sequences.
Figure 2
Fig.2 A histogram showing the effect of each kinase (217 kinases with three fold redundancy) on mitochondrial
calcium uptake, candidates with average increasing or reducing effect more than 20% are enlightened in red boxes.
% o
f v
ari
ati
on
of
mit
och
on
dri
al
calc
ium
up
tak
e
217 kinases x three siRNAs
47
According to prior studies Transforming growth factor–β (TGF-β) has been implicated as a key
factor in mediating many cellular processes and it has also been demonstrated its ability to impair
cytosolic calcium concentration which in some cases may result from the downregulation of the
IP3 receptor Ca2+
channels (IP3Rs). Pieces of evidence collected from many different groups indeed
demonstrate that the normal mobilization of intracellular Ca2+
stores is reduced in diabetic aortic
and proglomerular smooth muscle cells and the alteration is mediated by TGF-β. We decided to
concentrate our attention on the study of TGF-β role on mitochondrial calcium uptake and the
starting point was coming from the preliminary data collected from the above reported screen
which shows that calcium uptake is reduced of 22% by both the isofoms of TGF-β receptor (TGF-
βR I and II) .
Mitochondrial Calcium signaling is affected by TGF- β receptor inhibition
The first experiment to be performed was the reproduction of the siRNAs effect on a larger scale.
HeLa cells were transfected with the mitochondrially targeted aequorin probe and a reconstituted
with the aequorin co-factor coelenterazine; Ca2+
transients were trigger by maximal dose of
histamine 100μM, luminescence was measured and then converted in [Ca2+
]. Control coverslips,
treated with DMSO, were compared to TGF-β receptor chemical inhibitors SB431542 5μM
(inhibitor of TGF-β receptors I and II, signaling mainly through Smad2/3) and Dorsomorphin (DM)
10μM (inhibitor of BMP activated receptors, signaling mainly through Smad1/5/8) treated cells.
The time of treatment was reduced from 16 hours to 4 hours to 10 minutes in order to observe
the acute effect on mitochondrial calcium of the chemical silencing of TGF-β receptor signaling
cascade. As shown in figure 3A, B and C, the chemical inhibition of TGF-β receptors causes an
evident reduction of mitochondrial calcium uptake: while in control cells the mitochondrial

48
calcium transient observed corresponded to [Ca2+
]mt of 128+14.6 μM, after overnight treatment
with SB431542 and Dorsomorphin [Ca2+
]mt was reduced to 99.5+17.6μM and 72+17.6μM
respectively.
Figure 3
Fig.3 HeLa cells were transfected with mitochondrially-targeted aequorin (mtAEQ). 36 hours after transfection,
mitochondrial Ca2+
uptake evoked by Histamine 100μM, was measured in three different conditions : A) overnight
treatment with SB 431542 (SB) 5μM (inhibitor of TGF-β receptors I and II, signaling mainly through Smad2/3) and
Dorsomorphin (DM) 10μM (inhibitor of BMP activated receptors, signaling through Smad1/5/8); B) 4 hours treatment
and C) 10 minutes treatment with the same agents. The observed reduction in mitochondrial Ca2+
response produced
by these treatments was the first indication of a role of TGF-β signalling in the regulation of mitochondrial Ca2+
handling.
Thus the effect of two different inhibitors, working on two different subfamily of TGF-β receptor is
qualitatively the same, differences in the amplitude of reduction are probably linked to the greater
number of inhibited BMP receptors than TGF-β receptors, or differences in receptor affinity to the
two chemical compounds.
HeLa cells were transfected with cytosol localizing aequorin Ca2+
-probe (CytAeq) and low affinity
ER-targeted aequorin based Ca2+
-probe, cytosolic and Endoplasmic Reticulum calcium
concentration were measured and representative experiments are shown in Fig.4. These results
excluded that the mitochondrial calcium uptake reduction observed could be explained by general
Ca2+
handling impairment nor by defective storing within the major intracellular calcium store,

49
since no significant difference has been recorded in the two compartments. These data strongly
supported the hypothesis of a direct activity of TGF-β on mitochondria while the homeostasis of
this ion in the other compartment remained affected.
Figure 4
Fig.4 ER and cytosolic Ca2+
measurements with targeted aequorin probes. In both compartments, pretreatment with
SB and DM did not modify either the resting values nor the peak (cytosol) or decrease (ER) caused by stimulation with
Histamine 100μM.
Mitochondrial membrane potential (Δψmt ) was measured in HeLa cells in order to test whether
mitochondrial calcium uptake reduction is dependent from mitochondrial respiratory chain
activity. In living cells Δψmt was measured using tetramethyl rhodamine methyl ester (TMRM), a
fluorescent lipophilic cation that accumulates in the mitochondrial matrix in a Δψmt-dependent
way. The fluorescence intensity of TMRM in individual cell was measured using laser scanning
microscopy. To measure and compare the potential-dependent staining of TMRM of different
conditions, cells were incubated with 1 μM FCCP, a protonophore that collapses the Δψmt. The loss
of TMRM fluorescence was used to obtain quantitative analysis of Δψmt. The representative traces

50
in fig. 5 showed that overnight treatments with SB 5μM and DM 10 μM strongly reduced TMRM
fluorescence basal level (-35 + 8.2% and -42 + 12.7%) if compared with untreated controls. Since it
is well established the notion that Δψmt drives mitochondrial uptake of Ca2+
, these results
appeared to be consistent with the previous observation about the mitochondrial calcium uptake
impairment, obtained with aequorin measurements after TGF-β receptors inhibition.
Figure 5
Fig.5 The electrical potential across the mitochondrial inner membrane (Δψmt ) was measured with Tetramethyl
Rhodamine Methil Ester (TMRM). Mitochondrial TMRM loading at the steady state was significatively decreased by
overnight treatment with SB 5μM and DM 10 μM (A, left representative traces; right, quantification in the whole array
of analyzed cells). Upon treatment with FCCP, all traces reached the same background level. Figure B shows
representative images of HeLa cells incubated with TMRM 10nM for 20 minutes and DMSO, SB 5μM and DM 10μM,
fluorescent intesity of TMRM was detected with laser scanning microscopy.
Along the same line were the measurements of mitochondrial ATP production carried out by
means of ATP luciferase probe targeted to the mitochondrial compartment. The method is based
on the reaction of luciferase with the substrate luciferin in presence of oxygen, being the following
light emission a linear function of ATP concentration in a range between 10-3
and 10-2
M. HeLa
cells were transfected with mitochondrial targeted luciferase (mtLUC) and 24 later coverslips
were transferred to the 37°C termostated chamber of a luminometer and perfused with a Krebs
Ringer Buffer containing 20μM Luciferin. During the preliminary phase of equilibration, light

51
emission was in the range of 12000-17000 cps versus a background lower than 10 cps, cellular
response was evoked by the agonist Histamine 100μM added to the perfusion medium. As
previously reported (Jouaville L.S., 1999), agonist-dependent [Ca2+
] increases in the mitochondrial
matrix cause an increase in ATP levels, both in the mitochondria (Fig.6) and in the cytosol (data not
shown). This was mainly attributed to the stimulation of Ca2+
-dependent dehydrogenases. We
evaluated the effect on level of ATP production produced by acute treatment of HeLa cells with SB
5μM and DM 10 μM. In treated cells, in agreement with our previous results on calcium signaling,
ATP production is drastically reduced (fig.6). The impairment of calcium uptake occurring in the
organelle after TGF-β receptors inhibition correlates with a minor Ca2+
-mediated stimulation of
matrix dehidrogenases which leads to the reduction of ATP synthesis observed (-42.8+4.2% for SB
and -37.1+6.1% for DM ).
Figure 6
Fig.6 A mitochondrially targeted chimera of ATP-sensitive photoprotein Luciferase (mtLUC) was exploited to
dynamically monitore ATP synthesis within the mitochondrial subcellular compartment. HeLa cells were seeded on
coverslips and grown in DMEM plus 10% FBS. Two days before the ATP measurements, the two groups of cells were
transfected with mtLUC probe, the following day one set of coverslips was treated with dmso (controls), one set with
SB 5μM and one set with DM 10uM. For the measurements, the cells were rinsed twice with KRB, then transferred to
the luminometer chamber and perfused with KRB supplemented with glucose 5,5mM, calcium 1mM and Luciferin
20μM. 60 seconds were allowed for equilibration in the new medium, then ATP production was triggered by
supplementing the perfusion buffer with Histamine 100μM. In presence of TGF-β receptors inhibitors ATP production
appeared to be reduce of -42.8+4.2% in the case of SB and of 37.1+6.1% for DM.
60sec

52
TGF-β receptors silencing by means of specific siRNA plasmids
Mitochondrial network and the biophysical properties of mitochondrial calcium uptake have been
studied in detail and since it has been demonstrated its high sensitivity to lipholic molecules. In
order to evaluate the real effect of TGF-β receptors inhibition, without the usage of chemical
compounds dissolved into DMSO, we decided to built up siRNA plasmids to downregulate TGF-β
receptor isoforms through RNA interference techniques, so doing we would get rid of any possible
non-specific effect due to chemical treatment. Two different sequences for TGF-β receptor I and II
were cloned into pSuper Vector (siRNA TGF-βRI and siRNA TGF-βRII) and the silencing capacity of
the two most efficient plasmids, chosen for further experiments, is shown in figure 7.
Figure 7
Fig.7 HeLa cells were transfected with small interfering (siRNA ) plasmids created using a pSuper vector. We obtained
two different sequences cloned in the expression vector, efficently silencing target genes of TGF-β receptor I and II.
The western blot shows the most effective sequences we used to perform the following experiments.
Intracellular calcium homeostasis was then analized in HeLa cells after co-transfection of TGF-ΒR I
and II siRNAs and aequorin probes specifically targeted to mitochondria, Endoplasmic Reticulum
and cytosol.
The effect is reported in the panel below (fig. 8), where it is evident the peculiar reduction of
mitochondrial Ca2+
uptake while the other two compartment appeared to be unaffected.

53
Figure 8
Fig.8 Calcium measurements were carried out in HeLa cells co-transfected with the siRNAs of the two different
isoforms of TGF-β receptor and aequorin-based Ca2+
probes. The data confirmed that mitochondrial Ca2+
response
after stimulation was significantly decreased upon suppression of TGF-β signaling, whereas cytosolic and ER Ca2+
handling was unaffected.
Mitochondrial membrane potential (Δψmt) was measured in presence of DMSO (as negative
control, black line), SB 5μM (as positive control, orange line) and after 36 hours co-transfection
with the siRNA plasmids of the two different isoforms of TGF-β receptor.
Comparing the effect exerted by two different tools to achieve TGF-β pathway inactivation, we
could assess that they were both on the same line of what had been observed by aequorin
measurements, Δψmt was strongly reduced and mitochondrial Ca2+
uptake along with it. (Fig. 9)
Fig. 9
Fig. 9 Mitochondrial membranepotential (Δψmt) was measured with TMRM in untreated HeLa cells (black trace) or
after TGF-β receptor inhibition by means of SB 5μM (orange line) or siRNA silencing (pink line).
control

54
The effect on mitochondrial Ca2+
uptake was thus confirmed by direct specific intraorganelle
measurements thanks to aequorin probes, indirectly exploting Luciferase probe specifically
targeted to mitochondrial which measured ATP production and finally through TMRM analysis of
potential across the mitochondrial membrane.
Subcellular distribution of Smad proteins
The question we had to answer then was: which was molecular mechanism ruling the effect ?
Looking for possible molecular characters we decided to define subcellular localization of TGF-β
downstream effectors: the Smad proteins.
Among the huge family of these intracellular transducers we focused our attention on isoforms 2
and 3 because from previous work (Jullig M., 2003) they were demonstrated to be the members
with higher mitochondrial distribution.
Mitochondrial cellular fractioning was performed as described in Materials and Methods on HeLa
cells to compare Smads localization in mito crude fraction with or without TGF-β receptors
inactivation by means of SB treatment.
As it is shown in fig. 10 Smad2/3 was observed in mito crude of HeLa cells, interestingly its
phosphorylated fraction appeared to be delocalized from mitochondria after the treatment
applied.

55
Figure 10
Fig.10 Subcellular localization of Smad proteins, TGF-β receptor effectors. Western blots of subcellular fractions
shows mitochondrial distribution of Smad2/3 that was decreased by SB 5μM treatment. Interestingly, we observed
the almost complete absence of the phosphorylated protein in mitochondria of HeLa cells treated with the inhibitor.
We thus speculated that most likely the equilibrium between the phosphorylated and
unphosphorylated fraction of Smad2/3 could be linked to those mitochondrial events produced by
chemical or biological inhibition of TGF-β receptors, described before.
If the mitochondrial delocalization of the specific isoform of Smad proteins was responsible for
the impairment of mitochondrial functionality, then the question was: what about the biological
mechanism?
Two different possibilities could be envisioned.
In the first one the phosphorylated pool of Smad could act favouring calcium transfer between the
major intracellular store, the Endoplasmic Reticulum and mitochondria, thus we measure calcium
transient by means of mitochondrial aequorin probe in presence of TGF-β or not. What we
observed is shown in figure 11, and despite what was expected, no increase has been recorded in
mitochondrial calcium uptake.
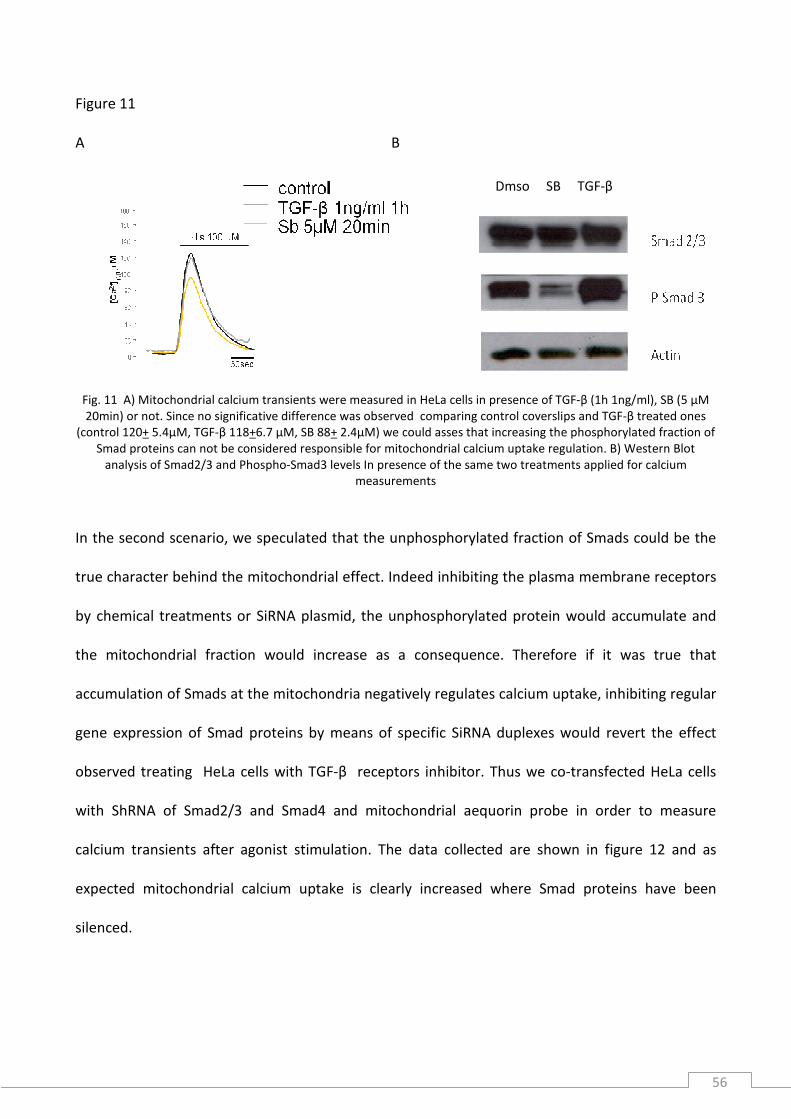
56
Figure 11
A B
Fig. 11 A) Mitochondrial calcium transients were measured in HeLa cells in presence of TGF-β (1h 1ng/ml), SB (5 μM
20min) or not. Since no significative difference was observed comparing control coverslips and TGF-β treated ones
(control 120+ 5.4μM, TGF-β 118+6.7 μM, SB 88+ 2.4μM) we could asses that increasing the phosphorylated fraction of
Smad proteins can not be considered responsible for mitochondrial calcium uptake regulation. B) Western Blot
analysis of Smad2/3 and Phospho-Smad3 levels In presence of the same two treatments applied for calcium
measurements
In the second scenario, we speculated that the unphosphorylated fraction of Smads could be the
true character behind the mitochondrial effect. Indeed inhibiting the plasma membrane receptors
by chemical treatments or SiRNA plasmid, the unphosphorylated protein would accumulate and
the mitochondrial fraction would increase as a consequence. Therefore if it was true that
accumulation of Smads at the mitochondria negatively regulates calcium uptake, inhibiting regular
gene expression of Smad proteins by means of specific SiRNA duplexes would revert the effect
observed treating HeLa cells with TGF-β receptors inhibitor. Thus we co-transfected HeLa cells
with ShRNA of Smad2/3 and Smad4 and mitochondrial aequorin probe in order to measure
calcium transients after agonist stimulation. The data collected are shown in figure 12 and as
expected mitochondrial calcium uptake is clearly increased where Smad proteins have been
silenced.
Dmso SB TGF-β

57
Figure 12
A B
Fig.12 A) Mitochondrial calcium transients were measured in HeLa cells co-transfected with two different ShRNAs of
Smad2/3 or Smad4, and mitochondrial aequorin. As shown in panel A silencing Smad proteins enhances
mitochondrial calcium uptake. (Scrambled 82+ 6.1μM, SiRNA Smad2/3 I 113+ 7.2μM, SiRNA Smad2/3 II 120+ 4.2μM,
SiRNA Smad4 I 121+ 9.2μM, SiRNA Smad4 II 125+ 6.2μM). B) Western Blot analysis of Smad2/3 and Smad4 levels In
presence of their specific ShRNAs.
At this point, the study of a more physiological system than HeLa cells was fundamental, for this
reason we wanted to analyze intracellular Smads distribution in mouse liver.
Recently a very accurate method has been described by Wieckowsky and coworkers to obtain
mitochondrial purification from different animal tissues by gradient centrifugation in order to
separate pure mitochondria from the so called “mitochondria-associated membrane” (MAM) (fig.
13) (Wieckowsky M., 2009). Intriguingly this fraction would prove to be not only mere
contamination of pure mitochondria but also a very interesting mitochondrial subfraction, indeed
since 1990 the specific mitochondrial regions showing close proximity to the ER cisternae were
referred as MAMs by Vance et al. (Vance J.E., 1990). Although they have been firstly described as
the headquarters of lipid transfer, today it is widely accepted the notion that MAMs are also
involved in rapid movement of Ca2+
ions between ER and mitochondria. So doing they play a
fundamental role in the coordination of ATP production through the activation of mitochondrial
dehydrogenase as well as the activation of the cell death program (Berridge M.J., 2002). The

58
shaping of the ER-mitochondrial network can be affected by bounding proteins and physiological
ligands indeed recently Hajnoczky and coworkers demonstrated that exposure to TGFβ affects Ca2+
transfer to the mitochondria (Hajnoczky G., 2008).
Figure 13
Fig. 13 A) Isolation of Mitochondria Associated Membranes (MAMs) from animal tissues and cells (Wieckowsky M.,
2009) B) Combined 3D imaging of mitochondria and ER in a HeLa cell transiently expressing mtGFP(Y66H,Y145F) and
erGFP(S65T). The two 3D images were processed and superimposed. The mitochondrial and ER images are
represented in red and green, respectively;
the overlaps of the two images are white and constitute the microdomains called MAMs. (Rizzuto R., 1998)
Mouse liver were homogenized, and crude mitochondrial fraction (8,000g pellet) was subjected to
separation on a 30% self-generated Percoll gradient as described previously (Vance J.E., 1990). A
low-density band (denoted as MAM fraction, fig.14A) was collected and analysed by
immunoblotting.
Specific markers were chosen for each different fraction (IP3 Receptor 3 for MAM and ER fractions,
VDAC2 for pure and crude mitochondria, Sigma1 Receptor for MAM and β-actin as cytosolic
protein, see figure 14), and from prelimary results Smad2/3 appeared to be clearly localized in the
mitochondria and in particular into the MAM fraction.

59
Figure 14
Fig.14 A more extensive subcellular fractionation in mouse liver shows the presence of Smads in the MAM fraction,
thus suggesting a direct regulatory role exerted in this signaling domain.
The evidence of Smad2/3 presence in the MAMs obtained from a physiological system such as
mouse liver, is the starting point of a wide work that would lead to the understandment of a new
role of TGF-β signaling pathway in the orchestration of mitochondrial calcium signaling.
Next step would be the analysis of Smads and phospho-Smads delocalization in vivo after TGF-β
receptor inhibition or activation by means of mouse liver perfusion techniques carried out in
presence of chemical compounds. Moreover it would be necessary the research of Smads
molecular interactors by means of co-immunoprecipitation and Blue Native assays.
Hence, further study will be done to assess a possible direct mitochondrial activity of Smad
proteins on the organelle calcium homeostasis.
60
DISCUSSION
Preliminary results obtained by a screening based on a human kinases library, showed that
silencing TGF-β Receptors by means of siRNA duplexes, exerted a clear effect on mitochondrial
calcium homeostasis. This starting information was then exploited to unravel the molecular
mechanism by which mitochondria could orchestrate intracellular calcium homeostasis.
TGF-β signaling has been widely studied and although its transcriptional activity is today well
understood, less efforts have been made to investigate its non-nuclear functions which are still
quite unknown.
We thus decided to go deeply through this study, since according to previous works a
transcriptional-independent activity of TGF-β cascade had already been observed. First of all,
many different groups are engaged in the study of TGF-β role in the regulation of the intrinsic
pathway leading to apoptosis. Gottfried in 2004 demonstrated TGF-β activation of ARTS, a
proapoptotic protein localized in the mitochondria. Wang et al., in 2008 published the observation
that TGF-β treatment could generate reactive oxygen species (ROS) and mitochondrial membrane
potential loss in epithelial cell.
Concerning calcium homeostasis, recent works showed that TGF-β could reduce IP3 Receptor 1
calcium release from ER in diabetic aortic and proglomerular smooth muscle cells.
The first step we took, was to obtain a more complete scenario about intracellular calcium
homeostasis after TGF-β signaling inhibition. Overexpressing aequorin probe in HeLa cells, we
observed that mitochondrial calcium uptake was impaired when TGF-β signaling was inhibited by

61
chemical treatments, whereas Endoplasmic Reticulum and cytosolic calcium handling was
unaffected.
The same scenario was there inhibiting TGF-β signaling both by molecular inhibitors acute
treatment and by transfecting TGF-β receptor siRNA plasmids into the cells.
Mitochondrial functionality was consistently affected in the same conditions, since we observed
the reduction of mitochondrial membrane potential and also the ATP production resulted
significantly impaired.
Then we focused on how this effect was achieved.
The biochemical meaning of TGF-β receptors inhibition is the reduction of the phosphorylated
fraction of TGF-β receptors downstream effectors: the Smad proteins. Therefore we speculated
that the mitochondrial specific effect could be the result of two different situation.
According to the first one, reduction of Smad phosphorylation could be direct source of the
mitochondrial effect, under the hypothesis that the phosphorylated Smad could positively control
calcium transfer between the ER and mitochondrial. Thus we hypothesized that the less is the
amount of phospho-Smad working at the mitochondria, the less these organelles are exposed to
high Ca2+
concentration generated at the mouth of IP3Rs. As described in the introduction of this
work, this could explain the reduction in mitochondrial calcium transient after agonist stimulation.
The second hypothesis envisioned the non-phosphorylated fraction of Smad proteins as
responsible for a negative regulation of ER-mitochondrial contacts. Indeed switching off TGF-β
receptors avtivity, the intracellular amount of non-pshorylated Smads increased and consequently
the equilibrium between the nuclear and mitochondrial (and cytosolic) pools of these proteins,
most likely would shift toward the mitochondrial translocation. Blocking TGF-β receptors activity a

62
great amount of Smad would be potentially disposable for mitochondrial accumulation where it
exerted a specific effect on calcium transients.
We thus decided to silence, by means of short hairpin RNA interference, the total amount of
specific isoforms of Smads, we chose to silence Smad 2/3 and Smad 4, members of a great family
of nuclear factors, which are described to be localized into the mitochondria (which was confirmed
in our lab also). So thanks to Smad2/3 and Smad4 shSiRNAs, we measured calcium transients in
HeLa cells and we observed a clear augmentation in mitochondrial calcium uptake in coverslips
where normal transcription of Smad proteins was blocked, compared to scrambled controls. This
observation supported the second hypothesis : the non phosphorylated Smads exerted negative regulation
on ER-mitochondrial transfer.
On the other hand, we treated HeLa cells with TGF-β polypeptide and measured mitochondrial
calcium uptake. If the first hypothesis had been true, the potentiation of TGF-β receptors activity
would have increased the phosphorylation of Smad proteins and consequently the mitochondrial
impairment described so far would have had to be inverted. Indeed if phospho-Smad was a
positive regulator of mitochondrial function, in TGF-β treated coverslips we should have observed
a mitochondrial calcium uptake enhancement.
However no increase was recorded to further support the idea that it was not the phosphorylated
but the non-phosphorylated pool of Smads which was responsible for a negative control of ER-
mitochondria contacts.
Moreover subcellular fractionation obtained from mouse liver, showed that a good fraction of
Smad2/3 protein is localized in the MAM, the well described contact sites between ER and
mitochondria.
63
Although the molecular mechanism that controls different distribution of Smads are still
completely unknown (apart from the classical pathway ruling gene transcription) according to our
data, a new role for these proteins has been demonstrated, which is independent from the
nucleus whereas it appears to be associated to the mitochondria.
Aequorin probe measurements, carried out in living cells, revealed a clear engagement of TGF-β in
regulating mitochondrial calcium transient evoked by agonists stimulation.
Moreover biochemical studies demonstrated that there is a specific localization of Smad proteins
both in crude mitochondrial fraction and in the low density mitochondrial associated membranes
(MAMs) where, most likely, they could participate in complexes with other signaling partners.
In conclusion this work highlights a quite unexplored signaling pathway for TGF-β, telling that
Smad proteins can directly regulate mitochondrial calcium homeostasis.
Although much remains to be unraveled, the notion that mitochondrial function could be
modulated by highly specialized domains at the ER-mitochondria interface is today generally
accepted. More and more efforts will be made in future and other experimental work will be
necessary to make it completely understood, so doing novel possibilities will be opened to
modulate downstream pathological conditions linked to cellular proliferation or metabolism.
64
REFERENCES
Alonso M.T., Barrero M.J., Carnicero, E. Montero M., Garcia-Sancho J., and Alvarez J. (1998).
Functional measurements of [Ca2+
] in the endoplasmic reticulum using a herpes virus to deliver
targeted aequorin. Cell Calcium 24, 87-96.
Berridge MJ. (2002) The endoplasmic reticulum: a multifunctional signaling organelle. Cell Calcium.
32(5-6):235-49.
Berridge M.J., Bootman M.D., and Roderick H.L. (2003). Calcium signaling: dynamics, homeostasis
and remodelling. Nat. Rev. Mol. Cell. Biol. 4, 517-529.
Bertolino M., and Llinas R.R. (1992). The central role of voltage-activated and receptor-operated
calcium channels in neuronal cells. Annu. Rev. Pharmacol. Toxicol. 32, 399-421.
Carrington W.A., Lynch R.M., Moore E.D., Isenberg G., Fogarty K.E., and Fay F.S. (1995).
Superresolution three-dimensional images of fluorescence in cells with minimal light exposure.
Science 268, 1483-1487.
Clybouw C., Mchichi B.E., Hadji A., Portier A., Auffredou M.T., Arnoult D., Leca G., and Vazquez A. (2008).
TGFbeta-mediated apoptosis of Burkitt's lymphoma BL41 cells is associated with the relocation of
mitochondrial Bim. Oncogene. 29, 27 (24) 3446-56.
Colombini M. (2004). VDAC: the channel at the interface between mitochondria and the cytosol.
Mol Cell Biochem 256-257, 107-115.
Csordas G., Renken C., Varnai P., Walter L., Weaver D., Buttle K.F., Balla T., Mannella C.A., and
Hajnoczky G. (2006). Structural and functional features and significance of the physical linkage
between ER and mitochondria. J. Cell. Biol. 174, 915-921.
Franze´n P., Ten Dijke P., Ichijo H., Yamashita H., Schulz P., and Heldin C-H. (1993). Cloning of a TGF
beta type I receptor that forms a heteromeric complex with the TGF beta type II receptor. Cell 75,
681– 92.
Gottfried Y., Voldavsky E., Yodko L., Sabo E., Ben-Itzhak O., and Larisch S. (2004). Expression of the
pro-apoptotic protein ARTS in astrocytic tumors: correlation with malignancy grade and survival
rate. Cancer. 101 11 2614-21
Gunter T.E., Buntinas L., Sparagna G.C., and Gunter K.K. (1998). The Ca2+
transport mechanisms of
mitochondria and Ca2+
uptake from physiological-type Ca2+
transients. Biochim. Biophys. Acta
1366, 5-15.
Hajnoczky G., Csordas G., Madesh M., and Pacher P. (2000). The machinery of local Ca2+
signalling
between sarco-endoplasmic reticulum and mitochondria. J. Physiol. 529 Pt 1, 69-81.

65
Heldin C.-H., Miyazono K., and Ten Dijke P. (1997). TGF-beta signalling from cell membrane to
nucleus through SMAD proteins. Nature 390, 465– 71.
Henis Y.I., Moustakas A., Lin H.Y., and Lodish H.F. (1994). The types II and III transforming growth
factor-beta receptors form homo-oligomers. J. Cell. Biol. 126, 139– 54.
Hocevar B.A., Smine A., Xu X.X., and Howe P.H. (2001). The adaptor molecule Disabled-2 links the
transforming growth factor beta receptors to the Smad pathway. EMBO J. 20, 2789– 801.
Huse M., Muir T.W., Xu L., Chen Y.G., Kuriyan J., and Massague´ J. (2001). The TGF beta receptor
activation process: an inhibitor- to substrate-binding switch Mol. Cell. 8, 671 – 82.
Itoh S., Itoh F., Goumas M.J., and Dijke P. (2000). Signaling of transforming growth factor-beta
family members through Smad proteins. Eur. J. Biochem. 267, 6954– 67.
Jouaville L. S., Pinton P., Bastianutto C., Rutter G. A., and Rizzuto R. (1999). Regulation of
mitochondrial ATP synthesis by calcium: Evidence for a long-term metabolic priming. PNAS. 96,
13809.
Jullig M. and Stott N. S. (2003). Mitochondrial localization of Smad5 in a human chondrogenic cell
line Biochemical and Biophysical Research Communications 307, 108–113.
Lai Y.T., Beason K.B., Brames G.P., Desgrosellier J.S., Cleggett M.C., and Shaw M.V., (2000). Activin
receptor-like kinase 2 can mediate atrioventricular cushion transformation. Dev. Biol. 222, 1– 11.
Liunan L., Joseph J. S., Juan C. B., Lihua H., Abanti C., Zhihong L., Chad S., Brett H. Graham and
Chester W. B. (2009) Activin Signaling: Effects on Body Composition and Mitochondrial Energy
Metabolism Endocrinology. 150, 3521-3529.
Luo K., and Lodish H.F. (1996). Signaling by chimeric erythropoietin-TGF-beta receptors:
homodimerization of the cytoplasmic domain of the type I TGF-beta receptor and
heterodimerization with the type II receptor are both required for intracellular signal transduction.
EMBO J. 15, 4485– 96.
Luo K., and Lodish H.F. (1997). Positive and negative regulation of type II TGF-beta receptor signal
transduction by autophosphorylation on multiple serine residues. EMBO J. 16, 1970– 81.
Massague´ J. (1998). TGF-beta signal transduction. Annu. Rev. Biochem. 67, 753– 91.
Massague´ J., and Chen Y.G. (2000). Controlling TGF-beta signaling. Genes Dev. 14, 627– 44.
McFadzean I., and Gibson A. (2002). The developing relationship between receptor-operated and
store-operated calcium channels in smooth muscle. Br. J. Pharmacol. 135, 1-13.
McGowan T.A., and Sharma K. (2000). Regulation of inositol 1,4,5-trisphosphate receptors by
transforming growth factor-beta: implications for vascular dysfunction in diabetes. Kidney Int.
Suppl. 77, 99–S103.
66
Meldolesi J., and Pozzan T. (1987). Pathways of Ca2+
influx at the plasma membrane: voltage-,
receptor-, and second messenger-operated channels. Exp. Cell. Res. 171, 271-283.
Nakao A., Afrakhte M., Moren A., Nakayama T., Christian J.L., and Heuchel R. (1997). Identification
of Smad7, a TGFbeta-inducible antagonist of TGF-beta signaling. Nature 389, 631– 5.
Oh-hora M., and Rao A. (2008). Calcium signaling in lymphocytes. Curr. Opin. Immunol. 20, 250-
258.
Pacher P, Sharma K, Csordás G, Zhu Y, Hajnóczky G. (2008) Uncoupling of ER-mitochondrial calcium
communication by transforming growth factor-beta. Am J Physiol Renal Physiol. 295(5):F1303-12.
Persson U., Izumi H., Souchelnytskyi S., Itoh S., Grimsby S., and Engstrom U. (1998). The L45 loop in
type I receptors for TGF-beta family members is a critical determinant in specifying Smad isoform
activation. FEBS Lett. 434, 83–7.
Pierreux C.E., Nicolas F.J., Hill and C.S. (2000). Transforming growth factor beta-independent
shuttling of Smad4 between the cytoplasm and nucleus. Mol. Cell. Biol. 20, 9041– 54.
Rembold C.M., Kendall J.M., and Campbell A.K. (1997). Measurement of changes in sarcoplasmic
reticulum [Ca2+
] in rat tail artery with targeted apoaequorin delivered by an adenoviral vector. Cell
Calcium 21, 69-79.
Rizzuto R., Brini M., Murgia M., and Pozzan T. (1993). Microdomains with high Ca2+
close to IP3-
sensitive channels that are sensed by neighboring mitochondria. Science 262, 744-747.
Rizzuto R., Pinton P., Carrington W., Fay F.S., Fogarty K.E., Lifshitz L.M., Tuft R.A., and Pozzan T.
(1998). Close contacts with the endoplasmic reticulum as determinants of mitochondrial Ca2+
responses. Science 280, 1763-1766.
Rizzuto R., and Pozzan T. (2006). Microdomains of intracellular Ca2+
: molecular determinants and
functional consequences. Physiol. Rev. 86, 369–408.
Robert V., De Giorgi F., Massimino M.L., Cantini M., and Pozzan T. (1998). Direct monitoring of the
calcium concentration in the sarcoplasmic and endoplasmic reticulum of skeletal muscle
myotubes. J Biol Chem 273, 30372-30378.
Sharma K., Deelman L., Madesh M., Kurz B., Ciccone E., Siva S., Hu T., Zhu Y., Wang L., Henning R.,
Ma X., and Hajnoczky G. (2003). Involvement of transforming growth factor-β in regulation of
calcium transients in diabetic vascular smooth muscle cells. Am. J. Physiol. Renal. Physiol. 285,
1258–1270.
Shi Y., Wang F., Jayaraman L., Yang H., Massague´ J., and Pavletich N.P. (1998). Crystal structure of
a Smad MH1 domain bound to DNA: insights on DNA binding in TGF-beta signaling. Cell 94, 585–
94.
Shimomura O. (1986). Isolation and properties of various molecular forms of aequorin. Biochem J.
234, 271-277.

67
Shimomura O., Kishi Y., and Inouye S. (1993). The relative rate of aequorin regeneration from
apoaequorin and coelenterazine analogues. Biochem. J. 296 (Pt 3), 549-551.
Streb H., Irvine R.F., Berridge M.J., and Schulz I. (1983). Release of Ca2+
from a non-mitochondrial
intracellular store in pancreatic acinar cells by inositol-1,4,5-trisphosphate. Nature 306, 67-69.
Szabadkai G., Bianchi K., Varnai P., De Stefani D., Wieckowski M.R., Cavagna D., Nagy A.I., Balla T.,
and Rizzuto R. (2006). Chaperone-mediated coupling of endoplasmic reticulum and mitochondrial
Ca2+
channels. J. Cell. Biol. 175, 901-911.
Szabadkai G., and Rizzuto R. (2004). Participation of endoplasmic reticulum and mitochondrial
calcium handling in apoptosis: more than just neighborhood? FEBS Lett. 567, 111-115.
Vance J.E. (2008). Phosphatidylserine and phosphatidylethanolamine in mammalian cells: two
metabolically related aminophospholipids. J. Lipid Res. 49, 1377-1387
Vance J.E. (1990). Phospholipid synthesis in a membrane fraction associated with mitochondria. J.
Biol. Chem. 265, 7248-7256.
Wang F., Kaur S., Cavin L.G., Arsura M. (2008). Nuclear-factor-kappaB (NF-kappaB) and radical
oxygen species play contrary roles in transforming growth factor-beta1 (TGF-beta1)-induced
apoptosis in hepatocellular carcinoma (HCC) cells. Biochem. Biophys. Res. Commun. 26, 377 (4)
1107-12.
Wang T., Donahoe P.K., and Zervos A.S. (1994). Specific interaction of type I receptors of the TGF-
beta family with the immunophilin FKBP-12. Science 265, 674–6.
Watkins N.J., and Campbell A.K. (1993). Requirement of the C-terminal proline residue for stability
of the Ca2+
-activated photoprotein aequorin. Biochem. J. 293 ( Pt 1), 181-185.
Wicks S.J., Lui S., Abdel-Wahab N., Mason R.M., and Chantry A. (2000). Inactivation of smad-
transforming growth factor beta signaling by Ca2+
-calmodulin-dependent protein kinase II. Mol.
Cell. Biol., 20, 8103– 11.
Wieckowski M.R, Giorgi C, Lebiedzinska M, Duszynski J, Pinton P.(2009). Isolation of mitochondria-
associated membranes and mitochondria from animal tissues and cells. Nat Protoc. 4(11):1582-90

68
.