Tele2 q2 2013
69
SECOND QUARTER 2013 Tele2 AB July 18, 2013
Transcript of Tele2 q2 2013
SECOND QUARTER 2013
Tele2 AB
July 18, 2013
2
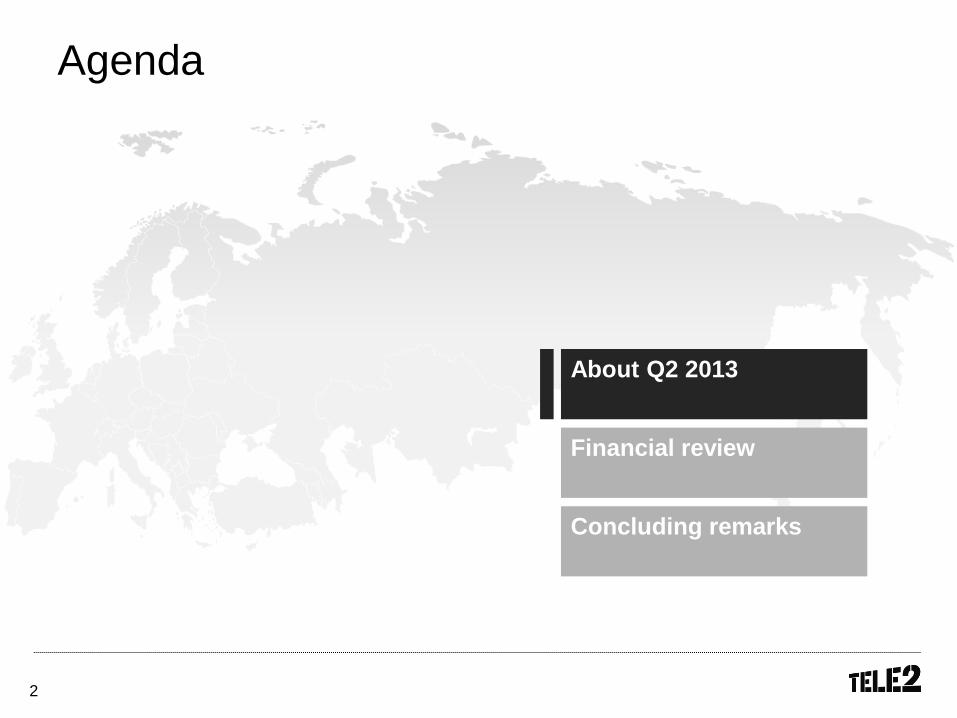
Agenda
About Q2 2013
Financial review
Concluding remarks
3
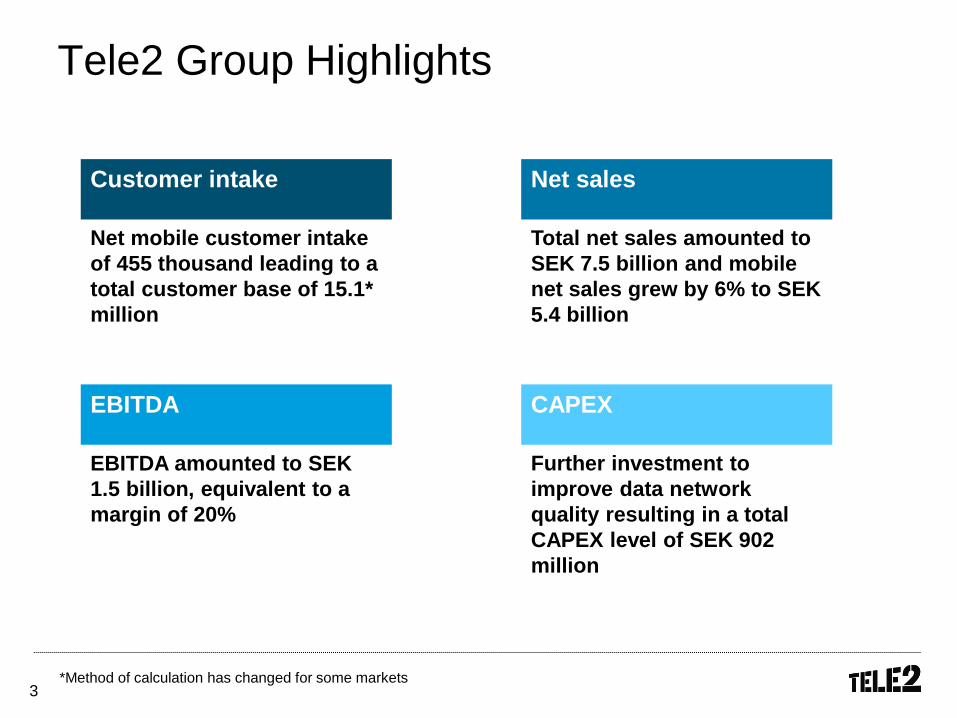
Tele2 Group Highlights
Net mobile customer intake
of 455 thousand leading to a
total customer base of 15.1*
million
Total net sales amounted to
SEK 7.5 billion and mobile
net sales grew by 6% to SEK
5.4 billion
EBITDA amounted to SEK
1.5 billion, equivalent to a
margin of 20%
Further investment to
improve data network
quality resulting in a total
CAPEX level of SEK 902
million
Customer intake Net sales
EBITDA CAPEX
*Method of calculation has changed for some markets
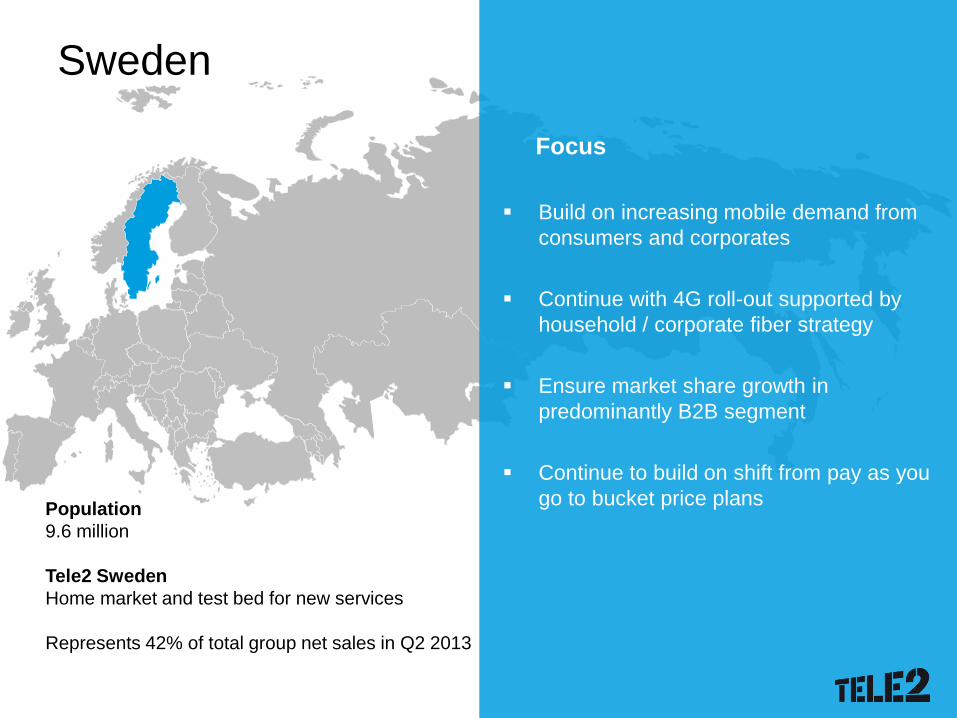
Sweden
Build on increasing mobile demand from
consumers and corporates
Continue with 4G roll-out supported by
household / corporate fiber strategy
Ensure market share growth in
predominantly B2B segment
Continue to build on shift from pay as you
go to bucket price plans
Focus
Population
9.6 million
Tele2 Sweden
Home market and test bed for new services
Represents 42% of total group net sales in Q2 2013
5
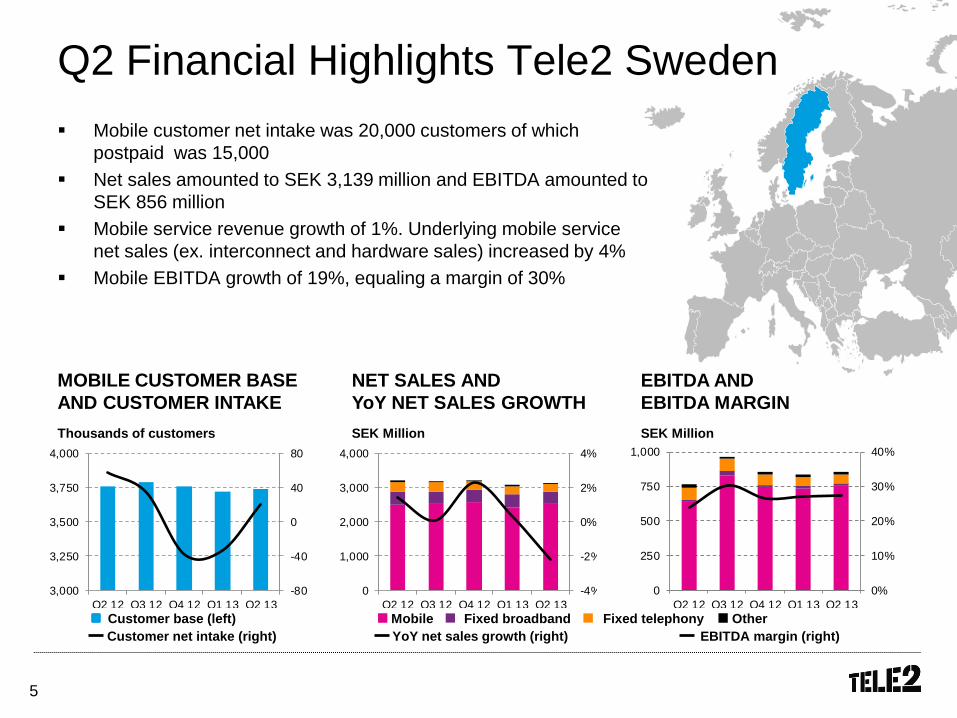
Mobile customer net intake was 20,000 customers of which
postpaid was 15,000
Net sales amounted to SEK 3,139 million and EBITDA amounted to
SEK 856 million
Mobile service revenue growth of 1%. Underlying mobile service
net sales (ex. interconnect and hardware sales) increased by 4%
Mobile EBITDA growth of 19%, equaling a margin of 30%
Q2 Financial Highlights Tele2 Sweden
Mobile Fixed telephony Fixed broadband Other Customer base (left)
Customer net intake (right) EBITDA margin (right) YoY net sales growth (right)
SEK Million SEK Million Thousands of customers
EBITDA AND
EBITDA MARGIN
NET SALES AND
YoY NET SALES GROWTH
MOBILE CUSTOMER BASE
AND CUSTOMER INTAKE
-80
-40
0
40
80
3,000
3,250
3,500
3,750
4,000
Q2 12 Q3 12 Q4 12 Q1 13 Q2 13
-4%
-2%
0%
2%
4%
0
1,000
2,000
3,000
4,000
Q2 12 Q3 12 Q4 12 Q1 13 Q2 13
0%
10%
20%
30%
40%
0
250
500
750
1,000
Q2 12 Q3 12 Q4 12 Q1 13 Q2 13
6
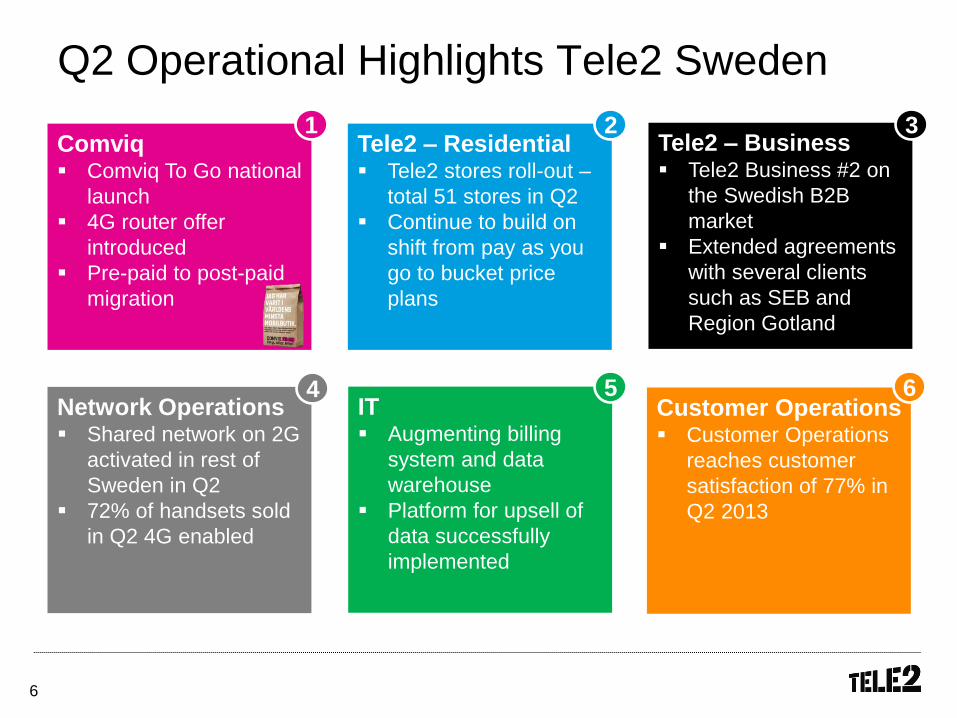
Q2 Operational Highlights Tele2 Sweden
Tele2 – Residential Tele2 stores roll-out –
total 51 stores in Q2
Continue to build on
shift from pay as you
go to bucket price
plans
2
Network Operations Shared network on 2G
activated in rest of
Sweden in Q2
72% of handsets sold
in Q2 4G enabled
4
Comviq Comviq To Go national
launch
4G router offer
introduced
Pre-paid to post-paid
migration
1
Customer Operations Customer Operations
reaches customer
satisfaction of 77% in
Q2 2013
6
Tele2 – Business Tele2 Business #2 on
the Swedish B2B
market
Extended agreements
with several clients
such as SEB and
Region Gotland
3
IT Augmenting billing
system and data
warehouse
Platform for upsell of
data successfully
implemented
5
7
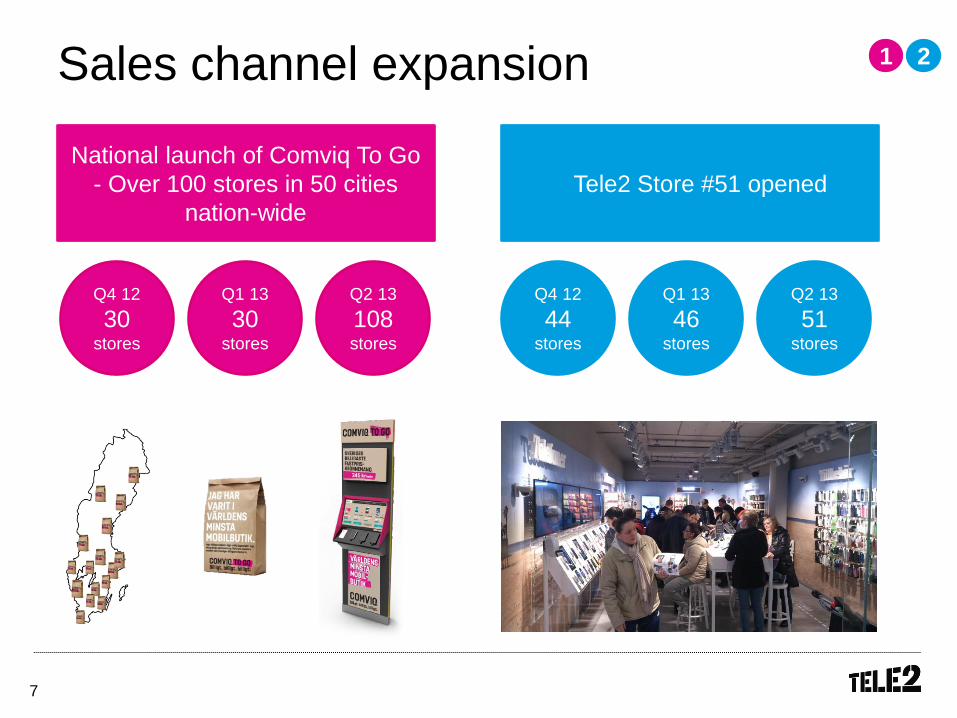
Sales channel expansion
National launch of Comviq To Go
- Over 100 stores in 50 cities
nation-wide
Tele2 Store #51 opened
Q4 12
44 stores
Q1 13
46
stores
Q2 13
51
stores
Q4 12
30
stores
Q1 13
30
stores
Q2 13
108 stores
1 2
8
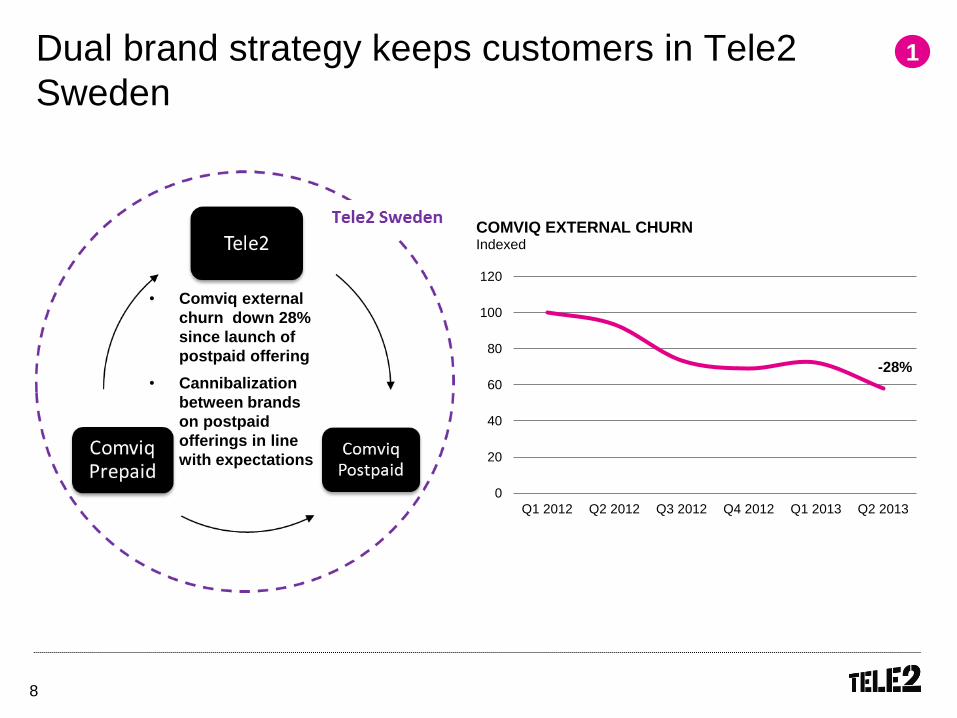
Dual brand strategy keeps customers in Tele2
Sweden
• Comviq external
churn down 28%
since launch of
postpaid offering
• Cannibalization
between brands
on postpaid
offerings in line
with expectations
0
20
40
60
80
100
120
Q1 2012 Q2 2012 Q3 2012 Q4 2012 Q1 2013 Q2 2013
COMVIQ EXTERNAL CHURN Indexed
-28%
1
9
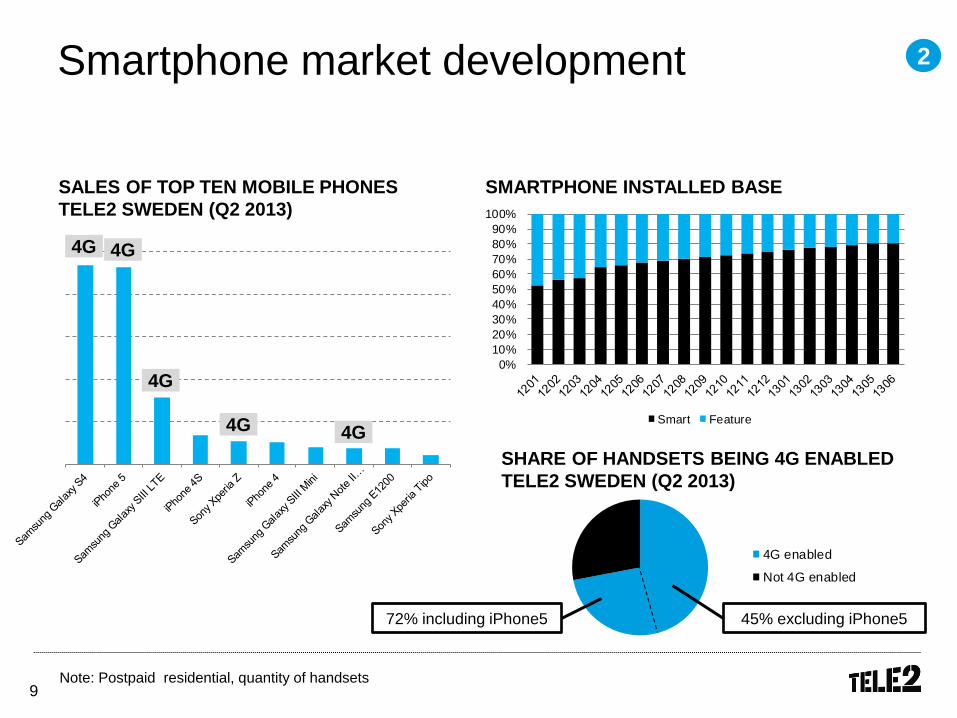
Smartphone market development
SMARTPHONE INSTALLED BASE SALES OF TOP TEN MOBILE PHONES
TELE2 SWEDEN (Q2 2013)
4G
2
4G
4G 4G
4G
Note: Postpaid residential, quantity of handsets
0%
10%
20%
30%
40%
50%
60%
70%
80%
90%
100%
SMARTPHONE INSTALLED BASE
Smart Feature
SHARE OF HANDSETS BEING 4G ENABLED
TELE2 SWEDEN (Q2 2013)
4G enabled
Not 4G enabled
4G enabled
Not 4G enabled
45% excluding iPhone5 72% including iPhone5
10
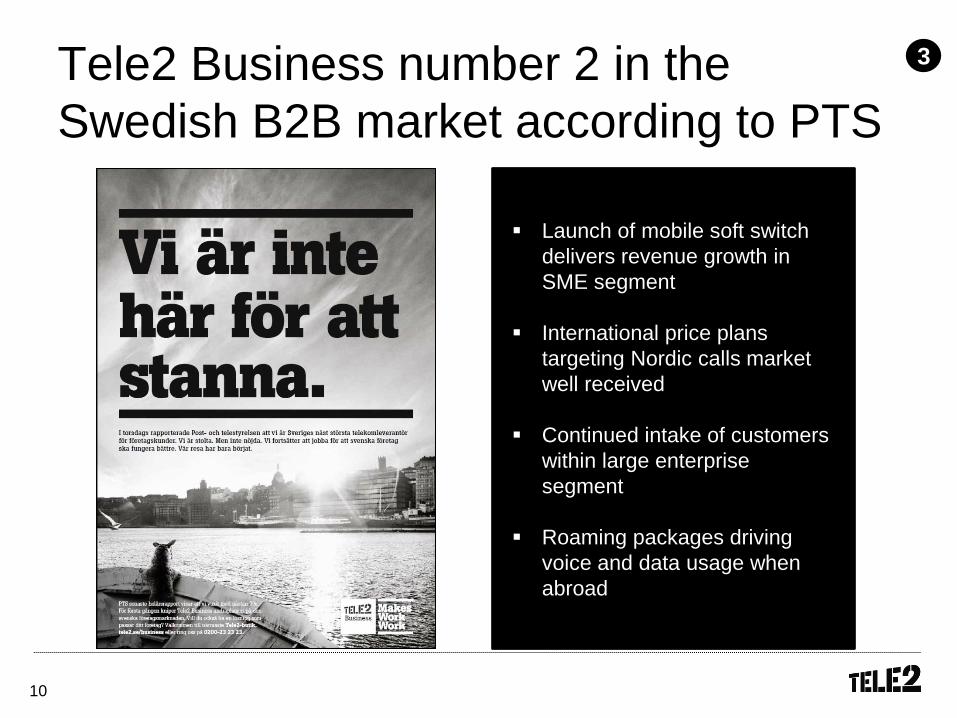
Tele2 Business number 2 in the
Swedish B2B market according to PTS
Launch of mobile soft switch
delivers revenue growth in
SME segment
International price plans
targeting Nordic calls market
well received
Continued intake of customers
within large enterprise
segment
Roaming packages driving
voice and data usage when
abroad
3
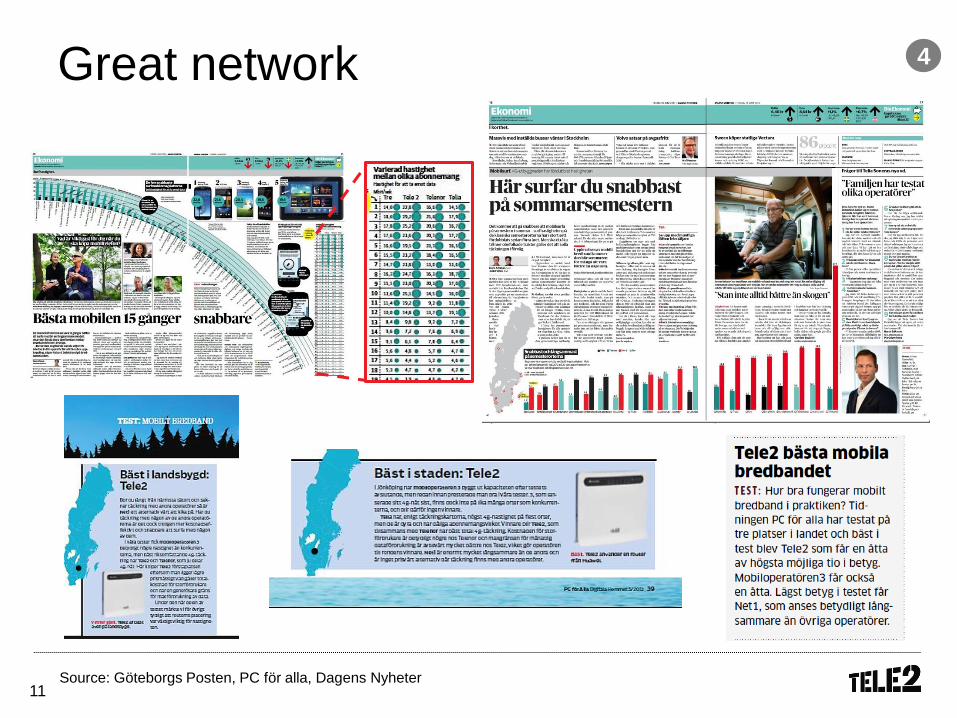
11 Source: Göteborgs Posten, PC för alla, Dagens Nyheter
Great network
4
12
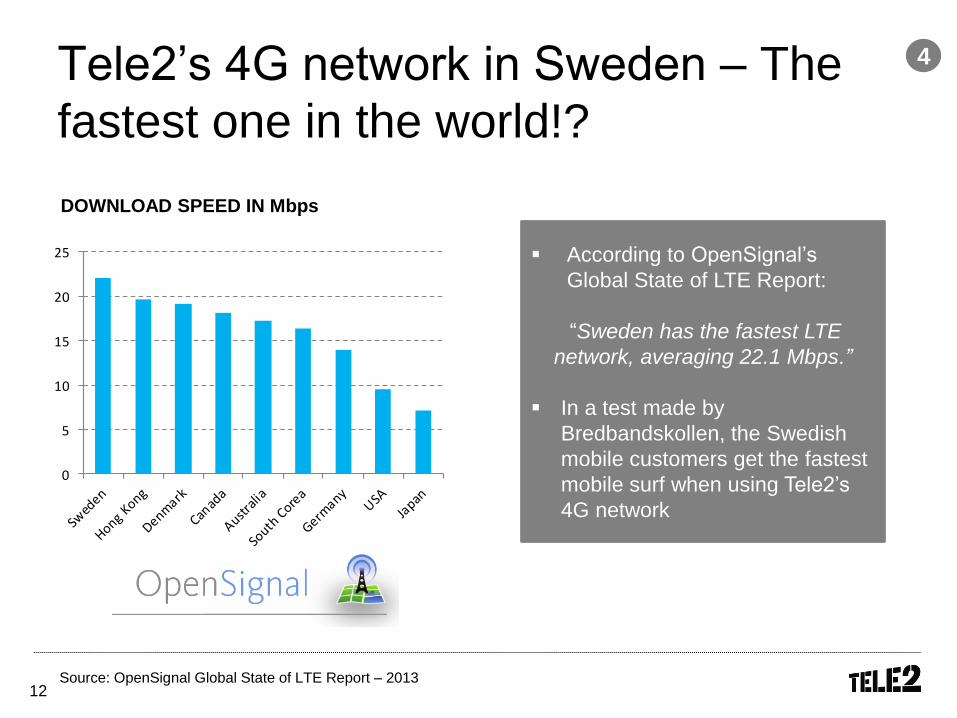
Tele2’s 4G network in Sweden – The
fastest one in the world!?
0
5
10
15
20
25
Speed in Mbps
Source: OpenSignal Global State of LTE Report – 2013
DOWNLOAD SPEED IN Mbps
According to OpenSignal’s
Global State of LTE Report:
“Sweden has the fastest LTE
network, averaging 22.1 Mbps.”
In a test made by
Bredbandskollen, the Swedish
mobile customers get the fastest
mobile surf when using Tele2’s
4G network
4
13
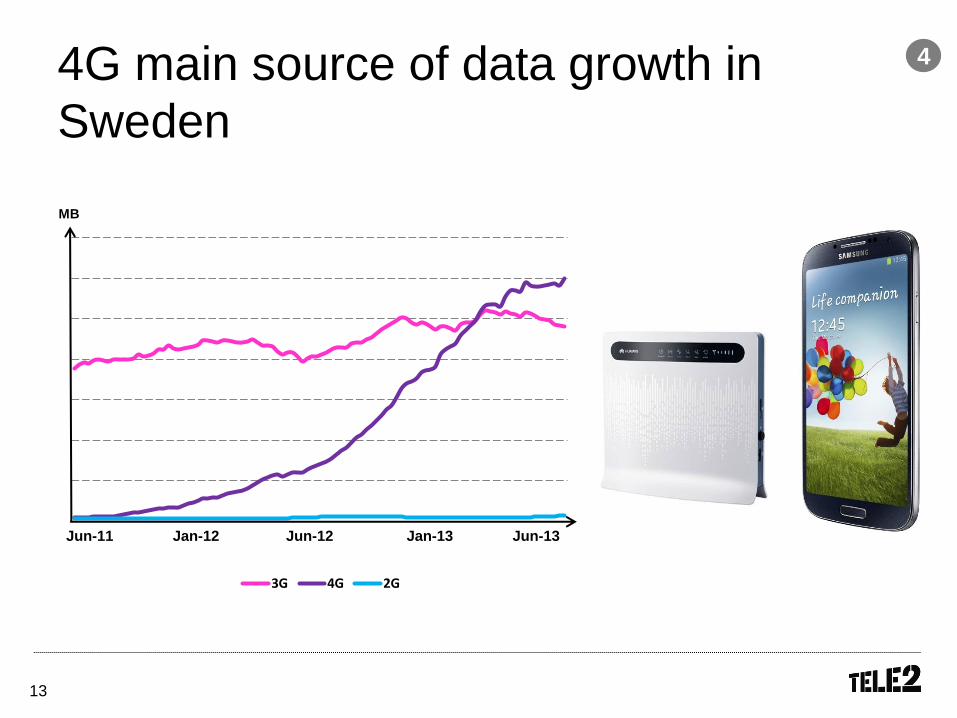
4G main source of data growth in
Sweden
3G 4G 2G
Jun-11 Jun-12 Jan-12 Jan-13
MB
Jun-13
4
14
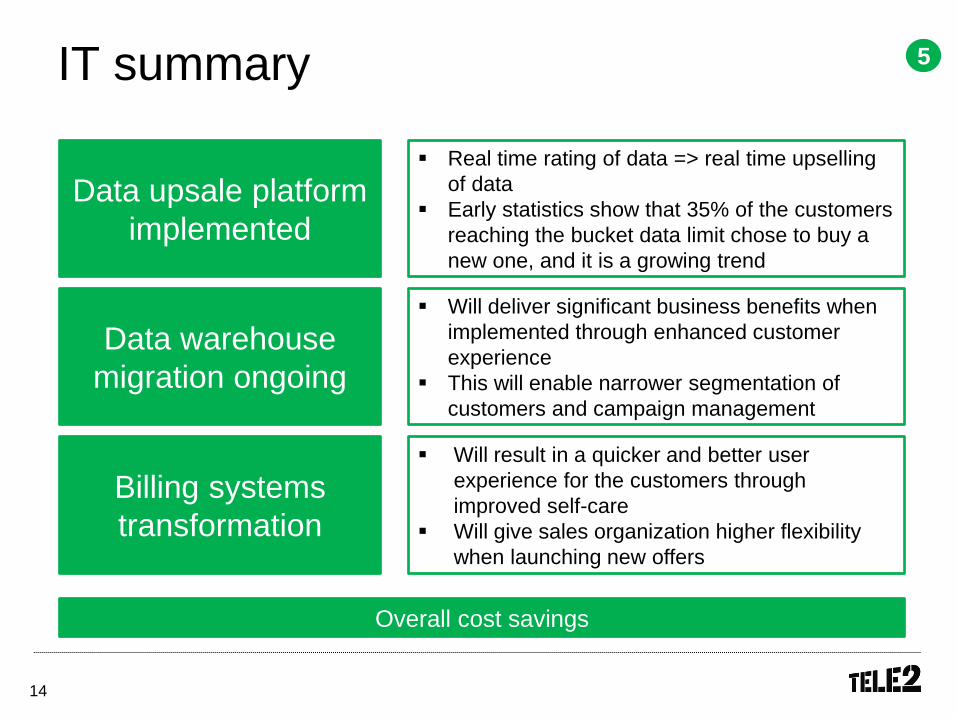
IT summary 5
Billing systems
transformation
Data warehouse
migration ongoing
Data upsale platform
implemented
Real time rating of data => real time upselling
of data
Early statistics show that 35% of the customers
reaching the bucket data limit chose to buy a
new one, and it is a growing trend
Will deliver significant business benefits when
implemented through enhanced customer
experience
This will enable narrower segmentation of
customers and campaign management
Will result in a quicker and better user
experience for the customers through
improved self-care
Will give sales organization higher flexibility
when launching new offers
Overall cost savings
15
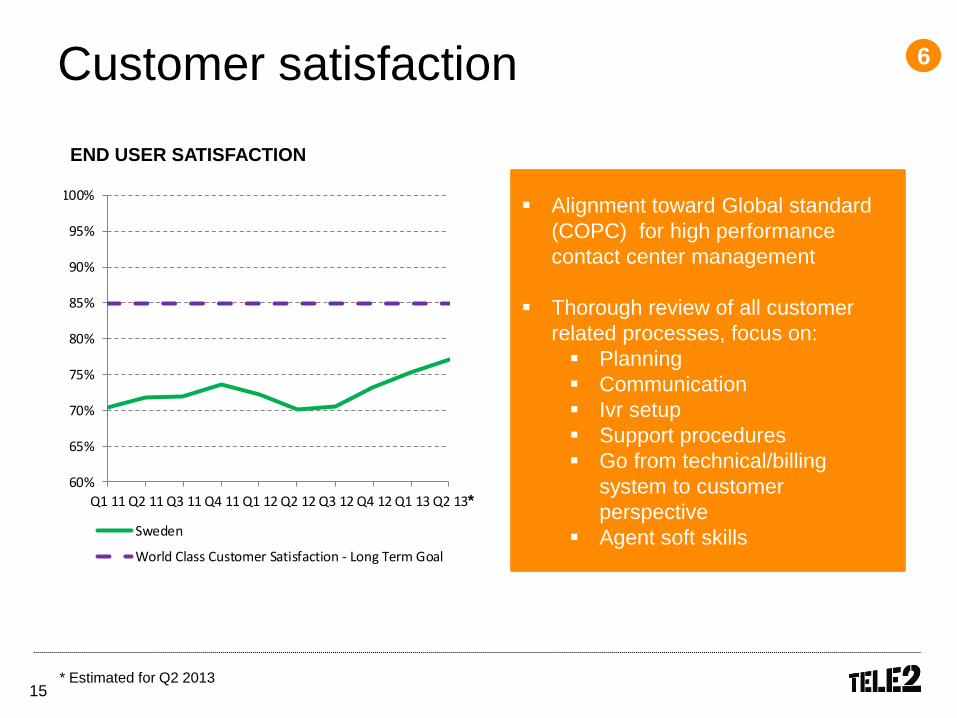
Alignment toward Global standard
(COPC) for high performance
contact center management
Thorough review of all customer
related processes, focus on:
Planning
Communication
Ivr setup
Support procedures
Go from technical/billing
system to customer
perspective
Agent soft skills
Customer satisfaction 6
* Estimated for Q2 2013
END USER SATISFACTION
60%
65%
70%
75%
80%
85%
90%
95%
100%
Q1 11 Q2 11 Q3 11 Q4 11 Q1 12 Q2 12 Q3 12 Q4 12 Q1 13 Q2 13
Sweden
World Class Customer Satisfaction - Long Term Goal
*
16
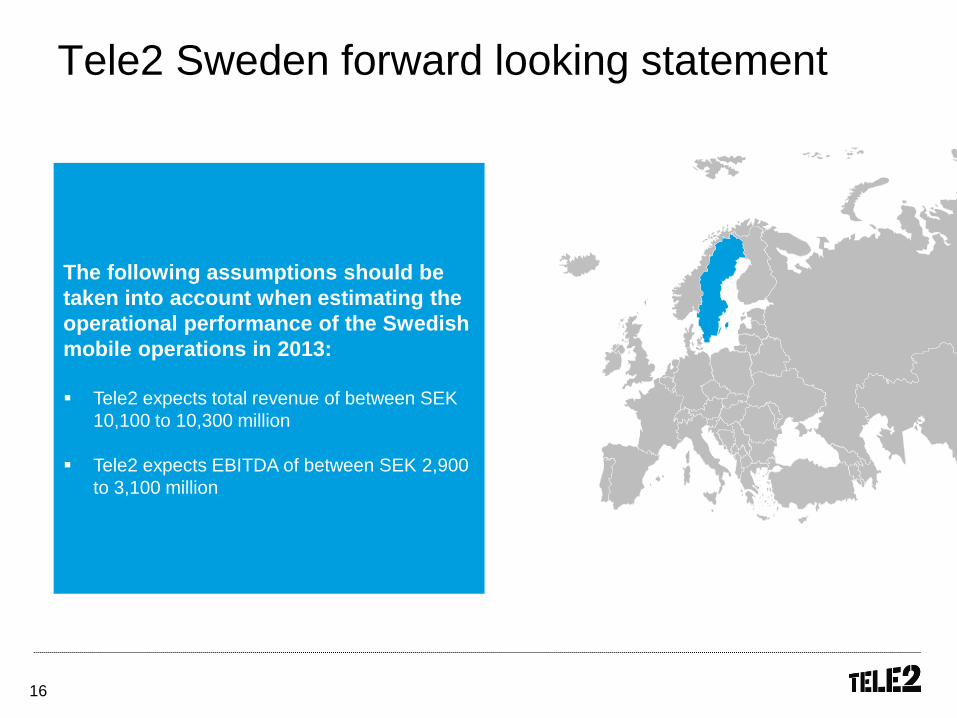
Tele2 Sweden forward looking statement
The following assumptions should be
taken into account when estimating the
operational performance of the Swedish
mobile operations in 2013:
Tele2 expects total revenue of between SEK
10,100 to 10,300 million
Tele2 expects EBITDA of between SEK 2,900
to 3,100 million
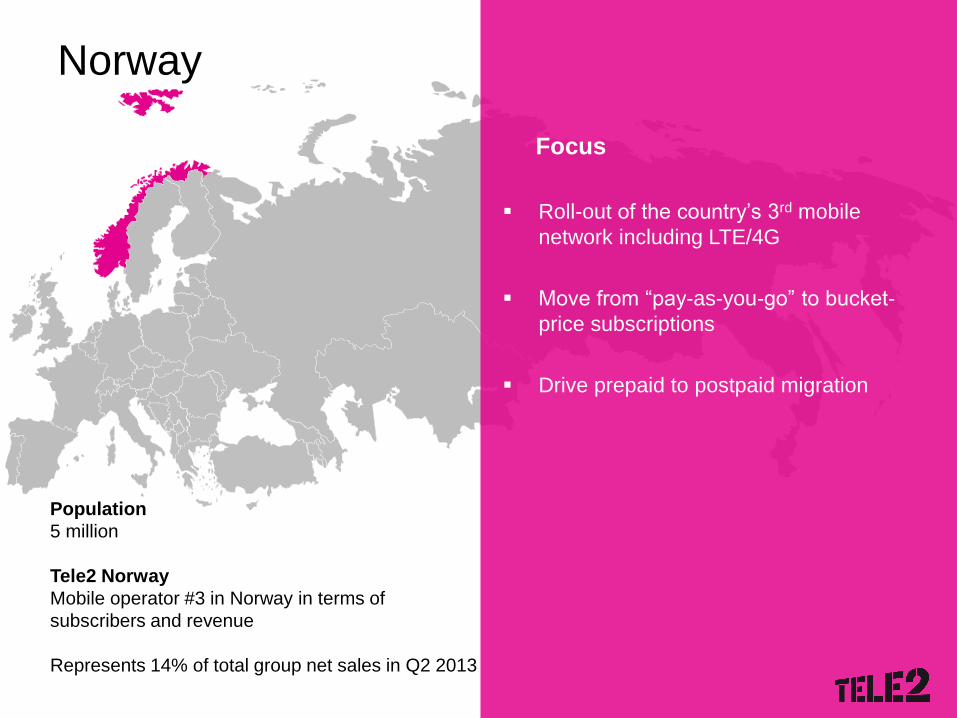
Norway
Roll-out of the country’s 3rd mobile
network including LTE/4G
Move from “pay-as-you-go” to bucket-
price subscriptions
Drive prepaid to postpaid migration
Focus
Population
5 million
Tele2 Norway
Mobile operator #3 in Norway in terms of
subscribers and revenue
Represents 14% of total group net sales in Q2 2013
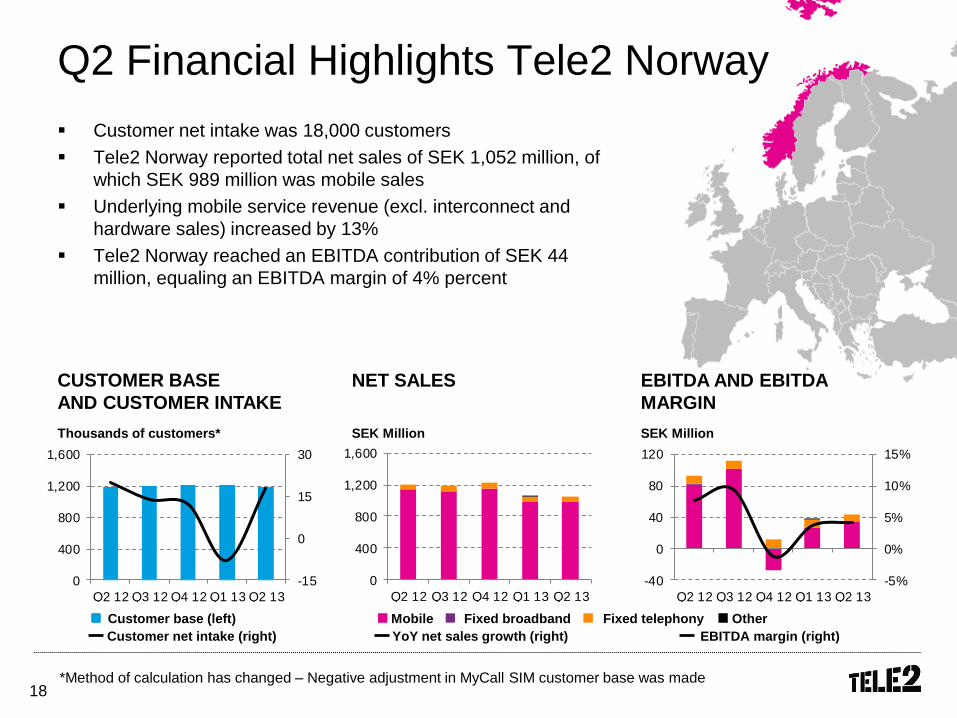
18 *Method of calculation has changed – Negative adjustment in MyCall SIM customer base was made
Q2 Financial Highlights Tele2 Norway
Customer net intake was 18,000 customers
Tele2 Norway reported total net sales of SEK 1,052 million, of
which SEK 989 million was mobile sales
Underlying mobile service revenue (excl. interconnect and
hardware sales) increased by 13%
Tele2 Norway reached an EBITDA contribution of SEK 44
million, equaling an EBITDA margin of 4% percent
Mobile Fixed telephony Fixed broadband Other Customer base (left)
Customer net intake (right) EBITDA margin (right) YoY net sales growth (right)
SEK Million SEK Million Thousands of customers*
EBITDA AND EBITDA
MARGIN
NET SALES CUSTOMER BASE
AND CUSTOMER INTAKE
-15
0
15
30
0
400
800
1,200
1,600
Q2 12 Q3 12 Q4 12 Q1 13 Q2 13
0
400
800
1,200
1,600
Q2 12 Q3 12 Q4 12 Q1 13 Q2 13
-5%
0%
5%
10%
15%
-40
0
40
80
120
Q2 12 Q3 12 Q4 12 Q1 13 Q2 13
19
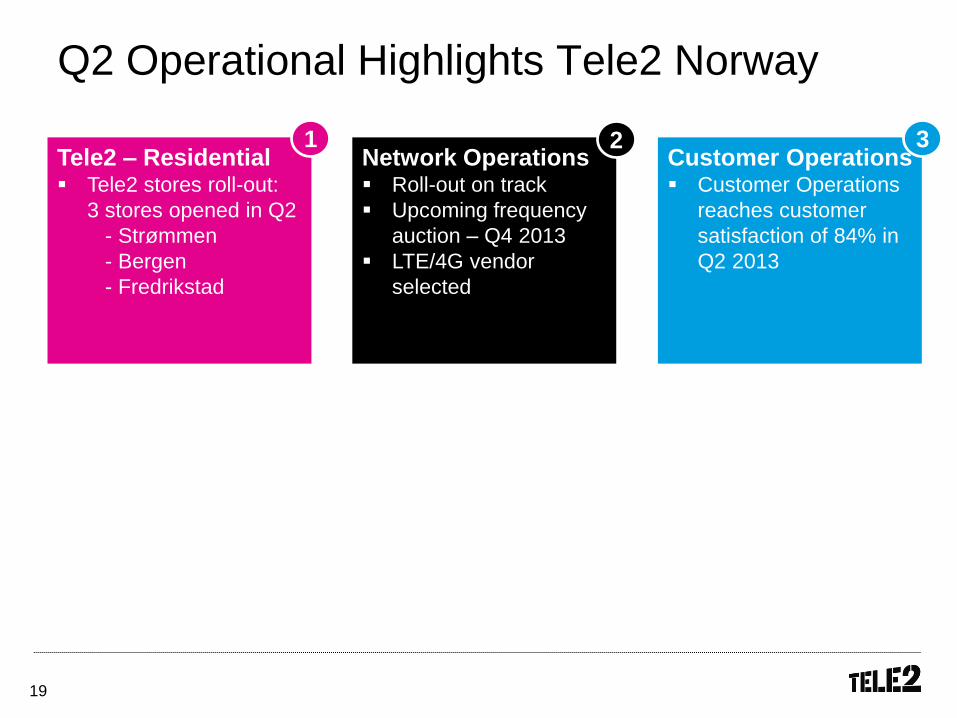
Q2 Operational Highlights Tele2 Norway
Tele2 – Residential Tele2 stores roll-out:
3 stores opened in Q2
- Strømmen
- Bergen
- Fredrikstad
1 Customer Operations Customer Operations
reaches customer
satisfaction of 84% in
Q2 2013
3 Network Operations Roll-out on track
Upcoming frequency
auction – Q4 2013
LTE/4G vendor
selected
2
20
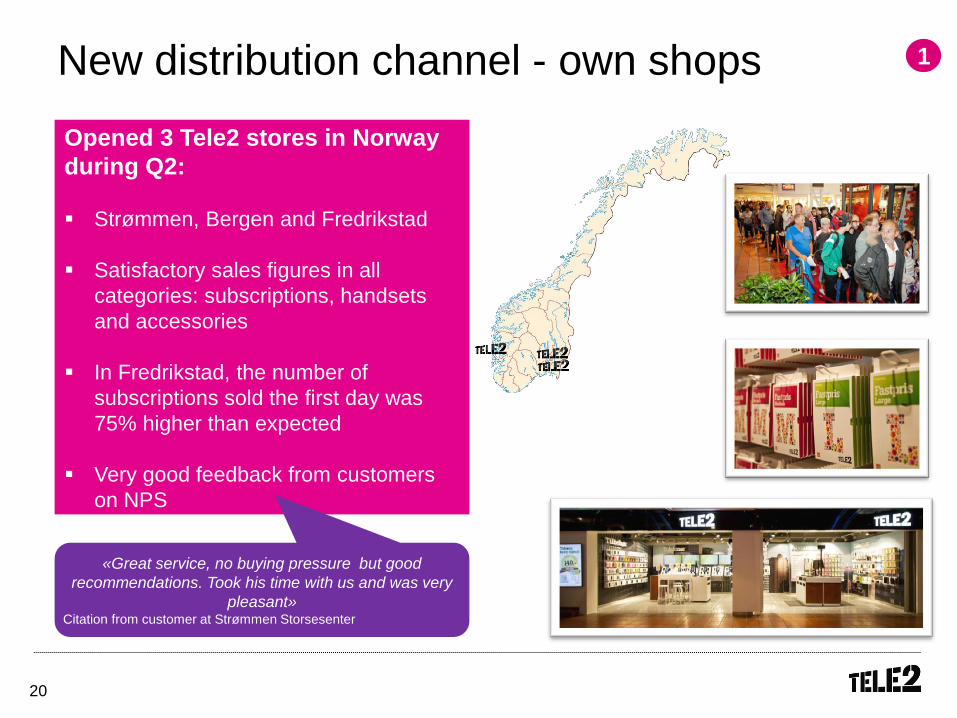
New distribution channel - own shops
Opened 3 Tele2 stores in Norway
during Q2:
Strømmen, Bergen and Fredrikstad
Satisfactory sales figures in all
categories: subscriptions, handsets
and accessories
In Fredrikstad, the number of
subscriptions sold the first day was
75% higher than expected
Very good feedback from customers
on NPS
1
«Great service, no buying pressure but good
recommendations. Took his time with us and was very
pleasant» Citation from customer at Strømmen Storsesenter
21
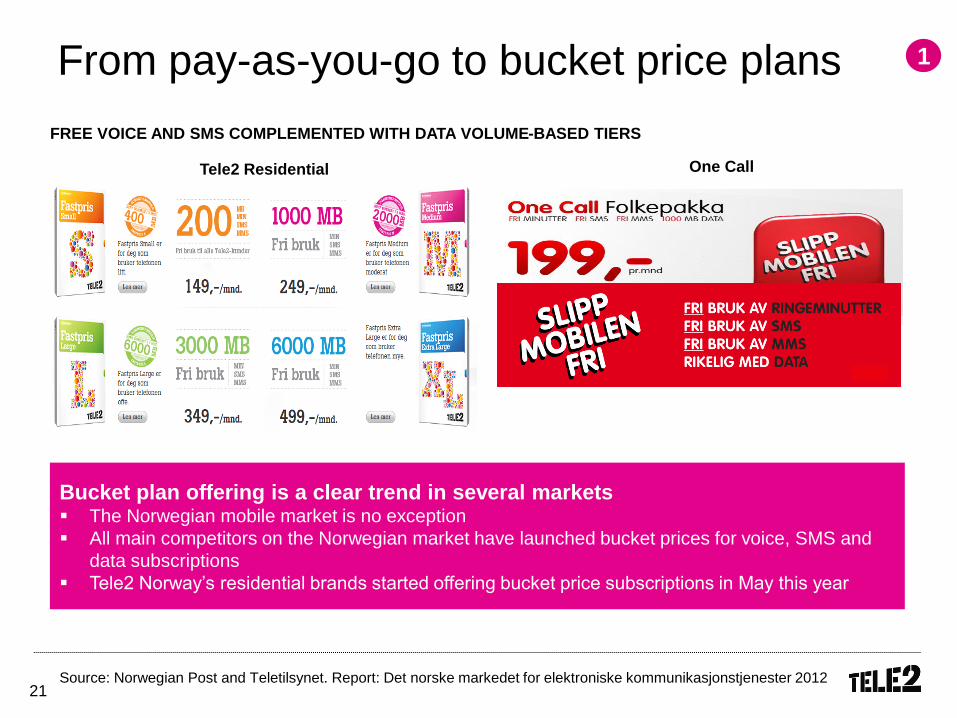
From pay-as-you-go to bucket price plans
Bucket plan offering is a clear trend in several markets The Norwegian mobile market is no exception
All main competitors on the Norwegian market have launched bucket prices for voice, SMS and
data subscriptions
Tele2 Norway’s residential brands started offering bucket price subscriptions in May this year
Tele2 Residential One Call
FREE VOICE AND SMS COMPLEMENTED WITH DATA VOLUME-BASED TIERS
1
Source: Norwegian Post and Teletilsynet. Report: Det norske markedet for elektroniske kommunikasjonstjenester 2012
22
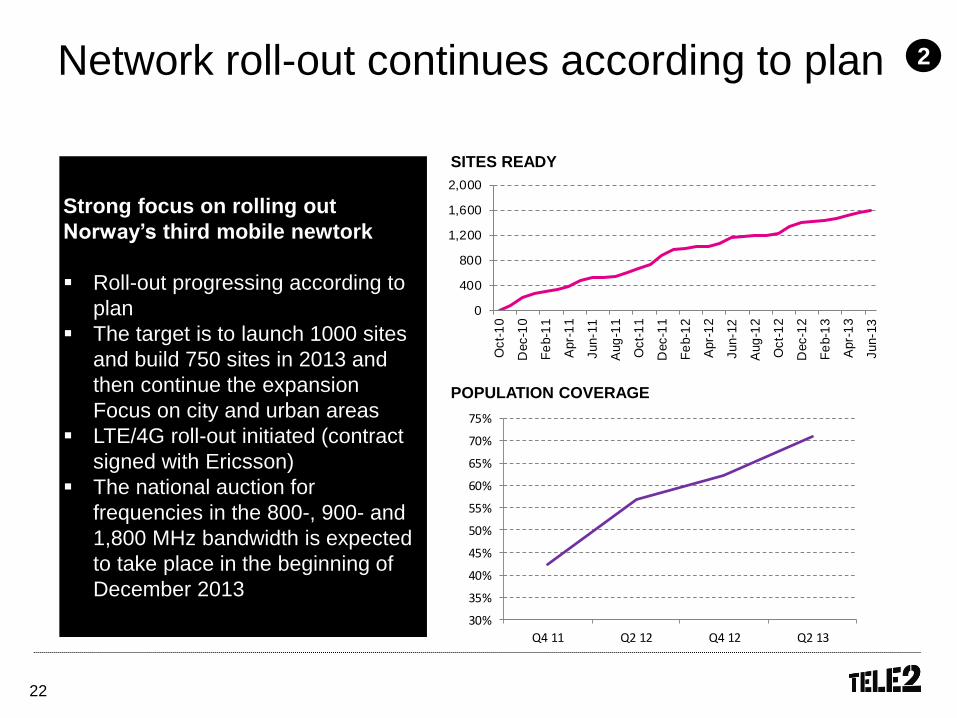
Network roll-out continues according to plan
Strong focus on rolling out
Norway’s third mobile newtork
Roll-out progressing according to
plan
The target is to launch 1000 sites
and build 750 sites in 2013 and
then continue the expansion
Focus on city and urban areas
LTE/4G roll-out initiated (contract
signed with Ericsson)
The national auction for
frequencies in the 800-, 900- and
1,800 MHz bandwidth is expected
to take place in the beginning of
December 2013
SITES READY
2
POPULATION COVERAGE
0
400
800
1,200
1,600
2,000
Oct-
10
Dec-1
0
Fe
b-1
1
Apr-
11
Jun-1
1
Aug
-11
Oct-
11
Dec-1
1
Fe
b-1
2
Apr-
12
Jun-1
2
Aug
-12
Oct-
12
Dec-1
2
Fe
b-1
3
Apr-
13
Jun-1
3
30%
35%
40%
45%
50%
55%
60%
65%
70%
75%
Q4 11 Q2 12 Q4 12 Q2 13
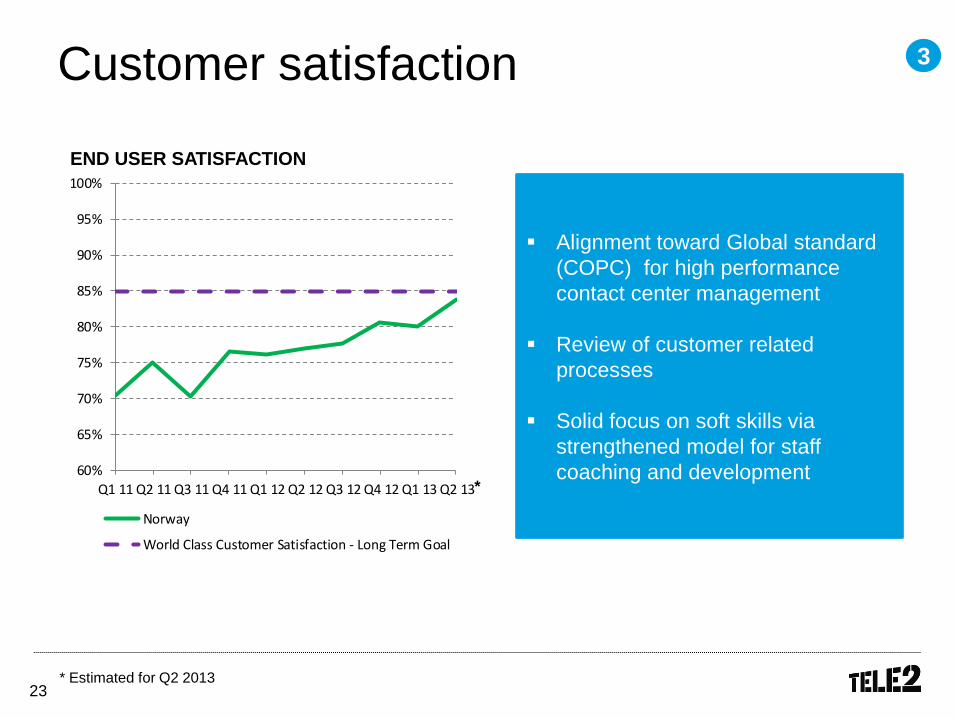
23
Alignment toward Global standard
(COPC) for high performance
contact center management
Review of customer related
processes
Solid focus on soft skills via
strengthened model for staff
coaching and development
Customer satisfaction 3
* Estimated for Q2 2013
END USER SATISFACTION
60%
65%
70%
75%
80%
85%
90%
95%
100%
Q1 11 Q2 11 Q3 11 Q4 11 Q1 12 Q2 12 Q3 12 Q4 12 Q1 13 Q2 13
Norway
World Class Customer Satisfaction - Long Term Goal
*
24
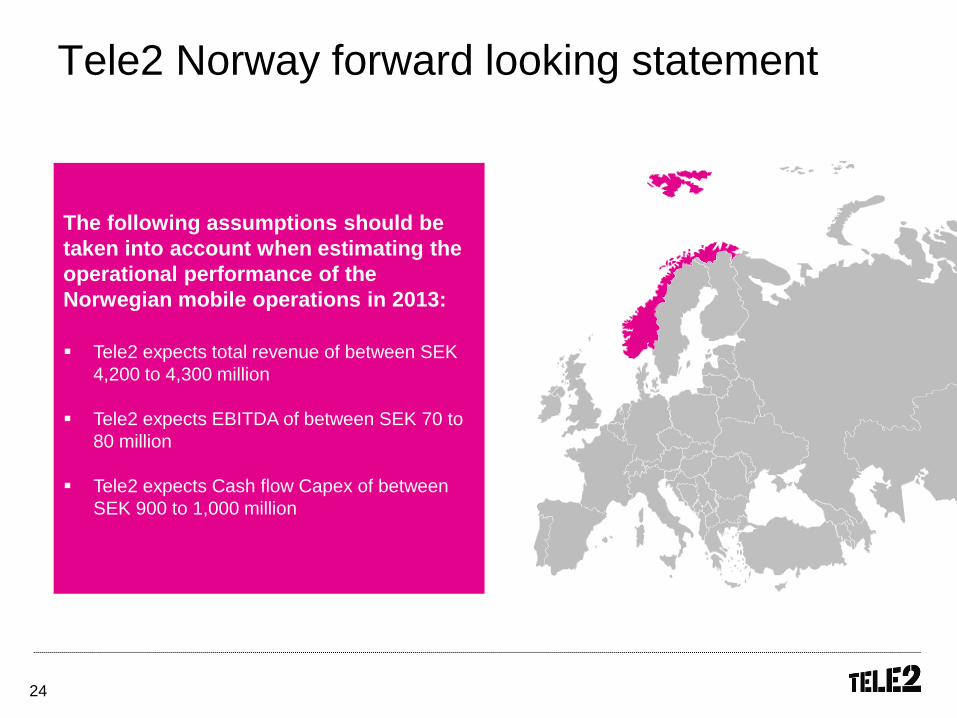
Tele2 Norway forward looking statement
The following assumptions should be
taken into account when estimating the
operational performance of the
Norwegian mobile operations in 2013:
Tele2 expects total revenue of between SEK
4,200 to 4,300 million
Tele2 expects EBITDA of between SEK 70 to
80 million
Tele2 expects Cash flow Capex of between
SEK 900 to 1,000 million
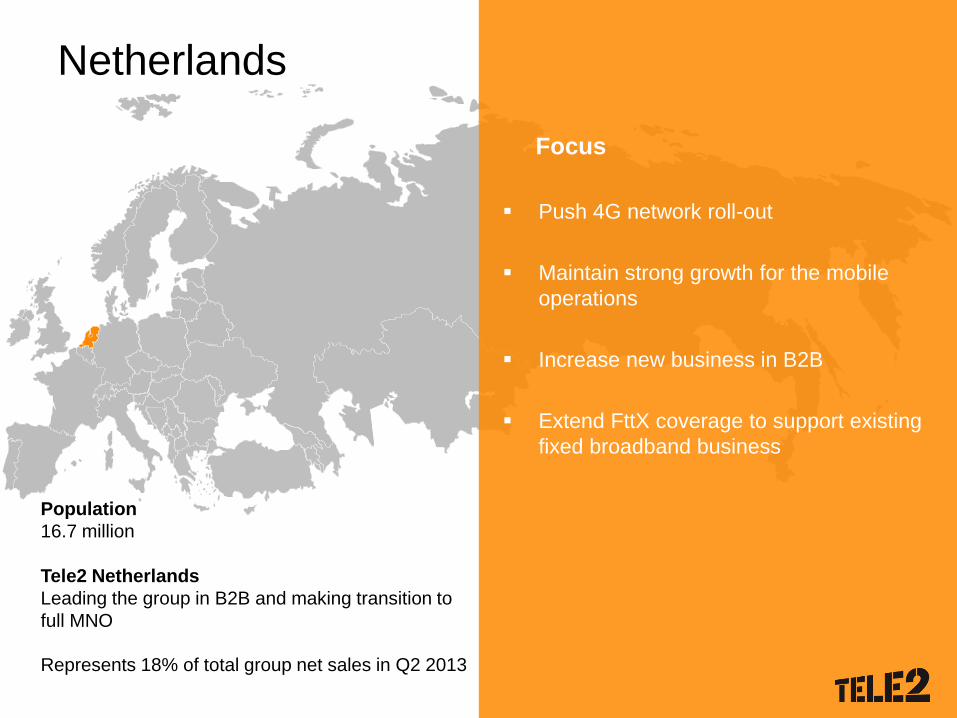
Netherlands
Push 4G network roll-out
Maintain strong growth for the mobile
operations
Increase new business in B2B
Extend FttX coverage to support existing
fixed broadband business
Focus
Population
16.7 million
Tele2 Netherlands
Leading the group in B2B and making transition to
full MNO
Represents 18% of total group net sales in Q2 2013
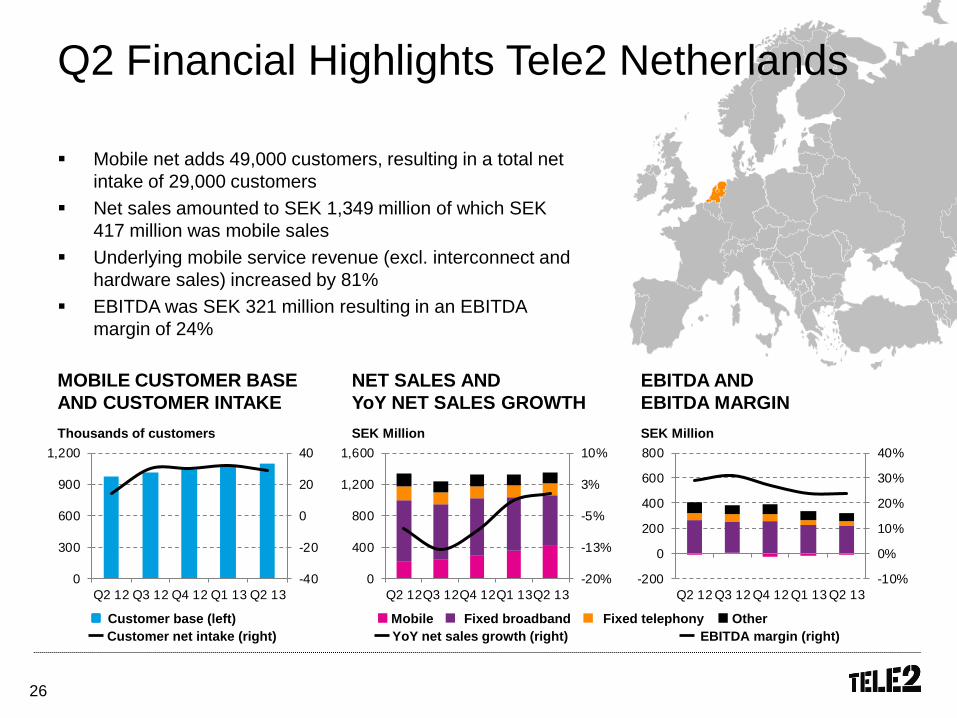
26
Mobile net adds 49,000 customers, resulting in a total net
intake of 29,000 customers
Net sales amounted to SEK 1,349 million of which SEK
417 million was mobile sales
Underlying mobile service revenue (excl. interconnect and
hardware sales) increased by 81%
EBITDA was SEK 321 million resulting in an EBITDA
margin of 24%
Q2 Financial Highlights Tele2 Netherlands
SEK Million SEK Million Thousands of customers
EBITDA AND
EBITDA MARGIN
NET SALES AND
YoY NET SALES GROWTH
MOBILE CUSTOMER BASE
AND CUSTOMER INTAKE
Mobile Fixed telephony Fixed broadband Other Customer base (left)
Customer net intake (right) EBITDA margin (right) YoY net sales growth (right)
-20%
-13%
-5%
3%
10%
0
400
800
1,200
1,600
Q2 12Q3 12Q4 12Q1 13Q2 13
-10%
0%
10%
20%
30%
40%
-200
0
200
400
600
800
Q2 12 Q3 12 Q4 12 Q1 13 Q2 13
-40
-20
0
20
40
0
300
600
900
1,200
Q2 12 Q3 12 Q4 12 Q1 13 Q2 13
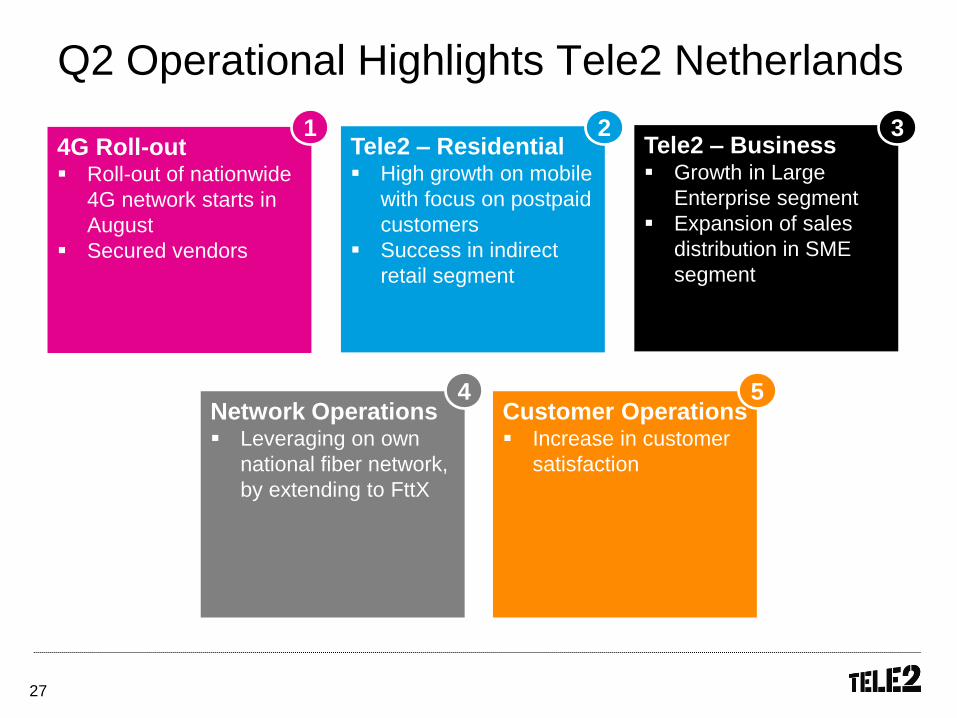
27
Tele2 – Business Growth in Large
Enterprise segment
Expansion of sales
distribution in SME
segment
3
Q2 Operational Highlights Tele2 Netherlands
4G Roll-out Roll-out of nationwide
4G network starts in
August
Secured vendors
1 Tele2 – Residential High growth on mobile
with focus on postpaid
customers
Success in indirect
retail segment
2
Network Operations Leveraging on own
national fiber network,
by extending to FttX
4 Customer Operations Increase in customer
satisfaction
5
28
4G Network roll-out update 1
Network roll out starts in August
v
Secured vendors for radio, core and IMS
v
Our 4G network will contain 3,500-4,000 sites at
completion
v
We will build a competitive high quality ‘4G-only’
network
v
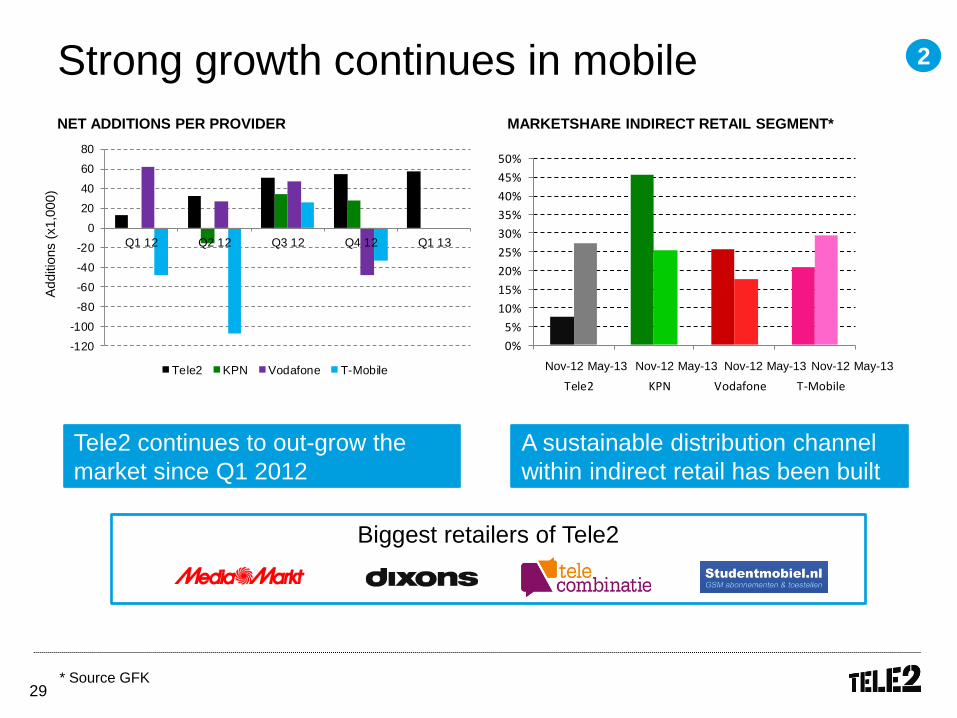
29 * Source GFK
Tele2 continues to out-grow the
market since Q1 2012
NET ADDITIONS PER PROVIDER
Strong growth continues in mobile
A sustainable distribution channel
within indirect retail has been built
MARKETSHARE INDIRECT RETAIL SEGMENT*
2
Biggest retailers of Tele2
Additio
ns (
x1,0
00)
Nov-12 May-13 Nov-12 May-13 Nov-12 May-13 Nov-12 May-13
0%
5%
10%
15%
20%
25%
30%
35%
40%
45%
50%
Tele2 KPN Vodafone T-Mobile0%
5%
10%
15%
20%
25%
30%
35%
40%
45%
50%
Tele2 KPN Vodafone T-Mobile
-120
-100
-80
-60
-40
-20
0
20
40
60
80
Q1 12 Q2 12 Q3 12 Q4 12 Q1 13
Tele2 KPN Vodafone T-Mobile
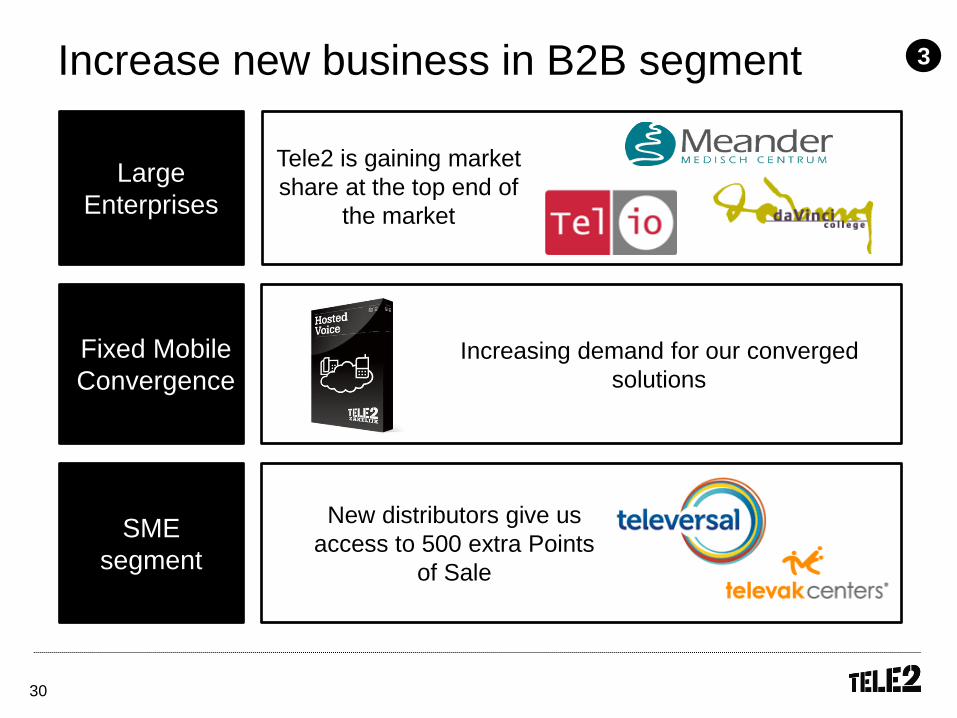
30
Large
Enterprises
Tele2 is gaining market
share at the top end of
the market
SME
segment
New distributors give us
access to 500 extra Points
of Sale
Fixed Mobile
Convergence
Increasing demand for our converged
solutions
Increase new business in B2B segment
3
31
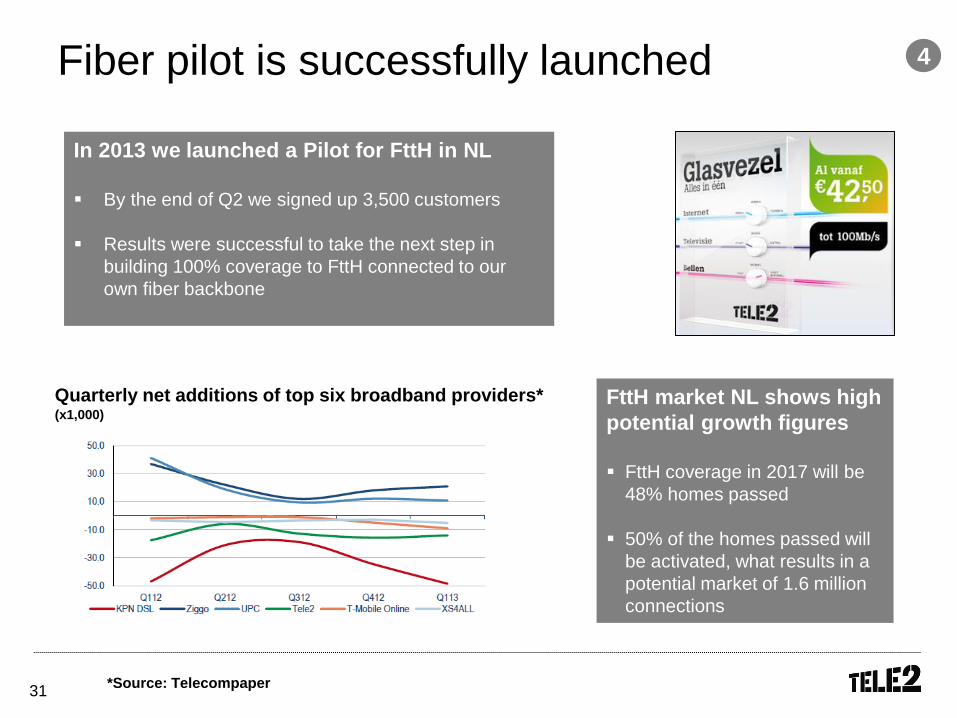
Fiber pilot is successfully launched
*Source: Telecompaper
Quarterly net additions of top six broadband providers* (x1,000)
FttH market NL shows high
potential growth figures
FttH coverage in 2017 will be
48% homes passed
50% of the homes passed will
be activated, what results in a
potential market of 1.6 million
connections
In 2013 we launched a Pilot for FttH in NL
By the end of Q2 we signed up 3,500 customers
Results were successful to take the next step in
building 100% coverage to FttH connected to our
own fiber backbone
4
32
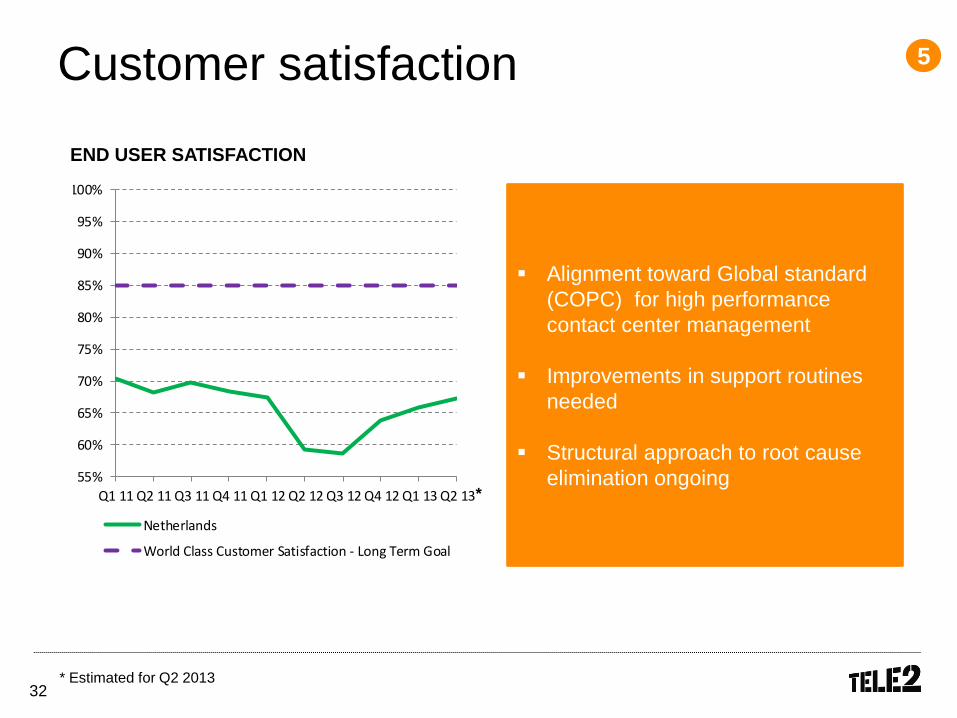
Customer satisfaction 5
Alignment toward Global standard
(COPC) for high performance
contact center management
Improvements in support routines
needed
Structural approach to root cause
elimination ongoing
* Estimated for Q2 2013
END USER SATISFACTION
55%
60%
65%
70%
75%
80%
85%
90%
95%
100%
Q1 11 Q2 11 Q3 11 Q4 11 Q1 12 Q2 12 Q3 12 Q4 12 Q1 13 Q2 13
Netherlands
World Class Customer Satisfaction - Long Term Goal
*
33
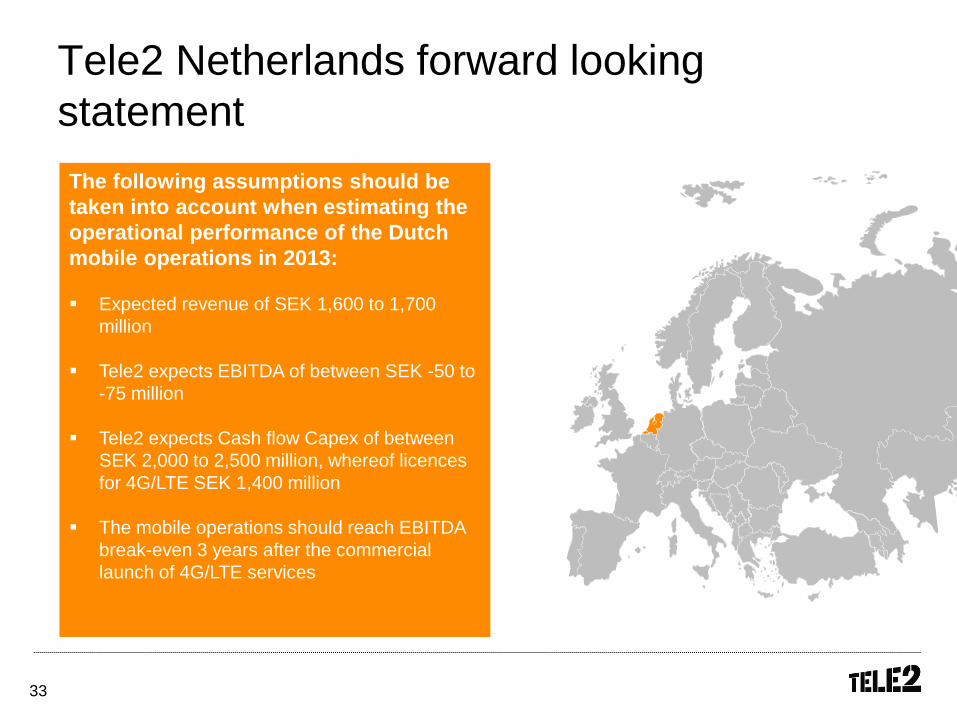
Tele2 Netherlands forward looking
statement
The following assumptions should be
taken into account when estimating the
operational performance of the Dutch
mobile operations in 2013:
Expected revenue of SEK 1,600 to 1,700
million
Tele2 expects EBITDA of between SEK -50 to
-75 million
Tele2 expects Cash flow Capex of between
SEK 2,000 to 2,500 million, whereof licences
for 4G/LTE SEK 1,400 million
The mobile operations should reach EBITDA
break-even 3 years after the commercial
launch of 4G/LTE services
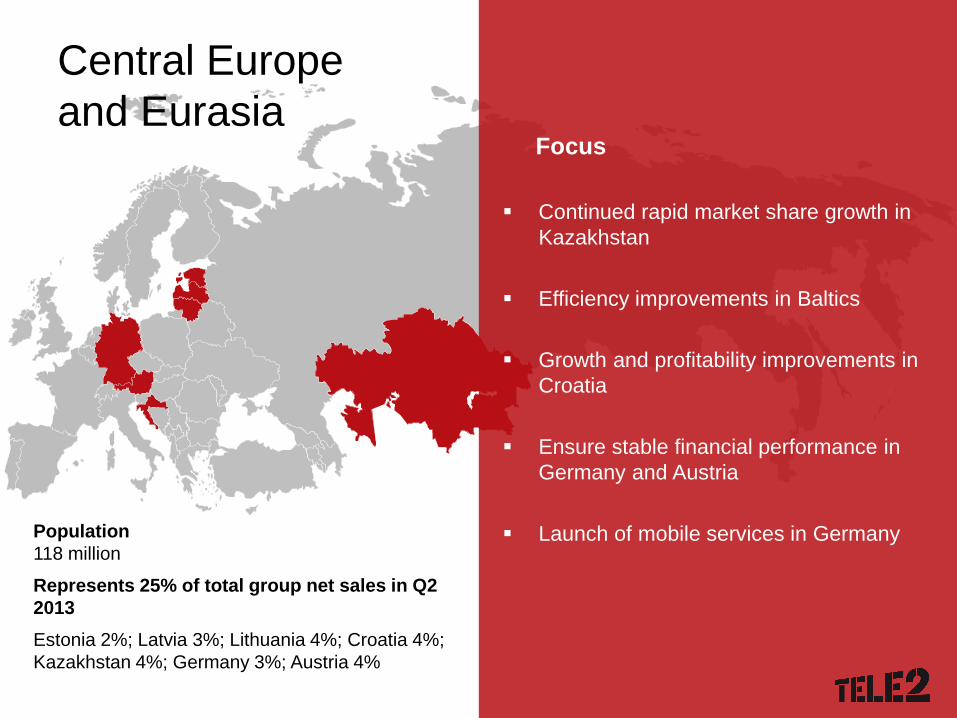
Continued rapid market share growth in
Kazakhstan
Efficiency improvements in Baltics
Growth and profitability improvements in
Croatia
Ensure stable financial performance in
Germany and Austria
Launch of mobile services in Germany
Focus
Central Europe
and Eurasia
Population
118 million
Represents 25% of total group net sales in Q2
2013
Estonia 2%; Latvia 3%; Lithuania 4%; Croatia 4%;
Kazakhstan 4%; Germany 3%; Austria 4%
35
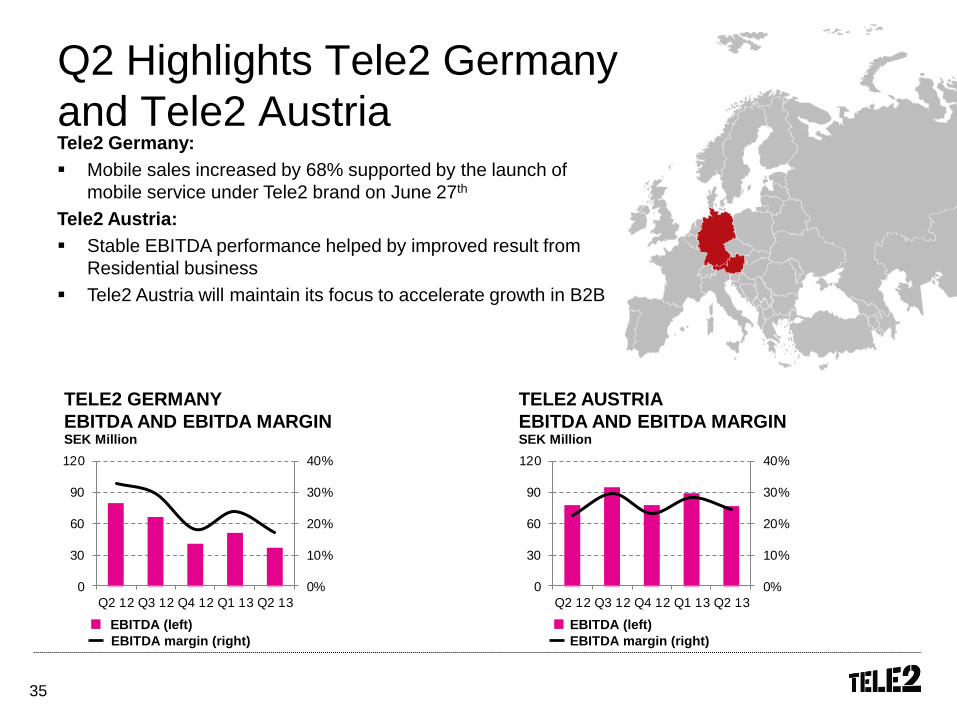
Q2 Highlights Tele2 Germany
and Tele2 Austria Tele2 Germany:
Mobile sales increased by 68% supported by the launch of
mobile service under Tele2 brand on June 27th
Tele2 Austria:
Stable EBITDA performance helped by improved result from
Residential business
Tele2 Austria will maintain its focus to accelerate growth in B2B
TELE2 GERMANY
EBITDA AND EBITDA MARGIN
TELE2 AUSTRIA
EBITDA AND EBITDA MARGIN
EBITDA margin (right)
EBITDA (left)
EBITDA margin (right)
EBITDA (left)
SEK Million SEK Million
0%
10%
20%
30%
40%
0
30
60
90
120
Q2 12 Q3 12 Q4 12 Q1 13 Q2 13
0%
10%
20%
30%
40%
0
30
60
90
120
Q2 12 Q3 12 Q4 12 Q1 13 Q2 13
36
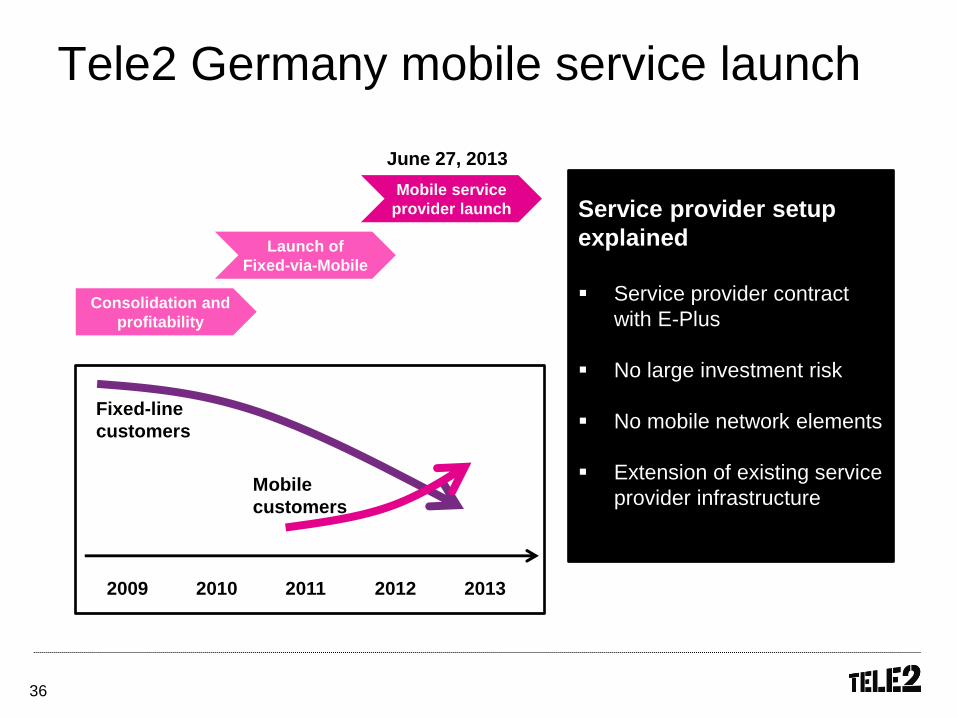
Tele2 Germany mobile service launch
Consolidation and
profitability
Launch of
Fixed-via-Mobile
Mobile service
provider launch
2010 2011 2012 2009 2013
Fixed-line
customers
Mobile
customers
June 27, 2013
Service provider setup
explained
Service provider contract
with E-Plus
No large investment risk
No mobile network elements
Extension of existing service
provider infrastructure
37
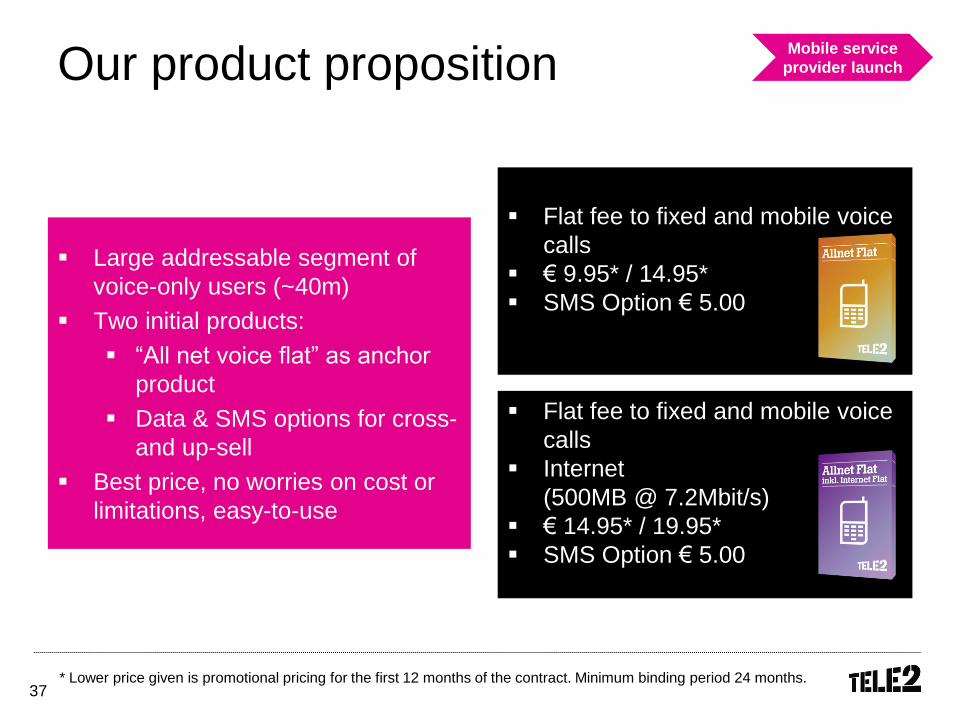
Our product proposition
Large addressable segment of
voice-only users (~40m)
Two initial products:
“All net voice flat” as anchor
product
Data & SMS options for cross-
and up-sell
Best price, no worries on cost or
limitations, easy-to-use
Flat fee to fixed and mobile voice
calls
€ 9.95* / 14.95*
SMS Option € 5.00
Flat fee to fixed and mobile voice
calls
Internet
(500MB @ 7.2Mbit/s)
€ 14.95* / 19.95*
SMS Option € 5.00
* Lower price given is promotional pricing for the first 12 months of the contract. Minimum binding period 24 months.
Mobile service
provider launch
38
0
250
500
750
1,000
Q2 12 Q3 12 Q4 12 Q1 13 Q2 13
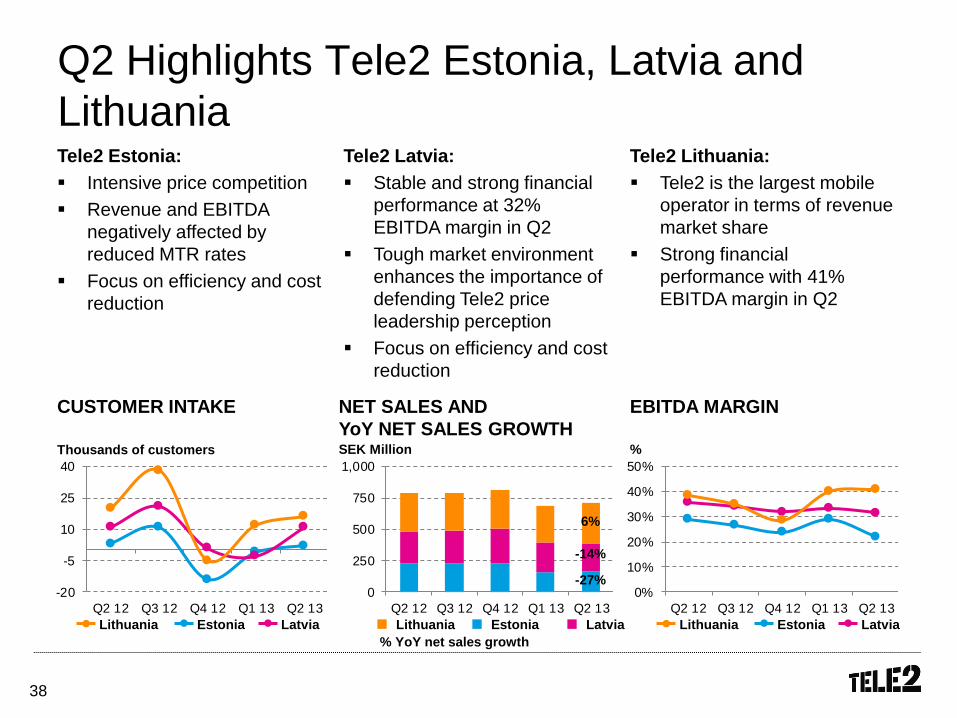
Q2 Highlights Tele2 Estonia, Latvia and
Lithuania
Thousands of customers SEK Million %
Tele2 Estonia:
Intensive price competition
Revenue and EBITDA
negatively affected by
reduced MTR rates
Focus on efficiency and cost
reduction
Tele2 Latvia:
Stable and strong financial
performance at 32%
EBITDA margin in Q2
Tough market environment
enhances the importance of
defending Tele2 price
leadership perception
Focus on efficiency and cost
reduction
Tele2 Lithuania:
Tele2 is the largest mobile
operator in terms of revenue
market share
Strong financial
performance with 41%
EBITDA margin in Q2
CUSTOMER INTAKE NET SALES AND
YoY NET SALES GROWTH
EBITDA MARGIN
6%
-14%
-27%
Lithuania Latvia Estonia Lithuania Latvia Estonia
% YoY net sales growth
Lithuania Latvia Estonia
-20
-5
10
25
40
Q2 12 Q3 12 Q4 12 Q1 13 Q2 13
0%
10%
20%
30%
40%
50%
Q2 12 Q3 12 Q4 12 Q1 13 Q2 13
39
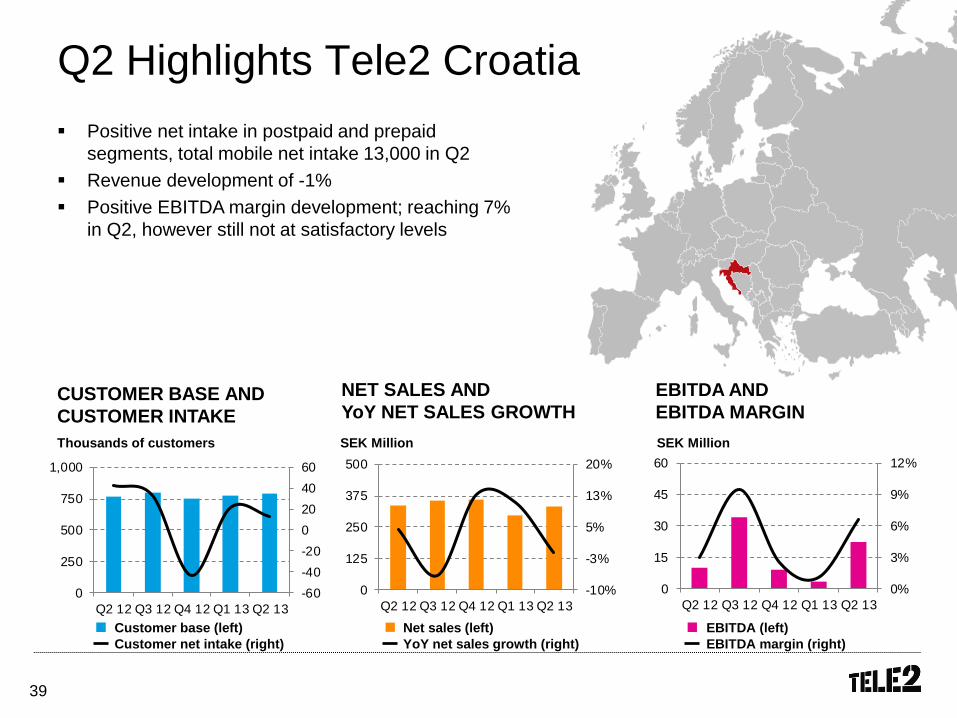
Q2 Highlights Tele2 Croatia
Positive net intake in postpaid and prepaid
segments, total mobile net intake 13,000 in Q2
Revenue development of -1%
Positive EBITDA margin development; reaching 7%
in Q2, however still not at satisfactory levels
CUSTOMER BASE AND
CUSTOMER INTAKE
Thousands of customers
Customer net intake (right)
Customer base (left)
SEK Million
NET SALES AND
YoY NET SALES GROWTH
YoY net sales growth (right)
Net sales (left)
EBITDA AND
EBITDA MARGIN
SEK Million
EBITDA margin (right)
EBITDA (left)
-60
-40
-20
0
20
40
60
0
250
500
750
1,000
Q2 12 Q3 12 Q4 12 Q1 13 Q2 13
-10%
-3%
5%
13%
20%
0
125
250
375
500
Q2 12 Q3 12 Q4 12 Q1 13 Q2 13
0%
3%
6%
9%
12%
0
15
30
45
60
Q2 12 Q3 12 Q4 12 Q1 13 Q2 13
40
0%
10%
20%
30%
40%
50%
60%
70%
80%
90%
100%
Q1 11 Q3 11 Q1 12 Q3 12 Q1 13
Tele2 T-Mobile VIPnet
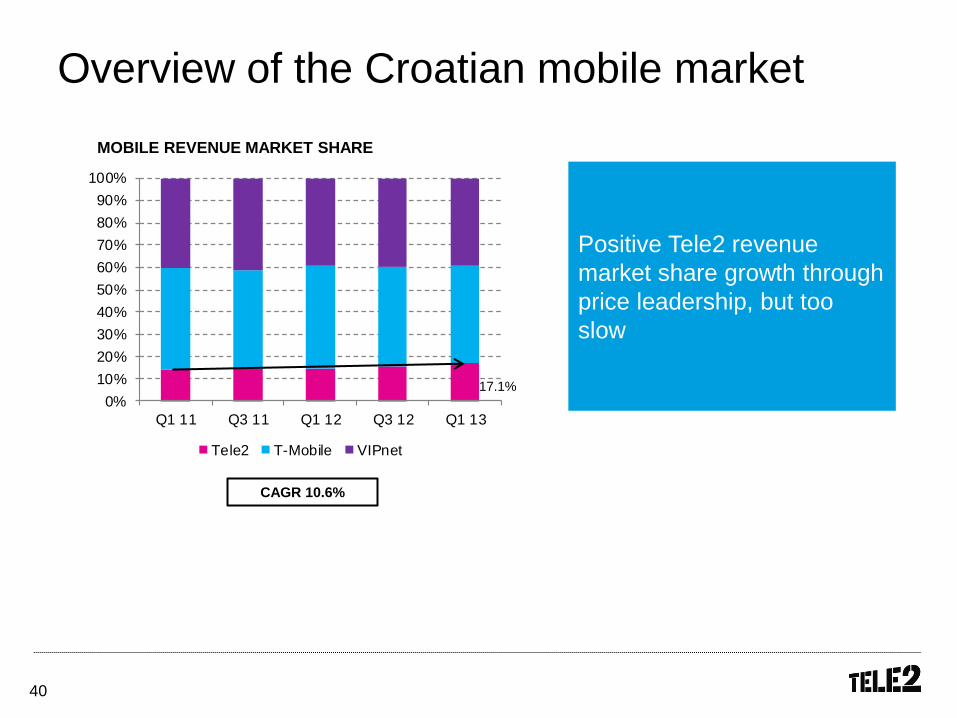
Overview of the Croatian mobile market
MOBILE REVENUE MARKET SHARE
Positive Tele2 revenue
market share growth through
price leadership, but too
slow
CAGR 10.6%
17.1%
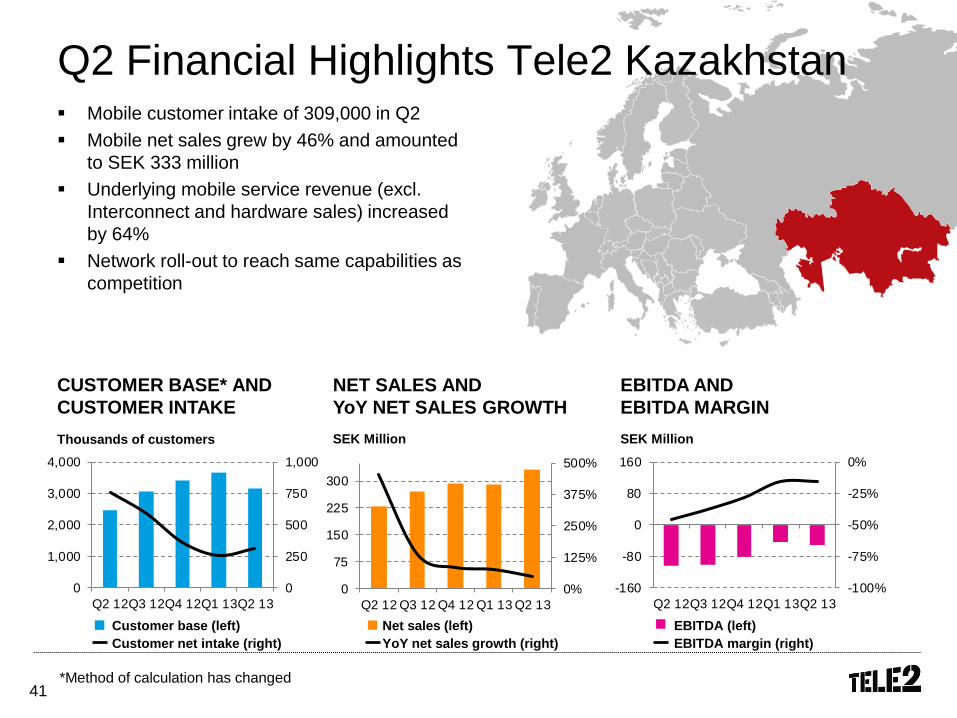
41 *Method of calculation has changed
Q2 Financial Highlights Tele2 Kazakhstan Mobile customer intake of 309,000 in Q2
Mobile net sales grew by 46% and amounted
to SEK 333 million
Underlying mobile service revenue (excl.
Interconnect and hardware sales) increased
by 64%
Network roll-out to reach same capabilities as
competition
CUSTOMER BASE* AND
CUSTOMER INTAKE
Thousands of customers
Customer base (left)
Customer net intake (right)
SEK Million
NET SALES AND
YoY NET SALES GROWTH
YoY net sales growth (right)
Net sales (left)
EBITDA AND
EBITDA MARGIN
SEK Million
EBITDA margin (right)
EBITDA (left)
-100%
-75%
-50%
-25%
0%
-160
-80
0
80
160
Q2 12Q3 12Q4 12Q1 13Q2 13
0
250
500
750
1,000
0
1,000
2,000
3,000
4,000
Q2 12Q3 12Q4 12Q1 13Q2 130%
125%
250%
375%
500%
0
75
150
225
300
Q2 12 Q3 12 Q4 12 Q1 13 Q2 13
42
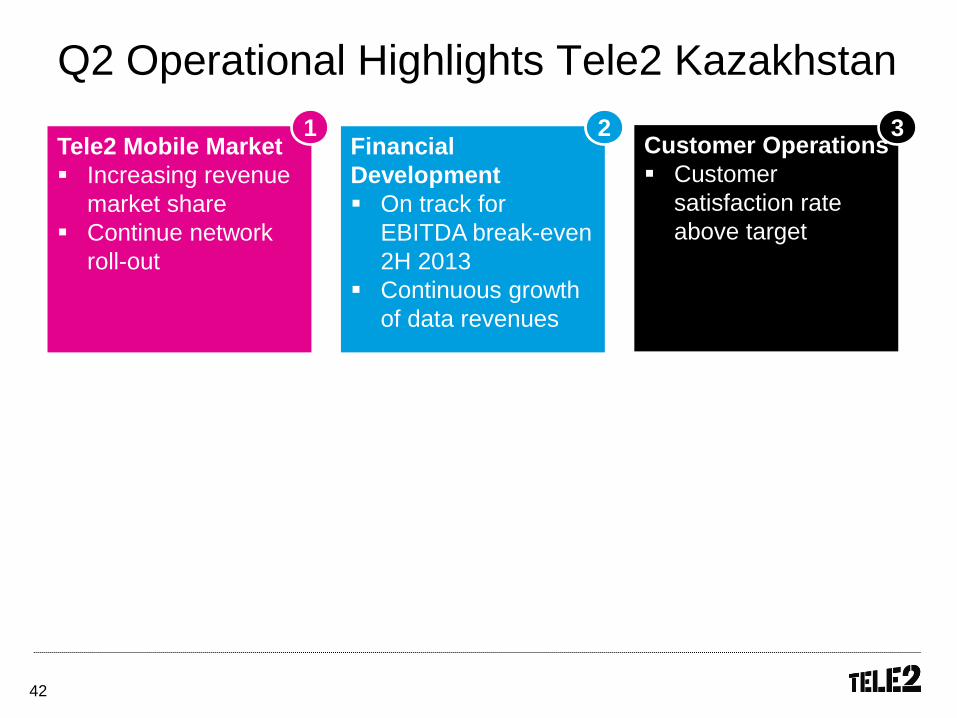
Customer Operations
Customer
satisfaction rate
above target
3
Q2 Operational Highlights Tele2 Kazakhstan
Tele2 Mobile Market
Increasing revenue
market share
Continue network
roll-out
1 Financial
Development
On track for
EBITDA break-even
2H 2013
Continuous growth
of data revenues
2
43
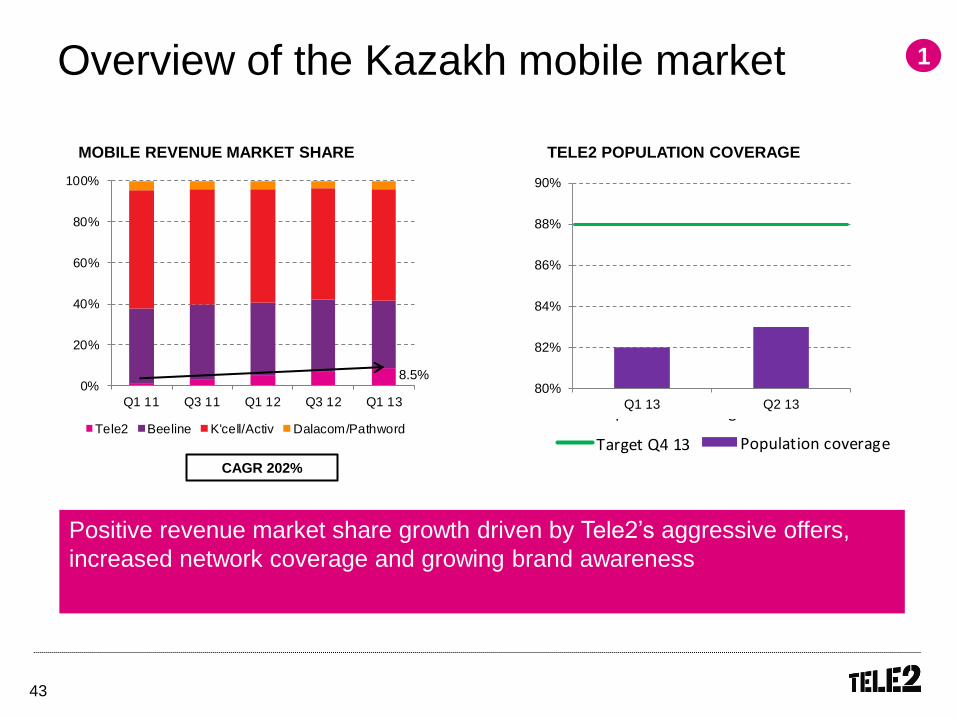
Overview of the Kazakh mobile market
MOBILE REVENUE MARKET SHARE
Positive revenue market share growth driven by Tele2’s aggressive offers,
increased network coverage and growing brand awareness
1
TELE2 POPULATION COVERAGE
CAGR 202%
80%
82%
84%
86%
88%
90%
Q1 13 Q2 13
0%
20%
40%
60%
80%
100%
Q1 11 Q3 11 Q1 12 Q3 12 Q1 13
Tele2 Beeline K'cell/Activ Dalacom/Pathword
80%
82%
84%
86%
88%
90%
Q1 13 Q2 13
Population coverage Q4 13 Worst case
Target Q4 13
80%
82%
84%
86%
88%
90%
Q1 13 Q2 13
Population coverage Q4 13 Worst case
Target Q4 13
8.5%
44
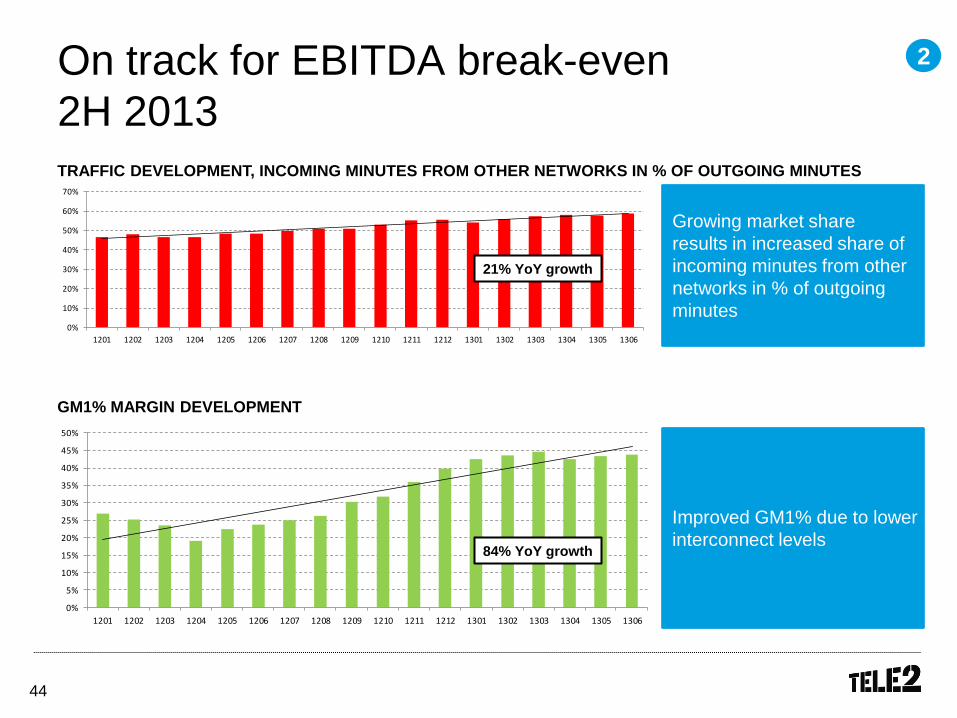
On track for EBITDA break-even
2H 2013
TRAFFIC DEVELOPMENT, INCOMING MINUTES FROM OTHER NETWORKS IN % OF OUTGOING MINUTES
GM1% MARGIN DEVELOPMENT
Improved GM1% due to lower
interconnect levels
2
0%
10%
20%
30%
40%
50%
60%
70%
1201 1202 1203 1204 1205 1206 1207 1208 1209 1210 1211 1212 1301 1302 1303 1304 1305 1306
0%
5%
10%
15%
20%
25%
30%
35%
40%
45%
50%
1201 1202 1203 1204 1205 1206 1207 1208 1209 1210 1211 1212 1301 1302 1303 1304 1305 1306
Growing market share
results in increased share of
incoming minutes from other
networks in % of outgoing
minutes
84% YoY growth
21% YoY growth
45
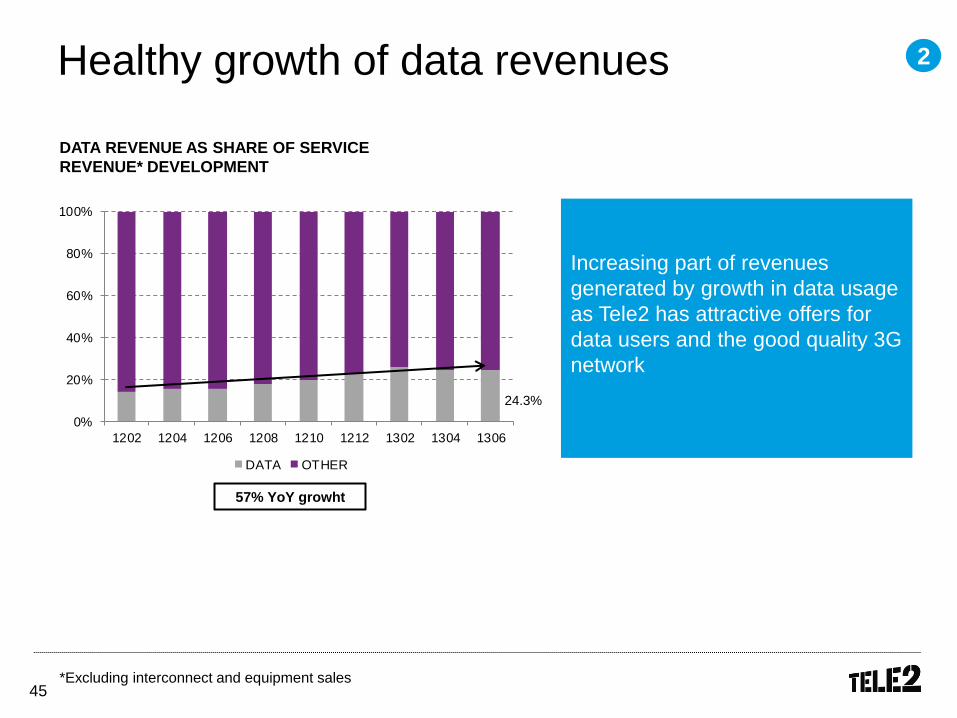
Healthy growth of data revenues
DATA REVENUE AS SHARE OF SERVICE
REVENUE* DEVELOPMENT
Increasing part of revenues
generated by growth in data usage
as Tele2 has attractive offers for
data users and the good quality 3G
network
2
*Excluding interconnect and equipment sales
57% YoY growht
0%
20%
40%
60%
80%
100%
1202 1204 1206 1208 1210 1212 1302 1304 1306
DATA OTHER
24.3%
46
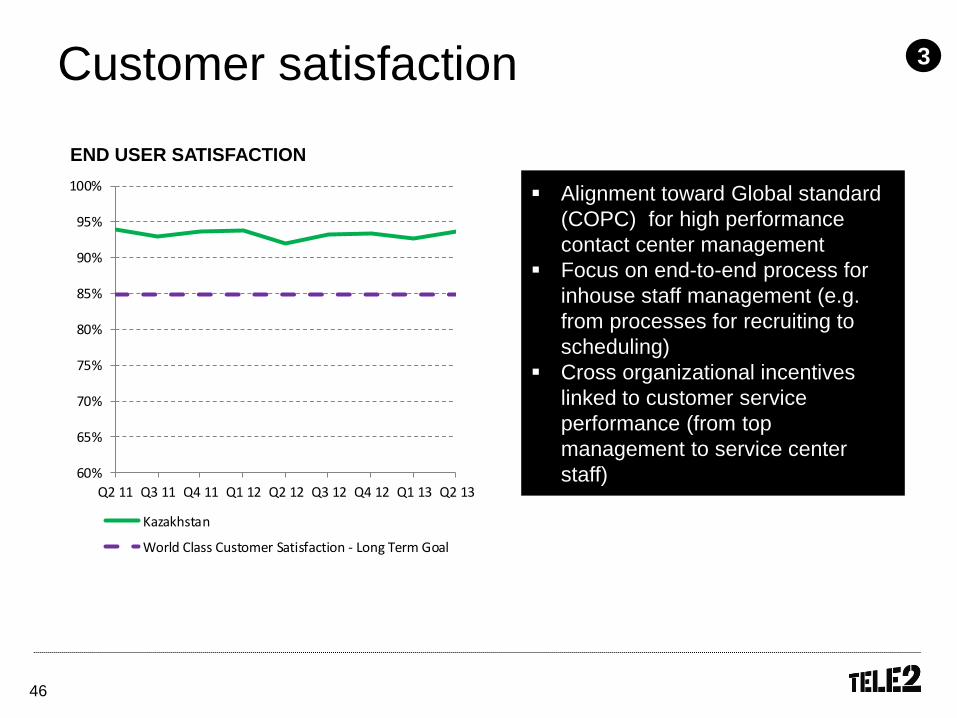
Customer satisfaction 3
Alignment toward Global standard
(COPC) for high performance
contact center management
Focus on end-to-end process for
inhouse staff management (e.g.
from processes for recruiting to
scheduling)
Cross organizational incentives
linked to customer service
performance (from top
management to service center
staff)
END USER SATISFACTION
60%
65%
70%
75%
80%
85%
90%
95%
100%
Q2 11 Q3 11 Q4 11 Q1 12 Q2 12 Q3 12 Q4 12 Q1 13 Q2 13
Kazakhstan
World Class Customer Satisfaction - Long Term Goal
47
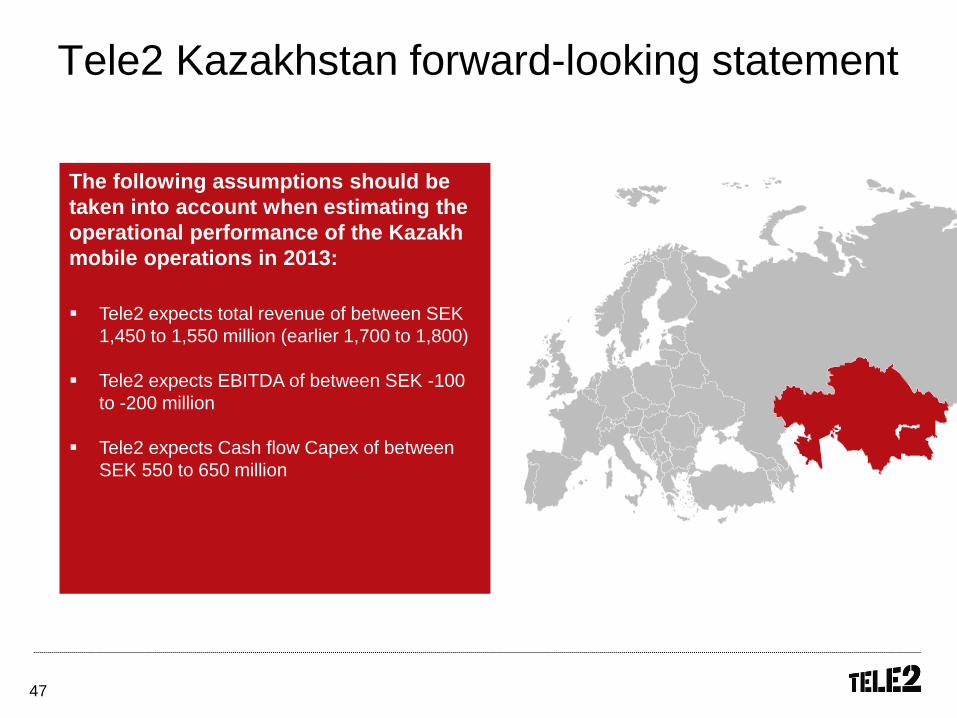
Tele2 Kazakhstan forward-looking statement
The following assumptions should be
taken into account when estimating the
operational performance of the Kazakh
mobile operations in 2013:
Tele2 expects total revenue of between SEK
1,450 to 1,550 million (earlier 1,700 to 1,800)
Tele2 expects EBITDA of between SEK -100
to -200 million
Tele2 expects Cash flow Capex of between
SEK 550 to 650 million
48
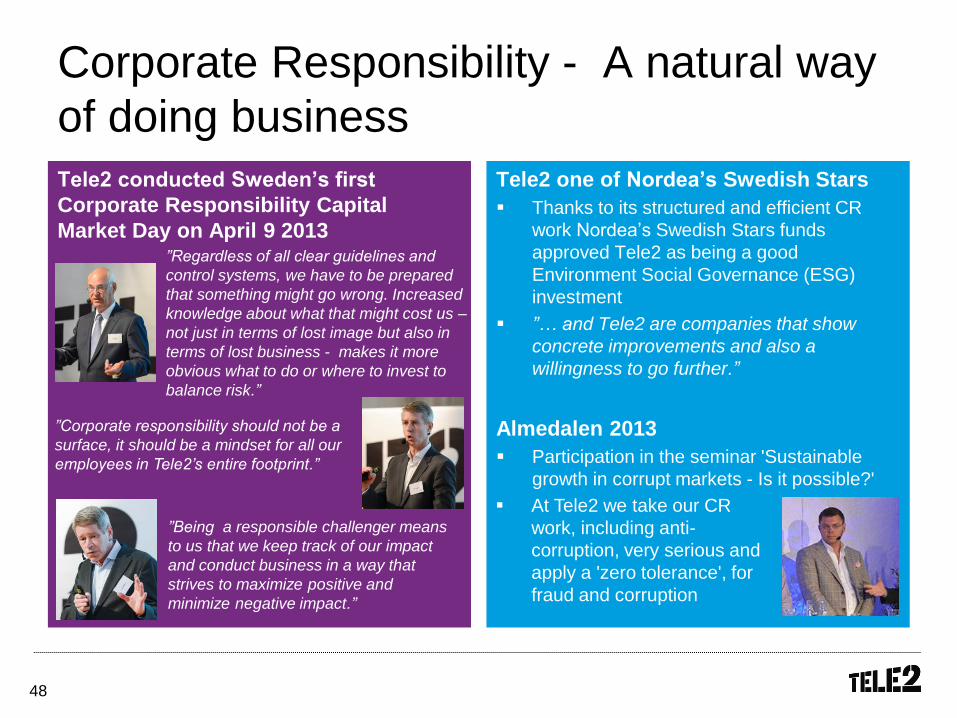
Corporate Responsibility - A natural way
of doing business
Tele2 conducted Sweden’s first
Corporate Responsibility Capital
Market Day on April 9 2013
Tele2 one of Nordea’s Swedish Stars
Thanks to its structured and efficient CR
work Nordea’s Swedish Stars funds
approved Tele2 as being a good
Environment Social Governance (ESG)
investment
”… and Tele2 are companies that show
concrete improvements and also a
willingness to go further.”
Almedalen 2013
Participation in the seminar 'Sustainable
growth in corrupt markets - Is it possible?'
”Being a responsible challenger means
to us that we keep track of our impact
and conduct business in a way that
strives to maximize positive and
minimize negative impact.”
”Corporate responsibility should not be a
surface, it should be a mindset for all our
employees in Tele2’s entire footprint.”
At Tele2 we take our CR
work, including anti-
corruption, very serious and
apply a 'zero tolerance', for
fraud and corruption
”Regardless of all clear guidelines and
control systems, we have to be prepared
that something might go wrong. Increased
knowledge about what that might cost us –
not just in terms of lost image but also in
terms of lost business - makes it more
obvious what to do or where to invest to
balance risk.”
49
Agenda
About Q2 2013
Financial review
Concluding remarks
50
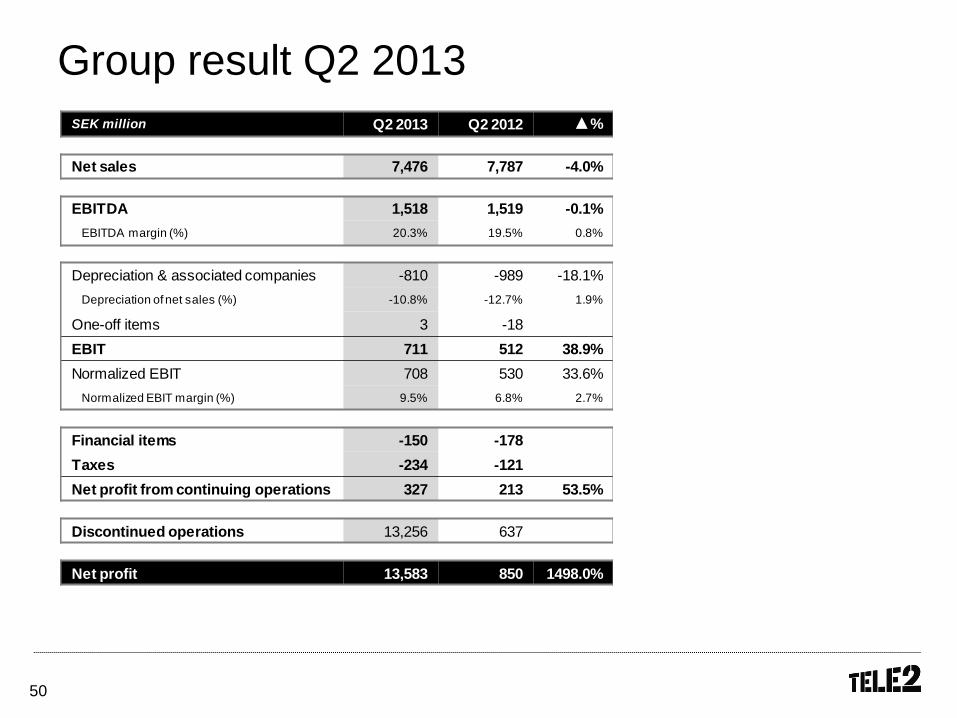
Group result Q2 2013
SEK million Q2 2013 Q2 2012 ▲%
Net sales 7,476 7,787 -4.0%
EBITDA 1,518 1,519 -0.1%
EBITDA margin (%) 20.3% 19.5% 0.8%
Depreciation & associated companies -810 -989 -18.1%
Depreciation of net sales (%) -10.8% -12.7% 1.9%
One-off items 3 -18
EBIT 711 512 38.9%
Normalized EBIT 708 530 33.6%
Normalized EBIT margin (%) 9.5% 6.8% 2.7%
Financial items -150 -178
Taxes -234 -121
Net profit from continuing operations 327 213 53.5%
Discontinued operations 13,256 637
Net profit 13,583 850 1498.0%
51
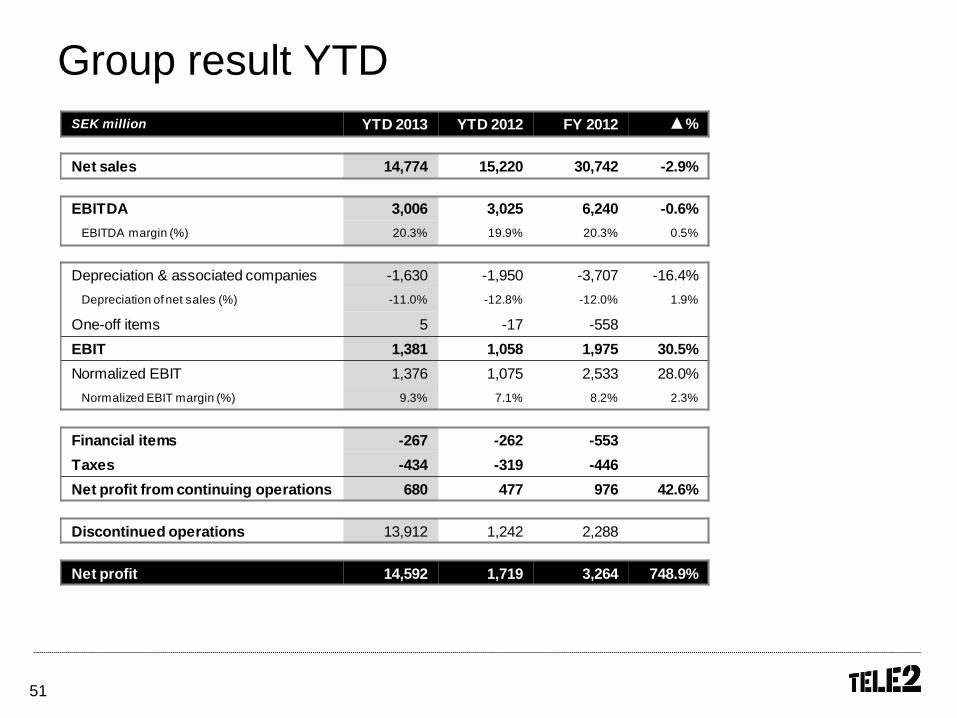
Group result YTD
SEK million YTD 2013 YTD 2012 FY 2012 ▲%
Net sales 14,774 15,220 30,742 -2.9%
EBITDA 3,006 3,025 6,240 -0.6%
EBITDA margin (%) 20.3% 19.9% 20.3% 0.5%
Depreciation & associated companies -1,630 -1,950 -3,707 -16.4%
Depreciation of net sales (%) -11.0% -12.8% -12.0% 1.9%
One-off items 5 -17 -558
EBIT 1,381 1,058 1,975 30.5%
Normalized EBIT 1,376 1,075 2,533 28.0%
Normalized EBIT margin (%) 9.3% 7.1% 8.2% 2.3%
Financial items -267 -262 -553
Taxes -434 -319 -446
Net profit from continuing operations 680 477 976 42.6%
Discontinued operations 13,912 1,242 2,288
Net profit 14,592 1,719 3,264 748.9%
52
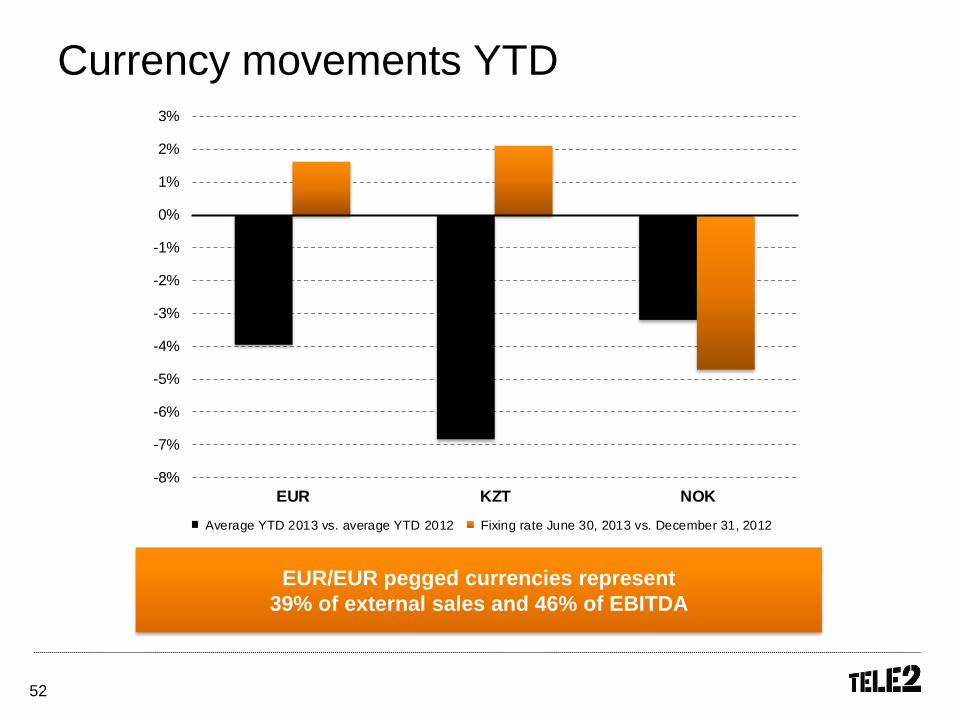
Currency movements YTD
EUR/EUR pegged currencies represent
39% of external sales and 46% of EBITDA
-8%
-7%
-6%
-5%
-4%
-3%
-2%
-1%
0%
1%
2%
3%
EUR KZT NOK
Average YTD 2013 vs. average YTD 2012 Fixing rate June 30, 2013 vs. December 31, 2012
53
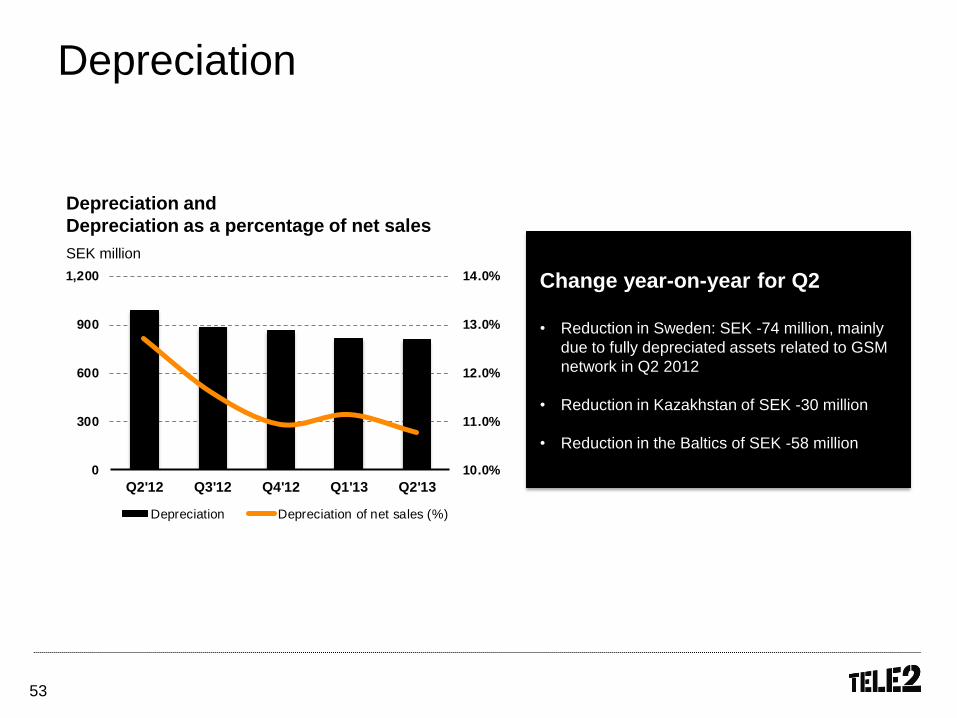
Depreciation
Change year-on-year for Q2
• Reduction in Sweden: SEK -74 million, mainly
due to fully depreciated assets related to GSM
network in Q2 2012
• Reduction in Kazakhstan of SEK -30 million
• Reduction in the Baltics of SEK -58 million
Depreciation and
Depreciation as a percentage of net sales
SEK million
10.0%
11.0%
12.0%
13.0%
14.0%
0
300
600
900
1,200
Q2'12 Q3'12 Q4'12 Q1'13 Q2'13
Depreciation Depreciation of net sales (%)
54
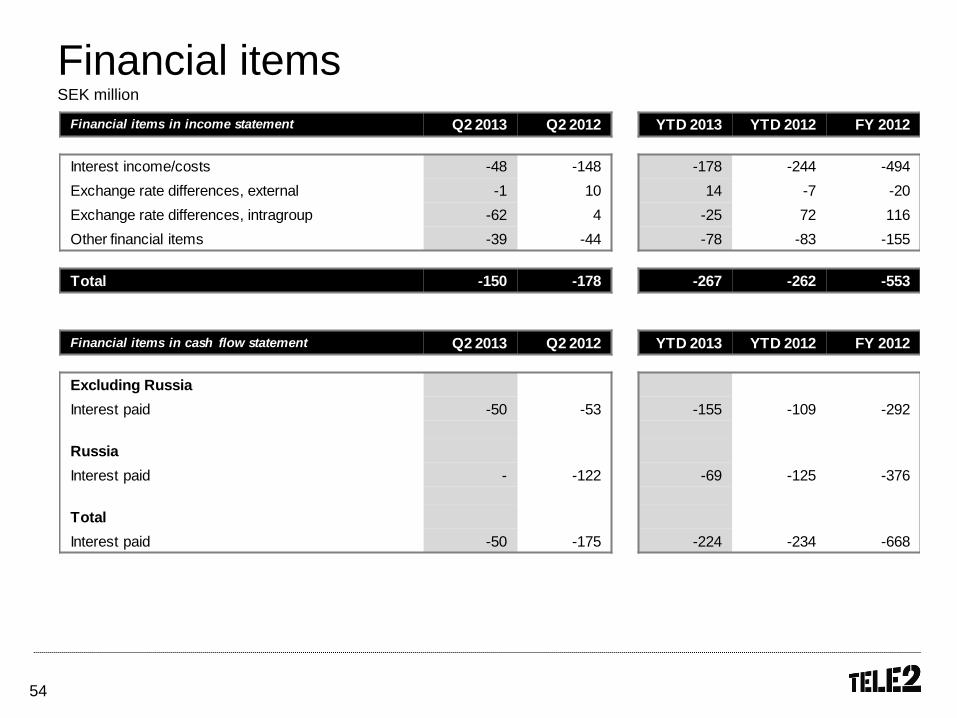
Financial items SEK million
Financial items in income statement Q2 2013 Q2 2012 YTD 2013 YTD 2012 FY 2012
Interest income/costs -48 -148 -178 -244 -494
Exchange rate differences, external -1 10 14 -7 -20
Exchange rate differences, intragroup -62 4 -25 72 116
Other financial items -39 -44 -78 -83 -155
Total -150 -178 -267 -262 -553
Financial items in cash flow statement Q2 2013 Q2 2012 YTD 2013 YTD 2012 FY 2012
Excluding Russia
Interest paid -50 -53 -155 -109 -292
Russia
Interest paid - -122 -69 -125 -376
Total
Interest paid -50 -175 -224 -234 -668
55
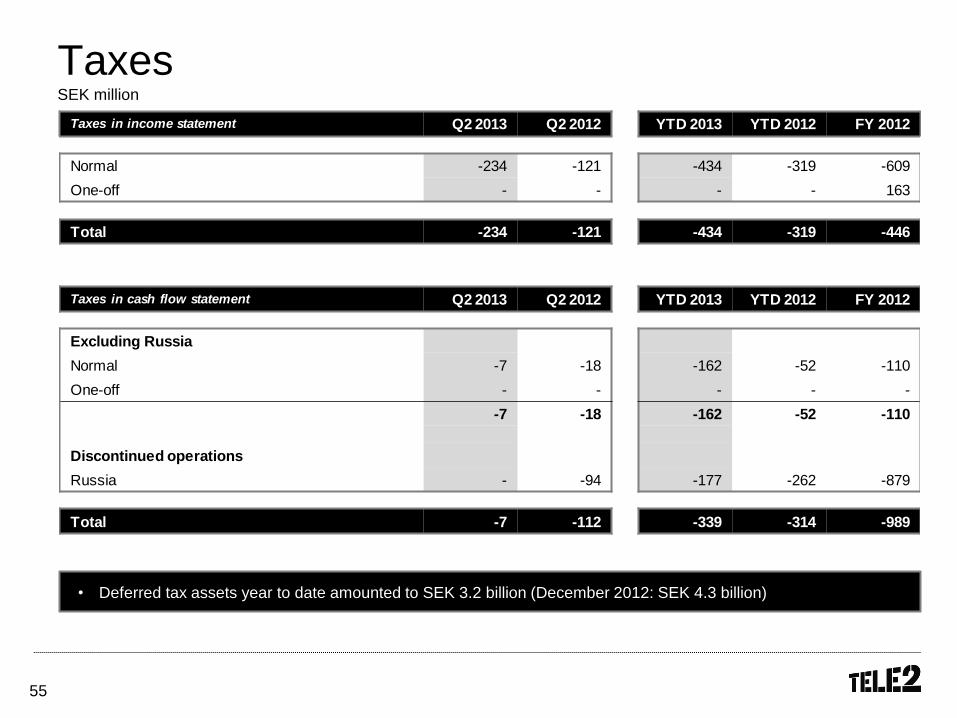
Taxes SEK million
• Deferred tax assets year to date amounted to SEK 3.2 billion (December 2012: SEK 4.3 billion)
Taxes in income statement Q2 2013 Q2 2012 YTD 2013 YTD 2012 FY 2012
Normal -234 -121 -434 -319 -609
One-off - - - - 163
Total -234 -121 -434 -319 -446
Taxes in cash flow statement Q2 2013 Q2 2012 YTD 2013 YTD 2012 FY 2012
Excluding Russia
Normal -7 -18 -162 -52 -110
One-off - - - - -
-7 -18 -162 -52 -110
Discontinued operations
Russia - -94 -177 -262 -879
Total -7 -112 -339 -314 -989
56
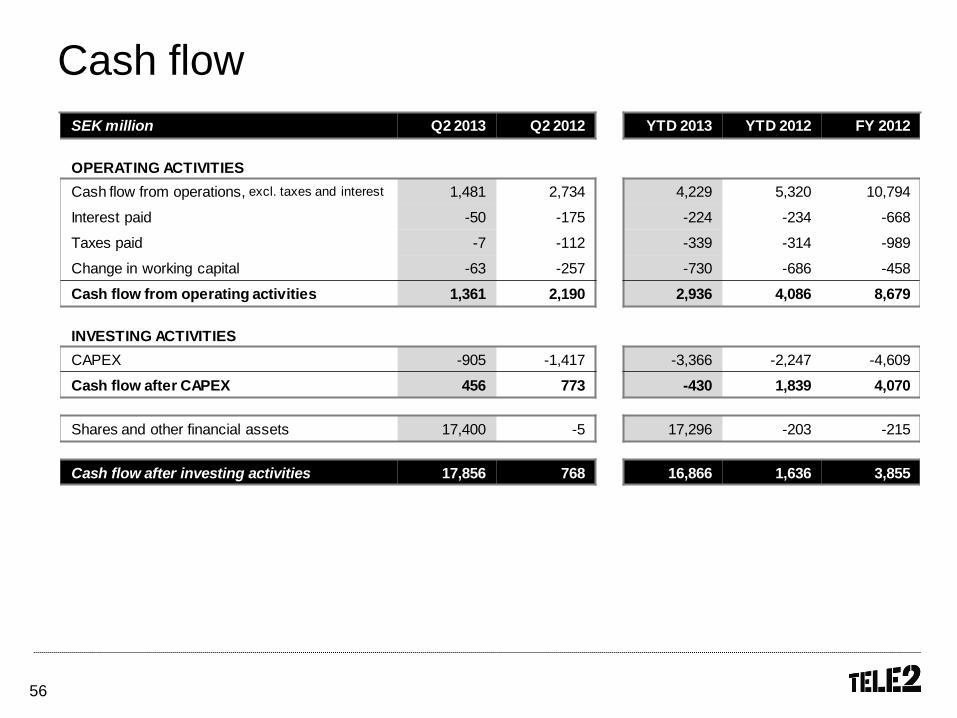
Cash flow
SEK million Q2 2013 Q2 2012 YTD 2013 YTD 2012 FY 2012
OPERATING ACTIVITIES
Cash flow from operations, excl. taxes and interest 1,481 2,734 4,229 5,320 10,794
Interest paid -50 -175 -224 -234 -668
Taxes paid -7 -112 -339 -314 -989
Change in working capital -63 -257 -730 -686 -458
Cash flow from operating activities 1,361 2,190 2,936 4,086 8,679
INVESTING ACTIVITIES
CAPEX -905 -1,417 -3,366 -2,247 -4,609
Cash flow after CAPEX 456 773 -430 1,839 4,070
Shares and other financial assets 17,400 -5 17,296 -203 -215
Cash flow after investing activities 17,856 768 16,866 1,636 3,855
57
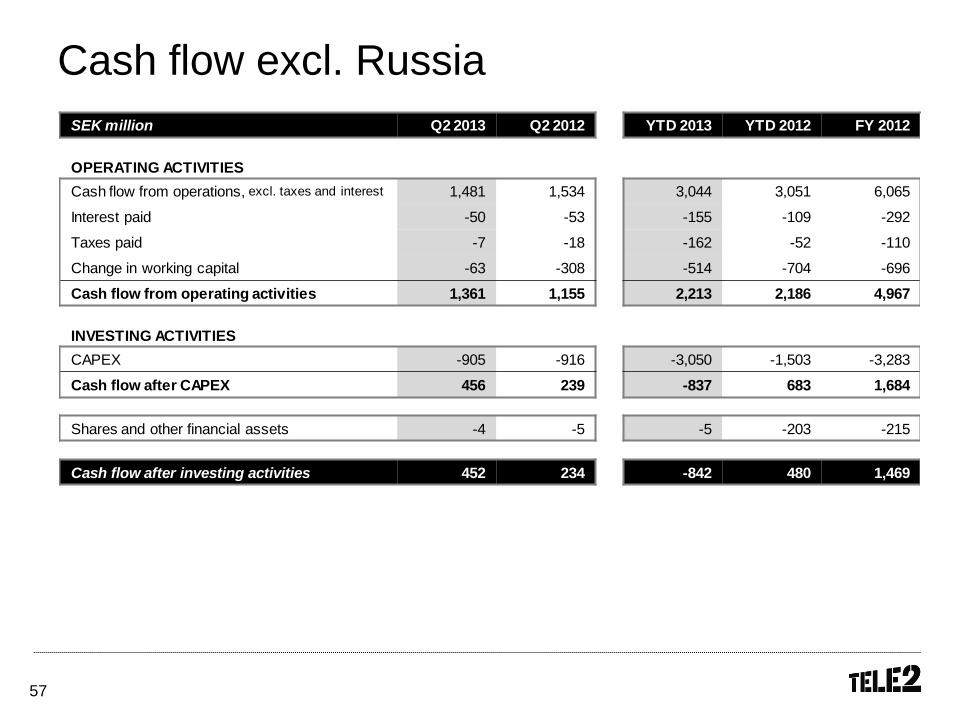
Cash flow excl. Russia
SEK million Q2 2013 Q2 2012 YTD 2013 YTD 2012 FY 2012
OPERATING ACTIVITIES
Cash flow from operations, excl. taxes and interest 1,481 1,534 3,044 3,051 6,065
Interest paid -50 -53 -155 -109 -292
Taxes paid -7 -18 -162 -52 -110
Change in working capital -63 -308 -514 -704 -696
Cash flow from operating activities 1,361 1,155 2,213 2,186 4,967
INVESTING ACTIVITIES
CAPEX -905 -916 -3,050 -1,503 -3,283
Cash flow after CAPEX 456 239 -837 683 1,684
Shares and other financial assets -4 -5 -5 -203 -215
Cash flow after investing activities 452 234 -842 480 1,469
58
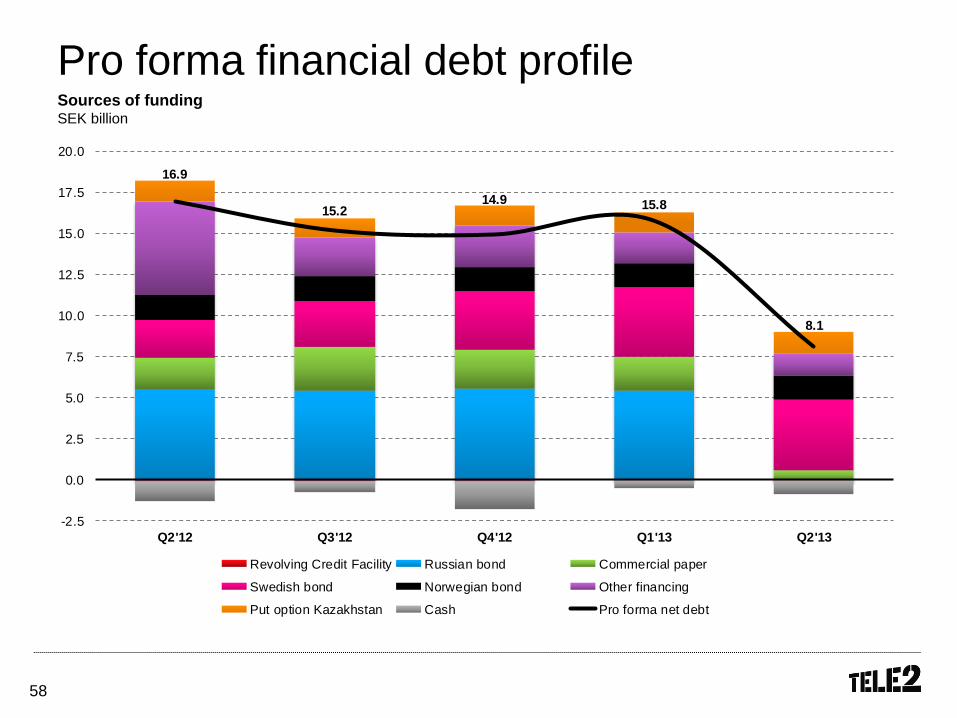
Pro forma financial debt profile
Sources of funding SEK billion
16.9
15.214.9 15.8
8.1
-2.5
0.0
2.5
5.0
7.5
10.0
12.5
15.0
17.5
20.0
Q2'12 Q3'12 Q4'12 Q1'13 Q2'13
Revolving Credit Facility Russian bond Commercial paper
Swedish bond Norwegian bond Other financing
Put option Kazakhstan Cash Pro forma net debt
59
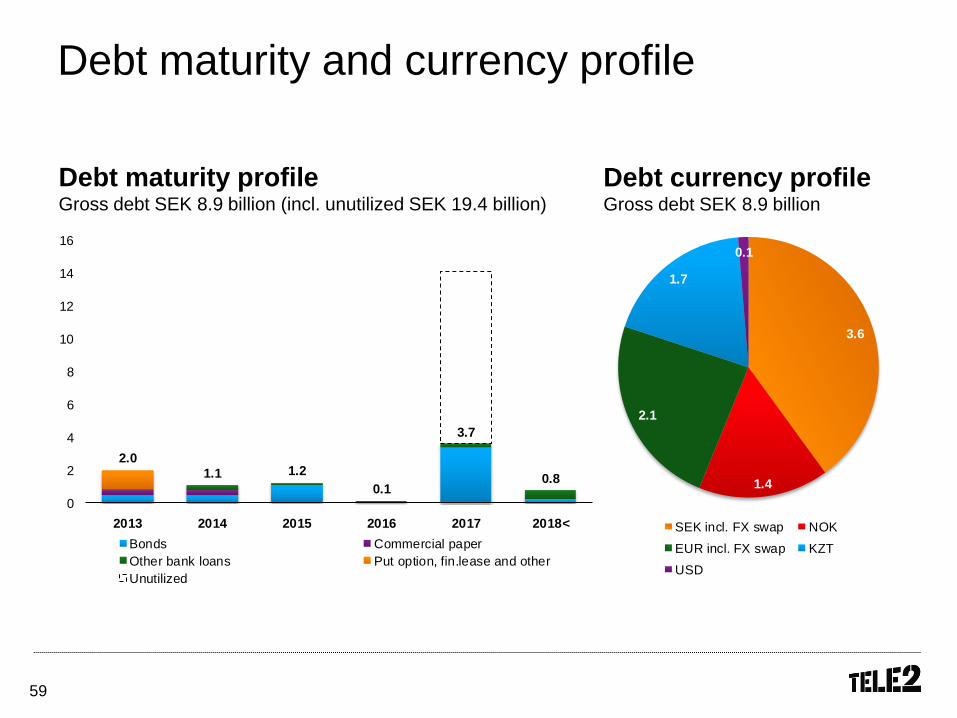
Debt maturity and currency profile
Debt maturity profile Gross debt SEK 8.9 billion (incl. unutilized SEK 19.4 billion)
Debt currency profile Gross debt SEK 8.9 billion
3.6
1.4
2.1
1.7
0.1
SEK incl. FX swap NOK
EUR incl. FX swap KZT
USD
2.0
1.1 1.2
0.1
3.7
0.8
0
2
4
6
8
10
12
14
16
2013 2014 2015 2016 2017 2018<
Bonds Commercial paper
Other bank loans Put option, fin.lease and other
Unutilized
60
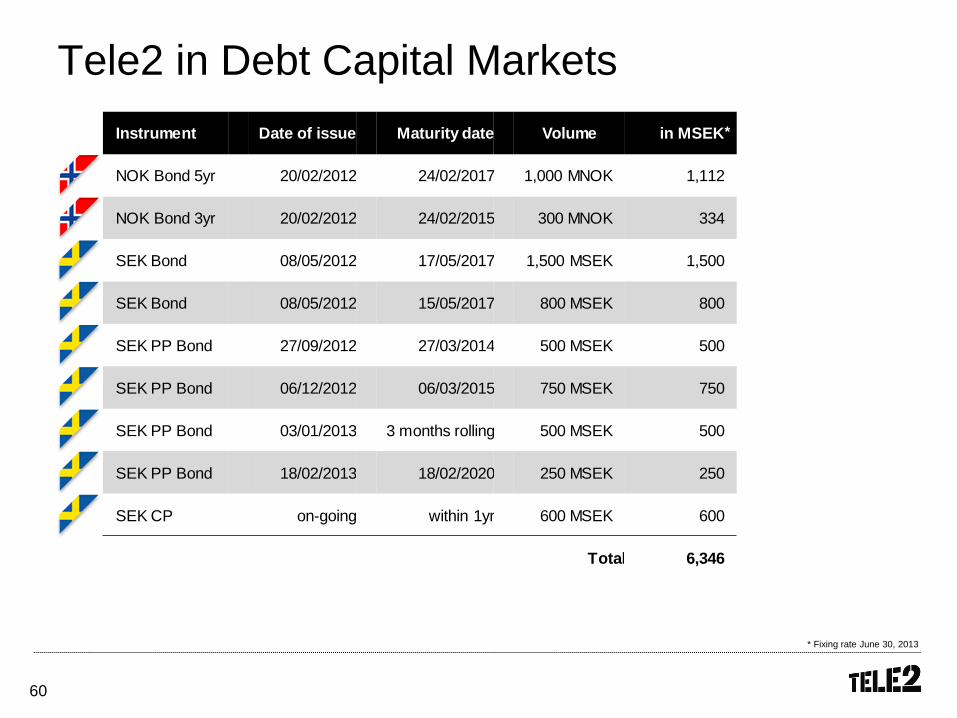
Tele2 in Debt Capital Markets
* Fixing rate June 30, 2013
* Instrument Date of issue Maturity date Volume in MSEK
NOK Bond 5yr 20/02/2012 24/02/2017 1,000 MNOK 1,112
NOK Bond 3yr 20/02/2012 24/02/2015 300 MNOK 334
SEK Bond 08/05/2012 17/05/2017 1,500 MSEK 1,500
SEK Bond 08/05/2012 15/05/2017 800 MSEK 800
SEK PP Bond 27/09/2012 27/03/2014 500 MSEK 500
SEK PP Bond 06/12/2012 06/03/2015 750 MSEK 750
SEK PP Bond 03/01/2013 3 months rolling 500 MSEK 500
SEK PP Bond 18/02/2013 18/02/2020 250 MSEK 250
SEK CP on-going within 1yr 600 MSEK 600
Total 6,346
*
61
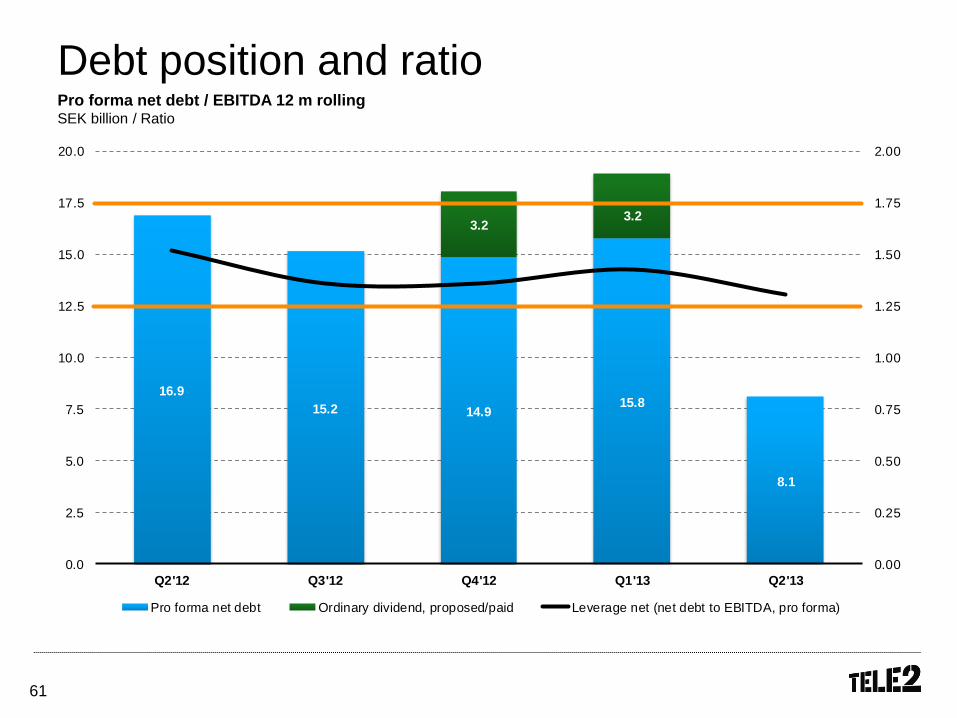
Debt position and ratio Pro forma net debt / EBITDA 12 m rolling SEK billion / Ratio
16.9
15.2 14.915.8
8.1
3.23.2
0.00
0.25
0.50
0.75
1.00
1.25
1.50
1.75
2.00
0.0
2.5
5.0
7.5
10.0
12.5
15.0
17.5
20.0
Q2'12 Q3'12 Q4'12 Q1'13 Q2'13
Pro forma net debt Ordinary dividend, proposed/paid Leverage net (net debt to EBITDA, pro forma)
62
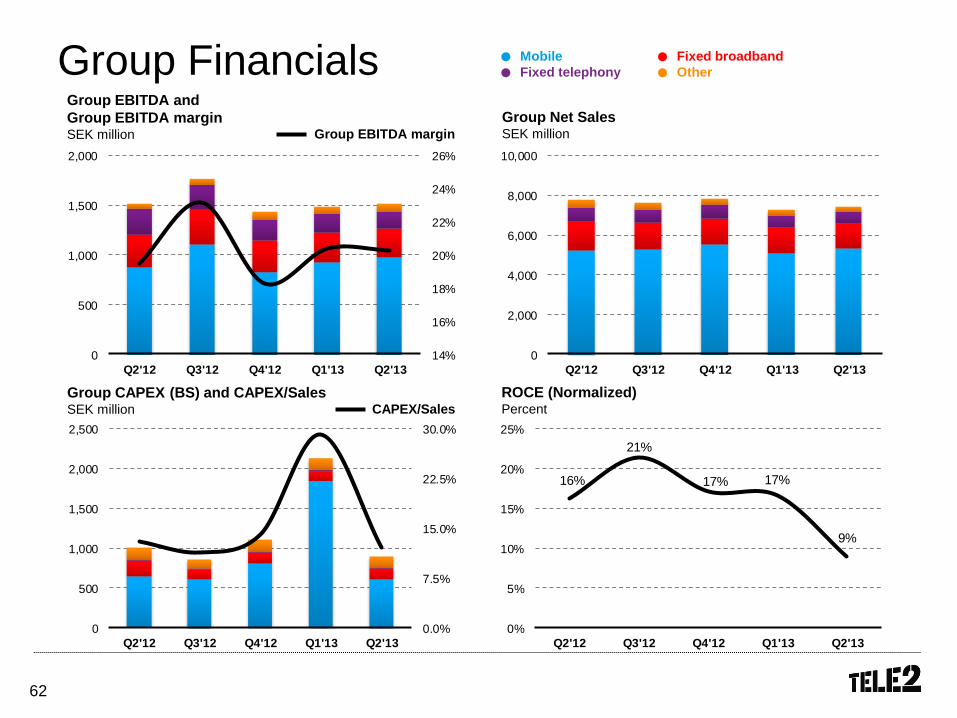
Group Financials Group EBITDA and
Group EBITDA margin SEK million
Group CAPEX (BS) and CAPEX/Sales SEK million
Group Net Sales SEK million
ROCE (Normalized) Percent
Group EBITDA margin
CAPEX/Sales
● Mobile
● Fixed telephony
● Fixed broadband
● Other
14%
16%
18%
20%
22%
24%
26%
0
500
1,000
1,500
2,000
Q2'12 Q3'12 Q4'12 Q1'13 Q2'13
0
2,000
4,000
6,000
8,000
10,000
Q2'12 Q3'12 Q4'12 Q1'13 Q2'13
0.0%
7.5%
15.0%
22.5%
30.0%
0
500
1,000
1,500
2,000
2,500
Q2'12 Q3'12 Q4'12 Q1'13 Q2'13
16%
21%
17% 17%
9%
0%
5%
10%
15%
20%
25%
Q2'12 Q3'12 Q4'12 Q1'13 Q2'13
63
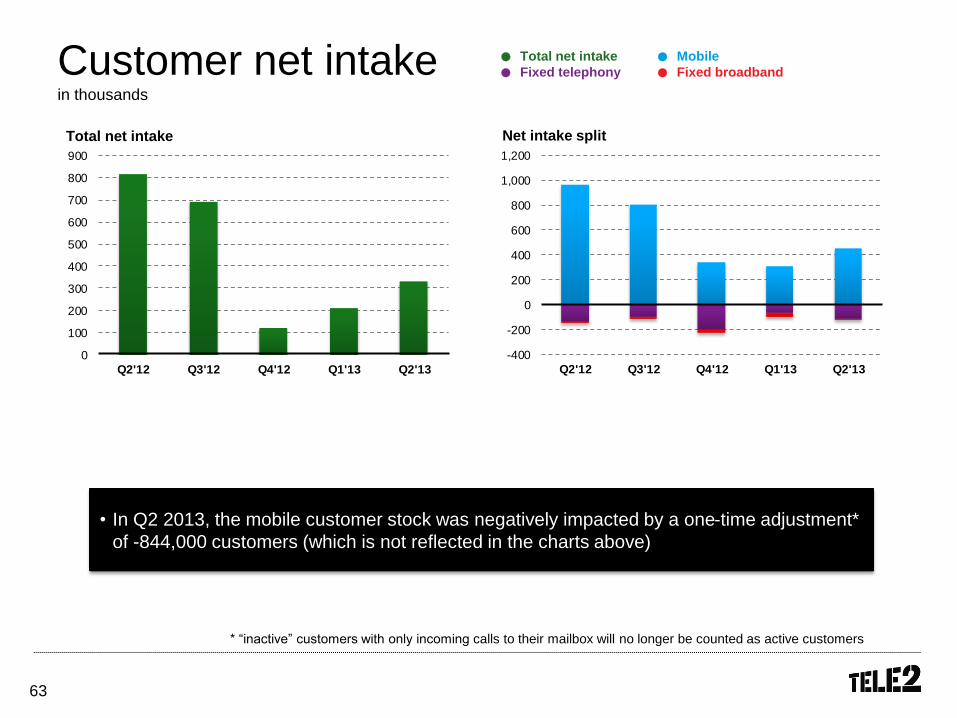
Customer net intake in thousands
-400
-200
0
200
400
600
800
1,000
1,200
Q2'12 Q3'12 Q4'12 Q1'13 Q2'13
● Total net intake
● Fixed telephony
● Mobile
● Fixed broadband
0
100
200
300
400
500
600
700
800
900
Q2'12 Q3'12 Q4'12 Q1'13 Q2'13
• In Q2 2013, the mobile customer stock was negatively impacted by a one-time adjustment*
of -844,000 customers (which is not reflected in the charts above)
Total net intake Net intake split
* “inactive” customers with only incoming calls to their mailbox will no longer be counted as active customers
64
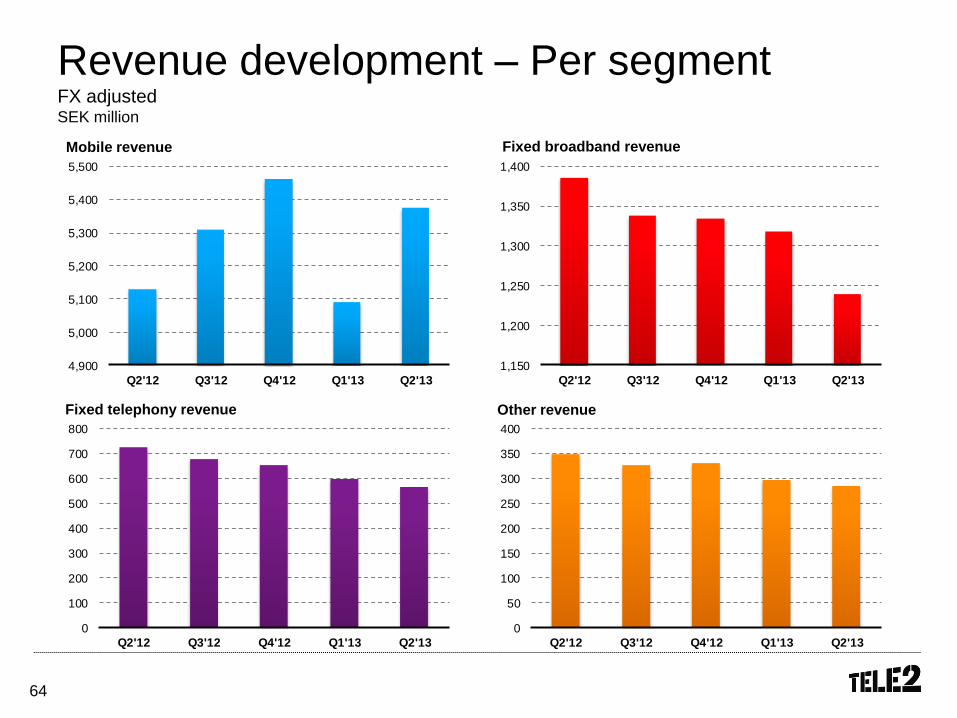
Revenue development – Per segment FX adjusted SEK million
Mobile revenue Fixed broadband revenue
Fixed telephony revenue Other revenue
4,900
5,000
5,100
5,200
5,300
5,400
5,500
Q2'12 Q3'12 Q4'12 Q1'13 Q2'13
1,150
1,200
1,250
1,300
1,350
1,400
Q2'12 Q3'12 Q4'12 Q1'13 Q2'13
0
100
200
300
400
500
600
700
800
Q2'12 Q3'12 Q4'12 Q1'13 Q2'13
0
50
100
150
200
250
300
350
400
Q2'12 Q3'12 Q4'12 Q1'13 Q2'13
65
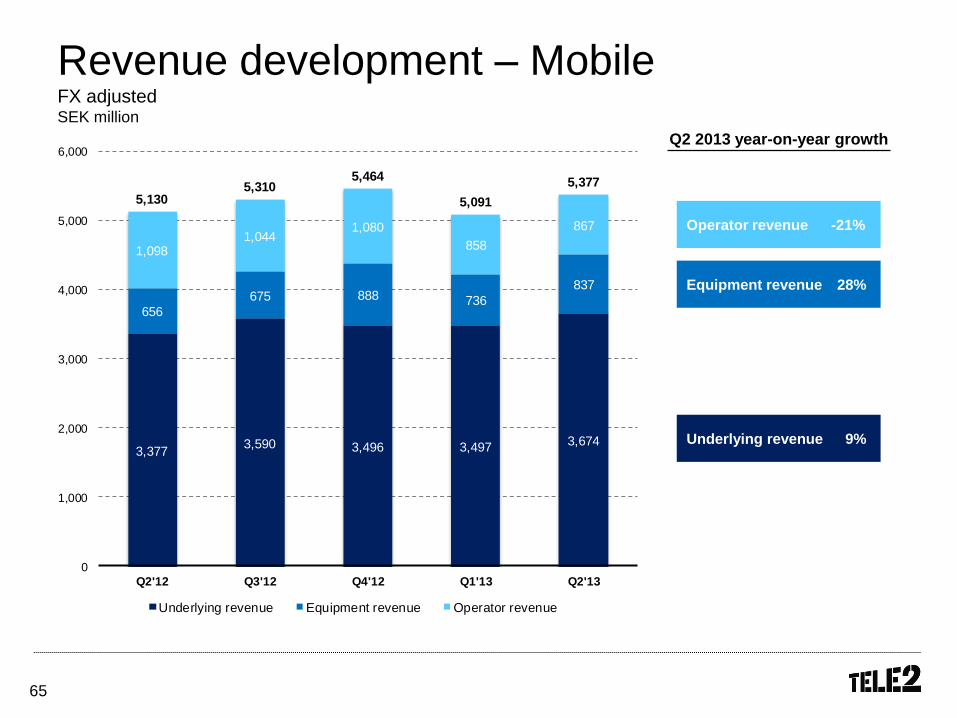
Revenue development – Mobile FX adjusted SEK million
3,3773,590 3,496 3,497
3,674
656
675 888 736
837
1,0981,044
1,080
858
867
5,1305,310
5,464
5,091
5,377
0
1,000
2,000
3,000
4,000
5,000
6,000
Q2'12 Q3'12 Q4'12 Q1'13 Q2'13
Underlying revenue Equipment revenue Operator revenue
Operator revenue -21%
Equipment revenue 28%
Underlying revenue 9%
Q2 2013 year-on-year growth
66
Agenda
About Q1 2013
Financial review
Concluding remarks
67
Concluding remarks
Strong customer intake in key markets
Good mobile growth development
Maintain focus on network roll-out and cost efficiency
68
Q&A