TEfl9 (yoD Oak Ridge Energy' · TEfl9 (yoD Oak Ridge Energy' Associated Post Office Box 117...
27
(yoD Oak Ridge Energy' TEfl9 Associated Post Office Box 117 environment (S\_J Universities Oak Ridge. Tennessee 37831-011 Systems Division July 26, 1991 Mr. James Wagoner, II FUSRAP Program Manager Decontamination and Decommissioning Division Office of Environmental Restoration and Waste Management U.S. Department of Energy Washington, DC 20545 Subject: DRAFT VERIFICATION SURVEY OF PARCEL 1A ELZA GATE SITE, OAK RIDGE, TENNESSEE Dear Mr. Wagoner: l Enclosed are five copies of the draft report for the Verification Survey of Parcel 1A, Elza Gate Site for your review and comment. Should you have any questions, please do not hesitate to contact either Michele Landis at FTS 626-2908 or myself at FTS 626-5073. Sincerely, Timothy Vitkus Environmental Project Leader Environmental Survey and Site Assessment Program \ TJV:jls A x cc: -A Mitchell, OTS D. Adler, DOE/OR M. Landis, ORAU Site File: EGS/335
Transcript of TEfl9 (yoD Oak Ridge Energy' · TEfl9 (yoD Oak Ridge Energy' Associated Post Office Box 117...

(yoD Oak Ridge Energy'
TEfl9 Associated Post Office Box 117 environment
(S\_J Universities Oak Ridge. Tennessee 37831-011 Systems Division
July 26, 1991
Mr. James Wagoner, IIFUSRAP Program ManagerDecontamination and Decommissioning
DivisionOffice of Environmental Restoration
and Waste ManagementU.S. Department of EnergyWashington, DC 20545
Subject: DRAFT VERIFICATION SURVEY OF PARCEL 1AELZA GATE SITE, OAK RIDGE, TENNESSEE
Dear Mr. Wagoner: l
Enclosed are five copies of the draft report for the Verification Survey of Parcel 1A, Elza Gate
Site for your review and comment.
Should you have any questions, please do not hesitate to contact either Michele Landis at
FTS 626-2908 or myself at FTS 626-5073.
Sincerely,
Timothy VitkusEnvironmental Project LeaderEnvironmental Survey and
Site Assessment Program\
TJV:jlsA x
cc: -A Mitchell, OTSD. Adler, DOE/ORM. Landis, ORAUSite File: EGS/335

DRAFTVERIFICATION SURVEY
OF PARCEL 1AELZA GATE SITE
OAK RIDGE, TENNESSEE
INTRODUCTION AND SITE HISTORY
The 8.1 hectare (20 acre) Elza Gate Site is located in the southeastern portion of the city ofOak Ridge, Tennessee. In the early 1940's, the Manhattan Engineer District (MED) operatedfive warehouses on the site. It is known that three of the warehouses were used to storepitchblende (a high-grade uranium ore) as well as sludges and other tailings and residues fromthe uranium refining process. Historical documentation indicates that some of these materialsmay have been released when container packaging deteriorated. The resultant contaminantsincluded uranium in natural isotopic abundances, radium and thorium.
In 1946, ownership of the site was transferred to the Atomic Energy Commission (AEC),predecessor organization to the Department of Energy (DOE), who used the site until the early1970's. During this period, the AEC stored radioactively contaminated materials generated atOak Ridge National Laboratory and the Oak Ridge Y-12 Plant. DOE discontinued use of thefacility and performed radiological surveys and decontamination under guidelines and criteriawhich were current in 1972. The site was then released for unrestricted use and the propertytitle transferred to the city of Oak Ridge. The property was initially sold to a metal platingcompany and finally sold to the current owner in 1988. Presently, the site is comprised of ninedifferent parcels. Additionally, Parcel 1 has recently been subdivided into Parcel 1A and 1B.Four of these parcels contain the five concrete foundations from the MED warehouses.Electro-Panel, Inc., a manufacturer of metal boxes for containment of low-level radioactivewastes, occupies the only building on the site and is located on Parcel 1A. The building wasconstructed over one of the concrete pads previously mentioned.

The DOE has implemented remedial actions for Parcel 1A under the Formerly Utilized SitesRemedial Action Program (FUSRAP) to remove contamination that was a result of the previousMED/AEC activities and release the site for unrestricted use. Future plans call for remediationof the remainder of the site.
It is the policy of the DOE to perform independent verifications of the effectiveness of remedialactions conducted within FUSRAP. The Environmental Survey and Site AssessmentProgram (ESSAP) of Oak Ridge Associated Universities (ORAU) was designated by the DOEas the organization responsible for this task at the Elza Gate Site. Verification activities wereconducted in phases for Parcel 1A during the months of March, April, and May and are thesubject of this report.
SITE DESCRIPTION
The Elza Gate Site is located in the eastern portion of the City of Oak Ridge and is bounded bythe L & N railroad tracks to the north, Melton Lake Dr. to the east, and the Clinch River to thesouth and west (Figure 1). The site contains five concrete pads with a single building, occupiedby Electro-Panel, Inc., constructed on Pad 1 (Figure 2).
Parcel 1A contains an area of approximately 0.8 hectares (1.9 acres). The Electro-Panelbuilding is a single-story structure with floor space of 1800 m2 (20,000 ft2) of which Pad 1comprises 980 m2 (10,500 ft2) of the floor area (Figure 3).
Parcel 1A remedial activities conducted by Bechtel National, Inc., the FUSRAP projectmanagement contractor (PMC), included removal of Pad 1 in three phases and excavation of theunderlying contaminated soil. The exterior portion of the property required soil excavation fromfive localized areas of contamination. The concrete rubble created was segregated intoreleasable and non-releasable piles and stored separately on-site as was the contaminated soil.
2

PROCEDURES
Objective
The objective of the survey was to confirm that the remedial actions conducted the PMC weresuccessful in meeting DOE guidelines so that Parcel 1A could be released without radiological
restrictions.
Document Review
The PMC's Characterization Report and post-remedial action data were reviewed for accuracy,completeness, and compliance with DOE radionuclide surface activity and residual soilconcentration guidelines.
Survey Procedures
Between March 25 and May 31, 1991, ORAU personnel conducted independent measurementand sampling activities of Parcel 1A at the Elza Gate Site.
Interior
Reference Grid
1. The existing grid, established by the PMC, was used to reference measurement andsampling locations. The interior grid encompassing Pad 1 consisted of 10 m by 10 mblocks.
3
Surface Scans
2. As each phase of the pad removal was completed, 100% gamma surface scans of exposed
soils were conducted using portable NaI(TI) gamma scintillation detectors coupled to
ratemeters with audible indicators. Areas of elevated contact radiation were marked for
further investigation.
3. Exposed edges of the concrete pad were scanned in order to detect any elevated beta-
gamma activity, using thin window GM detectors coupled to ratemeter/scalers with
audible indicators.
Surface Activity Measurement
4. Twenty (20) randomly selected 1 m2 blocks of the concrete rubble, identified by the PMC
as releasable without radiological restriction, were surface scanned on the top, bottom,
and sides. For each block, five-point direct measurements for total alpha and beta-
gamma activity were made on the side which exhibited the highest activity. Scans and
measurements were made using ZnS alpha scintillation and thin-window GM detectors
coupled to ratemeter/scalers. For each concrete block, smear samples to determine
removable activity levels, were collected from the five-point direct measurement location,
exhibiting the highest total activity level.
Soil Sampling
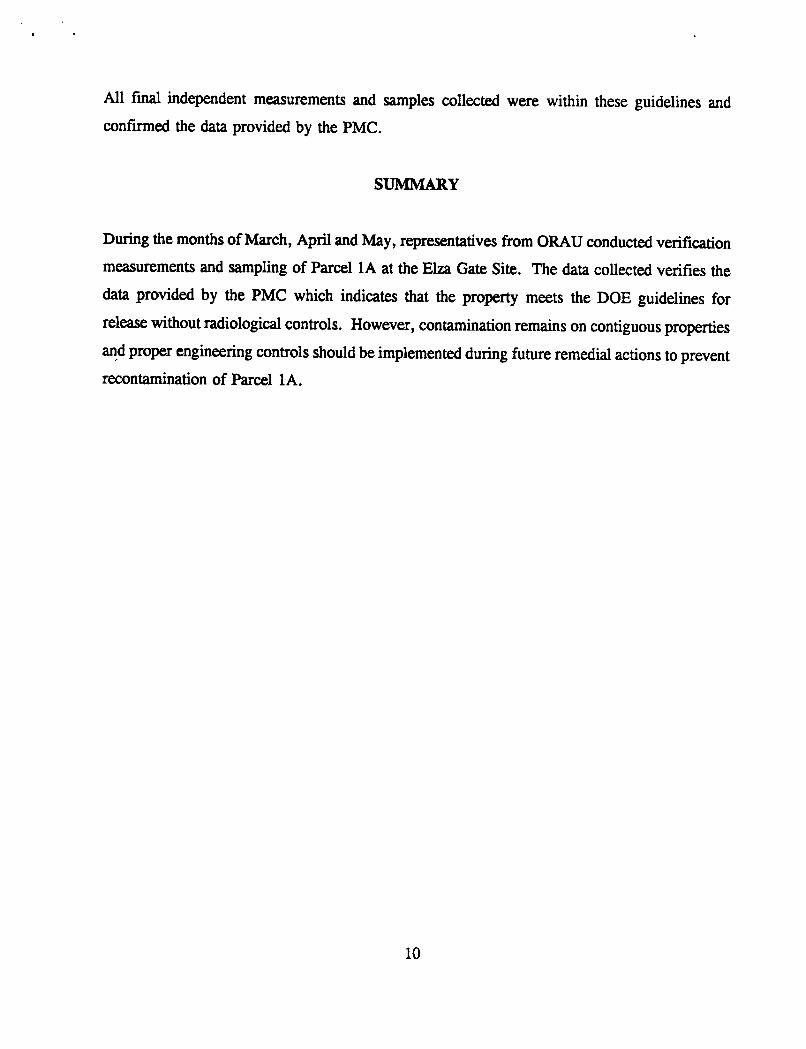
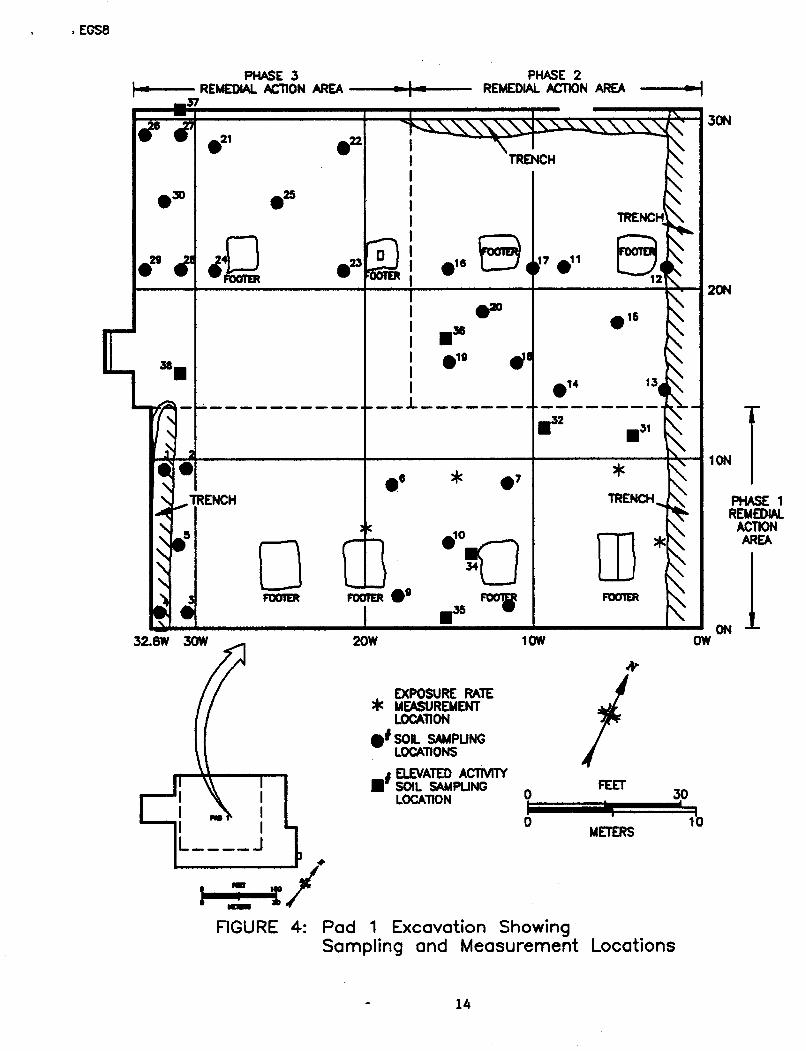
5. Surface soil samples were collected from five representative locations within six (6)
randomly selected grid-blocks for laboratory analysis. In addition, seven (7) soil samples
were collected from areas where gamma scans identified elevated activity greater than
1.5 times that of site background (Figure 4).
4

Exposure Rates
6. Exposure rate measurements were made at four (4) locations within the excavated area
using a pressurized ionization chamber (Figure 4).
Exterior
Reference Grid
1. The PMC's reference grid for the site consisted of 100 ft by 100 ft grid blocks. Where
excavation work was conducted, 1 m by 1 m grids were established with main site gridcoordinates used to reference south and west boundaries (X and Y axis) of each
excavation.
Surface Scans
2. Gamma radiation surface scans were conducted within excavations as well as all of Parcel
1A using NaI(Tl) gamma scintillation detectors coupled to ratemeters with audible
indicators. Areas of elevated contact radiation were marked for further investigation.
Soil Sampling
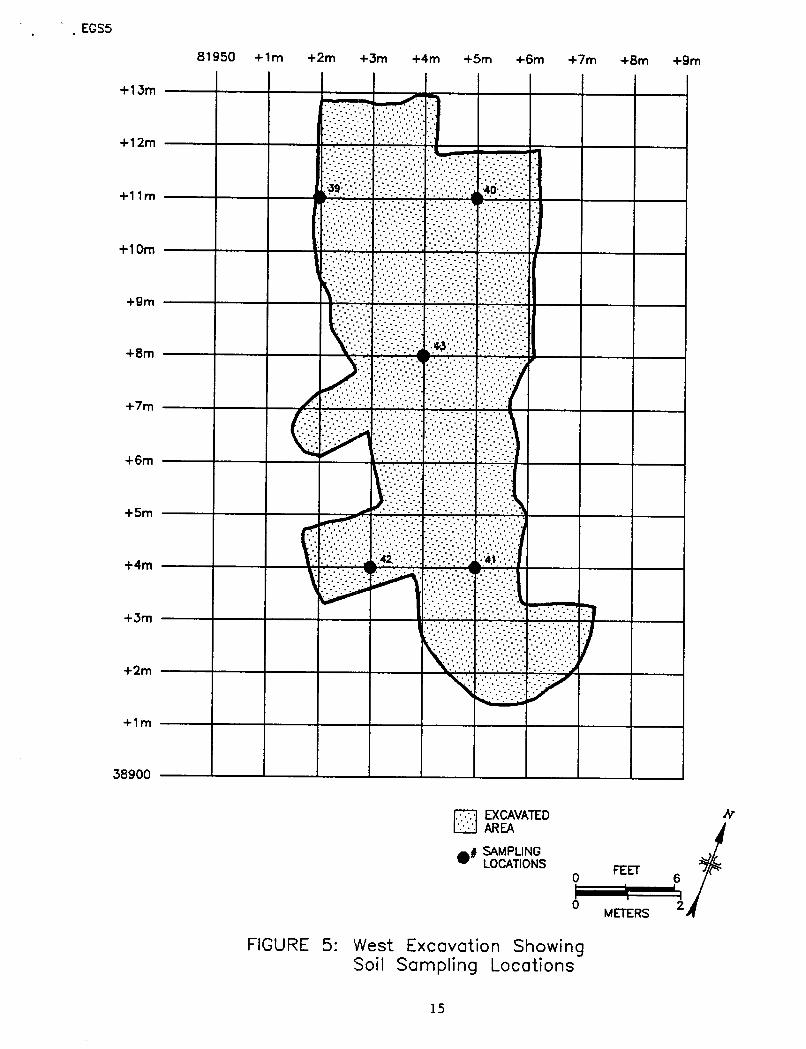
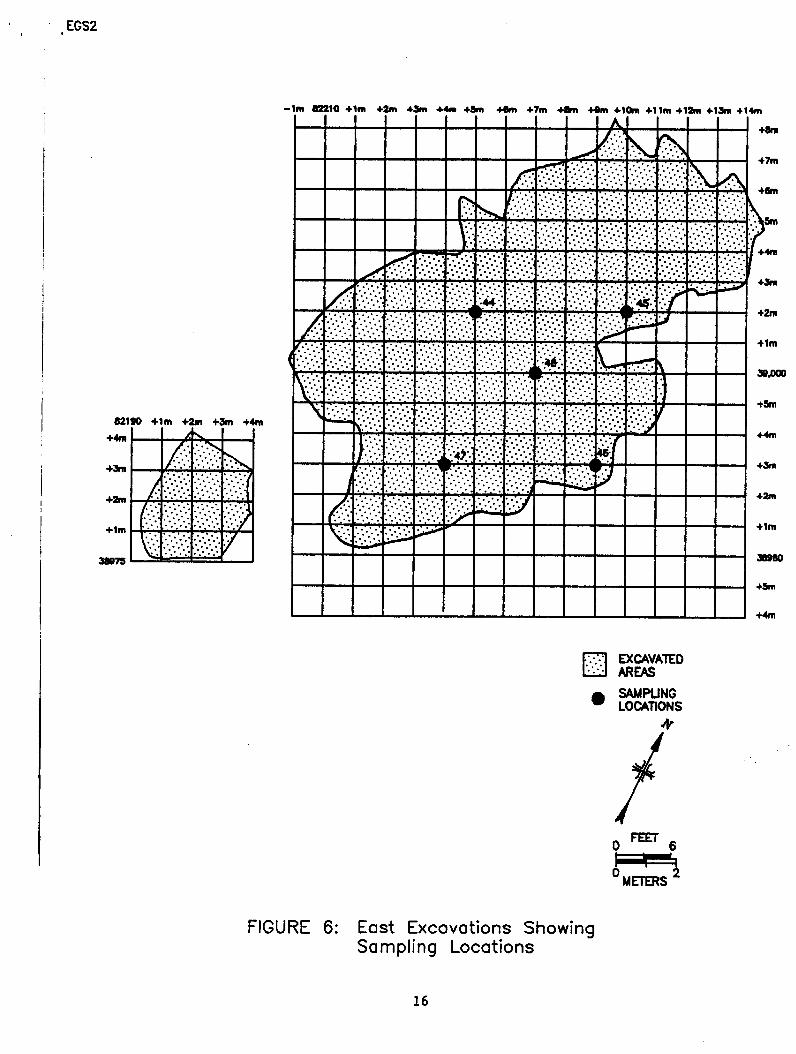
3. Within excavations, either five-point or single-point (from the area exhibiting the highestcontact gamma radiation level) soil samples were collected (Figures 5-7).
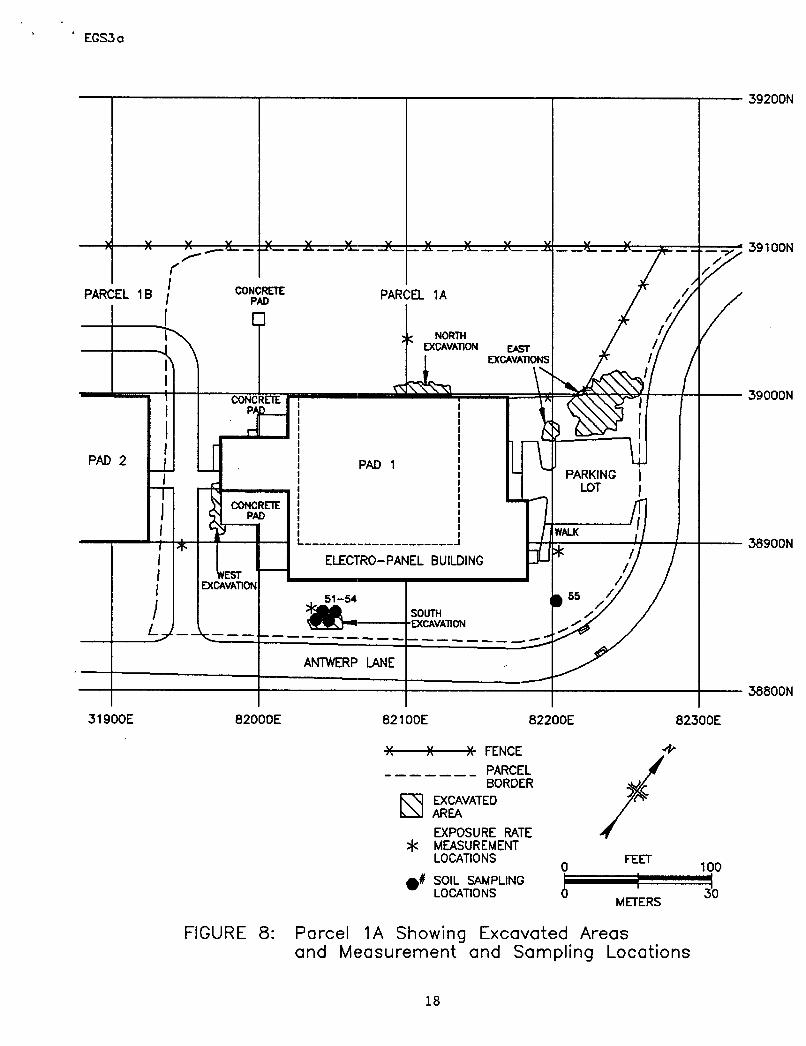
4. Three (3) soil samples were collected from the surface and subsurface of locations within
Parcel 1A identified during gamma scans (Figure 8). A post-remedial action soil samplewas collected by the PMC and provided to ORAU for analysis.
5

Exposure Rates
5. Exposure rate measuremets were made at four locations using a pressurized ionization
chamber (Figure 5).
DATA INTERPREATION AND SAMPLE ANALYSIS
Samples and direct measurement data were returned to ORAU's laboratory for analysis andinterpretation. Individual soil samples were analyzed by solid-state gamma spectrometry forU-238, Th-232 and Ra-226. For interior locations, equal aliquots of the five samples from
selected grid blocks were composited in the laboratory. These composite samples together with
selected samples from locations identified during surface scans were analyzed by alpha
spectrometry for Th-230. Samples collected from exterior locations were not analyzed forTh-230. Smear samples were analyzed for gross alpha and gross beta activity with a low
background proportional counter.
FINDINGS AND RESULTS
Document Review
Review of the characterization report, data and project summary transmitted by the PMC
provides adequate support of the success of remedial actions in meeting DOE guidelines.
Comments will be provided to the PMC requesting clarification to deficiencies identified in thePMC's data transmittal letter #078999. These deficiencies should be addressed in the PMC's
Post-Remedial Action Report.
6> a 0 X Cg/5 pW'CJ ah;e ^r^4· v +$fA _9t A
6

Interior
Surface Scans
Gamma scans of the soil beneath Pad 1 detected small areas of elevated activity which were
identified to the PMC. The majority of the locations found were the result of small pieces ofcontaminated concrete scattered within the soils. Upon removal of the concrete by the PMC,activity returned to background levels. One localized area of contaminated soil was foundadjacent to one of the concrete footers within the Phase 1 excavation area. At a later time,additional excavation was performed by the PMC and a post-remedial soil sample was provided
to ORAU. Gamma scans of the remaining area did not indicate the presence of any additionalareas of elevated activity.
Beta-gamma scans of the exposed edges of the remaining concrete pad did not identify anysignificant elevated activity. Random scans of the concrete blocks, identified for release anddisposal at a sanitary landfill, identified elevated activity on several blocks. As a result of these) W,5findings, the PMC performed additional surveys of the concrete rubble in order to ensure tha t ~
the material was releasable and resegregated as necessary.
Measurement of Surface Activity
Surface activity measurements collected from the 1 m2 sections of concrete are summarized inTable 1. Five-point direct measurement activities ranged from < 66 to 150 dpm/100 cm2 and<910 to 6800 dpm/100 cm2 for alpha and beta-gamma respectively. The highest average
activity over 1 m2 sections of concrete were < 83 dpm/100 cm2 for alpha and 3400 dpm/100 cm2
for beta-gamma.
Removable activity levels were less than the detection limit of the procedure which is
<6 dpm/100 cm2 for alpha and < 13 dpm/100 cm2 for beta.
7

Radionuclide Concentrations in Soil
Concentrations of radionuclides found in soils beneath Pad 1 are summarized in Tables 2 and 3.Final concentrations of radionuclides of concern, after additional remediation, are as follow:U-238, 0.2 to 17.7 pCi/g; Ra-226, 0.1 to 4.1 pCi/g; Th-230, 0.91 to 2.53 pCi/g; Th-232, 0.1to 2.2 pCi/g.
Exposure Rates
Exposure rates at one meter above the surface are summarized in Table 4. Levels for the siteranged from 8 to 10 /R/h. Background measurements in the Oak Ridge area are typically inthe 7 to 10 tR/h range.
Exterior
Surface Scans
Gamma scans of the exterior portions of Parcel 1A detected one small area of elevated activityon the south side of the building. The location was identified to the PMC. At a later time,additional excavation was performed by the PMC and post-remedial soil samples were providedto ORAU. No other areas of significant elevated activity were identified during the walkoversurvey.
Radionuclide Concentrations in Soil
Concentrations of radionuclides found in soil samples collected from Parcel 1A are summarizedin Tables 5 and 6. Final concentrations, after remediation of the elevated area previouslydiscussed, for radionuclides of concern are as follow: U-238, 1.6 to 8.1 pCi/g; Ra-226, 0.5 to1.4 pCi/g; Th-232, 0.4 to 1.7 pCi/g.
8

Exposure Rates
Exposure rate measurements made at four locations on Parcel 1A are summarized in Table 2.Exposure rates at one meter above the surface ranged from 6 to 8 IR/h. Backgroundmeasurements in the Oak Ridge area are typically in the 7 to 10 t/R/h range.
COMPARISON OF RESULTS WITH GUIDELINES
The primary contaminant at Elza Gate was natural uranium. Natural uranium emits both alphaand beta radiations in approximately equal proportions; beta levels may therefore be consideredrepresentative of uranium surface activity. Because rough, dirty, or damp surfaces mayselectively attenuate alpha radiation, beta activity was also measured and used for comparison.Guidelines for residual surface activity for natural uranium are:
Total Activity
5000 ca dpm/100 cm2, averaged over 1 m2
15,000 at dpm/100 cm2, maximum in a 100 cm2 area
Removable Activity
1000 a dpm/100 cm 2, removable
The generic guideline for thorium and radium in soil are as follows:
5 pCi/g averaged over the first 15 cm of soil below the surface
15 pCi/g averaged over 15 cm thick layers of soil more than 15 cm below
the surface
The residual uranium cleanup guideline developed for the Elza Gate Site is 35 pCi/g ofU-238.
9
All final independent measurements and samples collected were within these guidelines andconfirmed the data provided by the PMC.
SUMMARY
During the months of March, April and May, representatives from ORAU conducted verificationmeasurements and sampling of Parcel 1A at the Elza Gate Site. The data collected verifies thedata provided by the PMC which indicates that the property meets the DOE guidelines forrelease without radiological controls. However, contamination remains on contiguous propertiesand proper engineering controls should be implemented during future remedial actions to preventrecontamination of Parcel 1A.
10

EGS9
i s^ ;;;;1111111;\;i; RAILROAD
'^^^fi-^~~~~~~~ -^ N ~ ~NOT TO SCALE
FIGURE 1: Location of the Elza Gate Site,Oak Ridge, Tennessee
11

EGS1
39600N
_7~-- ~ ~ - ~ _ ~ -~ -~ - ~ -~ - --- --3 1--- -39500N
39400N
.-. -- -_ - -_ - - -- -- 3900N39300N
00"CA…39200N^"E~ ON~n OMHK ECAK~ ~ TO MELTON
: t t t i iL $ $X t 1 B )39100N_._ . . '*- *-' .-- ... .. :. .1._E...I.E
^ ^-T-^^ -^^F" Tr !^!-- 3 9 000 N
r- ;'-;~-- ;;--a--^ -^ --. f --- 4^='-~ -- /38900N
__i - - ,_-..f^ ^^ · = 3 a H E = = : == L _ -- ~ - 38800N
3- - - -- - - -…38700N
- -- - - - - - - - s N - -- 3 8 6 00 N
'"""- -- " '" ' - 38400N
. PROPERTY UNE
/o FEET 0384
0 200
METERS
FIGURE 2: Elza Gate Site ShowingPlot Plan and Reference Grid
12

' EGS3
39200N
-X--X _i_..__._ X. v v _j _v f v _L _ __ ,i_____i_v__ /_. /Z 39100N
PARCEL 18 PARCEL 1AI /n
X--- k i 7CONCR.1 /, 39000N
I I
PAD 2 PAD 1 RI PARKINGLOT
7 __ _______________________ z__ ___
IN:) I
.=-- __ .__-------------- _38800N
31900E 82000E 82100E 82200E 82300E
X ------ FENCE ^>
C__ _ PARCELBORDER
0 FEET 100
METERS
FIGURE 3: Plot Plan of Parcel 1A
13
. EGS
PHASE 3 PHASE 2s--- REMEDIAL ACTION AREA ---- --- REMEDIAL ACTION AREA --
N37
e2 6 e 21 e .
*30 *.25
29 2B^ j
I^20 *O~ 32 2O
0I * e 0,* I
T,1RENRENCH ECPHASE14 13 g X 9IO5 NofI __
L·, L2 *,
I RENTRENCH TNCH PHASE 1* MEASUREMEN REMEDIAL
ISLn----------\ ----_---- I -----LO-TIO ON_ _
~ LAACTION
A 0 MR AREA
14
52.8W 30W 20W lOW OW
EXPOSURE RATEc MEASUREMENT
LOCATION
tSOL SAMPUNGLOCATIONS
!i ELEVATED ACIVITYSOIL SAMPUNG FEETLOCATION 0 30
METERS b
FIGURE 4: Pad 1 Excavation ShowingSampling and Measurement Locations
14
EGS5
81950 +1m +2m +3m +4m +5m +6m +7m +8m +9m
+13m
+12m
+8lm -- ____, WA __
+8m --- --- -- _ . - -
+4m -------- :^ :: .: . . . ': .. . .___
+2m ---- ---- ---- --- . . . -.-. . .
+1m O
Ir:l EXCAVATED 2
+Bm
+7m
+6m
FIGURE 5: West Excavation Showing
5m15
+4m
+3m
+2m
+lm
38900
.. . EXCAVATED
LOCATIONS FEE0 6/;
0 2
FIGURE 5: West Excavation ShowingSoil Sampling Locations
15
EGS2
-Im an10 +41 +2m 4 m +4 S 4m +7m 41m 4n +10m4 +11m +12m +13m *14m
| ------------- - --- *8m
+7m
¢ * 4+2m44
.. .<: . :.- .:.-.-.
+4nl -- T^^ - _~ _ __ _ _ +4m
+2m +3. ---+
Fm EXCAVATED. .L;: AREAS
^ SAMPUINGLOCATIONS
-......- : . '. :+4
0 FE E T 6
I m
FIGURE 6: East Excavations ShowingSampling Locations
16
.~:: ::: :. · : .I · · · o.-' : ·I:F~~~~~~IGURE: 6·:· Eost Excvoton Show:::ing:..·~::
Sampling Locations~~~~*5
:·: ·:: :~:I:~~ :.:16::I.' :·'

. EGS7
81993 i#m +2m +3m +4m +5m +6m +7m +8m +9m +10m +11m +12+5m- -…-___ --
+3m-
+2m- -- X b.. ,-".",.:.. L C E E
39001-- -
DOOR
ELECTRO-PANEL BUILDING m- EXCAVATEDL3 AREA
f SOIL SAMPLINGLOCAnTION
0 FEET 6
METERS2
FIGURE 7: North Excavation ShowingSampling Location
17
::'~~~~~~~~~~ 6: : 1·:-·:··::·1 :::::. ~2 ::·~~~~~ ::::.'·:·'METER
FIGURE :NrhEcvtohwnSampli-Png BULoIGDcaVt ion
EGS3a
_ _ _ _ -- _ _ __ - 39200N
....._y,,.. _..v _ X __,v,,.__ ~_ _ _ ,~_ ._~_ _X_ _,~__ ._X39100NCONCR ^ ETg i E -? OON
PARCEL 1 CONCRETE PARCEL 1Af__ ( D ,yPAD
_T\~~ **-1~ ~NORTH / // /___ __4_ j \ ~EXCAVATION EAST /
EXCAVATIONS // /
- CONCRETE I- 39000N
PAD 2 I _ PAD 1!i~~ !-~ - ~PARKING
CONCRETE 'I P 1IPAD i L
---- L ---------- ---------- 38900N
XER~~I _ ELECTRO-PANEL BUILDINGEST _________ ____
EXCAVATION
/ ,K. SOUTH /
ANTWERP LANE
38800N
31900E 82000E 82100E 82200E 82300E
X X XFENCE ^
- _---_ - PARCELBORDER
LX] AREA
EXPOSURE RATE* MEASUREMENT
LOCATIONS FEET 10
0 SOIL SAMPLING LI!0LOCATIONS 0 ETE S
METERS
FIGURE 8: Parcel 1A Showing Excavated Areasand Measurement and Sampling Locations
18

TABLE 1
SUMMARY OF SURFACE ACTIVITY MEASUREMENTSPAD 1, CONCRETE RUBBLE
ELZA GATE SITE. PARCEL 1AOAK RIDGE, TN
HIGHEST GRID BLOCK
# OF FIVE-POINT AVERAGE TOTAL ACTIVITY REMOVABLE ACTIVITY
PAD REMOVAL PHASE MEASUREMENTS dmlOg ; cm" dom1100 ;m2_a a range P-y range a range range
Phase I 16 < 66 3,400 < 66-150 < 910 - 6800 <6 < 13
%O o _8Phase II 5 < 83 1,500 < 83 - 120 < 960-3.900 < 6 < 13
Phase III 5 < 83 1,500 < 83 < 960- 2,900 < 6
* ' . . -. v * '*** '* . ' *' - ~ ~ ~ ~ < 1
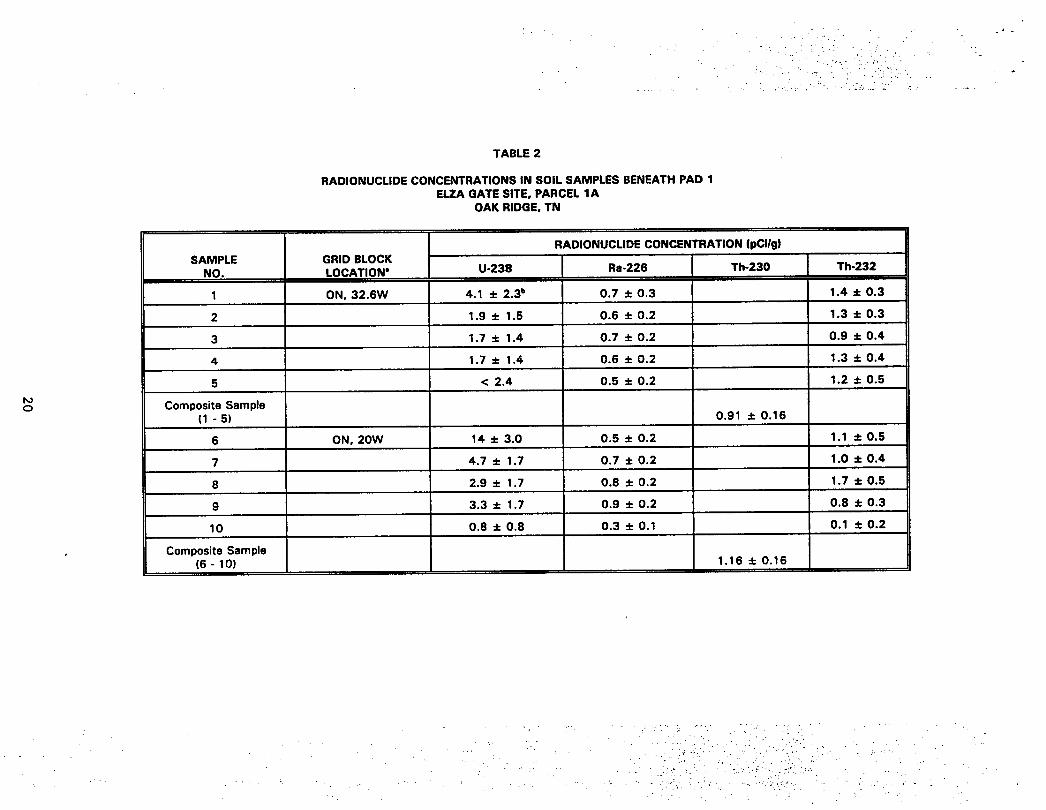
TABLE 2
RADIONUCLIDE CONCENTRATIONS IN SOIL SAMPLES BENEATH PAD 1ELZA GATE SITE, PARCEL 1A
OAK RIDGE, TN
RADIONUCLIDE CONCENTRATION (pCi/g)SAMPLE GRID BLOCK I
NO. LOCATION' U-238 Ra-226 Th-230 Th-232
1 ON, 32.6W 4.1 + 2.3b 0.7 ± 0.3 1.4 ± 0.3
2 1.9 ± 1.5 0.6 ± 0.2 1.3 ± 0.3
3 1.7 ± 1.4 0.7 + 0.2 0.9 ± 0.4
4 1.7 + 1.4 0.6 + 0.2 1.3 ± 0.4
5 < 2.4 0.5 ± 0.2 1.2 + 0.5
Composite Sample1 - 5) 0.91 + 0.16
6 ON, 20W 14 + 3.0 0.5 ± 0.2 1.1 * 0.5
7 4.7 ± 1.7 0.7 + 0.2 1.0 + 0.4
8 2.9 + 1.7 0.8 + 0.2 1.7 ± 0.5
9 3.3 + 1.7 0.9 + 0.2 0.8 + 0.3
10 0.8 + 0.8 0.3 ± 0.1 0.1 + 0.2
Composite Sample(6- 10) 1.16 0.16

TABLE 2 (Cont'd)
RADIONUCLIDE CONCENTRATIONS IN SOIL BENEATH PAD 1ELZA GATE SITE. PARCEL 1A
OAK RIDGE. TN
RADIONUCLIDE CONCENTRATION (pCilg)
SAMPLE GRID BLOCKNO. LOCATION' U-238 Ra-226 Th-230 Th-232
11 13N. 10W 14 ± 2.1 0.9 ± 0.2 1.8 ± 0.2
12 4.5 ± 1.3 1.1 ± 0.3 1.8 ± 0.5
13 1.3 * 1.0 1.1 ± 0.2 1.4 * 0.4
14 3.7 * 1.0 1.1 ± 0.2 1.4 ± 0.4
15 2.3 ± 0.9 0.9 ± 0.2 1.3 ± 0.4
15 QC 2.2 + 1.1 0.9 ± 0.2 1.7 : 0.4
Composite Sample(11 - 15) 1.16 ± 0.17
16 13N, 17W 11.9 ± 2.0 0.9 ± 0.2 1.1 ± 0.3
17 1.9 ± 1.1 0.8 + 0.2 1.0 ± 0.5
18 2.7 ± 1.0 0.7 ± 0.2 1.0 ± 0.4
19 3.6 + 1.1 0.8 + 0.1 1.4 ± 0.4
20 7.7 ± 1.0 1.2 ± 0.2 1.0 ± 0.4
Composite Sample(16- 20) 1.55 ± 0.18

TABLE 2 (Cont'd)
RADIONUCLIDE CONCENTRATIONS IN SOIL SAMPLESELZA GATE SITE. PARCEL 1A
OAK RIDGE, TN
RADIONUCLIDE CONCENTRATION (pCi/g)SAMPLE GRID BLOCK
NO. LOCATION' U-238 Ra-226 Th-230 Th-232
21 20N, 30W 2.0 ± 1.3 1.0 ± 0.3 - 1.4 ± 0.5
22 2.7 + 1.1 1.3 ± 0.3 -- 1.3 * 0.4
23 7.9 ± 2.1 0.9 + 0.2 --- 1.3 + 0.4
24 3.4 ± 1.3 0.9 ± 0.2 - 1.6 ± 0.5
25 2.1 ± 1.2 0.7 ± 0.3 -- 2.2 ± 0.5
26 20N, 33W 1.3 + 1.4 1.0 ± 0.3 - 1.4 ± 0.4
27 0.2 ± 0.1 0.10 ± 0.03 - 0.13 ± 0.03
28 1.5 + 1.3 0.7 ± 0.2 -- 2.2 + 0.5
29 1.6 + 1.6 0.7 ± 0.2 _ 1.5 ± 0.5
30 1.3 + 1.4 1.0 + 0.3 _ 1.4 ± 0.5
30 QC 2.0 0 1.1 0.5 ± 0.2 - 1.5 ± 0.4
'Refer to Figure 4.bUncertainties represent the 95% confidence level, based only on counting statistics;additional laboratory uncertainties of + 6 to 10% have not been propagated into these data.---No analysis performed.
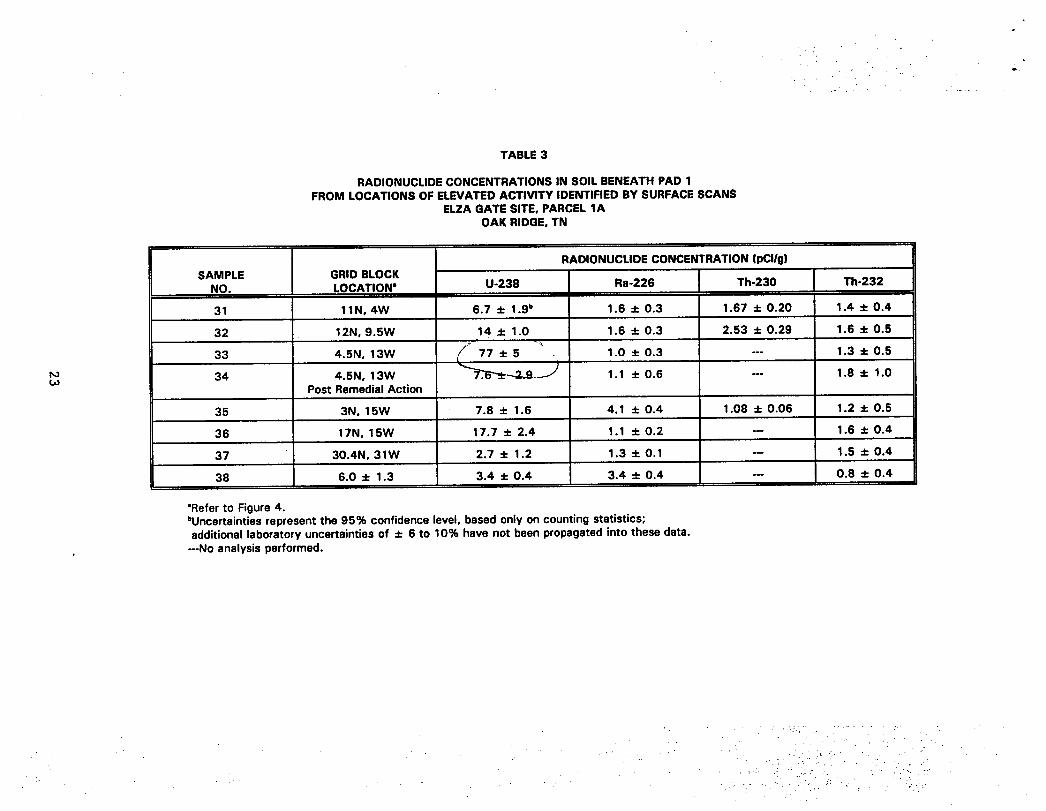
TABLE 3
RADIONUCLIDE CONCENTRATIONS IN SOIL BENEATH PAD 1FROM LOCATIONS OF ELEVATED ACTIVITY IDENTIFIED BY SURFACE SCANS
ELZA GATE SITE, PARCEL 1AOAK RIDGE, TN
RADIONUCLIDE CONCENTRATION (pCI/g)
SAMPLE GRID BLOCK I U- INO. LOCATION6 U-238 Ra-226 Th-230 Th-232
31 11N, 4W 6.7 ± 1.9b 1.6 ± 0.3 1.67 ± 0.20 1.4 + 0.4
32 12N, 9.5W 14 ± 1.0 1.6 ± 0.3 2.53 ± 0.29 1.6 ± 0.5
33 4.5N, 13W / 77 * 5 1.0 ± 0.3 --- 1.3 + 0.5
34 4.5N, 13W -- . 1.1 ± 0.6 --- 1.8 ± 1.0Post Remedial Action
35 3N, 15W 7.8 ± 1.6 4.1 ± 0.4 1.08 ± 0.06 1.2 ± 0.5
36 17N, 15W 17.7 ± 2.4 1.1 ± 0.2 - 1.6 ± 0.4
37 30.4N, 31W 2.7 ± 1.2 1.3 ± 0.1 1.5 ± 0.4
38 6.0 ± 1.3 3.4 ± 0.4 3.4 ± 0.4 - 0.8 ± 0.4
'Refer to Figure 4.bUncertainties represent the 95% confidence level, based only on counting statistics;additional laboratory uncertainties of ± 6 to 10% have not been propagated into these data.---No analysis performed.
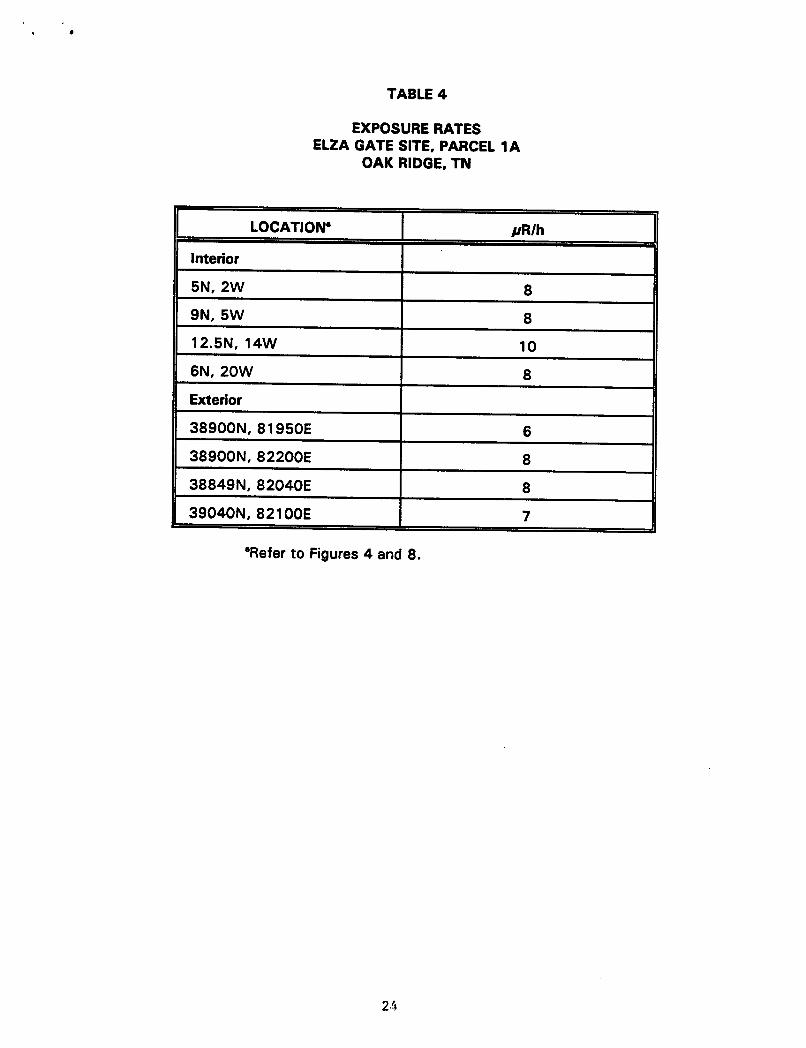
TABLE 4
EXPOSURE RATESELZA GATE SITE, PARCEL 1A
OAK RIDGE, TN
LOCATION' pR/h
Interior
5N, 2W 8
9N, 5W 8
12.5N, 14W 10
6N, 20W 8
Exterior
38900N,81950E 6
38900N, 82200E 8
38849N, 82040E 8
39040N,82100E 7
"Refer to Figures 4 and 8.
2,4
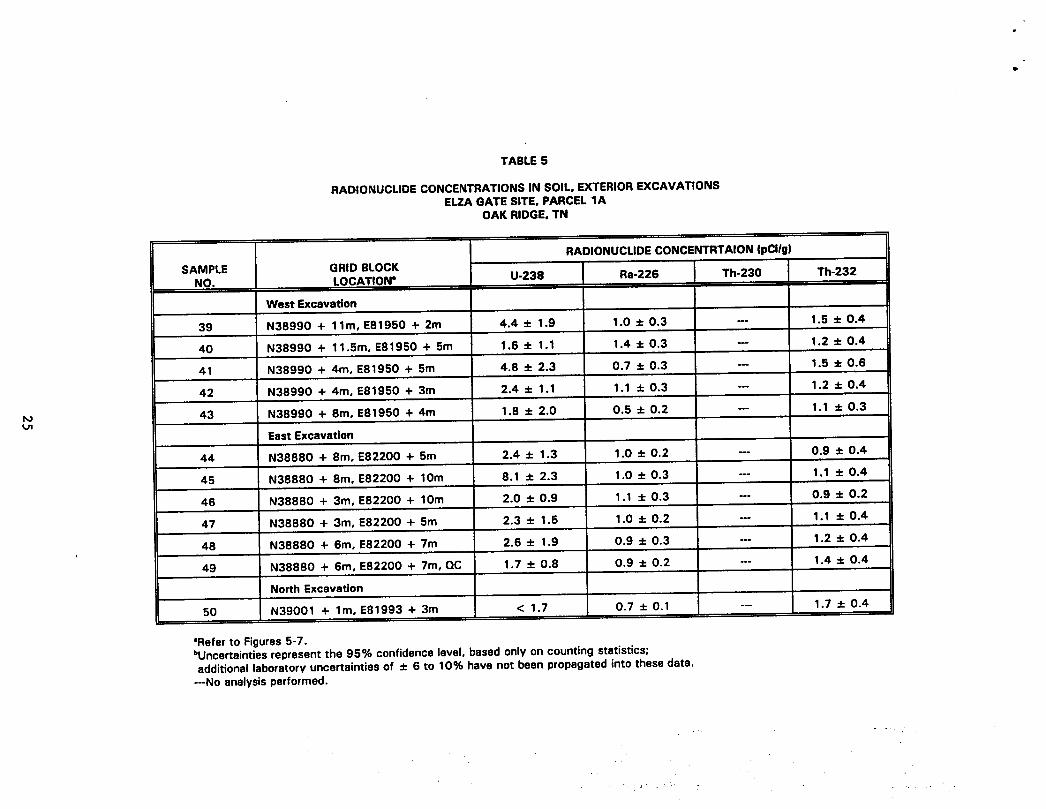
TABLE 5
RADIONUCLIDE CONCENTRATIONS IN SOIL, EXTERIOR EXCAVATIONSELZA GATE SITE, PARCEL 1A
OAK RIDGE, TN
RADIONUCLIDE CONCENTRTAION (pCil/g
NO. LOCATGIDBONK U-238 Ra-226 Th-230 Th-232
West Excavation
39 N38990 + 11m, E81950 + 2m 4.4 + 1.9 1.0 ± 0.3 -- 1.5 * 0.4
40 N38990 + 11.5m, E81950 + 5m 1.6 * 1.1 1.4 * 0.3 -1.2 + 0.4
41 N38990 + 4m, E81950 + 5m 4.8 * 2.3 0.7 * 0.3 -- 1.5 * 0.6
42 N38990 + 4m, E81950 + 3m 2.4 1.1 1.1 * 0.3 1.2 * 0.4
43 N38990 + 8m, E81950 + 4m 1.8 + 2.0 0.5 ± 0.2 -1.1 ± 0.3
East Excavation
44 N38880 + 8m, E82200 + 5m 2.4 + 1.3 1.0 ± 0.2 -- 0.9 ± 0.4
45 N38880 + 8m, E82200 + 10m 8.1 + 2.3 1.0 ± 0.3 --- 1.1 + 0.4
46 N38880 + 3m, E82200 + 10m 2.0 + 0.9 1.1 ± 0.3 -- 0.9 ± 0.2
47 N38880 + 3m, E82200 + 5m 2.3 ± 1.5 1.0 ± 0.2 -1.1 ± 0.4
48 N38880 + 6m, E82200 + 7m 2.6 ± 1.9 0.9 ± 0.3 -- 1.2 ± 0.4
49 N38880 + 6m, E82200 + 7m, QC 1.7 ± 0.8 0.9 ± 0.2 -- 1.4 ± 0.4
North Excavation
50 N39001 + 1m, E81993 + 3m < 1.7 0.7 ± 0.1 --- 1.7 ± 0.4
'Refer to Figures 5-7.bUncertainties represent the 95% confidence level, based only on counting statistics;
additional laboratory uncertainties of ± 6 to 10% have not been propagated into these data.
---No analysis performed.

TABLE 6
RADIONUCLIDE CONCENTRATIONS IN EXTERIOR SOILFROM LOCATIONS OF ELEVATED ACTIVITY IDENTIFIED BY SURFACE SCANS
ELZA GATE SITE, PARCEL 1AOAK RIDGE, TN
RADIONUCLIDE CONCENTRATION (pClgg)
SAMPLE GRID BLOCKNO. LOCATION OU-238 Ra-226 Th-230 Th-232
51 38849N, 82041E 3.4 * 1.7b 1.0 ± 0.2 - 0.4 ± 0.3
52 38849N, 82041E 22 ± 3.8 15.8 ± .8 0.5 ± 0.8
53 38849N, 82040E 19 3 26.9 ± 0 _ -- < 1.0
54 Post Remedial Action 1.6 0.8 .- .2± 0.2 - 0.6 ± 0.3
38849N,82040E
55 38861N. 82201E 2.0 + 1.0 1.0 ± 0.3 -0.6 ± 0.4
'Refer to Figure 8.bUncertainties represent the 95% confidence level, based only on counting statistics;additional laboratory uncertainties of + 6 to 10% have not been propagated into these data.
---No analysis performed.