Mechanisms underlying 3-bromopyruvate-induced cell death in ...
EMCDDA
June 2017
TECHNICAL REPORTEMCDDA assessment of drug-induced death data and contextual information in selected countries

EMCDDA assessment of drug-induced death data and contextual information in selected
countries
Contract number CT.15.IBS.0137.1.0
Tim Millara and Andrew McAuleyb
a) Division of Psychology and Mental Health, School of Health Sciences, The University of Manchester, United Kingdom
b) BBV/STI/VPD Group, Health Protection Scotland, and School of Health and Life Sciences, Glasgow Caledonian University, United Kingdom
May 2017
EMCDDA DRD 2016 projects ‘Steering Group’: Isabelle Giraudon, Tim Millar, Andrew McAuley, Håkan Leifman, Kathleen England, Roland Simon and Paul Griffiths
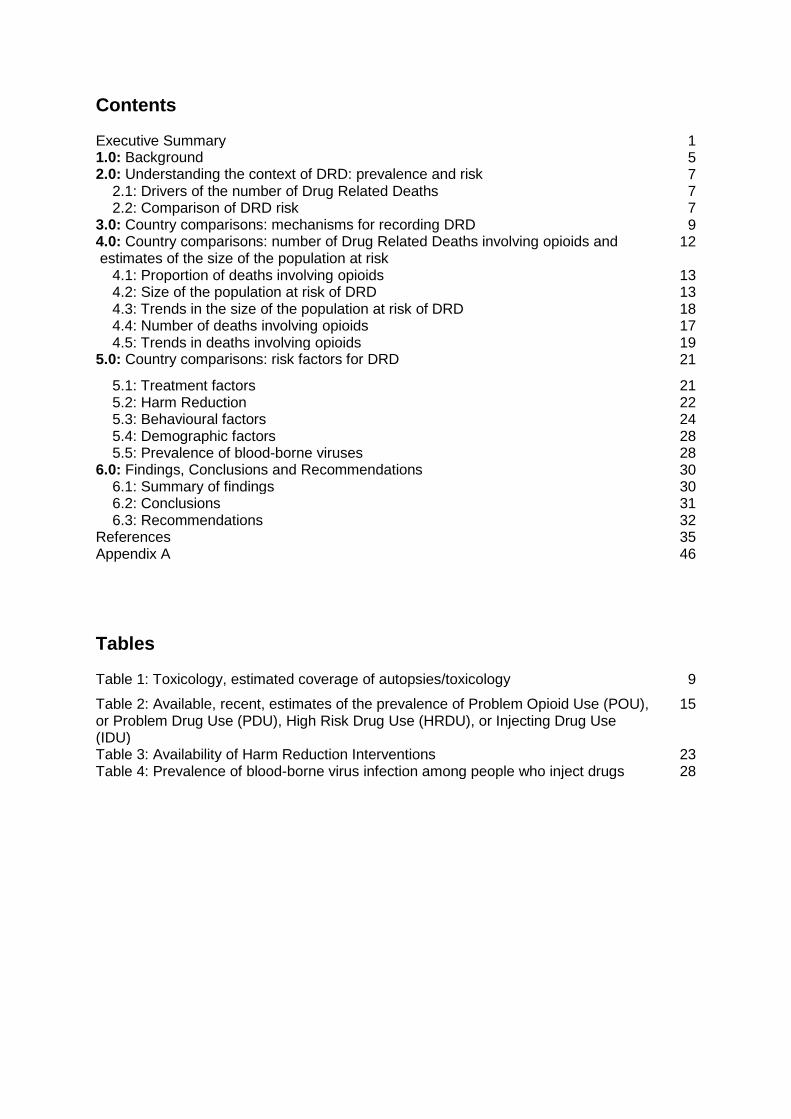
Contents
Executive Summary 1 1.0: Background 5 2.0: Understanding the context of DRD: prevalence and risk 7 2.1: Drivers of the number of Drug Related Deaths 7 2.2: Comparison of DRD risk 7 3.0: Country comparisons: mechanisms for recording DRD 9 4.0: Country comparisons: number of Drug Related Deaths involving opioids and estimates of the size of the population at risk
12
4.1: Proportion of deaths involving opioids 13 4.2: Size of the population at risk of DRD 13 4.3: Trends in the size of the population at risk of DRD 18 4.4: Number of deaths involving opioids 17 4.5: Trends in deaths involving opioids 19 5.0: Country comparisons: risk factors for DRD 21
5.1: Treatment factors 21 5.2: Harm Reduction 22 5.3: Behavioural factors 24 5.4: Demographic factors 28 5.5: Prevalence of blood-borne viruses 28 6.0: Findings, Conclusions and Recommendations 30 6.1: Summary of findings 30 6.2: Conclusions 31 6.3: Recommendations 32 References 35 Appendix A 46
Tables
Table 1: Toxicology, estimated coverage of autopsies/toxicology 9
Table 2: Available, recent, estimates of the prevalence of Problem Opioid Use (POU), or Problem Drug Use (PDU), High Risk Drug Use (HRDU), or Injecting Drug Use (IDU)
15
Table 3: Availability of Harm Reduction Interventions 23 Table 4: Prevalence of blood-borne virus infection among people who inject drugs 28

Figures
Figure 1: Number of DRD by country: total number of DRD, number with known toxicology, and number involving opioids: 2013
12
Figure 2: Proportion of Drug Related Deaths with known toxicology where opioids were present: 2013
13
Figure 3: Number of deaths with known toxicology where opioids were present: 2013 18 Figure 4: Mean annual number of opioid related deaths (2008-13) vs. best available estimates of problem opioid users (or proxy thereof)
19
Figure 5: Trends in the number of Drug Related Deaths involving opioids: 2004-2014 19 Figure 6: Number of persons in OST in each country during 2007 22 Figure 7: Trend in the percentage injecting primary drug among primary opioid users presenting for treatment: 2003-14
25
Figure 8: Proportion of clients entering treatment for opioids by country and type of opioid misused: 2010
26
Figure 9: Trend in mean age at DRD (all DRD) 27
Abbreviations
BBV Blood-borne virus CAN Swedish Council for Information on Alcohol and Other Drugs CDR Cause of Death Register CHI Community Health Index CI Confidence interval CRC Capture–recapture CTL Central Treatment List DCR Drug consumption room DD Drug death DID Drug-induced death DRD Drug-related death DXP Dextropropoxyphene EMCDDA European Monitoring Centre for Drugs and Drug Addiction GMR General mortality register HAT Heroin assisted treatment HBV Hepatitis B virus HCV Hepatitis C virus HIV Human immunodeficiency virus HRDU High-risk drug use HROU High-risk opioid user ICD-10 10th revision of the International Statistical Classification of Diseases and
Related Health Problems IEP Injecting equipment provision ISD Information Services Division Scotland NDRDD National Drug-related Death Database NDRDI National Drug-related Death Index NDTRS National Drug Treatment Reporting System NEP Needle exchange programme NIHD National Institute for Health Development

NRS National Records of Scotland NSP Needle and syringe provision OST Opioid substitution treatment PDU Problem drug use POU Problem opioid use PWID People who inject drugs SDMD Scottish Drug Misuse Database SIF Supervised injecting facility SMR Special mortality register SR Special registers TDI Treatment demand indicator THN Take-home naloxone

Acknowledgements We thank the following individuals for their valued contributions, which informed the development of this report: Country Contributors Scotland (and the United Kingdom)
Saket Pryadarshi, Roy Robertson, Lee Barnsdale and Frank Dixon (and Martin White)
Ireland Suzi Lyons and Ena Lynn
Finland Martta Forsell and Pirkko Kriikku
Denmark Henrik Saelan, Kari Grasaasen, Claudia Ranneries and Henrik Thiesen
Norway Thomas Clausen, Christian Lycke Ellingsen and Vigdis Vindenes
Estonia Gleb Denissov and Maris Salekešin Sweden Håkan Leifman, Joakim Strandberg, Daniel Svensson and
Jesper Hornblad
Thanks and acknowledgements also go to Linda Montanari, for her contributions to the analysis of treatment data, Nadine Van Gelder, for her support with data management, and Thomas Seyler, Dagmar Hedrich and Julian Vicente for helpful comments.

Executive summary
Background
More than 7 000 drug-related deaths (DRDs) are reported every year in Europe, which is equivalent to a mortality of circa 18 deaths per million population aged 15-64 years. However, there is considerable variation in the extent of DRDs in European countries: the rates reported in many of the northernmost European countries exceed 40 per million population, whereas in many southern European countries there are fewer than 10 DRDs per million per annum. There are also variations in the patterns of drug use, the drug markets and the national responses. The sensitivity of DRD recording systems may also vary between countries. The sensitivity of these recording systems may also vary over time, confounding temporal comparisons.
In this report, we summarise the findings of a project to examine the triggers and dynamics of DRDs in the seven northern European countries with the highest DRD rates per general population: Denmark, Estonia, Finland, Ireland, Norway, Sweden and Scotland (United Kingdom) during the 2004-2014 period. The project considered whether or not between-country variation in DRDs, and trends therein, might be explained in terms of:
• differences in (and changes to) mechanisms for recording DRDs; • differences (and trends) in the number of drug users at risk of DRD; • differences (and trends) in the level of DRD risk among those who are at risk.
The analysis is based on a series of country profiles (see Appendices A.1-7 for country profile summaries). These profiles were developed in consultation with national experts from the participating countries and summarise the available aggregate-level data pertinent to drug-related mortality. Many of these data derive from European Monitoring Centre for Drugs and Drug Addiction (EMCDDA) standard indicators, principally estimates of the prevalence of high-risk drug use; data on treatment seekers, demand, availability and coverage; the prevalence of drug-related infectious diseases; and the availability of primary harm-reduction measures. Structured interviews with national data providers and stakeholders were conducted, followed by a workshop involving national experts and the EMCDDA.
Key findings
In all seven countries, opioids were implicated in the bulk (circa 80-90 %) of DRDs. Therefore, opioid-related deaths were the project’s primary focus.
In all six of the countries for which trend data were available, the number of recorded DRDs involving opioids increased during the early part of the time series (up to 2008/2009). Most of these six countries exhibited an interruption to this increasing trend during 2010, the period of the European ‘heroin drought’. It is conceivable that reduced availability of heroin during this drought contributed to a reduction in both the number of individuals at (and/or occasions of) immediate risk and the level of risk involved. Thereafter (up to 2014), in only one of the six countries (Sweden) was there a clear and sustained increase in recorded DRDs, although more recent data (not covered here) indicate subsequent increases in Scotland and Ireland.
2
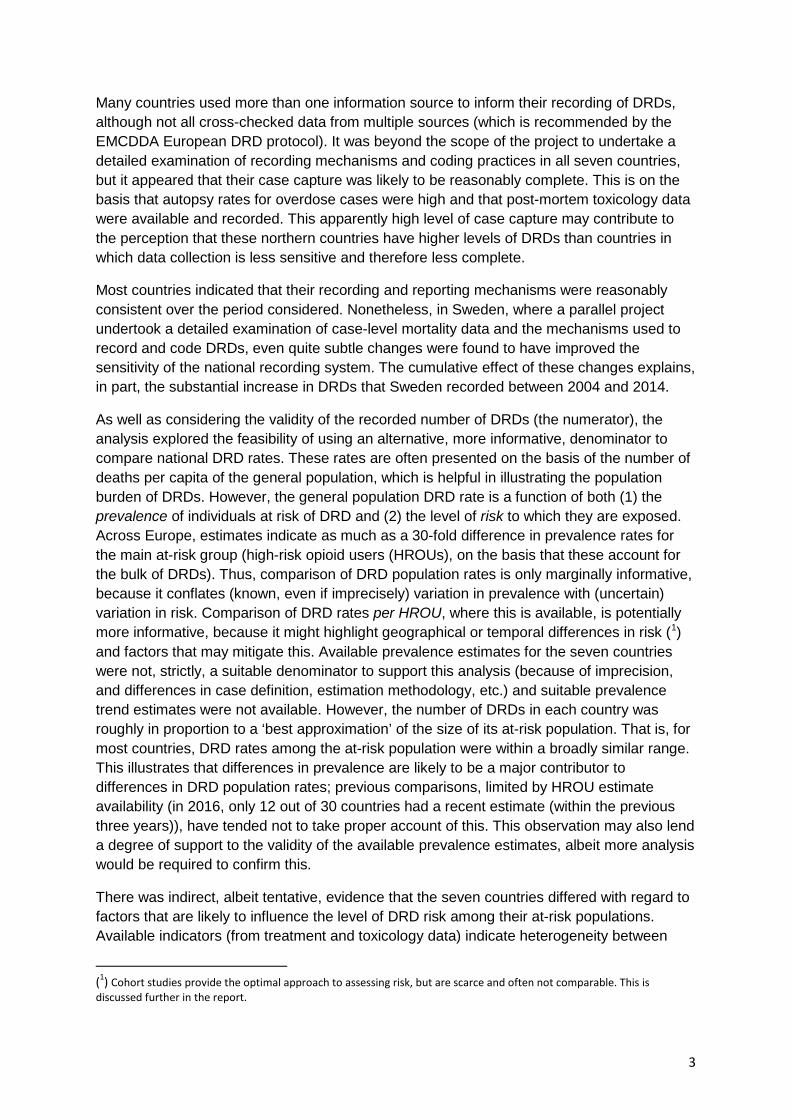
Many countries used more than one information source to inform their recording of DRDs, although not all cross-checked data from multiple sources (which is recommended by the EMCDDA European DRD protocol). It was beyond the scope of the project to undertake a detailed examination of recording mechanisms and coding practices in all seven countries, but it appeared that their case capture was likely to be reasonably complete. This is on the basis that autopsy rates for overdose cases were high and that post-mortem toxicology data were available and recorded. This apparently high level of case capture may contribute to the perception that these northern countries have higher levels of DRDs than countries in which data collection is less sensitive and therefore less complete.
Most countries indicated that their recording and reporting mechanisms were reasonably consistent over the period considered. Nonetheless, in Sweden, where a parallel project undertook a detailed examination of case-level mortality data and the mechanisms used to record and code DRDs, even quite subtle changes were found to have improved the sensitivity of the national recording system. The cumulative effect of these changes explains, in part, the substantial increase in DRDs that Sweden recorded between 2004 and 2014.
As well as considering the validity of the recorded number of DRDs (the numerator), the analysis explored the feasibility of using an alternative, more informative, denominator to compare national DRD rates. These rates are often presented on the basis of the number of deaths per capita of the general population, which is helpful in illustrating the population burden of DRDs. However, the general population DRD rate is a function of both (1) the prevalence of individuals at risk of DRD and (2) the level of risk to which they are exposed. Across Europe, estimates indicate as much as a 30-fold difference in prevalence rates for the main at-risk group (high-risk opioid users (HROUs), on the basis that these account for the bulk of DRDs). Thus, comparison of DRD population rates is only marginally informative, because it conflates (known, even if imprecisely) variation in prevalence with (uncertain) variation in risk. Comparison of DRD rates per HROU, where this is available, is potentially more informative, because it might highlight geographical or temporal differences in risk (1) and factors that may mitigate this. Available prevalence estimates for the seven countries were not, strictly, a suitable denominator to support this analysis (because of imprecision, and differences in case definition, estimation methodology, etc.) and suitable prevalence trend estimates were not available. However, the number of DRDs in each country was roughly in proportion to a ‘best approximation’ of the size of its at-risk population. That is, for most countries, DRD rates among the at-risk population were within a broadly similar range. This illustrates that differences in prevalence are likely to be a major contributor to differences in DRD population rates; previous comparisons, limited by HROU estimate availability (in 2016, only 12 out of 30 countries had a recent estimate (within the previous three years)), have tended not to take proper account of this. This observation may also lend a degree of support to the validity of the available prevalence estimates, albeit more analysis would be required to confirm this.
There was indirect, albeit tentative, evidence that the seven countries differed with regard to factors that are likely to influence the level of DRD risk among their at-risk populations. Available indicators (from treatment and toxicology data) indicate heterogeneity between
(1) Cohort studies provide the optimal approach to assessing risk, but are scarce and often not comparable. This is discussed further in the report.
3

countries in the degree of behavioural risk involved in opioid use, especially with regard to the type of opioids typically consumed (heroin vs. fentanyl vs. other opioids), patterns of adjunctive (polydrug) use, and the prevalence of injecting (which was markedly higher than the European ‘average’ in some countries). There were also differences in potential demographic risk/vulnerability, whereby some countries had an older at-risk population (which is relevant because DRD risk increases with age). In addition, there was some indication of differences in contextual factors that are likely to be associated with the level of risk, such as countries’ treatment coverage or the prevalence of blood-borne virus (BBV) infection. It is notable that Estonia, for which comparison of the number of DRDs with the number of users at risk indicated a potentially greater than average risk, also exhibited a range of contributory factors (high rates of fentanyl use, high rates of injecting and a high prevalence of BBV infection) associated with elevated risk.
Limitations
A limitation of this report is that it does not consider, in detail, the seven countries’ DRD coding and recording practices, or the data flow between their different mortality registers. These aspects are covered in a parallel project, commissioned by the EMCDDA in 2016, that considers these factors for all 30 countries and for a range of southern European countries in particular for some aspects of the project (England, 2017a, 2017b, 2017c). Additional exploration of market data (the availability and purity of the opioids in common use) would have added to the ability to explore the level of risk, but this was not possible because of the scarcity of supporting data. Also, data to support analysis of other key factors that affect DRD risk, such as the extent of recent imprisonment or psychiatric comorbidity and the quality or duration of treatment, were not analysed.
Recommendations
Clearly, countries should continue to endeavour to produce and use robust DRD data, including information about toxicology that is indispensable for the basic descriptive epidemiology of DRDs. Several recommendations emerged from the project, based on analysis and the advice of the national experts, designed to help countries place their DRD data within the proper context, in order to facilitate temporal and geographical comparison and better inform knowledge about the epidemiology of DRDs for policymaking. Three key recommendations are summarised below:
1. The number of deaths per capita of the general population is helpful for illustrating the population burden of DRDs, but general population rates for DRDs should not be used as a basis for the geographical or temporal comparison of DRD risk.
2. Countries should produce more specific estimates of the prevalence of high-risk opioid use, to provide a denominator to support comparisons of opioid-related DRD rates (and thereby risks).
3. Preferably, to assess DRD risk, countries should undertake (or regularly update) mortality cohort studies (notwithstanding the difficulty of recruiting representative cohorts of sufficient size and ensuring comparability with other studies).
4

Cross-indicator analysis, such as that undertaken here, should be encouraged and the findings communicated to policymakers. To support this, it is suggested that EMCDDA indicator data (e.g. treatment demand data) that are more specific to the main at-risk population (i.e. HROUs) are analysed against DRD data.
Conclusions
The population burden of DRDs is high; this is evident especially in northern Europe. As illustrated here, simple comparisons of the numbers of DRDs and the associated population rates are unlikely to yield meaningful inferences about the causes of such high rates in northern Europe, because much of the variation in DRD rates can be explained in terms of variation in the prevalence of users at risk.
A broad range of factors may contribute to differences (or changes) in the level of DRD risk within the at-risk population. However, (1) there may be complex interactions between drivers; and (2) upwards and downwards drivers will operate simultaneously. Thus, it is unlikely that a single explanatory factor exists or could be identified.
DRDs occur within a highly complex and dynamic context. Policymakers should understand that simple hypotheses about the impact, if any, of the responses to DRDs that are (or are not) provided should be avoided. In the absence of properly controlled studies, even if the number of DRDs is increasing, it should not be assumed that interventions put in place to reduce risk are not effective.
5

1.0: Background
This report summarises the findings of a project to examine drug-related deaths (DRDs) in seven selected European countries: Denmark, Estonia, Finland, Ireland, Norway, Scotland and Sweden and. These countries have been selected by the European Monitoring Centre for Drugs and Drug Addiction (EMCDDA) on the basis that:
• they may have high, and in some cases increasing, numbers of recorded DRDs; • their general population rate for DRDs is above the EU average (EMCDDA, 2016a).
As discussed later in this report, and depending on the objective of the comparison, general population rates for DRDs may not be the preferred measure for the purposes of comparison between countries.
The project was designed to develop an understanding of the triggers and dynamics of drug-related mortality in these countries by considering the national contexts of these deaths; comparing the different national situations; and investigating the possible impact of methodological changes (in these seven countries) in the manner of recording DRDs, if these exist.
The report is based on a series of country profiles (see Appendices 1-7 for profile summaries), which have been developed in consultation with national experts from the participating countries and which summarise the available indicator data pertinent to drug-related mortality, much of which derives from EMCDDA standard indicators. These country profiles draw together relevant information to consider whether or not, and if so why, DRD rates in the selected countries are high or increasing; the profile of drug use in each country, including wider contextual factors; how trends in drug-related mortality have evolved and the drivers for the changes observed; the coverage of autopsies/toxicological examination in each country; and coding and data collection practices in each country. The information presented is based upon the following:
• a review of the quantitative data reported though Fonte to the EMCDDA; • a review of national reports/workbooks/country profiles; • a review of the pertinent literature; • structured interviews with the focal point/national experts from each of the seven
countries; • the collation of the data reported by the countries to the EMCDDA on harm
reduction, treatment, infections, prices and purity.
A parallel project investigated the mechanisms used by 19 of 30 (the 28 EU Member States plus Norway and Turkey) European countries to record DRDs and the comparability thereof, including detailed examinations of coding practices and the use of specific ICD-10 (10th revision of the International Statistical Classification of Diseases and Related Health Problems) codes (England, 2016; England, 2017a; 2017b; 2017c; Giraudon et al., 2016a). The work of this parallel project highlights examples of good practice and the issues related to the only partial national coverage of DRD recording in many countries.
6

Box 1 describes the sources (general mortality registers (GMRs) and special registers (SRs)) from which Member States obtain information regarding DRDs. Six of the seven countries considered here provided data derived from a GMR (Selection B), while Ireland provided data based on an SR (Selection D). The DRD figures reproduced here are based on these sources, but many countries maintain additional registers to meet their particular national needs.
As shown in Chapter 4, in all of the countries considered here, opioids are implicated in the bulk (circa 80-90 %) of DRDs. The number of deaths that do not involve opioids is very small; thus, small variations in these have a disproportionate effect on the apparent non-opioid trend and patterns are more difficult to discern. Therefore, the primary focus of the project reported here was on attempting to understand the context of opioid-related deaths.
Box 1: Drug-related deaths, definition In its DRD protocol, the EMCDDA defines DRDs (more precisely, drug-induced deaths (DIDs)) as follows: ‘...people who die directly due to use of illegal substances, although these often occur in combination with other substances such as alcohol or psychoactive medicines. These deaths occur generally shortly after the consumption of the substance. They are also known as overdoses or poisonings’. The EMCDDA standard protocol transforms this definition into operative criteria for extracting the relevant deaths from both General Mortality Registers (GMR) and Special Registers (SR) (types of death) in a way that provides the best possible estimation for the number of cases matching this definition. For the GMR, these operative criteria consist of a list of codes from the WHO International Classification of Diseases (ICD) 10th Edition. For the SR they consist of the classes of deaths that should be extracted (only overdoses out of all possible cases recorded in these registries e.g. traffic accidents, violence). The DRD protocol specifies the following: ‘For GMR, the list of ICD-10 codes is known as “Selection B”. They include cases where the underlying cause of death (the condition that initiated the process that lead to the death) is: (1) mental and behavioural disorders due to psychoactive substance use (harmful use, dependence, and other mental and behavioural disorders (F codes) due to opioids, cannabinoids, cocaine, other stimulants, hallucinogens or multiple drug use, or (2) poisonings (X and Y codes) that are accidental, intentional or of undetermined intent due to substances under the heading of narcotics (T40-0 to T40-9) or psychostimulants (T43.6). For the SR, the EMCDDA operative criteria are known as “Selection D”. Cases are selected when the deaths are due to poisoning by accident, suicide, homicide, or undetermined intent by a set of illegal drugs of abuse.’ (EMCDDA, 2010; EMCDDA, 2011a)
7

2.0: Understanding the context of drug-related deaths — prevalence and risk
2.1: Drivers of drug-related deaths
In simple terms, in order to understand the context of DRDs, which is necessary if we are to make meaningful comparisons between countries and over time, we must consider two key, interacting drivers, which are the primary factors explaining the number (and general population rates) (2) of DRDs that occur:
1. the number of drug users who are at risk of DRD; 2. the level of risk involved.
Perhaps the more important of these is the number of individuals in the population who engage in drug use that involves a risk of overdose or drug poisoning (hereafter ‘at-risk drug users’; see Section 2.2 for further discussion of the groups affected). The second factor is the degree of risk that is associated with such drug use (Waal and Gossop, 2014). Put simply, the larger the number of individuals who are at risk of DRD and the greater the degree of risk involved, the larger the number who will die as a consequence of drug use. Countries differ, and there are likely to be changes over time within countries, with respect to the number (and prevalence rate) of at-risk drug users within their populations. Countries may also differ, and there may be differences over time, with respect to the degree of risk associated with such drug use. Differences in risk may be explained in terms of a variety of different factors, such as the availability of treatment or specific interventions to reduce risk; behavioural risk (e.g. the extent of polydrug/polysubstance use or the extent to which injecting is a mode of administration among the at-risk population); demographic risk (e.g. the age of the at-risk population); etc. Thus, we should expect to see differences between countries and over time in the number and general population rate of DRDs.
2.2: Comparison of DRD risk among at-risk drug users
The prevalence of at-risk drug users may be a primary driver of differences or, for temporal changes, in the extent of drug-related mortality. However, in policy terms it is perhaps equally important to understand whether or not there are differences between countries or over time in the degree of risk associated with drug use among at-risk drug users. Here, the question is not whether there are more DRDs in one country than in another or whether the number of DRDs is increasing or decreasing, but whether DRD among at-risk drug users in one place or at one time is more or less likely than in another place or at another time. That is, are there national or temporal differences in the rate of DRDs among those drug users
(2) Note that the DRD rates reported in the European Drug Report are calculated on the basis of the number of DRDs (among 15- to 64-year olds) divided by the number of persons in the general population aged 15-64 years.
8

who are at risk? If these rates differ then we might conclude that this reflects underlying differences in the degree of risk involved.
Box 2: Comparison of hypothetical countries Country A
100 opioid DRDs per annum General population = 1 000 000 persons
Estimated POU prevalence 5 000 persons
(POU population rate = 50 per 10 000)
General population DRD rate = 1 per 10 000 POU DRD rate = 200 per 10 000
= ≠
Country B 500 opioid DRDs per annum.
General population = 5 000 000 persons
Estimated POU prevalence = 60 000 persons
(POU population rate = 120 per 10 000)
General population DRD rate = 1 per 10 000 POU DRD rate = 83 per 10 000
Comparison of DRD risk requires both accurate measurement of the number of DRDs that occur and knowledge of the size of the drug user population in which these deaths occur. As noted earlier, the majority of DRDs in the countries considered here involve opioids and the primary focus of this report is on opioid-related deaths. Therefore, putting aside the question of differences in the accuracy of recorded DRD figures, the EMCDDA indicator for estimates of the prevalence of problem opioid use (POU; see Box 4) (3) would provide the most suitable denominator with which to frame national DRD figures.
It should be noted that, whilst the number of DRDs per capita of the general population is a helpful indicator of the population burden that arises from DRDs, it is not an adequate basis for comparing risk within the at-risk population, because prevalence rates for at-risk drug users differ between countries and over time. For example, available estimates indicate a more than 30-fold difference in POU prevalence rates between EU countries (EMCDDA, 2016b). This variation in prevalence rates may perhaps be exaggerated by differences in national definitions or methodologies, but the differences will confound comparisons of risk based on general population rates. Box 2 shows an illustrative comparison of two (hypothetical) countries; where comparison based on the general population rate for DRDs indicates similar rates in each country, but disguises a more than twofold difference in the DRD rate for the POU population specifically. Thus, similarities or differences in general population rates for DRDs do not, necessarily, signify similarities or differences in POU DRD risk. Temporal comparisons will be similarly confounded if POU prevalence rates have changed over time.
(3) The EMCDDA POU indicator was, in 2013, relabeled as the high-risk opioid use indicator; the estimates presented in this report were produced prior to this change.
9

3.0: Country comparisons — mechanisms for recording drug-related deaths
A key consideration, especially when considering trends over time, is whether or not there have been changes in the method used to identify and/or record DRDs. Equally, when comparing countries, it is important to consider the extent to which national recording systems provide data on DRDs that are comparable. The use of Selection D (see Box 1) data for Ireland may lead to some issues regarding comparability with the other six countries, for which Selection B data were used. If there is substantial variability between countries or over time with respect to the degree to which their systems capture cases of DRDs, then these differences in recording will confound comparisons between countries. Such variability might arise from differences or changes in recording practice (e.g. routine use of specific ICD codes on death certificates); coverage of autopsies and/or toxicology screening; the sensitivity of the toxicological tests employed; the drugs included in toxicology screening; or the national definition of DRD.
Table 1: Estimated coverage of toxicology, 2004-2014
Country Coverage
Denmark 94-100 %
Estonia 97-100 %
Finland 100 %
Ireland ~100 %
Norway ~90 %
Scotland 100 %
Sweden ~100 % See country profiles in Appendix for more details
Note that in a parallel EMCDDA project (England, 2017a; 2017b; 2017c; Giraudon et al., 2016), which considered a larger range of EU countries, a more detailed examination specifically of DRD recording mechanisms was undertaken. In this parallel project:
• the Inventory of the national Special Mortality Registries in Europe was reviewed with a focus on information flow to the General Mortality Register;
• examples of good practice and collaboration between the general mortality registers (GMRs) and special registers (SRs) were identified;
• coding practices and trends in DRDs in countries were reviewed following the World Health Organization (WHO) ICD-10 updates;
• data on DRDs in a subset of countries were analysed in order to evaluate the use of specific codes, such as X44/X64/Y14 codes, and non-specific codes, such as R99, X49 and X69, and the use or non-use of T codes.
10
The findings from this parallel project have been published in a separate report (England, 2017).
Table 1 shows the estimated coverage of autopsies of unexplained deaths and associated toxicology for the countries considered here. It is apparent that case capture is reasonably complete in all of the countries: their high level of case capture may contribute to the perception that these countries have higher levels of DRDs than countries for which the reliability of data collection is more limited or case capture may be less complete. For example, in France, it is suggested that official statistics underestimate the number of DRDs by as much as 30-40 % (Janssen, 2009; Janssen, 2010).
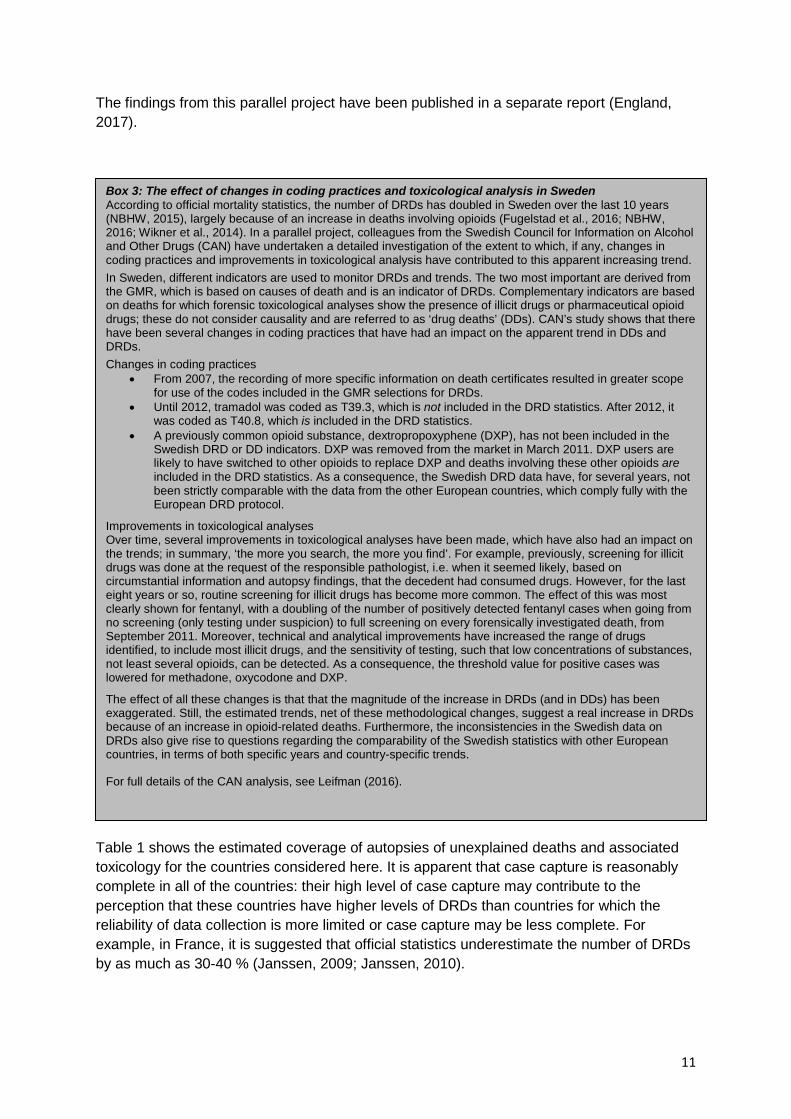
Box 3: The effect of changes in coding practices and toxicological analysis in Sweden According to official mortality statistics, the number of DRDs has doubled in Sweden over the last 10 years (NBHW, 2015), largely because of an increase in deaths involving opioids (Fugelstad et al., 2016; NBHW, 2016; Wikner et al., 2014). In a parallel project, colleagues from the Swedish Council for Information on Alcohol and Other Drugs (CAN) have undertaken a detailed investigation of the extent to which, if any, changes in coding practices and improvements in toxicological analysis have contributed to this apparent increasing trend. In Sweden, different indicators are used to monitor DRDs and trends. The two most important are derived from the GMR, which is based on causes of death and is an indicator of DRDs. Complementary indicators are based on deaths for which forensic toxicological analyses show the presence of illicit drugs or pharmaceutical opioid drugs; these do not consider causality and are referred to as ‘drug deaths’ (DDs). CAN’s study shows that there have been several changes in coding practices that have had an impact on the apparent trend in DDs and DRDs. Changes in coding practices
• From 2007, the recording of more specific information on death certificates resulted in greater scope for use of the codes included in the GMR selections for DRDs.
• Until 2012, tramadol was coded as T39.3, which is not included in the DRD statistics. After 2012, it was coded as T40.8, which is included in the DRD statistics.
• A previously common opioid substance, dextropropoxyphene (DXP), has not been included in the Swedish DRD or DD indicators. DXP was removed from the market in March 2011. DXP users are likely to have switched to other opioids to replace DXP and deaths involving these other opioids are included in the DRD statistics. As a consequence, the Swedish DRD data have, for several years, not been strictly comparable with the data from the other European countries, which comply fully with the European DRD protocol.
Improvements in toxicological analyses Over time, several improvements in toxicological analyses have been made, which have also had an impact on the trends; in summary, ‘the more you search, the more you find’. For example, previously, screening for illicit drugs was done at the request of the responsible pathologist, i.e. when it seemed likely, based on circumstantial information and autopsy findings, that the decedent had consumed drugs. However, for the last eight years or so, routine screening for illicit drugs has become more common. The effect of this was most clearly shown for fentanyl, with a doubling of the number of positively detected fentanyl cases when going from no screening (only testing under suspicion) to full screening on every forensically investigated death, from September 2011. Moreover, technical and analytical improvements have increased the range of drugs identified, to include most illicit drugs, and the sensitivity of testing, such that low concentrations of substances, not least several opioids, can be detected. As a consequence, the threshold value for positive cases was lowered for methadone, oxycodone and DXP.
The effect of all these changes is that that the magnitude of the increase in DRDs (and in DDs) has been exaggerated. Still, the estimated trends, net of these methodological changes, suggest a real increase in DRDs because of an increase in opioid-related deaths. Furthermore, the inconsistencies in the Swedish data on DRDs also give rise to questions regarding the comparability of the Swedish statistics with other European countries, in terms of both specific years and country-specific trends. For full details of the CAN analysis, see Leifman (2016).
11
It was beyond the scope of this project to consider, in detail, the recording systems used in each country and possible changes over time. However, in parallel work, the Swedish Council for Information on Alcohol and Other Drugs (CAN) examined data from Sweden’s three recording systems to establish (1) whether or not there have been changes over time in DRD recording processes and (2) the extent to which such changes contribute to the apparent increasing trend in DRDs in Sweden (see Box 3).
As shown later in the report (see Figure 5), Sweden has experienced a particularly dramatic increase in the number of recorded opioid-related DRDs; hence, it is important to understand whether this increase is a real one or it is an artefact arising from changes to the national recording system. The CAN study demonstrates, very clearly, the importance of considering such changes, because, although there appears to have been a real underlying increase, it is highly likely that quite subtle changes in coding and toxicological practice have inflated the apparent trend. Notable here is Sweden’s non-inclusion of dextropropoxyphene (DXP)-related deaths in its DRD figures; after DXP was withdrawn from the market in 2011, users are likely to have switched to other opioids that are included in the national DRD figures, inflating the apparent trend. Thus, the actual year-on-year increase in DRDs is real, but is less dramatic than the published figures suggest.
12
4.0: Country comparisons — number of drug-related deaths involving opioids and estimates of the size of the population at risk
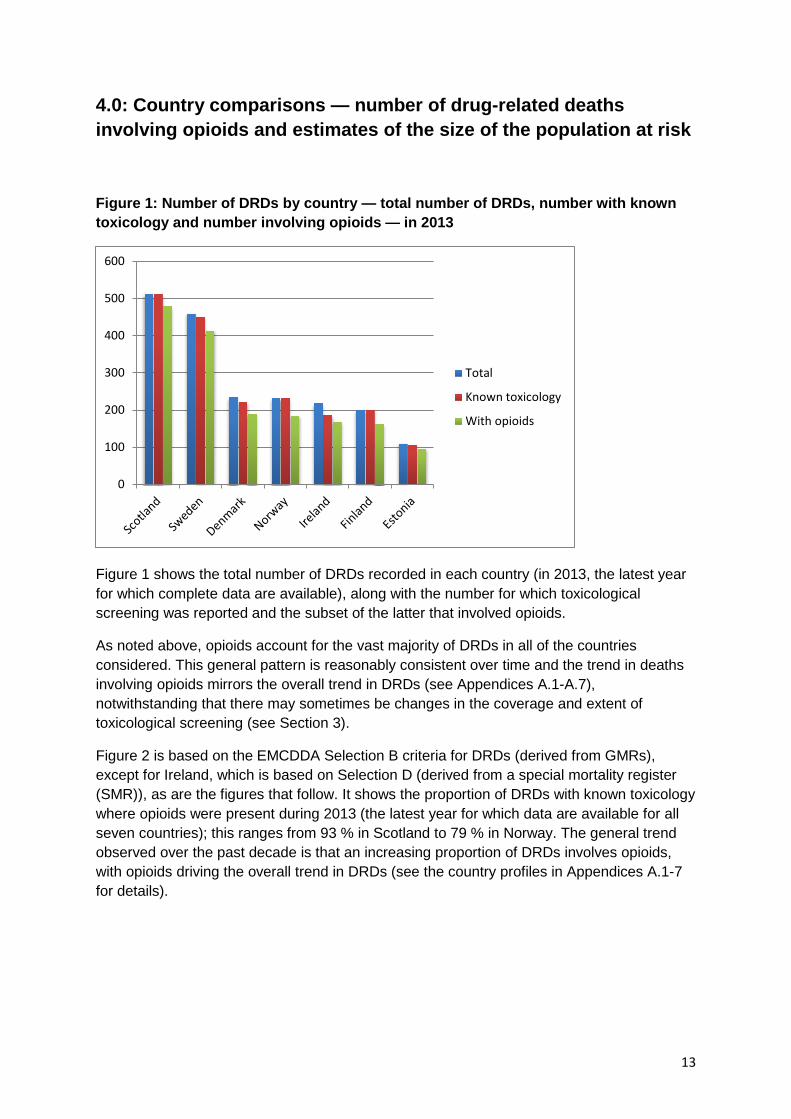
Figure 1: Number of DRDs by country — total number of DRDs, number with known toxicology and number involving opioids — in 2013
Figure 1 shows the total number of DRDs recorded in each country (in 2013, the latest year for which complete data are available), along with the number for which toxicological screening was reported and the subset of the latter that involved opioids.
As noted above, opioids account for the vast majority of DRDs in all of the countries considered. This general pattern is reasonably consistent over time and the trend in deaths involving opioids mirrors the overall trend in DRDs (see Appendices A.1-A.7), notwithstanding that there may sometimes be changes in the coverage and extent of toxicological screening (see Section 3).
Figure 2 is based on the EMCDDA Selection B criteria for DRDs (derived from GMRs), except for Ireland, which is based on Selection D (derived from a special mortality register (SMR)), as are the figures that follow. It shows the proportion of DRDs with known toxicology where opioids were present during 2013 (the latest year for which data are available for all seven countries); this ranges from 93 % in Scotland to 79 % in Norway. The general trend observed over the past decade is that an increasing proportion of DRDs involves opioids, with opioids driving the overall trend in DRDs (see the country profiles in Appendices A.1-7 for details).
0
100
200
300
400
500
600
Total
Known toxicology
With opioids
13
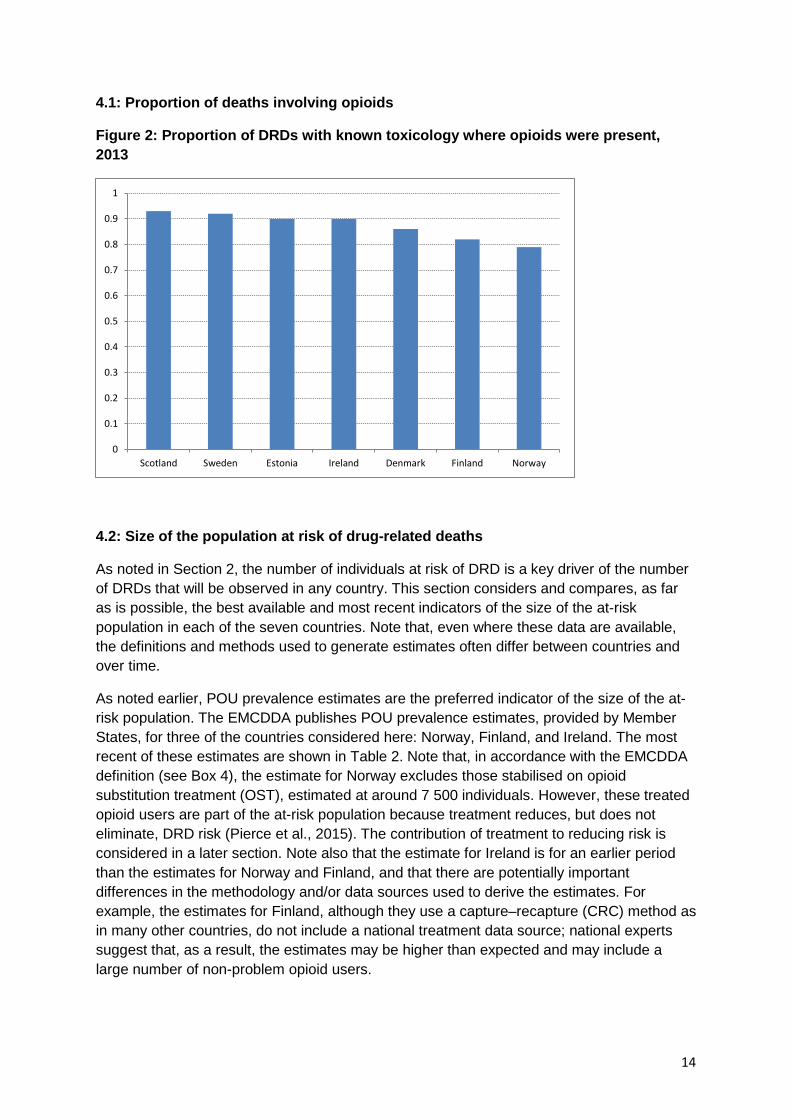
4.1: Proportion of deaths involving opioids
Figure 2: Proportion of DRDs with known toxicology where opioids were present, 2013
4.2: Size of the population at risk of drug-related deaths
As noted in Section 2, the number of individuals at risk of DRD is a key driver of the number of DRDs that will be observed in any country. This section considers and compares, as far as is possible, the best available and most recent indicators of the size of the at-risk population in each of the seven countries. Note that, even where these data are available, the definitions and methods used to generate estimates often differ between countries and over time.
As noted earlier, POU prevalence estimates are the preferred indicator of the size of the at-risk population. The EMCDDA publishes POU prevalence estimates, provided by Member States, for three of the countries considered here: Norway, Finland, and Ireland. The most recent of these estimates are shown in Table 2. Note that, in accordance with the EMCDDA definition (see Box 4), the estimate for Norway excludes those stabilised on opioid substitution treatment (OST), estimated at around 7 500 individuals. However, these treated opioid users are part of the at-risk population because treatment reduces, but does not eliminate, DRD risk (Pierce et al., 2015). The contribution of treatment to reducing risk is considered in a later section. Note also that the estimate for Ireland is for an earlier period than the estimates for Norway and Finland, and that there are potentially important differences in the methodology and/or data sources used to derive the estimates. For example, the estimates for Finland, although they use a capture–recapture (CRC) method as in many other countries, do not include a national treatment data source; national experts suggest that, as a result, the estimates may be higher than expected and may include a large number of non-problem opioid users.
0
0.1
0.2
0.3
0.4
0.5
0.6
0.7
0.8
0.9
1
Scotland Sweden Estonia Ireland Denmark Finland Norway
14

For countries where POU estimates are not available, the EMCDDA indicator of problem drug use (PDU) prevalence, defined as ‘injecting drug use or regular and/or long-term use of opioids, cocaine and/or amphetamines’ (EMCDDA, 2013), might provide a suitable proxy, albeit this is imperfect and will apply only in countries where opioid users account for the bulk of problem users. The PDU indicator has recently been superseded by the high-risk drug use (HRDU) indicator, defined as ‘recurrent drug use that is causing actual harms (negative consequences) to the person (including dependence, but also other health, psychological or social problems) or is placing the person at a high probability/risk of suffering such harms’ (EMCDDA, 2013). Definitions of HRDU, in particular, can encompass a far wider group than those specifically at risk of DRD, rendering the indicator potentially unsuitable as a denominator; in Denmark, for instance, HRDU estimates include persistent users of cannabis (4), a group that does not contribute to the size of the at-risk population (EMCDDA, 2016b).
Table 2 also shows the most recent estimates for PDU/HRDU available via EMCDDA for countries without a POU figure and the most recent estimate of PDU published by the Information Services Division Scotland (ISD). Note that the estimate for Denmark includes approximately 11 000 cannabis users. The estimate for Scotland focuses on opioid use (prescribed and non-prescribed) and/or illicit benzodiazepine use. However, national experts in Scotland advise that the PDU estimate is a close proxy for POU because the CRC sampling framework is unlikely to sample problem benzodiazepine users who are not also heroin users.
(4) This was possible before 2013, but is no longer recommended in the current data collection.
Box 4: EMCDDA indicator for the prevalence of problem opioid use Case definition, in order of preference (recall period: last 12 months): Use of opioids, including opioid medicines, weekly or more frequently for at least six months of the past 12 months (alternatively can be measured as 26 days or more in the past 12 months), not according to medical prescription. OR A medical diagnosis according to current DSM (Diagnostic and Statistical Manual of Mental Disorders) or ICD criteria, e.g. ‘harmful use or dependence on opioids or opioid use disorder’ (diagnosed in the past 12 months). OR Any other best proxy of the above that can be collected at the level of the data source. Note: opioid users who are stabilised on OST are, if possible, reported separately. (EMCDDA, 2013)
15
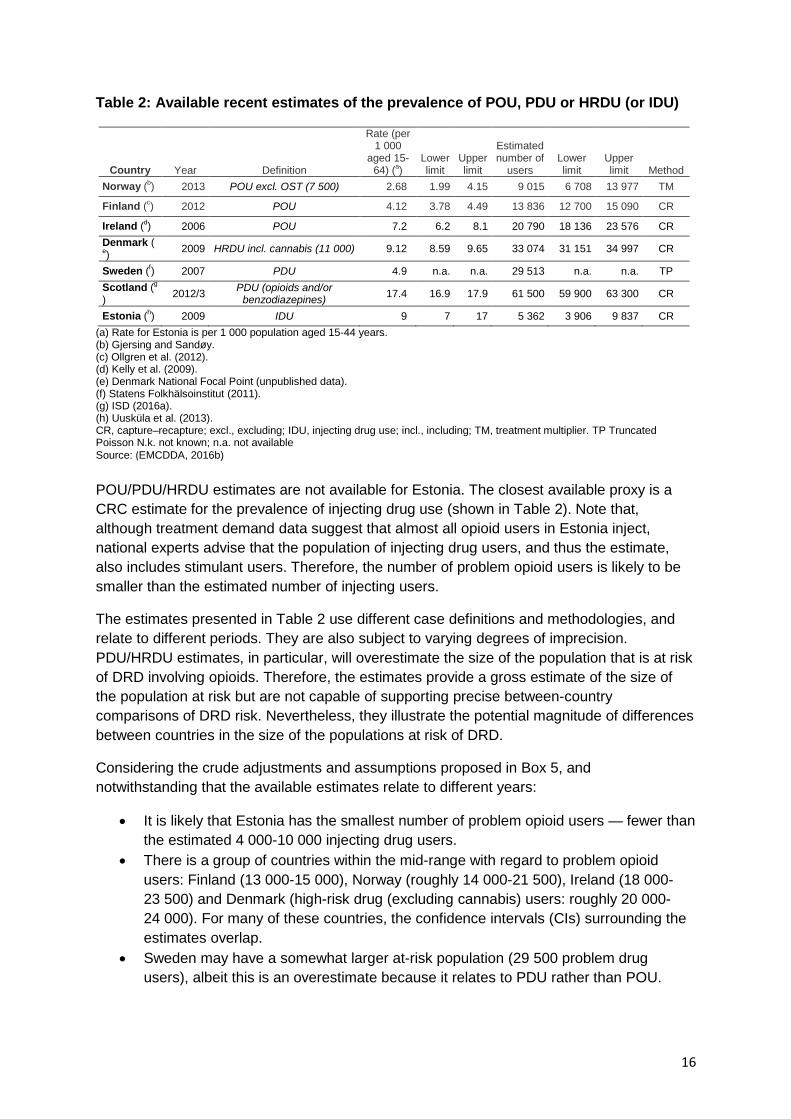
Table 2: Available recent estimates of the prevalence of POU, PDU or HRDU (or IDU)
Country Year Definition
Rate (per 1 000
aged 15-64) (a)
Lower limit
Upper limit
Estimated number of
users Lower limit
Upper limit Method
Norway (b) 2013 POU excl. OST (7 500) 2.68 1.99 4.15 9 015 6 708 13 977 TM
Finland (c) 2012 POU 4.12 3.78 4.49 13 836 12 700 15 090 CR
Ireland (d) 2006 POU 7.2 6.2 8.1 20 790 18 136 23 576 CR Denmark (e) 2009 HRDU incl. cannabis (11 000) 9.12 8.59 9.65 33 074 31 151 34 997 CR
Sweden (f) 2007 PDU 4.9 n.a. n.a. 29 513 n.a. n.a. TP Scotland (g
) 2012/3 PDU (opioids and/or benzodiazepines) 17.4 16.9 17.9 61 500 59 900 63 300 CR
Estonia (h) 2009 IDU 9 7 17 5 362 3 906 9 837 CR (a) Rate for Estonia is per 1 000 population aged 15-44 years. (b) Gjersing and Sandøy. (c) Ollgren et al. (2012). (d) Kelly et al. (2009). (e) Denmark National Focal Point (unpublished data). (f) Statens Folkhälsoinstitut (2011). (g) ISD (2016a). (h) Uusküla et al. (2013). CR, capture–recapture; excl., excluding; IDU, injecting drug use; incl., including; TM, treatment multiplier. TP Truncated Poisson N.k. not known; n.a. not available Source: (EMCDDA, 2016b) POU/PDU/HRDU estimates are not available for Estonia. The closest available proxy is a CRC estimate for the prevalence of injecting drug use (shown in Table 2). Note that, although treatment demand data suggest that almost all opioid users in Estonia inject, national experts advise that the population of injecting drug users, and thus the estimate, also includes stimulant users. Therefore, the number of problem opioid users is likely to be smaller than the estimated number of injecting users.
The estimates presented in Table 2 use different case definitions and methodologies, and relate to different periods. They are also subject to varying degrees of imprecision. PDU/HRDU estimates, in particular, will overestimate the size of the population that is at risk of DRD involving opioids. Therefore, the estimates provide a gross estimate of the size of the population at risk but are not capable of supporting precise between-country comparisons of DRD risk. Nevertheless, they illustrate the potential magnitude of differences between countries in the size of the populations at risk of DRD.
Considering the crude adjustments and assumptions proposed in Box 5, and notwithstanding that the available estimates relate to different years:
• It is likely that Estonia has the smallest number of problem opioid users — fewer than the estimated 4 000-10 000 injecting drug users.
• There is a group of countries within the mid-range with regard to problem opioid users: Finland (13 000-15 000), Norway (roughly 14 000-21 500), Ireland (18 000-23 500) and Denmark (high-risk drug (excluding cannabis) users: roughly 20 000-24 000). For many of these countries, the confidence intervals (CIs) surrounding the estimates overlap.
• Sweden may have a somewhat larger at-risk population (29 500 problem drug users), albeit this is an overestimate because it relates to PDU rather than POU.
16
• The PDU estimate for Scotland (60 000-63 000 users), which is a good proxy for POU, suggests an at-risk population that is perhaps double that for Sweden, around three times as large as for most of the other countries considered and at least six times as large as for Estonia.
4.3: Trends in the size of the population at risk of drug-related death
Section 4.2 illustrates the difficulty of comparing countries with respect to the size of their corresponding at-risk populations. This difficulty becomes more acute when attempting to compare trends over time.
Even if serial prevalence estimates are available, the case definition for these not only differs between countries, but can also change over time within countries. For example, the 2007 estimate for Sweden related to ‘problematic abuse diagnosis according to ICD code (F11-16; F18-19; O35.5; P04.4; T40; T43.6; Z50.3; Z71.5)’, whereas previous estimates related to injecting over the past year or daily use in the past month (Folkhälsomyndigheten, 2014).
Even if the case definition is consistent over time, by their nature, prevalence estimates may not be sufficiently precise to allow a comparison of an estimate at one time point with an estimate at another point in time. For example, for Estonia, serial estimates, for 2004-2009, are available for the prevalence of injecting drug use and these employ a reasonably consistent methodology (Uusküla et al., 2013): however, although the mid-point estimates for these may indicate declining prevalence, if the associated CIs are taken into account the situation may be interpreted as more stable.
Box 5: Improving the comparability of estimates Although the exercise is highly speculative, it may be helpful to consider whether or not it is possible to make, albeit crude, adjustments to or assumptions about some of the estimates presented in Table 2 to improve their comparability:
• Norway: the 2013 POU estimate (9 015, 95 % CI 6 708-13 977) excludes those in OST, estimated to be around 7 500 individuals. Although the national experts advise that an accurate estimate cannot be obtained by combining the two figures, this combination would imply a very rough estimate of the size of the Norwegian at-risk population of somewhere in the region of 14 000 to 21 500 individuals (lower/upper CI for the POU estimate + number in OST).
• Finland: a 2012 POU estimate (13 000 to 15 000) is available. • Ireland: a 2006 POU estimate (18 000 to 23,500) is available. • Denmark: the 2009 HRDU estimate (33 000) includes around 11 000 cannabis users who, as noted above,
do not contribute to the at-risk population. Subtracting these would imply a rough estimate of the Danish at-risk population of around 20 000 to 24 000 individuals, although this rough estimate will still include non-opioid users who meet the Danish HRDU definition, so it remains an overestimate of the denominator for opioid DRDs.
• Sweden: there is insufficient information regarding the 2007 PDU estimate (29 500) to attempt an adjustment; it is likely to overestimate POU prevalence.
• Scotland: national experts advise that the 2012/2013 PDU estimate (60 000 to 63 000) is a very close proxy for POU because the CRC sampling framework is unlikely to sample problem benzodiazepine users who are not also heroin users.
• Estonia: the 2009 estimate shown is for injecting drug use (4 000 to 10 000). Treatment demand data suggest that almost all opioid users in Estonia inject. However, national experts advise that the population of injecting drug users, and thus the estimate, also includes stimulant users. Therefore, the number of problem opioid users is likely to be smaller than the estimated number of injecting users.
17

Moreover, the methods used to derive estimates may change over time. For example, Finland has produced POU estimates for 2005 and 2012 that suggest a substantial increase in prevalence; however, the later estimate is based on a different approach to modelling and incorporates an improved range of CRC sources. National experts have indicated that, although the later estimate may be a more accurate reflection of the size of the at-risk population, it is not comparable with the earlier estimate (and may not be comparable with the estimates for other countries).
Although it is correct that countries should improve the specificity of case definition and the methods used to derive estimates, our conclusion is that, for the countries considered here, it is not possible to make meaningful comparisons between the trends in the size of the at-risk population and the trends in the number of DRDs recorded.
4.4: Number of deaths involving opioids
Figure 3 shows, for 2013, the number of recorded deaths with known toxicology in each country where opioids were present. Scotland stands out as a country with a similar population size to countries such as Denmark, Finland and Norway, but a much greater number of opioid-related deaths; however, this should be considered in the context of the size of the population at risk of DRD, as highlighted in previous sections.
Box 6: Cohort studies Cohort studies, which examine DRDs among groups of drug users of known size and with known characteristics, were proposed as an alternative approach to understanding differences in DRD risk between countries and over time. Twenty-three potential studies relating to drug user mortality in the countries/regions considered in this report were identified based on a non-systematic search of available databases and bibliographic searches of the published literature (Merrall et al., 2012; Merrall et al., 2013; Copeland et al., 2012; Bloor et al., 2008; Bird, 2010; Cornish et al., 2010; Macleod et al., 2010; McCowan et al., 2009; McKeganey et al., 2008; Kimber et al., 2010; Neufeind et al., 2011; Clausen et al., 2008; Clausen et al., 2009; Ødegård et al., 2007; Ravndal et al., 2010; Davstad et al., 2011; Nyhlén et al., 2011; Stenbacka et al., 2010; Fugelstad et al., 1997; Onyeka et al., 2014; Arendt et al., 2011; Lynn et al., 2009, Lyons et al ., 2010). These were screened according to the following criteria (studies excluded at each level did not progress to screening at further levels):
1. the study reports findings for one of the countries/regions of interest; 2. the study reports a DRD crude mortality rate (CMR) — 16 were excluded on this basis; 3. the cohort recruitment and observation at least overlaps with the period of interest (to avoid excessive
confounding because of epoch); 4. the study employs a clear case definition comprising active drug users during the period of observation (to
avoid ‘dilution’ of risk in historically recruited cohorts that include no-longer-active drug users) — an additional three were excluded on this basis;
5. the study specifies the type of drug use among the cohort (because, for example, we should not compare DRD risk in a cohort of cannabis users with risk in a cohort of heroin users).
The remaining four studies related to Scotland and to Norway. Within-country cohorts were the same or overlapping, hence one study from each country was selected for consideration (Merrall et al. (2012) and Clausen et al. (2008), respectively). Both studies recruited from treatment settings (Scotland, 1996-2006; Norway, 1997-2003), but, in contrast to the Scotland study, the Norway study included a subset of persons who did not actually enter treatment (not included here). The Scotland study reported a DRD rate (during- and post-treatment rates combined) for opiate users of 4.4 (95 % CI 4.1-4.6) per 1 000 person years; information is not available on the number of DRDs or the duration of observation for treatment and non-treatment periods. The Norway study reported a during-treatment rate of 4 (95 % CI 0-8) and a post-treatment rate of 21 (95 % CI 17-25) per 1 000 person-years, equivalent to a (derived) rate of around 6.7 per 1 000 person-years for treatment and post-treatment periods combined.
18
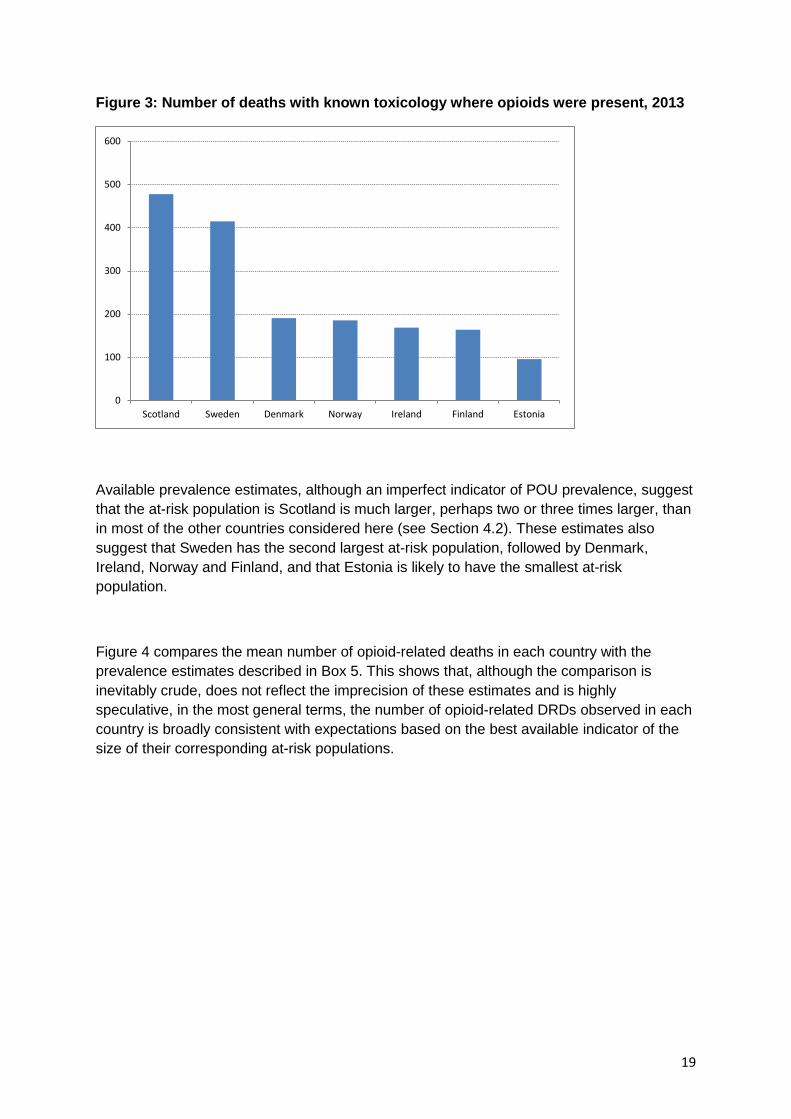
Figure 3: Number of deaths with known toxicology where opioids were present, 2013
Available prevalence estimates, although an imperfect indicator of POU prevalence, suggest that the at-risk population is Scotland is much larger, perhaps two or three times larger, than in most of the other countries considered here (see Section 4.2). These estimates also suggest that Sweden has the second largest at-risk population, followed by Denmark, Ireland, Norway and Finland, and that Estonia is likely to have the smallest at-risk population.
Figure 4 compares the mean number of opioid-related deaths in each country with the prevalence estimates described in Box 5. This shows that, although the comparison is inevitably crude, does not reflect the imprecision of these estimates and is highly speculative, in the most general terms, the number of opioid-related DRDs observed in each country is broadly consistent with expectations based on the best available indicator of the size of their corresponding at-risk populations.
0
100
200
300
400
500
600
Scotland Sweden Denmark Norway Ireland Finland Estonia
19

Figure 4: Mean annual number of opioid-related deaths (2009-2013) vs. best available estimates of problem opioid users (or a proxy thereof)
4.5: Trends in deaths involving opioids
Figure 5 shows the trend from 2004 to 2014 in the number of deaths involving opioids that were recorded in each country. Again, these are based on the EMCDDA Selection B criterion (derived from a GMR), except for Ireland which is based on Selection D (derived from an SMR).
Figure 5: Trends in the number of DRDs involving opioids, 2004-2014
0
50
100
150
200
250
300
350
400
450
500
550
0 10000 20000 30000 40000 50000 60000 70000
Mea
n n
deat
hs
Prevalence
Estonia Finland
Norway
Ireland
Denmark
Sweden
Scotland
0
100
200
300
400
500
600
Denmark
Estonia
Finland
Ireland
Norway
Scotland
Sweden
20

In many of the countries considered (Denmark, Finland, Ireland, Norway, Scotland and Sweden), there was an increase in the number of DRDs involving opioids during the early part of the time series, until around 2008/2009. An interruption in this trend is apparent for several countries around 2010, the period of the European ‘heroin drought’ observed in some countries (Ahmad and Richardson, 2016; EMCDDA, 2011b), with a return to the pre-2010 level thereafter; only in Sweden was there a clear and sustained increase after 2008/2009 in the annual number of recorded DRDs involving opioids.
The ‘heroin drought’ is an example of an environmental factor that may affect both the number of users actively ‘at risk’, if decreased availability results in some individuals using less often or not at all, and the degree of risk involved, if fluctuations in availability result in variable purity, as purity is moderately associated with the occurrence of DRDs (Darke et al., 1999). Estimates of global opium production, from the United Nations Office on Drugs and Crime (UNODC, 2015), suggest a relatively short period of reduced production, starting around 2009/2010. It is not clear why this might have had a more sustained effect on DRDs. However, it is plausible that periods of low production might have longer term impacts on availability and, also, that changes in users’ behaviour during periods of restricted supply might have an impact on their DRD risk; for example, they may access treatment and remain in treatment thereafter. It is notable that some countries, e.g. the United Kingdom (ONS, 2016; National records of Scotland, 2016), have seen a more recent return to the increasing DRD trend that preceded the European ‘heroin drought’. Data on purity were available for some of the countries considered here and are presented in the country profiles in Appendix.
In Finland, Ireland and Scotland, the most recent available EMCDDA figures (up to 2014) indicate only a very slight (around 5 %) increase from 2008/2009 levels, and in Denmark and Norway the figures suggest that in recent years there have fewer deaths than during 2008/2009. A full time series is not available for Estonia but, despite increases in 2011 and 2012, the number of deaths recorded during 2014 was similar to that recorded in 2010.
Thus, for most of the countries considered here, for the period for which EMCDDA data are available, despite an earlier increase (between 2004 and 2008/2009), there has been no apparent increase in DRDs involving opioids in recent years. However, Sweden is an exception here, although it is likely that the apparent increase in recorded deaths in this country is, in part, a consequence of changes in the method of recording DRDs (see Section 3). The most recent data for Scotland (i.e. for 2015) suggest that the number of deaths has been increasing again, substantially, each year since 2013.
As noted above (Section 4.3), it has not been possible, on the basis of available data, to place the trend in the number of opioid DRDs in the context of the trend in the size of the at-risk population.
21

5.0: Country comparisons — risk factors for drug-related deaths
There is insufficient precise information available to enable a comparison of DRD risk between countries or to establish whether or not observed risk has changed over time. However, the project has explored a series of factors that may, plausibly, influence risk, in order to determine whether or not there might be evidence that countries differ with respect to these factors and whether or not these vary over time. The set of risk factors considered here is not exhaustive, but reflects those drivers that might be assessed on the basis of available information published by the EMCDDA. There are, of course, additional factors that could not be assessed here and that may contribute to differences in the level of risk in different countries, for example the prevalence of comorbidity in the at-risk population or the influence of prison release, and different responses to these factors. The time after release from prison is known to be a period of high DRD risk (Farrell and Marsden, 2008; Merrall et al., 2010). Although it has been suggested that this factor is not sufficient to explain between-country differences in mortality levels (Waal and Gossop, 2014), countries may differ with regard to interventions designed to reduce risk during this period; however, there is no systematically collected dataset that would inform a comparison of this.
5.1: Treatment factors
Treatment might potentially influence risk via two primary dimensions. First, differences in the pattern of treatment might increase risk: for example, more and briefer treatment episodes may increase treatment transitions, which elevate risk (Pierce et al., 2016), or an emphasis on abstinence-focused treatment might increase the number of individuals exposed to elevated risk on relapse. Second, insofar as being in OST is associated with a reduction in individual risk, the extent to which treatment services ‘capture’ the at-risk population is likely to influence the degree of risk in that population (White et al., 2015). There are no standard indicators available to assess the first of these factors, but the second may be explored, to some extent, via EMCDDA figures describing the number of persons in OST in each country, or estimates thereof (EMCDDA, 2014 (for Scotland); EMCDDA, 2016b). These are also discussed in the country profiles provided in Appendix. Differences in the pattern and introduction of OST in the Nordic countries have been described elsewhere (Skretting and Rosenqvist, 2010).
In most of the countries considered here, there has been a general increase in the number of persons engaged in OST. Denmark and Estonia, where the numbers are relatively stable throughout most of the time series, are exceptions. Data for only two time points (2006 and 2007) could be located for Scotland. However, the implications of the increasing trend are difficult to interpret in the absence of information about trends in the size of the POU population. If the latter is stable or has decreased, an increase in OST numbers would imply a possible reduction in population-level risk among problem opioid users. If POU prevalence has increased, then it is not possible to determine whether or not the increasing trend for OST has kept pace. In some cases, local intelligence suggests that very good OST coverage has been achieved (see, for example, Appendix A.5, Norway summary); however, it has not been possible to make systematic comparisons between countries. The EMCDDA
22

publishes data on OST coverage for just one of the countries considered here: Norway (EMCDDA, 2016b).
Figure 6 shows the number of persons in OST in each country during 2007, the most recent year for which figures are available for all of the countries considered (note that more recent data are available for most countries and that these indicate an increase in the numbers in OST, e.g. in Norway). The number of people in OST appears to be only weakly related to the estimates of the size of the at-risk population, discussed in Section 4.2, which might imply that differences in OST coverage may result in higher levels of population risk in some countries than in others. It is not possible to draw firm conclusions in this regard because of variability in the definitions on which prevalence estimates are based and because different periods are considered. A further difficulty here is that available data are not sufficient to determine the extent to which the OST population is representative of those subgroups within the wider at-risk population, which may be at greater or lesser risk. It should also be considered that in countries where OST covers a higher than average proportion of problem opioid users, there may still be a larger than average number of ‘out-of-OST’ problem opioid users and thus a larger number of ‘at-higher-risk’ problem opioid users.
Figure 6: Number of persons in OST in each country during 2007
5.2: Harm reduction
Across all of the featured countries, a number of effective harm-reduction interventions have been mainstreamed within routine practice over the past 30 years (Table 3). For example, needle and syringe provision (NSP) or injecting equipment provision (IEP) is now well established within all countries. The extent of NSP/IEP coverage in each country is less clear, however, with only crude estimates available regarding how many syringes are accessed by people who inject drugs (PWID) each year.
0
5000
10000
15000
20000
25000
Scotland Ireland Denmark Norway Sweden Finland Estonia
23

Treatment via OST is also widespread and known to reduce the risk of death among PWID (Degenhardt et al., 2011; Pierce et al., 2016). Methadone-based OST is available in every country to varying degrees, accounting for almost all OST prescriptions in Estonia and Ireland. In contrast, countries such as Norway, Denmark and Sweden no longer recommend methadone as a first choice OST option and have policies in place aimed at increasing use of buprenorphine- or buprenorphine-/naloxone-based medicines.
Other harm-reduction approaches have been proposed and adopted in some countries, in particular supervised injecting facilities (SIFs) and heroin assisted treatment (HAT). Although it is difficult to quantify their overall impact, there is evidence to suggest that SIFs are associated with reductions in overdose-related mortality (Marshall et al., 2011). Far from being mainstreamed, there are examples of SIFs in many European countries including Denmark and Norway (EMCDDA, 2016c). There are no such facilities in the United Kingdom or Ireland; however, formal proposals are now in place to open such venues in Dublin (Ireland) and Glasgow (Scotland). The adoption of HAT is less common and is available in only one of the seven included countries (Denmark). The number of patients engaged with the five HAT clinics in Denmark is limited each year by funding, but had risen to 300 by 2013. The overall effectiveness of HAT, at a population level, is unclear; however, there are currently clinical trials under way that aim to determine its benefits in reducing drug-related harm, including overdose (EMCDDA, 2012a).
Table 3: Availability of harm-reduction interventions
Country
Met
hado
ne
mai
nten
ance
tr
eatm
ent
Bup
reno
rphi
ne
trea
tmen
t
Bup
reno
rphi
ne/
nalo
xone
Nee
dle
and
syrin
ge
exch
ange
Supe
rvis
ed
inje
ctin
g fa
cilit
ies
Her
oin
assi
sted
tr
eatm
ent
Take
-hom
e na
loxo
ne
Denmark ✓ ✓ × ✓ ✓ ✓ ✓
Estonia ✓ ✓ × ✓ × × ✓
Finland ✓ ✓ ✓ ✓ × × ×
Ireland ✓ × ✓ ✓ × × ✓
Norway ✓ ✓ ✓ ✓ ✓ × ✓
Scotland ✓ ✓ ✓ ✓ × × ✓
Sweden ✓ ✓ ✓ ✓ × × ×
See country profiles in Appendix for more details
Lastly, there was good evidence available from the majority of the seven countries about their implementation of take-home naloxone (THN). With the exception of Finland, all featured countries provide THN at some level, ranging from large programmes with national coverage (e.g. Scotland, Norway) to small-scale experimental pilot programmes which are very much in their infancy (e.g. Ireland). Bird et al. estimate that national THN schemes should aim to issue at least nine times as many THN kits as there are opioid-related deaths per annum, and that the optimum level is 20 times as many (Bird et al., 2015a). Scotland’s
24
national programme achieved its minimum threshold of 3 600 per annum in its second year (2012/2013) and its optimum level by year five (2015/2016). Since its inception in 2011, the national naloxone programme in Scotland has now distributed almost 30 000 THN kits, which have been associated with a 36 % reduction in opioid-related deaths in the four weeks following prison release (Bird et al., 2016).
The impact of THN on DRD numbers and trends in the other countries studied in this project is unclear thus far, but is likely to be modest given the small number of kits distributed. Estonia has come closest to achieving its minimum threshold of approximately 850 kits per annum. In addition, Norway is on course to supply its own minimum threshold of 1 800 per annum, having supplied over 2 000 kits in the first 18 months of its national programme, which commenced in spring 2014.
5.3: Behavioural factors
The extent of risky behaviour among at-risk populations is another factor that influences differences in population-level DRD risk. Injecting is a known behavioural risk (Gossop et al., 2002; Pierce et al. 2016), as are polysubstance use (Darke and Zador, 1996; Pierce et al., 2016) and the use of specific opioids such as fentanyl (Mounteney et al., 2015). Experience of a prior non-fatal overdose is also likely to elevate risk of DRD (Caudarella et al., 2016).
The EMCDDA treatment demand indicator potentially provides a source of information about differences in risk behaviour with respect to injecting and provides some information regarding trends in the use of different classes of opioid (heroin vs. methadone vs. other opioid drugs). Information about the extent to which DRDs involve polysubstance use are also available, but for a more limited number of countries, and long-term trend data not being available.
Injecting
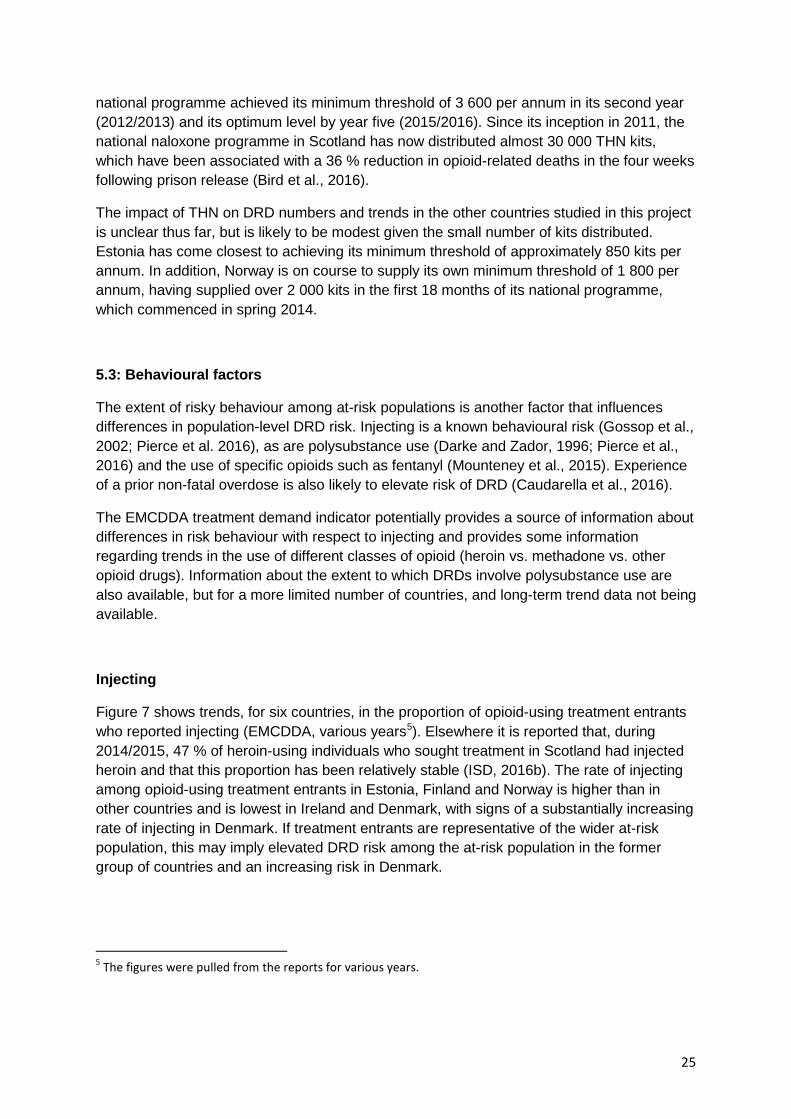
Figure 7 shows trends, for six countries, in the proportion of opioid-using treatment entrants who reported injecting (EMCDDA, various years5). Elsewhere it is reported that, during 2014/2015, 47 % of heroin-using individuals who sought treatment in Scotland had injected heroin and that this proportion has been relatively stable (ISD, 2016b). The rate of injecting among opioid-using treatment entrants in Estonia, Finland and Norway is higher than in other countries and is lowest in Ireland and Denmark, with signs of a substantially increasing rate of injecting in Denmark. If treatment entrants are representative of the wider at-risk population, this may imply elevated DRD risk among the at-risk population in the former group of countries and an increasing risk in Denmark.
5 The figures were pulled from the reports for various years.
25
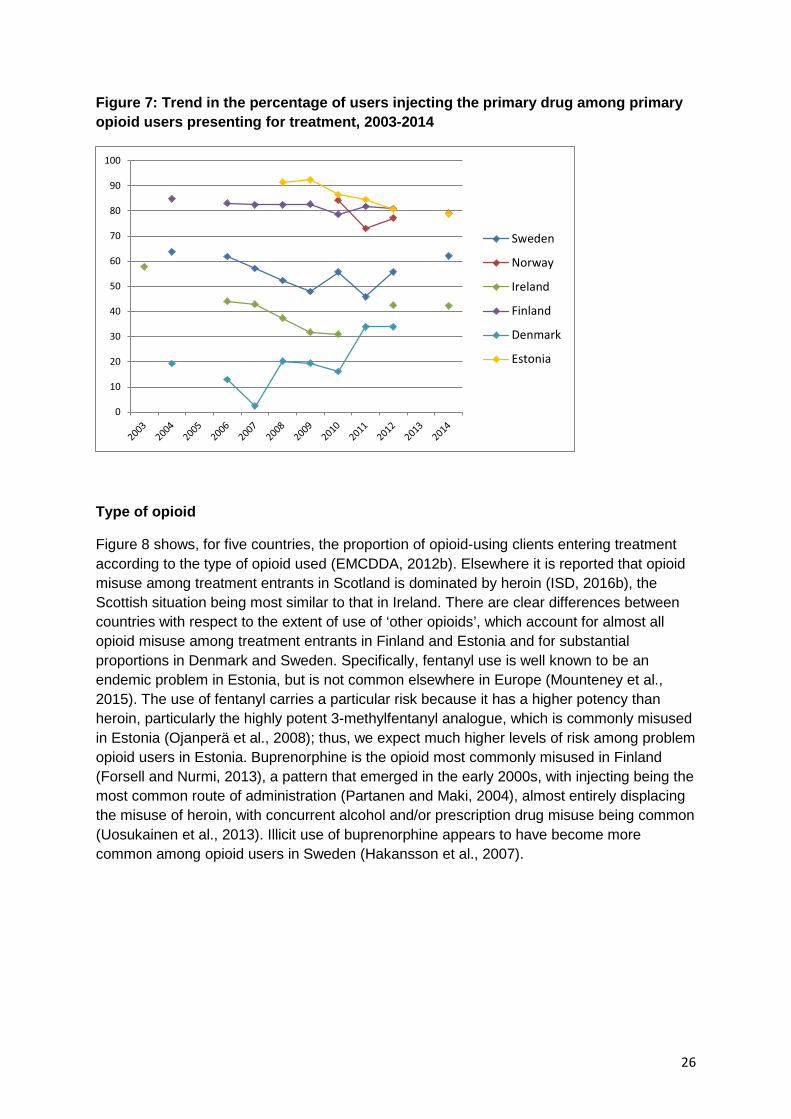
Figure 7: Trend in the percentage of users injecting the primary drug among primary opioid users presenting for treatment, 2003-2014
Type of opioid
Figure 8 shows, for five countries, the proportion of opioid-using clients entering treatment according to the type of opioid used (EMCDDA, 2012b). Elsewhere it is reported that opioid misuse among treatment entrants in Scotland is dominated by heroin (ISD, 2016b), the Scottish situation being most similar to that in Ireland. There are clear differences between countries with respect to the extent of use of ‘other opioids’, which account for almost all opioid misuse among treatment entrants in Finland and Estonia and for substantial proportions in Denmark and Sweden. Specifically, fentanyl use is well known to be an endemic problem in Estonia, but is not common elsewhere in Europe (Mounteney et al., 2015). The use of fentanyl carries a particular risk because it has a higher potency than heroin, particularly the highly potent 3-methylfentanyl analogue, which is commonly misused in Estonia (Ojanperä et al., 2008); thus, we expect much higher levels of risk among problem opioid users in Estonia. Buprenorphine is the opioid most commonly misused in Finland (Forsell and Nurmi, 2013), a pattern that emerged in the early 2000s, with injecting being the most common route of administration (Partanen and Maki, 2004), almost entirely displacing the misuse of heroin, with concurrent alcohol and/or prescription drug misuse being common (Uosukainen et al., 2013). Illicit use of buprenorphine appears to have become more common among opioid users in Sweden (Hakansson et al., 2007).
0
10
20
30
40
50
60
70
80
90
100
Sweden
Norway
Ireland
Finland
Denmark
Estonia
26

Figure 8: Proportion of clients entering treatment for opioids by country and type of opioid misused, 2010
Toxicology data, where available, may be informative for understanding differences in the types of opioid use involved in DRDs. For example, the most recently available data from analysis of countries’ DRD 2015 statistical returns to the EMCDDA highlights that the majority (60 %) of opioid DRDs in Denmark involve methadone and a minority (34 %) involve heroin, whereas in Norway methadone and heroin were each involved in around one third of opioid DRDs and in Ireland each was involved in around a half. Data provided by Scotland indicate a similar pattern to that in Ireland, albeit with a slightly smaller proportion of opioid DRDs involving methadone and a slightly larger proportion involving heroin. Elsewhere, it is reported that DRDs in Denmark and Sweden primarily involve methadone (this is in contrast to the patterns of use reported among treatment entrants); in Norway most DRDs involve heroin; and in Finland most involve buprenorphine (Gjersing et al., 2013; Simonsen et al., 2015), although more recent analysis suggests more buprenorphine-related than methadone-related deaths in Sweden (Leifman, 2016). Based on a series of studies of DRDs that include the Nordic countries considered here (Denmark, Finland, Norway and Sweden), published between 1984 and 2015, Simonsen et al. (2015) concluded that methadone, buprenorphine, fentanyl and tramadol have, to a large extent, replaced heroin. Fentanyl or 3-methylfentanyl is involved in the majority of DRDs in Estonia, having displaced poppy straw from around 2002 (Tuusov et al., 2013).
Polysubstance use
Toxicology data may also be informative in respect of DRDs involving polysubstance use (drugs and/or alcohol), which is known to elevate DRD risk. The most recently available data from the EMCDDA suggest that the proportion of opioid DRDs involving other (non-opioid) substances was as follows: 30 % in Norway; 56 % in Denmark; 65 % in Ireland; and 92 % in Scotland. However, elsewhere it is reported that almost all DRDs in Norway involve polydrug intoxication (Gjersing et al., 2013). In Finland, it has been observed that one third of DRDs involving buprenorphine misuse also involve alcohol (Häkkinen et al., 2014a) and there is
0.00
0.10
0.20
0.30
0.40
0.50
0.60
0.70
0.80
0.90
1.00
Finland Estonia Denmark Sweden Ireland
Heroin
Methadone
Other opioids
27

also evidence of the involvement of concurrent use of opioids, particularly buprenorphine, with pregabalin (Häkkinen et al., 2014b). National experts in Finland suggest that 80 % of DRDs involve multiple drugs, with few attributed to poisoning as a result of consumption of a single drug, and that there has been little change in the trend of polydrug involvement in DRDs over time (see Appendix A.3). Polydrug use is common among at-risk drug users in Sweden (Leifman, 2015) and multiple drugs are often found in poisoning-related deaths (Fugelstad et al., 2010). The CAN analysis (Leifman, 2016; see Box 3) indicates that combined use with benzodiazepines may have contributed to the increase in opioid DRDs.
5.4: Demographic factors
Cohort studies suggest that opioid users’ risk of DRD increases with increasing age (Pierce et al., 2015), perhaps more markedly for deaths also involving alcohol (McAuley and Best, 2012) or methadone (Gao et al., 2016). There may also be synergistic effects of age and hepatitis C virus (HCV) infection (Merrall et al., 2012). Thus, although the number of older users in the POU population may dwindle because of death or recovery, a population of older problem opioid users is likely to have a higher risk of DRD than a younger population.
Figure 9: Trend in mean age at DRD (all DRDs)
Figure 9 shows the trend in mean age at DRD in the featured countries; for Scotland, the mean age was not available and the median is substituted here (NRS, 2016). Data specific to opioid DRDs are not available, but the data are dominated by such deaths. Although non-opioid DRDs are a minority, if these occur primarily among relatively young drug users then the age trend for opioid DRDs may be more pronounced than Figure 9 suggests.
In recent years, in most countries the average age at DRD is around 40 years. In Ireland, it is slightly younger and in Estonia younger still. Denmark shows the oldest average age for DRD, at around 48 years.
0
5
10
15
20
25
30
35
40
45
50
Sweden
Norway
Ireland
Finland
Denmark
Estonia
Scotland (median)
28
In several countries (Denmark, Norway, Scotland, Ireland and Estonia) the average age at DRD appears to have increased, which is supported by analysis of age by era shown in the country-specific reports (Appendices A.1-A.7). This is consistent with the existence of an ageing population of problem opioid users. Although the Selection B (GMR) data for Finland shown here do not show any trend for an increasing mean age at death, the Finnish Special Registry indicates that the mean age of DRD is rising in line with other European countries. The national experts for Finland suggest that the differences here are likely to be explained by the GMR’s inclusion of older adult deaths coded as ‘drug poisoning’ but with no history of drug misuse. Note that ‘mean age’ may disguise important differences in the age distribution of at-risk drug users; for example, Swedish experts suggest that their at-risk population exhibits a bimodal distribution, comprising younger and older users but with few in the intermediate age groups.
It would be informative to consider information about age at DRD in the context of wider indicators of the age of the POU population. EMCDDA treatment demand data were considered as a possible information source here, but routinely published data do not distinguish between the age of POU and non-POU. However, an earlier study of EMCDDA treatment demand data (Barrio et al., 2013) provides information for three countries, on trends (from 2000 to 2009) in the age of heroin users seeking treatment, that is highly consistent with the information presented in Figure 9. Mean age increased in both Denmark and Ireland over this period, but was more stable in Sweden. On average, users in Denmark were older and users in Ireland were younger.
5.5: Prevalence of blood-borne viruses
Table 4: Prevalence of blood-borne virus infection among people who inject drugs (2010-2016)
Country HCV HBV HIV
Denmark 75 % 35 % < 5 %
Estonia 76-90 % 3-22 % ~50 %
Finland 74 % 1.2 % —
Ireland 68 % — —
Norway 64 % 35 % (Oslo)
2.4 %
Scotland 58 % — 1.9 %
Sweden 60-80 % — — See country profiles in Appendix for more details
29
Blood-borne virus (BBV) infections, in particular HCV infection, are highly prevalent among opioid users, and injecting is the main route of transmission (Giraudon, 2016b). An increase in the prevalence of BBV infections in the at-risk population may, therefore, be a factor in countries with high or increasing DRD rates. Having an HCV diagnosis is associated with an increased risk of DRD among PWID (Merrall et al., 2012; Vajdic et al., 2015) and drug-related mortality is a major contributor to the overall excess mortality in HCV patients achieving sustained viral response post treatment (Innes et al., 2016). High rates of death have also been reported among PWID who were positive for human immunodeficiency virus (HIV) (Green et al., 2012; Mathers et al., 2013). Therefore, it is plausible that more BBV infections in a population at risk could signify more comorbidity in that population and a higher risk of DRD.
Overall, prevalence of HCV infection among PWID across the seven countries ranged from 60-90 %. The lowest rates were reported in Scotland (58 %) and potentially higher rates were reported in Estonia and Sweden (80-90 %). It is notable that Estonia has a very high HIV prevalence, although this is decreasing. Comparability of BBV prevalence estimates between countries should be made cautiously, though, given the variation in methodologies used to collect such data. For example, infectious diseases related to drug use are likely to be underdiagnosed in Denmark, since a large proportion of PWID are not regularly tested. Moreover, the most recent HCV and HIV prevalence estimates from Norway are based on testing carried out within an OST service and are therefore likely to underestimate levels of infection within the wider population of opioid users.
30

6.0: Findings, conclusions and recommendations
6.1: Summary of findings
In many of the seven countries, there was an increase in the number of DRDs, specifically opioid DRDs, between 2004 and 2008/2009. There was an interruption to this increasing trend in most countries during 2010, the period of the European ‘heroin drought’ (EMCDDA, 2011b; Ahmad and Richardson, 2016), with little sign of an increase in DRDs thereafter. However, there are signs of a more recent increase in DRDs, in some countries, after the period considered here. Only in Sweden are there clear signs of an increase in the number of recorded DRDs throughout the period considered and after 2010. The trend for Sweden has been exaggerated by changes in recording practice and toxicology screening, and the Swedish baseline has been underestimated by the exclusion of DXP (see Box 3); however, despite this, Swedish national experts conclude that there was an underlying increasing trend, albeit of lesser magnitude (Leifman, 2016).
In the absence of information to support accurate comparisons of risk, Section 5 considered a range of factors that may influence risk. These are not exhaustive, being limited to those that are reasonably accessible via data published by the EMCDDA. They relate to the availability of treatment and harm-reduction interventions; risk associated with drug use behaviour; risk associated with key demographic factors (age); and the prevalence of BBVs. Here, the clearest differences in risk relate to demographic (age) and behavioural (opioid type and injecting) risk.
• Treatment: there is some evidence of variations between countries with respect to treatment coverage, insofar as the number of people engaged in OST is only weakly related to a ‘best approximation’ of the number of problem opioid users in each country. In the absence of trend data on the size of the POU at-risk population, it is not possible to assess the potential effect that changes in the size of the OST group exert on DRD trends. Moreover, there is a lack of information on the delivery of treatment, dimensions of which are likely to modify a treatment’s protective effect with regard to DRD; for example, brief-duration OST will provide less of a protective effect than prolonged OST.
• Harm reduction: most of the countries considered here provide core harm-reduction interventions, including THN. For these countries, there is insufficient evidence to conclude that variations in the availability of harm-reduction interventions exert an impact on differences in DRD risk.
• Drug use behaviour: there is reasonably strong evidence of between-country differences in drug use behaviour that are likely to contribute to differences in DRD risk. These include variations in the rate of injecting among known populations of opioid users and the use of different opioid types. There is weaker, and in some cases contradictory, evidence of between-country variation in the involvement of polydrug use (that includes opioids) in DRD.
• Demographic risk: age is a known risk factor for DRD. For many of the countries considered here, there is evidence of an increase in the age at DRD among opioid DRD decedents and more limited evidence (derived from treatment settings) that the POU population in some countries is ageing. In addition, there is evidence of
31
between-country differences in the age at DRD among opioid DRD decedents that is consistent with differences observed via the treatment indicator. This suggests both that age-related risk is increasing in some countries and that there are between-country differences in age-related risk.
• Prevalence of BBVs: there is some evidence of differences between countries in rates of BBV infection, which may elevate DRD risk. However, comparisons should be made with caution, given variation in the methods used to assess infection rates.
Section 3 discussed the possible influence of the mechanisms that countries use to identify and record DRDs. Clearly, if recording is substantially incomplete, then the number of DRDs recorded by published statistics will be an underestimate. In addition, changes over time in the way that DRDs are recorded may exaggerate any underlying upwards or downwards trends in the number of DRDs that actually occur. All of the countries considered here have sophisticated counting systems for DRD, for which local experts regard case capture to be reasonably complete. However, experts in Sweden have demonstrated the discernible effect that even subtle changes to their national recording system may have had in exaggerating the underlying increase in the number of DRDs.
6.2: Conclusions
Available data do not support precise comparison of DRD rates, and thereby DRD risk, between the seven countries, or of trends in DRD rates. Thus, although the number of DRDs is broadly proportional to the likely number of at-risk individuals, it is not possible to conclude with any certainty whether or not the number of DRDs in some countries is larger than would be expected, taking into account the size of their at-risk populations. In addition, it is not possible to determine whether changes in the number of opioid DRDs are driven by increased POU prevalence or by changes in DRD risk among problem opioid users. It should be noted that, if POU prevalence is declining, then even a stable opioid DRD trend may reflect increasing risk; this scenario is plausible where there is an ageing, dwindling, population of problem opioid users.
It is likely that several of the risk factors considered here have driven trends in DRDs, and that they may explain differences between countries’ DRD rates, if such differences exist. However, it is unlikely to be possible to identify a single, primary explanatory factor. It should be recognised that (1) there may be complex interactions between drivers; and (2) upwards and downwards drivers will operate simultaneously. Thus, downwards drivers, such as improving the coverage of OST or the availability of THN, will operate at the same time as upwards drivers, such as increasing age in the POU population (Pierce et al., 2015). The effect of upwards drivers of risk may be magnified by synergistic interactions between, for example, age and alcohol use (McAuley and Best, 2012), methadone consumption (Gao et al., 2016) or HCV infection (Merrall et al., 2012).
In the light of the above observations, given the absence of counterfactual evidence, even where the number of DRDs is increasing, it should not be assumed that interventions designed to reduce DRDs have not been successful. Indeed, it is likely that the situation would be significantly worse without such interventions.
32
6.3: Recommendations
Most DRDs involve opioids and opioids have driven the trend in DRDs in the countries considered. Increasing age among problem opioid users may be one important driver of increasing risk in this population, but it is not possible, based on the EMCDDA DRD indicator, to distinguish between opioid- and non-opioid-related deaths with respect to decedents’ age (or gender).
Recommendation: additional specificity regarding the age of opioid versus non-opioid DRDs would aid interpretation of DRD trends. In addition, further analysis of the other EMCDDA indicators about the wider population of opioid and non-opioid users would be helpful, such as the age of those opioid users who seek treatment. The availability of these data should now allow this analysis (6).
As explored in Section 2, the overarching question in comparing DRDs between countries or over time is whether or not the observed risk of DRD is different in different countries and whether or not that risk has changed. This requires both accurate knowledge about the number of DRDs that occur and knowledge about the size of the drug user population that is at risk, in order to estimate DRD rates. Alternatively, comparison might be on the basis of evidence derived from studies of DRD, and thus DRD rates, observed within drug user cohorts of known size.
Recommendation: the rate of DRD per capita of the general population, although a helpful indicator of the population burden from DRDs, is not an adequate basis for comparisons of DRD risk among problem opioid users in different countries, or over time, because of underlying differences in POU prevalence rates and should not be used as such (see Boxes 2 and 5).
As shown in Section 4, estimates of the size of the at-risk population are lacking and/or imprecise and there is no suitable evidence on which to base an assessment of changes in DRD risk over time. The EMCDDA currently (2016) publishes POU (now high-risk opioid user (HROU)) prevalence estimates for the majority of Member States, but these were available for only three of the seven countries considered in this work (and one of these estimates relates to a decade ago). In view of the interest in DRDs in these countries and the preponderance of opioid involvement in these deaths, the remaining countries should consider whether or not it is feasible for them to generate POU prevalence estimates. Countries that have produced POU estimates have, most commonly, based these on the CRC method, and recent work to account for bias in the application of this method has shown promising results (Jones et al., 2016). However, countries are not always consistent in the data sources used to support this approach; lack of consistency may have implications for the comparability of the estimates obtained. Countries’ capacities to apply CRC may be constrained by the availability of suitable data sources or the feasibility of case-linking these, in which case it may be necessary to employ other approaches, which may introduce further
(6) For instance, see the Statistical Bulletin available from http://www.emcdda.europa.eu/data/stats2016 (Treatment demand > Current situation > Age of treatment > Never previously treated > Heroin).
33
problems of comparability. The use of mortality data (i.e. overdose-related mortality rate in a cohort) as a basis for prevalence estimation, or the mortality multiplier estimation method, is inadvisable in the context of providing a denominator for DRDs. The DRD rate thus calculated would be the same as the overdose death rate of the cohort study. It is important to note that prevalence estimates will be subject to a degree of uncertainty and that where estimates are imprecise there may be difficulties in discerning differences between countries or over time.
Recommendation: comparisons of the number of (opioid) DRDs should be considered in the context of estimates of POU prevalence. Countries that do not already do so should be encouraged to investigate the scope to produce such estimates, although their capacity to do so may be constrained by the availability of supporting data, national privacy regulations, etc.
Cohort studies may provide an alternative, and potentially more precise, approach to comparing DRDs. However, only a very limited number of cohort studies that would provide a suitable basis for comparison among the seven countries is available. Researchers in several Member States, and elsewhere, have undertaken cohort studies of mortality that consider the rate of DRD in known drug user/POU cohorts (recent examples of European work include Clausen et al., 2009; Clausen et al., 2008; Merrall et al., 2012; Merrall et al., 2013; Pierce et al., 2015; Pierce et al., 2016). The EMCDDA recommends that this approach should be a key component of understanding DRD and publishes guidelines for undertaking such work (EMCDDA, 2012c). Cohort studies can enable more precise analysis of DRD rates than may be achieved via comparison of population-level DRDs and prevalence estimates, because of the lack of precision in the latter. Most such studies have employed a case-linkage (otherwise referred to as a cross-registry) method, whereby cases present in both a known drug user cohort and official mortality records are linked. Thus, if the linkage is accurate, the number and rate of DRDs in the cohort can be enumerated and, if the cohort is representative, this provides an indication of DRD rates in the wider drug-using population. This approach has the advantage of being highly cost-effective and, if suitable cohorts are available, enables the assessment of mortality in large numbers of drug users. However, there can be difficulties in comparing the results of such studies. Many studies have considered mortality among treated drug users, often with the aim of comparing changes in DRD risk associated with treatment. However, there may be differences in DRD risk among treated, untreated and never-treated individuals, whereby risk is likely to differ according to treatment status but is not always reported according to such (see Box 6 for a related example of the difficulty of comparing recent studies from Norway and Scotland). Several factors should be considered when assessing the comparability of such studies; for example:
• Are case definitions for cohort membership clearly defined and are cohorts drawn from the same underlying population? A study of DRDs among problem opioid users is not comparable with a study among ‘drug users’ or even, necessarily, a study among ‘treated drug users’.
• Related to the above, is the underlying population representative of those at risk of DRD? A study of DRDs among a cohort that uses a range of drugs is likely to produce a lower estimate of DRD risk than a study specifically among problem opioid users.
• Do studies use the same definition of DRD?
34
• Are cohorts accrued from the same setting? A cohort drawn from criminal justice settings may have a different DRD risk than a cohort drawn from treatment settings. In addition, the type of treatment available in one country may confer more or less risk than that in another.
• Does analysis adjust for changing treatment status and/or report in-/out-of-treatment risk separately? Unmeasured heterogeneity in treatment enrolment during observation may confound comparison.
• Does analysis adjust for risk factors such as age or drug use behaviours? Adjusted risk in one study may not be comparable with unadjusted risk in another.
• Do the studies relate to contemporary time periods? Risk may vary by epoch, confounding comparison of studies from different periods.
• Are DRD or all-cause mortality rates reported? Many studies have reported all-cause mortality rates, for which the rate is expected to be very much higher (note that 16 of the 23 drug user mortality cohort studies considered here (Box 6) did not report a DRD rate).
• Are recruitment and observation periods coterminous and are the latter sufficiently short to allow reasonable certainty that the individuals in the cohort remained active drug users? Very long-term follow-up of drug user cohorts, although informative, may fail to account for reductions in risk associated with drug-use cessation as time elapses.
To date, many European studies have varied with respect to all of these factors, illustrating the difficulty of making comparisons between them. Note that it is more straightforward to assess comparability where studies adhere to the STROBE (Strengthening the Reporting of Observational Studies in Epidemiology) checklist of items, which should be included in reporting cohort studies (7). The EMCDDA previously provided guidance on ensuring comparability between cohort studies (Perucci et al., 1999a; Perucci et al., 1999b) and noted the difficulty of making comparisons based on published findings alone (EMCDDA, 1997). Moreover, the EMCDDA has highlighted the importance of accurate case linkage and that it may be difficult, in some countries, to identify causes of death (EMCDDA, 2015).
Recommendation: countries should be encouraged to investigate the scope of assessing rates of DRD among known cohorts of problem opioid users, using methods that are comparable between countries and over time. There is a need for further cohort studies and updates to the currently available studies. The central coordination of such studies, through joint protocols (EMCDDA, 2012c; EMCDDA, 2015), is beneficial to improving comparability.
(7) http://www.strobe-statement.org/fileadmin/Strobe/uploads/checklists/STROBE_checklist_v4_cohort.pdf
35
References
Ahmad, M. and Richardson, A. (2016), Impact of the reduction in heroin supply between 2010 and 2011, Research Report 91, Home Office, London (available at www.gov.uk/government/uploads/system/uploads/attachment_data/file/494423/horr91-reduction-heroin-supply.pdf). (accessed on 20 May 2017) Arendt, M., Munk-Jorgensen, P., Sher, L. and Jensen, S. O. (2011), ‘Mortality among individuals with cannabis, cocaine, amphetamine, MDMA, and opioid use disorders: a nationwide follow-up study of Danish substance users in treatment’, Drug and Alcohol Dependence 114, pp. 134-139. Barrio, G., Montanari, L., Bravo, M.J., Bruno, G., de la Fuente, L., Pulido, J. and Vicente, J. (2013), ‘Trends of heroin use and heroin injection epidemics in Europe: findings from the EMCDDA treatment demand indicator (TDI)’, Journal of Substance Abuse Treatment 45, pp. 19-30. Bird, S. M. (2010), ‘Over 1200 drugs-related deaths and 190,000 opiate-user-years of follow-up: relative risks by sex and age group’, Addiction Research and Theory 18, pp. 194-207 (available at https://pure.strath.ac.uk/portal/files/402703/strathprints013373.pdf). (accessed on 20 May 2017) Bird, S. M., Parmar, M. K. B. and Strang, J. (2015a), ‘Take-home naloxone to prevent fatalities from opiate-overdose: protocol for Scotland’s public health policy evaluation, and a new measure to assess impact’, Drugs: Education, Prevention and Policy 22, pp. 66-76. Bird, S. M., McAuley, A., Perry, S. and Hunter, S. (2016), ‘Effectiveness of Scotland’s National Naloxone Programme for reducing opioid-related deaths: a before (2006-10) versus after (2011-13) comparison’, Addiction. 2016 May; 111(5):883-91. doi: 10.1111/add.13265. Epub 2016 Feb 4.. Bloor, M., Gannon, M., Hay, G., Jackson, G., Leyland, A. H. and McKeganey, N. (2008), ‘Contribution of problem drug users’ deaths to excess mortality in Scotland: secondary analysis of cohort study’, British Medical Journal 337, a478. Caudarella, A., Donga, H., Milloy, M. J., Kerr, T., Wood, E. and Hayashia, K. (2016), ‘Non-fatal overdose as a risk factor for subsequent fatal overdose among people who inject drugs’ Drug and Alcohol Dependence 162, pp. 51-55. Clausen, T., Anchersen, K. and Waal, H. (2008), ‘Mortality prior to, during and after opioid maintenance treatment (OMT): a national prospective cross-registry study’, Drug and Alcohol Dependence 94, pp. 151-157.
36

Clausen, T., Waal, H., Thoresen, M. and Gossop, M. (2009), ‘Mortality among opiate users: opioid maintenance therapy, age and causes of death’ Addiction 104, pp. 1356-1362. Copeland, L., Robertson, J., McKenzie, J., Kimber, J., Macleod, J., Hickman, M. and deAngelis, D. (2012), ‘Premature mortality in Scottish injecting drug users: a life-history approach’, Scottish Medical Journal 57, pp. 38-42. Cornish, R., Macleod, J., Strang, J., Vickerman, P. and Hickman, M. (2010), ‘Risk of death during and after opiate substitution treatment in primary care: prospective observational study in UK General Practice Research Database’, British Medical Journal 341, c5475. Darke, S. and Zador, D. (1996), ‘Fatal heroin “overdose”: a review’, Addiction 91, pp. 1765-1772. Darke, S., Hall, W., Weatherburn, D. and Lind, B. (1999), ‘Fluctuations in heroin purity and the incidence of fatal heroin overdose’, Drug and Alcohol Dependence 54, pp. 155-161. Davstad, I., Allebeck, P., Leifman, A., Stenbacka, M. and Romelsjö, A. (2011), ‘Self-reported drug use and mortality among a nationwide sample of Swedish conscripts — a 35-year follow-up’, Drug and Alcohol Dependence 118, pp. 383-390. Degenhardt, L., Bucello, C., Mathers, B., Briegleb, C., Ali, H., Hickman, M. and McLaren, J. (2011), ‘Mortality among regular or dependent users of heroin and other opioids: a systematic review and meta-analysis of cohort studies’, Addiction 106, pp. 32-51. European Monitoring Centre for Drugs and Drug Addiction (EMCDDA) (1997), Review of scientific studies of mortality among drug users and feasibility study for a common methodology for monitoring overall and cause-specific mortality among drug users in Member States of European Union, EMCDDA, Lisbon. European Monitoring Centre for Drugs and Drug Addiction (EMCDDA) (2010), EMCDDA standard protocol to collect data and report figures for the key indicator drug-related deaths (DRD-Standard version 3.2), Technical reports, EMCDDA, Lisbon (available at http://emcdda.europa.eu/html.cfm/index107404EN.html). (accessed on 20 May 2017) European Monitoring Centre for Drugs and Drug Addiction (EMCDDA) (2011a), Drug-related deaths and mortality — an overview of the methods and definitions used, http://www.emcdda.europa.eu/stats11/drd/methods (accessed on 30 November 2016). European Monitoring Centre for Drugs and Drug Addiction (EMCDDA) (2011b), 2011 Annual report on the state of the drugs problem in Europe, European Drug Report, EMCDDA, Lisbon (available at http://www.emcdda.europa.eu/online/annual-report/2011) (accessed on 20 May 2017)
37

European Monitoring Centre for Drugs and Drug Addiction (EMCDDA) (2012a), New heroin-assisted treatment: Recent evidence and current practices of supervised injectable heroin treatment in Europe and beyond, EMCDDA Insights 11, Publications Office of the European Union, Luxembourg (available at http://www.emcdda.europa.eu/publications/insights/heroin-assisted-treatment) (accessed on 20 May 2017) European Monitoring Centre for Drugs and Drug Addiction (EMCDDA) (2012b), Table TDI-113. All clients entering treatment for opioids by country and type of opioid misused (%), 2010 or most recent year available, http://www.emcdda.europa.eu/stats12/tditab113. (accessed on 20 May 2017) European Monitoring Centre for Drugs and Drug Addiction (EMCDDA) (2012c), Mortality among drug users: Guidelines for carrying out, analysing and reporting key figures 2012, Technical reports, EMCDDA, Lisbon (available at http://www.emcdda.europa.eu/scientific-studies/2012/mortality-cohorts) (accessed on 20 May 2017) European Monitoring Centre for Drugs and Drug Addiction (EMCDDA) (2013), PDU (problem drug use) revision summary, EMCDDA, Lisbon (available at http://www.emcdda.europa.eu/attachements.cfm/att_218205_EN_PDU%20revision.pdf) (accessed on 20 May 2017) European Monitoring Centre for Drugs and Drug Addiction (EMCDDA) (2014), Data: statistical bulletin 2014, http://www.emcdda.europa.eu/data/2014 (accessed on 20 May 2017) European Monitoring Centre for Drugs and Drug Addiction (EMCDDA) (2015), Mortality among drug users in Europe: New and old challenges for public health, EMCDDA Papers, Publications Office of the European Union, Luxembourg (available at http://www.emcdda.europa.eu/publications/emcdda-papers/mortality-among-drug-users-in-europe) (accessed on 20 May 2017) European Monitoring Centre for Drugs and Drug Addiction (EMCDDA) (2016a), European Drug Report 2016: Trends and Developments, Publications Office of the European Union, Luxembourg (available at http://www.emcdda.europa.eu/system/files/publications/2637/TDAT16001ENN.pdf) (accessed on 20 May 2017)
38

European Monitoring Centre for Drugs and Drug Addiction (EMCDDA) (2016b), Statistical Bulletin 2016, http://www.emcdda.europa.eu/data/stats2016 European Monitoring Centre for Drugs and Drug Addiction (EMCDDA) (2016c), Drug consumption rooms: an overview of provision and evidence, http://www.emcdda.europa.eu/topics/pods/drug-consumption-rooms (accessed on 30 November 2016) (accessed on 20 May 2017) European Monitoring Centre for Drugs and Drug Addiction (EMCDDA) (various years), Main data and statistics page: Statistical archive, http://www.emcdda.europa.eu/stats/archive (accessed on 20 May 2017) England, K. (2016), To contribute to the EMCDDA review of drug related deaths from the GMR in some countries (including the codification practices of DRDs following the WHO revision of ICD coding guidelines), presented at the EMCDDA Drug-related deaths Expert meeting 2016 (available at http://emcdda.europa.eu/system/files/attachments/3235/To%20contribute%20to%20the%20EMCDDA%20review%20of%20drug.pdf) (accessed on 20 May 2017) England, K (2017a), Coding and reporting of drug-related deaths in Europe. Part I: Codification practices of drug related deaths following the WHO revision of ICD coding guidelines related to DRDs. May 2017, Lisbon. http://www.emcdda.europa.eu/activities/drd //Studies (accessed on 29 May 2017) England, K (2017b), Coding and reporting of drug-related deaths in Europe. Part II: A review of the inventory of the national Special Mortality Registries in Europe, with a focus on information flow to the General mortality registries. 29 May 2017, Lisbon. http://www.emcdda.europa.eu/activities/drd //Studies (accessed on 9May 2017) England, K (2017c), Coding and reporting of drug-related deaths in Europe. Part III: Codification practices in some countries following the WHO revision. May 2017, Lisbon. http://www.emcdda.europa.eu/activities/drd //Studies (accessed on 29 May 2017) Farrell M. and Marsden, J. (2008) ‘Acute risk of drug-related death among newly released prisoners in England and Wales’, Addiction 103, pp. 251-255. Folkhälsomyndigheten (2014), 2014 National Report (2013 data) to the EMCDDA by the Reitox national focal point, Public Health Agency of Sweden, Stockholm (available at . http://www.emcdda.europa.eu/attachements.cfm/att_239764_EN_2014%20National%20Report%20-%20Sweden.pdf) (accessed on 20 May 2017)
39

Forsell, M. and Nurmi, T. (2013), Päihdehuollon huumeasiakkaat 2012 (Tilastoraportti 21/2013) [Substance use treatment customers 2012 (Statistical report)], Terveyden ja hyvinvoinnin laitos, Helsinki. Fugelstad, A., Annell, A., Rajs, J. and Agren, G. (1997), ‘Mortality and causes and manner of death among drug addicts in Stockholm during the period 1981-1992’, Acta Psychiatrica Scandinavica 96, pp. 169-175. Fugelstad, A., Johansson, L. A. and Thiblin, I. (2010), ‘Allt fler dör av metadon’, Läkartidningen 107, pp. 1225-1228. Fugelstad, A., Johansson, L. A. and Thiblin, I. (2016), ‘Faktisk ökning av antalet narkotikaklassade läkemedel mörkas’, DN.debatt, 3 April 2016. Gao, L., Dimitropouloua, P., Robertson, J. R., McTaggart, S., Bennie, M. and Bird, S. M. (2016), ‘Risk-factors for methadone-specific deaths in Scotland’s methadone-prescription clients between 2009 and 2013’, Drug and Alcohol Dependence 167, pp. 214-223. Giraudon, I., Mathis, F, Kalamara, E., Vicente, J., Hedrich, D. and Simon, R. (2016a), Drug-related deaths and mortality among drug users — annual expert meeting 2016. Introduction — setting the scene, presented at the EMCDDA Drug-related deaths Expert meeting 2016 (available at http://emcdda.europa.eu/system/files/attachments/3233/DRDINtroductions_IG-final_for%20the%20webages.pdf) (accessed on 20 May 2017) Giraudon, I., Hedrich, D., Duffell, E., Kalamara, E. and Wiessing, L. (2016b), ‘Hepatitis C virus infection among people who inject drugs: epidemiology and coverage of prevention measures in Europe’, in European Monitoring Centre for Drugs and Drug Addiction, Hepatitis C among drug users in Europe: Epidemiology, treatment and prevention, Insights 23, pp. 17-30, Publications Office of the European Union, Luxembourg (available at http://www.emcdda.europa.eu/publications/insights/hepatitis-c-among-drug-users-in-europe) (accessed on 20 May 2017) Gjersing, L and Sandøy, T, Narkotikabruk på gateplan i syv norske byer, SIRUS report 2/2014 and National Focal Point (unpublished data). Gjersing, L., Jonassen, K.V., Biong, S., Ravndal, E., Waal, H., Bramness, J.G. and Clausen, T. (2013), ‘Diversity in causes and characteristics of drug-induced deaths in an urban setting’, Scandinavian Journal of Public Health 41, pp. 119-125. Gossop, M., Stewart, D., Treacy, S. and Marsden, J. (2002), ‘A prospective study of mortality among drug misusers during a 4-year period after seeking treatment’, Addiction 97, pp. 39-47.
40

Green, T. C., McGowan, S. K., Yokell, M. A., Pouget, E. R. and Rich, J. D. (2012), ‘HIV infection and risk of overdose: a systematic review and meta-analysis’ AIDS 26, pp. 403-417. Hakansson, A., Medvedeo, A., Andersson, M. and Berglund M. (2007), ‘Buprenorphine misuse among heroin and amphetamine users in Malmo, Sweden: purpose of misuse and route of administration’, European Addiction Research 13, pp. 207-215. Häkkinen, M., Vuori, E. and Ojanperä, I. (2014a), ‘Prescription opioid abuse based on representative postmortem toxicology’, Forensic Science International 245, pp. 121-125. Häkkinen, M., Vuori, E., Kalso, E., Gergov, M. and Ojanperä, I. (2014b), ‘Profiles of pregabalin and gabapentin abuse by postmortem toxicology’, Forensic Science International 241, pp. 1-6. Information Services Division Scotland (ISD) (2016a), Estimating the national and local prevalence of problem drug use in Scotland 2012/13, ISD (available at https://www.isdscotland.org/Health-Topics/Drugs-and-Alcohol-Misuse/Publications/2014-10-28/2014-10-28-Drug-Prevalence-Report.pdf) (accessed on 20 May 2017) Information Services Division Scotland (ISD) (2016b), Scottish Drug Misuse Database: Overview of initial assessments for specialist drug treatment 2014/15, ISD (available at https://www.isdscotland.org/Health-Topics/Drugs-and-Alcohol-Misuse/Publications/2016-05-17/2016-05-17-SDMD-Report.pdf) (accessed on 20 May 2017) Innes, H., McDonald, S., Hayes, P., Dillon, J. F., Allen, S., Goldberg, D., Mills, P. R. et al. (2016), ‘Mortality in hepatitis C patients who achieve a sustained viral response compared to the general population’, Journal of Hepatology doi:10.1016/j.jhep.2016.08.004. Janssen, E. (2009), ‘Drug related deaths in France. A critical view’, Revue d’Epidemiologie et de Sante Publique 57, pp. 126-129. Janssen, E. (2010), ‘Estimating the levels of acute drug-related deaths in France, 2001-2002: a simple technique to measure bias in overdoses recording’, Journal of Substance Use 15, pp. 105-112. Jones, H. E., Welton, N. J., Ades, A. E., Pierce, M., Davies, W., Coleman, B., Millar, T. and Hickman, H. (2016), ‘Problem drug use prevalence estimation revisited: heterogeneity in capture–recapture and the role of external evidence’, Addiction, 111, pp. 438-437. Kelly, A., Teljeur, C. and Carvalho, M. (2009), A capture–recapture study estimating the prevalence of opiate use in Ireland 2006, National Advisory Committee on Drugs, Dublin.
41

Kimber, J., Copeland, L., Hickman, M., Macleod, J., McKenzie, J. and DeAngelis, D. (2010), ‘Survival and cessation in injecting drug users: prospective observational study of outcomes and effect of opiate substitution treatment’, British Medical Journal 340, 3172. Leifman, H. (2015), ‘Förekomsten av alkohol och narkotika i Sverige’, in Franck, J. and Nylander, I. (eds.), Beroendemedicin, Studentlitteratur, Lund, pp. 21-36. Leifman, H. (2016), Drug-related deaths in Sweden: Estimations of trends, effects of changes in recording practices and studies of drug patterns, Centralförbundet för alkohol- och narkotikaupplysning, Stockholm (available at http://www.can.se/Publikationer/rapporter/drug-related-deaths-in-sweden/ and http://www.emcdda.europa.eu/activities/drd //Studies (accessed on 20 May 2017) Lynn, E., Lyons, S., Walsh, S. and Long, J. (2009), Trends in deaths among drug users in Ireland from traumatic and medical causes, 1998 to 2005, Health Research Board, Dublin. Lyons, S., Walsh, S., Lynn, E. and Long, J. (2010), ‘Drug related deaths among recently released prisoners in Ireland, 1998 to 2005’, International Journal of Prisoner Health 6, pp. 26-32. McAuley, A. and Best, D. (2012), ‘A quantitative exploration of risk factors associated with drug-related deaths involving heroin, alcohol or methadone in the West of Scotland’, Addiction Research and Theory 20, pp. 153-161. McCowan, C., Kidd, B. and Fahey, T. (2009), ‘Factors associated with mortality in Scottish patients receiving methadone in primary care: retrospective cohort study’, British Medical Journal 338, p. 222. McKeganey, N., Bloor, M., McIntosh, J. and Neale, J. (2008), Key findings from the Drug Outcome Research in Scotland (DORIS) study, University of Glasgow Centre for Drug Misuse Research, Glasgow (available at http://substanceuseresearch.org/wp-content/uploads/2016/02/DORIS-Key.pdf). Macleod, J., Copeland, L., Hickman, M., McKenzie, J., Kimber, J. et al. (2010), ‘The Edinburgh Addiction Cohort: recruitment and follow-up of a primary care based sample of injection drug users and non drug-injecting controls’, BMC Public Health 10, p. 101. Marshall, B. D. L., Milloy, M. -J., Wood, E., Montaner, J. S. G. and Kerr, T. (2011), ‘Reduction in overdose mortality after the opening of North America’s first medically supervised safer injecting facility: a retrospective population-based study’, Lancet 377, pp. 1429-1437.
42

Mathers, B. M., Degenhardt, L., Bucello, C., Lemon, J., Wiessing, L. and Hickman, M. (2013), ‘Mortality among people who inject drugs: a systematic review and meta-analysis’, Bulletin of the World Health Organization 91, pp. 102-123. Merrall, E. L. C., Kariminia, A., Binswanger, I. A., Hobbs, M. S., Farrell, M., Marsden, J., Hutchinson, S.J. and Bird, S. M. (2010), ‘Meta-analysis of drug-related deaths soon after release from prison’, Addiction 105, pp. 1545-1554. Merrall, E. L., Bird, S. M. and Hutchinson, S. J., (2012), ‘Mortality of those who attended drug services in Scotland 1996-2006: record-linkage study’, International Journal of Drug Policy 23, pp. 24-32. Merrall, E. L., Bird, S. M. and Hutchinson, S. J. (2013), ‘A record-linkage study of drug-related death and suicide after hospital discharge among drug-treatment clients in Scotland, 1996-2006’, Addiction 108, pp. 377-384. Mounteney, J., Giraudon, I., Denissov, G. and Griffiths, P. (2015), ‘Fentanyls: are we missing the signs? Highly potent and on the rise in Europe’, International Journal of Drug Policy 26, pp. 626-631. National Board of Health and Welfare (NBHW) (2015), Dödsorsaker 2014, Socialstyrelsen, Stockholm. National Board of Health and Welfare (NBHW) (2016), Narkotikarelaterade dödsfall. En analys av 2014 års dödsfall och utveckling av den officiella statistiken, Socialstyrelsen, Stockholm. National Records of Scotland (NRS) (2016), Drug-related deaths in Scotland in 2015, Edinburgh National Statistics (available at http://www.nrscotland.gov.uk/files//statistics/drug-related-deaths/15/drugs-related-deaths-2015.pdf) (accessed on 20 May 2017) Neufeind, J., Stephenson, A., Paterson, M., Young, M., Steer, C. and Baldacchino, A. (2011), Drug deaths in Fife, Scotland, 2008-2010: A report on the findings of the Fife Drug Deaths Monitoring and Strategic Group, Fife Alcohol Drug Partnership http://s3.amazonaws.com/zanran_storage/www.nhsfife.scot.nhs.uk/ContentPages/53546360.pdf (accessed on 20 May 2017) Nyhlén, A., Fridell, M., Hesse, M. and Krantz, P. (2011), ‘Causes of premature mortality in Swedish drug abusers: a prospective longitudinal study 1970-2006’, Journal of Forensic and Legal Medicine 18, pp. 66-72.
43
Ødegård, E., Amundsen, E. and Kielland, K. (2007), ‘Fatal overdoses and deaths by other causes in a cohort of Norwegian drug abusers: a competing risk approach’, Drug and Alcohol Dependence 89, pp. 176-182. Office for National Statistics (2016) Deaths related to drug poisoning in England and Wales: 2015egistrationshttps://www.ons.gov.uk/peoplepopulationandcommunity/birthsdeathsandmarriages/deaths/bulletins/deathsrelatedtodrugpoisoninginenglandandwales/2015registrations
Ojanperä, I., Gergov, M., Liiv, M., Riikoja, A. and Vuori, E. (2008), ‘An epidemic of fatal 3-methylfentanyl poisoning in Estonia’, International Journal of Legal Medicine 122, pp. 395-400. Ollgren, J., Forsell, M., Varjonen, V., Alho, H., Brummer-Korvenkontio, H., Kainulainen, H., Karjalainen, K. et al. (2012), ‘Amfetamiinien ja opioidien ongelmakäytön yleisyys Suomessa’, Yhteiskuntapolitiikka 79, 5/2014. Onyeka, I. N., Beynon, C. M., Hannila, M. L., Tiihonen, J., Föhr, J., Tuomola, P., Kuikanmäki, O. et al. (2014), ‘Patterns and 14-year trends in mortality among illicit drug users in Finland: the HUUTI study’, International Journal of Drug Policy 25, pp. 1047-1053. Partanen, A. and Maki, J. (2004), ‘Buprenorphine more common as a problem drug in Finland’, Nordisk Alkohol & Narkotikatidskift 21 (English Supplement). Perucci, C. A., Bargagli, A. M., Davoli, M., Sperati, A., Vicente, J. and Hartnoll, R. EMCDDA (1999a), Co-ordination of implementation, follow-up and analysis of cohort studies on mortality among drug users in European Union Member States, EMCDDA, Lisbon. Perucci, C. A., Davoli, M., Bargagli, A. M., Vicente, J. and Hartnoll, R. EMCDDA (1999b), Implementation, follow-up and analysis of cohort studies on mortality among drug users in European Union member States, EMCDDA, Lisbon. Pierce, M., Bird, S. M., Hickman M. and Millar, T. (2015), ‘National record linkage study of mortality for a large cohort of opioid users ascertained by drug treatment or criminal justice sources in England, 2005-2009’, Drug and Alcohol Dependence 146, pp. 17-23. Pierce, M., Bird, S. M., Hickman, M., Marsden, J., Dunn, G., Jones, A. and Millar, T. (2016), ‘Impact of treatment for opioid dependence on fatal drug-related poisoning: a national cohort study in England’, Addiction 11, pp. 298-308. Ravndal, E. and Amundsen, E. J. (2010), ‘Mortality among drug users after discharge from inpatient treatment: an 8-year prospective study’, Drug and Alcohol Dependence 108, pp. 65-69.
44

Simonsen, K. W., Edvardsen, H. M. E., Thelander, G., Ojanperä I., Thordardottir, S., Andersen, L. V., Kriikku, P. et al. (2015), ‘Fatal poisoning in drug addicts in the Nordic countries in 2012’, Forensic Science International 248, pp. 172-180. Skretting, A. and Rosenqvist, P. (2010), ‘Shifting focus in substitution treatment in the Nordic countries’, Nordic Studies on Alcohol and Drugs 27, pp. 581-597. Statens Folkhälsoinstitut (2011), Narkotikabruket i Sverige, Statens Folkhälsoinstitut, Östersund. Stenbacka, M., Leifman, A. and Romelsjö, A. (2010), ‘Mortality and cause of death among 1705 illicit drug users: a 37 year follow up’, Drug and Alcohol Review 29, pp. 21-27. Tuusov, J., Vals, K., Tõnisson, M., Riikoja, A., Denissov, G. and Väli, M. (2013), ‘Fatal poisoning in Estonia 2000-2009: trends in illegal drug-related deaths’, Journal of Forensic and Legal Medicine 20, pp. 51-56. United Nations Office on Drugs and Crime (UNODC) (2015), World Drug Report 2015, United Nations publication, Sales No E.15.XI.6, UNODC, Vienna (available at https://www.unodc.org/documents/wdr2015/World_Drug_Report_2015.pdf) (accessed on 20 May 2017) Uosukainen, H., Kauhanen, J., Voutilainen, S., Föhr, J., Paasolainen, M., Tiihonen, J., Laitinen, K. et al. (2013), ‘Twelve-year trend in treatment seeking for buprenorphine abuse in Finland’, Drug and Alcohol Dependence 127, pp. 207-214. Uusküla, A., Rajaleid, K., Talu, A., Abel-Ollo, K. and Des Jarlais, D. C. (2013), ‘A decline in the prevalence of injecting drug users in Estonia, 2005-2009’, International Journal of Drug Policy 24, pp. 312-318. Vajdic, C. M., Marashi Pour, S., Olivier, J., Swart, A., O’Connell, D. L., Falster MO, Meagher NS,et al. (2015), ‘The impact of blood-borne viruses on cause-specific mortality among opioid dependent people: an Australian population-based cohort study’, Drug and Alcohol Dependence 152, pp. 264-271. Waal, H. and Gossop, M. (2014), ‘Making sense of differing overdose mortality: contributions to improved understanding of European patterns’, European Addiction Research 20, pp. 8-15. White, M., Burton, R., Darke, S., Eastwood, B., Knight, J., Millar, T., Musto, V. and Marsden, J. (2015), ‘Fatal opioid poisoning: a counterfactual model to estimate the preventive effect of treatment for opioid use disorder in England’, Addiction 110, pp. 1321-1329.
45

Wikner, B. N., Öhman, I., Selden, T., Druid, H., Brandt, L. and Kieler, H. (2014), ‘Opioid-related mortality and filled prescriptions for buprenorphine and methadone’, Drug and Alcohol Review 33, pp. 491-498.
46

Appendices: Country-level summaries
Data discussed and presented in the country summaries (below) are primarily derived from the EMCDDA country profiles (available from http://www.emcdda.europa.eu/countries), unless otherwise specified. Country profiles are populated by data submitted by each national focal point within workbooks related to different aspects of drug use, e.g. harm and treatment. The workbooks are more complete documents reported to the EMCDDA as part of annual national reporting to complete the standard figures reported for the Statistical Bulletin (available from http://www.emcdda.europa.eu/data/stats2016). Although not available on the EMCDDA website, these workbooks may be provided on request.
47

Appendix 1: Denmark Sources of data on overdose The numbers of drug-induced deaths (DIDs) in Denmark are recorded in two registers — the National Police Register and the State Serum Institute’s Cause of Death Register (the GMR). Information provided by the GMR indicates that 94-100 % of DIDs in Denmark have known toxicology between 2006 and 2013, but levels have continually decreased over the time series. Both the National Police Register and the GMR show similar trends, which suggest that recording issues are unlikely to explain why rates are ‘high’.
Background epidemiology
Estimates of ‘problem drug users’ Trends in the number of ‘drug abusers’ (i.e. people who use drugs (PWUD)) in Denmark appear to have increased over time, with the most recent estimate suggesting there were 33 000 PWUD in Denmark in 2009. However, these figures include cannabis users (11 000 in 2009); no specific estimate of the number of POUs exists (Sundhedsstyrelsen, 2014). In 2009, there were an estimated 13 000 PWID in Denmark; most Danish PWID are opioid users and 50-67 % are unknown to treatment services (Sundhedsstyrelsen, 2014).
Drug-related infectious diseases It is estimated that up to 75 % of PWID in Denmark are infected with HCV and 35 % are infected with hepatitis B virus (HBV) (Sundhedsstyrelsen, 2014). Fewer than 5 % of PWID are infected with HIV and between 2005 and 2014 PWID accounted for 4-11 % of newly diagnosed HIV cases in Denmark (Sundhedsstyrelsen, 2014). It should be noted that infectious diseases related to drug use are likely to be underdiagnosed in Denmark, since a large proportion of PWID are not regularly tested.
Drug treatment data There appears to have been a general decline, between 2005 and 2011, in the proportion of PWUD treated for the first time, with opioids being reported as the main problem, decreasing from 17 % to 5 %. At the same time, the proportion of people who inject heroin in this population increased between 2005 and 2008, and then decreased over the next two years before rising again to its highest level (27 %) in 2011. Although contrasting, these trends are perceived to reflect a general decrease in opioid use within the Danish population over time and increasing engagement in treatment among older people who inject heroin. No drug treatment data are available for after 2011.
Opioid substitution treatment In 2013, more than 7 000 individuals received OST — either with methadone (6 200; 89 %) or buprenorphine. This potentially translates to ~ 54 % of PWID based on 2009 estimates (i.e. 13,000), although it is possible this denominator has changed (i.e. decreased) since 2009 when looking at changes in the proportion of new opioid users recorded in the treatment data. Just over 500 (7%) of those on OST in 2013 were in prison or on probation. The overall OST number is down from the estimates from 2010 (7,850; 60%) and 2011 (7,600; 58%).
Non-fatal poisoning Hospital contacts with drug poisoning as the ‘action’ diagnosis are recorded in the National Patient Register (LPR). It is notable that there was a decrease in the number of recent poisonings related to heroin between 2010 and 2014 (from 195 in 2010 to 107 in 2014) (Figure A.1.1), a trend that mirrors the corresponding increase in OST engagement and the
48

increase in the proportion of injecting heroin users accessing treatment for the first time. In contrast, poisonings related to other opioids increased sharply over the time series. This is largely attributed to an increase in the use of prescription opioids within Denmark in recent years. The data retrieval criterion changed in 2010, making comparisons before and after this period difficult; it is likely that poisonings before 2010 were under-reported.
Figure A.1.1: Hospital contacts resulting from intoxication and poisoning by main drug, Denmark 2005-2014 (source: the National Patient Register)
Heroin assisted treatment As of March 2009, treatment with medically prescribed heroin for injection has been allowed in Denmark, with five clinics established. The number of patients engaged with HAT programmes is limited each year by funding, but had risen to 300 by 2013. Drug consumption rooms Drug consumption rooms (DCRs) were legally authorised in Denmark in 2012, with three DCRs now established across the country. Although originally established to address the opioid-injecting epidemic, DCRs in Denmark are now increasingly used by individuals injecting crack cocaine. Take-home naloxone Based on positive outcomes from a pilot project in the Copenhagen Municipality, an intranasal THN project financed by the state was initiated in January 2013, based in four municipalities. As of October 2014, 100 people had been trained to train others, and 121 drug users had received overdose prevention training and THN kits. There have been seven instances of reported naloxone use for overdose reversal.
Injecting equipment provision A study by Local Government Denmark concluded that the number of PWID with access to clean needles and syringes is ‘high’, although the coverage rate of syringe exchange in Denmark has never been quantified.
Drug-induced deaths: overall In Denmark, the number of annual DIDs increased from 227 in 2006 to 235 in 2013, an increase of 4 % (Figure A.1.2). By era, DIDs averaged 254 per annum between 2006 and 2009, rising slightly to almost 260 per annum in the most recent four-year period for which data are available (2010-2013). A visual inspection of the data suggests that the overall number of DIDs increased gradually over the time series to a peak in 2011, with decreases observed in the following two years. However, it is too early to confirm if the recent decline represents definitive epidemiological evidence of a falling trend.
49

Figure A.1.2: Crude numbers of annual drug-induced deaths recorded in Denmark, 2006-2013 (source: National Focal point report to the EMCDDA through Standard Table 6)
The overall proportion of DIDs in Denmark accounted for by males has remained relatively stable at between 70 % and 78 % across the time series. The average (mean) age of those affected has increased over the time series, from 42.8 years between 2006 and 2009 to 45.6 years between 2010 and 2013. Between-era differences in DIDs across different age groups also show some evidence of change. For example, deaths in older adults all appear to have increased significantly regardless of how the data are categorised (> 35 years, p = 0.0002; > 45 years, p = 0.0001; > 55 years, p = 0.0001). Similarly, the proportion of deaths in the younger adult group (< 35 years) decreased significantly (p = 0.0001).
Drug-induced deaths: toxicology The number of cases recorded involving opioids increased from 181 in 2006 to 191 in 2013, an increase of 6 % (Figure A.1.2). Opioid-related DIDs averaged 202 per annum between 2006 and 2009, rising to over 214 per annum in the most recent four-year period for which data are available (2010-2013). When comparing the presence of opioids in DID toxicology between eras, the data show a significant increase between the 2006-2009 (81 %) and 2010-2013 (85 %) periods (p = 0.01). A visual inspection of the data shows patterns similar to those for the overall number of DIDs; the overall numbers have increased steadily over the time series to a peak in 2011, with decreases observed in the following two years. Parallel patterns are perhaps to be expected given that opioid-related DIDs account for over 80 % of all DIDs in Denmark.
Based on National Police Register data, on average three to four drugs are found upon examination of all DIDs in Denmark, which is indicative of polydrug use as major contributor to drug-related mortality. Of the 263 deaths recorded in the National Police Register in 2014, 191 (73 %) were caused by poisoning from one or several drugs.
Summary
Although no recent prevalence data exist to confirm such a hypothesis, it appears that the scale of heroin injecting has decreased since 2009, based on treatment data and national focal point communication. It is possible that the decreasing prevalence of heroin injecting and changing drug use patterns more generally in Denmark are having some impact on mortality rates among PWUD. Polydrug use remains a key contributor too, although the composition of polydrug combinations could be changing and also having an impact on death rates.
The average age at DID in Denmark has been rising for many years, as it has elsewhere in Europe, and parallels the increase in age among traditional opioid (i.e. heroin) user cohorts. The average age at DID in Denmark is among the highest in Europe and possibly reflects a
50

combination of improving treatment and care for PWUD and a decrease in the onset of newly injecting opioid users.
References Sundhedsstyrelsen (2014), Narkotikasituationen i Danmark 2013 [2014 National Report (2013 data) to the EMCDDA], Sundhedsstyrelsen, Copenhagen.
51

Appendix 2: Estonia Sources of data on overdose The National Cause of Death Register (the GMR — Estonian Causes of Death Registry) and the Estonian Forensic Science Institute provide data on DIDs in Estonia. There have been no notable methodological changes over time in relation to the source of data (the GMR), case definition (Selection B: ICD-10) or geography. Information provided by the GMR indicates that DIDs in Estonia had between 97 and 100 % coverage of known toxicology.
Background epidemiology
Estimates of ‘problem drug users’
There were an estimated 13 886 (95 % CI 8 132-34 443) PWID in Estonia in 2004, which equates to a prevalence figure of 2.4 % (95 % CI 1.4-5.9 %) among people aged 15-44 years ('Uusküla' et al., 2007; 'Uusküla' et al., 2013. The estimated prevalence of PWID among the population aged 15-44 years increased to 15 675 (2.7 %; 95 % CI 1.8-7.9 %) in 2005, but then declined to 11 493 in 2008 (2.0 %; 95 % CI 1.4-5.0 %) and 5 362 in 2009 (0.9 %; 95 % CI 0.7-1.7 %). At best, this corresponds to a significant decrease in the PWID population of 56 % over the study period, 2004-2009. However, taking into account the wide CIs, the overall decrease may actually have been much smaller and results should therefore be interpreted with caution. Although no definitive explanation exists with regard to why the prevalence of PWID in Estonia may have decreased between 2005 and 2009, the reduction is consistent with cross-sectional studies that show significant reductions in the number of new injectors recruited over the study period (Uusküla et al., 2011).
Drug-related infectious diseases HCV antibody prevalence among PWID ranges from 76 % in the Narva region (2010) to 90 % in Tallinn (2013). Hepatitis B surface antigen (HBsAg) prevalence ranges from 3 % to 22 %. The Joint United Nations Programme on HIV/AIDS (UNAIDS) reports that the prevalence of HIV among PWID in Estonia has fallen in recent years, from 62.5 % in 2009 to 52.4 % in 2012 (UNAIDS, 2012). Trend data from the National Institute for Health Development (NIHD) indicates that the number of newly diagnosed cases of HIV among PWID has fallen considerably since data collection began, from around 100 in 2009 to 21 in 2014 (Figure A.2.1). This fall is in line with decreasing trends in the overall number of new diagnoses of HIV in the Estonian population.
Drug treatment data The proportion of total clients in the treatment system reporting opioids as the main drugs used has fallen marginally across the time series, from around 98 % in 2008 to 90 % in 2014, but remains very high in comparison with all other substances. The majority of clients report illicit fentanyl as their primary drug, as they have done for a number of years. However, given that there are no specific treatments or treatment centres funded for users of other substances, it is possible that treatment demand indicator (TDI) data are skewed towards opioid use and underestimate treatment need/demand for users of other drugs. The majority (70 %) of clients have injected at some point in the past and only 5 % claimed to have never injected any drugs, thus implying that PWID prevalence estimates provide a reasonable proxy for POU prevalence.
In 2012 and 2014, the National Drug Treatment Database had technical issues that resulted in the loss of approximately 30-40 % of treatment records. TDI data for those years should therefore be interpreted with caution.
52

Opioid substitution treatment In 2014, there were seven substitution treatment providers in Estonia and 919 clients were receiving substitution treatment. Outpatient treatment centres have mainly provided OST with methadone since 2001 (in prisons since 2008). Buprenorphine treatment is provided by only one hospital at a cost to the patient, while methadone treatment is free. Based on data from the National Drug Treatment Database, only 2 % of OST clients received buprenorphine in 2014. From 2009 to 2013, the number of OST clients increased gradually but decreased in 2014 (Figure A.2.1). Assuming the prevalence of PWID is representative of POU prevalence, it is estimated that between 9 and 19 % of PWID were engaged in OST between 2008 and 2009. Again, CIs are wide and results should be interpreted with caution. Figure A.2.1: Number of clients in OST, 2007-2014 (source: National Focal point report to the EMCDDA through Standard Table 24)
Injecting equipment provision The number of syringes distributed to PWID in Estonia increased markedly between 2003 and 2010, but has stabilised since at around 200 000 per year. Using the 2009 estimate of 5 000 PWID, this is equivalent to around 40 syringes per year per problem opioid user.
Take-home naloxone In September 2013, a THN pilot programme was launched in Estonia by the NIHD. In total, 1 135 participants received training and 1 130 naloxone kits were disseminated during the period of September 2013-August 2015. The majority of kits were distributed to PWID (920;, 81 %). During the same period, 251 repeat naloxone prescriptions were reported, which provides an indication of the level of naloxone use within the community. These data suggest that, in Estonia, the number of THN kits issued was almost nine times the number of opioid-related deaths.
0200400600800
100012001400
2007 2008 2009 2010 2011 2012 2013 2014
53

Drug-induced deaths: overall Figure A.2.2: Crude number of annual drug-induced deaths recorded in Estonia, 2008-2014 (source: National Focal point report to the EMCDDA through Standard Table 6)
In Estonia, the annual number of DIDs increased from 67 in 2008 to 170 in 2012, an increase of 154 %. In the two following years, the numbers decreased considerably, to 111 (2013) and 98 (2014) (Figure A2.2). However, it is too early to confirm if this recent decline represents definitive epidemiological evidence of a falling trend.
The overall proportion of DIDs in Estonia accounted for by males has remained relatively stable, at between 84 % and 90 % across the time series. The average (mean) age at DID in Estonia increased from 31.1 years in 2012 to 31.9 years in 2013 and 33.4 years in 2014. Moreover, the proportion of deaths occurring in those aged under 30 years decreased from 45 % in 2012 to 28 % in 2014.
Drug-induced deaths: toxicology Opioid-related DIDs accounted for over 90 % of all DIDs in Estonia between 2012 and 2014, the vast majority of which involved illicit fentanyl use. However, the number of DIDs for which opioids were recorded in toxicology decreased from 165 in 2012 to 98 in 2014, a decrease of 41 % (Figure A.2.2). Poisoning involving fentanyl is frequently combined with amphetamines (Tuusov et al., 2013).
Purity Since 2012, the purity of fentanyl has decreased in Estonia, coinciding with a decrease in DIDs in Estonia over the same period. The decrease in the purity of fentanyl in Estonia has been associated with police operations targeting street vendors (Abel-Ello et al., 2014). However, fentanyl is extremely potent by weight; therefore, small variations in the illicit production or processing of the drug may lead to large variations in effective dosage, increasing the likelihood of overdose (Uusküla et al., 2013).
Summary Studies suggest that the number of PWID/problem opioid users in Estonia may have declined to some extent between 2005 and 2009; however, DIDs continued to increase until a peak in 2012, then decreased thereafter. Local intelligence attributes this decrease in DIDs to a combination of decreasing PWID/POU prevalence and the implementation of a THN programme. The former is not yet supported by a prevalence study using similar methods to those conducted earlier. However, it is plausible to assume that those who remained within the PWID cohort post 2009 were at increased risk of DID, as the purity of fentanyl continued to increase (until 2012) and then decreased across the time series.
54

The naloxone project is likely to have already affected the opioid-related death rate and will continue to do so in subsequent years if it is maintained at current levels. However, the overall DID rate in Estonia has been falling since 2012 and the initial decrease cannot therefore be attributed to naloxone alone. Alternative explanations for the decline DIDs in Estonia could be that the scale-up of harm-reduction and treatment services reached a sufficient level to affect overall mortality. It is true that coverage of needle exchange and OST provision increased across the time series, although not to a level at which such a direct impact on DIDs would be expected.
References Abel-Ello, K. Salekesin, M., Vorobjov, S., Vals, K. and Ruutel, K. (2014), 2014 National Report (2013 data) to the EMCDDA by the Reitox national focal point: Estonia — New developments, trends, National Institute for Health Development, Tallinn.
Tuusov, J. Vals, K., Tonisson, M. And Rikoja, A. (2013), ‘Fatal poisoning in Estonia 2000-2009: trends in illegal drug-related deaths’, Journal of Forensic and Legal Medicine 20, pp. 51-56.
United Nations Programme on HIV/AIDS (UNAIDS) (2012), Global report: UNAIDS report on the global AIDS epidemic 2012, UNAIDS (available at http://www.unaids.org/sites/default/files/media_asset/20121120_UNAIDS_Global_Report_2012_with_annexes_en_1.pdf).
Uusküla, A., Des Jarlais, D. C., Kals, M., Rüütel, K., Abel-Ollo, K. and Talu, A. (2011), ‘Expanded syringe exchange programs and reduced HIV infection among new injection drug users in Tallinn, Estonia’, BMC Public Health 11, 517.
Uusküla, A., Rajaleid, K., Talu, A., Abel-Ollo, K. and Des Jarlais, D. C. (2013), ‘A decline in the prevalence of injecting drug users in Estonia, 2005-2009’, International Journal of Drug Policy 24, pp. 312-318.
55
Appendix 3: Finland Sources of data on overdose The National Cause of Death Register (GMR — Statistics Finland) and the Special Registry provide data on DIDs in Finland. There have been no notable methodological changes over time in relation to the source of data (GMR), case definition (Selection B: ICD-10) or geography. Information provided by the GMR indicates that DIDs in Finland have 100 % coverage of known toxicology.
Background epidemiology
Estimates of ‘problem drug users’ The latest estimates of ‘problem drug use’ are from 2012 and indicate that the ‘opioid abuse’ estimate is between 13 000 and 15 000, or 0.38-0.45 % of the population (Ollgren et al., 2014). The opioid most commonly used in Finland is buprenorphine (Forsell and Nurmi, 2013).
Drug-related infectious diseases By the end of 2014, the National Infectious Diseases Register estimated HIV prevalence among PWID to be 1.2 % and HCV prevalence to be 74 % (8). The numbers of new HIV and HCV cases have remained largely stable for the past 10 years at around 150 and 1 200 per annum, respectively, as has the proportion accounted for by PWID (approximately 5 % (for HIV) and 50 % (for HCV) of all new diagnoses).
Drug treatment data The Finnish drug treatment data collection, which provides the TDI data, is a voluntary data collection system. In 2014, over half (53 %) of all drug clients in the Finnish drug treatment data collection system reported opioids as their primary drug, primarily buprenorphine (85 % of all opioids). Of the remainder, the most notable drugs reported were stimulants (15 %) and cannabis (14 %). Two thirds of clients are male, and the median age is 30 years. The most notable trend in the Finnish TDI data is the increasing amount of opioid users, in particular the increasing use of buprenorphine. Available data and local intelligence on service delivery changes indicate that the increase of opioid-related presentations (for new and all clients) is a result of both an increase in the prevalence of opioid use in Finland over the time series and service reconfiguration that focuses treatment much more on those with problem opioid use. The primary use of buprenorphine by treatment entrants has persisted since 2002. The proportion of individuals presenting to treatment with primary heroin use have fallen dramatically since 2001, to fewer than 5 % of the total opioid-using group in 2014. There is some evidence of an increase in ‘other’ opioids being reported between 2004 and 2013, to around 30 % of all primary opioid presentations, but with a sharp drop in 2014. Other opioids reported include a broad range of codeine, oxycodone, fentanyl and tramadol, although individually all are at levels comparable to heroin, i.e. less than 5 %.
Opioid substitution treatment Trends in the numbers of clients in OST in Finland have increased in the past 15 years to a peak of 3 000 clients in 2014 (Figure A.3.1). Based on the most recent prevalence estimates, this would suggest that between 20 % and 23 % of Finnish opioid users were
(8) Anonymous and voluntary finger prick blood sampling linked with a risk behaviour questionnaire. Participation was an option offered to all clients entering needle exchange during the period of 1.3.2014-31.6.2014.
56

engaged in OST in 2014. Almost two thirds (62 %) of those on OST in 2011 were on buprenorphine-based therapy (Selin et al., 2015). However, in the same year, fewer than 3 % of prisoners were on OST, a trend which has persisted (9). Figure A.3.1: Trends in the numbers of clients in OST, 2003-2012 (source: National Focal point report to the EMCDDA through Standard Table 24)
Finland uses CRC methods to estimate POU, but differs from other European countries with regard to the data sources it uses to produce its CRC estimate. Therefore, the treatment coverage estimate of approximately 20 % is not likely to accurately reflect the scale of treatment coverage among opioid users (i.e. those on OST).
Injecting equipment provision The IEP coverage in the community is estimated to be 100 %. To date, there are still no IEP facilities available within Finnish prisons. In recent years, the number of clients using the NSP at community facilities has stabilised at between 11 000 and 14 000.
Drug-induced deaths: overall In Finland, the number of DIDs rose from 126 in 2005 to 176 in 2014, an increase of 40 % (Figure A.3.2). By era, DIDs averaged 150 per annum between 2005 and 2009, rising to almost 190 per annum in the most recent five-year period for which data are available (2010-2014). A visual inspection of the data suggests that the overall number of DIDs increased steadily over the time series to a peak in 2012, with decreases observed in the following two years. However, it is too early to confirm if the recent decline represents definitive epidemiological evidence of a falling trend. Figure A.3.2: Crude numbers of annual drug-induced deaths recorded in Finland, 2005-2014
(9) Martta Forsell, personal communication.
0
1000
2000
3000
4000
5000
6000
7000
2003 2004 2005 2006 2007 2008 2009 2010 2011 2012
57

The overall proportion of DIDs in Finland accounted for by males has remained relatively stable, at between 74 % and 81 % across the time series. The average (mean) age of those affected has also remained relatively stable: 38.2 years between 2005 and 2009, and 37.8 years between 2010 and 2014. In comparison, data from the Special Registry indicate that the mean age of DIDs is rising in line with other European countries. The differences between the SMR and GMR mean age trends are likely to be explained by the inclusion in the GMR data of older adult deaths coded as ‘drug poisoning’ but with no history of drug misuse.
Drug-induced deaths: toxicology The number of deaths with opioids recorded in the toxicology increased from 100 in 2005 to 146 in 2014, an increase of 46 % (Figure A.3.2). Opioid-related DIDs averaged 125 per annum between 2005 and 2009, rising to over 150 per annum in the most recent five-year period for which data are available (2010-2014). A visual inspection of the data shows patterns similar to those for the overall number of DIDs. Parallel patterns are perhaps to be expected given that opioid-related DIDs account for over 80 % of all DIDs in Finland.
Overall, the majority (over 80 %) of DID cases involve multiple drugs, with few attributed to poisoning as a result of consumption of a single drug (10).There has been little change in the trend of polydrug involvement in DIDs in Finland over time, with multiple drugs recorded for between 81 % and 92 % of all cases between 2008 and 2014.
Summary
The number of DIDs recorded in Finland increased steadily between 2005 and 2014, although early indications suggest that this rising trend peaked in 2012. Each of the different data sources on DIDs in Finland broadly shows an upwards trend across the time series with minor variations, which suggests that the increase is not an artefact of data recording. The absence of robust prevalence data on problem drug use, in particular opioid use, limits the ability to draw any meaningful conclusions as regards the drivers of this increase, for example whether the increase in DIDs reflects an increase in the number of individuals using drugs or is due to an increased risk of DID among this population. However, increases in the number of opioid-related DIDs and in clients engaged in OST could point towards an overall increase in prevalence.
(10) Pirkko Krikku, Forensic toxicologist, Finland National Institute for Health and Welfare, personal communication, 30 August 2016.
58
References
Forsell, M. and Nurmi, T. (2013), Päihdehuollon huumeasiakkaat 2012 (Tilastoraportti 21/2013) [Substance use treatment customers 2012 (Statistical report)], Terveyden ja hyvinvoinnin laitos, Helsinki.
Ollgren, J., Forsell, M., Varjonen, V., Alho, H., Brummer-Korvenkontio, H., Kainulainen, H., Karjalainen, K. et al. (2014), Amfetamiinien ja opioidien ongelmakäytön yleisyys Suomessa 2012 [Prevalence of amphetamine and opioid misuse in Finland in 2012], Terveyden ja hyvinvoinnin laitos, Helsinki.
Selin, J., Perala, R., Stenius, K., Partanen, A., Rosenqvist, P. and Alho, H. (2015), ‘Opioid substitution treatment in Finland and other Nordic countries: established treatment, varying practices’, Nordic Studies on Alcohol and Drugs 32, pp. 311-324.
59
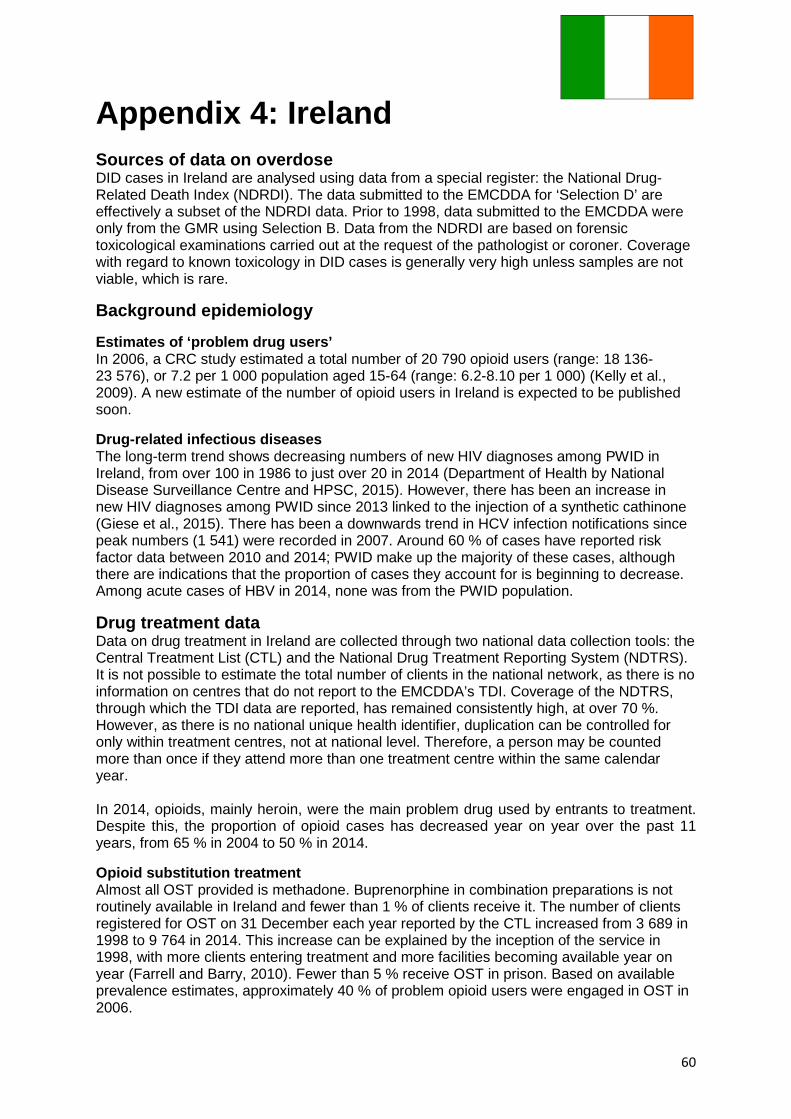
Appendix 4: Ireland Sources of data on overdose DID cases in Ireland are analysed using data from a special register: the National Drug-Related Death Index (NDRDI). The data submitted to the EMCDDA for ‘Selection D’ are effectively a subset of the NDRDI data. Prior to 1998, data submitted to the EMCDDA were only from the GMR using Selection B. Data from the NDRDI are based on forensic toxicological examinations carried out at the request of the pathologist or coroner. Coverage with regard to known toxicology in DID cases is generally very high unless samples are not viable, which is rare.
Background epidemiology
Estimates of ‘problem drug users’ In 2006, a CRC study estimated a total number of 20 790 opioid users (range: 18 136-23 576), or 7.2 per 1 000 population aged 15-64 (range: 6.2-8.10 per 1 000) (Kelly et al., 2009). A new estimate of the number of opioid users in Ireland is expected to be published soon.
Drug-related infectious diseases The long-term trend shows decreasing numbers of new HIV diagnoses among PWID in Ireland, from over 100 in 1986 to just over 20 in 2014 (Department of Health by National Disease Surveillance Centre and HPSC, 2015). However, there has been an increase in new HIV diagnoses among PWID since 2013 linked to the injection of a synthetic cathinone (Giese et al., 2015). There has been a downwards trend in HCV infection notifications since peak numbers (1 541) were recorded in 2007. Around 60 % of cases have reported risk factor data between 2010 and 2014; PWID make up the majority of these cases, although there are indications that the proportion of cases they account for is beginning to decrease. Among acute cases of HBV in 2014, none was from the PWID population.
Drug treatment data Data on drug treatment in Ireland are collected through two national data collection tools: the Central Treatment List (CTL) and the National Drug Treatment Reporting System (NDTRS). It is not possible to estimate the total number of clients in the national network, as there is no information on centres that do not report to the EMCDDA’s TDI. Coverage of the NDTRS, through which the TDI data are reported, has remained consistently high, at over 70 %. However, as there is no national unique health identifier, duplication can be controlled for only within treatment centres, not at national level. Therefore, a person may be counted more than once if they attend more than one treatment centre within the same calendar year. In 2014, opioids, mainly heroin, were the main problem drug used by entrants to treatment. Despite this, the proportion of opioid cases has decreased year on year over the past 11 years, from 65 % in 2004 to 50 % in 2014.
Opioid substitution treatment Almost all OST provided is methadone. Buprenorphine in combination preparations is not routinely available in Ireland and fewer than 1 % of clients receive it. The number of clients registered for OST on 31 December each year reported by the CTL increased from 3 689 in 1998 to 9 764 in 2014. This increase can be explained by the inception of the service in 1998, with more clients entering treatment and more facilities becoming available year on year (Farrell and Barry, 2010). Fewer than 5 % receive OST in prison. Based on available prevalence estimates, approximately 40 % of problem opioid users were engaged in OST in 2006.
60
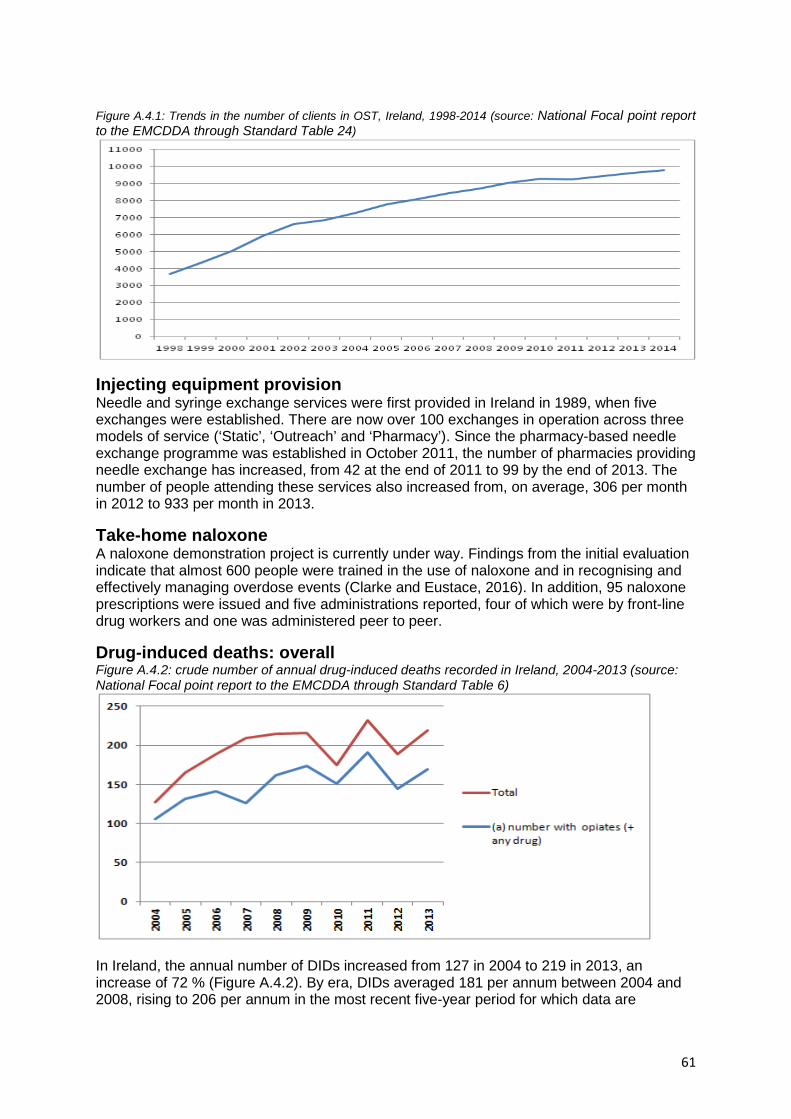
Figure A.4.1: Trends in the number of clients in OST, Ireland, 1998-2014 (source: National Focal point report to the EMCDDA through Standard Table 24)
Injecting equipment provision Needle and syringe exchange services were first provided in Ireland in 1989, when five exchanges were established. There are now over 100 exchanges in operation across three models of service (‘Static’, ‘Outreach’ and ‘Pharmacy’). Since the pharmacy-based needle exchange programme was established in October 2011, the number of pharmacies providing needle exchange has increased, from 42 at the end of 2011 to 99 by the end of 2013. The number of people attending these services also increased from, on average, 306 per month in 2012 to 933 per month in 2013.
Take-home naloxone A naloxone demonstration project is currently under way. Findings from the initial evaluation indicate that almost 600 people were trained in the use of naloxone and in recognising and effectively managing overdose events (Clarke and Eustace, 2016). In addition, 95 naloxone prescriptions were issued and five administrations reported, four of which were by front-line drug workers and one was administered peer to peer.
Drug-induced deaths: overall Figure A.4.2: crude number of annual drug-induced deaths recorded in Ireland, 2004-2013 (source: National Focal point report to the EMCDDA through Standard Table 6)
In Ireland, the annual number of DIDs increased from 127 in 2004 to 219 in 2013, an increase of 72 % (Figure A.4.2). By era, DIDs averaged 181 per annum between 2004 and 2008, rising to 206 per annum in the most recent five-year period for which data are
61

available (2009-2013). A visual inspection of the data suggests that the overall numbers of DIDs increased consistently between 2004 and 2009, but have fluctuated since then. The overall proportion of DIDs in Ireland accounted for by males has remained relatively stable, at between 73 % and 81 % across the time series. The average (mean) age of those affected by DID in Ireland has increased over time, from 32.6 years between 2004 and 2008 to 35.5 years between 2009 and 2013. This ageing cohort effect is reflected in between-era differences in DIDs across all age groups, with significant increases and decreases among all categories (under 25 years, p = 0.01; under 35, p = 0.01; over 35, p = 0.01; over 45, p = 0.04; and over 55, p < 0.01). NDRDI data highlight that, in females, the age (median age range: 42-49 years) at poisoning-related death is, on average, consistently higher than in males (median age range: 34-38 years) across the time series.
Drug-induced deaths: toxicology Toxicology data are available for between 78 and 96 % of DIDs over the time series. Where known, the number of deaths with opioids recorded in the toxicology increased from 121 in 2004 to 187 in 2013, an increase of 55 %. Opioid-related DIDs averaged 133 per annum between 2004 and 2008, rising to over 160 per annum in the most recent five-year period for which data are available (2009-2013). A visual inspection of the data shows patterns for opioid-related deaths similar to the overall number of DIDs; the overall numbers have increased steadily over the time series to 2009, with fluctuations observed in the following years. Parallel patterns are perhaps to be expected given that opioid-related DIDs account for over 85 % of all DIDs with a known toxicology in Ireland. According to NDRDI data, the majority of poisoning deaths between 2004 and 2013 involved more than one drug, with an increasing trend for polydrug-related poisoning deaths evident across the time series. Data from the NDRDI also show that methadone (alone or with another drug) continues to be the opioid most commonly implicated in poisoning deaths. In 2013, methadone was implicated in 93 deaths, accounting for one in four (24 %) of all deaths recorded in the NDRDI database that year. The overall trend indicates a rise in methadone involvement in DIDs, from 15 % in 2004 to a peak of 31 % in 2011, when there were 119 deaths in which methadone was implicated. Between eras, polydrug use involvement in methadone-implicated deaths was significantly higher in the most recent five-year period for which data are available (2009-2013; 89.1 %) than in an earlier period (2004-2008; 76.1 %) (p < 0.01). It is also interesting to note that the proportion of cases in which methadone was implicated and in which methadone was being prescribed at time of death was highest between 2006 and 2009 (47-59 %), but has decreased in recent years, suggesting that diversion may be increasing. In 2013, heroin was implicated in 86 deaths, accounting for one in five (22 %) of all deaths that year. This represents the first increase in heroin-related deaths since 2009. Again, heroin was rarely the only drug involved, with polydrug use a prominent feature of poisonings in which heroin was implicated between 2004 and 2013. Benzodiazepines were the main drugs implicated along with heroin.
Suicides The total number of suicides recorded in Ireland has fallen in recent years, from a peak of 554 in 2011 to 451 in 2015. Taking account of population size, the rate of suicide per 100 000 people has decreased markedly across the time series, from a peak of 13.5 per 100 000 in 2001 to 9.7 per 100 000 in 2015.
Purity No routinely collected data series on drug purity levels in Ireland exists. However, specific studies have been undertaken to investigate drug purity levels, notably the work of Boyle et al. (2014). In the analysis undertaken by Boyle et al., in a sample of 239 diamorphine
62

(heroin) cases, the mean purity was 47 % in 2010, 30 % in 2011 and 24 % in the first three months of 2012. The study revealed ‘a general decline of diamorphine purity over the time period, with the 2012 average being nearly half the average purity obtained for 2010’.
Summary The number of DIDs in Ireland increased steadily between 2004 and 2009, but has fluctuated in the years since. The absence of recent and consistent prevalence data on PDU, in particular opioid use, limits the ability to draw any meaningful conclusions as regards the drivers of these trends, for example whether the increase in DID reflects an increase in the number of individuals using drugs or is due to an increased risk of DID among this population. Basic statistical testing confirms evidence of an ageing cohort, with significant decreases in the proportion of DIDs in younger age groups (i.e. under 35 years) and increases in the proportion of older drug users (i.e. aged 35 years and above). This evidence of an ageing cohort is further confirmed by BBV infection and treatment data. The presence of heroin in toxicological and treatment data has diminished since 2009, coinciding with the heroin drought of 2010 and its associated impact on purity and availability. However, there are signs that the legacy of this drought is weakening, with the most recent data suggesting that the involvement of heroin in DIDs has risen for the first time since 2009 after the period of declining involvement. In contrast, the involvement of methadone in DIDs has increased in parallel with an increase in the number of individuals engaged with OST. Polydrug use also remains a key factor, with opioids rarely implicated on their own. Although absolute numbers of opioid-related DIDs have increased across the time series, the overall proportion they account for has decreased. This, coupled with increasing numbers in OST and decreases in the numbers of young people accessing treatment, suggests that the prevalence of POU may not have actually increased in recent years and that increasing DID rates may indeed reflect the increased risk among certain populations, e.g. older drug users, especially females.
References Boyle, M., Carroll, L., Clarke, K., Clarke, P., Coyle, H. J., English, H., Goff, M., et al. (2014), ‘What’s the deal? Trends in Irish street-level heroin and cocaine 2010-2012’, Drug Testing and Analysis 6, pp. 953-958 (available at http://www.drugsandalcohol.ie/21608/). Clarke, A. and Eustace, A. (2016), Evaluation of the HSE Naloxone Demonstration Project, Health Service Executive, Dublin (available at http://www.hse.ie/eng/services/publications/SocialInclusion/addiction/Naloxonedemoproject.pdf). Department of Health by National Disease Surveillance Centre and HPSC (2015), ‘Drug-related infectious diseases among drug users’, unpublished. Farrell, M. and Barry, J. (2010), The introduction of the opioid treatment protocol, Health Service Executive, Dublin (available at www.drugsandalcohol.ie/14458/). Giese, C., Igoe, D., Gibbons, Z., Hurley, C., Stokes, S., McNamara, S. Ennis, O., et al. (on behalf of the outbreak control team) (2015), ‘Injection of new psychoactive substance snow blow associated with recently acquired HIV infections among homeless people who inject drugs in Dublin, Ireland, 2015’, Euro Surveillance doi:10.2807/1560-7917.ES.2015.20.40.30036. Kelly, A., Teljeur, C. and Carvalho, M. (2009), Prevalence of opiate use in Ireland 2006: A 3-souce capture recapture study, Stationery Office, Dublin.
63

Appendix 5: Norway Sources of data on overdose Data are sourced from the GMR and compiled by Statistics Norway. The GMR includes only Norwegian residents; however, asylum seekers with a six-month residence permit can be included. Double counting is controlled for and there are no estimated levels of under-reporting in the dataset. Toxicological information is sourced from the Special Mortality Registry (SMR). This includes only substances that are listed as a cause of death. The autopsy rate for DRDs is consistently high over time, hence reported figures are, in the majority cases, based on toxicological confirmations of the DRDs.
Background epidemiology
Estimates of ‘problem drug users’ The most recent available estimates obtained by means of a treatment multiplier method suggest that around 9 015 high-risk opioid users (HROUs) were not in OST (95 % CI 6 708-13 977) in 2013 (Waal et al., 2015), corresponding to a rate of 2.68 per 1 000 inhabitants aged 15-64 years (95 % CI 1.99-4.15 per 1 000 inhabitants). In the same year, there were approximately 7 000 clients in OST. However, it is not possible to combine these estimates to produce an overall number of problem opioid users because of inconsistencies in the methodologies between the two estimates. The estimates of the numbers of PWID are also based on a mortality multiplier method. It was estimated that, in 2013, there were 8 145 PWID (95 % CI 6 984-9 842) in Norway, which is a slight decrease from the 2012 figure of 8 400 (95 % CI 7 200-10 100). The number of PWID in Norway increased until 2001, after which it declined until 2003 and thereafter appeared to remain stable until 2008 (Figure A.5.1). The rate of injecting drug use in Norway decreased from 3.22 per 1 000 population in 2008 to 2.42 per 1 000 in 2012. The PWID population in Norway comprises mainly people who inject opioids and methamphetamine.
Drug-related infectious diseases
Few BBV prevalence studies among PWID in Norway have been carried out to date. In Oslo, annual prevalence studies were carried out in the 2002-2012 period among PWID attending low-threshold services and injection rooms. The 2012 survey showed that 62 % of PWID tested had had a hepatitis A infection or had been vaccinated against the disease, 35 % had had an HBV infection and 64 % had had an HCV infection.
Among registered OST patients, the annual status survey for 2014 shows that 62 % of the clients whose status was known were HCV antibody positive, similar to 2013 (63 %) (Waal et al., 2015). This is lower than expected and is likely to be explained by the high proportion of cases with an unknown status (16 %). Furthermore, 2.4 % of the clients whose status was known were HIV antibody positive. Of the 249 new cases of HIV infection reported in 2014, only seven cases occurred among PWID. The number of HIV cases among PWID has remained at a stable and low level for many years.
Drug treatment data
The data source for treatment figures is the National Patient Registry (NPR). In 2014, the majority (43 %) of those in treatment had problems related to the use of opioids as their primary diagnosis. This is mainly attributed to the high proportion of OST patients who engaged in treatment over a long period.
64
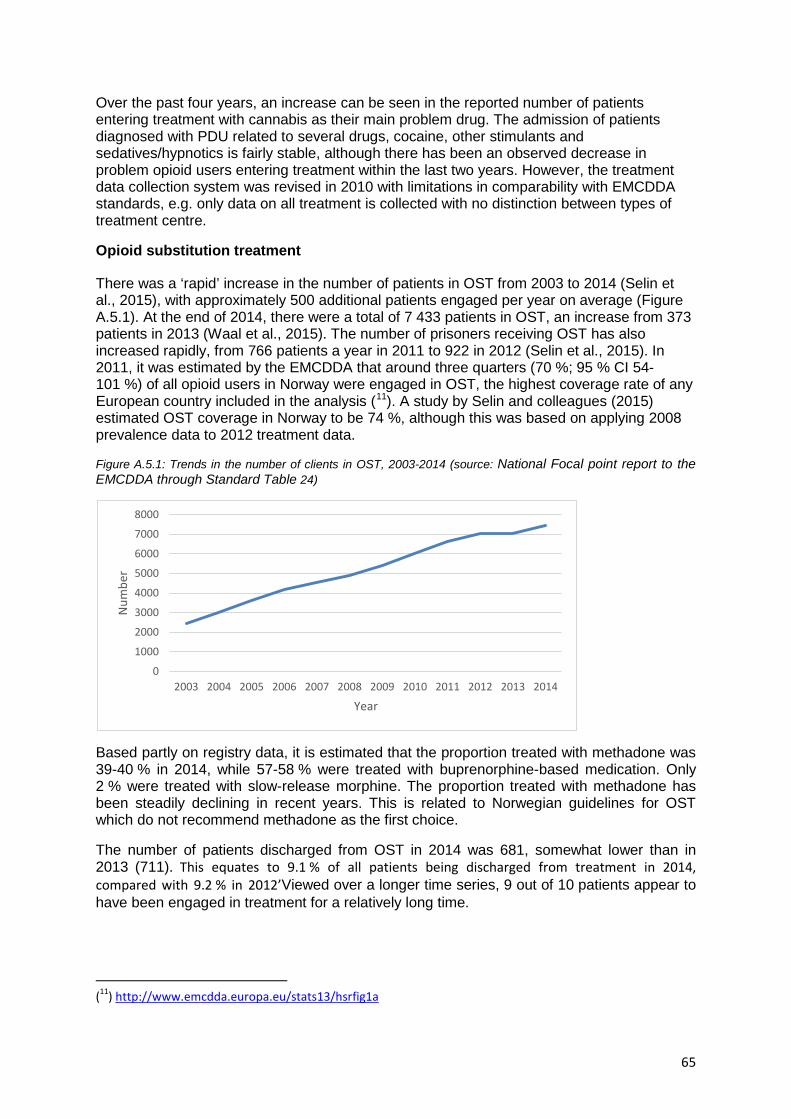
Over the past four years, an increase can be seen in the reported number of patients entering treatment with cannabis as their main problem drug. The admission of patients diagnosed with PDU related to several drugs, cocaine, other stimulants and sedatives/hypnotics is fairly stable, although there has been an observed decrease in problem opioid users entering treatment within the last two years. However, the treatment data collection system was revised in 2010 with limitations in comparability with EMCDDA standards, e.g. only data on all treatment is collected with no distinction between types of treatment centre.
Opioid substitution treatment
There was a ‘rapid’ increase in the number of patients in OST from 2003 to 2014 (Selin et al., 2015), with approximately 500 additional patients engaged per year on average (Figure A.5.1). At the end of 2014, there were a total of 7 433 patients in OST, an increase from 373 patients in 2013 (Waal et al., 2015). The number of prisoners receiving OST has also increased rapidly, from 766 patients a year in 2011 to 922 in 2012 (Selin et al., 2015). In 2011, it was estimated by the EMCDDA that around three quarters (70 %; 95 % CI 54-101 %) of all opioid users in Norway were engaged in OST, the highest coverage rate of any European country included in the analysis (11). A study by Selin and colleagues (2015) estimated OST coverage in Norway to be 74 %, although this was based on applying 2008 prevalence data to 2012 treatment data.
Figure A.5.1: Trends in the number of clients in OST, 2003-2014 (source: National Focal point report to the EMCDDA through Standard Table 24)
Based partly on registry data, it is estimated that the proportion treated with methadone was 39-40 % in 2014, while 57-58 % were treated with buprenorphine-based medication. Only 2 % were treated with slow-release morphine. The proportion treated with methadone has been steadily declining in recent years. This is related to Norwegian guidelines for OST which do not recommend methadone as the first choice.
The number of patients discharged from OST in 2014 was 681, somewhat lower than in 2013 (711). This equates to 9.1 % of all patients being discharged from treatment in 2014, compared with 9.2 % in 2012’Viewed over a longer time series, 9 out of 10 patients appear to have been engaged in treatment for a relatively long time.
(11) http://www.emcdda.europa.eu/stats13/hsrfig1a
0
1000
2000
3000
4000
5000
6000
7000
8000
2003 2004 2005 2006 2007 2008 2009 2010 2011 2012 2013 2014
Num
ber
Year
65
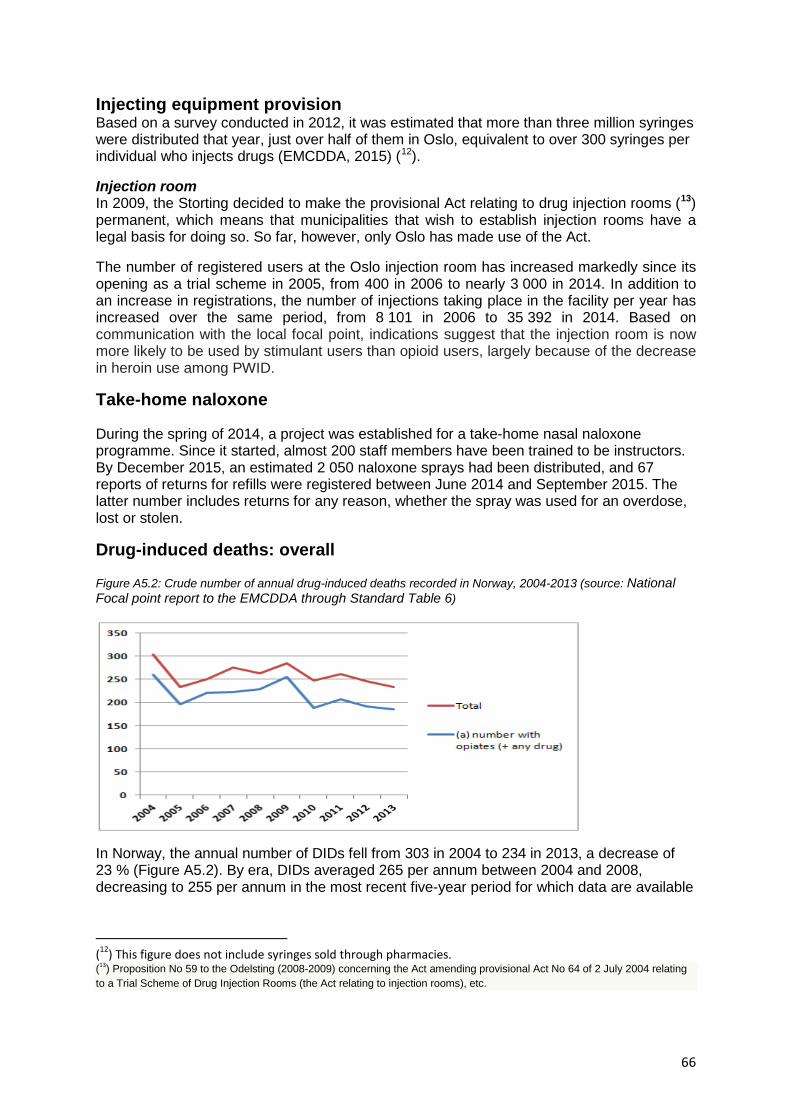
Injecting equipment provision Based on a survey conducted in 2012, it was estimated that more than three million syringes were distributed that year, just over half of them in Oslo, equivalent to over 300 syringes per individual who injects drugs (EMCDDA, 2015) (12).
Injection room In 2009, the Storting decided to make the provisional Act relating to drug injection rooms (13) permanent, which means that municipalities that wish to establish injection rooms have a legal basis for doing so. So far, however, only Oslo has made use of the Act.
The number of registered users at the Oslo injection room has increased markedly since its opening as a trial scheme in 2005, from 400 in 2006 to nearly 3 000 in 2014. In addition to an increase in registrations, the number of injections taking place in the facility per year has increased over the same period, from 8 101 in 2006 to 35 392 in 2014. Based on communication with the local focal point, indications suggest that the injection room is now more likely to be used by stimulant users than opioid users, largely because of the decrease in heroin use among PWID.
Take-home naloxone
During the spring of 2014, a project was established for a take-home nasal naloxone programme. Since it started, almost 200 staff members have been trained to be instructors. By December 2015, an estimated 2 050 naloxone sprays had been distributed, and 67 reports of returns for refills were registered between June 2014 and September 2015. The latter number includes returns for any reason, whether the spray was used for an overdose, lost or stolen.
Drug-induced deaths: overall
Figure A5.2: Crude number of annual drug-induced deaths recorded in Norway, 2004-2013 (source: National Focal point report to the EMCDDA through Standard Table 6)
In Norway, the annual number of DIDs fell from 303 in 2004 to 234 in 2013, a decrease of 23 % (Figure A5.2). By era, DIDs averaged 265 per annum between 2004 and 2008, decreasing to 255 per annum in the most recent five-year period for which data are available
(12) This figure does not include syringes sold through pharmacies. (13) Proposition No 59 to the Odelsting (2008-2009) concerning the Act amending provisional Act No 64 of 2 July 2004 relating to a Trial Scheme of Drug Injection Rooms (the Act relating to injection rooms), etc.
66
(2009-2013). A visual inspection of the data suggests that the overall numbers of DIDs have been decreasing since 2009 and are at their lowest level since 2005.
The overall proportion of DIDs in Norway accounted for by males has remained relatively stable, at between 73 % and 80 % across the time series. The average (mean) age of those affected has increased over the time series, from 37.5 years between 2004 and 2008 to 41.0 years between 2009 and 2013.
Between-era differences in DIDs across different age groups also show evidence of change, with a significant decline in the proportion of cases involving those aged under 25 years (2004-2008: 14 %; 2009-2013: 10 %; p < 0.01) and a significant increase in the proportion of cases involving those aged over 45 years (2004-2008: 25 %; 2009-2013: 39 %; p < 0.01).
Drug-induced deaths: toxicology
The number of deaths with opioids recorded in toxicology fell from 260 in 2004 to 186 in 2013, a decrease of 28 %. Opioid-related DIDs averaged 226 per annum between 2004 and 2008, falling to 206 per annum in the most recent five-year period for which data are available (2009-2013). Indeed, when comparing the presence of opioids in DID toxicology between eras, the data show a significant drop between the 2004-2008 (85 %) and 2009-2013 (81 %) periods (p = 0.03). A visual inspection of the data shows patterns similar to those for the overall number of DIDs; the overall numbers decreased sharply between 2009 and 2010 and steadily thereafter (Figure A.5.2). Parallel patterns are perhaps to be expected given that opioid-related DIDs account for over 80 % of all DIDs in Norway.
SMR data reveal that, in 2013, although 79 % of DIDs were related to opioids, only 29 % were related to heroin alone and 22 % were related to other opioids, such as morphine/codeine, 20 % to methadone and 8 % synthetic opioids. There has been a significant reduction in the involvement of heroin in Norwegian DIDs since 2009. Other opioids such as methadone have overtaken heroin as the main intoxicant, and the proportions of methadone-related deaths have increased in recent years.
Summary The number of DIDs in Norway has been falling since 2009. The absence of robust long-term prevalence data on PDU, in particular POU, limits the ability to draw any meaningful conclusions as regards the drivers of this increase, for example whether the increase in DIDs reflects an increase in the number of individuals using drugs or is due to an increased risk of DID among this population. However, decreases in the number of opioid-related DIDs and increases in clients engaged in OST could point towards a positive impact of treatment engagement on mortality. Indeed, available evidence suggests that OST coverage in Norway is high (> 70 %) and that heroin-related treatment presentations have been decreasing in recent years, which suggests that the majority of those available and motivated to engage have been accessed. Moreover, treatment retention is high, which is also likely to contribute to reducing mortality.
For those unable to access treatment, needle/syringe exchange is established, an injection room is in operation in the largest city (Oslo) and THN is available nationwide. In addition to a decrease in the number of syringes distributed, local intelligence suggests that the injection room is more likely to be used by stimulant injectors than it was when it was first opened (at which time it was used predominantly by opioid users), thus further contributing to an overall picture of decreasing heroin injecting in Norway. The THN programme has been able to supply 9-20 times as many naloxone kits as there are opioid-related deaths, which, for Norway, is around 1 500-2 000 based on the lower estimate. Both of these interventions are also likely to be contributing to maintaining the decline in drug-related mortality rates experienced in Norway since 2009.
67
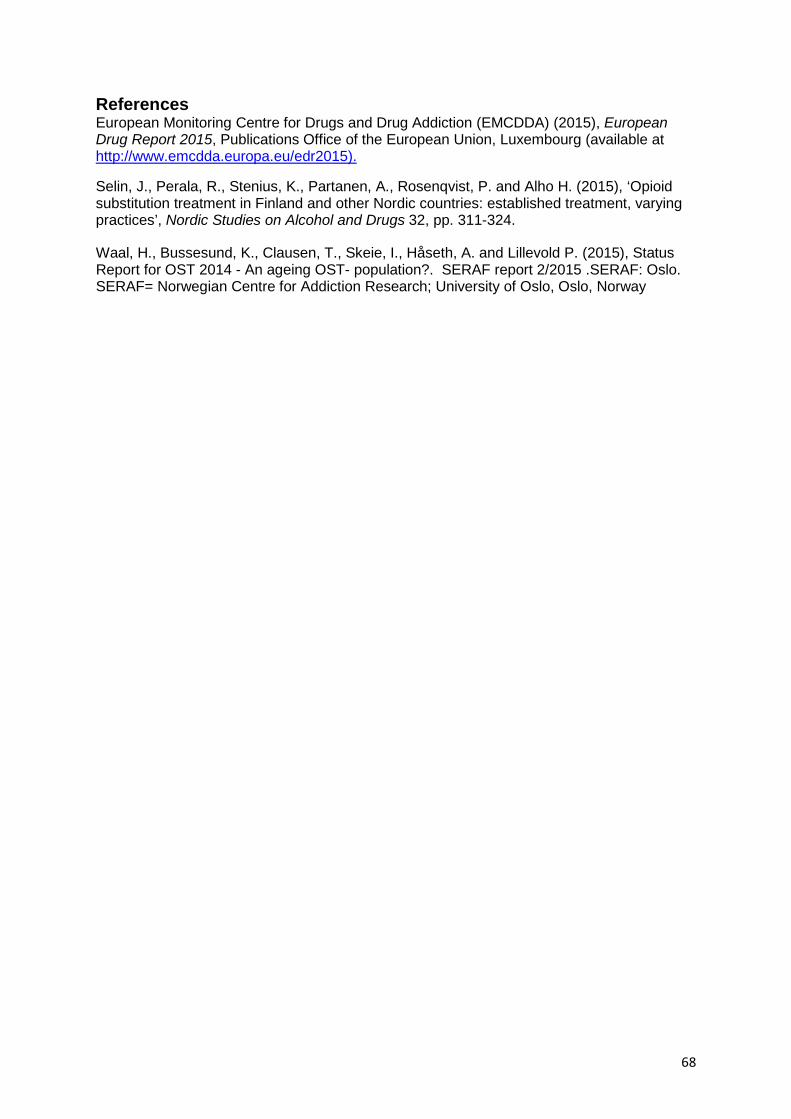
References European Monitoring Centre for Drugs and Drug Addiction (EMCDDA) (2015), European Drug Report 2015, Publications Office of the European Union, Luxembourg (available at http://www.emcdda.europa.eu/edr2015).
Selin, J., Perala, R., Stenius, K., Partanen, A., Rosenqvist, P. and Alho H. (2015), ‘Opioid substitution treatment in Finland and other Nordic countries: established treatment, varying practices’, Nordic Studies on Alcohol and Drugs 32, pp. 311-324.
Waal, H., Bussesund, K., Clausen, T., Skeie, I., Håseth, A. and Lillevold P. (2015), Status Report for OST 2014 - An ageing OST- population?. SERAF report 2/2015 .SERAF: Oslo. SERAF= Norwegian Centre for Addiction Research; University of Oslo, Oslo, Norway
68

Appendix 6: Scotland Sources of data on overdose DRD data for Scotland are compiled annually by the National Records of Scotland (NRS). The NRS holds details of all deaths registered in Scotland. The relevant questionnaire was revised for 2008, in order to collect more complete information about the substances present in the body; therefore, the figures for 2007 and earlier are not directly comparable with the figures for 2008 onwards on the new standard basis. For purposes of comparison with other European countries in this project, the NRS have provided a DRD dataset which complies with the EMCDDA criteria for its GMR. Scotland also hosts a National Drug-Related Death Database (NDRDD), which is coordinated, analysed and published by the ISD. The NDRDD effectively contains a subset of the NRS figures, but collects a much larger dataset covering characteristics of the deceased and their individual risk factors and behaviours.
Background epidemiology
Estimates of ‘problem drug users’ Using CRC methodology, the estimated number of individuals with problem drug use (14) in Scotland in 2012/2013, aged 15 to 64 years, is 61 500 (95 % CI 59 900-63 300) (ISD, 2014). The equivalent estimate for 2009/2010 is 59 600 (95 % CI 58 300-61 000). Although injecting prevalence was not reported in the 2014 publication, an estimate was provided in a previous prevalence report based on 2006 data (Hay et al., 2009). In 2006, 24 000 people are estimated to have injected opioids and/or benzodiazepines. Overstall et al. (2014) reported a somewhat lower figure (15 000) for 2009 using log-linear modelling methodology.
Drug-related infectious diseases The prevalence of HCV among PWID has been stable for the past few years, changing from 53 % to 58 % between 2008 and 2016 (PHE et al., 2016). The number of new cases of HIV among PWID remained relatively stable between 2005 and 2014, until a significant spike in 2015 associated with an outbreak in the Glasgow City area increased prevalence rates to almost 2 %.
Drug treatment data The Scottish Drug Misuse Database (SDMD) was set up in 1990 to collect information about people with PDU, based on data obtained when individuals first made contact with services providing tier-3 and -4 interventions (i.e. structured community and residential treatment) or reinitiated contact following a gap of at least six months since last attendance. Services contributing to the SDMD include specialist drug services and some medical services. In 2014/2015, among the 8 692 individuals providing information on recent ‘illicit’ drug use (including novel psychoactive substances/legal highs), heroin (3 955; 46 %) was the drug for which people most commonly sought treatment, followed by cannabis (1 762; 20 %) and diazepam (868; 10 %). The percentage of individuals reporting heroin as their main drug has decreased from 64 % in 2006/2007. The percentage of people under 25 years reporting recent heroin use decreased from 58 % (1 592/2 729) in 2006/2007 to 23 % (362/1 547) in 2014/2015. A general downwards trend in the percentage of individuals reporting current injecting since 2006/2007 (28 %) was also observed.
(14) Problem use of opioids and/or benzodiazepines. It is not possible to define how many individuals used opioids, benzodiazepines or both.
69

Opioid substitution treatment In 2014/2015, for the fourth successive year, there was a decrease in the dispensing of OST drugs (including methadone). However, the proportion of OST prescriptions that were accounted for by Suboxone has increased year on year from 1% 2007/2008 to 14% in 2015/2016. The declining number of items dispensed as an OST (including methadone hydrochloride) does not necessarily represent a decline in the number of individuals receiving OST. Indeed, this may represent a change in practice (e.g. an increase in take-home prescriptions for OST), a change in the demographic presenting to treatment service (e.g. fewer new opioid users who require more intensive one-to-one appointments when commencing OST) or a change in policy (e.g. a greater focus on abstinence-based recovery, which therefore affects treatment demand and discharge strategies). The number of individuals prescribed specific drugs can be estimated using the Community Health Index (CHI) numbers captured on prescriptions. Because of sub-optimal CHI capture rates, the estimates below should be regarded as a minimum count of individuals prescribed methadone hydrochloride 1 mg/ml solution within Scotland. In 2014/2015, methadone 1 mg/ml solution was prescribed at least once to 25 170 individuals (based on prescriptions with a valid CHI).The number of individuals prescribed methadone 1 mg/ml solution appears to have reduced from 26 202 individuals in 2011/2012; however, this change should be treated with caution in light of the abovementioned caveats. Based on available prevalence estimates, crude estimates suggest that a minimum of around 40 % of PDUs in Scotland are engaged in OST, a rate which appears to have remained relatively unchanged in recent years. Injecting equipment provision In 2014/2015, 328 329 attendances were reported by IEP outlets, an increase from 226 056 in 2013/2014. Approximately 4.4 million needles and syringes were reported to have been distributed by participating outlets in 2014/2015, an increase from 2013/2014 (3.8 million). Nationally, it was estimated that an average of 71 needles and syringes were distributed per problem drug user in 2014/2015. The number of outlets distributing injecting paraphernalia has increased over time, from just over 250 in 2009/2010 to almost 300 in 2014/2015.
Naloxone A national THN programme was launched in 2011 following successful pilots in three local areas. In total, 29 185 THN kits were issued by the national naloxone programme from 1 April 2011 to 31 March 2016. Because of carry-over of THN kits from previous years, the availability of naloxone in Scotland is likely to have exceeded 20 times the number of opioid-related deaths (i.e. 8 000 per annum) in 2013/2014, 2014/2015 and 2015/2016. Scotland’s national naloxone programme has been associated with a 36 % reduction in the proportion of opioid-related deaths in the four weeks following prison release, its primary outcome indicator (Bird et al., 2016).
Drug-induced deaths: overall In Scotland, the number of annual DIDs increased from 415 in 2006 to 637 in 2015, an increase of 53 % (Figure A.6.1). Since 2000, the number of DIDs has increased by 99 %. By era, DIDs averaged 488 per annum between 2005 and 2009, rising to 567 per annum in the most recent five-year period for which data are available (2011-2016). A visual inspection of the data suggests that the overall number of DIDs increased steadily until 2008, fluctuated over the following five years, before increasing again in the last five years. The overall trend is upwards and the most recent year for which data are available represented the highest ever annual total of DIDs recorded in Scotland.
70

Figure A.6.1: Crude numbers of annual drug-induced deaths recorded in Scotland, 2000-2015 (source: National Records of Scotland, 2016)
The proportion of DIDs in Scotland accounted for by males has decreased from a peak of 86 % in 2006 to 70 % in 2015, the lowest level recorded across the time series. Female DIDs, in contrast, appear have steadily increased over time. Between-era differences in DIDs across different age groups suggest that the proportion of cases in the younger age groups is decreasing and the proportion of cases in older age groups is increasing; in particular the average numbers of DIDs among those aged 45-54 (from 64 to 124), 55-64 (from 19 to 38) and 65 years and over (from 7 to 15) doubled between 2006 and 2015. In comparison, the average number DIDs in those aged 15 to 24 years almost halved between the 2006-2010 (mean = 76) and 2011-2015 (mean = 40) periods.
Drug-induced deaths: toxicology The number of cases recorded involving only opioids decreased from 79 in 2008 to 32 in 2015, a decrease of 59 %. Opioid-only DIDs averaged 64 per annum between 2008 and 2011, falling to 42 per annum in the most recent four-year period for which data are available (2012-2015). Polydrug deaths involving opioids, however, increased from 439 to 550, an increase of 25 % (Figure A6.1). Looking more closely at specific substances, the recent spike in opioid-related deaths appears to have been driven by heroin/morphine involvement, which has notably increased for the first time since it slumped between 2008 and 2011 (Figure A.6.2). The number of deaths involving methadone appears to have levelled off, after a peak in 2011. Of the other substances recorded, particularly notable trends include the decreasing involvement of alcohol across the time series, the volatile year-to-year trend in benzodiazepine involvement and a spike in cocaine-related cases in 2015. The number of deaths involving new psychoactive substances is relatively low and such deaths are likely to also involve other substances. Figure A.6.2: Crude numbers of annual opioid-related drug-induced deaths recorded in Scotland, by drug, 2008-2015 (source: National Records of Scotland, 2016)
71

Purity At UK level, after low levels were recorded during both 2011 and 2012, heroin purity has increased over the last two years and is now higher than in 2010 (UK Focal Point on Drugs, 2015). The street-level price per gram has also increased. However, the purity-adjusted price has fallen considerably from a peak of around GBP 74 per gram in 2011 to around GBP 45 in 2014 as a result of an increase in the quality of the substance typically being sold at street level.
Summary DIDs in Scotland are at historically high levels despite the availability of OST, the widespread provision of injecting equipment and a world-leading national THN programme. Although prevalence has been fairly stable in recent years, the existing cohorts have become older and therefore more at risk of death. This ‘ageing cohort’ is evident from all data sources on drug use in Scotland, including mortality, morbidity and treatment statistics. The number of problem drug users within this ageing cohort is increasing every year, creating an ageing epidemic with regard to drug-related mortality, which is seen elsewhere in Europe but appears particularly acute in Scotland, a country for which evidence has demonstrated the population to be vulnerable to excessive death rates that are not explained by deprivation (‘the Scottish effect’); these deaths are typically caused by violence, suicide, or alcohol and drug use (McCartney et al., 2015). A further demographic feature of the Scottish data is the substantial increase in DDs among females relative to males, with over a 100 % increase observed in the past 10 years. The ageing effect is more pronounced in females than in males and may account for this trend; however, there may be other contributing factors that have yet to be identified. OST coverage has remained relatively constant in recent years, at around 40 %. It is not clear, however, which 40 % of the PDU population is engaged (i.e. whether or not it is those most at risk of DRD) and to what extent those in treatment are ‘stable’ or whether or not they are dropping in and out regularly and thus are at elevated risk of overdose and death. Recent evidence from Gao et al. (2016) suggests that methadone-specific death rates are higher in older age groups (35 years and over) than in younger clients; in the context of Scotland’s ageing population, this may have contributed to the increase in methadone-related deaths between 2010 and 2011. Scotland’s naloxone programme has been associated with a decrease in opioid-related death rates among prisoners after release. However, the overall opioid-related death rate remains high and increased sharply in 2015 with heroin involvement at its highest levels since 2008. This may be an indication that the legacy of the heroin drought is now over in Scotland, a theory that is supported by purity levels, which have been rising again in recent years. In parallel with the resurgence in heroin purity recorded in drug seizure statistics, the
72

data demonstrate a steep rise in heroin-related polydrug deaths (typically alongside benzodiazepines and alcohol).
References Bird, S. M., McAuley, A., Perry, S. and Hunter, C. (2016), ‘Effectiveness of Scotland’s National Naloxone Programme for reducing opioid-related deaths: a before (2006-10) versus after (2011-13) comparison’, Addiction 111, pp. 883-891. Gao, L., Dimitropoulou, P., Robertson, J. R., McTaggart, S., Bennie, M. and Bird, S. M. (2016), ‘Risk-factors for methadone-specific deaths in Scotland’s methadone-prescription clients between 2009 and 2013’, Drug and Alcohol Dependence 167, pp. 214-223. Hay, G., Gannon, M., Casey, J. and McKeganey, N. (2009), Estimating the national and local prevalence of problem drug misuse in Scotland, University of Glasgow, Glasgow (available at http://www.scotpho.org.uk/downloads/drugs/Prevalence_Report_%202006.pdf). Information Services Division Scotland (ISD) (2016), Estimating the national and local prevalence of problem drug use in Scotland 2012/13 Updated - 4th March 2016, ISD (available at http://www.isdscotland.org/Health-Topics/Drugs-and-Alcohol-Misuse/Publications/2014-10-28/2014-10-28-Drug-Prevalence-Report.pdf). McCartney, G., Russ, T. C., Walsh, D., Lewsey, J., Smith, M., Smith, G. D. et al. (2015), ‘Explaining the excess mortality in Scotland compared with England: pooling of 18 cohort studies’, Journal of Epidemiology & Community Health 69, pp. 20-27. National Records of Scotland (NRS) (2016), Drug-Related Deaths in Scotland 2008-2015 based on EMCDDA definition. Unpublished. Overstall, A., King, R., Bird, S. M., Hay, G. and Hutchinson, S. J. (2014), ‘Incomplete contingency tables with censored cells with application to estimating the number of people who inject drugs in Scotland’, Statistics in Medicine 33, pp. 1564-1579. Public Health England (PHE), Health Protection Scotland (HPS), Public Health Wales (PHW) and Public Health Agency Northern Ireland (PHANI) (2016), Shooting up: Infections among people who inject drugs in the UK, 2015. An update: November 2016, Public Health England, London. UK Focal Point on Drugs (2015), United Kingdom drug situation: Focal Point Annual report 2015, UK Focal Point on Drugs, London (available at http://www.nta.nhs.uk/uploads/2015-focal-point-annual-report.pdf).
73

Appendix 7: Sweden Sources of data on overdose Data are sourced from the Cause of Death Register (CDR). It is estimated that 99 % of all deaths occurring in Sweden are included in the CDR (Stenbacka et al., 2010). In addition to the CDR, there is an SMR called ‘Toxreg’, comprising all deaths where illicit drugs are found at forensic toxicological examination; virtually all forensic examinations include toxicological examination (approximately 5 000 per year).
Background epidemiology
Estimates of ‘problem drug users’ The latest estimate of PDU, based on data from 2007, was published in 2010 (Statens Folkhälsoinstitut, 2011) and suggests that there are almost 30 000 individuals with ‘problematic use of drugs’ in Sweden. This figure includes users of opioids and other drugs but with no breakdown as regards the size of each drug sub-group. In addition, it is estimated that there were around 8 000 PWID in Sweden in 2011 (NBHW, 2013).
Drug-related infectious diseases In various studies conducted during the last 15 years, HCV prevalence among PWID in Sweden has been reported to be between 60 % and 80 %. HIV prevalence among PWID continues to remain at very low levels, with only four domestic cases being reported in 2014 and two in 2013. Among PWID, 38 cases of HBV infection were reported in 2014. In 2014, a review of the historical data reported by Sweden to the EMCDDA in Tables 1-4 of Standard Table9 (infectious diseases) and Standard Table 10 (syringe availability) concluded that these data could not provide a representative picture of the national situation for PWID in Sweden, nor did they allow any comparison between the years; therefore, any interpretation of the data must be undertaken with caution.
Drug treatment data Swedish TDI data are created through the collection of data from three separate information systems: (1) the national patient registry (outpatient and inpatient treatment services); (2) DOK (homes providing compulsory care for adult substance users); and (3) Prison and Probation Services. The last two sources function on a voluntary basis. It is not possible within the current data collection system to determine whether or not a person is counted several times across different data sources. Moreover, the Swedish TDI system is still under development in relation to many aspects of harmonisation with EMCDDA standards. Opioids were the most common drug reported among treatment entrants in Sweden in 2014, with cannabis and hypnotics/sedatives the second most prevalent. Overall, the primary drug distribution is similar when comparing inpatient and outpatient clients. The number of clients receiving inpatient and outpatient care has increased during the last five years. In compulsory care, increases in opioid and stimulant drugs as the primary drug have been reported over the same period, as have increased in the proportion of clients who use several different substances each day.
Opioid substitution treatment In 2014, 3 502 individuals were registered as OST clients, 96 of which received treatment in prison. Of these, 2 071 received buprenorphine and 1 520 received methadone, although there is the potential for double counting in the data. From 2006 to 2011, the number of clients in OST continuously increased, followed by a slight decline thereafter linked to a fall in the number of clients receiving methadone (Figure A.7.1).
74
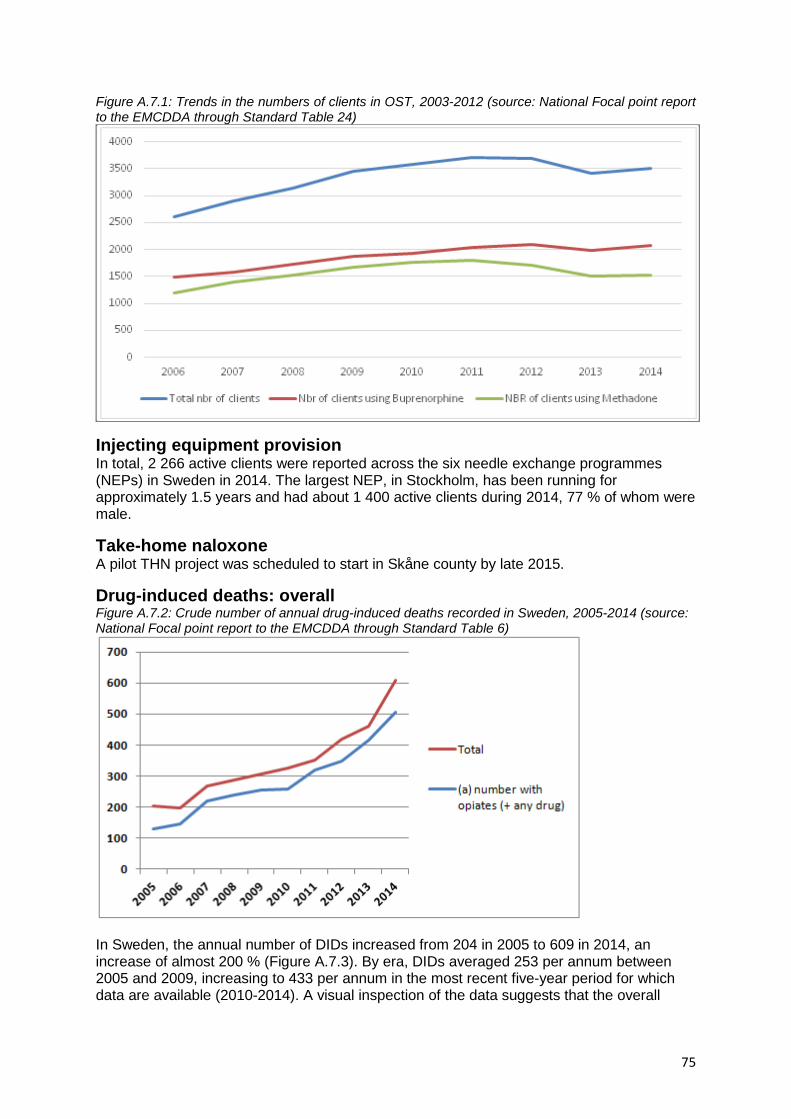
Figure A.7.1: Trends in the numbers of clients in OST, 2003-2012 (source: National Focal point report to the EMCDDA through Standard Table 24)
Injecting equipment provision In total, 2 266 active clients were reported across the six needle exchange programmes (NEPs) in Sweden in 2014. The largest NEP, in Stockholm, has been running for approximately 1.5 years and had about 1 400 active clients during 2014, 77 % of whom were male.
Take-home naloxone A pilot THN project was scheduled to start in Skåne county by late 2015.
Drug-induced deaths: overall Figure A.7.2: Crude number of annual drug-induced deaths recorded in Sweden, 2005-2014 (source: National Focal point report to the EMCDDA through Standard Table 6)
In Sweden, the annual number of DIDs increased from 204 in 2005 to 609 in 2014, an increase of almost 200 % (Figure A.7.3). By era, DIDs averaged 253 per annum between 2005 and 2009, increasing to 433 per annum in the most recent five-year period for which data are available (2010-2014). A visual inspection of the data suggests that the overall
75
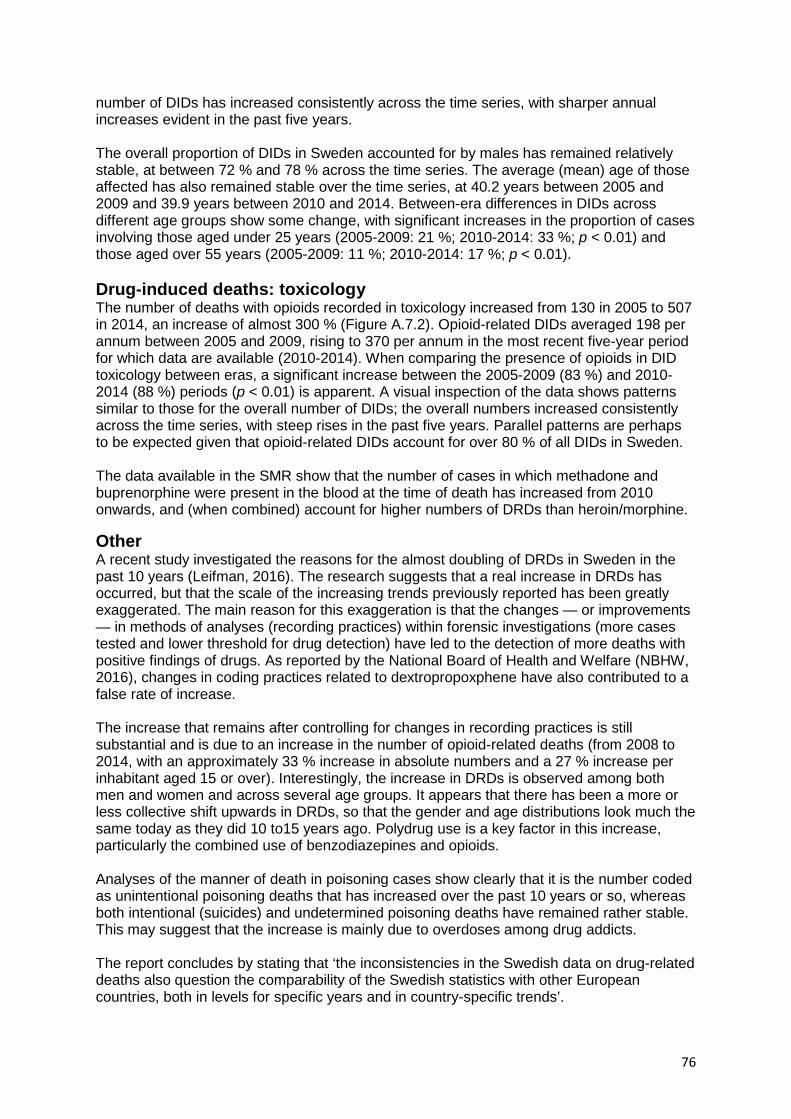
number of DIDs has increased consistently across the time series, with sharper annual increases evident in the past five years. The overall proportion of DIDs in Sweden accounted for by males has remained relatively stable, at between 72 % and 78 % across the time series. The average (mean) age of those affected has also remained stable over the time series, at 40.2 years between 2005 and 2009 and 39.9 years between 2010 and 2014. Between-era differences in DIDs across different age groups show some change, with significant increases in the proportion of cases involving those aged under 25 years (2005-2009: 21 %; 2010-2014: 33 %; p < 0.01) and those aged over 55 years (2005-2009: 11 %; 2010-2014: 17 %; p < 0.01). Drug-induced deaths: toxicology The number of deaths with opioids recorded in toxicology increased from 130 in 2005 to 507 in 2014, an increase of almost 300 % (Figure A.7.2). Opioid-related DIDs averaged 198 per annum between 2005 and 2009, rising to 370 per annum in the most recent five-year period for which data are available (2010-2014). When comparing the presence of opioids in DID toxicology between eras, a significant increase between the 2005-2009 (83 %) and 2010-2014 (88 %) periods (p < 0.01) is apparent. A visual inspection of the data shows patterns similar to those for the overall number of DIDs; the overall numbers increased consistently across the time series, with steep rises in the past five years. Parallel patterns are perhaps to be expected given that opioid-related DIDs account for over 80 % of all DIDs in Sweden. The data available in the SMR show that the number of cases in which methadone and buprenorphine were present in the blood at the time of death has increased from 2010 onwards, and (when combined) account for higher numbers of DRDs than heroin/morphine.
Other A recent study investigated the reasons for the almost doubling of DRDs in Sweden in the past 10 years (Leifman, 2016). The research suggests that a real increase in DRDs has occurred, but that the scale of the increasing trends previously reported has been greatly exaggerated. The main reason for this exaggeration is that the changes — or improvements — in methods of analyses (recording practices) within forensic investigations (more cases tested and lower threshold for drug detection) have led to the detection of more deaths with positive findings of drugs. As reported by the National Board of Health and Welfare (NBHW, 2016), changes in coding practices related to dextropropoxphene have also contributed to a false rate of increase. The increase that remains after controlling for changes in recording practices is still substantial and is due to an increase in the number of opioid-related deaths (from 2008 to 2014, with an approximately 33 % increase in absolute numbers and a 27 % increase per inhabitant aged 15 or over). Interestingly, the increase in DRDs is observed among both men and women and across several age groups. It appears that there has been a more or less collective shift upwards in DRDs, so that the gender and age distributions look much the same today as they did 10 to15 years ago. Polydrug use is a key factor in this increase, particularly the combined use of benzodiazepines and opioids. Analyses of the manner of death in poisoning cases show clearly that it is the number coded as unintentional poisoning deaths that has increased over the past 10 years or so, whereas both intentional (suicides) and undetermined poisoning deaths have remained rather stable. This may suggest that the increase is mainly due to overdoses among drug addicts. The report concludes by stating that ‘the inconsistencies in the Swedish data on drug-related deaths also question the comparability of the Swedish statistics with other European countries, both in levels for specific years and in country-specific trends’.
76

Summary The number of DIDs recorded in Sweden increased markedly between 2005 and 2014. In-depth analysis suggests that the scale of the increase is largely as a result of methodological improvements in data collection. Despite this, an increasing trend in DRDs is still observed over the time series after controlling for overestimation, but not to the extent that the data reported to EMCDDA ST6 would suggest. This increase is strongly associated with a rise in the number of opioid-related deaths among both men and women and across several age groups, with polydrug use a key factor. The increase in DIDs also appears to be principally driven by deaths as a result of accidental overdose.
The absence of robust prevalence data on POU limits the ability to draw any meaningful conclusions on the drivers of this increase, for example whether the increase in DIDs reflects an increase in the number of individuals using drugs or is due to an increased risk of DID among this population. However, increases in the number of opioid-related DIDs and in clients engaged in OST could point towards an overall increase in prevalence.
References Leifman, H. (2016), Drug-related deaths in Sweden: Estimations of trends, effects of changes in recording practices and studies of drug patterns, Centralförbundet för alkohol- och narkotikaupplysning, Stockholm. National Board of Health and Welfare (NBHW) (2013), ‘New estimates regarding PDU in Sweden’ (unpublished). Statens Folkhälsoinstitut (2011), Narkotikabruket i Sverige, Statens folkhälsoinstitut, Östersund. Stenbacka, M., Leifman, A. and Romelsjo, A. (2010), ‘Mortality and cause of death among 1705 illicit drug users: a 37 year follow up’, Drug and Alcohol Review 29, pp. 21-27.
77