TCA Across Asset Classes 2015 - Best · PDF file Where the buyside and sellside meet TCA...
45
www.bestexecution.net Where the buyside and sellside meet TCA Across Asset Classes 2015 A Best Execution publication in association with GreySpark 7 ( 9 ; 5 , 9 : platinum sponsor gold sponsor
Transcript of TCA Across Asset Classes 2015 - Best · PDF file Where the buyside and sellside meet TCA...

www.bestexecution.net
Where the buyside and sellside meet
TCA Across Asset Classes 2015
A Best Execution publication in association with
GreySpark7 ( 9 ; 5 , 9 :
plat
inum
spo
nsor
gold
spo
nsor
TCA Across Asset Classes
Best Execution | 2015 1
In these uncertain times and as the tide of regulation rises ever higher and wider, Best Execution offers an in-depth analysis into the major trends that are shaping the financial services industry as well as providing a more detailed insight into the technology driving new products and services being developed to meet these challenges. It’s where the buyside and sellside meet.
As with many facets of the industry, multi-layered regulatory pressure combined with increased competitiveness is prompting
the buyside to rethink their business propositions. This is particularly true with transaction cost analysis (TCA) and in our updated guide, Sam Shaw investigates why buyside firms are no longer solely relying on the sellside but are looking at the different models offered by vendors and creating their own models.
They will be spoilt for choice as many are honing their current wares in preparation for MiFID II which calls for even greater transparency in the execution process. Michael Sparkes, director, and Kevin O’Connor, managing director, ITG Analytics explore the challenges of applying equity based TCA across the asset classes while their colleagues Jim Cochrane, director, ITG TCA® for FX, Ian Domowitz, managing director, head of ITG Analytics, Milan Borkovec, managing director, head of financial engineering and Sandor Ferencz, vice president, ITG Analytics focus in on foreign exchange and the requests for size-adjusted spread benchmarks that account for risk and liquidity on a pre-trade and a post-trade basis.
Mike Googe, global head of post-trade transaction cost analysis at Bloomberg, takes a detailed look at the hurdles of applying equity-like TCA to the fixed income world while Anna Pajor, managing consultant and head of capital markets intelligence at consultancy GreySpark assesses the impact of the MiFID II changes to client trade reporting as well as the need to conform to external price benchmarks.
Sabine Toulson, managing director, LiquidMetrix also looks at the challenges in acquiring market data sources to properly benchmark, plus the need to have a more thoughtful discussion about the definition of best execution for the expanded set of asset classes which differ from cash equities. In addition, Vlad Rashkovich, global product manager for trade analytics at Bloomberg drills down into the process by explaining the significant benefits buyside traders can reap by using top down analysis of their order flow.
Lynn Strongin Dodds,Managing editor
www.bestexecution.net
Where the buyside and sellside meet
TCA Across Asset Classes 2015
A Best Execution publication in association with
GreySpark7 ( 9 ; 5 , 9 :
plat
inum
spo
nsor
gold
spo
nsor
Contents
2 Best Execution | 2015
33
I N T H I S I S S U E
Q TCA Across Asset Classes
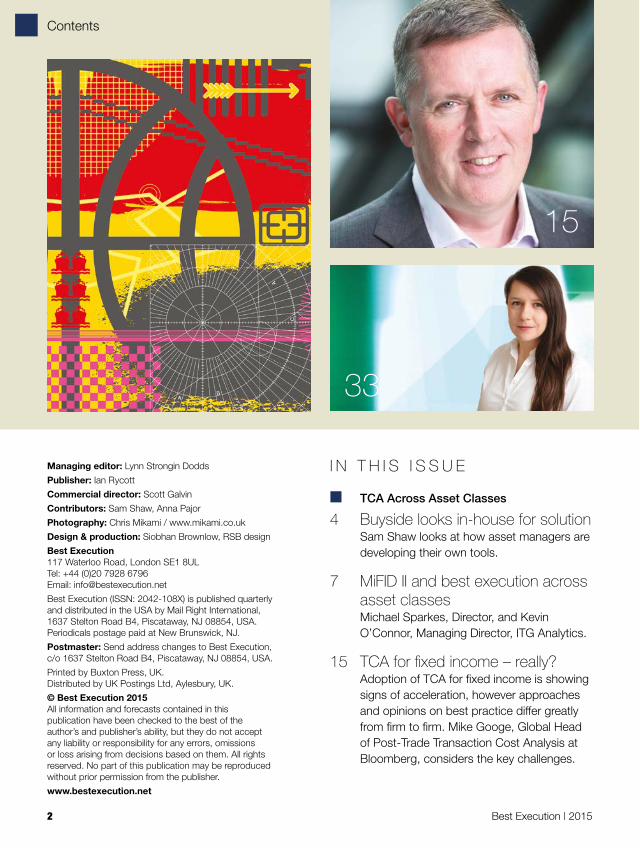
4 Buyside looks in-house for solution Sam Shaw looks at how asset managers are
developing their own tools.
7 MiFID II and best execution across asset classes
Michael Sparkes, Director, and Kevin O’Connor, Managing Director, ITG Analytics.
15 TCA for fixed income – really? Adoption of TCA for fixed income is showing
signs of acceleration, however approaches and opinions on best practice differ greatly from firm to firm. Mike Googe, Global Head of Post-Trade Transaction Cost Analysis at Bloomberg, considers the key challenges.
Managing editor: Lynn Strongin DoddsPublisher: Ian RycottCommercial director: Scott GalvinContributors: Sam Shaw, Anna PajorPhotography: Chris Mikami / www.mikami.co.ukDesign & production: Siobhan Brownlow, RSB designBest Execution 117 Waterloo Road, London SE1 8UL Tel: +44 (0)20 7928 6796 Email: [email protected] Execution (ISSN: 2042-108X) is published quarterly and distributed in the USA by Mail Right International, 1637 Stelton Road B4, Piscataway, NJ 08854, USA. Periodicals postage paid at New Brunswick, NJ.Postmaster: Send address changes to Best Execution, c/o 1637 Stelton Road B4, Piscataway, NJ 08854, USA.Printed by Buxton Press, UK. Distributed by UK Postings Ltd, Aylesbury, UK.© Best Execution 2015 All information and forecasts contained in this publication have been checked to the best of the author’s and publisher’s ability, but they do not accept any liability or responsibility for any errors, omissions or loss arising from decisions based on them. All rights reserved. No part of this publication may be reproduced without prior permission from the publisher.www.bestexecution.net
15
Contents
Best Execution | 2015 3
2177
3527
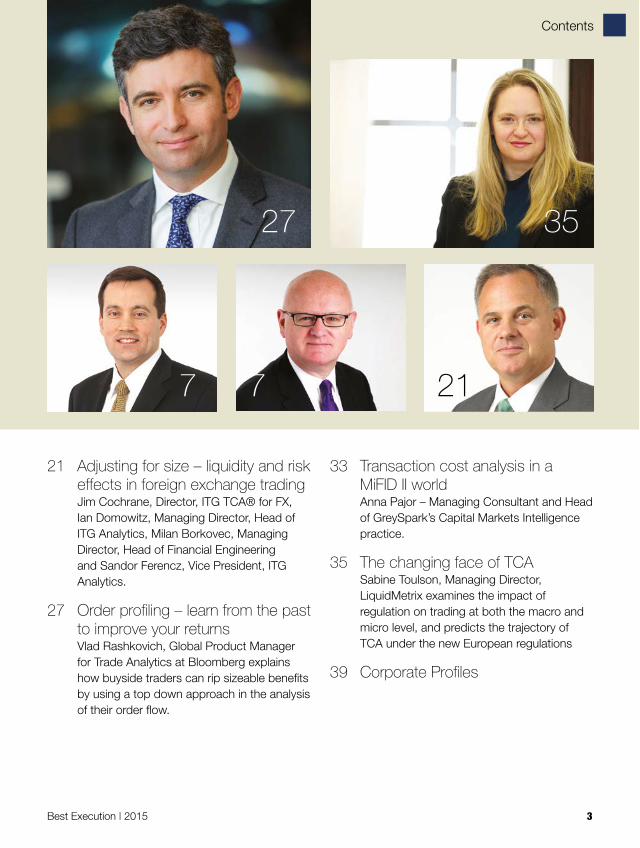
21 Adjusting for size – liquidity and risk effects in foreign exchange trading
Jim Cochrane, Director, ITG TCA® for FX, Ian Domowitz, Managing Director, Head of ITG Analytics, Milan Borkovec, Managing Director, Head of Financial Engineering and Sandor Ferencz, Vice President, ITG Analytics.
27 Order profiling – learn from the past to improve your returns
Vlad Rashkovich, Global Product Manager for Trade Analytics at Bloomberg explains how buyside traders can rip sizeable benefits by using a top down approach in the analysis of their order flow.
33 Transaction cost analysis in a MiFID II world
Anna Pajor – Managing Consultant and Head of GreySpark’s Capital Markets Intelligence practice.
35 The changing face of TCA Sabine Toulson, Managing Director,
LiquidMetrix examines the impact of regulation on trading at both the macro and micro level, and predicts the trajectory of TCA under the new European regulations
39 Corporate Profiles
TCA Across Asset Classes
4 Best Execution | 2015
Multi-faceted regulatory pressure combined with heightened competitiveness is prompting the buyside to look further afield for its transaction cost analysis (TCA). However, in some cases, looking ‘further’ actually means looking inward, as asset managers are honing their own solutions.
Pure reliance on the sellside could beg questions over an asset manager’s credibility as well as become more onerous at a time when TCA needs to be more prevalent, detailed, accurate and immediate. The need for real-time instruction and analysis form the backbone of this argument, although in a more complex landscape, blended solutions may be a better route as the landscape changes.
There is no doubt TCA is evolving. Put simply, what was once pre-trade analysis of what might happen, used retrospectively by compliance departments is morphing into a real-time, dynamic process of trade monitoring with an impact on trading behaviour, consequently informing better judgments, or such is the view of Simon Maugham, head of operations at OTAS Technologies.
Creating the analysis to do this effectively though is both time-consuming and expensive and to date, neither buy nor sellside firms have led the charge. Yossi Brandes, formerly EMEA managing director, ITG Analytics explains, “The asset managers are looking for third parties because it is harder to aggregate and standardise across 15
Buyside looks in-house for solution Sam Shaw looks at how asset managers are developing their own tools.
TCA Across Asset Classes
Best Execution | 2015 5
different brokers, methodologies and datasets – it is a nightmare to compare otherwise. The TCA vendors offer a form of standardisation across brokers, from an independent perspective.”
As well as the practicalities, there is a fairness argument for introducing an independent view. Despite the FCA’s recent thematic review on best execution focusing on sellside obligations, it highlights the need for all parties to take greater responsibility to ensure optimum trading conditions, with MiFID II and its various aspects a key driver.
According to the Investment Association, a trend is emerging of asset managers hiring dedicated personnel acting as liaison between TCA vendors, sellside and internal stakeholders, demonstrating the fund manager’s commitment to the cause.
The trade body notes that greater emphasis on TCA means asset managers are not only more focused on achieving best execution but are demonstrating to clients they are enforcing a policy that is signed off by senior management, effectively monitored and backed by supporting data.
Sabine Toulson, managing director at LiquidMetrix, says regulation has propelled impartiality up the buyside’s list of priorities. “In the last year and a half we have been approached
far more by the buyside, which has been more interested in independent analysis,” she adds. “They want to be able to compare their brokers in a more standardised way rather than getting individual reports, which may not contain the same benchmarks and cannot be compared on a like-for-like basis.”
While a broker report might provide in-depth examination of trading activity, it only offers a single perspective. LiquidMetrix notes the growing penetration of its reports across the buyside allow an interrogation of all the brokers, their chosen venues, algorithms and performance comparison.
While MiFID and the FCA can be blamed – or rather, thanked – for shining their light, the media also has a role to play, according to Toulson.
She says the publication of the Michael Lewis book ‘Flash Boys’ and stories around high frequency trading as well as arguments over venue toxicity, and coverage of the various dark pools under investigation in the US have collectively driven TCA up the agenda.
Beyond equitiesAs the industry shifts away from just high-level TCA measures around order routing, implementation shortfall, volume-weighted average price (VWAP) and post-order price reversion towards more granularity, MiFID II is also expanding its reach beyond equities.
Fund managers are happy with the broader view. For example, while Investec Asset Management recognises the maturity of equity market TCA, drawing on a broad church of benchmarks and analytics, Mark Denny, its
“While the widely held view is that third parties provide the best chance for independent analysis of trades, the issue is they cannot provide pre-trade or real-time intraday market activity that is critical for TCA.” Robert Henry, GFT
TCA Across Asset Classes
6 Best Execution | 2015
head of dealing, global markets sees the need for “meaningful execution analysis across all asset classes”.
Denny adds that while foreign exchange TCA may now be established in the major currencies, it is not the case in the emerging markets space, which holds greater importance for the South African based fund manager. Further, as bond TCA progresses in the more liquid and regularly traded markets he says it also struggles to find relevant benchmarks in less liquid instruments.
At BNY Mellon subsidiary Newton, head of dealing Tony Russell is also keen to branch out and says he has been working with long-term TCA provider ITG to roll out FX this year, with fixed income capability to follow. However, he concedes data accuracy and availability is difficult.
“We need to get to the point where the fixed income data gives a true representation of the marketplace but at the moment there is not enough data and it is not clean enough. It is a challenge for a number of reasons – liquidity is an issue as well as price transparency – the investment banks hold less than 10% of the liquidity in the market, which is why there are huge calls for buyside to buyside trading platforms to aid clearer price formation, to help improve transparency and liquidity.”
Counting the costsWhile the explicit costs – commissions, counterparty trade novation data, data around venues – can be sought externally, implicit and opportunity costs are harder to measure. As such,
asset managers might be better conducting some, if not all, of their TCA internally.
Robert Henry, director at GFT says more common is the bifurcation of solutions – combining the critical information found internally and externally. “It is very hard for them to assess opportunity costs – the time between the fund manager’s decision to trade and executing that trade comes at a cost that needs to be assessed.”
He believes there is value in both options. “While the widely held view is that third parties provide the best chance for independent analysis of trades, the issue is they cannot provide pre-trade or real-time intraday market activity that is critical for TCA.”
Kames Capital’s head of investment trading Adrian Fitzpatrick goes even further, saying external TCA is too backward looking. He has turned away from third-party TCA altogether, favouring proprietary tools such as execution management systems, which negate the need for external provision and improve the real-time capability.
“At Kames we no longer take third-party TCA because we utilise other metrics including our EMS to monitor trades as we are actually trading them,” he adds. “If I do a trade and it is incorrect I can see if a broker is trading it today, so if I give various parameters, such as I want to be 15% of the volume and they are only 5%, I can get them to adjust it to make sure they are in line with my instructions.”
Ultimately the primary objective of using TCA is to ascertain the impact of various trading practices on investment returns, and asset managers – especially the ones delivering quantitative strategies – are increasingly well-informed. More data, plugged into independent analysis, and used to complement the sellside may well create an optimal solution.
“We now see more and more trends into understanding the effect on fund returns; more from quant side fund managers trying to understand the associated costs and what percentage of return is lost due to the implementation of investment ideas,” says Brandes.
“You will never know how much the processes hurt your fund unless you measure it.” ■
“We need to get to the point where the fixed income data gives a true representation of the marketplace but at the moment there is not enough data and it is not clean enough. It is a challenge for a number of reasons – liquidity is an issue as well as price transparency.” Tony Russell, BNY Mellon subsidiary Newton
TCA Across Asset Classes
Best Execution | 2015 7
SummaryWhile best execution and transaction cost analysis (TCA) are well-established in equity trading, other asset classes have been slower to adopt such techniques due to limitations in market data and market structure characteristics. In over-the-counter (OTC) markets there has typically been no requirement for central reporting, making it difficult to demonstrate best execution in the same way as for equities. This is beginning to change due to pressure from regulators and end investors who require higher standards of information. Market structure changes, with more electronic platforms taking increasing shares of trading, are also enabling more precise analysis. Over the last three or four years, foreign exchange (FX) TCA has become increasingly mainstream for asset managers, while one recent survey shows that in the past year, fixed income TCA has become the fastest growing category of analysis1. These trends are expected to continue, not least in the light of MiFID II regulations.
Regulatory pressureIt is a truism that an asset manager should be expected to execute orders on terms most favourable to the client as opposed to the benefit of themselves or any third party. It is also reasonable that they should be expected to demonstrate this on a systematic basis across all types of trading that they undertake, whatever the asset class. In the real world this has not been as
easy as it sounds. Increasingly, regulation is raising the bar of expectations and imposing obligations which the industry is struggling to implement, particularly in markets which have historically traded OTC.
Under article 27 of the EU Directive 2014/65/EU, “Member States shall require that investment firms take all sufficient steps to obtain, when executing orders, the best possible result for their clients taking into account price, costs, speed, likelihood of execution and settlement, size, nature or any other consideration relevant to the execution of the order. Nevertheless, where there is a specific instruction from the client the investment firm shall execute the order following the specific instruction.”
The asset manager is obliged to take these key factors into account as part of their measurement and monitoring processes to be able to show that their trading has indeed met the regulatory requirements. Random sampling of a few trades per quarter is unlikely to be considered adequate in the way it would have been in the past. In this new regime firms will have to introduce processes to record details of every trade and its characteristics, together with the market conditions, and any relevant instructions received from the client.
The largest asset managers have in some cases developed in-house processes to undertake this kind of monitoring, but for many firms the cost of such developments is prohibitive. Hence, third party suppliers have increasingly been called upon
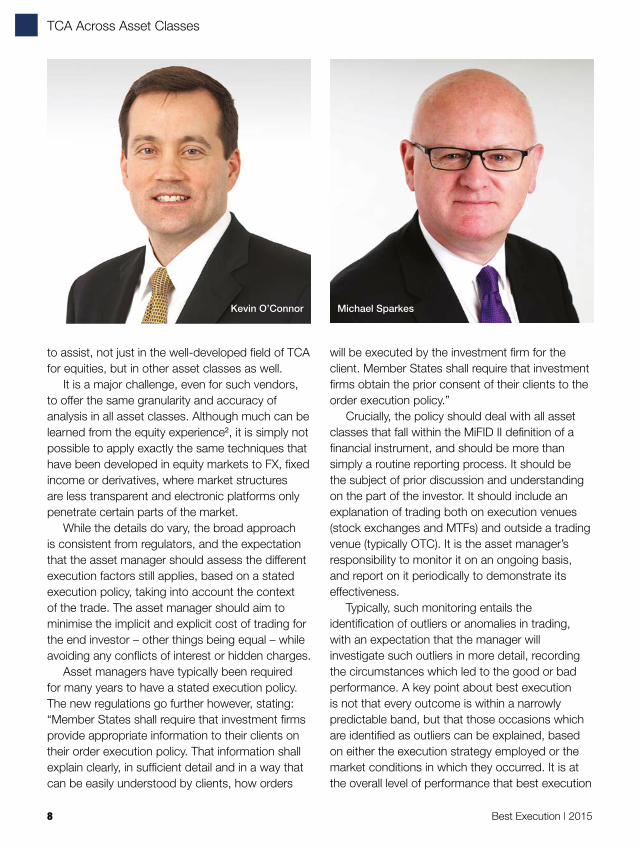
MiFID II and best execution across asset classesBy Michael Sparkes, Director, and Kevin O’Connor, Managing Director, ITG Analytics.
TCA Across Asset Classes
8 Best Execution | 2015
to assist, not just in the well-developed field of TCA for equities, but in other asset classes as well.
It is a major challenge, even for such vendors, to offer the same granularity and accuracy of analysis in all asset classes. Although much can be learned from the equity experience2, it is simply not possible to apply exactly the same techniques that have been developed in equity markets to FX, fixed income or derivatives, where market structures are less transparent and electronic platforms only penetrate certain parts of the market.
While the details do vary, the broad approach is consistent from regulators, and the expectation that the asset manager should assess the different execution factors still applies, based on a stated execution policy, taking into account the context of the trade. The asset manager should aim to minimise the implicit and explicit cost of trading for the end investor – other things being equal – while avoiding any conflicts of interest or hidden charges.
Asset managers have typically been required for many years to have a stated execution policy. The new regulations go further however, stating: “Member States shall require that investment firms provide appropriate information to their clients on their order execution policy. That information shall explain clearly, in sufficient detail and in a way that can be easily understood by clients, how orders
will be executed by the investment firm for the client. Member States shall require that investment firms obtain the prior consent of their clients to the order execution policy.”
Crucially, the policy should deal with all asset classes that fall within the MiFID II definition of a financial instrument, and should be more than simply a routine reporting process. It should be the subject of prior discussion and understanding on the part of the investor. It should include an explanation of trading both on execution venues (stock exchanges and MTFs) and outside a trading venue (typically OTC). It is the asset manager’s responsibility to monitor it on an ongoing basis, and report on it periodically to demonstrate its effectiveness.
Typically, such monitoring entails the identification of outliers or anomalies in trading, with an expectation that the manager will investigate such outliers in more detail, recording the circumstances which led to the good or bad performance. A key point about best execution is not that every outcome is within a narrowly predictable band, but that those occasions which are identified as outliers can be explained, based on either the execution strategy employed or the market conditions in which they occurred. It is at the overall level of performance that best execution
Michael SparkesKevin O’Connor
TCA Across Asset Classes
Best Execution | 2015 9
is ultimately evidenced, with individual trades (and even more so individual fills) being subordinate to the process.
“Member States shall require investment firms to be able to demonstrate to their clients, at their request, that they have executed their orders in accordance with the investment firm’s execution policy and to demonstrate to the competent authority, at its request, their compliance with this Article.”
Hence it is the policy that is key, and the ability to demonstrate compliance with it to clients. This is expected to ensure a closer and more open level of communication between asset manager and client than in the past, bringing enhanced transparency throughout the investment process.
The regulation is more specific about the reporting of execution venues than in the past: “Member States shall require investment firms who execute client orders to summarise and make public on an annual basis, for each class of financial instruments, the top five execution venues in terms of trading volumes where they executed client orders in the preceding year and information on the quality of execution obtained.”
This particular statement has been a cause for concern on the part of some asset managers who initially believed it to mean that they needed to install expensive systems to record every single fill to determine where their brokers were routing their orders, whether to primary stock exchange or MTF, whether in the lit or dark markets. The interpretation has evolved however, and it is now widely considered that the buyside need only to monitor the brokers that they use. The brokers in turn are expected to monitor the underlying execution venues on which the trades occur, and
make this information available to the buyside on request.
Nevertheless, the more progressive (and financially able) buyside firms are already recording the execution venue data as well as the brokers. This enables them to understand in far greater detail the ways in which their broker is routing the order, whether to their own liquidity pools or elsewhere, and the relative performance due to such routing. It can also potentially help identify the value of any rebate or other third party payment or non-monetary benefit from an execution venue to an investment firm.
While this type of granular analysis is likely to become the norm it is something to be used with care. Individual fills are rather like looking at each of the dots of a colour TV: individually, they can tell a picture of sorts, but the real story is only understandable by standing back and looking at the overall effect. The fact that an order was traded in one thousand pieces is all very well, but the timing, the sizes and the locations of the fills when taken in aggregate are what determines the overall result. Best execution is not about where and at what price 100 shares traded out of an order for 100,000 shares. In addition, research has shown that factors such as the strategy used to access the venue are critical to the overall evaluation of the execution venue.3
The proposed regulations require execution venues to publish significantly more detailed information on trades that take place on their venue. This includes expectations of the required fields, format and frequency, plus additional requirements for quote/order driven execution venues. This requirement for more data is part of a move towards greater pre- and post-trade transparency that continues to be a core theme in the regulatory direction, both explicitly spelt out in the regulations and as interpreted by market practitioners.
One phrase which is open to interpretation in the draft regulations is the definition of the “quality of executions obtained”. This is intrinsically a qualitative benchmark which requires interpretation by the user. One proposal which is emerging, is
“One proposal which is emerging, is the possibility of an industry-led definition of best execution which could include some outline of the qualitative features that should form the basis of such a definition.”
TCA Across Asset Classes
10 Best Execution | 2015
the possibility of an industry-led definition of best execution which could include some outline of the qualitative features that should form the basis of such a definition. The FIX Trading Community published a document of Best Practice in TCA in 2014, and there is scope for the document to be extended to incorporate key definitions regarding Best Execution as well. Within such a framework the onus would still remain with the asset manager to define its own policy based on their investment process, asset mix and circumstances.
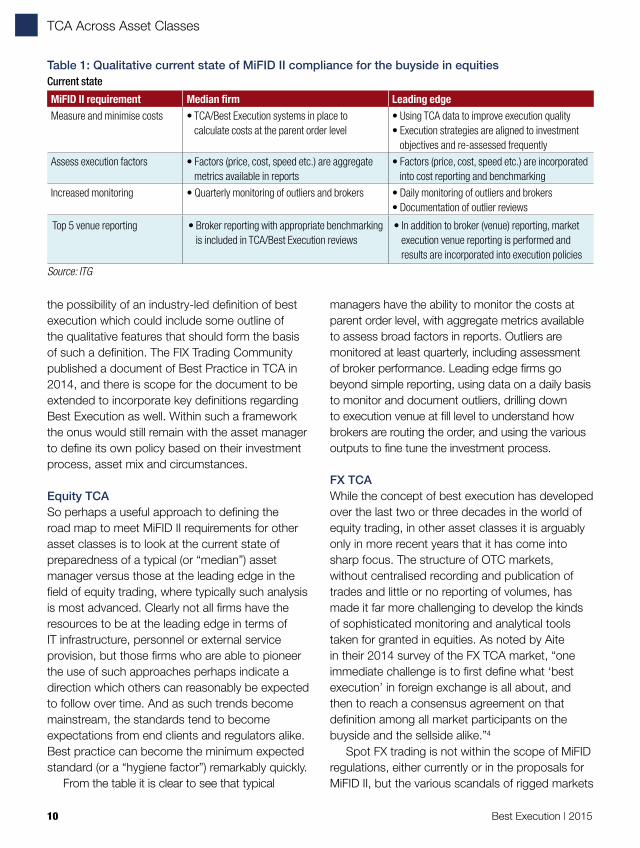
Equity TCASo perhaps a useful approach to defining the road map to meet MiFID II requirements for other asset classes is to look at the current state of preparedness of a typical (or “median”) asset manager versus those at the leading edge in the field of equity trading, where typically such analysis is most advanced. Clearly not all firms have the resources to be at the leading edge in terms of IT infrastructure, personnel or external service provision, but those firms who are able to pioneer the use of such approaches perhaps indicate a direction which others can reasonably be expected to follow over time. And as such trends become mainstream, the standards tend to become expectations from end clients and regulators alike. Best practice can become the minimum expected standard (or a “hygiene factor”) remarkably quickly.
From the table it is clear to see that typical
managers have the ability to monitor the costs at parent order level, with aggregate metrics available to assess broad factors in reports. Outliers are monitored at least quarterly, including assessment of broker performance. Leading edge firms go beyond simple reporting, using data on a daily basis to monitor and document outliers, drilling down to execution venue at fill level to understand how brokers are routing the order, and using the various outputs to fine tune the investment process.
FX TCAWhile the concept of best execution has developed over the last two or three decades in the world of equity trading, in other asset classes it is arguably only in more recent years that it has come into sharp focus. The structure of OTC markets, without centralised recording and publication of trades and little or no reporting of volumes, has made it far more challenging to develop the kinds of sophisticated monitoring and analytical tools taken for granted in equities. As noted by Aite in their 2014 survey of the FX TCA market, “one immediate challenge is to first define what ‘best execution’ in foreign exchange is all about, and then to reach a consensus agreement on that definition among all market participants on the buyside and the sellside alike.”4
Spot FX trading is not within the scope of MiFID regulations, either currently or in the proposals for MiFID II, but the various scandals of rigged markets
Table 1: Qualitative current state of MiFID II compliance for the buyside in equitiesCurrent state
MiFID II requirement Median firm Leading edgeMeasure and minimise costs • TCA/Best Execution systems in place to
calculate costs at the parent order level• Using TCA data to improve execution quality• Execution strategies are aligned to investment
objectives and re-assessed frequentlyAssess execution factors • Factors (price, cost, speed etc.) are aggregate
metrics available in reports• Factors (price, cost, speed etc.) are incorporated
into cost reporting and benchmarkingIncreased monitoring • Quarterly monitoring of outliers and brokers • Daily monitoring of outliers and brokers
• Documentation of outlier reviews
Top 5 venue reporting • Broker reporting with appropriate benchmarking is included in TCA/Best Execution reviews
• In addition to broker (venue) reporting, market execution venue reporting is performed and results are incorporated into execution policies
Source: ITG
TCA Across Asset Classes
Best Execution | 2015 11
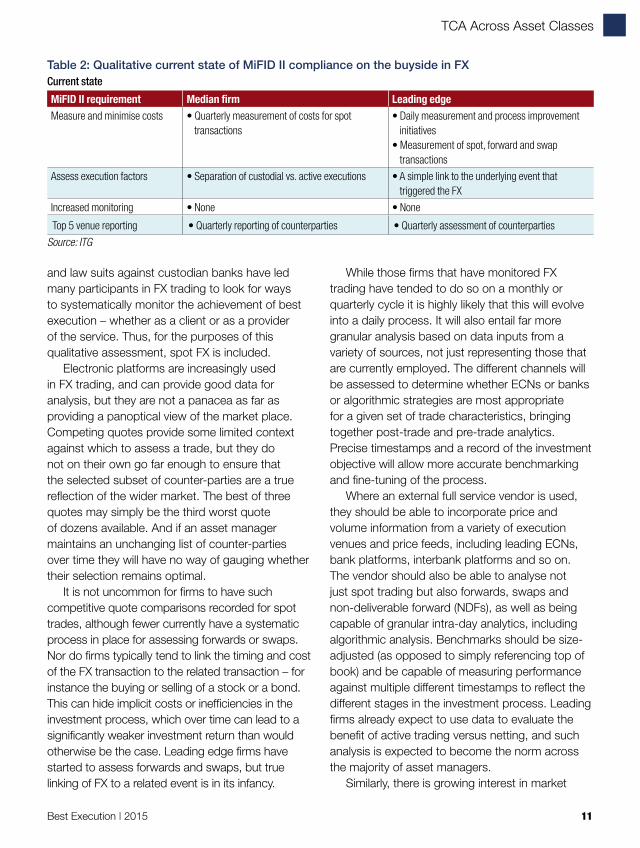
and law suits against custodian banks have led many participants in FX trading to look for ways to systematically monitor the achievement of best execution – whether as a client or as a provider of the service. Thus, for the purposes of this qualitative assessment, spot FX is included.
Electronic platforms are increasingly used in FX trading, and can provide good data for analysis, but they are not a panacea as far as providing a panoptical view of the market place. Competing quotes provide some limited context against which to assess a trade, but they do not on their own go far enough to ensure that the selected subset of counter-parties are a true reflection of the wider market. The best of three quotes may simply be the third worst quote of dozens available. And if an asset manager maintains an unchanging list of counter-parties over time they will have no way of gauging whether their selection remains optimal.
It is not uncommon for firms to have such competitive quote comparisons recorded for spot trades, although fewer currently have a systematic process in place for assessing forwards or swaps. Nor do firms typically tend to link the timing and cost of the FX transaction to the related transaction – for instance the buying or selling of a stock or a bond. This can hide implicit costs or inefficiencies in the investment process, which over time can lead to a significantly weaker investment return than would otherwise be the case. Leading edge firms have started to assess forwards and swaps, but true linking of FX to a related event is in its infancy.
While those firms that have monitored FX trading have tended to do so on a monthly or quarterly cycle it is highly likely that this will evolve into a daily process. It will also entail far more granular analysis based on data inputs from a variety of sources, not just representing those that are currently employed. The different channels will be assessed to determine whether ECNs or banks or algorithmic strategies are most appropriate for a given set of trade characteristics, bringing together post-trade and pre-trade analytics. Precise timestamps and a record of the investment objective will allow more accurate benchmarking and fine-tuning of the process.
Where an external full service vendor is used, they should be able to incorporate price and volume information from a variety of execution venues and price feeds, including leading ECNs, bank platforms, interbank platforms and so on. The vendor should also be able to analyse not just spot trading but also forwards, swaps and non-deliverable forward (NDFs), as well as being capable of granular intra-day analytics, including algorithmic analysis. Benchmarks should be size-adjusted (as opposed to simply referencing top of book) and be capable of measuring performance against multiple different timestamps to reflect the different stages in the investment process. Leading firms already expect to use data to evaluate the benefit of active trading versus netting, and such analysis is expected to become the norm across the majority of asset managers.
Similarly, there is growing interest in market
Table 2: Qualitative current state of MiFID II compliance on the buyside in FXCurrent state
MiFID II requirement Median firm Leading edgeMeasure and minimise costs • Quarterly measurement of costs for spot
transactions• Daily measurement and process improvement
initiatives• Measurement of spot, forward and swap
transactionsAssess execution factors • Separation of custodial vs. active executions • A simple link to the underlying event that
triggered the FXIncreased monitoring • None • None
Top 5 venue reporting • Quarterly reporting of counterparties • Quarterly assessment of counterpartiesSource: ITG
TCA Across Asset Classes
12 Best Execution | 2015
movements in OTC markets immediately after a trade (sometimes referred to as footprint analysis). And given the scandals of recent years the ability to assess the benefit or cost of trading on the 4.00pm London fix is expected as a standard metric in any best execution or TCA process.
Derivatives TCACurrently, listed derivatives are largely treated in a similar way to equities for TCA purposes, although under the current reporting regime not all trades are reported, meaning that certain metrics such as Volume-Weighted Average Price (VWAP) are unreliable. In the future, it is expected that reporting requirements will be more rigorous, allowing more accurate analysis. It is also likely that asset managers will start evaluating the performance as an offset to other asset transactions and the related delay costs which are currently being incurred. An example might be the switching of an index-based instrument to the underlying constituents: it may be that a cost on one side is offset by a gain on the other, or if handled badly, costs may be incurred on both sides of the trade.
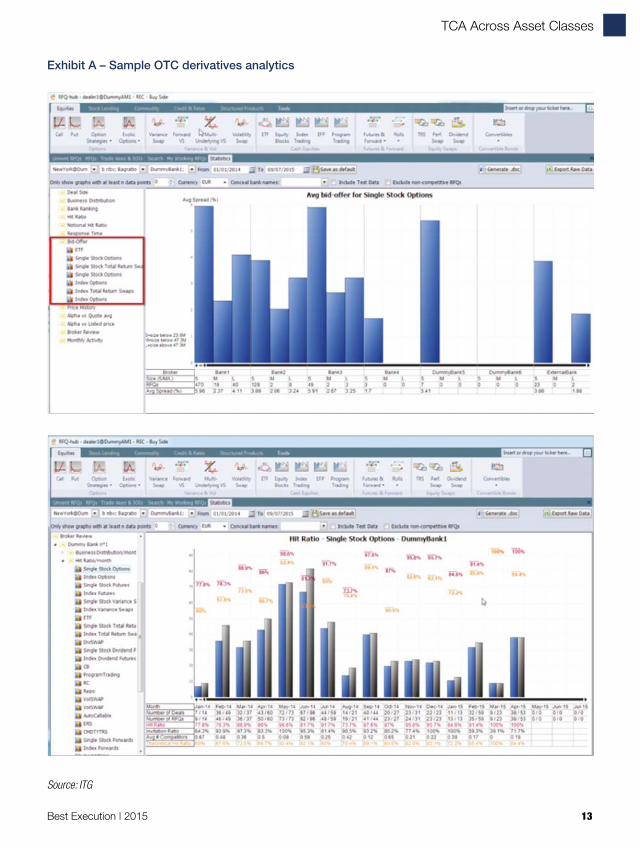
OTC derivatives pose a greater challenge, as with all OTC markets. Currently they are at best measured manually using laborious recording which is not always reliable or insightful, for instance comparing competing quotes. Leading
edge firms are starting to look at RFQ (Request For Quote) automated software to provide audit trail and analytical records to provide more robust surveillance and the ability to adjust processes to iron out inefficiencies. A range of metrics are already available for post-trade analysis, including hit ratios, product statistics, size statistics, and links to underlying assets within a basket. Notional hit ratios can be measured, as can response ratios, bid-offer spreads, alpha versus quote average, alpha versus listed price and broker assessment measures.
Fixed Income TCAWhile FX TCA is in its early stages fixed income TCA is in its infancy. The challenges of an OTC market without a central record of prices or volumes, and in which large numbers of securities do not trade at all for weeks or months, are considerable. In fixed income, as in FX, a widely used approach to best execution is a manual comparison against competing quotes from a limited number of counter-parties. Alternatively the use of indicative valuation data is used, based on the prices used for portfolio valuations. The latter approach is indicative but not necessarily a tradable price. Despite the challenges there is a pressing need for good analytics in fixed income trading. A recent report by Greenwich Associates
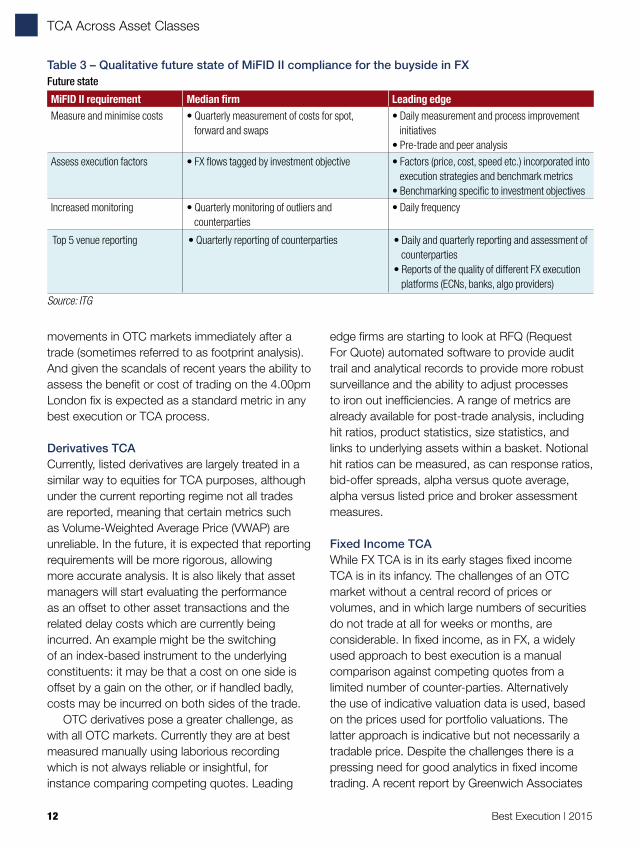
Table 3 – Qualitative future state of MiFID II compliance for the buyside in FXFuture state
MiFID II requirement Median firm Leading edgeMeasure and minimise costs • Quarterly measurement of costs for spot,
forward and swaps• Daily measurement and process improvement
initiatives• Pre-trade and peer analysis
Assess execution factors • FX flows tagged by investment objective • Factors (price, cost, speed etc.) incorporated into execution strategies and benchmark metrics
• Benchmarking specific to investment objectivesIncreased monitoring • Quarterly monitoring of outliers and
counterparties• Daily frequency
Top 5 venue reporting • Quarterly reporting of counterparties • Daily and quarterly reporting and assessment of counterparties
• Reports of the quality of different FX execution platforms (ECNs, banks, algo providers)
Source: ITG
TCA Across Asset Classes
Best Execution | 2015 13
Exhibit A – Sample OTC derivatives analytics
Source: ITG
TCA Across Asset Classes
14 Best Execution | 2015
claims the use of TCA in fixed income markets is growing faster than in any other asset class, with over one third of asset managers interviewed using TCA in the sector, up from 19% two years earlier. However, of those who do anything at all, 54% use internally developed tools. This is likely to move towards third party solutions over time.5
More advanced firms have developed automated comparisons of market quotes to their executions, or use the TCA reports provided by electronic platforms. Best execution can also be assessed for fairness compared with similar products, although such approaches are still relatively simplistic and lack granularity. For rarely traded securities the best available reference price is likely to be based on securities with a similar mix of characteristics (credit rating, coupon, maturity, liquidity and so on) and which have traded in similar size. At best this is likely to be patchy, a sort of shadow play which is as good as the bucketing of those characteristics. The more homogeneous the bucket, the more accurate the price indication is likely is to be.
A number of initiatives are underway which will help develop more sophisticated fixed income analytics and best execution reporting, starting with market structure. If more fixed income trading moves to centralised electronic venues and away from the OTC market makers this will provide more transparent sources of post-trade data on trades (although the effect on liquidity remains to be seen). Similarly, a move to more standardised instruments may to some extent mitigate the issue of bucketing
similar securities, at least for commonly traded instruments.
The FIX Trading Community initiative Project Neptune is also expected to provide more granular data which could be used for best execution and TCA purposes.
It is likely that most firms will implement manual or partially automated processes for comparing rates to dealer quotes, using daily or potentially intraday data. More advanced firms are likely to want to compare performance against a range of price sources – actual market quotes and trades, peer data and intraday evaluative pricing. Cost measurement can be expected to develop, similar to the implementation shortfall types of metric used widely in equities, along with difficulty-adjusted, liquidity-based assessment of counterparties.
Challenges clearly remain in best execution for fixed income trading. In the near term the determination of a fair price will continue to entail a degree of inaccuracy. Over time it is possible that developments in market structure and data availability will finally allow the same level of analysis that is widely employed in equities. ■
Footnotes:1. “Fixed-Income Transaction Cost Analysis Continues Strong
Growth Trend”, Greenwich Associates, Q2 2015.2. See “Multi-asset TCA”, TCA Across Asset Classes
supplement, Best Execution Magazine, 2013.3. Ian Domowitz, Krisit Reitnauer, Colleen Ruane, “Garbage In,
Garbage Out:An Optical Tour of the Role of Strategy in Venue Analysis”, August 2014.
4. FX Transaction Cost Analysis Providers:Brave New World!, Aite, May 2014.
5. “Fixed-Income Transaction Cost Analysis Continues Strong Growth Trend”, Greenwich Associates, Q2 2015.
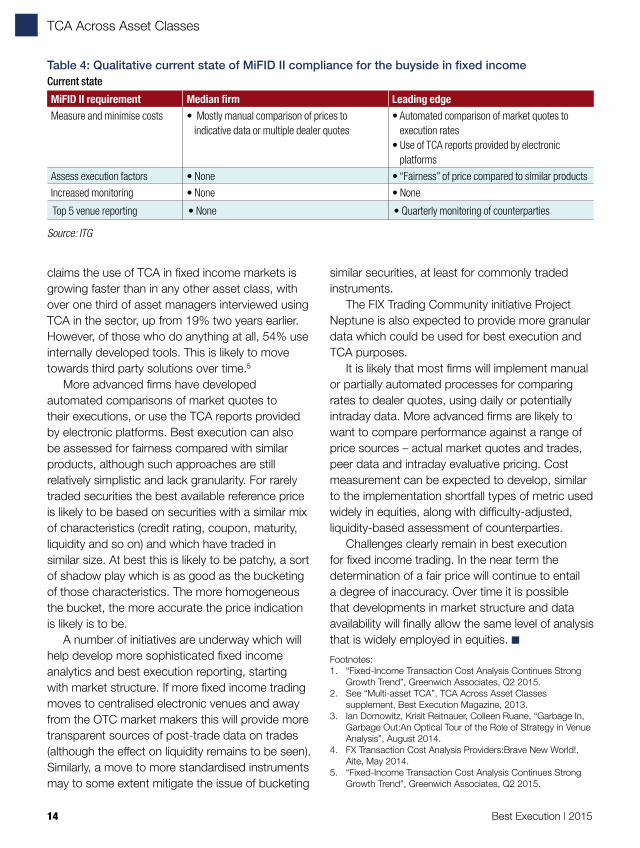
Table 4: Qualitative current state of MiFID II compliance for the buyside in fixed incomeCurrent state
MiFID II requirement Median firm Leading edgeMeasure and minimise costs • Mostly manual comparison of prices to
indicative data or multiple dealer quotes• Automated comparison of market quotes to
execution rates• Use of TCA reports provided by electronic
platformsAssess execution factors • None • “Fairness” of price compared to similar productsIncreased monitoring • None • None
Top 5 venue reporting • None • Quarterly monitoring of counterparties
Source: ITG
TCA Across Asset Classes
Best Execution | 2015 15
There are people who question whether it is possible to gain any kind of value or insight by conducting TCA for fixed income (FI). While there are limitations to FI TCA, it can and indeed does deliver value, and more and more firms are starting to realise that. At the annual Bloomberg TCA conference in 2013, our interactive survey showed 38% of respondents would like to implement FI TCA and another 30% are looking at a full multi-asset implementation. In 2015 Greenwich Associates published a paper which supported this observation. Their survey revealed use of FI TCA has grown from 19% of firms in 2012 to 38% in 2014.
Interestingly, the reasons put forward to explain why fixed income TCA can’t be relied upon – quality of pricing data, lack of a complete volume picture, market trading practices, the liquidity crisis – are issues which also affect the quality of analysis in equities markets where TCA is a firmly-established practice. Yes, equity markets have published market data, but given the imbalance of HFT to real money flows, fragmentation of liquidity across lit and dark venues and the disparity in quality of pricing data between the most liquid
large caps and small and micro caps, accurately measuring your trading performance is still very challenging.
The challenges of conducting TCA for fixed income can be overcome. What is imperative is that firms clearly define a TCA policy that meets their objectives, taking into account the limitations of the analysis and using it in conjunction with good judgement.
Why conduct FI TCA?The primary goal cited by market participants is generally to gain insight in order to improve their trading and investment processes, and be able to demonstrate control and resultant benefits in terms of performance. According to the Greenwich Associates survey, 64% of respondents said ‘post-trade review to analyse trade effectiveness’ was their main use of the analysis.
Repurposing TCA for compliance surveillance is also gaining traction. Having an independent analysis of performance allows firms to implement a defendable policy for the identification of potential market abuse, conflicts of interest and suspicious transaction breeches.
TCA for fixed income – really?Adoption of TCA for fixed income is showing signs of acceleration, however approaches and opinions on best practice differ greatly from firm to firm. Mike Googe, Global Head of Post-Trade Transaction Cost Analysis at Bloomberg, considers the key challenges and factors in implementing an efficient and effective fixed income TCA policy.
TCA Across Asset Classes
16 Best Execution | 2015
Last but not least, the quality of analysis, and thus the value of conducting FI TCA, is set to improve significantly with initiatives like MiFID II in Europe, which will lead to increased pre and post-trade transparency on fixed income markets.
Key challengesBy considering the following questions you can begin to address the issues surrounding pricing data quality, cost decomposition, benchmark selection and aggregating results.
What do you want to measure and why? This might include which trade types or flows to include, which part of the order lifecycle to consider and are you doing this to detect outliers or trends or compliance breeches etc.
How do you want to measure and what effects are you trying to observe?This includes benchmark selection, which pricing data to measure against, which contextual data to incorporate, such as momentum or volatility, in order to isolate insights such as which dealers perform best under what conditions or how best to reduce impact etc.
When do you want to measure and how do you want to use the results?Select a frequency of analysis to give you the best insight and the best output for the various types of internal and external consumers of analysis, e.g. summary vs detailed reports, charts and visual representations, exceptions or alerts or even a feed to contribute to pre-trade decision support tools.
Pricing dataIn the absence of a continuous stream of published tick data it is impossible to achieve a complete picture of pricing and volume for a given bond. At some point in the future regulation may mandate publication, or even create the conditions for a central order book, but there are many challenges to overcome before anything like that can be considered.
Currently pricing data consists of contributed
indicative pricing, firm pricing, quotes, evaluated pricing and to an extent runs and axes. The higher the liquidity of the issue, the more reliable is the pricing data. Of course purely indicative prices can be skewed, but in liquid names where multiple contributors are in a competitive environment the onus is to deliver accurate prices, and many participants view these as a good proxy for a continuous tick data set. Contributions can also be made by exchanges and reporting agencies such as TRACE (the Trade Reporting and Compliance Engine). As markets become more electronic, firm prices further increase the quality of pricing data and time-stamps, as will initiatives to enhance pre-trade transparency.
As liquidity deteriorates, so does the quality of contributed data. If it falls below a given threshold it is time to consider using evaluated prices, which are based on a variety of direct and indirect observations and are often provided with a ‘confidence score’, allowing consumers to determine to what extent they want to rely on them. In this case, it is fair to say that any TCA will not be useful from a trading insight point of view, however it can be used for trading surveillance for the purpose of compliance testing. This introduces the idea of contingent benchmarking, e.g. selecting the benchmark to use based on the characteristics of the bond or indeed the order.
Cost decompositionOne of the critical insights TCA strives to deliver is an understanding of where costs occur during the lifecycle of a trade. Being able to understand the opportunity cost between the various stages can help identify areas of best or poor practice and assist in changes of procedure as well as strategy selection or timing. Being able to answer what happened to the price between portfolio manager decision, order creation, RFQ going out, quotes back, execution time etc. helps provide these insights.
With a highly-automated electronic workflow providing accurate timestamps, equities can be reliably measured. But with a high proportion of fixed income flow conducted over voice, the quality
TCA Across Asset Classes
Best Execution | 2015 17
of decomposition is seriously eroded. In this case the systems and workflow of the firm must be considered when looking at what insight can be gained from any decomposition. In the case of a high proportion of manual workflow, benchmark selection is critical. For example, measuring an observed price when requesting quotes, and comparing it to the price when a quote is accepted can provide insight on price sensitivity. When aggregated and compared, this can indicate areas where more or less caution in timing or better dealer selection is required.
BenchmarksThe next factor to consider, once you have the underlying pricing data in place, is what ‘measuring sticks’ you want to use. Benchmarks use different approaches to detect specific effects and broadly fall into two categories: absolute and relative.
Of course making comparisons for benchmarking requires matching conventions. Prices should be against prices, be they clean or dirty, yields against yields, but in all cases normalised. Conducting TCA based on spread is fraught with difficulty because of the changing nature of the underlying benchmark, curve or interpolation method from firm-to-firm.
• Absolute benchmarksAbsolute benchmarks are calculated by comparing raw pricing data with transactional data. The most prevalent is implementation shortfall, or arrival price, which simply compares the price at a given action point in the order lifecycle with the achieved execution price. This price is taken as the observed mid-price. You can then compare the observed price when the PM made the decision, or when the order was created, or when the trader sent the RFQ or executed against the execution price, and calculate the slippage.
This can be used to calculate the opportunity cost in a decomposition model: what was the price when the order landed on the traders pad compared to when they sent the RFQ out? Did the price move favourably or adversely? When you aggregate the results over a period of time, trends
can be detected (and even more so when put in context of the order in hand) to determine if the effect is peculiar to one type of bond over another, for example.
• Near/far touch benchmarksA variation of this is the near/far touch benchmarks, which operate in a similar way, but depending on the side of the order they use the bid or ask price instead of taking the mid-point. For example a buy order benchmarked to the far touch will use the offer price in its calculation. The benefit of this approach is that it allows the cost of crossing the spread to be factored into the performance. Whilst it only looks at the arrival time, it allows seeing how much spread was captured. A natural evolution to this will be to take the average spread from the arrival to the final execution time, but this is a more complex operation.
• Time Weighted Average PriceVolume Weighted Average Price benchmarks are challenging to deliver due to the absence of a complete volume picture. Different platforms or dealers could provide something, but to avoid the pitfalls of self-fulfilling prophecies this is realistic only for very liquid bonds. Future post-trade
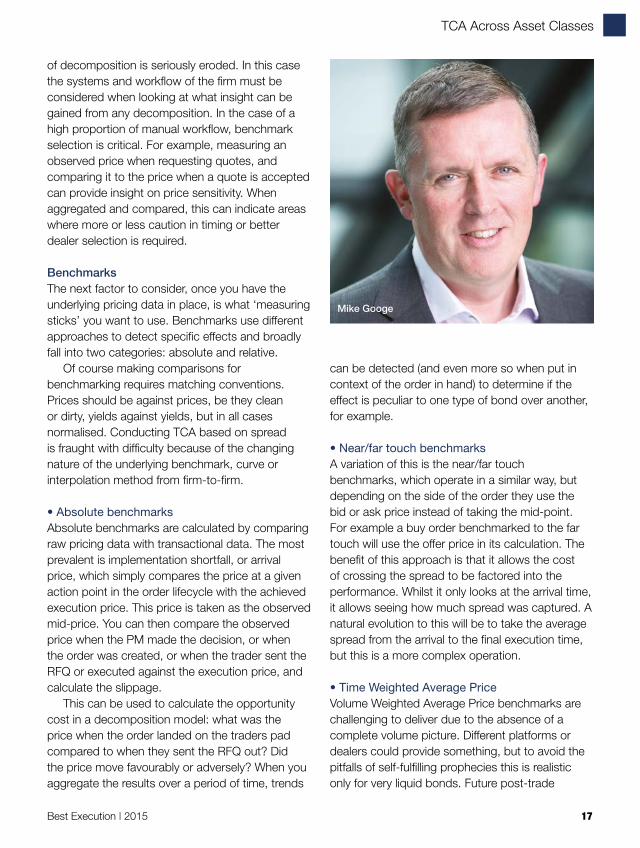
Mike Googe
TCA Across Asset Classes
18 Best Execution | 2015
transparency initiatives might allow this, but for now you can consider the alternative of Time Weighted Average Price (TWAP). This requires aggregating prices into time intervals where each interval has an equal weighting. A TWAP can then be constructed over a full day’s trading or a given interval, for example the order interval or the interval from the order arrival to the end of trading day. Again this is most effective at the higher end of the liquidity spectrum.
• Point in time benchmarksPoint in time benchmarks allow measurements against discrete times not related to the lifecycle of an order, for example a given prior or post days close. These benchmarks can be used in tandem to create a momentum profile less centred on the trading process but more looking at the timing of trades. When aggregated by portfolio manager or fund for example, this can reveal momentum bias and whether the trading approach can afford to be more passive or aggressive.
At a lower level of resolution, time offset or reversion benchmarks will take snap prices at a much shorter interval, usually measured in minutes or even seconds, around a given action (e.g. arrival time or execution time). These work in a similar way to point in time but look to detect short term momentum or impact, which can again be aggregated by order characteristics to see which orders or bonds etc. are more sensitive than others.
• Relative benchmarksRelative benchmarks help to calculate costs within some sort of context. There are two main approaches: using peer performance to see how your trading compares to others who have conducted similar business, and using pre-trade cost estimates which calculate a likely cost of execution given the characteristics of the order in hand.
Creating a meaningful set of peer benchmarks is a balancing act between measuring into such detail that you risk leaking information about contributors’ trading activity against aggregating
results to such a high level that the benchmark becomes meaningless. The balance is to use 2-3 levels of aggregation to get a more relevant result, e.g. what is peer arrival when trading French sovereign debt in 7-10 year maturity or corporate debt of high order difficulty during adverse momentum?
In addition, it is imperative that the sample of peer results has thresholds for minimum acceptable observations, for example specifying a minimum number of relevant orders from a minimum number of contributing firms (excluding yourself to avoid material skew). If these criteria are not met then no result should be generated to avoid misleading observations. A peer equivalent of any of the absolute benchmarks will allow relative comparison of performance, but typically they tend not to include point in time benchmarks.
Pre-trade impact estimates in fixed income are beginning to emerge. Through approaches such as cluster analysis, you can leverage scarce transaction data observations while considering a large number of relevant factors that can influence the liquidity of a particular security. In other words, big data offers promising methods to estimate impact cost and time to execute for a given volume, even for bonds with limited historical trading activity.
This is a sophisticated way of doing benchmarking which allows using market impact models similar to those well proven for equities and provides a natural way to extend coverage for TCA in fixed income markets. Again, to enhance transparency, results can be caveated with an uncertainty or confidence score.
• RFQ benchmark testsFinally, Request For Quote (RFQ) trading allows for another set of benchmark tests to be conducted. These have tended to fall into the category of best execution. A firm might go out to several dealers requesting quotes and will typically select the best quote to trade before comparing it to the next best quote. This measure is very simple to capture and is known as the cover, which gives the price improvement achieved.
TCA Across Asset Classes
Best Execution | 2015 19
There is now a growing interest in capturing all returned quotes, including rejected quotes and abandons, and comparing them to the traded price to calculate the opportunity cost when you didn’t trade with a certain dealer. Further metrics such as hit ratio (how often you trade with a given dealer within a given context) or average time to respond to a request can provide further context to the analysis.
Aggregating resultsTypical aggregations are group results based on prevailing market conditions (e.g. volatility, momentum etc.), order characteristics (e.g. maturity, security type, country, sector, rating etc.), entity (e.g. dealer, trader, PM or account etc.) or time period (e.g. day, week etc.).
One of the most important goals of TCA is to group according to the difficulty of completing an order. In equities the standard proxy is order size/average daily volume, but the absence of a full volume picture in bonds makes a similar approach unreliable. Compounding the challenge is the fact that as bonds mature their liquidity profile typically deteriorates.
An alternative methodology is to attribute a notional value to a level of difficulty. This doesn’t, however, reflect the wide variety of liquidity profiles a firm trades. Trading up to $5 million of the current US Treasury 10 year is different from trading up to $5 million of an off the run corporate bond for
“With time pressure and firms seeking to increase the tempo of their decision/action cycle, TCA increasingly focuses on determining outliers on the basis of thresholds and tolerance, pushing results to the most appropriate user and feeding them into decision support tools.”Mike Googe, Global Head of Post-Trade Transaction Cost Analysis, Bloomberg
TCA Across Asset Classes
20 Best Execution | 2015
example. Further elements need to be considered, e.g. the security type.
The confidence index score given by evaluated prices can also be used to map difficulty. Bonds tend to have high confidence scores when many reliable direct observations are made, indicating higher liquidity and vice versa. A more simplistic approach could be to look at the size of the order relative to the issued size or available float, but this is constrained when you factor in the difficulty in assessing how much of an issue has been locked up and can no longer be considered accessible liquidity.
Another important step to produce a more accurate analysis is to ensure that things like flow type or semantics are captured. For example repos should be identified so they can be grouped separately to look at the overall performance, to avoid looking at individual legs, which can introduce contingent skew under some other aggregations (e.g. side).
Capturing semantic elements is a lot more difficult and relies on the capabilities of the feed system, but can provide meaningful insight. For example, an order instruction which seeks to get executed ASAP would typically attract a less favourable cost profile vs. one where the instruction is full discretion. If this data can be captured with syntactic consistency it can be a very insightful aggregation.
Turning analysis into actionTypically, TCA takes the form of reports looking to answer one or several questions concerning best/worst trades, dealer performance etc. However these require someone to review the analysis and pull whatever insight they can from them. With time pressure and firms seeking to increase the tempo of their decision/action cycle, TCA increasingly focuses on determining outliers on the basis of thresholds and tolerance, pushing results to the most appropriate user and feeding them into decision support tools.
Integrating trends or aggregate results for decision support is an area of increasing interest in all asset classes. Having an arbitrary ‘show me my best 5 and worst 5 trades’ on a given day doesn’t take into account the quality threshold which all the benchmarking discussed previously delivers. Increasingly, firms are looking to set acceptable tolerances on performance for a given benchmark for a given set of order characteristics. This means you don’t have to rely on a single quality line for all your flow.
Within fixed income the area of dealer selection is a focus. Using some of the previously described benchmarks it is possible to say for a given order profile which dealers are the most likely to respond to your RFQ, which are likely to give you the most competitive prices etc. The result of this can be a probability of execution score or list of ranked dealers to go to. If presented within the EMS or even as a set of options when creating the ticket or RFQ, the trader can make an informed decision with insight directly at their fingertips.
Again, using groupings, a user can say ‘if I have an easy US treasury order which slips by more than 5 bps against arrival then tell me’. The result is that users only get alerted to those items that they have specifically flagged, thereby reducing the incidents of false positives.
This is of particular importance for the growing community of compliance users who are moving away from random sampling to a more defendable surveillance policy which tests every trade and presents only those which require investigation.
Really? Yes!Fixed Income TCA is still emerging but is evolving and being adopted at an increasing rate. The crux is not to view TCA as a ‘one size fits all’ activity but to consider it in light of the unique attributes of your firm and the variety of flow types traded. With this in mind you can establish a TCA policy which gives you the insights that can deliver real value add to your business. ■
TCA Across Asset Classes
Best Execution | 2015 21
As the next advance in FX TCA reporting, our clients in the investment community have requested size-adjusted spread (SAS) benchmarks that account for risk and liquidity on a pre-trade and a post-trade basis. However, one of the more frustrating aspects of over-the-counter trading is the lack of transparency around these spreads. An accurate size-adjusted spread based on aggregated electronic foreign exchange quotes would replace the old method of supplying expected spreads: manually-filled matrices for each trading region with spreads for given currency pairs and sizes. Buyside traders depended on this information to both hold banks accountable for their agreed spreads as well as manage their own expectations for costs. Now that buyside firms are more responsible for currency risk, they need a system that will digitally re-create those matrices and give them a benchmark that will show that they add value to the investment process.
While every benchmark is a useful tool for the analyst, the lack of a benchmark that measures the impact of their trading skill and discretion in FX has been sorely missed over the past several years. Most traders feel that they add value to the funds for which they trade. A true accounting for that currency risk management will not only provide them with a skill measure, but it will also provide valuable information to every constituent group at a buyside firm regarding portfolio performance, implementation shortfall and process improvement.
As a provider of foreign exchange transaction cost analysis (FX TCA) ITG created FX cost curves from our tradable quote database that provide insights into expected costs for any size trade at any time of day for liquid, deliverable currency pairs. Our curves were split up into four distinct categories from our quote sources: all sources, the best bank quotes, the average bank quotes and ECN-only quotes. Each cost curve had a different expectation for SAS, which would be expected for FX trading. While each have their uses for pre-trade analysis and trading strategy, which is the “best” curve? Which curve produces the most accurate cost estimate?
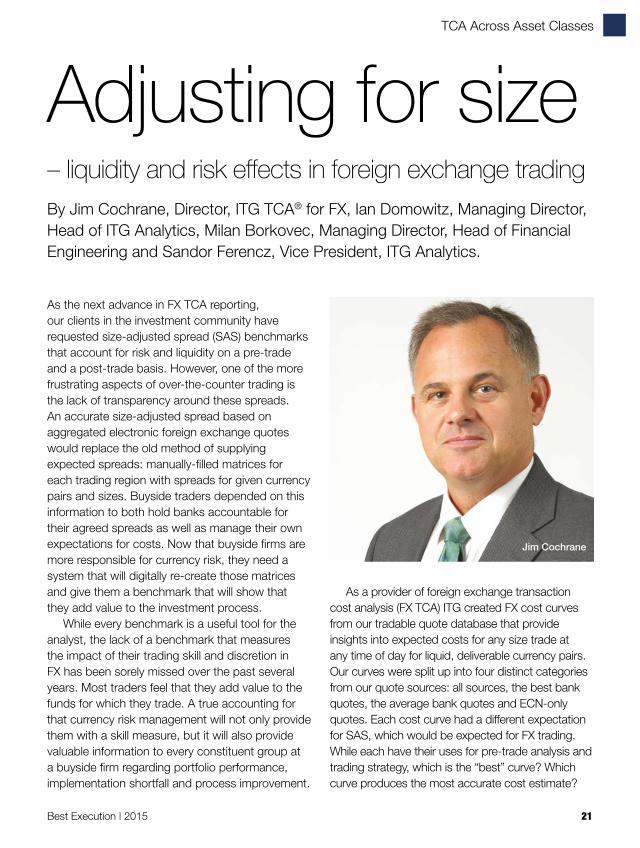
Adjusting for size – liquidity and risk effects in foreign exchange tradingBy Jim Cochrane, Director, ITG TCA® for FX, Ian Domowitz, Managing Director, Head of ITG Analytics, Milan Borkovec, Managing Director, Head of Financial Engineering and Sandor Ferencz, Vice President, ITG Analytics.
Jim Cochrane
TCA Across Asset Classes
22 Best Execution | 2015
Since ITG also has access to executed transactions in our database, we tested our cost curves for accuracy. The result of this examination was a modified cost curve that can be used to adjust for the size of currency transactions during times of differing liquidity and risk profiles. This cost curve can then be used to create a SAS benchmark rate that will account for trader skill as well as provide a more precise pre-trade measurement of expected trading costs. The result can then be a source for decision-making and research at firms that seek to outperform their peers.
First we will review FX market structure and our methodology for managing both opacity and aggregation. Then we will detail the first results of our study in size-adjusted spreads and the creation of our cost curves. Lastly, we will review our test of those curves against actual transactions to see which curve is the best fit for SAS.
The lack of a central exchange in the FX market has challenged analysts pursuing accurate cost
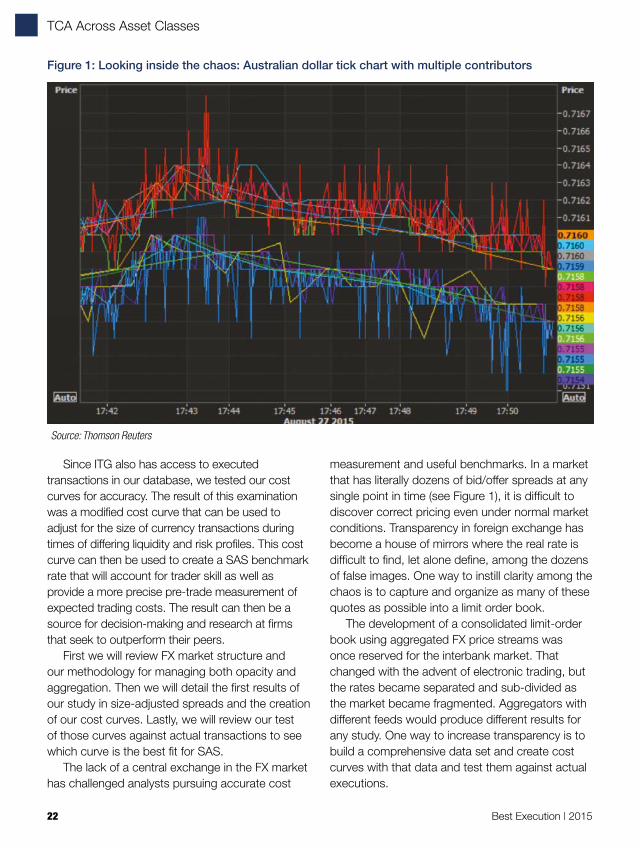
measurement and useful benchmarks. In a market that has literally dozens of bid/offer spreads at any single point in time (see Figure 1), it is difficult to discover correct pricing even under normal market conditions. Transparency in foreign exchange has become a house of mirrors where the real rate is difficult to find, let alone define, among the dozens of false images. One way to instill clarity among the chaos is to capture and organize as many of these quotes as possible into a limit order book.
The development of a consolidated limit-order book using aggregated FX price streams was once reserved for the interbank market. That changed with the advent of electronic trading, but the rates became separated and sub-divided as the market became fragmented. Aggregators with different feeds would produce different results for any study. One way to increase transparency is to build a comprehensive data set and create cost curves with that data and test them against actual executions.
Figure 1: Looking inside the chaos: Australian dollar tick chart with multiple contributors
Source: Thomson Reuters
TCA Across Asset Classes
Best Execution | 2015 23
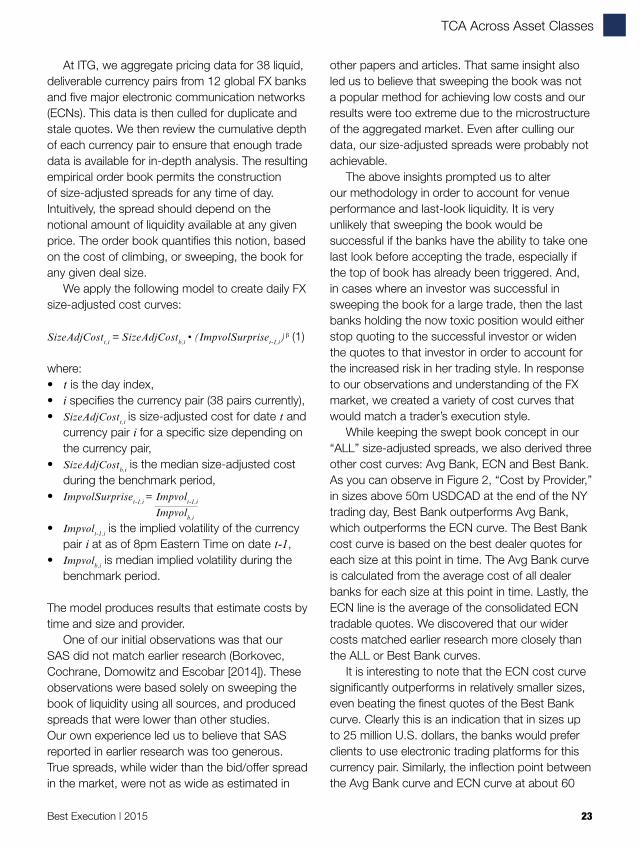
At ITG, we aggregate pricing data for 38 liquid, deliverable currency pairs from 12 global FX banks and five major electronic communication networks (ECNs). This data is then culled for duplicate and stale quotes. We then review the cumulative depth of each currency pair to ensure that enough trade data is available for in-depth analysis. The resulting empirical order book permits the construction of size-adjusted spreads for any time of day. Intuitively, the spread should depend on the notional amount of liquidity available at any given price. The order book quantifies this notion, based on the cost of climbing, or sweeping, the book for any given deal size.
We apply the following model to create daily FX size-adjusted cost curves:
SizeAdjCostt,i = SizeAdjCostb,i • (ImpvolSurpriset-1,i)` (1)
where: • t is the day index,• i specifies the currency pair (38 pairs currently),• SizeAdjCostt,i is size-adjusted cost for date t and
currency pair i for a specific size depending on the currency pair,
• SizeAdjCostb,i is the median size-adjusted cost during the benchmark period,
• ImpvolSurpriset-1,i = Impvolt-1,i Impvolb,i
• Impvolt-1,i is the implied volatility of the currency pair i at as of 8pm Eastern Time on date t-1,
• Impvolb,i is median implied volatility during the benchmark period.
The model produces results that estimate costs by time and size and provider.
One of our initial observations was that our SAS did not match earlier research (Borkovec, Cochrane, Domowitz and Escobar [2014]). These observations were based solely on sweeping the book of liquidity using all sources, and produced spreads that were lower than other studies. Our own experience led us to believe that SAS reported in earlier research was too generous. True spreads, while wider than the bid/offer spread in the market, were not as wide as estimated in
other papers and articles. That same insight also led us to believe that sweeping the book was not a popular method for achieving low costs and our results were too extreme due to the microstructure of the aggregated market. Even after culling our data, our size-adjusted spreads were probably not achievable.
The above insights prompted us to alter our methodology in order to account for venue performance and last-look liquidity. It is very unlikely that sweeping the book would be successful if the banks have the ability to take one last look before accepting the trade, especially if the top of book has already been triggered. And, in cases where an investor was successful in sweeping the book for a large trade, then the last banks holding the now toxic position would either stop quoting to the successful investor or widen the quotes to that investor in order to account for the increased risk in her trading style. In response to our observations and understanding of the FX market, we created a variety of cost curves that would match a trader’s execution style.
While keeping the swept book concept in our “ALL” size-adjusted spreads, we also derived three other cost curves: Avg Bank, ECN and Best Bank. As you can observe in Figure 2, “Cost by Provider,” in sizes above 50m USDCAD at the end of the NY trading day, Best Bank outperforms Avg Bank, which outperforms the ECN curve. The Best Bank cost curve is based on the best dealer quotes for each size at this point in time. The Avg Bank curve is calculated from the average cost of all dealer banks for each size at this point in time. Lastly, the ECN line is the average of the consolidated ECN tradable quotes. We discovered that our wider costs matched earlier research more closely than the ALL or Best Bank curves.
It is interesting to note that the ECN cost curve significantly outperforms in relatively smaller sizes, even beating the finest quotes of the Best Bank curve. Clearly this is an indication that in sizes up to 25 million U.S. dollars, the banks would prefer clients to use electronic trading platforms for this currency pair. Similarly, the inflection point between the Avg Bank curve and ECN curve at about 60

TCA Across Asset Classes
24 Best Execution | 2015
million US dollars reveals a desire to have clients pick up the phone and deal directly. Now we have four curves that could represent normal operating procedures for dissimilar trading desks: one that relies solely on ECNs, one that calls up a bank randomly (Avg Bank), one that knows the best broker-dealer for each currency pair (Best Bank), especially in large size transactions and one that sweeps the book (ALL). While each provides a cost expectation that fits a unique scenario, we still do not know which curve is the closest to actual experiences of FX traders in the market. We will discuss which of the four curves is the best curve in the next section of the article.
The table in Figure 3 below represents the first
step of our inquiry into which cost curve is the best to use to create a SAS benchmark. It contains the results of comparing our test SAS benchmark rates against actual executions. The “Quoted Mid bps” column is the difference between the execution rate of a transaction subtracted by the mid rate prevailing in the market at the time of the transaction (if selling the base currency) expressed as a percentage of the same mid rate in basis points. That difference between the two rates is then compared to our four SAS benchmark rates. The results in the “SAS” columns are the expected SAS minus the “Quoted Mid bps”. A result of zero indicates that the expected SAS benchmark matched the actual transaction rate. A positive result indicates that the actual trade was a “gain” against this benchmark. A negative result indicates that the execution was outside, or worse, than the expected spread. “We did not differentiate for size. All trades are between 5 and 100 million base currency units. In total, 82,705 trades were analyzed for this study.
The observations do not create a clear picture of which SAS curve should prevail. In other words, there is no clear winner using this analysis. The cells outlined in white are the closest to a zero in comparing the total cost of the transaction against the predicted cost using the SAS benchmark rate. The cost curve that produces differentials closest to zero changes by currency pair. Further tests made in this fashion revealed that the SAS_Avg
USD/CAD (as of 2015/08/26 16:44 GMT)
Expe
cted
cos
t (bp
s)
Trade size (million)
Best bank ECN Avg bank
5
4
3
3
1
00 50 100 150 200
Figure 2: Cost by Provider – Expected costs by quote source for USDCAD
Source: ITG
Figure 3: First stage test: Comparing actual rates against SAS benchmark rates
QuotedMid_bps SAS_Avg_bps SAS_BestBank_bps SAS_ALL_bps SAS_ECN_bpsALL -0.932795 0.371654 -0.173652 -0.448911 -0.035778AUDUSD -1.164342 0.152975 -0.323044 -0.665689 -0.408137EURUSD -0.694656 0.114253 -0.281908 -0.465211 -0.206716GBPUSD -0.811915 0.15438 -0.213672 -0.452524 -0.145148USDCAD -0.899985 0.284957 -0.208581 -0.483942 -0.179376USDCHF -1.901301 1.151784 -0.134199 -0.621057 0.787477USDJPY -0.559865 0.021291 -0.233061 -0.3691 -0.197743USDMXN -1.601155 1.141493 -0.01253 -0.464468 0.486327USDTRY -2.26209 2.792391 0.520947 -0.177423 2.480802USDZAR -2.298837 2.993995 1.030807 0.004737 1.379885
Source: ITG
TCA Across Asset Classes
Best Execution | 2015 25
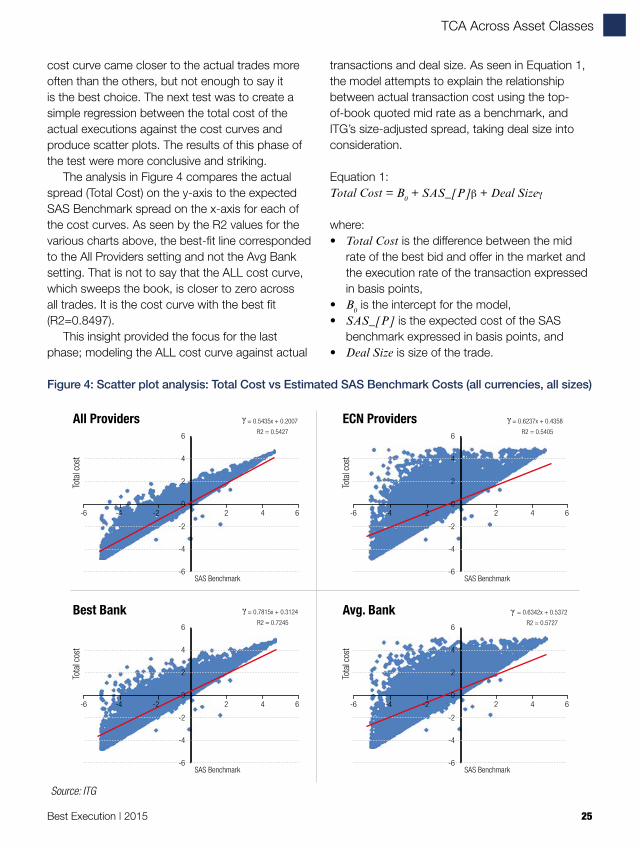
cost curve came closer to the actual trades more often than the others, but not enough to say it is the best choice. The next test was to create a simple regression between the total cost of the actual executions against the cost curves and produce scatter plots. The results of this phase of the test were more conclusive and striking.
The analysis in Figure 4 compares the actual spread (Total Cost) on the y-axis to the expected SAS Benchmark spread on the x-axis for each of the cost curves. As seen by the R2 values for the various charts above, the best-fit line corresponded to the All Providers setting and not the Avg Bank setting. That is not to say that the ALL cost curve, which sweeps the book, is closer to zero across all trades. It is the cost curve with the best fit (R2=0.8497).
This insight provided the focus for the last phase; modeling the ALL cost curve against actual
transactions and deal size. As seen in Equation 1, the model attempts to explain the relationship between actual transaction cost using the top-of-book quoted mid rate as a benchmark, and ITG’s size-adjusted spread, taking deal size into consideration.
Equation 1: Total Cost = B0 + SAS_[P]` + Deal Sizea
where: • Total Cost is the difference between the mid
rate of the best bid and offer in the market and the execution rate of the transaction expressed in basis points,
• B0 is the intercept for the model,• SAS_[P] is the expected cost of the SAS
benchmark expressed in basis points, and• Deal Size is size of the trade.
6
4
2
0
-2
-4
-6
Tota
l cos
t
SAS Benchmark
-6 -4 -2 2 4 6
All Providers γ = 0.5435x + 0.2007
R2 = 0.5427
6
4
2
0
-2
-4
-6
Tota
l cos
t
SAS Benchmark
-6 -4 -2 2 4 6
Best Bank γ = 0.7815x + 0.3124
R2 = 0.7245
6
4
2
0
-2
-4
-6
Tota
l cos
t
SAS Benchmark
-6 -4 -2 2 4 6
ECN Providers γ = 0.6237x + 0.4358
R2 = 0.5405
6
4
2
0
-2
-4
-6
Tota
l cos
t
SAS Benchmark
-6 -4 -2 2 4 6
Avg. Bank γ = 0.6342x + 0.5372
R2 = 0.5727
Figure 4: Scatter plot analysis: Total Cost vs Estimated SAS Benchmark Costs (all currencies, all sizes)
Source: ITG
TCA Across Asset Classes
26 Best Execution | 2015
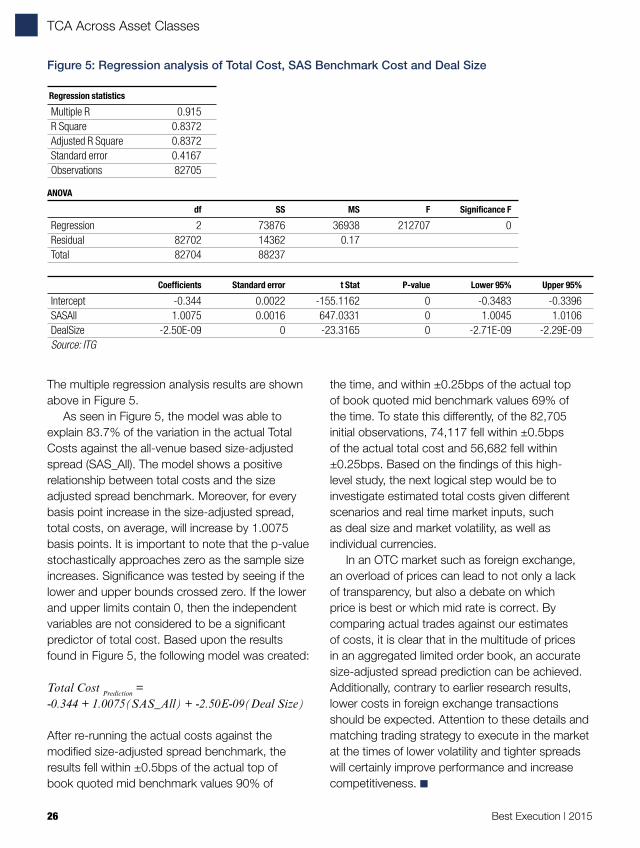
The multiple regression analysis results are shown above in Figure 5.
As seen in Figure 5, the model was able to explain 83.7% of the variation in the actual Total Costs against the all-venue based size-adjusted spread (SAS_All). The model shows a positive relationship between total costs and the size adjusted spread benchmark. Moreover, for every basis point increase in the size-adjusted spread, total costs, on average, will increase by 1.0075 basis points. It is important to note that the p-value stochastically approaches zero as the sample size increases. Significance was tested by seeing if the lower and upper bounds crossed zero. If the lower and upper limits contain 0, then the independent variables are not considered to be a significant predictor of total cost. Based upon the results found in Figure 5, the following model was created:
Total Cost Prediction = -0.344 + 1.0075(SAS_All) + -2.50E-09(Deal Size)
After re-running the actual costs against the modified size-adjusted spread benchmark, the results fell within ±0.5bps of the actual top of book quoted mid benchmark values 90% of
the time, and within ±0.25bps of the actual top of book quoted mid benchmark values 69% of the time. To state this differently, of the 82,705 initial observations, 74,117 fell within ±0.5bps of the actual total cost and 56,682 fell within ±0.25bps. Based on the findings of this high-level study, the next logical step would be to investigate estimated total costs given different scenarios and real time market inputs, such as deal size and market volatility, as well as individual currencies.
In an OTC market such as foreign exchange, an overload of prices can lead to not only a lack of transparency, but also a debate on which price is best or which mid rate is correct. By comparing actual trades against our estimates of costs, it is clear that in the multitude of prices in an aggregated limited order book, an accurate size-adjusted spread prediction can be achieved. Additionally, contrary to earlier research results, lower costs in foreign exchange transactions should be expected. Attention to these details and matching trading strategy to execute in the market at the times of lower volatility and tighter spreads will certainly improve performance and increase competitiveness. ■
Figure 5: Regression analysis of Total Cost, SAS Benchmark Cost and Deal Size
Regression statistics
Multiple R 0.915R Square 0.8372Adjusted R Square 0.8372Standard error 0.4167Observations 82705
ANOVA
df SS MS F Significance F
Regression 2 73876 36938 212707 0 Residual 82702 14362 0.17 Total 82704 88237
Coefficients Standard error t Stat P-value Lower 95% Upper 95%
Intercept -0.344 0.0022 -155.1162 0 -0.3483 -0.3396SASAll 1.0075 0.0016 647.0331 0 1.0045 1.0106DealSize -2.50E-09 0 -23.3165 0 -2.71E-09 -2.29E-09Source: ITG
TCA Across Asset Classes
Best Execution | 2015 27
You have your EMS connected to brokers, news and orders are flowing through. You monitor the slippage of each order against various benchmarks in real time. You might handicap your performance with a cost model. You’re paying for all that, of course. It’s the cost of doing business. Right?
Right. This morning you got a number of difficult orders. How does your setup help you to win them? You look at the market, at the news, you size your order versus the Average Daily Volume. A good pre-trade tool with a solid cost model and a volume estimate can definitely help. You couple it with an IOI flow and you’re up for a good start.
Wait a moment. What about all these orders you executed over the years? Don’t they have some information about portfolio managers you work with, perhaps their patterns and biases? What about brokers and algos you have used, and which worked better for which type of order? Shouldn’t this history tell you, at the very least, about your own trading style and potential blind spots?
Another aspect is venue analysis, which has been very hot recently. With the proliferation of execution outlets, high-frequency players and dark liquidity, it’s natural to be concerned and want to control where your orders are being sent. As a result, the buyside demands increasing transparency from brokers. An urge to make some changes in algo routing logic is understandable. It is also relatively easy to implement.
Portfolio Manager (PM) profilingA trade usually starts with a portfolio manager, and the largest improvement could come from analysing PMs and trading strategy alignment to the short-term momentum implicitly built into the orders. If the trader is wrong on the expected short-term alpha, he can try to speed up and find the best algo and venues to help him, only to realise that the right way to handle this order was to slow down. Venue analysis, broker selection, dark pools, IOIs – nothing will help if the trader’s overall strategy is not aligned with the portfolio manager’s.
A case in point, you work with a growth portfolio manager. Her “buys” might be momentum driven and require aggressive executions. Her “sells”, however, might be driven by the dips, where the momentum seems to be vanishing. If over time these dips are statistically significant to point for reversion, then the sell orders might benefit from a slow execution.
Real life and behaviour is more nuanced of course, thus the same portfolio manager might respond differently to various market conditions across countries, sectors, volatility and many other factors. As a result, you’re facing a multi-dimensional analysis where advanced machine learning techniques could decipher the signal from the noise.
Learning from similar orders in the past to
Order profiling– learn from the past to improve your returnsVlad Rashkovich, Global Product Manager for Trade Analytics at Bloomberg explains how buyside traders can rip sizeable benefits by using a top down approach in the analysis of their order flow.
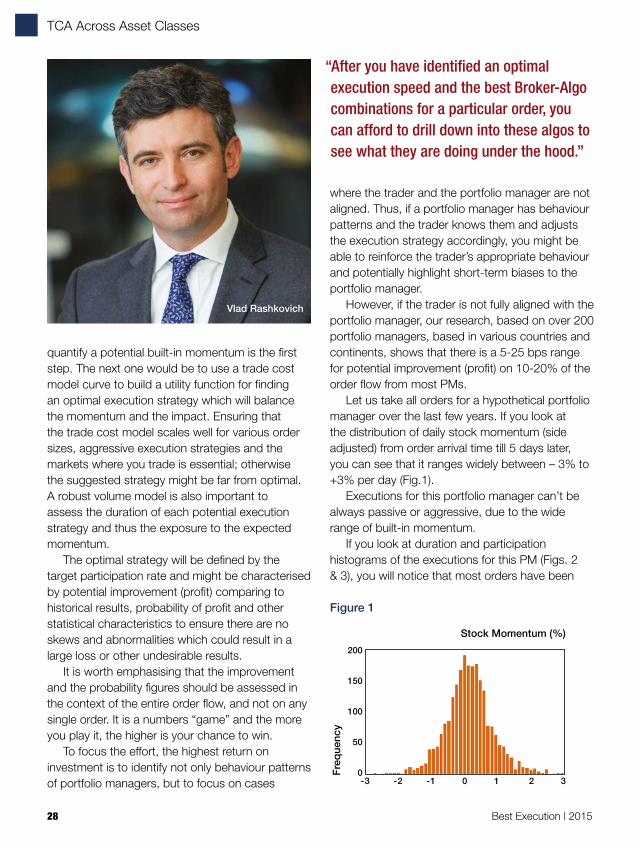
TCA Across Asset Classes
28 Best Execution | 2015
quantify a potential built-in momentum is the first step. The next one would be to use a trade cost model curve to build a utility function for finding an optimal execution strategy which will balance the momentum and the impact. Ensuring that the trade cost model scales well for various order sizes, aggressive execution strategies and the markets where you trade is essential; otherwise the suggested strategy might be far from optimal. A robust volume model is also important to assess the duration of each potential execution strategy and thus the exposure to the expected momentum.
The optimal strategy will be defined by the target participation rate and might be characterised by potential improvement (profit) comparing to historical results, probability of profit and other statistical characteristics to ensure there are no skews and abnormalities which could result in a large loss or other undesirable results.
It is worth emphasising that the improvement and the probability figures should be assessed in the context of the entire order flow, and not on any single order. It is a numbers “game” and the more you play it, the higher is your chance to win.
To focus the effort, the highest return on investment is to identify not only behaviour patterns of portfolio managers, but to focus on cases
where the trader and the portfolio manager are not aligned. Thus, if a portfolio manager has behaviour patterns and the trader knows them and adjusts the execution strategy accordingly, you might be able to reinforce the trader’s appropriate behaviour and potentially highlight short-term biases to the portfolio manager.
However, if the trader is not fully aligned with the portfolio manager, our research, based on over 200 portfolio managers, based in various countries and continents, shows that there is a 5-25 bps range for potential improvement (profit) on 10-20% of the order flow from most PMs.
Let us take all orders for a hypothetical portfolio manager over the last few years. If you look at the distribution of daily stock momentum (side adjusted) from order arrival time till 5 days later, you can see that it ranges widely between – 3% to +3% per day (Fig.1).
Executions for this portfolio manager can’t be always passive or aggressive, due to the wide range of built-in momentum.
If you look at duration and participation histograms of the executions for this PM (Figs. 2 & 3), you will notice that most orders have been
Vlad Rashkovich
Stock Momentum (%)
-3 -2 -1 0 1 2 3
200
150
100
50
0Freq
uenc
y
Figure 1
“After you have identified an optimal execution speed and the best Broker-Algo combinations for a particular order, you can afford to drill down into these algos to see what they are doing under the hood.”
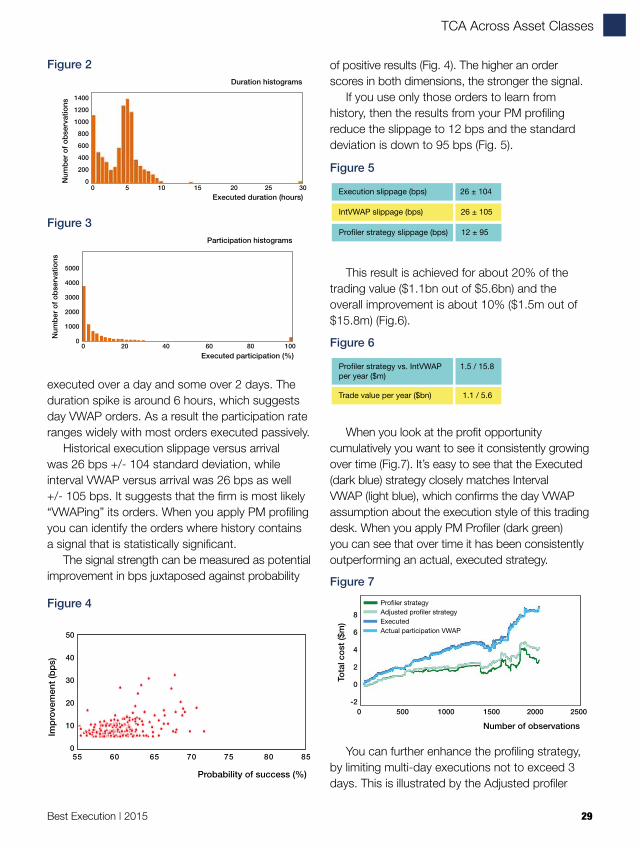
TCA Across Asset Classes
Best Execution | 2015 29
executed over a day and some over 2 days. The duration spike is around 6 hours, which suggests day VWAP orders. As a result the participation rate ranges widely with most orders executed passively.
Historical execution slippage versus arrival was 26 bps +/- 104 standard deviation, while interval VWAP versus arrival was 26 bps as well +/- 105 bps. It suggests that the firm is most likely “VWAPing” its orders. When you apply PM profiling you can identify the orders where history contains a signal that is statistically significant.
The signal strength can be measured as potential improvement in bps juxtaposed against probability
of positive results (Fig. 4). The higher an order scores in both dimensions, the stronger the signal.
If you use only those orders to learn from history, then the results from your PM profiling reduce the slippage to 12 bps and the standard deviation is down to 95 bps (Fig. 5).
This result is achieved for about 20% of the trading value ($1.1bn out of $5.6bn) and the overall improvement is about 10% ($1.5m out of $15.8m) (Fig.6).
When you look at the profit opportunity cumulatively you want to see it consistently growing over time (Fig.7). It’s easy to see that the Executed (dark blue) strategy closely matches Interval VWAP (light blue), which confirms the day VWAP assumption about the execution style of this trading desk. When you apply PM Profiler (dark green) you can see that over time it has been consistently outperforming an actual, executed strategy.
You can further enhance the profiling strategy, by limiting multi-day executions not to exceed 3 days. This is illustrated by the Adjusted profiler
Probability of success (%)
55 60 65 70 75 80 85
50
40
30
20
10
0
Impr
ovem
ent (
bps)
Number of observations0 500 1000 1500 2000 2500
8
6
4
2
0
-2
Tota
l cos
t ($m
)
Profiler strategyAdjusted profiler strategyExecutedActual participation VWAP
Execution slippage (bps) 26 ± 104
IntVWAP slippage (bps) 26 ± 105
Profiler strategy slippage (bps) 12 ± 95
Trade value per year ($bn) 1.1 / 5.6
Profiler strategy vs. IntVWAP 1.5 / 15.8per year ($m)
Figure 4
Figure 7
Figure 5
Figure 6
Duration histograms
Executed duration (hours)
Num
ber o
f obs
erva
tions
140012001000800600400200
00 5 10 15 20 25 30
Participation histograms
Executed participation (%)
Num
ber o
f obs
erva
tions
5000
4000
3000
2000
1000
00 20 40 60 80 100
Figure 2
Figure 3
TCA Across Asset Classes
30 Best Execution | 2015
strategy (light green line). It is easy to see that this adjusted strategy keeps most alpha since the light green line is very close to the dark green one. This adjusted strategy also ensures that the profiler is close to existing trading practices and the risk profile of the asset manager. Limiting the maximum number of execution days also reduces standard deviation from 104 bps to 95 bps, as you can see in Fig.5.
If you apply the profiling across all PMs at the firm, thus multiplying potential improvement by the trading volume of the firm (no high frequency firms are in this sample), it could translate to an opportunity to increase their returns for clients by tens of millions of dollars, euros and pounds annually.
Based on the research published by Bloomberg over the years, 83% of trader success comes from reading the momentum correctly. Therefore PM profiling should be at the top of the list for decision support systems for the modern trader.
Portfolio managers can also be interested in understanding their short-term momentum patterns, so this tool can and should serve both the trader and the portfolio manager.
Broker-Algo profileOnce you have identified the optimal execution speed, you can analyse historical executions to see which Broker-Algo combinations have been the most successful for an order type you are about to trade.
To help you profile Broker-Algos, some trading platforms provide peer universes containing millions of routes contributed by hundreds of buyside firms in a non-attributable way over the last few years. When a firm decides to contribute its history, it benefits in return from the entire community experience.
The same concept of multi-dimensional analysis and supervised machine learning could be used
TCA Across Asset Classes
Best Execution | 2015 31
here. Profiling of algos can be slightly different comparing to the portfolio managers, though. For instance, most algos are sector and side agnostic – two important factors for PM profiling. Spread, however, and target participation percentage are important factors for an algo selection.
The country might play a role in algo selection, since brokers adjust their algos across regions and countries. Thus an algo from a broker can carry the same name across markets but behave differently and yield different results.
As for measuring Broker-Algo results, optimal algo selection could be based not only on historical performance against a chosen benchmark or a set of benchmarks, but could also take into account consistency of historical performance and the number of observations. In some cases the outcome could be a group of Broker-Algo combinations that have been yielding similar results.
An important nuance to consider is that the same algo can behave very differently depending on the parameters selected. A passive algo, which reaches and invokes an ‘I would’ criterion, can become very aggressive and thus drastically change the algo’s behaviour. Mixing up these aggressive executions with passive ones will create a huge noise and an inconsistency in algo analysis.
Thus, you have to take parameters’ selection into account to understand the algo’s behaviour and to reduce the noise in historical observations. This is key for a successful Broker-Algo profiling, which can, according to industry advertised results, lead to 2-3 bps of outperformance.
Venue analysisAfter you have identified an optimal execution speed and the best Broker-Algo combinations for a particular order, you can afford to drill down into these algos to see what they are doing under the hood.
You should quantify the efficiency of anti-gaming mechanisms, protection against adverse
price selection and front-running. Ensuring there is no conflict of interest between the best execution obligation and the collection of maker/taker rebates is part of this analysis.
If you choose to customise Broker-Algos, you will be able to compare your results versus standard algos to measure the improvement. Custom algos might limit the ability to use peer universes and will narrow the analysis to the client specific routes only.
Once you have an optimal speed and the best algo, you should expect a potential improvement left in the venue analysis to lie in the execution tactics, and not the execution strategy. You should expect a smaller profit from venue analysis compared to PM and algo profiling.
Learn from the past Based on the above-described research and assumptions, multi-dimensional order profiling which aligns the portfolio manager, the trader and the market can generate the highest returns. This should be the top decision support tool for the modern trader.
Broker-Algo profiling can ensure the best match between your order characteristics and selected strategy. It has the second largest potential impact. Venue analysis could be a beneficial tactical tool to complement the two previous ones.
The three aforementioned decision support tools can work separately, but using them together will bring the most powerful results in maximising trading profit.
Using big data and advanced decision support tools can allow the trader to be at the vantage point and have better control in executing his order. Portfolio profitability will naturally improve, so why not learn from the past to make better pre-trade decisions?
As William Faulkner famously wrote: “The past is never dead. It’s not even past.” ■

TCA Across Asset Classes
32 Best Execution | 2015
Imminent transparencyThe EU’s Markets in Financial Instruments Regulation (MiFIR) and the second iteration of the Markets in Financial Instruments Directive (MiFID II) are changing the region’s capital markets landscape by altering the approaches buyside firms and investment banks take in making trading processes more transparent to their respective groups of clients. This article comments on the main challenges and changes within the range of transaction cost analysis (TCA) services expected by and offered by asset managers, institutional
investors and banks, as well as the best execution reporting mandates each type of company will need to comply with in the near-future.
The overarching principles of transparency inherent in the EU’s new rules are affecting all aspects of the trade lifecycle. Specifically:• pre-trade and post-trade through the
publication of quotes and transaction reporting;• all asset classes, through rules for equities,
equity-like products, bonds, OTC and listed derivatives and structured products;
• all types of trading organisations – regulated
Transaction cost analysis in a MiFID II worldAnna Pajor – Managing Consultant and Head of GreySpark’s Capital Markets Intelligence practice.
TCA Across Asset Classes
Best Execution | 2015 33
markets, multilateral trading facilities, newly-created organised trading facilities and systematic internalisers;
• the creation of granular information related to the decision-maker behind an investment decision or a detailed breakdown of all costs related to a trade; and
• the annual reporting of execution quality at the leading trading venues.
The main game-changers for the EU’s revised trade transparency rules are the creation of new transaction reporting mechanisms and data aggregators. In particular, MiFID II is set to create a consolidated trade tape for Europe’s equities markets that will provide investors with an even view on equities prices and which will set European benchmarks for best-bid-and-offer statistics.
The three main consequences of greater transparency in European capital markets trading will be: the application of equities-like best execution models for other asset classes; changes to client trade reporting and internal sellside trade reporting mandates; and requirements to conform to external price benchmarks. MiFID I established a set of principles for best execution for equities in Europe, which will be expanded to non-equities instruments in MiFID II. However, many non-equities instruments have different structural liquidity dynamics, and they are traded in different ways. Therefore, an expansion of MiFID I’s best execution mandate requires market participants to engage in a rethink of their approach to trade execution on an asset class-by-asset class basis.
Additionally, existing buyside and sellside metrics used to evaluate broker performance on trades or to evaluate the performance of specific traders will be challenged under MiFID II
to provide a greater level of insight on the quality of trade execution. The additional benchmark – a consolidated tape – for equities will challenge the veracity of previously-used, broker-specific or client-specific benchmarks.
Navigating to a more transparent world Based on an assessment of common industry practices across the leading banks, hedge funds, asset managers and technology vendors, GreySpark Partners has observed a variety of MiFID II trade execution issues that are common to them all. For example, when offering their clients TCA and best execution reporting, the companies must evaluate if existing practices are sufficient in the context of the new regulatory framework. In particular, the evaluation needs to ask:• Are the right instruments covered under
MiFID II’s best execution reporting and TCA standards?
• Is the time and trading context captured properly?
• Are all direct and indirect costs captured?• Are the costs properly categorised and
attributed?• What is the accuracy of the timestamp, and are
the time-stamping clocks synchronised?The availability of new European trade execution benchmarks for equities through the creation of a consolidated tape for each benchmark may challenge the nature of some existing buyside and sellside execution policy methodologies. Specifically, the MiFID II requirements will challenge underlying models for providing and proving best execution reporting and for calculating costs.
Banks should also consider if the frequency at which they distribute TCA information to
“There are some emerging technology vendor solutions focusing on FX or on fixed income TCA only. But the leading banks in each market are now also offering or building their own bonds, currencies or interest rates derivatives TCA and execution advisory tools in-house.”
TCA Across Asset Classes
34 Best Execution | 2015
their clients is sufficient. At the least, the EU regulations specify an annual reporting schedule. But, in the new, data-driven rather than relationship-driven world, annual communication of transactions analysis data is considered as significantly insufficient.
The end of ‘not-the-worst’ execution?Post-MiFID I, the most common claim regarding the directive’s best execution rules was that the client did not receive the worst-possible execution level – trade execution was done on a price/at-the-cost that was not the worst in the given context of when the trade was made. One of the problems with obtaining the best rather than not-the-worst execution is the lack of reliable, comprehensive pricing benchmarks.
A European consolidated tape would fix that problem. However, it will not be sufficient to provide best execution. This reality emanates from the fact that the quality of the execution can be evaluated fully only after the trade is done, in the context of the market’s movements in reaction to the order, and in the context of all events that occurred during the execution period.
Execution strategies are typically built and selected based on historical information on market behaviour for an instrument, and on the historical outcomes associated with trading it at any given point in time. Therefore, by default, the pre-trade assessment is not universally applicable to all future market scenarios and, as a result, is insufficient to guarantee ultimately the best outcome.
A European consolidated tape would, however, change the benchmark used to evaluate not-the-worst execution, and it will raise the bar for pre-trade TCA or execution advisory to take into account a Europe-wide context for the underlying analytics.
The best-possible tool for use in supporting – but not yet resolving – MiFID II’s goal to create a best execution environment is real-time TCA software. These types of so-called in-trade analytics can advise their users if the original, planned execution strategy is on course to be the best one possible.
A brave new world in the makingHowever, the development landscape for TCA tools supporting real-time analytics and proof of best execution is uneven. A GreySpark review of the leading TCA providers in 2014 showed that post-trade TCA for equities trading is fully commoditised, with in-trade and pre-trade analytics delivered by 10 out of the 11 equity specialists surveyed.
FX analytics is the second-most sophisticated asset class in terms of real-time TCA maturity, with eight out of 11 equities TCA specialists surveyed by GreySpark seen offering FX post-trade TCA. Out of those eight FX TCA providers, three were seen by GreySpark as offering pre-trade execution advisory tools.
Fixed income is the most difficult asset class for TCA tools to penetrate due to a lower level of electronic trading in, primarily, corporate bonds, and a lower level of overall transparency in the asset class as a whole when compared to equities or FX. Therefore, only two out of 11 vendors surveyed by GreySpark were seen offering post-trade TCA for fixed income products. Meanwhile, pre-trade TCA for fixed income products remains an unexplored area.
There are some emerging technology vendor solutions focusing on FX or on fixed income TCA only. But the leading banks in each market are now also offering or building their own bonds, currencies or interest rates derivatives TCA and execution advisory tools in-house. It is important to emphasise, however, that those tools will only be effective for their client base of users in the context of the liquidity that is accessible through the bank.
As the technology supporting TCA matures and expands across asset classes, incorporating real-time analysis, the EU’s regulatory principle of providing best execution as it is enshrined in MiFID II will move closer to becoming a reality. However, as the end of 2015 approaches, the provision of independent buyside and sellside technology tools and pricing benchmarks making the development of truly robust best execution still seems like a holy grail. ■
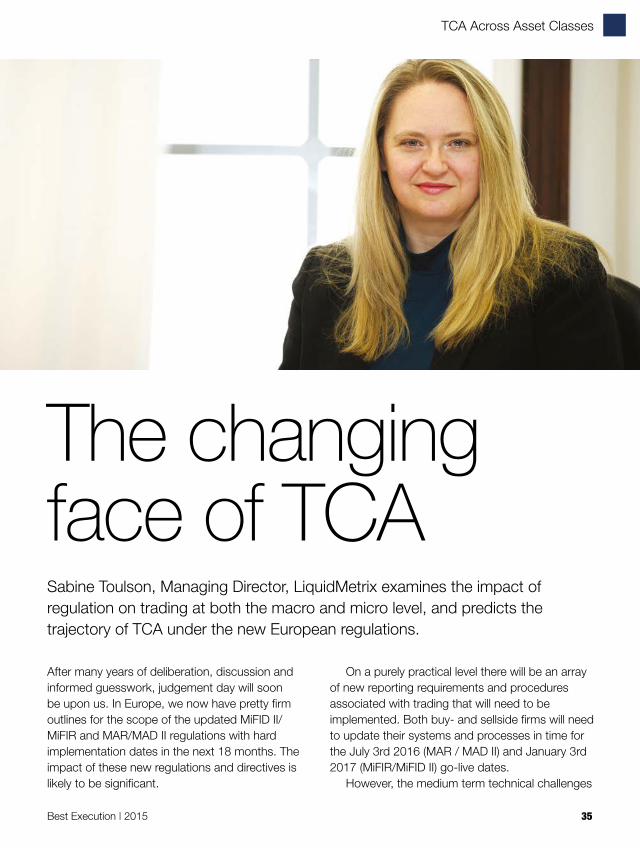
TCA Across Asset Classes
Best Execution | 2015 35
After many years of deliberation, discussion and informed guesswork, judgement day will soon be upon us. In Europe, we now have pretty firm outlines for the scope of the updated MiFID II/MiFIR and MAR/MAD II regulations with hard implementation dates in the next 18 months. The impact of these new regulations and directives is likely to be significant.
On a purely practical level there will be an array of new reporting requirements and procedures associated with trading that will need to be implemented. Both buy- and sellside firms will need to update their systems and processes in time for the July 3rd 2016 (MAR / MAD II) and January 3rd 2017 (MiFIR/MiFID II) go-live dates.
However, the medium term technical challenges
The changing face of TCASabine Toulson, Managing Director, LiquidMetrix examines the impact of regulation on trading at both the macro and micro level, and predicts the trajectory of TCA under the new European regulations.
TCA Across Asset Classes
36 Best Execution | 2015
brought about by the new regulations are unlikely to stop there as the implementation is quite likely to alter the market microstructure itself. As an example, and foretaste, the imminent imposition of limits on ‘Dark’ trading (the 4% / 8% caps) and the demise of Broker Crossing Networks (BCNs) are most likely the driving factor behind a number of recent innovations in European equity markets. Examples include: London Stock Exchange’s new intraday auction, BATS Europe’s new continuous intraday periodic auctions, Turquoise’s Block Discovery service and the proposed new Dark Pool, Plato. These changes are already throwing up new opportunities and obligations for investment firms to consider.
One could argue that the most significant practical impact to trading firms – especially sellsides – from the MiFID I regulations adopted in 2007, was not only the immediate new direct reporting/process requirements that went live in 2007, but also the fact that the new regulations heralded lit market fragmentation, starting a technological arms race of Smart Order Routers / HFT market making / Dark Pools / BCNS and so on. Keeping up with these rapid changes in trading microstructures brought about by the new regulations required significant investments by firms in the years following MiFID I implementation. The real sting was in the tail.
It will be interesting to see what impact MiFID II will have on the market microstructure of, for example, fixed income trading. It may well be that the immediate requirements imposed by the new regulations are the start, not the end, of larger changes to the technologies and processes used to trade these markets.
Let’s consider the areas of the new regulations that are likely to impact TCA, best execution and reporting.
Extension to more asset classesOne of the biggest changes in MiFID II is that a number of the more onerous requirements related to Best Execution monitoring and pre- and post-trade reporting, that were previously limited to equity instruments, are now extended to other
asset classes; most significantly perhaps fixed income and listed derivatives.
This will be challenging. One of the more persistent complaints following MiFID I implementation was that the lack of an official ‘consolidated tape’ (such as NBBO in the US) made monitoring best execution difficult for firms. In fact, the situation was not really so bad. All the ingredients required to make your own ‘EBBO’ tape were available (market data feeds from exchanges / reporting venues) so the challenge was more of a technical nature to gather this data and stitch it together (or asking someone else, whether a market data supplier or TCA firm, to do it for you).
However, if we now consider best execution for fixed income trading, the problems of a lack of an EBBO tape in equities look pretty small by comparison. For many fixed income instruments, instead of deep public, lit order books with firm prices, we have less formalised, quote-driven trading. Also there are many (by equity standards) illiquid instruments that trade alongside relatively liquid ‘similar’ instruments.
So, when we try to assess a fair benchmark price to measure fixed income best execution: • Do we use all quotes visible in the market, or
only private, firm quotes? Can we add volumes from multiple quotes or assume only one quote from one venue / provider is ‘valid’. And how do we assess the time validity of quotes if they are not explicitly stated?
• If there is a trade today in an instrument that last traded three weeks ago and for which we only have very wide indicative quotes for today, do we use the firm traded price of three weeks ago or do we use the more recent private or non-firm quotes? Alternatively, do we use a model that takes the firm price of three weeks ago, adjusted by the implied price change due to market wide yield curve movements in the meantime?
Of course TCA firms like ourselves are currently busy sourcing data and coming up with solutions to the questions above. But it’s most likely the case that methodologies for best execution are going to
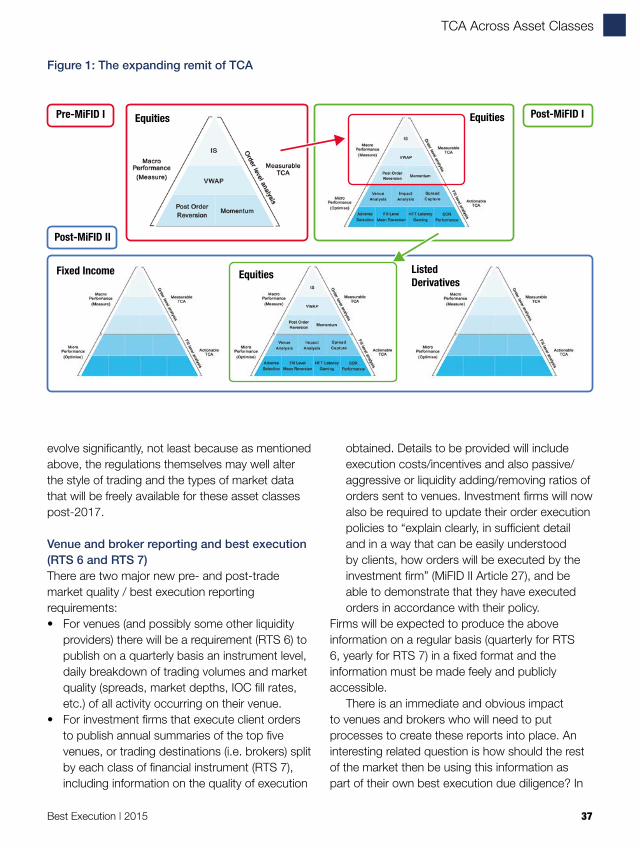
TCA Across Asset Classes
Best Execution | 2015 37
evolve significantly, not least because as mentioned above, the regulations themselves may well alter the style of trading and the types of market data that will be freely available for these asset classes post-2017.
Venue and broker reporting and best execution (RTS 6 and RTS 7)There are two major new pre- and post-trade market quality / best execution reporting requirements:• For venues (and possibly some other liquidity
providers) there will be a requirement (RTS 6) to publish on a quarterly basis an instrument level, daily breakdown of trading volumes and market quality (spreads, market depths, IOC fill rates, etc.) of all activity occurring on their venue.
• For investment firms that execute client orders to publish annual summaries of the top five venues, or trading destinations (i.e. brokers) split by each class of financial instrument (RTS 7), including information on the quality of execution
obtained. Details to be provided will include execution costs/incentives and also passive/aggressive or liquidity adding/removing ratios of orders sent to venues. Investment firms will now also be required to update their order execution policies to “explain clearly, in sufficient detail and in a way that can be easily understood by clients, how orders will be executed by the investment firm” (MiFID II Article 27), and be able to demonstrate that they have executed orders in accordance with their policy.
Firms will be expected to produce the above information on a regular basis (quarterly for RTS 6, yearly for RTS 7) in a fixed format and the information must be made feely and publicly accessible.
There is an immediate and obvious impact to venues and brokers who will need to put processes to create these reports into place. An interesting related question is how should the rest of the market then be using this information as part of their own best execution due diligence? In
Pre-MiFID I Post-MiFID I
Fixed Income Equities ListedDerivatives
Equities Equities
Post-MiFID II
Figure 1: The expanding remit of TCA

TCA Across Asset Classes
38 Best Execution | 2015
principle, the RTS 6 reports provide a lot of detailed daily instrument level information on execution quality (albeit on a delayed basis). So what weight, if any, should firms be taking from this RTS 6 data when selecting which trading venues they should use? The RTS 7 reports give some useful detail on venue preferences and best execution policies of brokers, but how might buysides use this data in their broker selection decisions? From a TCA perspective is this data actually useful and if so how should it be used?
More generally, the requirement to clearly explain best execution policies to clients and to follow “all sufficient steps” (MiFID II Article 27) to achieve best possible results for clients is likely to lead to investment firms moving beyond ‘tick box TCA’ and towards providing a coherent, well thought out and quantifiable approach to all aspects of execution quality (see Figure 1).
Starting from parent level TCA analysis pre MiFID I, TCA has expanded to incorporate all aspects of execution quality over multiple venues and asset classes.
What does this mean for TCA?If we wind the clock back to before MiFID I, TCA was a relatively simple exercise based on parent order analysis (usually limited to equity markets) with some standard top-level benchmarks such as Implementation Shortfall (IS) and VWAP giving general guidance on relative implicit costs of trading.
Post MiFID I, LiquidMetrix often makes the case that the additional complexity of trading due to lit venue fragmentation, algos and the emergence of HFTs and dark pools meant that to get a proper sense of execution quality, TCA really required
drilling down into the micro level: our ‘Pyramid’ view of TCA.
Many of the high profile perceived ‘problems’ related to equity trading – such as HFT gaming and toxic dark pools – in recent years were largely invisible to standard top-level TCA analysis. To properly address concerns about such activities one needed to go beyond the basics. Some of the changes in MiFID II (for instance the new emphasis on venue/fill level reporting) are playing catch-up with the way equity markets currently work.
Possibly the most significant changes in MiFID II are the extensions to other asset classes. This presents an immediate set of challenges in acquiring market data sources to properly benchmark and assess best execution. As the trading microstructures of some of these new markets are very different to cash equities it will also mean thinking more deeply about how to define best execution for these asset classes.
As always, the temptation is to try and come up with a single set of measures common across asset classes. But as we saw with equity trading in Europe post MiFID I, if the underlying market structure and dynamics change then any effective best execution monitoring must be able to adapt to reflect these changes. So trying to simply copy ‘equity TCA’ methods to other asset classes may lead to inappropriate or worse, misleading, analysis of execution quality.
So be prepared for TCA methods to initially ‘fragment‘ for a period of time as the most appropriate methods of measuring execution quality in different markets evolve.
Of course, in the longer term, it is possible that the trading ecosystems of different asset classes might start to converge (we see some evidence of this in equity/FX markets) and a single set of TCA methods may work for all asset classes again. But in the short term, we think care needs to be taken not to try to force square pegs into round holes.
In summary, over recent years TCA has evolved rapidly to stay relevant to today’s markets. In the coming years that speed of evolution is only likely to increase. ■
“Over recent years TCA has evolved rapidly to stay relevant to today’s markets. In the coming years that speed of evolution is only likely to increase.”Sabine Toulson, LiquidMetrix
Best Execution | 2015 39
TCA Across Asset Classes
Company profiles
40 Best Execution | 2015
Company profile
goldsponsor
platinumsponsor
Bloomberg, the global business and financial information and news leader, gives influential decision makers a critical edge by connecting them to a dynamic network of information, people and ideas. The company’s strength – delivering data, news and analytics through innovative technology, quickly and accurately – is at the core of the Bloomberg Professional service, which provides real time financial information to more than 325,000 subscribers globally. Bloomberg’s enterprise solutions build on the company’s core strength, leveraging technology to allow customers to access, integrate, distribute and manage data and information across organisations more efficiently and effectively.
Through Bloomberg Government, Bloomberg New Energy Finance and Bloomberg BNA, the company provides data, news and analytics to decision makers in industries beyond finance. And Bloomberg News, delivered through the Bloomberg Professional service, television, radio, mobile, the Internet and three magazines, Bloomberg Businessweek, Bloomberg Markets and Bloomberg Pursuits, covers the world with more than 2,400 news and multimedia professionals at 150 bureaus in 73 countries. Headquartered in New York, Bloomberg employs more than 15,500 people in 192 locations around the world.
www.bloomberg.com/professional
Markets • Thought Leadership • Investment Research • Transparency • Trading
ITG is an independent execution and research broker partnering with global portfolio managers and traders throughout the investment process, from investment decision through to settlement. With our launch of the POSIT® crossing network in 1987, we founded ITG with a strong commitment to empower buyside investors. And over the years, we’ve continued to deepen that commitment by creating a powerful network of intellectual capital, true industry experience, and market-leading technology to offer the unmatched insights that help clients generate and preserve alpha.
With 15 offices in 9 countries and multi-asset capabilities that support the needs of large equity portfolios, we combine the power of global reach with the precision of local vision. Bringing together market-leading tools and unmatched expertise, we have helped clients understand market trends, improve
performance, mitigate risk, and navigate increasingly complex markets.
Above all else, we are driven by an unwavering commitment to service – we put clients’ interests first. We do not offer buy-sell recommendations and have no conflict of interest. We are your trusted, strategic partner offering objective insights and guidance through complicated and changing global market structures.
Headquarters:One Liberty Plaza, 165 Broadway, New York, NY 10006 Main: +1 212 588 4000 Electronic Sales & Trading: +1 800 814 1787 or +1 212 444 6100
London:Ropemaker Place, 25 Ropemaker Street, London EC2Y 9LY, UKMain: +44 (0)20 7670 4000Sales & Trading: +44 (0)20 7670 4100
www.itg.com
Best Execution | 2015 41
Company profile
Founded in 1996, FlexTrade is the industry pioneer and global leader in broker-neutral execution and order management systems for equities, foreign exchange and listed derivatives. With offices in North America, Europe and Asia, FlexTrade has a worldwide client base spanning more than 175 buy- and sell-side firms, including many of the largest investment banks, hedge funds, asset managers, commodity trading advisors and institutional brokers. FlexTRADER, our fully customisable EMS, comes with pre-defined trading strategies and tactics for portfolio
and single stock trading. FlexTCA offers comprehensive real-time and historical transaction cost analysis across multiple asset classes, and forms part of our MiFID II / Best Execution framework. The FlexTrade platform provides organically developed real-time and post-trade analytics as well as risk and cost optimised portfolio trade scheduling; advanced integrations with major OMSs; integrated real-time allocations and cash management; smart order routing; a sophisticated Dark Pool Router; commission management; complete transaction and IOI quality management; and a dynamic strategy matrix.EMEA: +44 (0)20 7929 2332; [email protected]: +1 516 627 8993; [email protected]: +65 6829 2569; [email protected]
www.flextrade.com
IFS LiquidMetrix is based in London, and are experts in financial market data research and execution quality analysis. IFS developed the LiquidMetrix suite of services focussed on execution quality assessment, transaction cost analysis and pre-trade cost prediction across increasingly fragmented global equity markets.The product Suite has recently been extended to include detection and alerting on patterns of market abuse to meet the MAD, MiFIR and ESMA guidelines.
The IFS LiquidMetrix Pre and Post-Trade Analysis services provide the sophisticated analytics required for performance measurement, and are made possible
through our suite of proprietary tools for optimal storage and retrieval of trades, and full depth order book data from multi-terabyte databases of equity venue data. The TCA methods we’ve developed are uniquely suited to reflect modern multi-venue trading realities and, among other features, include the modelling of venue latency effects allowing for realistic performance analysis on both algorithmic and Smart Order Routed trade flows.
The LiquidMetrix products allow brokers as well as trading firms to monitor and compare the performance of their order routing technology / algorithms / broker DMAs, and to make informed decisions.
Tel: +44 (0)20 3432 5610Email: [email protected]
www.liquidmetrix.com
GreySpark Partners is a management consultancy focusing exclusively on the Trading and Risk Management aspects of Capital Markets. Covering all asset classes, we engage directly with department heads to solve the complex issues faced by financial institutions at the cross road of business and technology.• Electronic trading including exchange connectivity,
order routing, client connectivity, market data, algorithmic trading and e-commerce.
• Risk and Position Management including portfolio
management, valuation, P&L calculation and reporting, credit, market and operational risk as well as post trade processing.
• Data Management including reference and historical data management, decision support and analytics, compliance and reporting.
• OTC clearing broker due diligence and selection service assists clients in choosing the clearing broker solution that is right for them. We provide an independent, efficient and cost-effective advice on the solution that reduces unnecessary risks and costs for clients now and in the future.
Tel: +44 (0)20 7011 9870Email: [email protected]
www.greyspark.com
42 Best Execution | 2015
Company profile
Our ReputationAbel/Noser has long been respected as a leader in the campaign to lower the costs associated with trading. We provide a range of effective tools and services for institutional sponsors and investment managers. For more than 30 years, Abel/Noser has been providing Transaction Cost Analysis and consultation that help our clients achieve savings.
Our ProductGlobal TCA coverage in Equities, Foreign Exchange and Derivatives • Pre-trade, Real-Time and Post-trade TCA• Fill Level Analysis to evaluate Brokers, Algos & Venues across fragmented Lit & Dark liquidity
pools• Fund Manager timing profiles to facilitate optimal execution strategy & alpha capture• Relative performance rankings using our extensive client peer universe
Compliance focused analysis to satisfy global regulatory directives and obligations• Best Execution, MiFID I & II, FCA Market Abuse, Dodd-Frank, SFC & other regional regulatory
directives
Web based interface• Highly graphical and visual, fast and user-friendly• Enables users to immediately view, drill down and graph trading activity
Custom TCA report templates for internal or external client distribution
Our DifferenceTCA has been an Abel/Noser core competence for over 30 years• Independent, privately-owned firm focused on providing leading TCA solutions
Consultative and service approach• Regular on-site meetings to review and interpret TCA results• Focus on providing actionable recommendations from TCA
Large peer universe• $7.5 trillion in annual equity principal traded • Over 500 institutional clients including Investment Managers, Plan Sponsors, Brokers
Contact us for a free, no obligation TCA trial: Europe: +44 (0)20 7058 2108 [email protected]: +44 (0)20 7058 2109 [email protected]: +1 646 432 4050 [email protected]
www.abelnoser.com
Best Execution | 2015 43
Company profile
Achieving Best Execution in FX: Execution Quality AnalysisTransaction cost analysis, well established in equity markets, is now an important component of foreign exchange execution strategies.
The driving force behind this trend is increased foreign exchange (FX) industry scrutiny and regulatory pressure resulting from a number of market conduct scandals.
In its report that laid out recommendations for changes to the WM/Reuters Benchmark fix, the Financial Stability Board’s FX Benchmark Group states, “Asset managers, including those passively tracking an index, should conduct appropriate due diligence around their foreign exchange execution and be able to demonstrate that to their own clients if requested. Asset managers should also reflect the importance of selecting a reference rate that is consistent with the relevant use of that rate as they conduct such due diligence.”
With structural changes and heightened scrutiny in the foreign exchange market, institutions are increasingly held to account over how they transact their FX business. Customers generally have fiduciary responsibilities: if they are asset managers, to the people whose assets they manage; if they are corporations, to shareholders. Institutions that perform transaction cost analysis (TCA) on their FX executions can identify improvement strategies and differentiate their offerings.
Thomson Reuters offers two TCA products for its FX customers. For customers who trade on its market leading multibank platform, FXall, Thomson Reuters provides Execution Quality Analysis (EQA). EQA provides deep insight into the performance of different FX execution strategies, helping customers understand how to better meet their execution goals and satisfy requirements around the evaluation and benchmarking of trade performance.
With EQA, customers can review a comprehensive summary of currency pairs traded, trade size and time of execution, in addition to spreads and response times received by counterparty. Comparing this summary data to market median statistics helps customers determine the time of day, size and counterparty to use for trades in different currency pairs and instrument types. Customers can also evaluate their executions against a variety of benchmarks, including the highs and lows of the day or reference rates, to measure performance.
The FXall platform offers customer choice in execution methods, including multibank request-for-quotes (RFQs), central limit order books and advanced execution algorithms. Customers can use EQA reports to compare these execution options and determine which is most suitable for a particular trading objective.
For example, if a customer has a large portfolio of trades in a variety of currency pairs and tenors, it could be advantageous to collaborate directly with a bank to identify valuable cross-currency netting opportunities. Where a customer has a large order in a specific currency, they could consider more actively managing their risk by trading on the central limit order book or using a bank algorithm to reduce market impact and save on execution costs.
By leveraging the insight from EQA reports and the multiple execution methods on FXall, institutions can efficiently and effectively maximize their execution performance and demonstrate best practice.
For more information, visit: www.thomsonreuters.com/fx
44 Best Execution | 2015
Company profile
TCA for the fixed income marketsThe unique characteristics of the bond markets make the development of a relevant and accurate fixed income TCA solution highly complex. Therefore, a deep knowledge of market structure and how these products trade, along with access to sufficient depth, accuracy and cleanliness of transaction data, are essential ingredients for a strong methodology.
Tradeweb is extremely well positioned to provide bond market TCA solutions because of its long history in operating fixed income marketplaces. By centralising fixed income trading activity, we can combine our proprietary composite data, which offers a precise, time-stamped reference price, with a broad set of executed trade data to accurately measure the cost of execution.
Providing buy-side firms with direct access to TCA reports means that analysis can be carried out directly by the trading desk. Comprehensive reports detail its transactions, and metrics quantify execution performance over a period of time. Trades can be assessed by looking at execution data such as time of day, trade size, sector, and number of counterparties in competition. This provides specific direction for traders, who can adapt their trading behaviour accordingly.
TCA reports can also be used by sales teams when pitching their trading desk’s performance, and by compliance to determine whether their best execution policies need strengthening in any area.
A powerful tool to provide insight into trading performance Tradeweb TCA is a performance measurement tool that allows users to evaluate their executions on Tradeweb against the proprietary Tradeweb composite, and assess the strengths in their fixed income trading.
The solution offers trusted composite and reliable dealer-to-client fixed income trading data for a variety of asset classes. Tradeweb is uniquely positioned to provide an accurate reflection of transaction costs due to the precision of its composite and execution levels.
The Tradeweb TCA offering gives you:• customised reporting based on trading
strategy/methodology • detailed analysis on how users can
improve their trading performance by reducing transaction costs
• enhanced best execution
Available across all Tradeweb tradable cash bonds including:• European government bonds• European credit• Covered bonds• Supranational, agencies and sovereigns
(SAS)• US treasuries• Japanese government bonds
Europe: +44 (0)20 7776 3200 europe.clientservices@ tradeweb.com
North America: +1 800 541 2268 [email protected]
Asia: Tokyo +81 (0)3 6441 1020 Hong Kong +852 2847 8030 Singapore +65 6417 4532 [email protected]
www.tradeweb.com