Tax Capacity, Fiscal Federalism and Development · Tax Capacity, Fiscal Federalism and Development...
64
Tax Capacity, Fiscal Federalism and Development ",, (+-(0' '"/+,"-2, ' "'",-+2 ( "'', !' -(+ 1, 2015
-
Upload
nguyenthuan -
Category
Documents
-
view
216 -
download
0
Transcript of Tax Capacity, Fiscal Federalism and Development · Tax Capacity, Fiscal Federalism and Development...
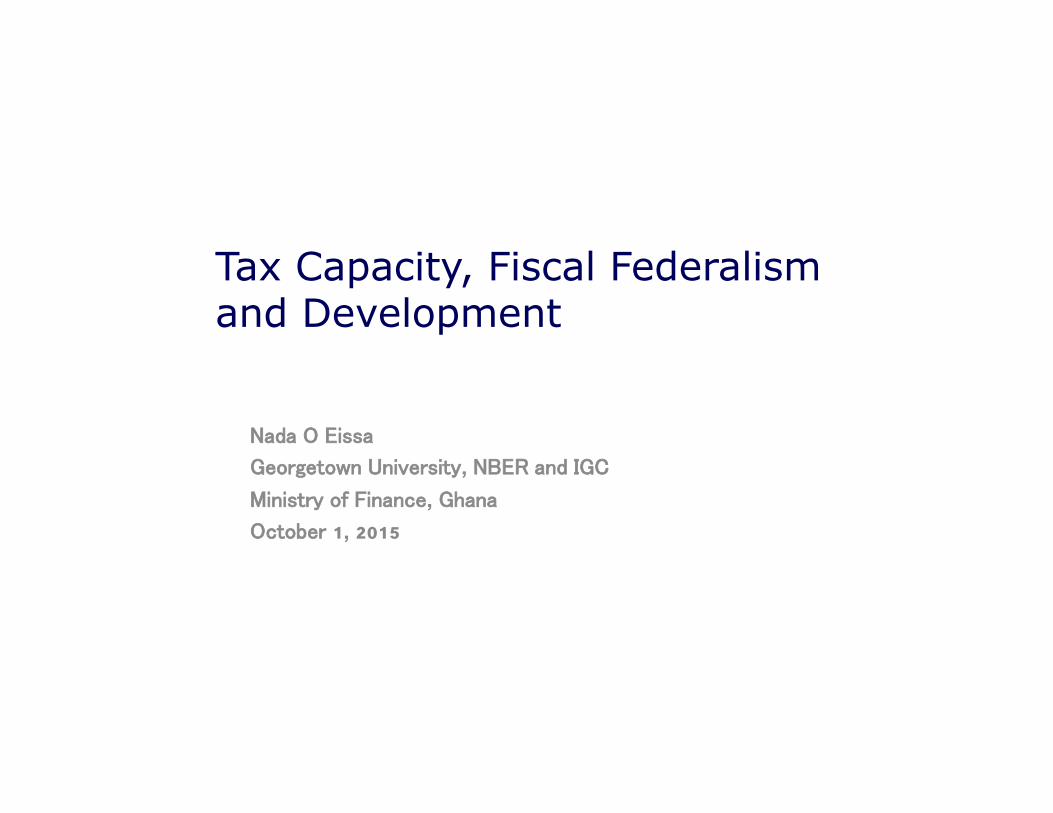
Tax Capacity, Fiscal Federalism and Development
���� � �",,�
��(+ �-(0' �'"/�+,"-2, ���� �'� ��
�"'",-+2 (� �"'�'��, �!�'�
��-(��+ 1, 2015

��1�-"(' �'� ��/�%()&�'- �q ︎��1�-"(' ", ��'-+�% -( �(-! ,-�-� �'� ��('(&"�
��/�%()&�'-
OLS Coefficient: 5.72 (1.24)
010
2030
4050
Tota
l taxe
s / G
DP
7 8 9 10 11Log GDP per Capita in 2005
A. Total Tax Revenue to GDP
Source: Kleven, Kreiner, Saez (2015)
��1�-"(' �'� ��/�%()&�'- �
q ︎�+"-"��% *.�,-"(', "' -!� �"�%� (� ��/�%()&�'- �(+ )(%"�2&�$�+, �'� �����&"�,
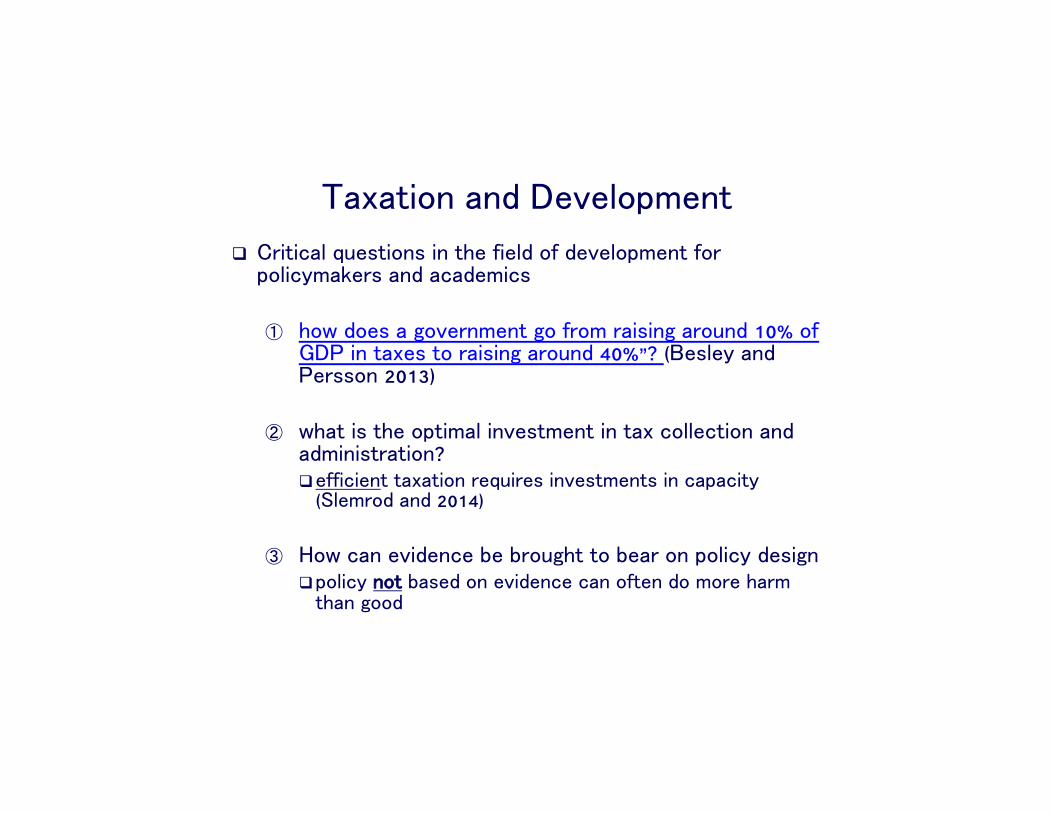
5 !(0 �(�, � (/�+'&�'- ( �+(& +�","' �+(.'� 10% (� ��� "' -�1�, -( +�","' �+(.'� 40%”? (��,%�2 �'� ��+,,(' 2013)
6 0!�- ", -!� ()-"&�% "'/�,-&�'- "' -�1 �(%%��-"(' �'� ��&"'",-+�-"('?q ���"�"�'- -�1�-"(' +�*."+�, "'/�,-&�'-, "' ��)��"-2
(�%�&+(� �'� 2014)
7 (0 ��' �/"��'�� �� �+(. !- -( ���+ (' )(%"�2 ��," 'q )(%"�2 '(- ��,�� (' �/"��'�� ��' (�-�' �( &(+� !�+& -!�' ((�
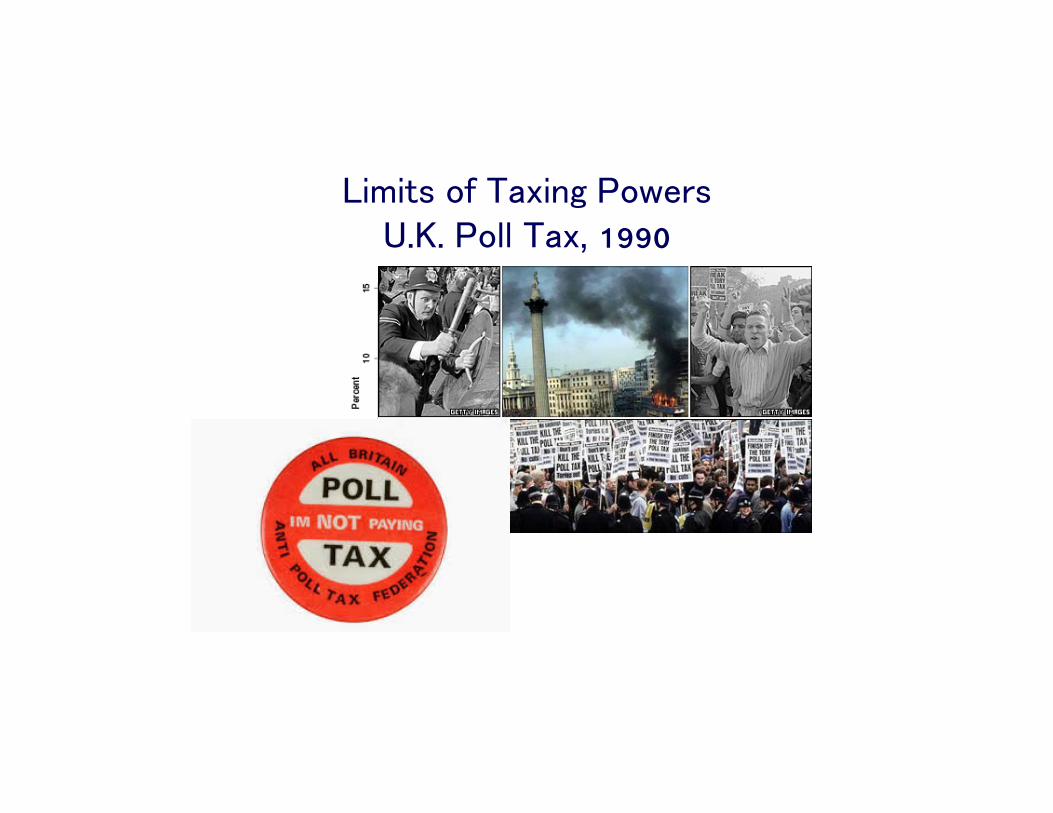
"&"-, (� ��1"' �(0�+, ��.�. �(%% ��1, 1990

��1�-"(' �'� ��/�%()&�'- �
q ︎�+"-"��% *.�,-"(', "' -!� �"�%� (� ��/�%()&�'- �(+ )(%"�2&�$�+, �'� �����&"�,
5 !(0 �(�, � (/�+'&�'- ( �+(& +�","' �+(.'� 10% (� ��� "' -�1�, -( +�","' �+(.'� 40%”?(��,%�2 �'� ��+,,(' 2013)
6 0!�- ", -!� ()-"&�% "'/�,-&�'- "' -�1 �(%%��-"(' �'� ��&"'",-+�-"('?q ���"�"�'- -�1�-"(' +�*."+�, "'/�,-&�'-, "' ��)��"-2
(�%�&+(� �'� 2014)
7 (0 ��' �/"��'�� �� �+(. !- -( ���+ (' )(%"�2 ��," 'q )(%"�2 '(- ��,�� (' �/"��'�� ��' (�-�' �( &(+� !�+& -!�' ((�

�.-%"'�
1. ��,"� ��--�+', �'� �+�'�,
2. �('��)-.�% �+�&�0(+$�) ��,"� ��('(&"� &(��%
�) ��1 ������� �))+(��!
3. �&)"+"��% "-�+�-.+�: �!�- �/� �� ��+'���) ��-!(�,: &(��%"-"�, �'� -��!'"��%"-"�,�) �/"��'��
4. �",��% ����+�%",& �'� �*."-2
5. �"+��-"(', �(+ �+��-"-"('�+, �'� �(%"�2&�$�+,

��1�-"(' �'� �",��% ��)��"-2 "' ��/�%()"' �(.'-+"�,
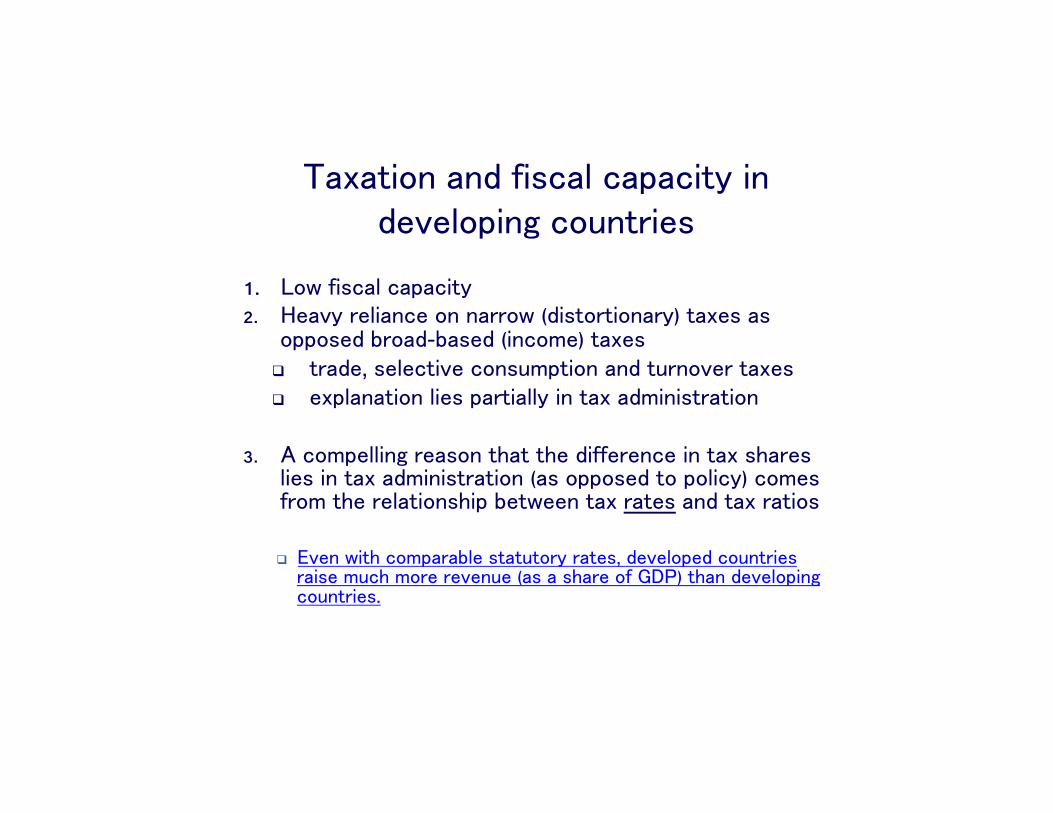
1. (0 �",��% ��)��"-2
2. ��/2 +�%"�'�� (' '�++(0 (�",-(+-"('�+2) -�1�, �, ())(,�� �+(��-��,�� ("'�(&�) -�1�,
q �+���, ,�%��-"/� �(',.&)-"(' �'� -.+'(/�+ -�1�,
q -�1 ��&"'",-+�-"('

0.1
.2.3
.4.5
Share
of ta
xes in G
DP
(1999)
6 7 8 9 10 11Log GDP per capita in 2000
High income in 2000 Mid income in 2000
Low income in 2000 Fitted values
A. Country-level taxes and income
0.1
.2.3
.4.5
5 y
ear
avera
ges o
f share
of ta
xes in G
DP
6 7 8 9 10 115 year averages of log GDP per capita
1900-39 1940-49 1950-69
1970-99 Fitted values
B. Global-level taxes and income
Figure 3: Tax revenue and GDP per capita
such tax allocations may encourage smuggling, this is a much easier propo-sition than collecting income taxes. The latter requires major investmentsin enforcement and compliance structures throughout the entire economy.We can thus obtain an interesting indication of fiscal-capacity investmentsby holding constant total tax revenue, and ask how large a share of it iscollected from trade taxes and income taxes, respectively.These shares are plotted against each other in Figure 4.4 Again, we report
the cross-sectional pattern for the year 2000, based on data from Baunsgaardand Keen (2005), and the time-series pattern over the last 100 years based onhistorical data from Mitchell (2007). The income-tax share is displayed onthe vertical axis, and the trade-tax share on the horizontal axis. We observea clear negative correlation: countries with a higher reliance on income taxestend to have less reliance on trade taxes. The left panel also shows a strikingpattern by income: high-income countries depend more on income taxes,while middle- and — in particular — low-income countries depend more ontrade taxes. The right panel of Figure 4 shows that the move from tradeto income taxes has also been a feature of the historical development of taxsystems. Again, the cross-sectional and time-series patterns look strikingly
4Other taxes not included in either trade or income taxes include indirect taxes suchas VAT, property and corporate taxes.
7
�"�!�+ �(.'-+"�, �(%%��- � &.�! %�+ �+ ,!�+� (� -!�"+ "'�(&� "' -�1�, -!�' �( )((+�+ �(.'-+"�,.
"'�(&�
��1
/���
-"&�
�%(��%
��1/�
��

��1�-"(' �'� �",��% ��)��"-2 "' ��/�%()"' �(.'-+"�,
1. (0 �",��% ��)��"-2
2. ��/2 +�%"�'�� (' '�++(0 (�",-(+-"('�+2) -�1�, �, ())(,�� �+(��-��,�� ("'�(&�) -�1�,
q -+���, ,�%��-"/� �(',.&)-"(' �'� -.+'(/�+ -�1�,

0.2
.4.6
.8Sh
are
of in
com
e ta
xes (
1999
)
0 .2 .4 .6Share of trade taxes (1999)
High income in 2000 Mid income in 2000Low income in 2000 Fitted values
A. Country-level income and trade taxes by GDP
0.2
.4.6
.85
year
ave
rage
s of s
hare
of in
com
e ta
x
0 .2 .4 .65 year averages of share of trade tax
1900-39 1940-49 1950-691970-99 Fitted values
B. Global-level income and trade taxes by time period
Figure 4: Income taxes and trade taxes
similar with a very similar slope of the regression lines.
Figure 5 zooms in on the income tax, plotting the relationship between
the share of income taxes in total taxes and income per capita, in the current
cross section as well as the historical time series. The left panel separates
the observations into three groups by tax take: countries that raise more
than 25% of taxes in GDP, countries that raise 15-25% of taxes in GDP, and
countries that raise less than 15%. The countries in the high-tax group again
look markedly di�erent, raising much more of their tax revenues in the formof income taxes. The right panel again colors observations by time period.
A striking similarity between the historical situation of this sample of older
nations and the developing world today is again apparent.
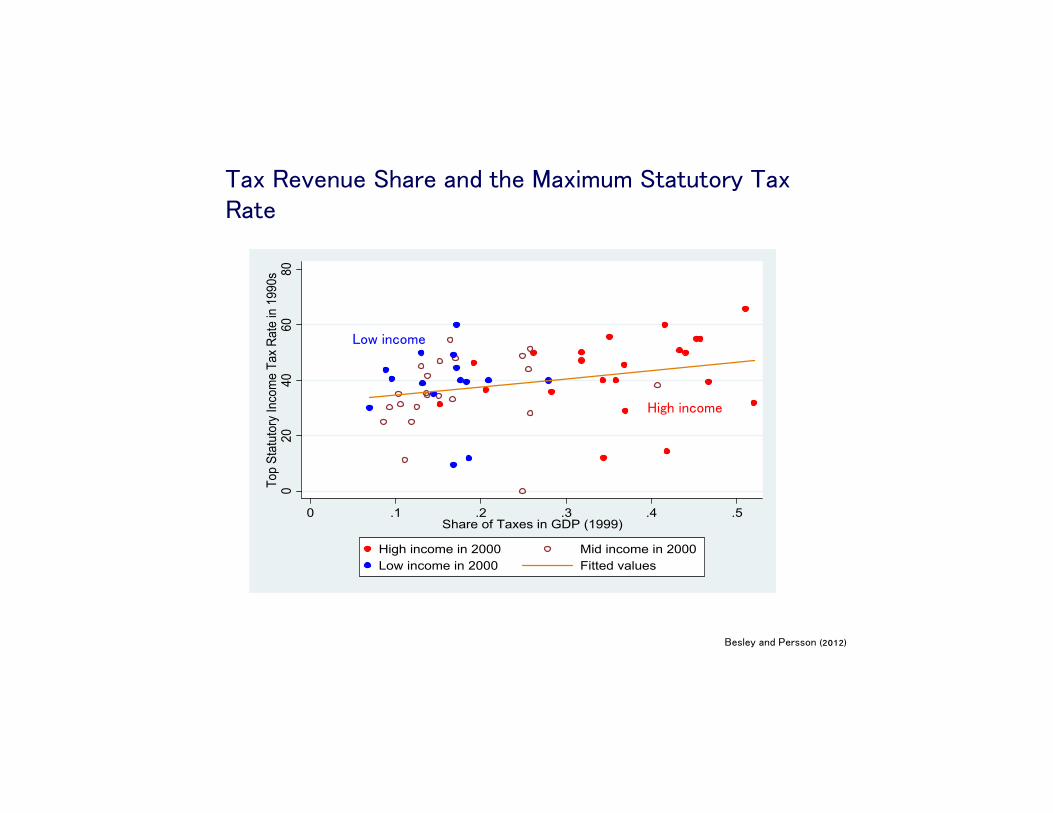
Finally, another indicator of fiscal capacity is the relation between statu-tory tax rates and actual tax take. Figure 6 shows some indication of this by
plotting the top statutory income tax rates in 1990s for the 67-country sam-
ple in Gordon and Lee (2005) against the share of total taxes in GDP from
Baunsgaard and Keen (2005) The figure shows that the distribution of thetop statutory rate is about the same amongst high-income and low-income
countries. Obviously, the figure does not take aspects such as coverage and
8
" !�+-"'�(&� �(.'-+"�, +�%2 &.�! &(+� (' "'�(&� -�1�, �, ())(,�� -( -+��� -�1�, -!�' �( )((+�+ �(.'-+"�,.
��,%�2 �'� ��+,,(' (2012)
��1�-"(' �'� �",��% ��)��"-2 "' ��/�%()"' �(.'-+"�,
1. (0 �",��% ��)��"-22. ��/2 +�%"�'�� (' '�++(0 (�",-(+-"('�+2) -�1�, �,
())(,�� �+(��-��,�� ("'�(&�) -�1�, q -+���, ,�%��-"/� �(',.&)-"(' �'� -.+'(/�+ -�1�,q �1)%�'�-"(' %"�, )�+-"�%%2 "' -�1 ��&"'",-+�-"('
3. � �(&)�%%"' +��,(' -!�- -!� �"���+�'�� "' -�1 ,!�+�, %"�, "' -�1 ��&"'",-+�-"(' (�, ())(,�� -( )(%"�2) �(&�, �+(& -!� +�%�-"(',!") ��-0��' -�1 +�-�, �'� -�1 +�-"(,
q �/�' 0"-! �(&)�+��%� ,-�-.-(+2 +�-�,, ��/�%()�� �(.'-+"�, +�",� &.�! &(+� +�/�'.� (�, � ,!�+� (� ���) -!�' ��/�%()"' �(.'-+"�,.
020
4060
80To
p St
atut
ory
Inco
me
Tax
Rate
in 1
990s
0 .1 .2 .3 .4 .5Share of Taxes in GDP (1999)
High income in 2000 Mid income in 2000Low income in 2000 Fitted values
Figure 6: Top statutory income tax rate and total tax take
progressivity into account. With this qualification, the fact that high-incomecountries raise much more tax revenue than low-income countries suggeststhat narrower tax bases driven by compliance di!culties are much biggerissues among low-income countries. This reinforces the earlier observationthat fiscal capacity is considerably less developed in poor countries.
Taken together, the cross-sectional and time series data suggest the fol-lowing five stylized facts confirmed in cross sectional and time series data:
Stylized Fact 1: Rich countries have made successive investments in theirfiscal capacities over time.
Stylized Fact 2: Rich countries collect a much larger share of their incomein taxes than do poor countries
Stylized Fact 3: Rich countries rely to a much larger extent on incometaxes as opposed to trade taxes than do poor countries.
Stylized Fact 4: High-tax countries rely to a much larger extent on incometaxes as opposed to trade taxes than do low-tax countries.
10
��1 ��/�'.� �!�+� �'� -!� ��1"&.& �-�-.-(+2 ��1 ��-�
" ! "'�(&�
(0 "'�(&�
��,%�2 �'� ��+,,(' (2012)

1. �(/�+'&�'- +�/�'.� ,!�+� "' ��� 0�, +","' (' �/�+� � -!+(. ! -!� 1990, �'� ��+%2 2000,q ��/��-,
q -�1 /,. (-!�+ ,(.+��, ('�-.+�% +�,(.+��,)
q � %(- (� /�+"��"%"-2 "' +�/�'.� �!�' �, ��+(,, �(.'-+"�,
q ,!"�-"' �(+-.'�, ��-�+ -!� 2008 �%(��% +���,,"('%
2. �!� �(&)(,"-"(' (� -�1�, !�, -"%-�� �0�2 �+(& -+��� -(0�+�, "'�"+��- -�1�,
��1�-"(' �'� �",��% ��)��"-2 "' ��+"��
5
7
9
11
13
15
17
19
21
2000 2001
2002 2003
2004 2005
2006 2007
2008 2009
2010 2011
2012 2013
Ghana Kenya Nigeria Sub-Saharan Africa (developing only)
���
�!�'�
��'2�
�" �+"�
�('��)-.�% �+�&�0(+$
q �+��"-"('�% %"-�+�-.+� (' -�1�-"('
q ��," ' (� ()-"&�% -�1
q ��&,�2 (1927): ()-"&�% �(',.&)-"(' -�1 '(- .'"�(+&
q ��1 ((�, ,.�! -!�- -!� &�+ "'�% +�/�'.� )�+ �(%%�+ ", �*.�% ��+(,, ((�,
q -�1 ((�, -!�- !�/� %(0 �%�,-"�"-2 (� ��&�'�/,.))%2 �- ����� +�-�,
q �(-� -!� �",-+"�.-"('�% "&)%"��-"(',

�)-"&�% '�(&� ��1
3 �(+'�+,-('�, (� ()-"&�% -�1 �+�&�0(+$ 5 '�"/"�.�% )+���+�'��,, �"+& -��!'(%( 2 �'� &�+$�-
,-+.�-.+�
6 ��/�'.� +�*."+�&�'- Ø �1( �'(.,: ,"&)%"�"�, (�#��-"/� �.'�-"('
7 �(�"�% 0�%��+� �.'�-"('
�(��+' �)-"&�% ��1 Ø �"�%��� "&)(+-�'- "'," !-, "'-( ��," ' (� -�1�,Ø �.- &(,- 0�+�/�+� (� %"&"-�� )+��-"��% +�%�/�'��
Ø �"++%��, (1971): &�+ "'�% -�1 +�-� (' +"�!�,- )�+,(' ", 3�+(
��1 �(&)%"�'��/�/�,"('
q �)-"&�% �/�,"(' ��)�'�, (' -�+&, (� �&�%� (%"$�%"!((� (� ��-��-"(' �'� )�'�%-2) �'� �--"-.�� -(0�+� +",$ (�%"' !�& � ��'�&( 1972)
q ��,�� (' ��('(&"� &(��% (� �+"&�
q � )�+,(' �(&&"-, � �+"&"'�% ��- "� -!� �1)��-�� .-"%"-2 -( !"& �1����, -!� .-"%"-2 !� �(.%� �- �2 .,"' !", -"&� �'� (-!�+ +�,(.+��, �- (-!�+ ��-"/"-"�,
q �+"&"'�%, -!�+��(+� �('’- !�/� � �"���+�'- ��,"� &(-"/�-"(', �+(& (-!�+,, �.- +�-!�+ !�/� �"���+�'-
��'��"-, �'� �(,-,.

��1 �(&)%"�'��/�/�,"(' q (0 &.�! ,!(.%� �� �%%(��-�� -( ��-��-"'
�/�,"('? (��'�&( 1981)
Ø �*.�-� +�,(.+�� �(,- (� ��-��-"(' �'� -!� ,(�"�% ��'��"- (' -!� &�+ "'
» ���"-"('�% +�/�'.� ", '(- '�- �"' -( ,(�"�-2
» ��'��"-,: ��"-! "' (/�+'&�'-

�)-"&�% ��1 �2,-�&, �'� -!� ���!'(%( 2 (� ��1 �(%%��-"('
• �%�&+(� (2013) "'�(+)(+�-�, -�1 ��&"'",-+�-"(' "'-( ()-"&�% -�1 �+�&�0(+$– �(+'�+,-('� '(0 -��!'(%( 2 (� -�1 �(%%��-"('
– ��,� (� ��&"'",-�+"' /�+"(., -�1�, !�, �+"-"��% "&)%"��-"(', �(+ -!� ()-"&�% ,-+.�-.+� (� -�1 ,2,-�&,.Ø &�+ "'�% +�,(.+�� �(,- '(0 ��)�'�, (' ��,� (�
�(%%��-"('
Ø �)-"&�% -�1 ,2,-�& �*.�-�, -!� &�+ "'�% �1��,, �.+��' -( &�+ "'�% ��&"'",-+�-"/� �(,-
Ø �1�&)%�: ���Ø �"���+�'-"�-�� +�-�, �'� �1�&)-"(', "&)(,� &�+ "'�%
��&"'",-+�-"/� �(,-,

�'�%2-"��% �))+(��!�,
1. �" -�"�-.+�, &��+( �))+(��!: -�1 ��)��"-2 �'� ���(+- [�-(�!�,-"� �+('-"�+ �'�%2,", – �' �(+� �'� �!%�'�.+ ! 2015]
2. �"�+( �))+(��!:
Ø ��," ' �'� �/�%.�-� ("'�+�&�'-�%) )(%"�2 "''(/�-"(', "' � 0(+%� (� 0��$ -�1 �'�(+��&�'-
Ø �(%%��(+�-� (+�,��+�!�+,/)(%"�2 &�$�+,/)+��-"-"('�+,)

�"�+( ��1 ��,��+�!
Ø ��-�: ��&"'",-+�-"/� ��-� )+(/"�� � 0��%-! (� "'�(+&�-"(' "' -�1 +��(+�,
Ø �&)"+"��% ��-!(�,: �(.%� .,� -�1 ,�!��.%�, (+ -�1 +��(+&,, )+�/"(., �!�' �, "' -�1 +�-�, �'� �'�(+��&�'- -( �+��"�%2 �,-"&�-� "&)��-,
Ø �+�&�0(+$: �.�%"� �"'�'�� !�, � 0�%%-��/�%()�� -!�(+2 -!�- ��' �� �+(. !- -( ���+ "' ��," '"' )(%"�2
Ø �(%"�2: �-+(' "'-�+�,- �+(& )(%"�2 &�$�+, "' �--"' -�1�, +" !-

�&)"+"��% '/�,-" �-"(', "' -( ��-�+&"'�'-, (� ��1 ��)��"-2
1. ��1 �(%"�2
2. ��1 ��&"'",-+�-"('
3. ��1 �(&)%"�'��
�. �'�(+��&�'-
�. �(+�%�

��0 �/"��'�� (' �(&)%"�'��
q �'�(+��&�'-
1. �!"+�-)�+-2 "'�(+&�-"('– �&)%(2�+ ��)(+-"' /�"-!!(%�"' (��'&�+$)– �"-"3�', �, &('"-(+, (�+�3"%/�!"%�)– ���(.'-"' �"+&, (�+. .�2)
2. ���!'(%( 2 – �%��-+('"� �"%%"' &��!"'�,- �0�'��/��'3�'"�
3. �,2�!(%( 2– &(+�% ,.�,"(' (�'"-�� �"' �(&)– ��1 ,�%"�'��

�!�&"' -�1 �(� �+, -( "&)+(/� �(&)%"�'��
�!�&"' - �!"%"))"'�,
“,"' "' �.'.�!,” – �"!�+, '�"�Source:Singhal(2014)
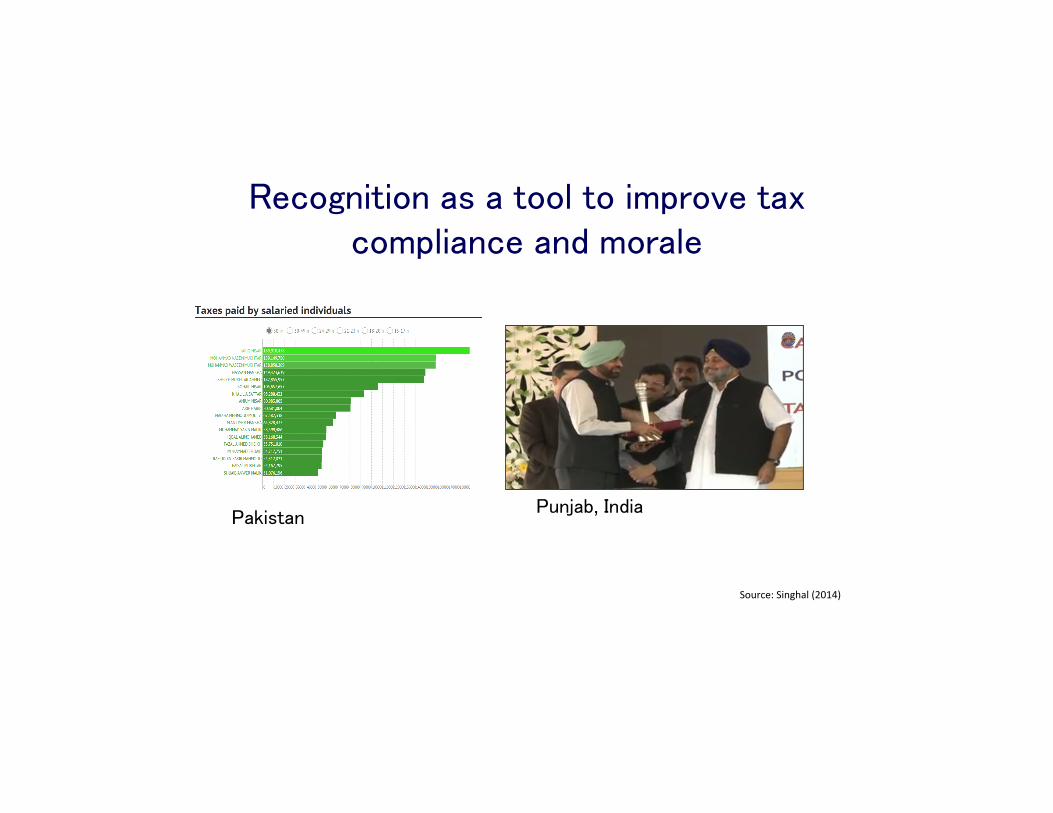
���( '"-"(' �, � -((% -( "&)+(/� -�1 �(&)%"�'�� �'� &(+�%�
�.'#��, '�"���$",-�'
Source:Singhal(2014)

��1 �'�(+��&�'-
�%�/�' ��. ��. (2009, 2011)
Ø ��'&�+$ �1)�+"&�'-: ��1 �/�,"(' +�-� ", �%(,� -( 3�+( �(+ "'�(&� ,.�#��- -( -!"+�-)�+-2 +�)(+-"' , �.- ,.�,-�'-"�% �(+ ,�%�-+�)(+-�� "'�(&�
Ø ��1 �'�(+��&�'- ", ,.���,,�.% "� �'� ('%2 "� /�+"�"��%� -!"+�-)�+-2 "'�(+&�-"(' !�, 0"�� �(/�+� �
��,�'- 0"�� �(/�+� � (� -!"+�-)�+-2 (+ (-!�+ "'�(+&�-"('Ø (0 ��' 0� �1)�'� -!"+�-)�+-2 "'�(+&�-"('?
Ø (0 ,!(.%� 0� ��," ' �.�"-,, ,�- )�'�%-"�,?

�!"+�-��+-2 ��)(+-"' : �/"��'�� �+(& ��'&�+$�(��1 -�$�: 50%)
Source: Kleven, Knudsen, Kreiner, Pedersen, Saez (2011) !
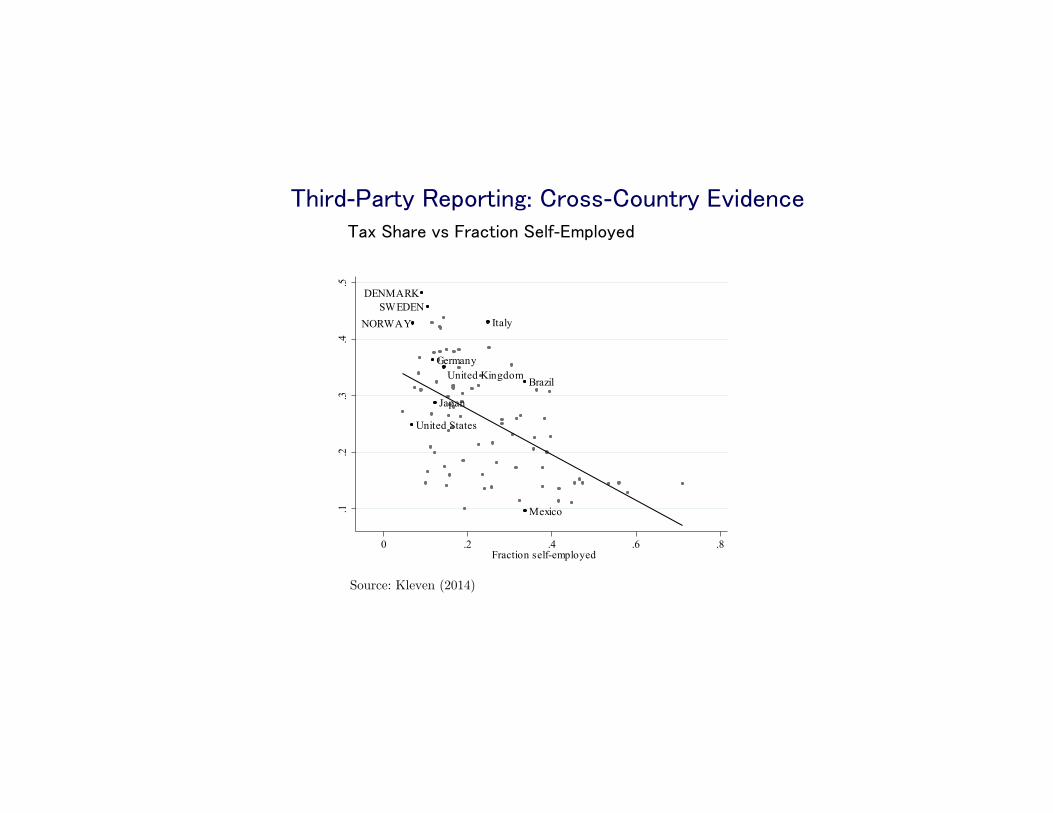
�!"+�-��+-2 ��)(+-"' : �+(,,-�(.'-+2 �/"��'����1 �!�+� /, �+��-"(' ��%�-�&)%(2��
Brazil
Germany
Italy
Japan
Mexico
United Kingdom
United States
DENMARK
NORWAYSWEDEN
.1.2
.3.4
.5
Tax
/ GD
P ra
tio
0 .2 .4 .6 .8Fraction self-employed
Source: Kleven (2014) !

���!'(%( 2 �'� ��1 �(&)%"�'��: �%��-+('"� �"%%"' ���!"'�, �'� ��� ��/�'.�,
�(%%��(+�-"(' 0"-! �0�'�� ��/�'.� �.-!(+"-2 (���)�&&��"�-� *.�,-"(': �!�- ", -!� "&)��- (� ���, ('
-�1 +�/�'.�?
�+(���+ *.�,-"(': (0 ��' -!� (/�+'&�'- �'�(.+� � �(&)%"�'��?
��-�
1. �.�+-�+%2 ��� ���%�+�-"(',, �+(& 2012 -!+(. ! 2014
2. 2. ��� +� ",-+�-"(' ��-�

��� ����")-
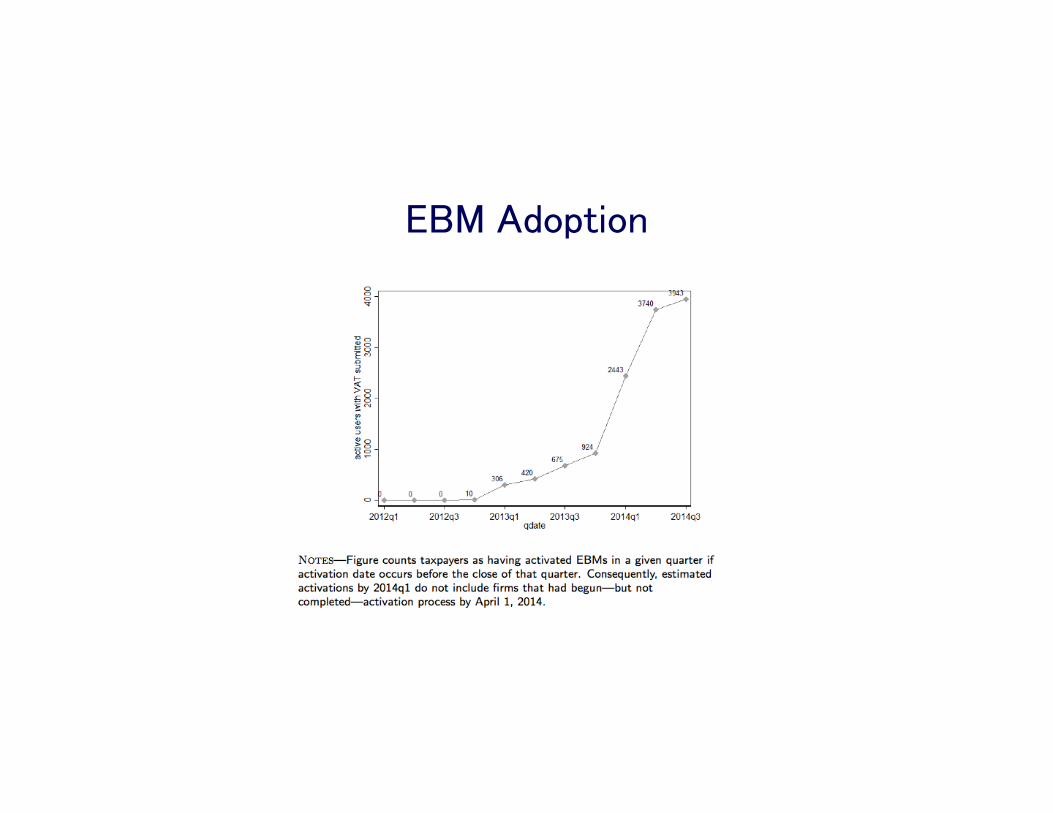
��� ��()-"('

��� ���!"'�, %�� -( !" !�+ ��� ��/�'.�,
��� +�/�'.�, "'�+��,�� �2 5.4%
�.-, -( ��--�+ .'��+,-�'� 0!�-’, .'��+%2"' -!", "&)��-, 0� ,�- .) � &2,-�+2-,!())�+ ,-.�2
Ø �( 0!�- �1-�'- �+� &��!"'�, ��"' .,��?
Ø ��' �(',.&�+, �'�(.+� � &(+� .,� �?

�2,-�+2 �!())�+ �-.�2: ��," '
q 129 /","-, -( ���-��-"/� +�-�"% ,!(), "' �" �%"q �.+�!�,�, �+(& � &�'. (� ,&�%% ((�,: -��, �(����, ,(�), ,-�)%�,, �-�., /�%.�� ��-0��' ��� 500–���1000.
q �' �&������ �1)�+"&�'-: "' (('%2) !�%� (� -!�,� /","-,, ,�%��-�� �- +�'�(&, 0� ,)��"�"��%%2 �,$�� �(+ � +���")-.
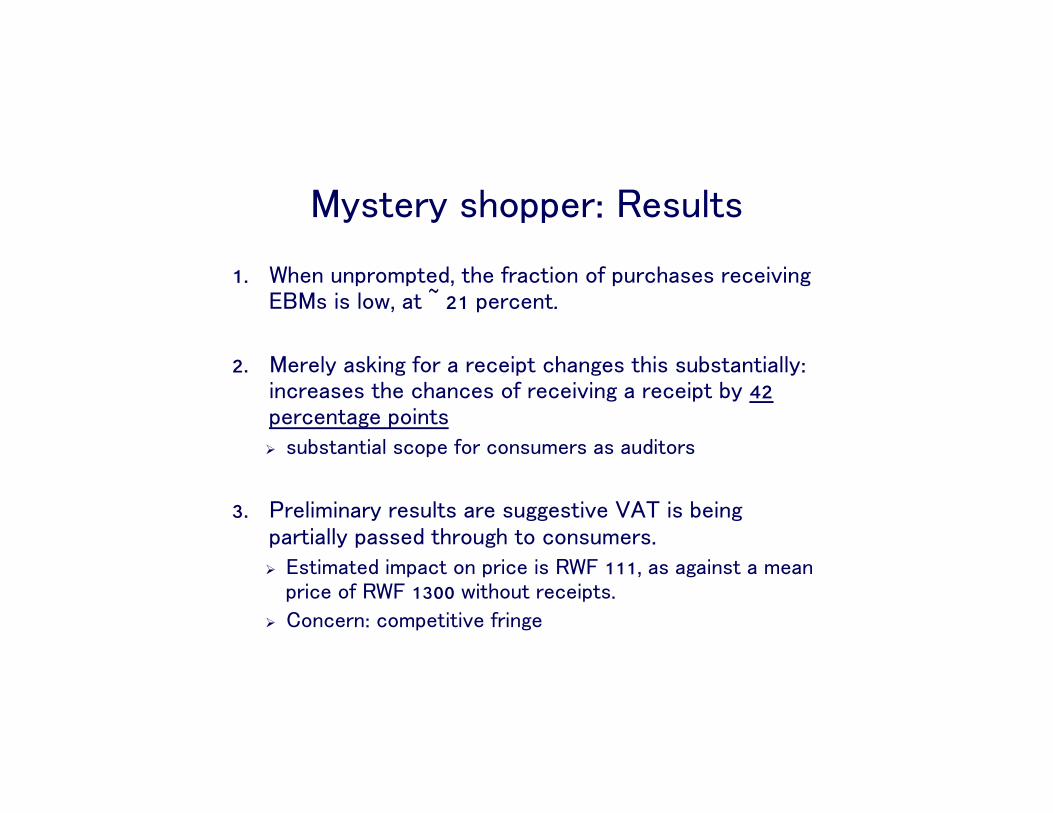
�2,-�+2 ,!())�+: ��,.%-,
1. �!�' .')+(&)-��, -!� �+��-"(' (� ).+�!�,�, +���"/"' ���, ", %(0, �- 4 21 )�+��'-.
2. ��+�%2 �,$"' �(+ � +���")- �!�' �, -!", ,.�,-�'-"�%%2: "'�+��,�, -!� �!�'��, (� +���"/"' � +���")- �2 42 )�+��'-� � )("'-, Ø ,.�,-�'-"�% ,�()� �(+ �(',.&�+, �, �.�"-(+,
3. �+�%"&"'�+2 +�,.%-, �+� ,. �,-"/� ��� ", ��"' )�+-"�%%2 )�,,�� -!+(. ! -( �(',.&�+,. Ø �,-"&�-�� "&)��- (' )+"�� ", ��� 111, �, � �"',- � &��' )+"�� (� ��� 1300 0"-!(.- +���")-,.
Ø �('��+': �(&)�-"-"/� �+"' �

�(,- (� ���+�,,"' �/�,"(' &�2 �� /�+2 %(0
– �(',.&�+, �, -�1 �.�"-(+, (��+"-(&" 2013) – �'-"--�1 �/�,"(' )+( +�& �+(& ��( ��.%(, �+�3"% - �(-� �",��% ��.%",-� - -!�- �+��-�� &('�-�+2 +�0�+�, �(+ �(',.&�+, -( �,$ �(+ +���")-,.
• ��,,"/� ��-�: 1 &"%%"(' �"+&,, 40 &"%%"(' )�()%�, �'� 2.7 �"%%"(' +���")-,!
– )+( +�& "'�+��,�� +�/�'.� +�)(+-�� "' +�-�"% ,��-(+, �2 &(+� -!�' 22% ((/�+ �(.+ 2��+ )�+"(�).• '( +�,"�.�% �����- (� �"+& �1"-, �'� �&)%(2&�'-
�(',.&�+ �--�'-"(' �'� )�+-"�")�-"('
39
Figure 2: Number of Receipts Reported Electronically to the Tax Authority – Timeline of Program Implementation
Notes: The figure shows the total number of receipts (millions of receipts) – with and without a SSN – electronically reported to the tax authority by month by establishments in Sao Paulo. The vertical lines highlight the key dates for the implementation of the NFP program. Between Oct.07 (Phase-in begins line) and May.08 (Phase-in ends line) 8 groups of sectors were phased-in in the policy of submitting receipts electronically to the tax authority. The possibility of inserting a SSN in the receipt for tax rebate purposes was introduced along with the electronic submission of receipts. The first lottery based on the purchases with SSN receipts was introduced in Dec.2008.
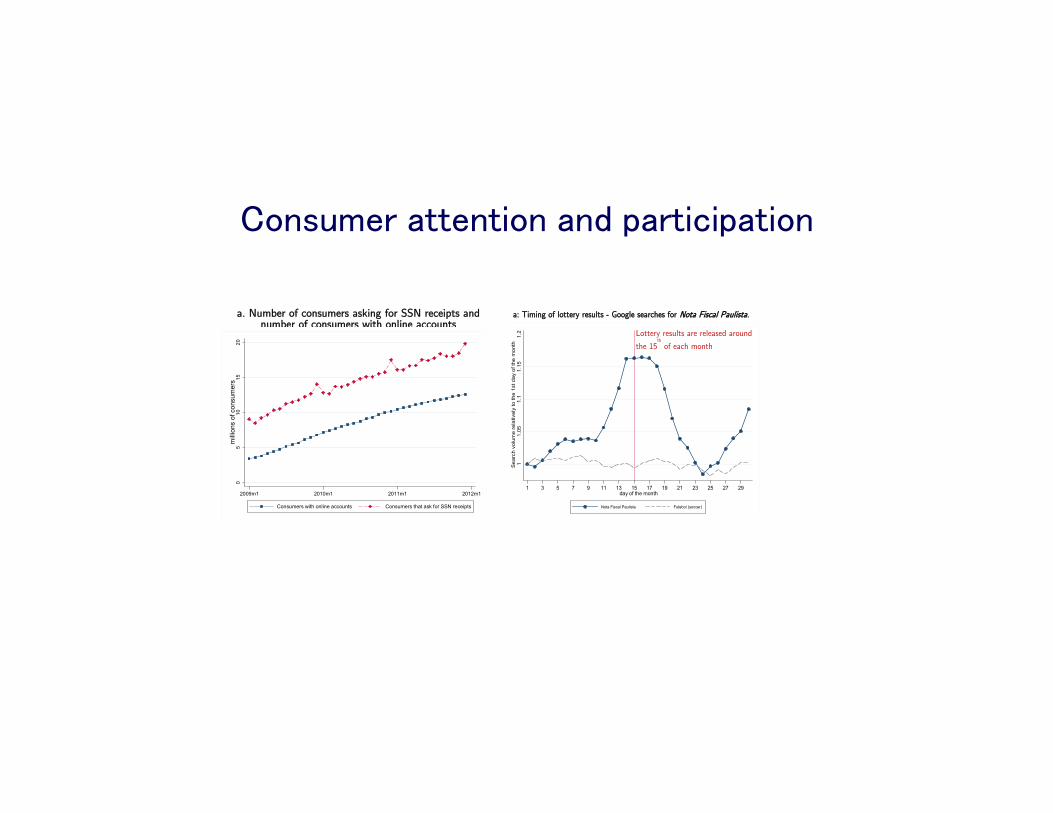
Figure 3: Consumer Participation
.
Notes: The dashed line in Figure 3a displays total number of consumers asking for SSN receipts each month, and the solid line is
the total number of consumers that had set up online account at the tax authority’s website between Jan. 2009 and Dec. 2011. Any person holding a Brazilian SSN is eligible to ask for receipts. In order to collect rewards and opt in for lotteries consumers need to enroll online. Figure 3b shows the average monthly expenditure by consumers with online accounts between Jan. 2009 and Dec. 2011. Monthly expenditure is the sum of the total value of SSN receipts by individual. The spikes of expenditure around December of each year follows the seasonal variation in consumption due to Christmas shopping.
Phase-in begins
Phase-in ends
first lottery
010
020
030
040
050
0m
illio
ns o
f rec
eipt
s
2007m1 2007m7 2008m1 2008m7 2009m1 2009m7 2010m1 2010m7 2011m1 2011m7
05
1015
20m
illio
ns o
f con
sum
ers
2009m1 2010m1 2011m1 2012m1
Consumers with online accounts Consumers that ask for SSN receipts20
030
040
050
060
0A
vera
ge m
onth
ly e
xpen
ditu
re in
US
$2009m1 2010m1 2011m1 2012m1
a. Number of consumers asking for SSN receipts and number of consumers with online accounts
b: Average expenditure in SSN receipts per month by consumers with online accounts.
40
Figure 4: Are Consumers Paying Attention to the Rewards Schedule?
a: Timing of lottery results - Google searches for Nota Fiscal Paulista.
b: Timing of tax rebate disbursements - Rewards requested for deposit in consumers’ bank accounts
Notes: Figure 4a displays the search volume from Google Trends website for Google searches with terms related to ”nfp” or ”nota fiscal paulista” or ”nota paulista” pooled by day of the month from IPs addresses in the state of Sao Paulo between Oct. 2007
and Dec. 2011. It also displays searches for “futebol” (soccer in Portuguese) pooled by day of the month from IPs addresses in the state of Sao Paulo for the same time period. The lottery results are released around the 15th of each month marked by the solid
vertical line. In Figure 4b each data point is the total amount in millions of US$ requested for direct deposit in consumer’s bank accounts. As described in section II.B, the tax authority does a biannual disbursement of the tax rebates: every April and October. The disbursement dates are marked by vertical lines in the x-axis.
11.
051.
11.
151.
2S
earc
h vo
lum
e re
lativ
ely
to th
e 1s
t day
of t
he m
onth
1 3 5 7 9 11 13 15 17 19 21 23 25 27 29day of the month
Nota Fiscal Paulista Futebol (soccer)
020
4060
8010
0
Rew
ards
req
uest
ed fo
r ba
nk a
ccou
nt d
epos
its(m
illio
ns U
S$)
2009m4 2009m10 2010m4 2010m10 2011m4 2011m10
two annual disbursements of tax rebates: April and October
Lottery results are released around
the 15th
of each month

��)(+-�� ��/�'.� �!�' �,���-�"% /, �!(%�,�%�
41
Figure 5: Compliance Effect – Retail vs. Wholesale a. Raw data: reported revenue changes
b. Difference coefficients for 6-month time bins - Log reported revenue by sector
Notes: Figure 5a shows reported revenue changes for retail and wholesale sectors. Each line is defined by the reported revenue by all establishments aggregated by retail or wholesale scaled by the average monthly reported revenue in 2004 for each sector group. The figure plots the raw data, so there are spikes around December of each year follows the seasonal variation in consumption due to Christmas shopping. The vertical lines highlight the key dates for the implementation of the NFP program: phase-in of sectors begins in Oct.07 and ends in May.08, and the first lottery based on the purchases with SSN receipts was introduced in Dec.2008. Figure 5b plots regression coefficients from estimating specification (1) using a sample of 210 sectors between Jan 2004 and Dec 2011. The sector sample has 24,990 observations. The difference in differences (DD) coefficient displayed in the figure is estimated using the specification (2) where the DD variable is defined by the interaction between a dummy for retail sectors and a dummy that equals 1 for time periods after Oct 2007. Standard errors are clustered by sector.
0.5
11.
52
2.5
3
2005m1 2005m11 2006m9 2007m7 2008m5 2009m3 2010m1 2010m11 2011m9
Retail Wholesale
16.8
1717
.217
.417
.6D
iffer
ence
in L
og R
epor
ted
Rev
enue
Jan
.04-
Mar
.04
Apr
.04-
Sep
.04
Oct
.04-
Mar
.05
Apr
.05-
Sep
.05
Oct
.05-
Mar
.06
Apr
.06-
Sep
.06
Oct
.06-
Mar
.07
Apr
.07-
Sep
.07
Oct
.07-
Mar
.08
Apr
.08-
Sep
.08
Oct
.08-
Mar
.09
Apr
.09-
Sep
.09
Oct
.19-
Mar
.10
Apr
.10-
Sep
.10
Oct
.10-
Mar
.11
Apr
.11-
Sep
.11
Oct
.11-
Dec
.11
DD coef. = 0.22*** [0.042]

�(,- (� ���+�,,"' �/�,"(' &�2 �� /�+2 %(0
– �'"-�� �"' �(&• �--�+, �+(& ��� (�%%,0(+-! �-.�% 2014)
• !--),://000. (/..$/ (/�+'&�'-/'�0,/!&+�-,��.+�,-+��(+�--�1-+�/�'.�,-�2-�+��$"' -�(0'-('--�1-�(� �+,

��1 �(%"�2
�+��"-"('�% +��(&&�'��-"(', �+(& -!� -�1 -!�(+2 %"-�+�-.+�:
Ø �,� )+( +�,,"/� "'�(&� -�1�, �'� ���
Ø �( '(- .,� �"���+�'-"�-�� �(',.&)-"(' -�1�,, ��)"-�% -�1�,, �'� -�1�, (' -.+'(/�+, -+���, �'� "'-�+&��"�-� ((�,
�!�,� -!�(+�-"��% +�,.%-, �'�+�%%2 �,,.&�:
Ø ��+���- -�1 �'�(+��&�'- (��&"'",-+�-"(' �(,-%�,,)
Ø �.%% ,�- (� -�1 "',-+.&�'-, �/�"%��%� -( )(%"�2 &�$�+,

�)-"&�% ��1 �(%"�"�,
�"�&('�-�"++%��, (1971): �,,.&"' )�+���- �'�(+��&�'-, ('%2 )+(�.�-"(' ���"�"�'- -�1 "',-+.&�'-, ,!(.%� �� .,��
�+(�.�-"(' "'���"�"�'- -�1 )(%"�2 "' ��/�%()"' �(.'-+"�, .�"*."-(.,:
Ø �"'"&.& ��1 ��!�&�, (���) 0!�+��2 �"+&, �+� -�1�� (' �"-!�+ )+(�"-, (+ -.+'(/�+ ��)�'�"' (' 0!"�! -�1 %"��"%"-2 ", %�+ �+
�.+'(/�+ -�1�, �+� )+(�.�-"(' "'���"�"�'-, �.- &�2�� !�+��+ -( �/���?
�!("�� (� ��1 ',-+.&�'- �'� ���$ ��)��"-2
' ,�--"' , 0"-! 0��$ -�1 ��)��"-2, -!� �!("�� (� "',-+.&�'-, ", $�2Ø �!"�! "',-+.&�'-, +�)+�,�'- -!� ��,- -+���-(�� ��-0��'
,-�'��+� ���"�"�'�2-�*."-2 �('��+', �'� �(&)%"�'��/��&"'",-+�-"(' �('��+',?
Ø �1�&)%�: ��,--�+(�$&�2�+-�%�/�'-�)"''�0"#'-��,��& (2014) -!� ��� "' ��$",-�':
Ø �.+'(/�+ -�1�, +��.�� �/�,"(' �2 .) -( 60-70% (� �(+)(+�-� "'�(&�
Ø �(&)%"�'�� �"', (.-0�" ! -!� %(,, (� )+(�.�-"(' ���"�"�'�2
Ø �( -!� ��� ", � ((� )(%"�2 "' � 0��$ -�1 ��)��"-2 ,�--"'

��2 �,,(',
1. �!"+�-)�+-2 "'�(+&�-"('
– 0"-!!(%�"' ("'�(&�) – -��!'(%( 2 (���)• �(',.&�+,
2. ��%"�'�� �'� �+�&"' – �(+�%�: '(+&, �'� �.,"'�,, -�1 (��' %���,!)– ��,,� "'

��2 ��$��0�2, Ø ��-!�+ -!�' +�%2 (' -+�',)%�'-"' ��/�%()�� �(.'-+2
,(%.-"(',, 0� �1�&"'� �(.'-+2-,)��"�"� )(%"�"�,
Ø �!�%%�' "' �.- �(��%�:
- ��-�: " !-*.�%"-2 ��-� [�. . ��&"'",-+�-"/� ��-�]
- ��," ': �+��"�%� +�,��+�! ��," ' [���,, *.�,"-�1)�+"&�'-,]
- �/�%.�-"(': �" (+(., �/�%.�-"(' -��!'"*.�,
- �(%%��(+�-"(': �' � �&�'- ��-0��' )(%"�2 &�$�+, �'� +�,��+�!�+,

��+- ��",��% ����+�%",& �'� �*."-��%�
��/�%()&�'-

�!�- ", �",��% ����+�%",&?
v �-�+- 0"-! � �(&&(' ���"'"-"(' (� � ����+�% ,2,-�&
v � ).�%"� ,��-(+ 0"-! �(-! ��'-+�%"3�� �'� ����'-+�%"3�� %�/�%, (� ���","('-&�$"' "' 0!"�! �!("��, &��� �- ���! %�/�% �+� ��-�+&"'�� �2 -!� ��&�'�, (� +�,"��'-, (� +�,)��-"/� #.+",�"�-"(', (��-�, 1972)
v �(-�: -!", 0"%% �%,( �� )(%"-"��% (%(��% �%��-"(',) (+ ��&"'",-+�-"/� ().�%"� ,�+/�'- ,�%��-"(', )�2, 0(+$ �('�"-"(',)
v ��,"� )+"'�")%� (� �",��% ����'-+�%"3�-"(': -!� )+(/","(' (� ).�%"� ,�+/"��, ,!(.%� �� �- -!� %(0�,- %�/�% (� (/�+'&�'- -!�- "'-�+'�%"3�, -!� (,)�-"�%) ��'��"-, �'� �(,-,

&)%�&�'-�-"(' ",,.�,: �",��% ����+�%",& �'� ����'-+�%"3�-"('
v �",��% ����'-+�%"3�-"(' ", -!� -+�',��+ (� �('-+(% (/�+ �1)�'�"-.+�, � � +�/�'.�, �+(& -!� ��'-�+ -( %(0�+ %�/�%, (� (/�+'&�'-
– �1)�'�"-.+�: ,�+/"�� ��%"/�+2 – !��%-!��+�, ��.��-"(', ,(&� "'�+�,-+.�-.+�
– ��/�'.�,: "'�+��,� -+�',)�+�'�2 �'� ,-��"%"-2 (� -+�',��+,, -+�',��+ )(0�+ -( �(%%��- �'� ,�- -�1�,
v �'�%2,", (� -!� "&)��- (� �",��% ����+�%",& &.,- ���(.'- �(+ )(%"-"��% �'� ��&"'",-+�-"/� ,-+.�-.+�,
�-!�+ �"&�',"(', (� ����'-+�%"3�-"('
�0( &��,.+�, (� �",��% ����'-+�%"3�-"(':
Ø +�/�'.� ����'-+�%"3�-"('—-!� ,!�+� (� -(-�% -�1 +�/�'.�, -!�- ,.�'�-"('�% -"�+, +���"/�
Ø �1)�'�"-.+� ����'-+�%"3�-"('—-!� ,!�+� (� -(-�% ).�%"� �1)�'�"-.+�, �.'��� �+(& ,.�'�-"('�% �.� �-,.
1. �.&��+ (� -"�+, (� (/�+'&�'-
2. �%��-(+�% ����'-+�%"3�-"('
3. ��+,(''�% ����'-+�%"3�-"('—-!� ,!�+� (� -(-�% (/�+'&�'- )�+,(''�% �&)%(2�� �- ,.�'�-"('�% -"�+,.

14
4Table 6.1 Median Levels of Decentralization Measures by Geographic Region, 1995 (percentage)
Decentralization Number of Sub-Saharan Latin Middle Eastern Former WesternMeasure Observations Africa East Asia South Asia America East Europe Soviet Union Europe
Number of tiers 164 4 4 4 3 3.5 3 4 3Percent elected 155 33.3 35.4 33.3 62.5 0.0 83.3 33.3 69.0Subnational share
of publicexpenditure 67 4.7 10.8 37.6 9.6 8.4 16.9 27.6 24.1
Subnational shareof total taxrevenue 53 4.0 6.5 N/A 6.7 6.3 7.3 24.2 13.4
Subnational shareof publicemployment 90 23.1 41.0 50.0 20.8 35.8 26.4 35.4 48.4
Stipulatedautonomy 133 6.9 11.8 20.0 23.5 0.0 8.3 15.4 33.0
Residual authority 133 3.8 5.9 20.0 22.2 0.0 16.7 7.7 23.8Federal 164 4.8 5.2 28.6 14.8 5.3 9.1 7.1 23.8
Sources: Daniel Treisman, Defining and Measuring Decentralization: A Global Perspective (Los Angeles: University of California, 2002);D. Elazar, Federal Systems of the World: A Handbook of Federal, Confederal and Autonomy Arrangements, 2nd ed. (London: Longman, 1994);S. Saideman, D. Lanoue, M. Campenni, and S. Stanton, “Democratization, Political Institutions, and Ethnic Conflict: A Pooled Time-SeriesAnalysis, 1985–1998,” Comparative Political Studies 35 (1) (2002): 103–129.
07_Connerley_Ch6.qxd 4/19/10 3:21 PM Page 144

�"&�',"(', (� ����+�%",&
' )+��-"��, -+�&�'�(., �+(,,-'�-"('�% /�+"�-"(' "' !(0 ����'-+�%"3�-"(' � �����
1. � �'�� – �1)�',"/� ����'-+�%"3�-"(' ��+(,, �%% �"&�',"(', "' -!� 1990,, �(&)+(&",�� �2 0��$ (0'-,(.+�� +�/�'.�,, ,�+/"�� ��%"/�+2, �",��% +�,)(',"�"%"-2
2. ��&�(�"� – �(&&.'�% �%��-"(',, %"--%� "'��)�'��'- +�/�'.� �('-+(%, !��/2 +�%"�'�� (' "'-�+ (/�+'&�'-�% -+�',��+,
3. �!"%� – )(%"-"��% ����'-+�%"3�-"(' �.- ��'-+�%"3�� +�/�'.�,
4. �(%"/"� – +�/�'.� ,!�+"' 0"-! &.'"�")�%"-"�, (+.%� ��,��) �.- ��'-+�%"3�� ��&"'",-+�-"('

�(�%,: -( 0!�- �'�?
1. �.�%"� ,�+/"�� ��%"/�+2/��('(&"� +(0-! ('�"�)2. ��&(�+�-"3�-"('3. �-��"%"-2 (�(%.&�"�/��&�(�"�)
�(%(&�"� – ����'-+�%"3�-"(' ,��' �, � 0�2 -( +��,-��%",! ,-��"%"-2 �'� )��"�2 +���% "',.+ �'�2
v �(%"-"��% – &�2(+�% �'� .��+'�-(+"�% �%��-"(',v �",��% – -+�',��++�� "&)(+-�'- �",��% +�/�'.�,
��&�(�"� – +�,-(+� �"-"3�' -+.,- "' (/�+'&�'- ��-�+ �+&�� �1-�'��� �+&�� �('�%"�-
v �",�+�-"('�+2 "'-�+ (/�+'&�'-�% -+�',��+, �%%(��-�� .,"' ������� �(+&.%�
v ��+/"��, )+"(+"-"3�� -!+(. ! %(��% )�+-"�")�-"('

��,"� -!�(+2v �+��"-"('�% -!�(+2 (� �",��% ����+�%",& )+(/"��, � �'�+�% ������� �+�&�0(+$ �(+ �,," '"' �.'�-"(', -( �"���+�'- %�/�%, (� (/�+'&�'- �'� �(+ -!� �))+()+"�-� �",��% "',-+.&�'-, +�*."+�� (�., +�/� 1959; ��-�, 1972, 1999)
v ��'-+�% (/�+'&�'- +�,)(',"�"%"-2
v ��+-�"' "'�-"('�%" ).�%"� ((�, %"$� '�-"('�% ����',�
v "'�(&� +��",-+"�.-"('
v ����'-+�%"3�� %�/�%, (� (/�+'&�'- )+(/"�� (%(��%) ((�, �'� ,�+/"��, -!�- &�-�! +�,"��'-,’ )+���+�'��,v .'�/�' ����'-+�%"3�� )+(/","(' ��,"+��%� �, "- "&)+(/�, ��('(&"�
0�%��+� (+�%�-"/� -( .'"�(+& %�/�%, (� ,.�! ,�+/"��,)

�",��% ',-+.&�'-, "' � ����+�% �2,-�&
v �+"&�+2 ,(.+��, (� (/�+'&�'- �"'�'�� �+� -�1 (�'� ���-) "',-+.&�'-,
– �.�,-"(' "' -!� �('-�1- (� ����+�% ,2,-�&: 0!"�! -�1�, �+� ��,- ,."-�� �(+ .,� �- ���! %�/�% (� (/�+'&�'- (-�1-�,," '&�'- )+(�%�&)?
– '��� -( �",-"' .",! ��-0��' ��&"'",-+�-"(' (�(%%��-"(') �'� )(%"�2 (,�--"' -�1 +�-�,, �'� -�1 ��,�)
v (0�+ %�/�%, (� (/�+'&�'-, !�/� �' ���"-"('�% ,(.+��: "'-�+ (/�+'&�'-�% +�'-,

��1�-"(' "' ����+�% �2,-�&
• ' -!� �('-�1- (� -�1�-"(', -!� $�2 ",,.� "' -!� ��," ' (� -�1�, ", -!� �� +�� (� &(�"%"-2 (� -�1�� .'"-, (0(+$�+,, �"+&, �-�.) �- -!� ��'-+�% �'� %(0�+ %�/�%,
– �(�"%� .'"-, ��' �/("� -!� -�1 �2 +�%(��-"' -( %(0�+ -�1 #.+",�"�-"('
• ��'�+�% �('�%.,"(': %(0�+ %�/�%, (� (/�+'&�'- ,!(.%� �/("� -�1"' &(�"%� .'"-, – �� -!�2 )�()%�, �"+&, (+ ((�,. – ��1"' -!�,� .'"-, �+��-�, � 0�%��+� %(,, �, -!�2 ��' �/("� -!� -�1
�2 �!�' "' %(��-"('

�.+",�"�-"('�% �(.'��+"�,
• �!�- ,!(.%� -!� �( +�)!"� �(.'��+"�, ��?
• ��2 ",,.�: �)"%%(/�+,, �2 0!"�! 0� &��' -!� ���+.�% (� ��'��"-, �+(& �'2 ('� #.+",�"�-"('’, ).�%"� ((�, -( "-’, '�" !�(+,. – "'�+��,� -!� ()-"&�% ,"3� (� � #.+",�"�-"('– '-+(�.��, !�-�+( '(., )+���+�'��, �'� +��.��, ��('(&"�
0�%��+�.
• �1",-"' �(.'��+"�, %�+ �%2 !",-(+"��%%2 �'� �.%-.+�%%2 ��-�+&"'��– �(.-! �.��', ��-� ���$ -( -!� &"��%� (� -!� 20-! ��'-.+2
(�(!',(' 2015)– �'"-�� �-�-�,: +"/�+, 0�+� .,�� -( ��&�+��-� �(.'��+"�,.
�.+",�"�-"('�% �(.'��+"�,
• �+ .��%2 � &.�! &(+� +�-"('�% &�) 0(.%� )+(���%2 �'-�"%
1. ,(&� ��"+%2 ,"3���%� +� "('�% (/�+'&�'-, -!�- �1-�'� (/�+ �'/"+('&�'-�% +�,(.+��,
2. ,&�%%�+ %(��% (/�+'&�'-, -!�- �%%(0 +(.), (� +�,"��'-, -( ��-�+&"'� ,�+/"��, (� +�%�/�'�� &�"'%2 -( -!�&,�%/�, (��-�, 1999)

�",��% ����+�%",& "' �(.-! �.��': ��2 ,,.�,
1. �-!'"�"-2 �"/�+,"-2
2. '-�+'�%/�+&�� �('�%"�-
3. '�*."-"�, ��+(,, #.+",�"�-"(', (,-�-�,, �(.'-"�,,..)
v �-!'"� �"/�+,"-2:v �/"��'�� ", (/�+0!�%&"' -!�- �-!'"� �"/�+,"-2 %(0�+, ).�%"� ((�,
1. �"�+(�+��"- %(�' ����.%- +�-�, "' ��+. (��+%�', 2002)
2. �.'�"' �(+ )+(�.�-"/� ).�%"� ((�,—��.��-"(', +(��,, ,�0�+, �-�. "' -!� �'"-�� �-�-�, (�%�,"'�, ��*"+ �'� ��,-�+%2, 1999)
3. )+"&�+2 ,�!((% �.'�"' –���"%"-"�,, &�"'-�'�'�� "' +.+�% ��'2� (�" .�% �'� �. �+-2 2004)

�/�+%�): (��% �(/�+'�'�� �'"-, �'� �-!'"� �",-+"�.-"('

�&)"+"��% ��,-
v �!�- ", -!� +�%�-"(',!") ��-0��' ).�%"� ,�+/"�� )+(/","(' �'� -!� �-!'"� �(&)(,"-"(' �- -!� �(.'-2 %�/�%?
v (0 �(�, %(��% ).�%"� ,�+/"�� )+(/","(' �"���+ ��+(,, �(.'-"�,/)�2�&,/�(&�, 0"-! �"���+�'- �-!'"� �(&)(,"-"('?
v �-!�+ ���-(+, &�--�+: )�+-��)"-� "'�(&�, '�-.+�% +�,(.+�� ��,�, � � �",-+"�.-"(', �-�,…
• ,,.� ", -!� %��$ (� ��-�
�/"��'�� -!�- ����'-+�%"3�-"(' �1���+��-�, "'�*."-2
1. �+ �'-"'� ,��('��+2 ,�!((%, (��%"�'", ��+-%�+, �'� ��!�+ +(�,$2 2008): ��!((%, "' )((+�+ &.'"�")�%"-"�, ��%% �.+-!�+ ��!"'� -!�"+ �(.'-�+)�+-, "' ��--�+-(�� �+��,.
– �"���+�'- +��,(', �(+ -!", (.-�(&�: • "- &�2 �� -!�- "',-"-.-"(', (� %(��% ��&(�+��2 /�+2 0"��%2 ��+(,, �+��,, (+ +"�!�+ �+��, &�2 !�/� &(+� �%(.- (+ %(��2"' )(0�+ 0"-! !" !�+ �.-!(+"-"�, 0!( �%%(��-� +�,(.+��, ��+(,, �+��,.
2. �%%(��-"(' (� ��'��"-, ��+(,, ��,--��' �%" /"%%� �, &(+� +� +�,,"/� ��-�+ ����'-+�%"3�-"('. – �(&"'�-�� )+( +�,,"/� %�'� +��(+&

��.��-"('�% +�,(.+��, /�+2 ��+(,, ,-�-�, �'� ��+(,, �(.'-"�, 0"-!"' ,-�-�,

��.��-"('�% +�,(.+��, /�+2 ��+(,, ,-�-�, �'� ��+(,, �(.'-"�, 0"-!"' ,-�-�,

�+�-�1",-"' "'�*."-"�, '('--+"/"�% "' �(.-! �.��': )(/�+-2 �'� ��.%- %"-�+��2 +�-�,
��+(,, ,-�-�,

,,.�, "' -!� ��," ' (� '-�+ (/�+'&�'-�% �+�'-,
1. �� +�� (� +��",-+"�.-"(' 1. �%(�$ +�'-, /, &�-�!"' +�'-,2. �",-�'�� &��,.+�,
2. �('�"-"('�% /, .'�('�"-"('�%
3. �",��% �",�")%"'�- )�+/�+,� "'��'-"/�, �(+ �",��% ��!�/"(+ - (0'-,(.+�� +�/�'.�, /,. “�+��” &('�2

���",-+"�.-"(' �((%,• ���",-+"�.-"(' -( (��,�- "'�*."-"�, ����'-+�%"3�� ,2,-�&
1. �%(�$ +�'-, • �.+� "'�(&� �����- �- -!� %(��% %�/�%• �%2)�)�+ �����- – �(�, %(��% ,)�'�"' +",� �2 -!� ,�&� �&(.'- (� -!� -+�',��+? �( %(��% �.-!(+"-"�, +��.�� -�1 �.+��',?
2. ��-�!"' +�'-,• �+"�� �'� "'�(&� �����-, �- -!� %(��% %�/�% • '��'-"/"3�, ).�%"� ,�+/"�� )+(/","(' (' -!� &�+ "'• �-+(' �+ �",��% �",�")%"'� (?)
���",-+"�.-"(' �((%,
• �(',"��+�-"(',1. �('�"-"('�%"-2
• (0 &.�! �",�+�-"(' ,!(.%� %�(�% �.-!(+"-"�, !�/�?
2. �+"-�+"� • �().%�-"(': -+�',��+, ��,�� (' #.+",�"�-"(', ,!�+� (�
)().%�-"('
• '�(&� )�+ ��)"-�
• �(�"�% 0�%��+� (.-�(&�,: ��.��-"(', !��%-!, )(/�+-2