Targeted therapy in ovarian cancer
40
Targeted Therapy In Ovarian Cancer Atlal Abusanad, MD, MSc, CIP, FRCPC No Disclosure
-
Upload
ovariancancer -
Category
Health & Medicine
-
view
107 -
download
3
Transcript of Targeted therapy in ovarian cancer
Targeted Therapy In Ovarian Cancer
Atlal Abusanad, MD, MSc, CIP, FRCPC
No Disclosure
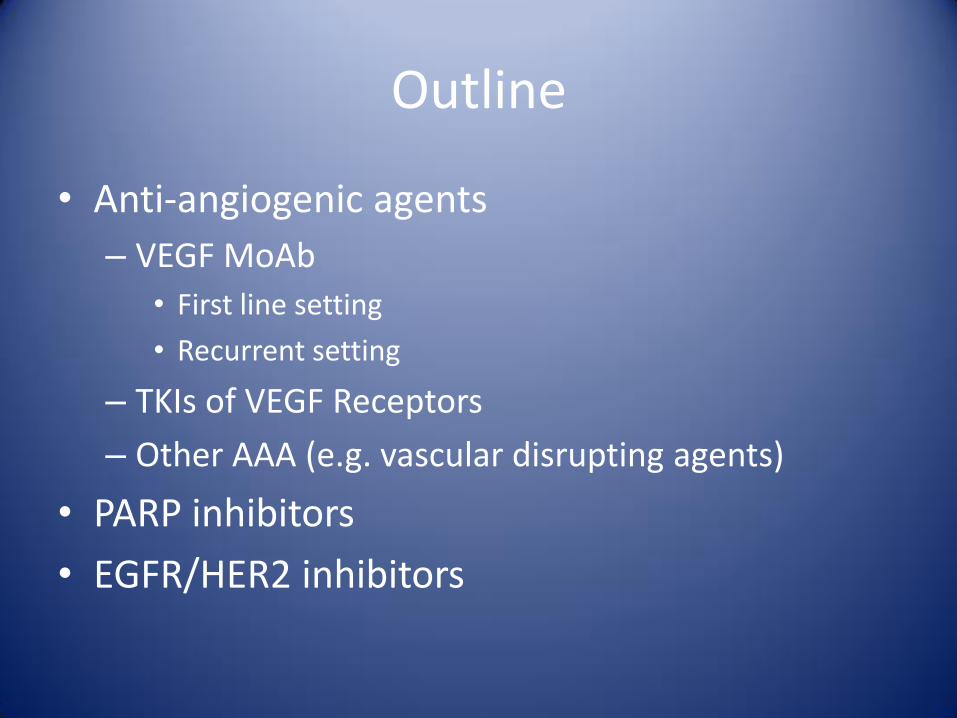
Outline
• Anti-angiogenic agents
– VEGF MoAb
• First line setting
• Recurrent setting
– TKIs of VEGF Receptors
– Other AAA (e.g. vascular disrupting agents)
• PARP inhibitors
• EGFR/HER2 inhibitors
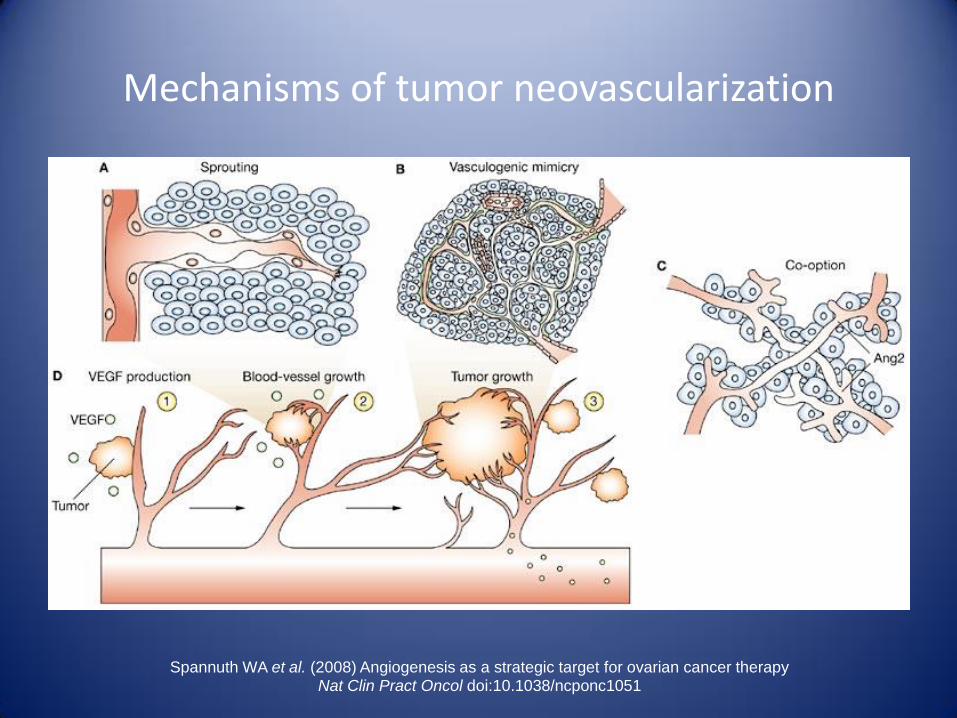
Mechanisms of tumor neovascularization
Spannuth WA et al. (2008) Angiogenesis as a strategic target for ovarian cancer therapy Nat Clin Pract Oncol doi:10.1038/ncponc1051
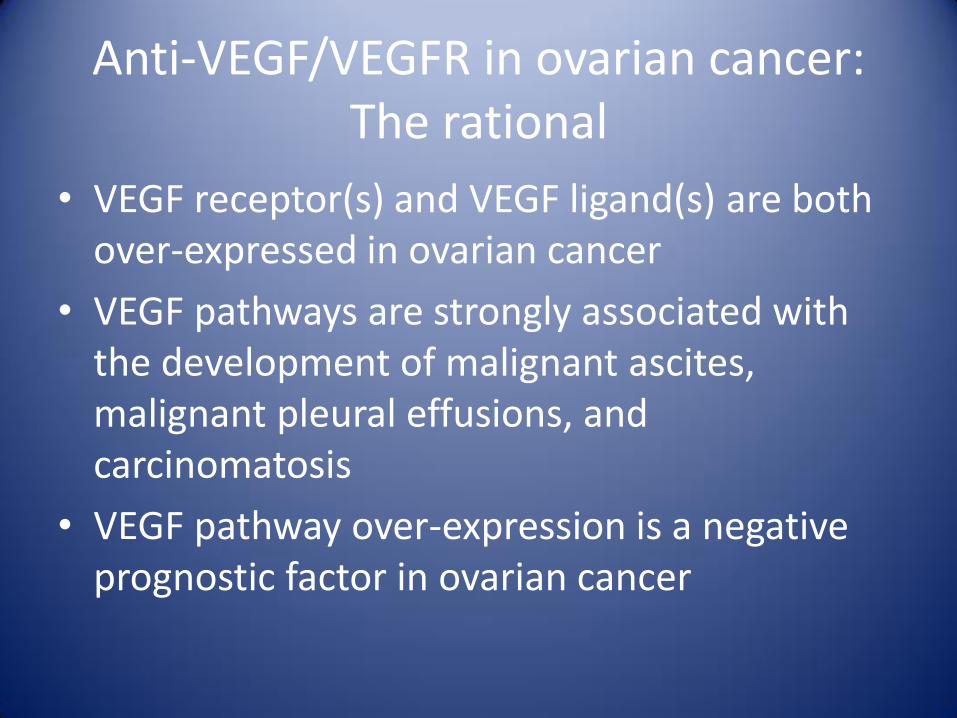
Anti-VEGF/VEGFR in ovarian cancer: The rational
• VEGF receptor(s) and VEGF ligand(s) are both over-expressed in ovarian cancer
• VEGF pathways are strongly associated with the development of malignant ascites, malignant pleural effusions, and carcinomatosis
• VEGF pathway over-expression is a negative prognostic factor in ovarian cancer
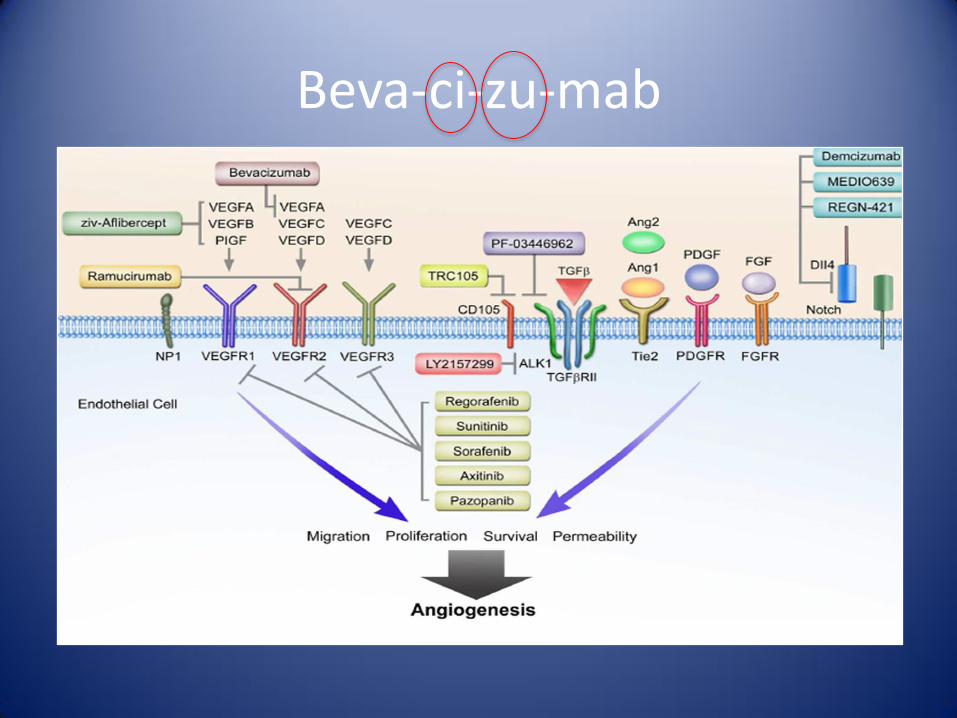
Beva-ci-zu-mab
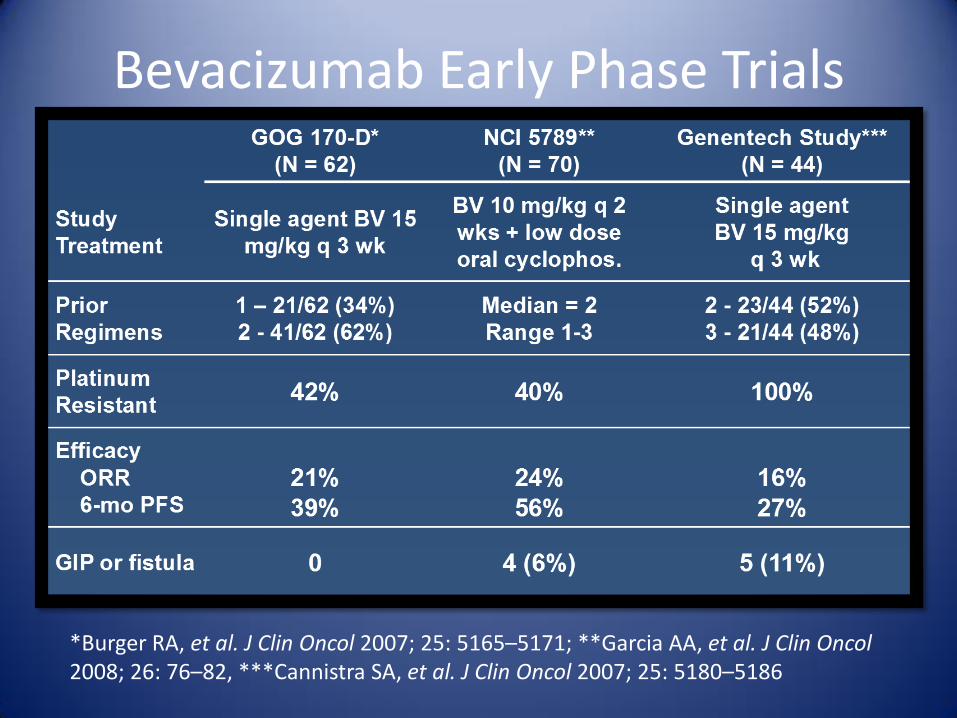
Bevacizumab Early Phase Trials
*Burger RA, et al. J Clin Oncol 2007; 25: 5165–5171; **Garcia AA, et al. J Clin Oncol 2008; 26: 76–82, ***Cannistra SA, et al. J Clin Oncol 2007; 25: 5180–5186
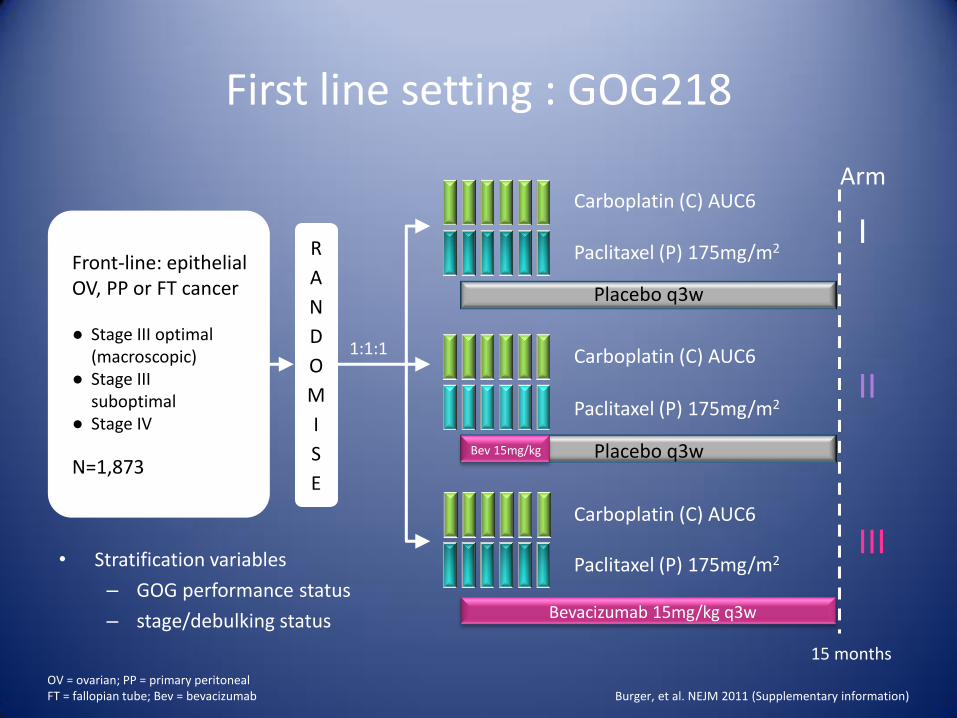
First line setting : GOG218
• Stratification variables
– GOG performance status
– stage/debulking status Bevacizumab 15mg/kg q3w
15 months
Paclitaxel (P) 175mg/m2
Carboplatin (C) AUC6
Carboplatin (C) AUC6
Paclitaxel (P) 175mg/m2
Carboplatin (C) AUC6
Paclitaxel (P) 175mg/m2
Placebo q3w
Placebo q3w
Front-line: epithelial OV, PP or FT cancer ● Stage III optimal (macroscopic) ● Stage III suboptimal ● Stage IV
N=1,873
I
II
III
Arm
1:1:1
Burger, et al. NEJM 2011 (Supplementary information) OV = ovarian; PP = primary peritoneal FT = fallopian tube; Bev = bevacizumab
Bev 15mg/kg
R
A
N
D
O
M
I
S
E
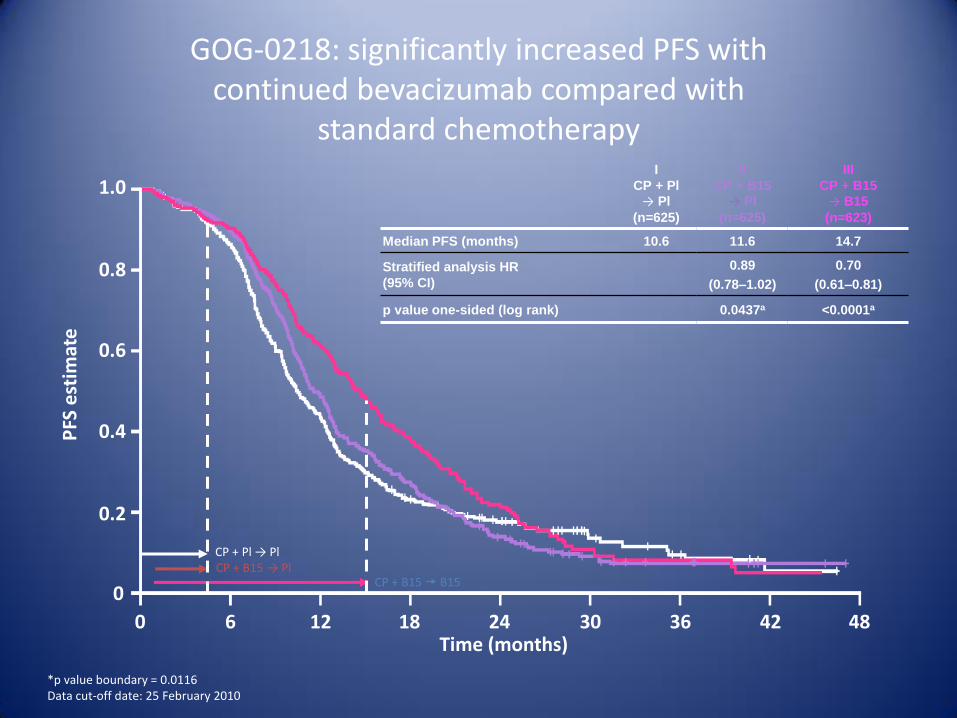
GOG-0218: significantly increased PFS with continued bevacizumab compared with
standard chemotherapy
I
CP + Pl
→ Pl
(n=625)
Median PFS (months) 10.6
Stratified analysis HR
(95% CI)
p value one-sided (log rank)
II
CP + B15
→ Pl
(n=625)
11.6
0.89
(0.78–1.02)
0.0437a
III
CP + B15
→ B15
(n=623)
14.7
0.70
(0.61–0.81)
<0.0001a
*p value boundary = 0.0116 Data cut-off date: 25 February 2010
0 6 12 18 24 30 36 42 48 Time (months)
1.0
0.8
0.6
0.4
0.2
0
PFS
est
imat
e
CP + B15 → Pl CP + Pl → Pl
CP + B15 B15
Data cut-off date: 26 August 2011 SmPC.
CP + Pl → Pl 625 595 558 506 447 322 202 117 55 27 13 1 -
CP + B15 → Pl 625 598 561 487 442 303 191 109 54 28 11 1 -
CP + B15 → B15 623 588 561 519 462 321 202 115 62 26 9 0 -
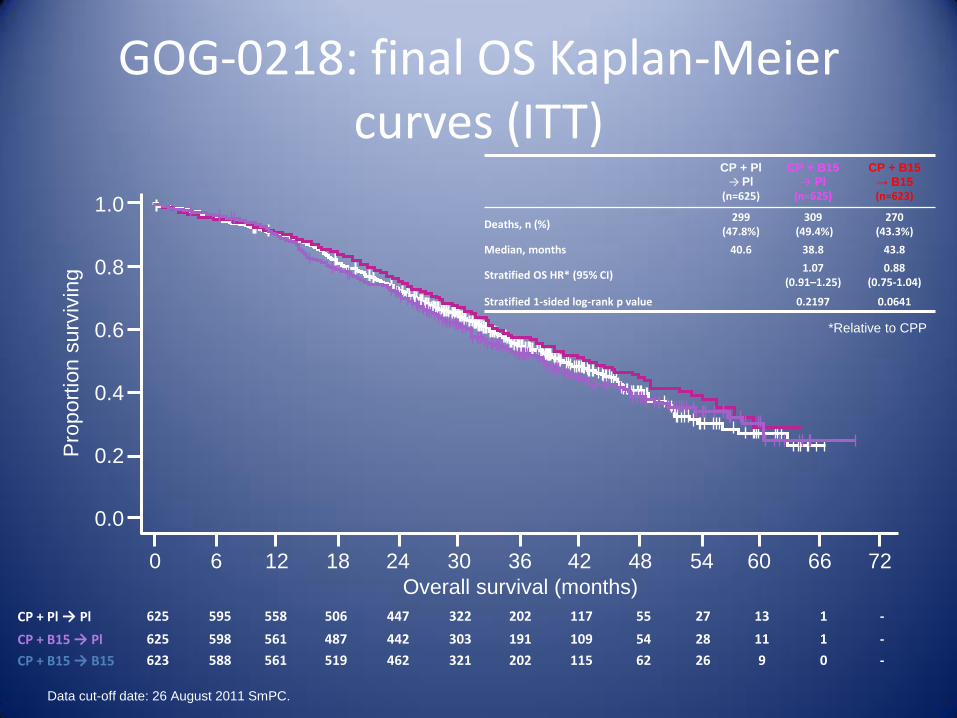
GOG-0218: final OS Kaplan-Meier curves (ITT)
CP + Pl
→ Pl
(n=625)
CP + B15
→ Pl
(n=625)
CP + B15
→ B15 (n=623)
Deaths, n (%) 299
(47.8%) 309
(49.4%) 270
(43.3%)
Median, months 40.6 38.8 43.8
Stratified OS HR* (95% CI) 1.07
(0.91–1.25) 0.88
(0.75-1.04)
Stratified 1-sided log-rank p value 0.2197 0.0641
Overall survival (months)
0 6 66 72
1.0
0.8
0.6
0.4
Pro
po
rtio
n s
urv
ivin
g
12 18 24 30 36 42 48 54 60
0.2
0.0
*Relative to CPP
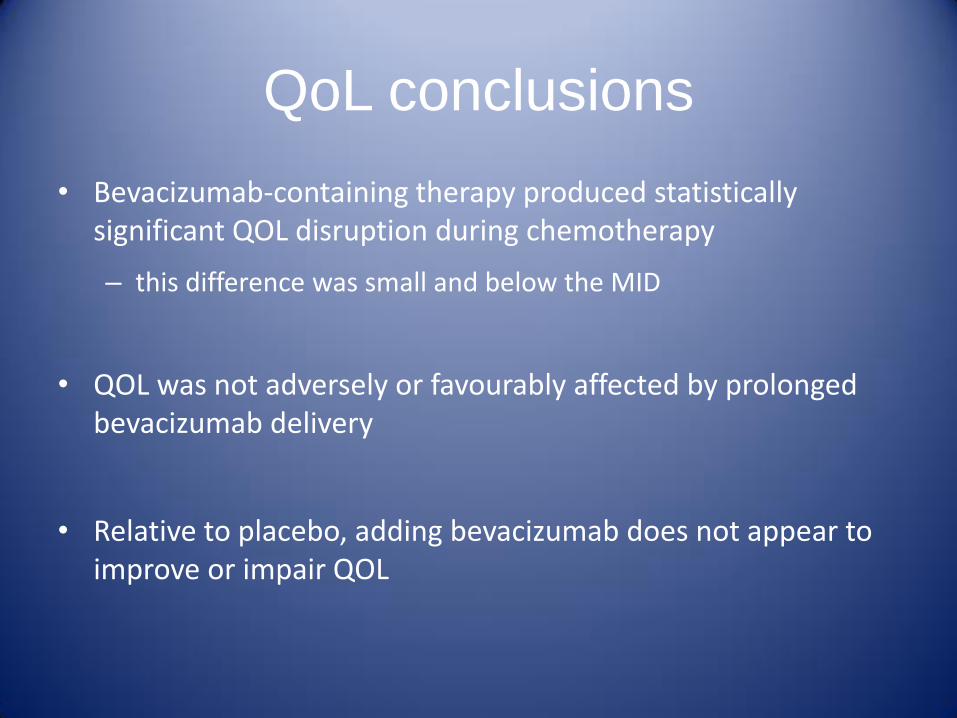
QoL conclusions
• Bevacizumab-containing therapy produced statistically significant QOL disruption during chemotherapy
– this difference was small and below the MID
• QOL was not adversely or favourably affected by prolonged bevacizumab delivery
• Relative to placebo, adding bevacizumab does not appear to improve or impair QOL
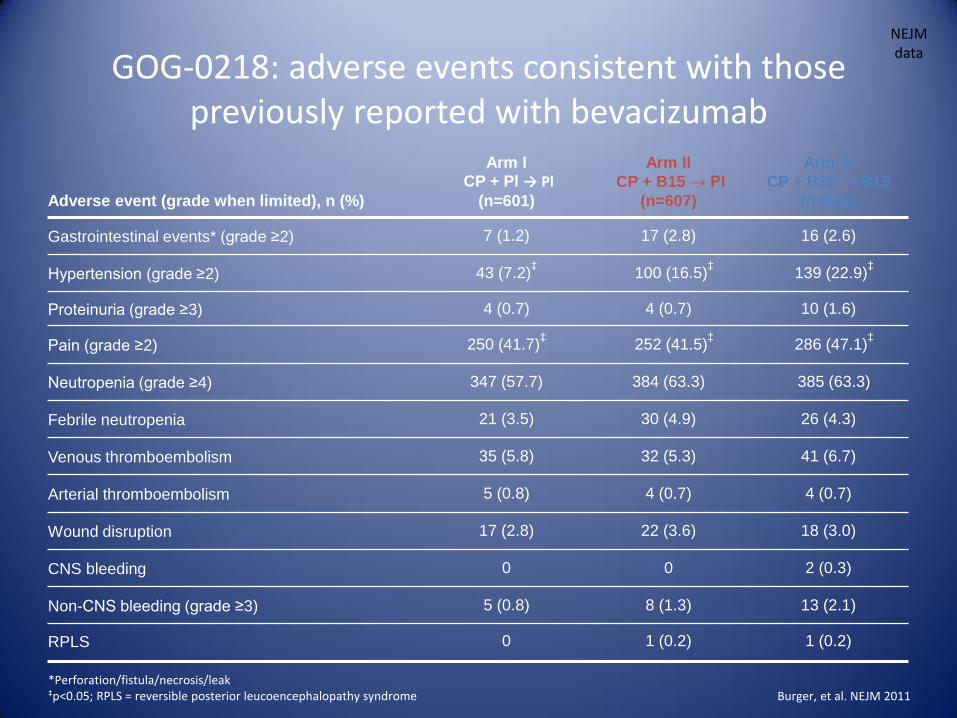
Adverse event (grade when limited), n (%)
Arm I CP + Pl → Pl
(n=601)
Arm II
CP + B15 → Pl
(n=607)
Arm III
CP + B15 → B15
(n=608)
Gastrointestinal events* (grade ≥2) 7 (1.2) 17 (2.8) 16 (2.6)
Hypertension (grade ≥2) 43 (7.2)‡
100 (16.5)‡
139 (22.9)‡
Proteinuria (grade ≥3) 4 (0.7) 4 (0.7) 10 (1.6)
Pain (grade ≥2) 250 (41.7)‡
252 (41.5)‡
286 (47.1)‡
Neutropenia (grade ≥4) 347 (57.7) 384 (63.3) 385 (63.3)
Febrile neutropenia 21 (3.5) 30 (4.9) 26 (4.3)
Venous thromboembolism 35 (5.8) 32 (5.3) 41 (6.7)
Arterial thromboembolism 5 (0.8) 4 (0.7) 4 (0.7)
Wound disruption 17 (2.8) 22 (3.6) 18 (3.0)
CNS bleeding 0 0 2 (0.3)
Non-CNS bleeding (grade ≥3) 5 (0.8) 8 (1.3) 13 (2.1)
RPLS 0 1 (0.2) 1 (0.2)
*Perforation/fistula/necrosis/leak ‡p<0.05; RPLS = reversible posterior leucoencephalopathy syndrome
GOG-0218: adverse events consistent with those previously reported with bevacizumab
NEJM data
Burger, et al. NEJM 2011
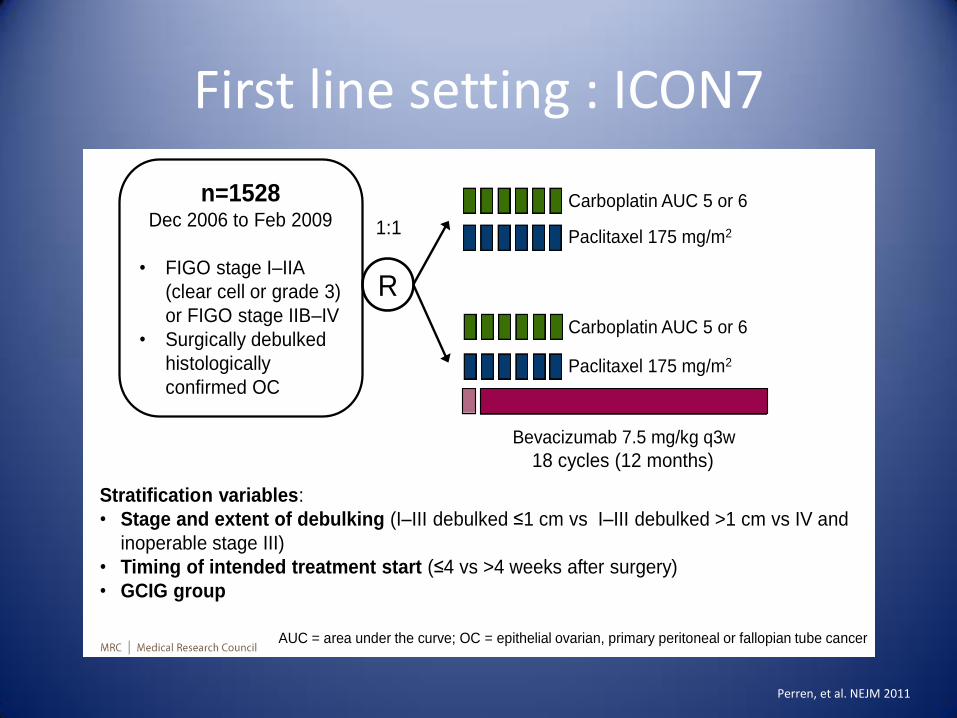
First line setting : ICON7 Schema
Stratification variables:
• Stage and extent of debulking (I–III debulked ≤1 cm vs I–III debulked >1 cm vs IV and
inoperable stage III)
• Timing of intended treatment start (≤4 vs >4 weeks after surgery)
• GCIG group
Paclitaxel 175 mg/m2
Carboplatin AUC 5 or 6
Carboplatin AUC 5 or 6
Paclitaxel 175 mg/m2
18 cycles (12 months)
R
Bevacizumab 7.5 mg/kg q3w
1:1
AUC = area under the curve; OC = epithelial ovarian, primary peritoneal or fallopian tube cancer
n=1528 Dec 2006 to Feb 2009
• FIGO stage I–IIA
(clear cell or grade 3)
or FIGO stage IIB–IV
• Surgically debulked
histologically
confirmed OC
4
Perren, et al. NEJM 2011
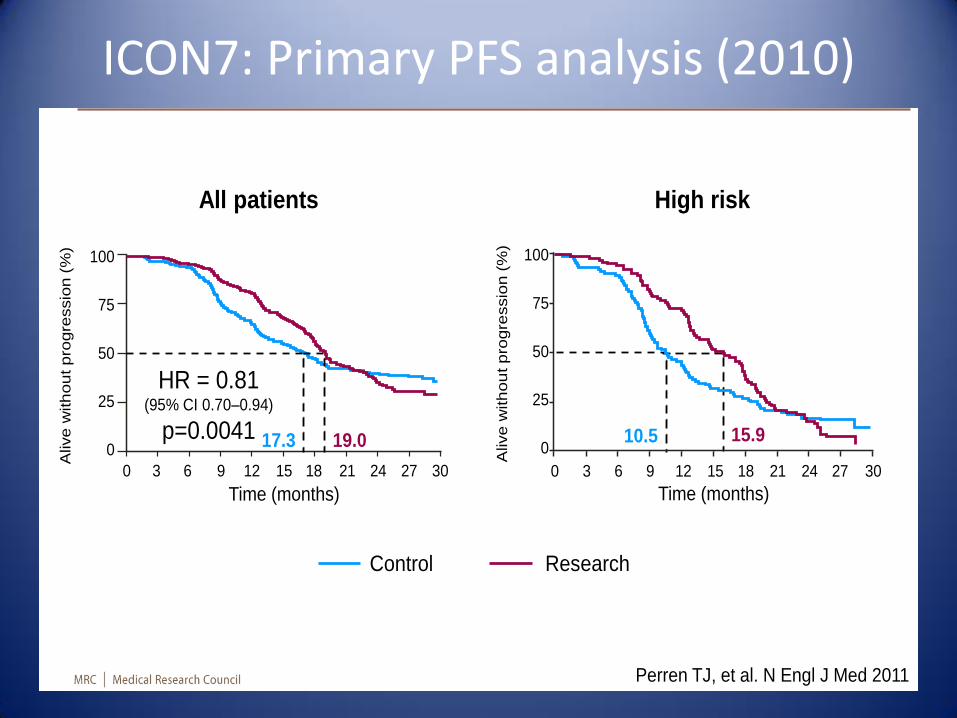
ICON7: Primary PFS analysis (2010)
Primary PFS
analysis (2010)
7
100
75
50
25
0
Alive
with
ou
t pro
gre
ssio
n (
%)
Time (months)
0 3 6 9 12 15 18 21 24 27 30
17.3 19.0
HR = 0.81 (95% CI 0.70–0.94)
p=0.0041 10.5 15.9
Time (months)
100
75
50
25
0
Alive w
ith
ou
t p
rogre
ssio
n (
%)
0 3 6 9 12 15 18 21 24 27 30
Perren TJ, et al. N Engl J Med 2011
Control Research
All patients High risk
Number at risk
Control 764 484 294 239 198 66
Research 764 604 314 226 182 54
1.00
0.75
0.50
0.25
0
Pro
po
rtio
n a
live
w
itho
ut p
ro
gressio
n
Time (months)
0 6 12 18 24 30 36 42 48 54 60
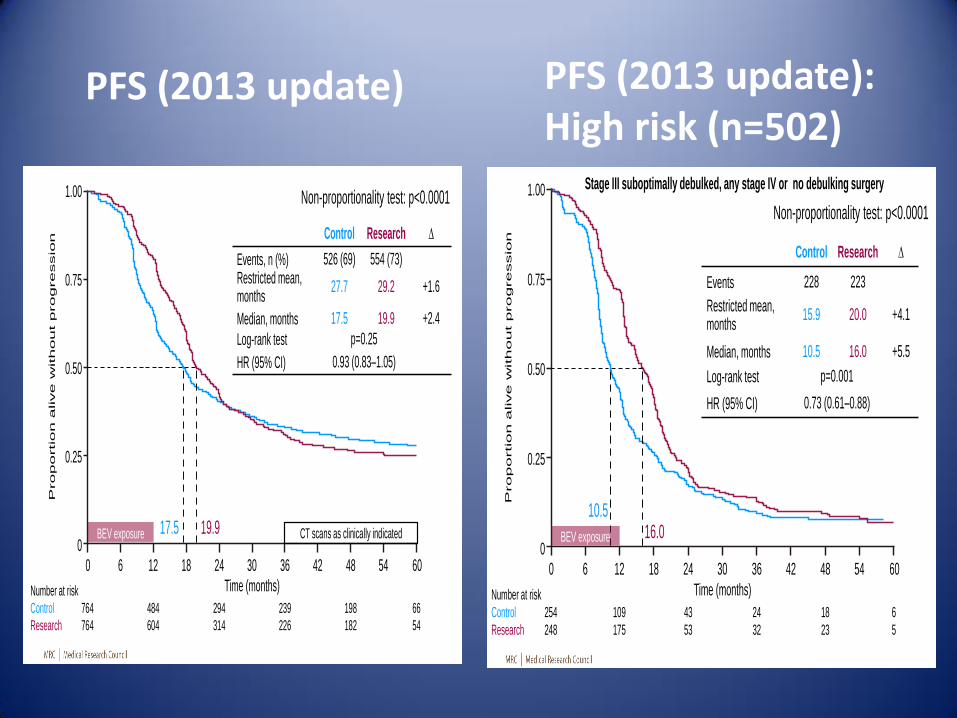
PFS (2013 update)
Control Research ∆
Events, n (%) 526 (69) 554 (73) Restricted mean, months
27.7 29.2 +1.6
Median, months 17.5 19.9 +2.4
Log-rank test p=0.25
HR (95% CI) 0.93 (0.83–1.05)
Non-proportionality test: p<0.0001
BEV exposure 19.9 17.5
8
CT scans as clinically indicated
Number at risk
Control 254 109 43 24 18 6
Research 248 175 53 32 23 5
1.00
0.75
0.50
0.25
0
Pro
po
rtio
n alive w
ith
out p
ro
gre
ssio
n
Time (months)
0 6 12 18 24 30 36 42 48 54 60
PFS (2013 update):
High risk (n=502)
Control Research ∆
Events 228 223
Restricted mean, months
15.9 20.0 +4.1
Median, months 10.5 16.0 +5.5
Log-rank test p=0.001
HR (95% CI) 0.73 (0.61–0.88)
Non-proportionality test: p<0.0001
16.0 10.5
13
Stage III suboptimally debulked, any stage IV or no debulking surgery
BEV exposure
PFS (2013 update) PFS (2013 update): High risk (n=502)
Final OS by risk groups
6.2
2.5 2.1 1.3 0.4
11.6
4.1 1.5
0.40
29.1
2.0
9.2
25.9
4.4 5.0
1.71.3
39.6
6.7
3.6
0.4 0
28.3
2.8
12.5
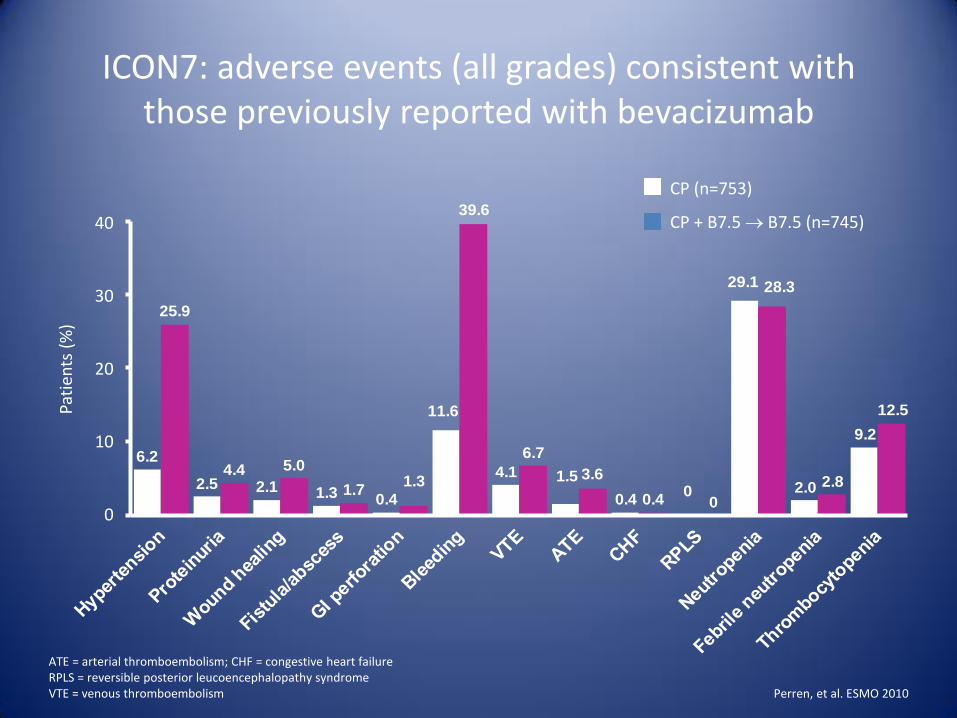
ICON7: adverse events (all grades) consistent with those previously reported with bevacizumab
ATE = arterial thromboembolism; CHF = congestive heart failure RPLS = reversible posterior leucoencephalopathy syndrome VTE = venous thromboembolism
CP (n=753)
CP + B7.5 B7.5 (n=745)
Pati
ents
(%
)
40
30
20
10
0
Perren, et al. ESMO 2010
RECURRENT PLATINUM SENSITIVE OVARIAN CANCER
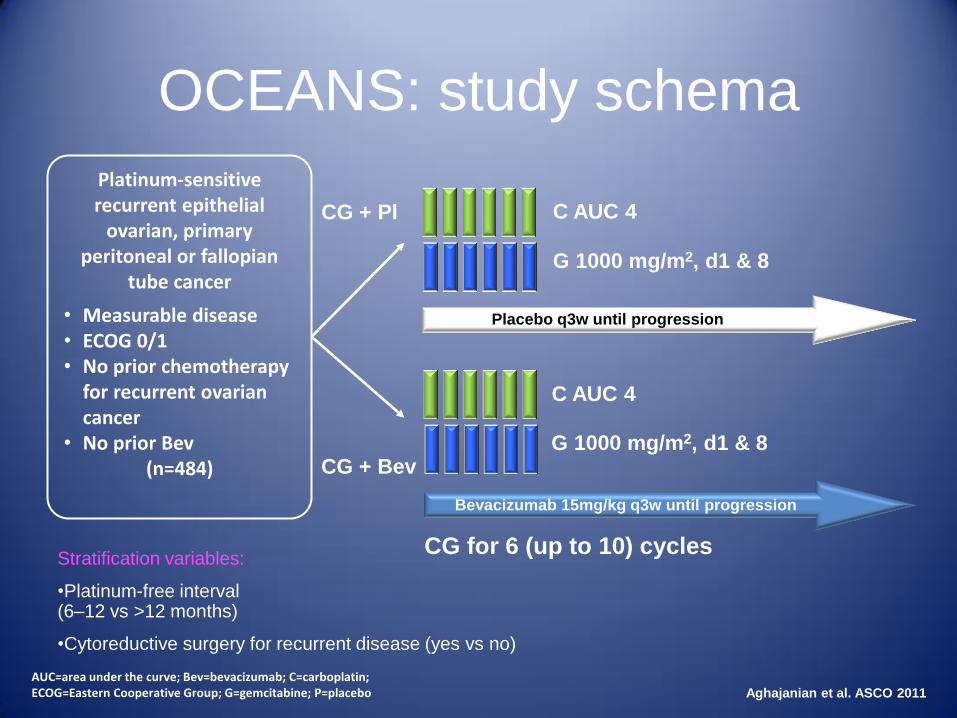
OCEANS: study schema
Stratification variables:
•Platinum-free interval (6–12 vs >12 months)
•Cytoreductive surgery for recurrent disease (yes vs no)
Placebo q3w until progression
Bevacizumab 15mg/kg q3w until progression
Platinum-sensitive recurrent epithelial
ovarian, primary peritoneal or fallopian
tube cancer
• Measurable disease • ECOG 0/1 • No prior chemotherapy
for recurrent ovarian cancer
• No prior Bev (n=484)
CG + Pl
CG for 6 (up to 10) cycles
G 1000 mg/m2, d1 & 8
C AUC 4
C AUC 4
G 1000 mg/m2, d1 & 8
CG + Bev
AUC=area under the curve; Bev=bevacizumab; C=carboplatin; ECOG=Eastern Cooperative Group; G=gemcitabine; P=placebo
Aghajanian et al. ASCO 2011
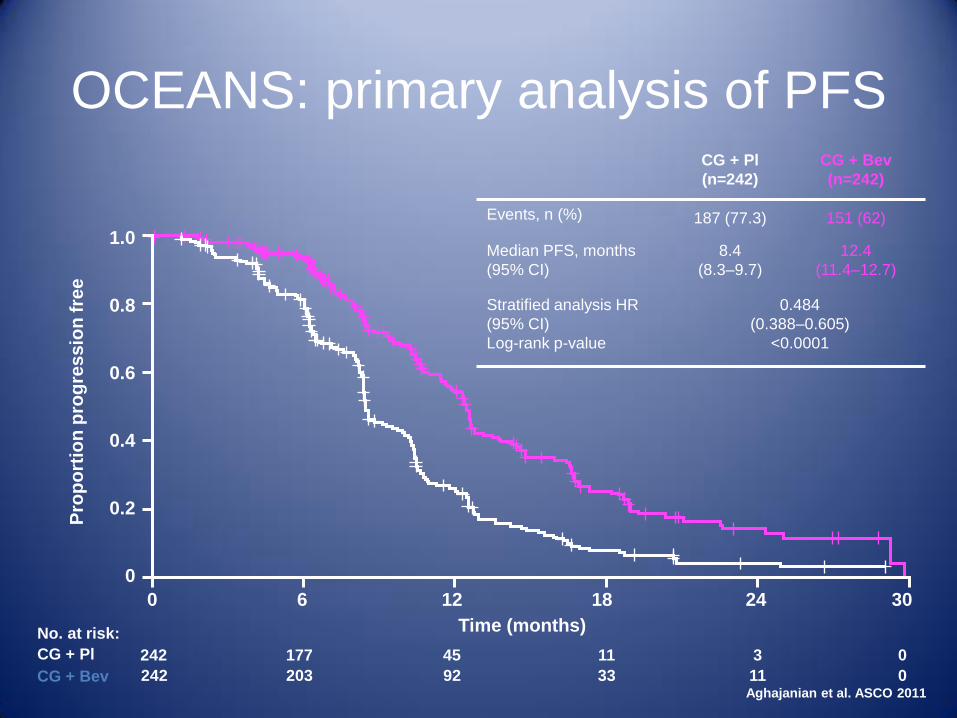
OCEANS: primary analysis of PFS CG + Pl
(n=242)
CG + Bev
(n=242)
Events, n (%) 187 (77.3) 151 (62)
Median PFS, months
(95% CI)
8.4
(8.3–9.7)
12.4
(11.4–12.7)
Stratified analysis HR
(95% CI)
Log-rank p-value
0.484
(0.388–0.605)
<0.0001
Pro
po
rtio
n p
rog
res
sio
n f
ree
242 177 45 11 3 0
242 203 92 33 11 0
CG + Pl
CG + Bev
No. at risk:
1.0
0.8
0.6
0.4
0.2
0
0 6 12 18 24 30
Time (months)
Aghajanian et al. ASCO 2011
100
80
60
40
20
0
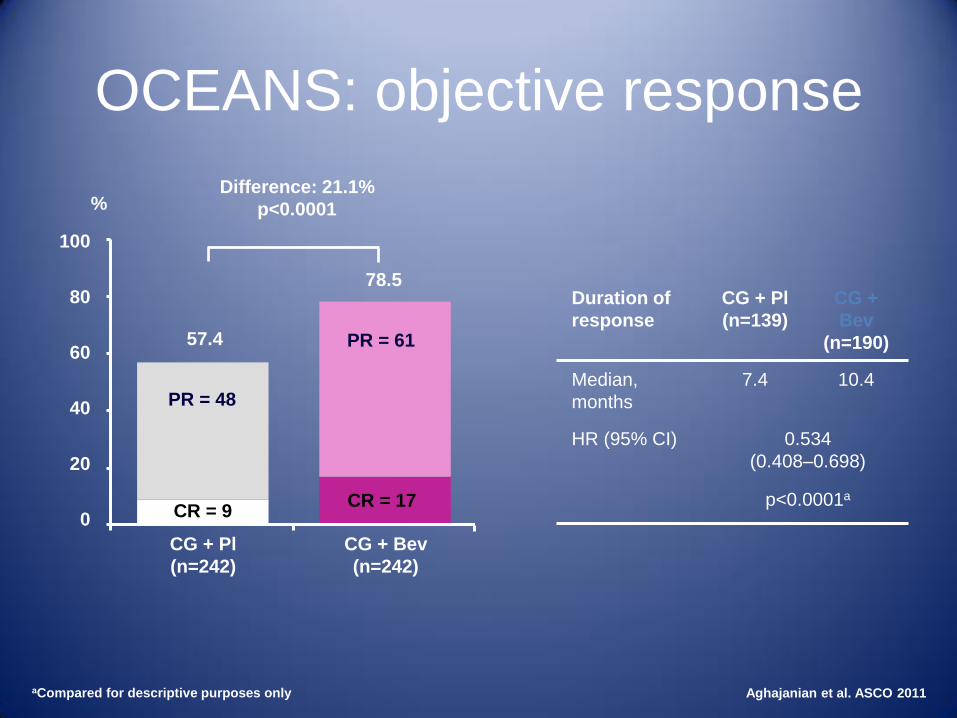
OCEANS: objective response
Aghajanian et al. ASCO 2011
Duration of
response
CG + Pl
(n=139)
CG +
Bev
(n=190)
Median,
months
7.4 10.4
HR (95% CI) 0.534
(0.408–0.698)
p<0.0001a
%
78.5
57.4 PR = 61
PR = 48
CR = 17 CR = 9
Difference: 21.1%
p<0.0001
aCompared for descriptive purposes only
CG + Pl
(n=242)
CG + Bev
(n=242)
0 6 12 18 24 30 36 42 48 54 60
Pro
po
rtio
n s
urv
ivin
g
Months
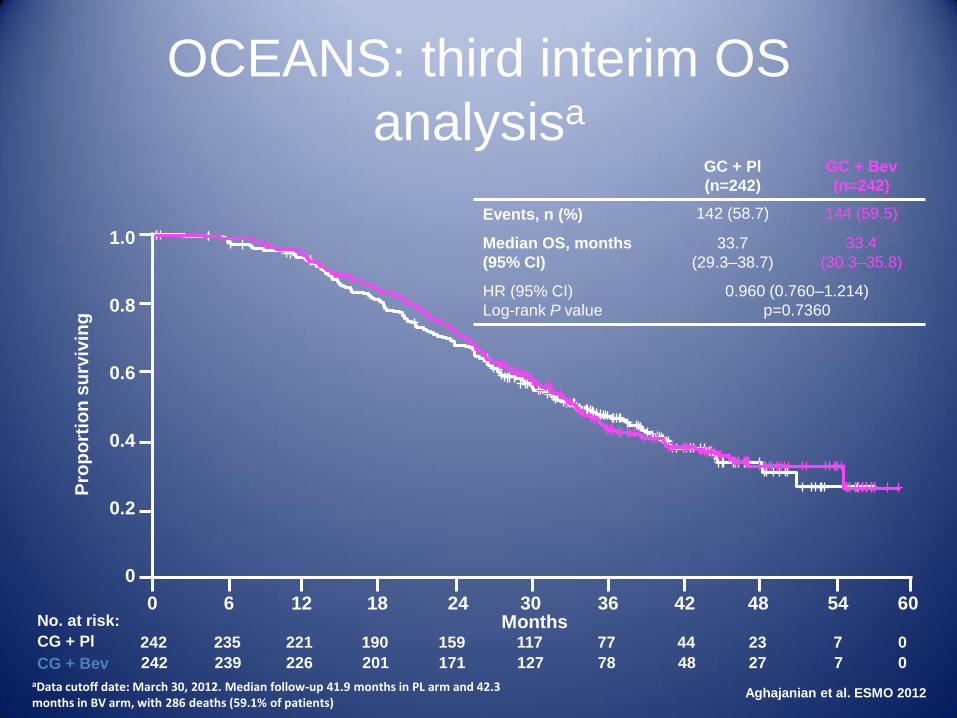
OCEANS: third interim OS
analysisa GC + Pl
(n=242)
GC + Bev
(n=242)
Events, n (%) 142 (58.7) 144 (59.5)
Median OS, months
(95% CI)
33.7
(29.3‒38.7)
33.4
(30.3‒35.8)
HR (95% CI)
Log-rank P value
0.960 (0.760–1.214)
p=0.7360
aData cutoff date: March 30, 2012. Median follow-up 41.9 months in PL arm and 42.3 months in BV arm, with 286 deaths (59.1% of patients)
1.0
0.8
0.6
0.4
0.2
0
242 221 159 77 23 0
242 226 171 78 27 0
CG + Pl
CG + Bev
No. at risk:
235
239
190
201
117
127
44
48
7
7
Aghajanian et al. ESMO 2012
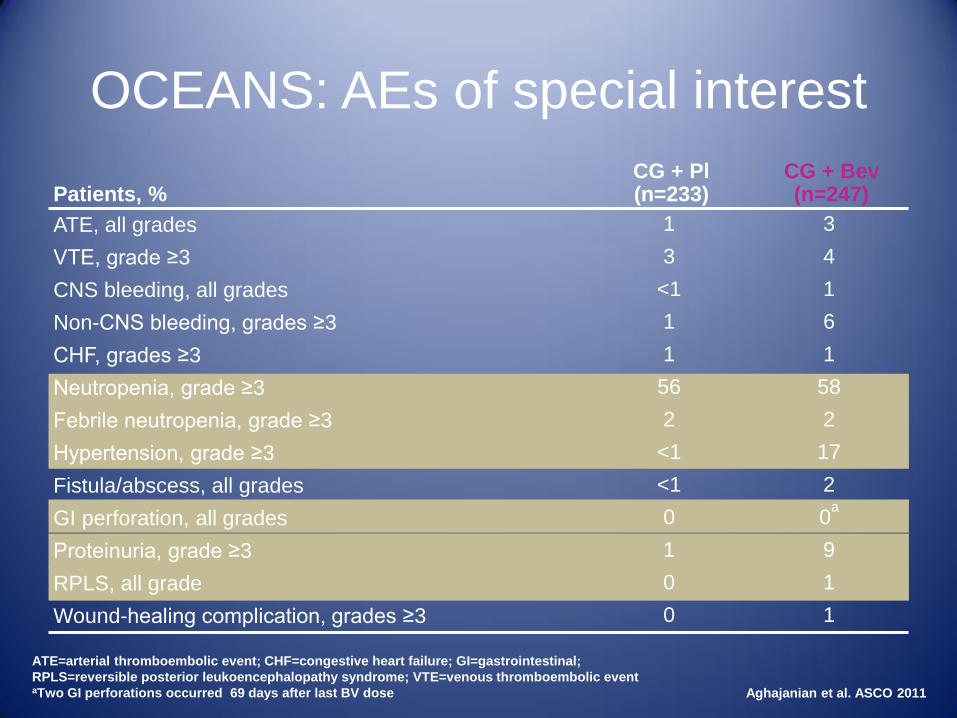
OCEANS: AEs of special interest
ATE=arterial thromboembolic event; CHF=congestive heart failure; GI=gastrointestinal;
RPLS=reversible posterior leukoencephalopathy syndrome; VTE=venous thromboembolic event aTwo GI perforations occurred 69 days after last BV dose
Patients, %
CG + Pl (n=233)
CG + Bev (n=247)
ATE, all grades 1 3
VTE, grade ≥3 3 4
CNS bleeding, all grades <1 1
Non-CNS bleeding, grades ≥3 1 6
CHF, grades ≥3 1 1
Neutropenia, grade ≥3 56 58
Febrile neutropenia, grade ≥3 2 2
Hypertension, grade ≥3 <1 17
Fistula/abscess, all grades <1 2
GI perforation, all grades 0 0a
Proteinuria, grade ≥3 1 9
RPLS, all grade 0 1
Wound-healing complication, grades ≥3 0 1
Aghajanian et al. ASCO 2011
PD = progressive disease
aEpithelial ovarian, primary peritoneal, or fallopian tube cancer; bOr 10 mg/kg q2w; c15 mg/kg q3w, permitted on clear evidence of progression
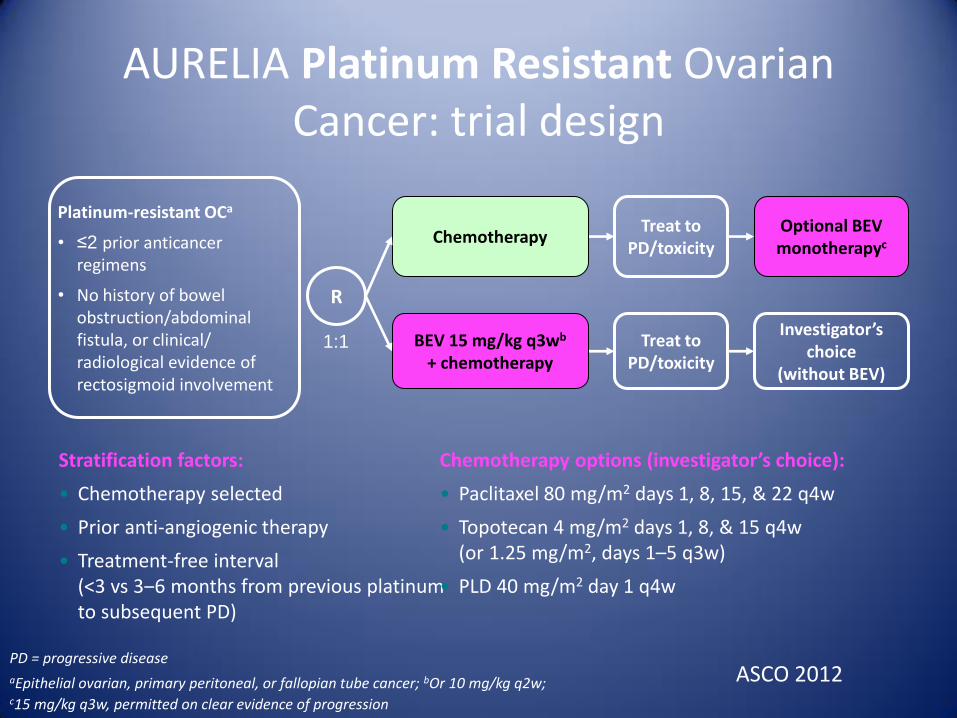
AURELIA Platinum Resistant Ovarian Cancer: trial design
Stratification factors:
• Chemotherapy selected
• Prior anti-angiogenic therapy
• Treatment-free interval (<3 vs 3‒6 months from previous platinum to subsequent PD)
Platinum-resistant OCa
• ≤2 prior anticancer regimens
• No history of bowel obstruction/abdominal fistula, or clinical/ radiological evidence of rectosigmoid involvement
Treat to PD/toxicity
Treat to PD/toxicity
Investigator’s choice
(without BEV)
Optional BEV monotherapyc
BEV 15 mg/kg q3wb + chemotherapy
Chemotherapy
R
1:1
Chemotherapy options (investigator’s choice):
• Paclitaxel 80 mg/m2 days 1, 8, 15, & 22 q4w
• Topotecan 4 mg/m2 days 1, 8, & 15 q4w (or 1.25 mg/m2, days 1–5 q3w)
• PLD 40 mg/m2 day 1 q4w
ASCO 2012
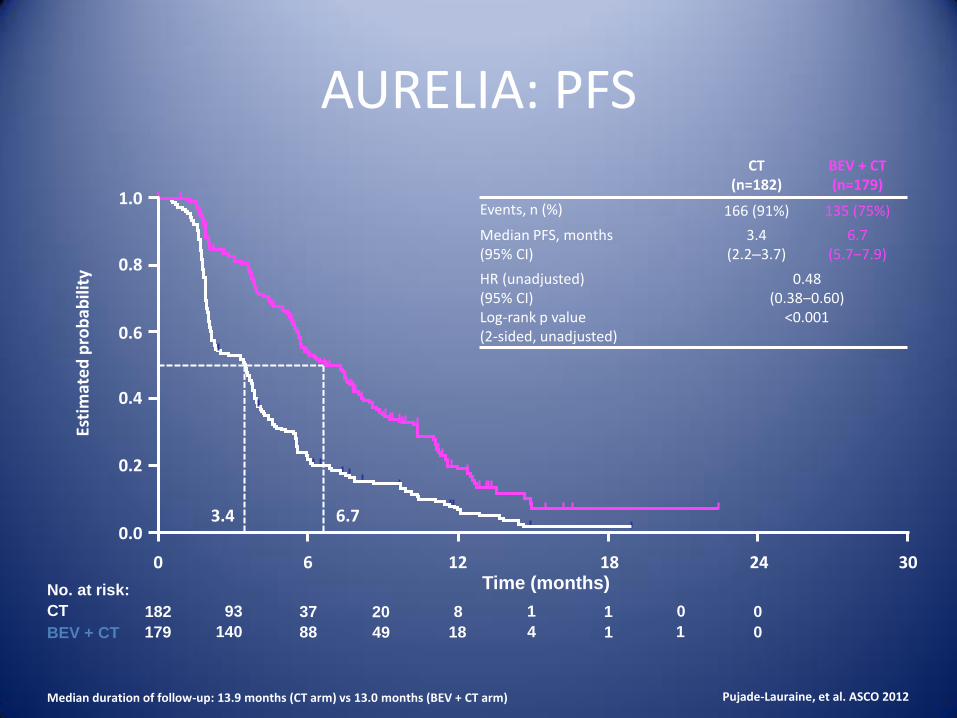
AURELIA: PFS
Median duration of follow-up: 13.9 months (CT arm) vs 13.0 months (BEV + CT arm)
CT (n=182)
BEV + CT (n=179)
Events, n (%) 166 (91%) 135 (75%)
Median PFS, months (95% CI)
3.4 (2.2‒3.7)
6.7 (5.7‒7.9)
HR (unadjusted) (95% CI) Log-rank p value (2-sided, unadjusted)
0.48 (0.38‒0.60)
<0.001
Time (months)
182 37 8 1 0
179 88 18 1 0
CT
BEV + CT
No. at risk:
93
140
20
49
1
4
0
1
3.4 6.7
Pujade-Lauraine, et al. ASCO 2012
Esti
mat
ed
pro
bab
ility
0.0
0.2
0.4
0.6
0.8
1.0
0 6 12 18 24 30
Subgroup No. of
patients
Median PFS, months
HR* BEV + CT
better CT
better CT BEV + CT
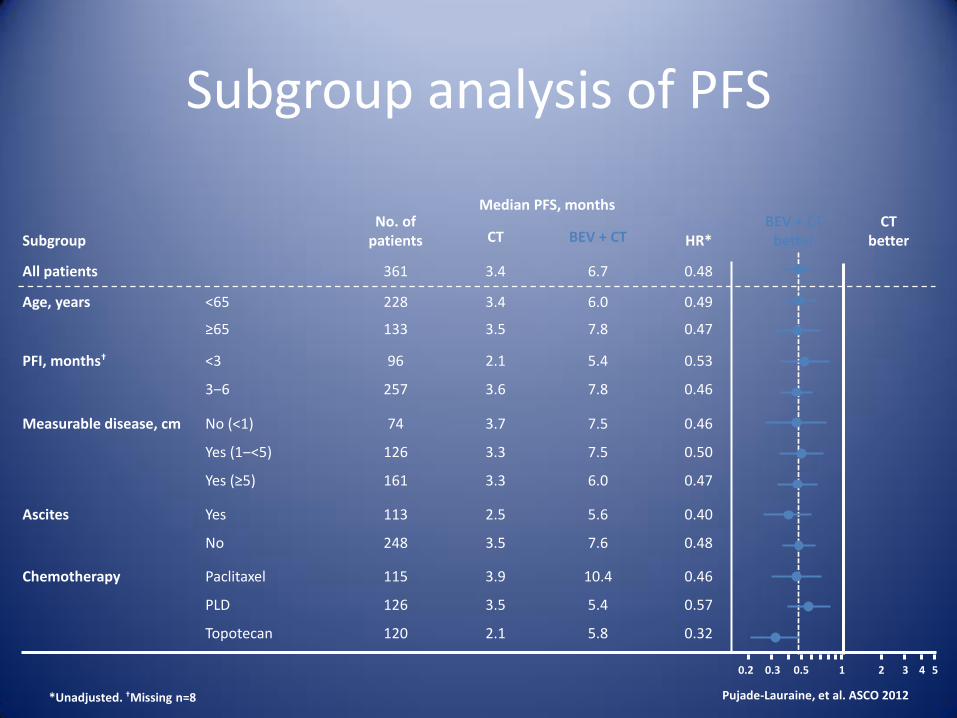
All patients 361 3.4 6.7 0.48
Age, years <65
≥65
228
133
3.4
3.5
6.0
7.8
0.49
0.47
PFI, months† <3
3‒6
96
257
2.1
3.6
5.4
7.8
0.53
0.46
Measurable disease, cm No (<1)
Yes (1‒<5)
Yes (≥5)
74
126
161
3.7
3.3
3.3
7.5
7.5
6.0
0.46
0.50
0.47
Ascites Yes
No
113
248
2.5
3.5
5.6
7.6
0.40
0.48
Chemotherapy Paclitaxel
PLD
Topotecan
115
126
120
3.9
3.5
2.1
10.4
5.4
5.8
0.46
0.57
0.32
Subgroup analysis of PFS
*Unadjusted. †Missing n=8
0.2 0.3 0.5 1 2 3 4 5
Pujade-Lauraine, et al. ASCO 2012
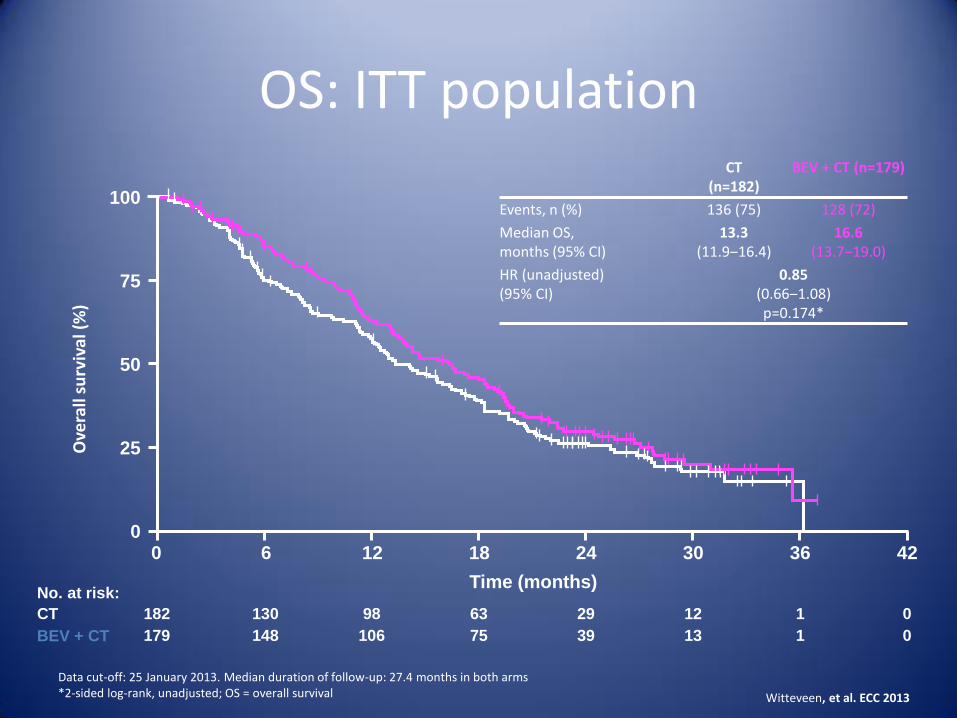
OS: ITT population
Data cut-off: 25 January 2013. Median duration of follow-up: 27.4 months in both arms *2-sided log-rank, unadjusted; OS = overall survival
CT
BEV + CT
No. at risk:
CT (n=182)
BEV + CT (n=179)
Events, n (%) 136 (75) 128 (72)
Median OS, months (95% CI)
13.3 (11.9‒16.4)
16.6 (13.7‒19.0)
HR (unadjusted) (95% CI)
0.85 (0.66‒1.08) p=0.174*
182 130 98 63 29 12 1 0
179 148 106 75 39 13 1 0
0 6 12 18 24 30 36 42
Time (months)
100
75
50
25
0
Ove
rall
surv
ival
(%
)
Witteveen, et al. ECC 2013
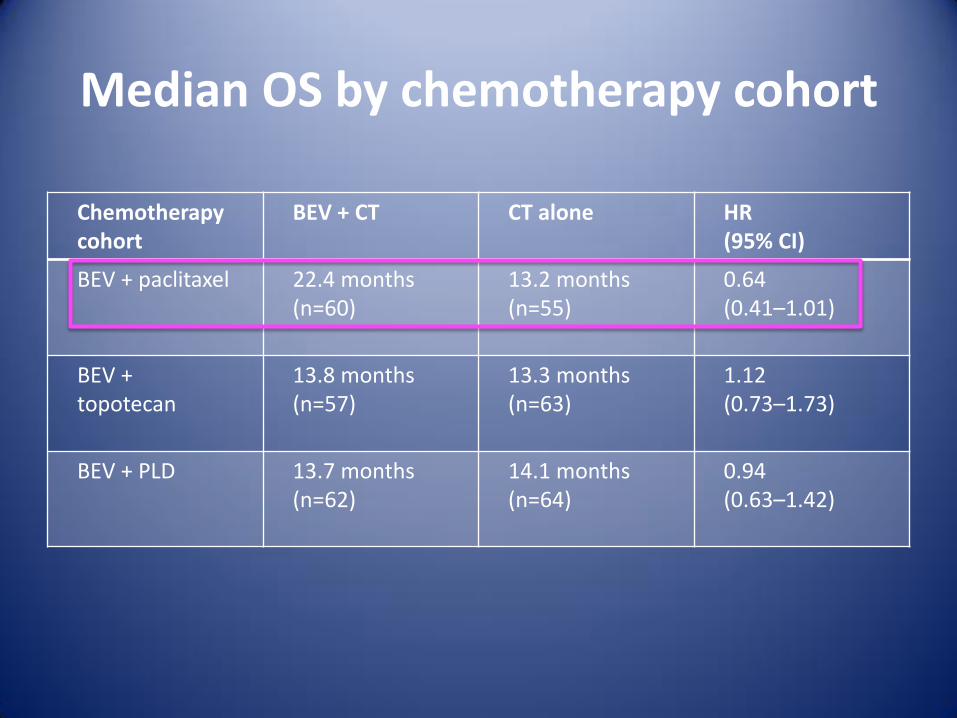
Median OS by chemotherapy cohort
Chemotherapy cohort
BEV + CT CT alone HR (95% CI)
BEV + paclitaxel 22.4 months (n=60)
13.2 months (n=55)
0.64 (0.41–1.01)
BEV + topotecan
13.8 months (n=57)
13.3 months (n=63)
1.12 (0.73–1.73)
BEV + PLD 13.7 months (n=62)
14.1 months (n=64)
0.94 (0.63–1.42)
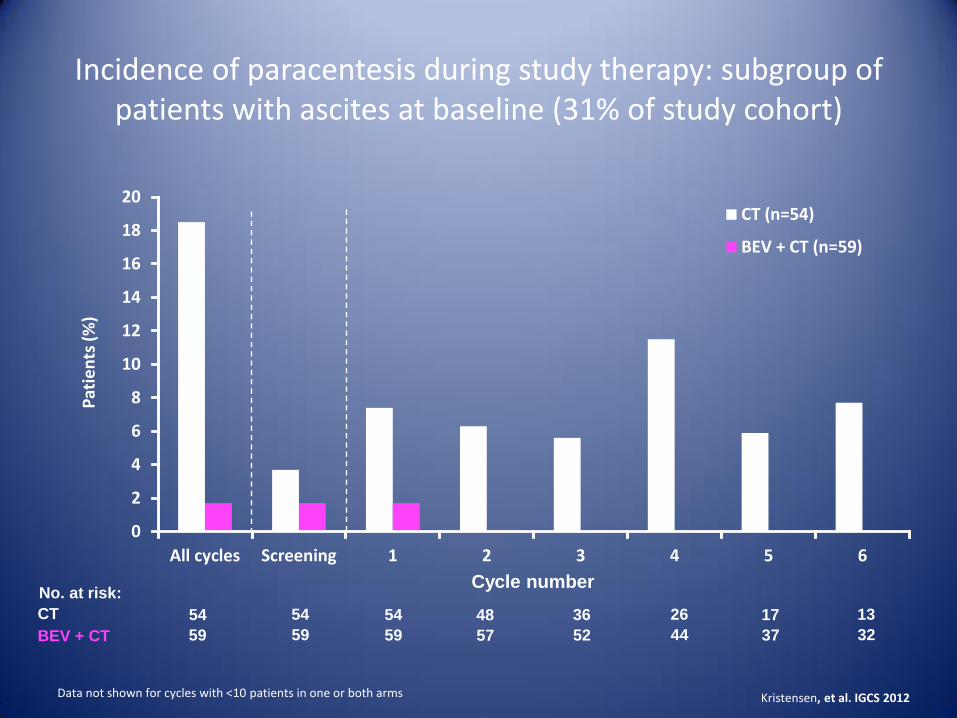
Incidence of paracentesis during study therapy: subgroup of patients with ascites at baseline (31% of study cohort)
Data not shown for cycles with <10 patients in one or both arms
0
2
4
6
8
10
12
14
16
18
20
All cycles Screening 1 2 3 4 5 6
CT (n=54)
BEV + CT (n=59)
Pat
ien
ts (
%)
Cycle number
CT
BEV + CT
No. at risk:
54 54 36 17
59 59 52 37
54
59
48
57
26
44
13
32
Kristensen, et al. IGCS 2012
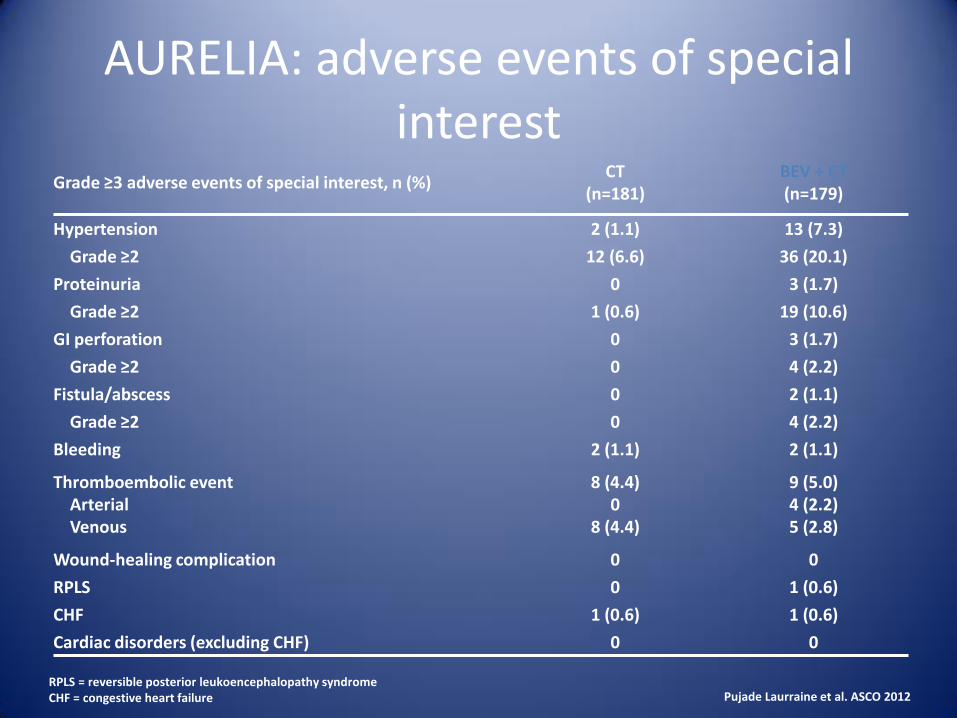
Grade ≥3 adverse events of special interest, n (%) CT
(n=181) BEV + CT (n=179)
Hypertension 2 (1.1) 13 (7.3)
Grade ≥2 12 (6.6) 36 (20.1)
Proteinuria 0 3 (1.7)
Grade ≥2 1 (0.6) 19 (10.6)
GI perforation 0 3 (1.7)
Grade ≥2 0 4 (2.2)
Fistula/abscess 0 2 (1.1)
Grade ≥2 0 4 (2.2)
Bleeding 2 (1.1) 2 (1.1)
Thromboembolic event Arterial Venous
8 (4.4) 0
8 (4.4)
9 (5.0) 4 (2.2) 5 (2.8)
Wound-healing complication 0 0
RPLS 0 1 (0.6)
CHF 1 (0.6) 1 (0.6)
Cardiac disorders (excluding CHF) 0 0
AURELIA: adverse events of special interest
Pujade Laurraine et al. ASCO 2012 RPLS = reversible posterior leukoencephalopathy syndrome CHF = congestive heart failure
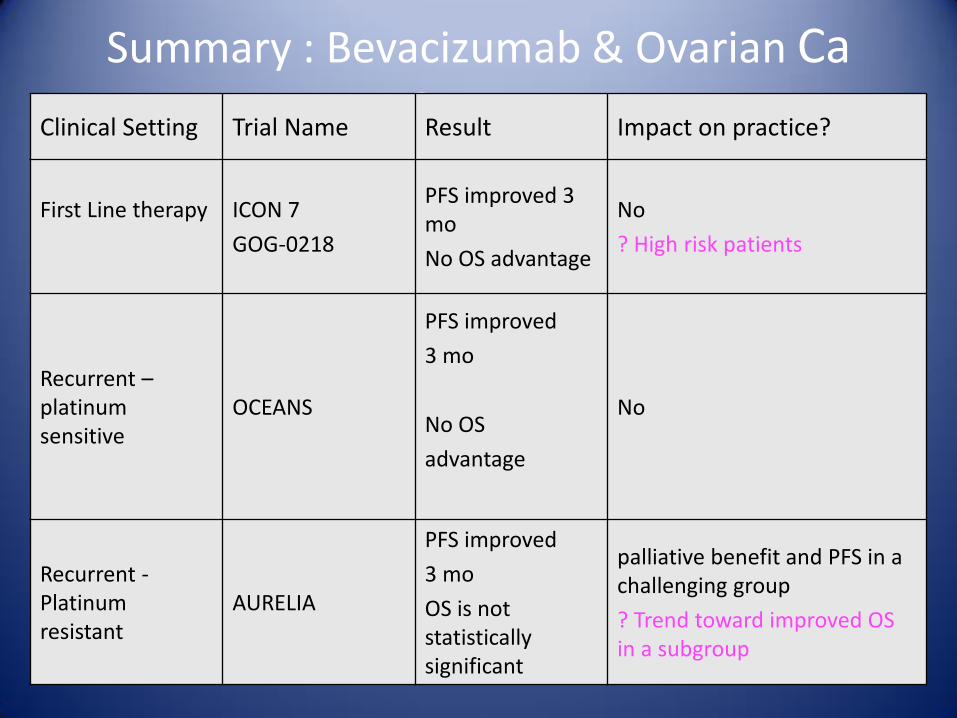
Summary : Bevacizumab & Ovarian Ca Cancer Clinical Setting Trial Name Result Impact on practice?
First Line therapy
ICON 7
GOG-0218
PFS improved 3 mo
No OS advantage
No
? High risk patients
Recurrent – platinum sensitive
OCEANS
PFS improved
3 mo
No OS
advantage
No
Recurrent - Platinum resistant
AURELIA
PFS improved
3 mo
OS is not statistically significant
palliative benefit and PFS in a challenging group
? Trend toward improved OS in a subgroup
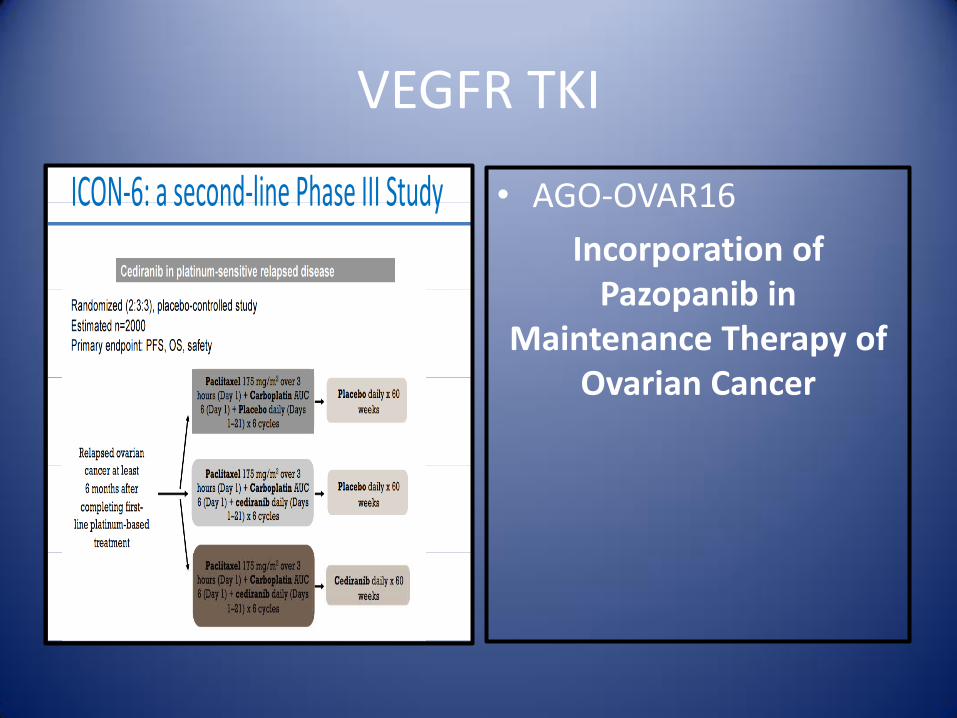
VEGFR TKI
• AGO-OVAR16
Incorporation of Pazopanib in
Maintenance Therapy of Ovarian Cancer
PARP Inhibitors
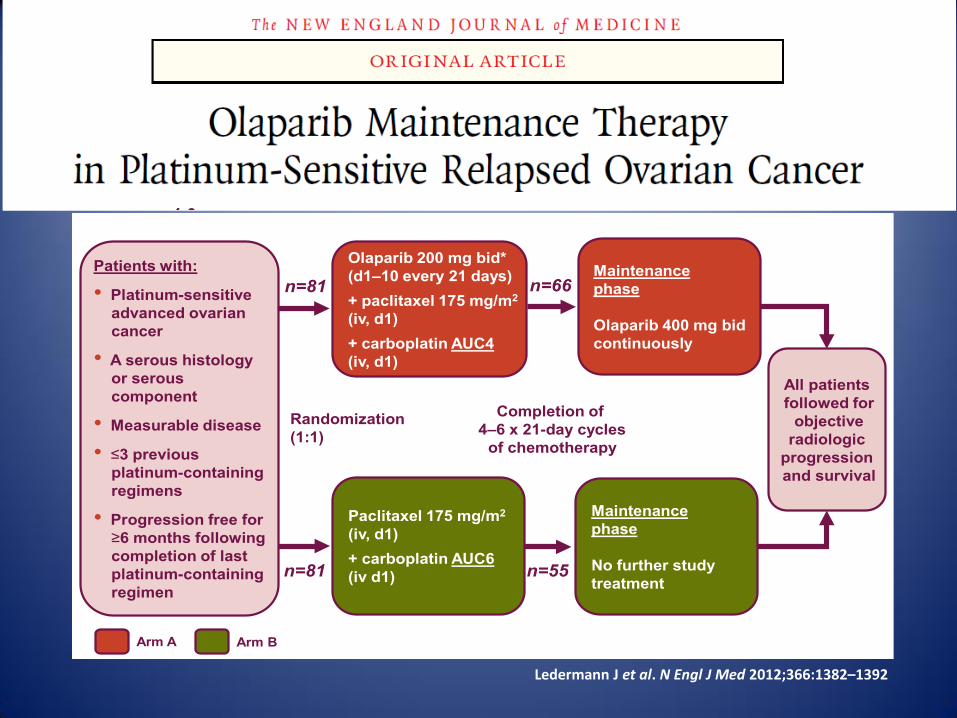
Randomized, open-label, Phase II study in patients with
platinum-sensitive, advanced serous ovarian cancer
Patients with:
• Platinum-sensitive
advanced ovarian
cancer
• A serous histology
or serous
component
• Measurable disease
• 3 previous
platinum-containing
regimens
• Progression free for
6 months following
completion of last
platinum-containing
regimen
Olaparib 200 mg bid*
(d1–10 every 21 days)
+ paclitaxel 175 mg/m2
(iv, d1)
+ carboplatin AUC4
(iv, d1)
Paclitaxel 175 mg/m2
(iv, d1)
+ carboplatin AUC6
(iv d1)
Randomization
(1:1)
All patients
followed for
objective
radiologic
progression
and survival
Maintenance
phase
Olaparib 400 mg bid
continuously
Maintenance
phase
No further study
treatment
Completion of
4–6 x 21-day cycles
of chemotherapy
Arm B Arm A
n=81
n=81
n=66
n=55
Multinational study; 43 sites in 12 countries * Capsule formulation
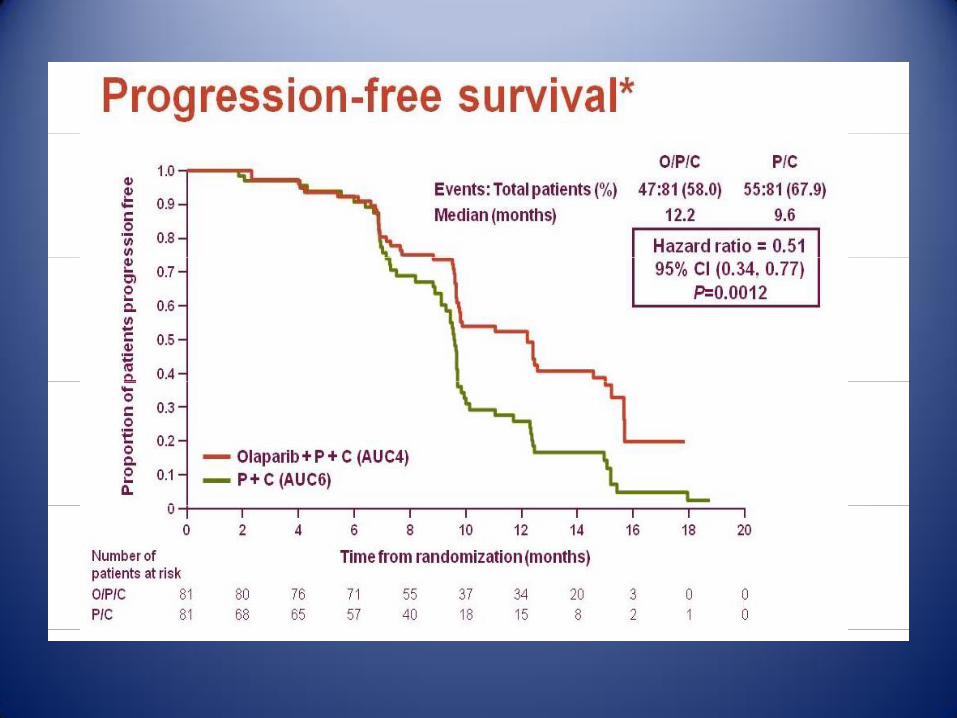
• Statistically significant PFS improvement (HR 0.35, P<0.00001)
• Interim OS analysis: HR=0.94; 95% CI, 0.63–1.39; P=0.75
Ledermann J et al. N Engl J Med 2012;366:1382–1392
0
0.6
0.8
0.9
0
0.1
0.2
0.3
0.4
0.5
0.7
1.0
3 6 9 12 15 18
Pro
ba
bil
ity o
f
pro
gre
ss
ion
-fre
e s
urv
iva
l
Time from randomization (months)
Hazard ratio 0.35
(95% CI, 0.25–0.49)
P<0.00001
Randomized treatment
Placebo
Olaparib 400 mg bid monotherapy
• Statistically significant PFS improvement (HR 0.35, P<0.00001)
• Interim OS analysis: HR=0.94; 95% CI, 0.63–1.39; P=0.75
Ledermann J et al. N Engl J Med 2012;366:1382–1392
0
0.6
0.8
0.9
0
0.1
0.2
0.3
0.4
0.5
0.7
1.0
3 6 9 12 15 18
Pro
ba
bil
ity o
f
pro
gre
ss
ion
-fre
e s
urv
ival
Time from randomization (months)
Hazard ratio 0.35
(95% CI, 0.25–0.49)
P<0.00001
Randomized treatment
Placebo
Olaparib 400 mg bid monotherapy
Ledermann J et al. N Engl J Med 2012;366:1382–1392
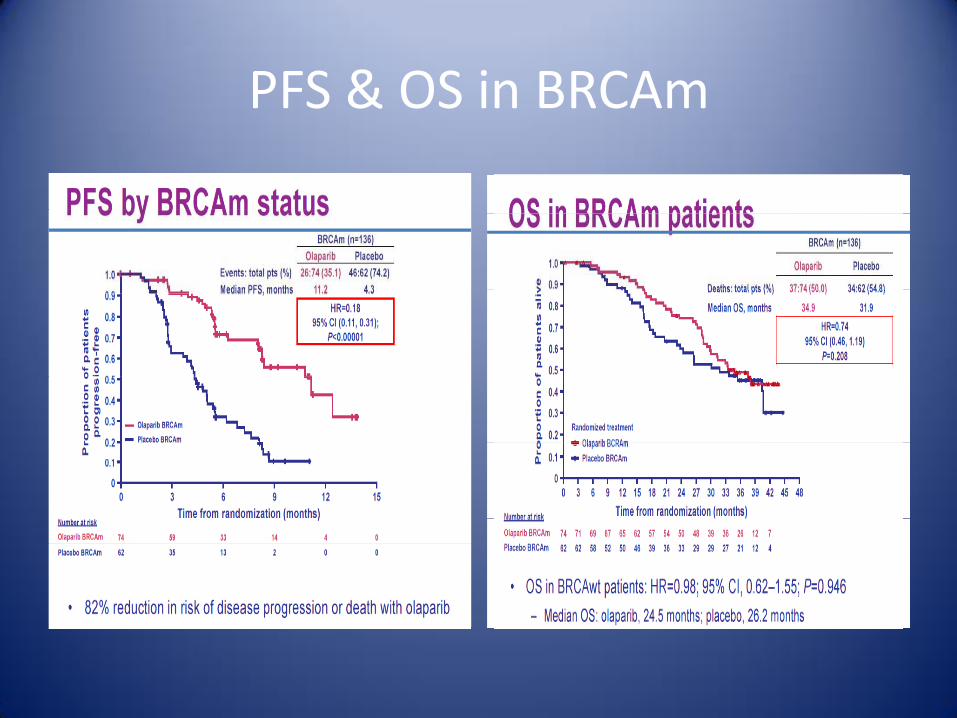
PFS & OS in BRCAm
52
53
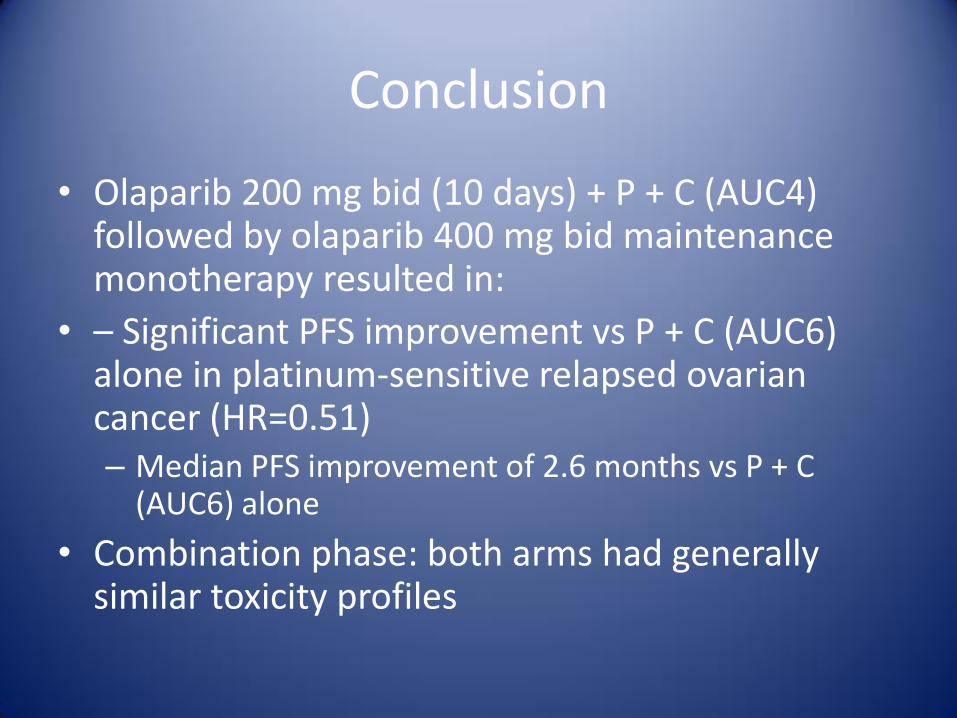
Conclusion
• Olaparib 200 mg bid (10 days) + P + C (AUC4) followed by olaparib 400 mg bid maintenance monotherapy resulted in:
• – Significant PFS improvement vs P + C (AUC6) alone in platinum-sensitive relapsed ovarian cancer (HR=0.51) – Median PFS improvement of 2.6 months vs P + C
(AUC6) alone
• Combination phase: both arms had generally similar toxicity profiles
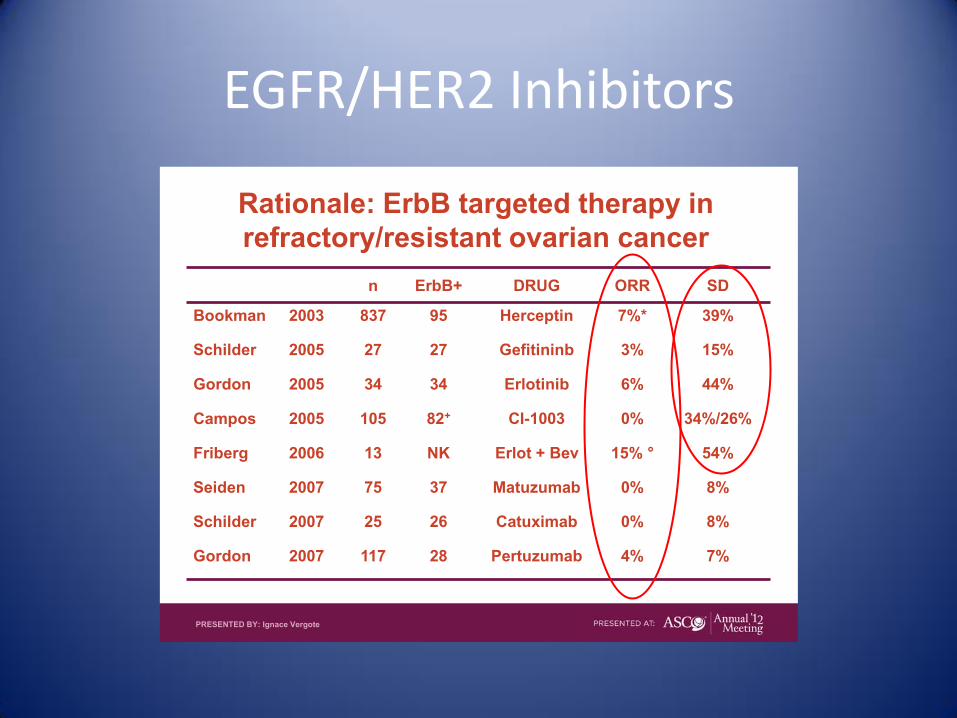
EGFR/HER2 Inhibitors
Rationale: ErbB targeted therapy in
refractory/resistant ovarian cancer
n ErbB+ DRUG ORR SD
Bookman 2003 837 95 Herceptin 7%* 39%
Schilder 2005 27 27 Gefitininb 3% 15%
Gordon 2005 34 34 Erlotinib 6% 44%
Campos 2005 105 82+ CI-1003 0% 34%/26%
Friberg 2006 13 NK Erlot + Bev 15% ° 54%
Seiden 2007 75 37 Matuzumab 0% 8%
Schilder 2007 25 26 Catuximab 0% 8%
Gordon 2007 117 28 Pertuzumab 4% 7%
PRESENTED BY: Ignace Vergote
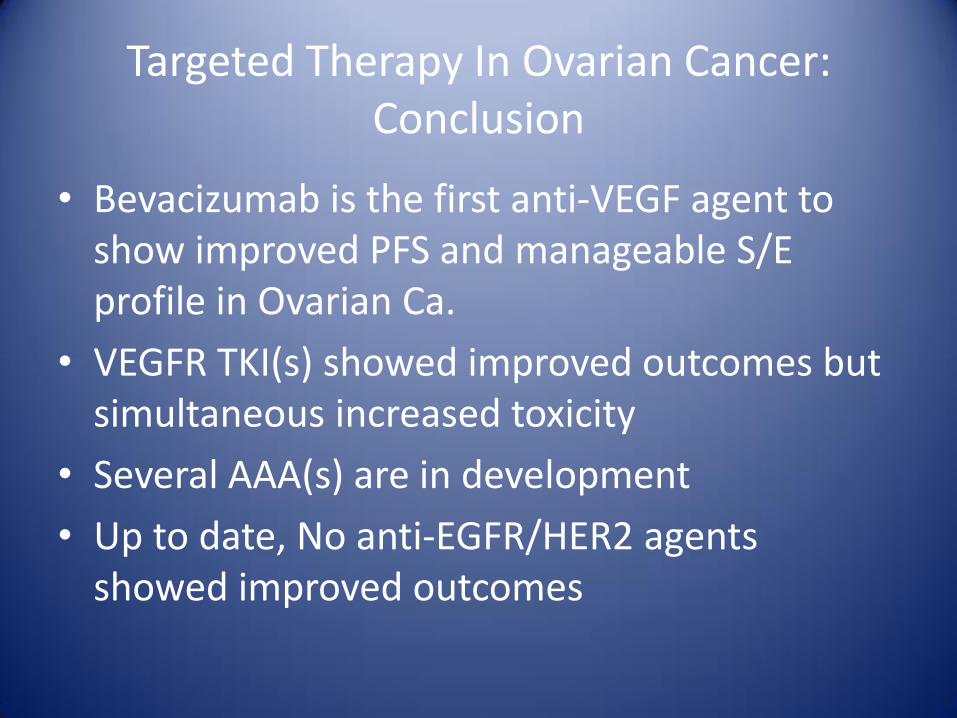
Targeted Therapy In Ovarian Cancer: Conclusion
• Bevacizumab is the first anti-VEGF agent to show improved PFS and manageable S/E profile in Ovarian Ca.
• VEGFR TKI(s) showed improved outcomes but simultaneous increased toxicity
• Several AAA(s) are in development
• Up to date, No anti-EGFR/HER2 agents showed improved outcomes
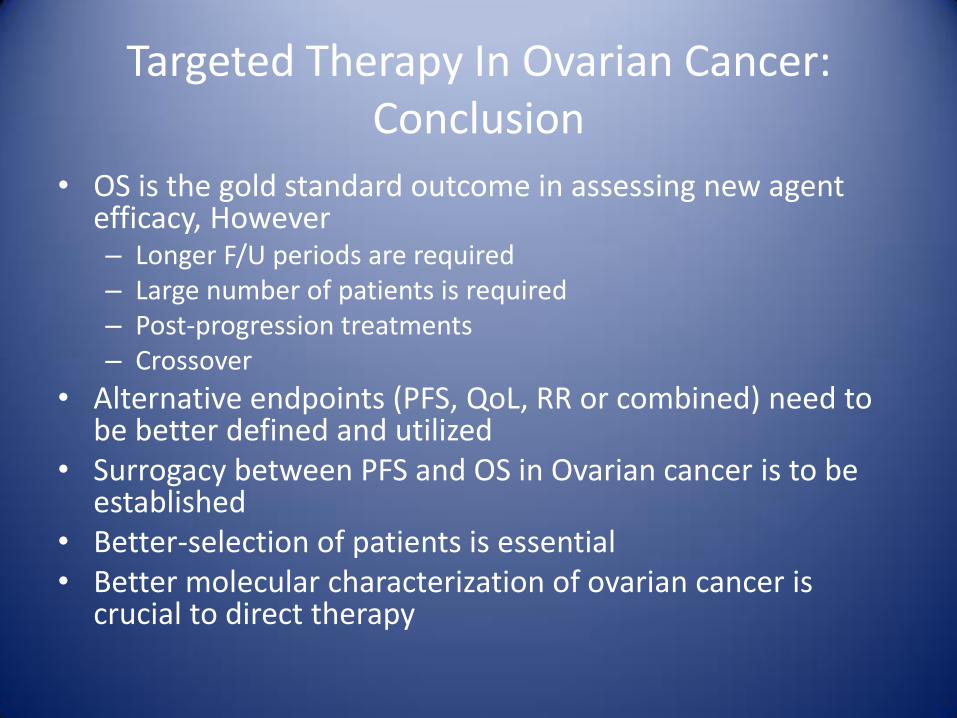
Targeted Therapy In Ovarian Cancer: Conclusion
• OS is the gold standard outcome in assessing new agent efficacy, However – Longer F/U periods are required – Large number of patients is required – Post-progression treatments – Crossover
• Alternative endpoints (PFS, QoL, RR or combined) need to be better defined and utilized
• Surrogacy between PFS and OS in Ovarian cancer is to be established
• Better-selection of patients is essential • Better molecular characterization of ovarian cancer is
crucial to direct therapy

“And mankind have not been given of knowledge except a little.”
قليل أوتيتم من العلم إلا وما { {