Training Program Performance Indicator Checklist Sorted by ...

SYSTEM & PROGRAM
INDICATOR REPORT
FY2018
4/1/18 – 6/30/18
Our Mission
To lead a coordinated, community effort to make sure
everyone has a place to call home.
We thank our Partner Agencies for their assistance in collecting data
and ensuring data accuracy for our community reports.

FEATURED PROGRAMS OF EXCELLENCE FY2018 Quarter 4: 4/1/18 – 6/30/18 Community Shelter Board is pleased to recognize and feature programs of excellence that demonstrated compelling results during the past quarter. We aim to acknowledge extraordinary leadership, collaborative practices, and high quality operations and services among partner agencies in their work to serve people facing homelessness every day. Our network includes partners delivering an array of services including homelessness prevention, shelter, rapid re-housing, street outreach, and supportive housing. Community Shelter Board sets specific outcomes for each partner agency, and performance is measured and reported in the accompanying report. We monitor data constantly to track how effectively the system is working to move people to stable housing. We partner with agencies both individually and as a system to continuously improve results. Along the way, we relish the opportunity to take a moment to recognize the tireless efforts by these partners delivering critical services to those facing homelessness.
ISAIAH PROJECT
Committed to lead a supportive housing leasing project that houses more than 200 people who have disabilities and histories of long-term homelessness
EMERGENCY HOUSING FOR VETERANS
Met every goal for numbers served, length of stay, and successful housing
outcomes

System and Program Indicator Report
TABLE OF CONTENTS
Overview ............................................................................................................................ 1
System Level Indicators
Family Emergency Shelter .......................................................................................... 2
Men’s Emergency Shelter ........................................................................................... 3
Women’s Emergency Shelter ..................................................................................... 4
Emergency Shelter (Family, Men’s, & Women’s) ...................................................... 5
Crisis Response for Single Adults ............................................................................... 6
Permanent Supportive Housing ................................................................................. 7
Rapid Re-housing ........................................................................................................ 8
Prevention .................................................................................................................... 9
Program Level Indicators
Single Adult Emergency Shelters ............................................................................. 10
CPOA, Outreach, and Family Shelters ...................................................................... 11
Permanent Supportive Housing ............................................................................... 12
Permanent Supportive Housing/Transitional Housing ........................................... 13
Rapid Re-housing, Prevention, and SSVF ................................................................ 14

Overview
1
Overview
System and Program Indicator Reports are published quarterly and furnished to CSB
trustees and the Continuum of Care. All reports are posted to www.csb.org. Results
are also shared with CSB funders consistent with funding contracts and agreements.
The System and Program Indicator Report monitors the current CSB funded programs
and some non-CSB funded programs that participate in our data system. The report
evaluates each system and program based on a system or program goal, actual
performance data, variances, and outcome achievements. Outcome achievement is
defined as 90% or better of numerical goal or within 5 percentage points of a
percentage goal, except where a lesser or greater value than this variance also
indicates an achieved goal. Systems or programs which meet less than one-half of
outcome goals are considered to be a “program of concern”. The following key is
used to express outcome achievement status for each indicator:
Outcome Achievement: Key
Outcome achieved √
Outcome not achieved ≠
Outcome goal not applicable N/A
All data generated from the Columbus ServicePoint (CSP) and used in the report met
CSB quality assurance standards, which require current and accurate data and a
95% completion rate for all required CSP data variables.
Data included in the report is analyzed per the Evaluation Definitions and
Methodology document that can be found at www.csb.org under the Publications
section.

System and Program Indicator Report
FY18 EMERGENCY
SHELTER
4/1/2018-6/30/2018Goal Actual
Outcome
Achievement Capacity1
Actual Goal Actual
Outcome
Achievement Goal (#) Actual
Outcome
Achievement Goal (%) Actual (%)
Outcome
Achievement
Family System 350 389 √ 114 128 20 42 ≠ 165 151 √ 70% 63% ≠
2 Starting 7/1/15, Successful Housing Outcomes include permanent exits to family.
3 Due to rounding percentage does not add up to 100%.
Households Served
Nightly
Occupancy
Average Length of Stay
(Days) Successful Housing Outcomes2
1 Overflow capacity is not included.
14 percent more households needed shelter compared to the same reporting period of last fiscal year. The success rate at exit from shelters remained the same. However, the
length of time homeless significantly increased, causing the nightly occupancy to exceed planned capacity. The employment rate at entry increased from 27% in FY17 to 31%
currently, coupled with an increase in average income. The percent of newly homeless was calculated using homelessness experience from the past two years. An additional 126
families stayed in the Overnight shelter program only, waiting for a face-to-face shelter eligibility assessment with Gladden Community House. These families were subsequently
either diverted from shelter by Gladden or self-exited.
295 310 275 289 291
334
406
497
398 367
342
389
0
100
200
300
400
500
600
FY07 FY08 FY09 FY10 FY11 FY12 FY13 FY14 FY15 FY16 FY17 FY18
Q4 Household Served (#)
64% 66%
60%
73% 70% 72%
65%
46%
59%
68% 63% 63%
0%
20%
40%
60%
80%
FY07 FY08 FY09 FY10 FY11 FY12 FY13 FY14 FY15 FY16 FY17 FY18
Q4 Successful Housing Outcomes (%)2
SHO SHO + Permanent Exit to Family
35 36
55 51
43
17 17 21
22 27
35
42
0
10
20
30
40
50
60
70
FY07 FY08 FY09 FY10 FY11 FY12 FY13 FY14 FY15 FY16 FY17 FY18
Q4 Average Length of Stay (Days)
113 121
101 103 98
55 65
98
86 94
110
128
0
25
50
75
100
125
150
FY07 FY08 FY09 FY10 FY11 FY12 FY13 FY14 FY15 FY16 FY17 FY18
Q4 Average Nightly Occupancy (#)
DEMOGRAPHICS Family
Households Served 389
Percent Newly homeless 66%
Clients Served 1,418
Average Age (HoH) 33
Gender - Male (HoH) 7%
Gender - Female (HoH) 93%
Veterans (U.S. Military) served 5
Veterans % of all adults 1%
Average Monthly Household Income $642
Percent Working at Entry 31%
Race - White (HoH)3 28%
Race - Black (HoH)3 69%
Race- Other (HoH)3 2%
Hispanic (HoH) 4%
Non-Hispanic (HoH) 96%
Adults Served 558
Children Served 860
Mean Family Size 3.6
Average Number of Children 2.2
Adults 18-24 years (HoH) 15%
Children 0 - 2 years 23%
Children 3 - 7 years 35%
Children 8 - 12 years 30%
Children 13 - 17 years 12%
Pregnant Women Served 53
Franklin County Residents 89%
2 System Level: Family Emergency Shelter

System and Program Indicator Report
FY18 EMERGENCY
SHELTER
Sys
tem
of
4/1/2018-6/30/2018Goal Actual
Outcome
Achievement Capacity1
Actual Goal Actual
Outcome
Achievement Goal (#) Actual (#)
Outcome
Achievement Goal (%) Actual (%)
Outcome
Achievement
Yes
or No
Men's System 1,500 1,368 √ 431 436 30 43 ≠ 353 244 ≠ 33% 25% ≠ Yes
1 Seasonal Overflow capacity is not included. Overflow opened 10/15/17 and remained open through 4/15/18.
2 Starting 7/1/15, Successful Housing Outcomes include permanent exits to family.
3 Due to rounding percentage does not add up to 100%.
Successful Housing Outcomes2Households Served
Nightly
Occupancy
Average Length of Stay
(Days)
The system experienced a 1% decrease in the number of individuals sheltered when compared to the same reporting period of last fiscal year. Both the success rate
at exit and the average length of time homeless increased compared to last fiscal year. The rapid re-housing program is only serving individuals with high needs and
barriers, which makes outcome achievement challenging. The employment rate at entry increased from 24% in FY17 to 28% currently, coupled with an increase in
average income. The percent of newly homeless was calculated using homelessness experience from the past two years.
1,406 1,509
1,367 1,410 1,425
1,514 1,555 1,509
1,351
1,596
1,383 1,368
0
500
1,000
1,500
2,000
FY07 FY08 FY09 FY10 FY11 FY12 FY13 FY14 FY15 FY16 FY17 FY18
Q4 Households Served (#)
20% 22% 22%
19%
26%
22%
28% 27%
21% 22%
18%
25%
0%
10%
20%
30%
40%
FY07 FY08 FY09 FY10 FY11 FY12 FY13 FY14 FY15 FY16 FY17 FY18
Q4 Successful Housing Outcomes (%)2
SHO SHO + Permanent Exit to Family
27 24
41 41 39
33 35 36
52
36 38
43
0
10
20
30
40
50
60
FY07 FY08 FY09 FY10 FY11 FY12 FY13 FY14 FY15 FY16 FY17 FY18
Q4 Average Length of Stay (Days)
415 404 402 416 427 442 450 448 463 426 421 436
0
100
200
300
400
500
600
FY07 FY08 FY09 FY10 FY11 FY12 FY13 FY14 FY15 FY16 FY17 FY18
Q4 Average Nightly Occupancy (#)
DEMOGRAPHICS Men
Households Served 1,368
Percent Newly homeless 46%
Average Age 45
Men as a percent of total single
adults served69%
Veterans (U.S. Military) served 176
Veterans % of all adults 13%
Average Monthly Household Income $584
Percent Working at Entry 28%
Average Daily Waitlist Number 82
Race - White 32%
Race - Black 66%
Race- Other 2%
Hispanic 3%
Non-Hispanic 97%
Adults 18 - 24 years 6%
Adults 25 - 34 years 19%
Adults 35 - 44 years 21%
Adults 45 - 55 years 31%
Adults 56 - 61 years 16%
Adults 62+ years 7%
Franklin County Residents 86%
3 System Level: Men's Emergency Shelter
System and Program Indicator Report
FY18 EMERGENCY
SHELTER
System
of
Concern
4/1/2018-6/30/2018Goal Actual
Outcome
Achievement Capacity1
Actual Goal Actual
Outcome
Achievement Goal (#) Actual (#)
Outcome
Achievement Goal (%) Actual (%)
Outcome
Achievement Yes or No
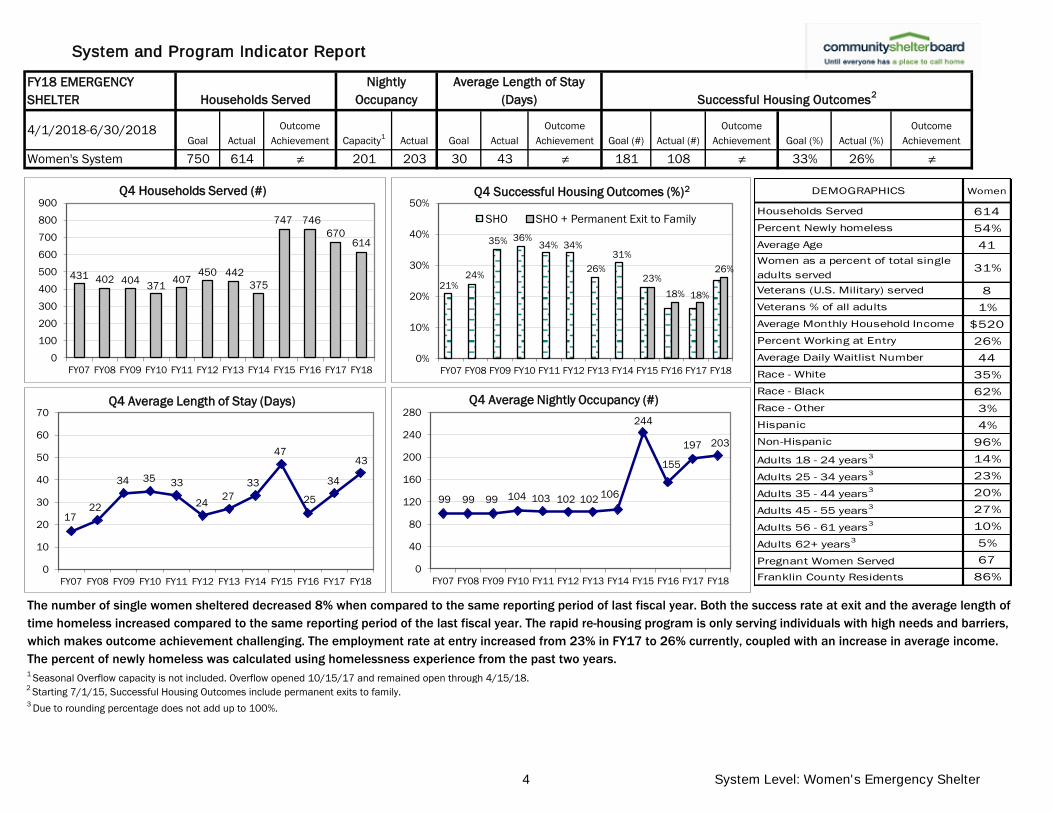
Women's System 750 614 ≠ 201 203 30 43 ≠ 181 108 ≠ 33% 26% ≠ No
3 Due to rounding percentage does not add up to 100%.
Successful Housing Outcomes2
Households Served
Nightly
Occupancy
Average Length of Stay
(Days)
1 Seasonal Overflow capacity is not included. Overflow opened 10/15/17 and remained open through 4/15/18.
2 Starting 7/1/15, Successful Housing Outcomes include permanent exits to family.
The number of single women sheltered decreased 8% when compared to the same reporting period of last fiscal year. Both the success rate at exit and the average length of
time homeless increased compared to the same reporting period of the last fiscal year. The rapid re-housing program is only serving individuals with high needs and barriers,
which makes outcome achievement challenging. The employment rate at entry increased from 23% in FY17 to 26% currently, coupled with an increase in average income.
The percent of newly homeless was calculated using homelessness experience from the past two years.
431 402 404 371
407 450 442
375
747 746
670 614
0
100
200
300
400
500
600
700
800
900
FY07 FY08 FY09 FY10 FY11 FY12 FY13 FY14 FY15 FY16 FY17 FY18
Q4 Households Served (#)
21% 24%
35% 36% 34% 34%
26%
31%
23%
18% 18%
26%
0%
10%
20%
30%
40%
50%
FY07 FY08 FY09 FY10 FY11 FY12 FY13 FY14 FY15 FY16 FY17 FY18
Q4 Successful Housing Outcomes (%)2
SHO SHO + Permanent Exit to Family
17 22
34 35 33
24 27
33
47
25
34
43
0
10
20
30
40
50
60
70
FY07 FY08 FY09 FY10 FY11 FY12 FY13 FY14 FY15 FY16 FY17 FY18
Q4 Average Length of Stay (Days)
99 99 99 104 103 102 102 106
244
155
197 203
0
40
80
120
160
200
240
280
FY07 FY08 FY09 FY10 FY11 FY12 FY13 FY14 FY15 FY16 FY17 FY18
Q4 Average Nightly Occupancy (#)
DEMOGRAPHICS Women
Households Served 614
Percent Newly homeless 54%
Average Age 41
Women as a percent of total single
adults served31%
Veterans (U.S. Military) served 8
Veterans % of all adults 1%
Average Monthly Household Income $520
Percent Working at Entry 26%
Average Daily Waitlist Number 44
Race - White 35%
Race - Black 62%
Race - Other 3%
Hispanic 4%
Non-Hispanic 96%
Adults 18 - 24 years3 14%
Adults 25 - 34 years3 23%
Adults 35 - 44 years3 20%
Adults 45 - 55 years3 27%
Adults 56 - 61 years3 10%
Adults 62+ years3 5%
Pregnant Women Served 67
Franklin County Residents 86%
4 System Level: Women's Emergency Shelter

System and Program Indicator Report
FY18 EMERGENCY SHELTER
Syste
m of
Conce
4/1/2018-6/30/2018Goal Actual
Outcome
Achievement Capacity2
Actual Goal Actual
Outcome
Achievement Goal (#) Actual (#)
Outcome
Achievement Goal (%) Actual (%)
Outcome
Achievement
Yes or
No
Emergency Shelter System1 2,600 2,362 √ 746 766 30 43 ≠ 686 501 ≠ 37% 31% ≠ No
2 Seasonal overflow capacity is not included. Overflow opened 10/15/17 and remained open through 4/15/18.
Households Served
Nightly
Occupancy Average Length of Stay (Days) Successful Housing Outcomes3
The system sheltered nearly the same amount of households when compared to the same reporting period of last fiscal year. The successful housing outcomes percent
significantly increased compared to the prior reporting period. The average length of time homeless increased across all systems, as well as the system occupancy. The
employment rate and income increased across all systems. 52% of sheltered households did not experience homelessness within the past two years.
1 System includes single adult and family shelters. Excludes Huckleberry House Emergency Shelter and YMCA Family Overnight; total distinct households served including the youth shelter and overnight program is 2,613.
3 Starting 7/1/15, Successful Housing Outcomes include permanent exits to family.
2126 2209
2010 2062 2151
2,295 2,400
2,368 2,487
2,638
2,378 2,362
0
500
1000
1500
2000
2500
3000
FY07 FY08 FY09 FY10 FY11 FY12 FY13 FY14 FY15 FY16 FY17 FY18
Q4 Households Served (#)
25% 27%
29% 28%
33% 32% 34%
32%
28% 28%
24%
31%
0%
10%
20%
30%
40%
50%
FY07 FY08 FY09 FY10 FY11 FY12 FY13 FY14 FY15 FY16 FY17 FY18
Q4 Successful Housing Outcomes (%)3
SHO SHO + Permanent Exit to Family
42 38
42 42 39
29 30 32
46
33
37 43
0
10
20
30
40
50
60
FY07 FY08 FY09 FY10 FY11 FY12 FY13 FY14 FY15 FY16 FY17 FY18
Q4 Average Length of Stay (Days)
626 626 602
621 642 599 617 652
793
675 727 766
0
200
400
600
800
1000
FY07 FY08 FY09 FY10 FY11 FY12 FY13 FY14 FY15 FY16 FY17 FY18
Q4 Average Nightly Occupancy (#)
DEMOGRAPHICSFamily &
Adults
Households Served 2,362
Percent Newly homeless 52%
Clients Served 3,390
Adults Served 2,530
Children Served 860
Average Age (HoH) 42
Gender - Male (HoH) 59%
Gender - Female (HoH) 41%
Veterans (U.S. Military) served 188
Veterans % of all adults 7%
Average Monthly Household Income $575
Percent Working at Entry 28%
Average Daily Waitlist Number 126
Race - White (HoH) 32%
Race - Black (HoH) 66%
Race - Other (HoH) 2%
Hispanic (HoH) 3%
Non-Hispanic (HoH) 97%
Adults 18-24 years (HoH) 10%
Pregnant Women Served 119
Franklin County Residents 86%
5 System Level: Emergency Shelter
System and Program Indicator Report
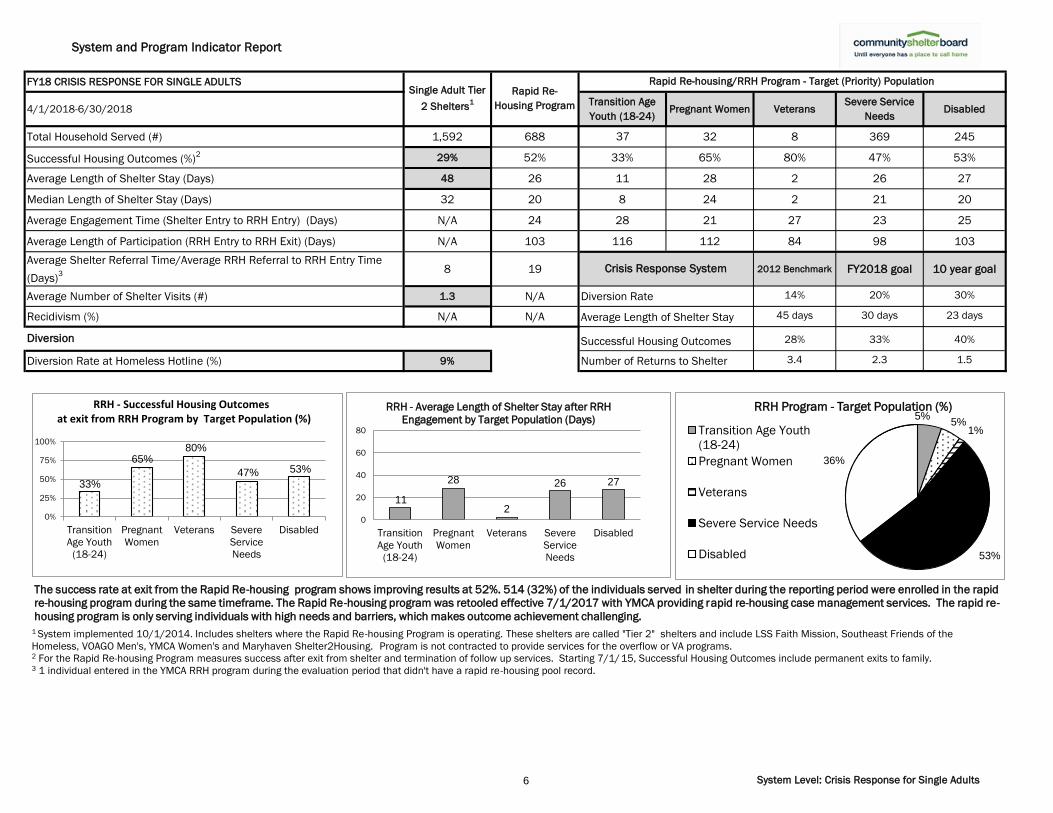
FY18 CRISIS RESPONSE FOR SINGLE ADULTS
4/1/2018-6/30/2018Transition Age
Youth (18-24)Pregnant Women Veterans
Severe Service
NeedsDisabled
Total Household Served (#) 1,592 688 37 32 8 369 245
Successful Housing Outcomes (%)2 29% 52% 33% 65% 80% 47% 53%
Average Length of Shelter Stay (Days) 48 26 11 28 2 26 27
Median Length of Shelter Stay (Days) 32 20 8 24 2 21 20
Average Engagement Time (Shelter Entry to RRH Entry) (Days) N/A 24 28 21 27 23 25
Average Length of Participation (RRH Entry to RRH Exit) (Days) N/A 103 116 112 84 98 103
Average Shelter Referral Time/Average RRH Referral to RRH Entry Time
(Days)3 8 19 2012 Benchmark FY2018 goal 10 year goal
Average Number of Shelter Visits (#) 1.3 N/A 14% 20% 30%
Recidivism (%) N/A N/A Average Length of Shelter Stay 45 days 30 days 23 days
28% 33% 40%
Diversion Rate at Homeless Hotline (%) 9% 3.4 2.3 1.5
Single Adult Tier
2 Shelters1
Rapid Re-
Housing Program
Rapid Re-housing/RRH Program - Target (Priority) Population
Crisis Response System
Diversion Successful Housing Outcomes
Number of Returns to Shelter
Diversion Rate
5% 5%
1%
53%
36%
RRH Program - Target Population (%)
Transition Age Youth
(18-24)
Pregnant Women
Veterans
Severe Service Needs
Disabled
33%
65% 80%
47% 53%
0%
25%
50%
75%
100%
Transition
Age Youth
(18-24)
Pregnant
Women
Veterans Severe
Service
Needs
Disabled
11
28
2
26 27
0
20
40
60
80
Transition
Age Youth
(18-24)
Pregnant
Women
Veterans Severe
Service
Needs
Disabled
RRH - Average Length of Shelter Stay after RRH
Engagement by Target Population (Days)
1 System implemented 10/1/2014. Includes shelters where the Rapid Re-housing Program is operating. These shelters are called "Tier 2" shelters and include LSS Faith Mission, Southeast Friends of the
Homeless, VOAGO Men's, YMCA Women's and Maryhaven Shelter2Housing. Program is not contracted to provide services for the overflow or VA programs. 2 For the Rapid Re-housing Program measures success after exit from shelter and termination of follow up services. Starting 7/1/15, Successful Housing Outcomes include permanent exits to family. 3 1 individual entered in the YMCA RRH program during the evaluation period that didn't have a rapid re-housing pool record. 4 Differences in averages relates to different population sizes used to calculate the measure.
The success rate at exit from the Rapid Re-housing program shows improving results at 52%. 514 (32%) of the individuals served in shelter during the reporting period were enrolled in the rapid
re-housing program during the same timeframe. The Rapid Re-housing program was retooled effective 7/1/2017 with YMCA providing rapid re-housing case management services. The rapid re-
housing program is only serving individuals with high needs and barriers, which makes outcome achievement challenging.
RRH - Successful Housing Outcomes at exit from RRH Program by Target Population (%)
6 System Level: Crisis Response for Single Adults
System and Program Indicator Report
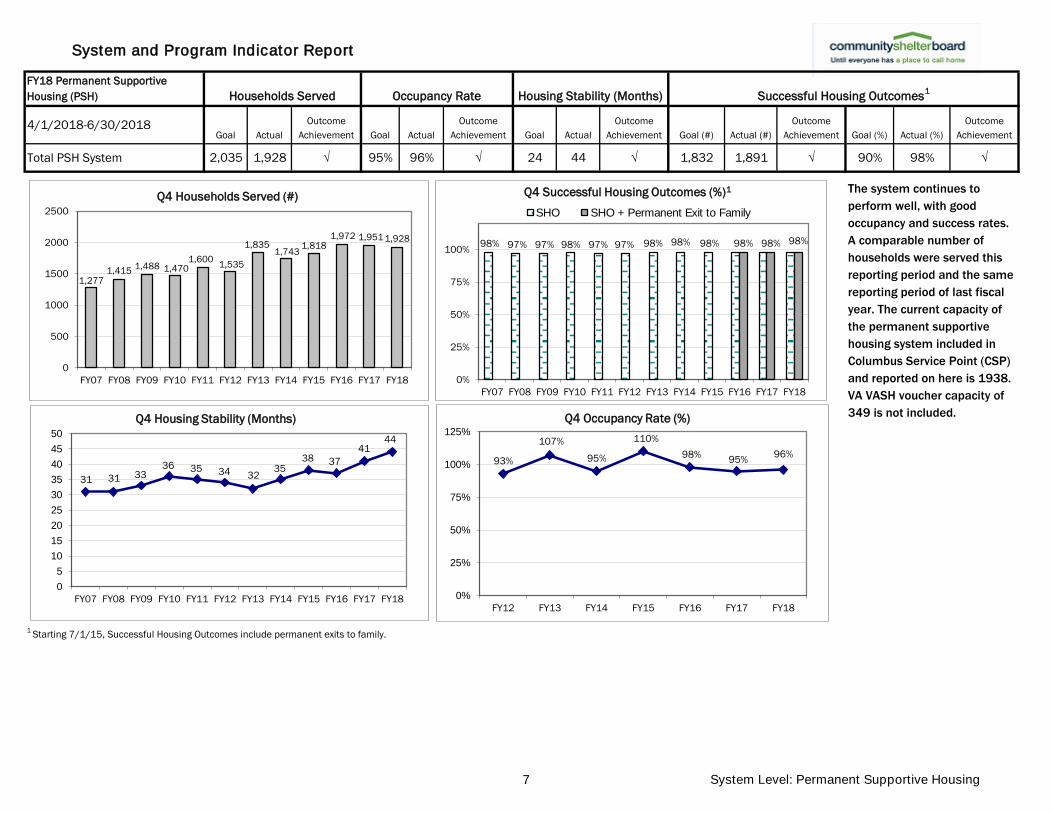
FY18 Permanent Supportive
Housing (PSH)
4/1/2018-6/30/2018Goal Actual
Outcome
Achievement Goal Actual
Outcome
Achievement Goal Actual
Outcome
Achievement Goal (#) Actual (#)
Outcome
Achievement Goal (%) Actual (%)
Outcome
Achievement
Total PSH System 2,035 1,928 √ 95% 96% √ 24 44 √ 1,832 1,891 √ 90% 98% √
1 Starting 7/1/15, Successful Housing Outcomes include permanent exits to family.
Successful Housing Outcomes1
Households Served Occupancy Rate Housing Stability (Months)
The system continues to
perform well, with good
occupancy and success rates.
A comparable number of
households were served this
reporting period and the same
reporting period of last fiscal
year. The current capacity of
the permanent supportive
housing system included in
Columbus Service Point (CSP)
and reported on here is 1938.
VA VASH voucher capacity of
349 is not included.
1,277 1,415
1,488 1,470 1,600
1,535
1,835 1,743
1,818 1,972 1,951 1,928
0
500
1000
1500
2000
2500
FY07 FY08 FY09 FY10 FY11 FY12 FY13 FY14 FY15 FY16 FY17 FY18
Q4 Households Served (#)
98% 97% 97% 98% 97% 97% 98% 98% 98% 98% 98% 98%
0%
25%
50%
75%
100%
FY07 FY08 FY09 FY10 FY11 FY12 FY13 FY14 FY15 FY16 FY17 FY18
Q4 Successful Housing Outcomes (%)1
SHO SHO + Permanent Exit to Family
31 31 33 36 35 34 32
35 38 37
41 44
0
5
10
15
20
25
30
35
40
45
50
FY07 FY08 FY09 FY10 FY11 FY12 FY13 FY14 FY15 FY16 FY17 FY18
Q4 Housing Stability (Months)
93%
107%
95%
110%
98% 95%
96%
0%
25%
50%
75%
100%
125%
FY12 FY13 FY14 FY15 FY16 FY17 FY18
Q4 Occupancy Rate (%)
7 System Level: Permanent Supportive Housing

System and Program Indicator Report
FY18 Rapid Re-housing
4/1/2018-6/30/2018Goal Actual
Outcome
Achievement Goal Actual
Outcome
Achievement Goal Actual
Outcome
Achievement Goal (#) Actual (#)
Outcome
Achievement Goal (%) Actual (%)
Outcome
Achievement
Rapid Re-housing System1 723 547 ≠ 1,455 1,112 ≠ 100 113 ≠ 362 303 ≠ 50% 65% √
3 Starting 7/1/15, Successful Housing Outcomes include permanent exits to family.
2 Data refers to families served.
New Households Served Households Served
Average Length of
Participation (Days) Successful Housing Outcomes3
The system served 177% more households than the same reporting period of last fiscal year, as the YMCA Rapid Re-housing project was added to the system. The number of households
served by the YMCA Rapid Re-housing project is below the projected goal, which impacts the performance of the entire system.1
System includes HFF Rapid Re-housing, VOAGO Rapid Re-housing, TSA Rapid Re-housing, TSA J2H, YMCA Rapid Re-housing, LSS SSVF, VOAGO SSVF programs. Excludes CSB Transition.
235
129 132 174
195 194 198
547
0
100
200
300
400
500
600
700
FY11 FY12 FY13 FY14 FY15 FY16 FY17 FY18
Q4 New Households Served (#)
91% 92% 94%
84% 82% 85% 85%
65%
0%
25%
50%
75%
100%
FY11 FY12 FY13 FY14 FY15 FY16 FY17 FY18
Q4 Successful Housing Outcomes (%)3
SHO SHO + Permanent Exit to Family
379 362 289
430 435 485
402
1,112
0
200
400
600
800
1000
1200
FY11 FY12 FY13 FY14 FY15 FY16 FY17 FY18
Q4 Households Served (#)
113 122
113 110 100
128
108 113
0
25
50
75
100
125
150
FY11 FY12 FY13 FY14 FY15 FY16 FY17 FY18
Q4 Average Length of Participation (Days)
DEMOGRAPHICS
Family &
Adults
Households Served 1,112
Clients Served 1,803
Average Age (HoH) 42
Gender - Male (HoH) 57%
Gender - Female (HoH) 43%
Veterans (U.S. Military) served 176
Veterans % of all adults 14%
Average Monthly Household
Income$534
Percent Working at Entry 27%
Adults Served 1,216
Children Served 587
Race - White (HoH) 34%
Race - Black (HoH) 64%
Race- Other (HoH) 2%
Hispanic (HoH) 3%
Non-Hispanic (HoH) 97%
Mean Family Size2 3.6
Average Number of Children2 2.2
Children 0 - 2 years2 26%
Children 3 - 7 years2 36%
Children 8 - 12 years2
26%
Children 13 - 17 years2 12%
Pregnant Women Served 91
8 System Level: Rapid Re-housing

System and Program Indicator Report
FY18 Prevention
4/1/2018-6/30/2018Goal Actual
Outcome
Achievement Goal Actual
Outcome
Achievement Goal Actual
Outcome
Achievement Goal (#)
Actual
(#)
Outcome
Achievement Goal (%)
Actual
(%)
Outcome
Achievement
Prevention System1
76 136 √ 261 265 √ 160 112 √ 90 133 √ 90% 82% ≠
3 Starting 7/1/15, Successful Housing Outcomes include permanent exits to family.
2 Data refers to the families served.
1 System includes Gladden Community House Stable Families and additional prevention programs, LSS REEB Stable Families, LSS SSVF, and VOAGO SSVF programs.
Households Served New Households Served
Average Length of Participation
(Days) Successful Housing Outcomes3
88% more households were served than the same reporting period of last fiscal year. The success rate at program exit is slightly below expectations. 64% of households remained
stable in their own housing at program exit and 18% decided to permanently move in with family, an unusually high rate for family move-ins. Income and percent working at entry
decreased compared to FY17 numbers ($1,078 and 81% respectively) showing better targeting and prioritization of households at greater risk of homelessness.
153 161
129 129
68 62
136
0
50
100
150
200
FY12 FY13 FY14 FY15 FY16 FY17 FY18
Q4 New Households Served (#)
99% 94% 92%
76%
87% 85% 82%
0%
25%
50%
75%
100%
FY12 FY13 FY14 FY15 FY16 FY17 FY18
Q4 Successful Housing Outcomes (%)3
SHO SHO + Permanent Exit to Family
58
79 80
94
130
113 112
0
25
50
75
100
125
150
FY12 FY13 FY14 FY15 FY16 FY17 FY18
Q4 Average Length of Participation (Days)
254 217
374
245
190
141
265
0
100
200
300
400
500
FY12 FY13 FY14 FY15 FY16 FY17 FY18
Q4 Households Served (#)
DEMOGRAPHICS
Family &
Adults
Households Served 265
Clients Served 941
Average Age (HoH) 33
Gender - Male (HoH) 11%
Gender - Female (HoH) 89%
Veterans (U.S. Military) served 20
Veterans % of all adults 6%
Average Monthly Household Income $817
Percent Working at Entry 50%
Race - White (HoH) 20%
Race - Black (HoH) 78%
Race - Other (HoH) 2%
Hispanic (HoH) 4%
Non-Hispanic (HoH) 96%
Adults Served 339
Children Served 602
Mean Family Size2 3.6
Average Number of Children2 2.4
Children 0 - 2 years2 25%
Children 3 - 7 years2 33%
Children 8 - 12 years2 25%
Children 13 - 17 years2 17%
Pregnant Women Served 24
9 System Level: Prevention

System and Program Indicator Report
EMERGENCY SHELTER - Single Adult Programs5
Movement
4/1/2018-6/30/2018
Go
al
(#)
Actu
al
(#)
Va
ria
nce
Ou
tco
me
Ach
ieve
me
nt
Ca
pa
cit
y 1
Actu
al
Ou
tco
me
Ach
ieve
me
nt
(95
%)
Go
al
Actu
al
Ou
tco
me
Ach
ieve
me
nt
Go
al
(#)
Actu
al
(#)
Ou
tco
me
Ach
ieve
me
nt
Go
al
(%)
Actu
al
(%)
Ou
tco
me
Ach
ieve
me
nt
Actu
al
(%)
Go
al
15
%
MEN
LSS - Faith Mission - Men's on Grant2 N/A 273 N/A N/A 89 92 N/A 30 48 N/A N/A 55 N/A 33% 29% N/A 13%
LSS - Faith Mission on 8th2 N/A 280 N/A N/A 95 93 N/A 30 46 N/A N/A 54 N/A 33% 29% N/A 9%
Friends of the Homeless - Men's Shelter5 489 415 (74) ≠ 130 128 √ 30 43 ≠ 118 64 ≠ 33% 22% ≠ 10%
VOAGO - Men's Shelter5 188 157 (31) ≠ 40 39 √ 30 32 √ 49 34 ≠ 33% 29% √ 6%
YMCA - Men's Overflow6 100 238 138 √ 40 40 √ 30 3 √ N/A 0 N/A N/A 0% N/A N/A
WOMEN
LSS - Faith Mission - Nancy's Place2 N/A 117 N/A N/A 38 39 N/A 30 44 N/A N/A 21 N/A 33% 26% N/A 5%
YMCA - Van Buren Women's Shelter5 350 398 48 √ 139 137 √ 30 46 ≠ 70 71 √ 33% 27% ≠ 9%
YMCA - Van Buren Pregnant Women's Shelter5 52 57 5 √ 12 12 √ 37 23 √ 13 7 ≠ 33% 17% ≠ 10%
YMCA - Women's Overflow6 50 77 27 √ 7 7 √ 30 2 √ N/A 0 N/A N/A 0% N/A N/A
INEBRIATE
Maryhaven - Engagement Center Safety 275 257 (18) √ 32 34 √ 12 13 √ 73 51 ≠ 30% 23% ≠ N/A
Maryhaven - Engagement Center Shelter2Housing5
45 48 3 √ 18 17 √ 30 45 ≠ 9 11 √ 33% 32% √ 3%
YOUTH .
Huckleberry House - Emergency Shelter 80 130 50 √ 16 9 ≠ 10 8 √ 59 86 √ 80% 73% ≠ 1%
VA EMERGENCY HOUSING
VOAGO - VA Emergency Housing 35 38 3 √ 15 14 √ 70 49 √ 11 14 √ 50% 56% √ 12%
LSS - VA Men & Women 50 65 15 √ 24 21 ≠ 70 41 √ 13 21 √ 50% 47% √ 13%
AGENCY
Lutheran Social Services - Faith Mission2,5
837 646 (191) ≠ 222 224 √ 30 48 ≠ 203 128 ≠ 33% 30% √ 10%
1 Capacity does not include overflow, with the exception of dedicated overflow programs. Overflow opened 10/15/17 and remained open through 4/15/18.
3 Successful outcomes measure for Maryhaven Engagement Center Safety.
4 Exit to family (permanent tenure) is a successful housing outcome for all starting 7/1/2015.
6 Men's and women's seasonal overflow was opened 11/08-11/11/17 and remained open from 11/13/17-4/17/18. Capacity is actual average nightly number served.
5 Starting 7/1/2017 housing services are provided by the YMCA Rapid Re-housing project. Some of the measures for emergency shelters are shared with the rapid re-housing program.
2 Lutheran Social Services is evaluated at the agency level rather than at the individual program level. Inclusive programs are Faith Mission Men's on Grant, Faith Mission on 8th, and Nancy's Place.
Average Length of
Stay (Days) Households Served Nightly Occupancy Successful Housing Outcomes3, 4
10 Program Level: Emergency Shelters - Single Adult Programs

System and Program Indicator Report
HOMELESS HOTLINE
4/1/2018-6/30/2018
Go
al (#
)
Actu
al (#
)
Ou
tco
me
Ach
ieve
me
nt
Go
al (%
)
Actu
al (%
)
Ou
tco
me
Ach
ieve
me
nt
Go
al (#
)
Actu
al (#
)
Ou
tco
me
Ach
ieve
me
nt
Go
al (%
)
Actu
al (%
)
Ou
tco
me
Ach
ieve
me
nt
HandsOn Central Ohio - Homeless Hotline (Single Adults) 2,600 3,073 √ 95% 98% √ 650 367 ≠ 25% 9% ≠
HandsOn Central Ohio - Homeless Hotline (Families) 1,100 775 ≠ 95% 100% √ 330 132 ≠ 30% 15% ≠
Gladden Community House - Family Diversion5 425 320 √ 95% 99% √ 128 73 ≠ 30% 29% √
OUTREACH
4/1/2018-6/30/2018
Go
al (#
)
Actu
al (#
)
Ou
tco
me
Ach
ieve
me
nt
Go
al (#
)
Actu
al (#
)
Ou
tco
me
Ach
ieve
me
nt
Go
al (#
)
Actu
al (#
)
Ou
tco
me
Ach
ieve
me
nt
Go
al (%
)
Actu
al (%
)
Ou
tco
me
Ach
ieve
me
nt
Go
al (#
)
Actu
al (#
)
Ou
tco
me
Ach
ieve
me
nt
Go
al (%
)
Actu
al (%
)
Ou
tco
me
Ach
ieve
me
nt
Go
al (%
)
Actu
al (%
)
Ou
tco
me
Ach
ieve
me
nt
Maryhaven - Capital Crossroad SID Outreach 25 28 √ 45 33 ≠ 19 23 √ 75% 100% √ 10 18 √ 55% 78% √ N/A 29% N/A
Maryhaven - Outreach 70 72 √ 130 159 √ 53 35 ≠ 75% 76% √ 29 21 ≠ 55% 60% √ 25% 31% √
Southeast - PATH Outreach3 70 33 ≠ 140 51 ≠ 35 0 ≠ 50% 0% ≠ N/A 0 N/A N/A 0% N/A N/A N/A N/A
EMERGENCY SHELTER - Families
4/1/2018-6/30/2018
Go
al (#
)
Actu
al (#
)
Ou
tco
me
Ach
ieve
me
nt
Ca
pa
cit
y 1
Actu
al
Ou
tco
me
Ach
ieve
me
nt
Go
al
Actu
al
Ou
tco
me
Ach
ieve
me
nt
Go
al (#
)
Actu
al (#
)
Ou
tco
me
Ach
ieve
me
nt
Go
al (%
)
Actu
al (%
)
Ou
tco
me
Ach
ieve
me
nt
Go
al
Actu
al
Ou
tco
me
Ach
ieve
me
nt
YWCA - Family Center 225 155 √5 50 51 √ 20 41 ≠ 123 64 ≠ 70% 62% ≠ 7 11 ≠
YMCA - Van Buren Family Shelter 240 247 √ 64 76 √ 20 41 ≠ 123 89 ≠ 70% 59% ≠ 7 16 ≠
1 Capacity does not include overflow.
2 Households that exited successfully without accessing DCA are excluded from calculation.
3 The goal of PATH Outreach is to outreach to homeless individuals for the purpose of linking them to ongoing mental health and other treatment.
4 Starting 7/1/15, Successful Housing Outcomes include permanent exits to family.
5 Program served all households in need of shelter. Outcomes re-calculated based on actual households served.
Actu
al (%
) G
oa
l 1
5%
4%
12%
Usage of CSB DCA
(%)2
Total Households
Served Shelter Linkage Successful Diversion Outcomes
No
Program of
Concern
Ye
s o
r N
o
Households Served
New Households
Served
Total Households
Served Successful Outcomes
Nightly Occupancy Successful Housing Outcomes4
Average Length of
Stay (Days)
Successful Housing Outcomes4
Movement
Average
Engagement Time
(Days)
11 Program Level: Homeless Hotline/Outreach/YWCA

System and Program Indicator Report
4/1/2018-6/30/2018
Ca
pa
cit
y
Go
al
(#)
Actu
al
(#)
Va
ria
nce
Ou
tco
me
Ach
ieve
me
nt
Actu
al
(#)
Actu
al
(%)
Att
ain
me
nt
of
Go
al
(95
%)
Go
al
(# o
f m
on
ths)
Actu
al
(# o
f m
on
ths)
Att
ain
me
nt
of
Go
al
Go
al
(#)
Actu
al
(#)
Ou
tco
me
Ach
ieve
me
nt
Go
al
(%)
Actu
al
(%)
Ou
tco
me
Ach
ieve
me
nt
Community Housing Network - Briggsdale 25 26 25 (1) √ 25 100% √ 24 53 √ 23 25 √ 90% 100% √
Community Housing Network - Cassady2 10 11 11 0 √ 11 110% √ 24 42 √ 10 11 √ 90% 100% √
Community Housing Network - Community ACT 42 44 42 (2) √ 42 100% √ 24 62 √ 40 42 √ 90% 100% √
Community Housing Network - East 5th Avenue 38 40 41 1 √ 35 92% √ 24 34 √ 36 41 √ 90% 100% √
Community Housing Network - Inglewood Court 45 47 46 (1) √ 44 98% √ 24 39 √ 42 46 √ 90% 100% √
Community Housing Network - Leasing Supportive Housing 25 26 26 0 √ 23 92% √ 24 53 √ 23 24 √ 90% 96% √
Community Housing Network - Leasing Supportive Housing II3 222 233 213 (20) N/A 204 92% N/A 21 25 N/A 210 210 N/A 90% 100% N/A
Community Housing Network - North 22nd Street 30 32 31 (1) √ 30 100% √ 24 37 √ 29 30 √ 90% 97% √
Community Housing Network - Parsons 25 26 26 0 √ 25 100% √ 24 22 √ 23 26 √ 90% 100% √
Community Housing Network - RLPTI6 80 84 73 (11) ≠ 69 86% ≠ 24 67 √ 76 73 √ 90% 100% √
Community Housing Network - Safe Haven 13 16 13 (3) ≠ 13 100% √ 24 79 √ 14 13 √ 90% 100% √
Community Housing Network - Southpoint Place2 46 48 49 1 √ 49 107% √ 24 45 √ 43 47 √ 90% 96% √
Community Housing Network - Terrace Place 47 49 46 (3) √ 46 98% √ 24 51 √ 44 46 √ 90% 100% √
Maryhaven - Commons at Chantry 50 53 49 (4) √ 49 98% √ 24 60 √ 48 49 √ 90% 100% √
National Church Residences - Commons at Buckingham 75 79 75 (4) √ 74 99% √ 24 57 √ 71 75 √ 90% 100% √
National Church Residences - Commons at Grant 50 53 51 (2) √ 50 100% √ 24 79 √ 48 51 √ 90% 100% √
National Church Residences - Commons at Livingston 60 63 60 (3) √ 57 95% √ 24 42 √ 57 60 √ 90% 100% √
National Church Residences - Commons at Third5 60 63 61 (2) √ 61 102% √ 24 38 √ 57 60 √ 90% 98% √
National Church Residences - VOAGO Van Buren Village 60 63 63 0 √ 59 98% √ 23 20 ≠ 57 61 √ 90% 97% √
YMCA - 40 West Long Street 105 110 108 (2) √ 103 98% √ 24 43 √ 99 105 √ 90% 98% √
YMCA - Franklin Station2 75 79 78 (1) √ 76 101% √ 24 61 √ 71 78 √ 90% 100% √
YMCA - Scattered Sites HOME2,4 50 50 58 8 √ 54 108% √ 3 5 √ 45 55 √ 90% 95% √
YWCA - WINGS 91 96 93 (3) √ 87 96% √ 24 30 √ 86 91 √ 90% 98% √
2 Occupancy exceeds 100% due to project serving homeless individuals in non-homeless units or eligible roommates/couples or project is able to increase census due to funding availability.
3 CHN took over the project from CAIHS as of 7/1/2017. CSB does not have confidence in the accuracy of the data for the reporting period.
4 Capacity was reduced from 75 units to 50 units starting 7/1/17. YMCA took over project from CAIHS starting 1/1/18.
5 Project adding units, up to 25 units across all N^^ properties.
6 Project served less individuals to help conserve system level funds.
1 Starting 7/1/15, Successful Housing Outcomes include permanent exits to family.
Successful Housing Outcomes1
PERMANENT SUPPORTIVE HOUSING Project OccupancyHouseholds Served
Housing Stability
(Months)
12 Program Level: Permanent Supportive Housing
System and Program Indicator Report
4/1/2018-6/30/2018
Ca
pa
cit
y
Go
al
(#)
Actu
al
(#)
Va
ria
nce
Ou
tco
me
Ach
ieve
me
nt
Go
al
(%)
Actu
al
(%)
Ou
tco
me
Ach
ieve
me
nt
Go
al
(#)
Actu
al
(#)
Ou
tco
me
Ach
ieve
me
nt
Go
al
(#)
Actu
al
(#)
Ou
tco
me
Ach
ieve
me
nt
Go
al
(%)
Actu
al
(%)
Ou
tco
me
Ach
ieve
me
nt
PERMANENT SUPPORTIVE HOUSING
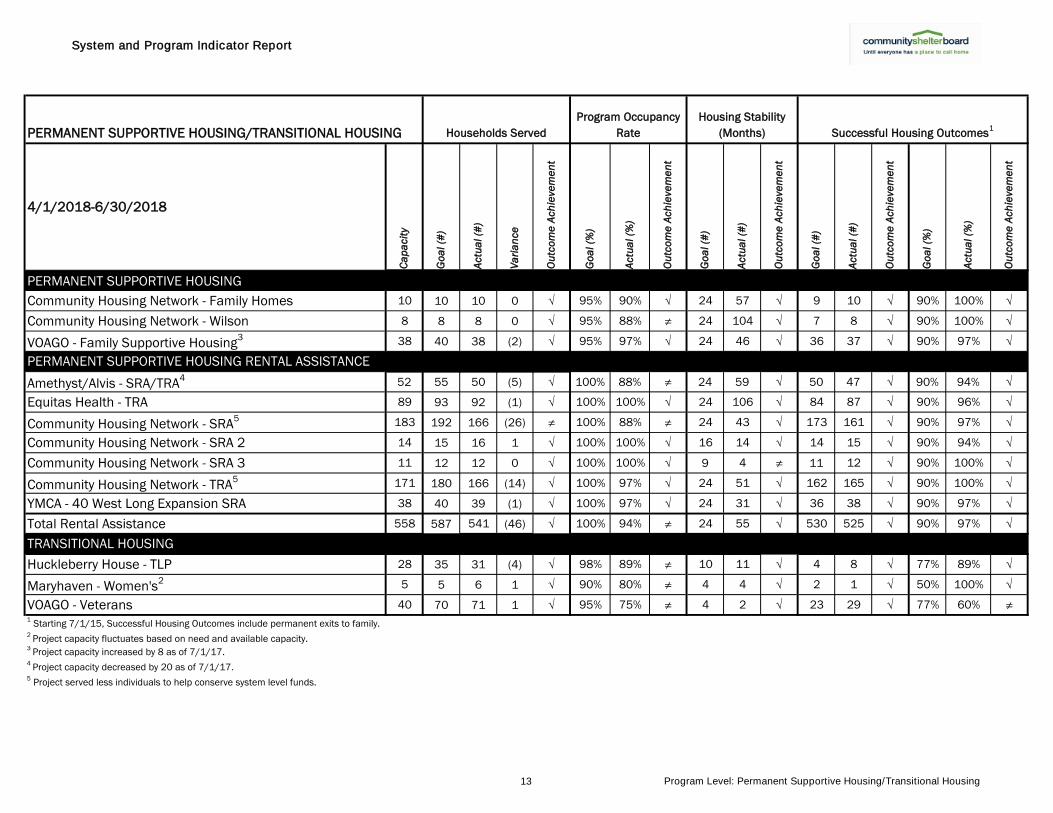
Community Housing Network - Family Homes 10 10 10 0 √ 95% 90% √ 24 57 √ 9 10 √ 90% 100% √
Community Housing Network - Wilson 8 8 8 0 √ 95% 88% ≠ 24 104 √ 7 8 √ 90% 100% √
VOAGO - Family Supportive Housing3 38 40 38 (2) √ 95% 97% √ 24 46 √ 36 37 √ 90% 97% √
PERMANENT SUPPORTIVE HOUSING RENTAL ASSISTANCE
Amethyst/Alvis - SRA/TRA4 52 55 50 (5) √ 100% 88% ≠ 24 59 √ 50 47 √ 90% 94% √
Equitas Health - TRA 89 93 92 (1) √ 100% 100% √ 24 106 √ 84 87 √ 90% 96% √
Community Housing Network - SRA5 183 192 166 (26) ≠ 100% 88% ≠ 24 43 √ 173 161 √ 90% 97% √
Community Housing Network - SRA 2 14 15 16 1 √ 100% 100% √ 16 14 √ 14 15 √ 90% 94% √
Community Housing Network - SRA 3 11 12 12 0 √ 100% 100% √ 9 4 ≠ 11 12 √ 90% 100% √
Community Housing Network - TRA5 171 180 166 (14) √ 100% 97% √ 24 51 √ 162 165 √ 90% 100% √
YMCA - 40 West Long Expansion SRA 38 40 39 (1) √ 100% 97% √ 24 31 √ 36 38 √ 90% 97% √
Total Rental Assistance 558 587 541 (46) √ 100% 94% ≠ 24 55 √ 530 525 √ 90% 97% √
TRANSITIONAL HOUSING
Huckleberry House - TLP 28 35 31 (4) √ 98% 89% ≠ 10 11 √ 4 8 √ 77% 89% √
Maryhaven - Women's2 5 5 6 1 √ 90% 80% ≠ 4 4 √ 2 1 √ 50% 100% √
VOAGO - Veterans 40 70 71 1 √ 95% 75% ≠ 4 2 √ 23 29 √ 77% 60% ≠1 Starting 7/1/15, Successful Housing Outcomes include permanent exits to family.
2 Project capacity fluctuates based on need and available capacity.
3 Project capacity increased by 8 as of 7/1/17.
4 Project capacity decreased by 20 as of 7/1/17.
5 Project served less individuals to help conserve system level funds.
Households Served
Program Occupancy
Rate
Housing Stability
(Months) Successful Housing Outcomes1
PERMANENT SUPPORTIVE HOUSING/TRANSITIONAL HOUSING
13 Program Level: Permanent Supportive Housing/Transitional Housing

System and Program Indicator Report
RAPID RE-HOUSING
4/1/2018-6/30/2018
Go
al (#
)
Actu
al (#
)
Ou
tco
me
Ach
ieve
me
nt
Go
al (#
)
Actu
al (#
)
Ou
tco
me
Ach
ieve
me
nt
Go
al
Actu
al
Ou
tco
me
Ach
ieve
me
nt
Go
al
Actu
al
Ou
tco
me
Ach
ieve
me
nt
Go
al (#
)
Actu
al (#
)
Ou
tco
me
Ach
ieve
me
nt
Go
al (%
)
Actu
al (%
)
Ou
tco
me
Ach
ieve
me
nt
Go
al
Actu
al
Ou
tco
me
Ach
ieve
me
nt
Go
al (%
)
Actu
al (%
)
Ou
tco
me
Ach
ieve
me
nt
Homeless Families Foundation - Rapid Re-housing 46 57 √ 92 98 √ 15 36 ≠ 100 94 √ 41 32 ≠ 90% 71% ≠ $800 $800 √ 90% 67% ≠
The Salvation Army - Rapid Re-housing 41 27 ≠ 78 63 ≠ 15 41 ≠ 100 98 √ 37 30 ≠ 90% 88% √ $1,800 $1,548 √ 90% 91% √
The Salvation Army - Job2Housing 17 23 √ 47 51 √ 15 29 ≠ 180 295 ≠ 15 18 √ 90% 100% √ N/A $1,900 N/A N/A 100% N/A
VOAGO Families - Rapid Re-housing 19 29 √ 43 44 √ 15 34 ≠ 100 92 √ 17 19 √ 90% 95% √ $800 $800 √ 90% 95% √
YMCA - Rapid Rehousing 500 342 ≠ 1,000 688 ≠ 23 26 ≠ 100 103 √ 350 148 ≠ 70% 52% ≠ $740 $964 ≠ 80% 48% ≠
CSB - Transition Program - Family N/A N/A N/A 90 30 ≠ N/A N/A N/A N/A N/A N/A 88 30 ≠ 98% 100% √ $950 $1,813 ≠ 98% 100% √
CSB - Transition Program - Single N/A N/A N/A 550 283 ≠ N/A N/A N/A N/A N/A N/A 539 279 ≠ 98% 99% √ $740 $967 ≠ 98% 99% √
PREVENTION
4/1/2018-6/30/2018
Go
al (#
)
Actu
al (#
)
Ou
tco
me
Ach
ieve
me
nt
Go
al (#
)
Actu
al (#
)
Ou
tco
me
Ach
ieve
me
nt
Go
al
Actu
al
Ou
tco
me
Ach
ieve
me
nt
Go
al (#
)
Actu
al (#
)
Ou
tco
me
Ach
ieve
me
nt
Go
al (%
)
Actu
al (%
)
Ou
tco
me
Ach
ieve
me
nt
Go
al
Actu
al
Ou
tco
me
Ach
ieve
me
nt
Go
al (%
)
Actu
al (%
)
Ou
tco
me
Ach
ieve
me
nt
Gladden Community House - Stable Families 54 89 √ 162 152 √ 180 90 √ 49 71 √ 90% 79% ≠ $1,000 $1,647 √
5 90% 73% ≠
Gladden Community House - Stable Families Expansion 7 10 √ 14 22 √ 120 81 √ 7 12 √ 90% 71% ≠ $1,458 $1,935 √
5 90% 64% ≠
Gladden Community House - Stable Families FCCS 0 20 N/A 24 45 √ 120 136 ≠ 21 16 ≠ 90% 76% ≠ $900 $1,673 √
5 90% 75% ≠
Lutheran Social Services - REEB Stable Families6 9 7 ≠ 45 28 ≠ 365 199 √ 8 28 √ 90% 100% √ $1,800 $1,250 √ 90% 100% √
SSVF - Supportive Services for Veteran Families
4/1/2018-6/30/2018
Go
al (#
)
Actu
al (#
)
Ou
tco
me
Ach
ieve
me
nt
Go
al (#
)
Actu
al (#
)
Ou
tco
me
Ach
ieve
me
nt
Go
al
Actu
al
Ou
tco
me
Ach
ieve
me
nt
Go
al
Actu
al
Ou
tco
me
Ach
ieve
me
nt
Go
al (#
)
Actu
al (#
)
Ou
tco
me
Ach
ieve
me
nt
Go
al (%
)
Actu
al (%
)
Ou
tco
me
Ach
ieve
me
nt
Go
al (%
)
Actu
al (%
)
Ou
tco
me
Ach
ieve
me
nt
LSS - SSVF Prevention4 3 0 N/A 5 0 N/A N/A N/A N/A 90 N/A N/A 2 N/A N/A 90% N/A N/A 75% N/A N/A
LSS - SSVF Rapid Re-housing2 30 27 √ 55 56 √ 30 26 √ 100 126 ≠ 24 19 ≠ 80% 86% √ 80% 80% √
VOAGO - SSVF Prevention7 10 10 √ 25 18 ≠ N/A N/A N/A 100 73 √ 9 7 ≠ 90% 100% √ 75% 100% √
VOAGO - SSVF Rapid Re-housing2, 7 70 48 ≠ 140 119 ≠ 30 28 √ 100 131 ≠ 56 38 ≠ 80% 81% √ 80% 78% √
1 Households that exited successfully without accessing DCA are excluded from calculation.
5 Higher DCA than projected with CSB's approval.
2 Households were excluded from ALOS measure if they still resided in emergency shelter at the time of the report.
6 CSB does not have confidence in the accuracy of the data for the reporting period.
3 Starting 7/1/15, Successful Housing Outcomes include permanent exits to family.
7 Program may not have had enough veterans to serve to meet goal. However, the SSVF Prevention should have shown an increase
4 Due to prioritizing clients into the Rapid-Rehousing program no clients were served in the prevention program. in number served to meet overall, combined (SSVF RRH and Prevention) program capacity.
New Households
Served
Total Households
Served
Average Length of
Shelter Stay
(Days)2
Average Length of
Participation
(Days) Successful Housing Outcomes3
New Households
Served
Average Length of
Participation
(Days)
Total Households
Served
Usage of CSB DCA
(%)1
Average Length of
Stay (Days)2
Average Length of
Participation
(Days)
Usage of CSB DCA
(Average $)Successful Housing Outcomes3
Successful Housing Outcomes3
Usage of CSB DCA
(Average $) Usage of CSB DCA (%)1
Program of
Concern
New Households
Served
Ye
s o
r N
o
No
No
Total Households
Served
No
No
No
Ye
s o
r N
o
No
Usage of SSVF DCA
(%)1
Program of
Concern
No
No
14 Program Level: Rapid Re-housing, Prevention, SSVF

111 liberty street, suite 150 l columbus, ohio 43215
614 221 9195/ main l 614 221 9199/ fax l www.csb.org