
Typical Key Performance Indicator Reports for Performance ...
University of Southern Queensland
Faculty of Engineering and Surveying
Production Operation System – Key Performance
Indicator
A dissertation submitted by
Chua Poh Lian
in fulfillment of the requirements of
Courses ENG4111 and ENG4112 Research Project
towards the degree of
Bachelor of Engineering (Electrical and Electronics)
Submitted: 2nd
November 2006
2
ABSTRACT
This project seeks to increase customers’ satisfaction and improve production operation
system through customizing analysis tools to monitor various factor e.g. delivery time,
production lead time, order lead time, order, sales and inventory.
For the last several years, businesses across the globe have been striving to adjust their
processes towards a lean business model. Many companies are set to become a “Lean
Enterprise”. Lean operations are well-known for leading to all the results which modern
enterprises are trying to obtain in today’s highly competitive world – shorter lead times,
improved quality, reduced cost, increased profit, improved productivity and better customer
service.
The methodology used will be to evaluate current sales and operation systems and consider
alternate methods to measure production operation system and customers’ satisfaction.
Discussions and brain-storming will be going on extensively to define and decide the
requirements of the systems.
Performance metrics play an important role in guiding and shaping the company by
reflecting business factors that are critical to meeting the needs of the market place they
serve. In this project, simple measuring systems will be created to measure customers’
satisfaction and production operations.
With the development of the measuring systems, the company’s performance will be able
to be measured accurately and analyzed in a shorter time; solutions and counter-measures
can be performed immediately. Ultimately, it will help in increasing customers’
satisfaction, reducing production time and controlling work-in-process & inventory.

3
DISCLAIMER PAGE
Limitations of Use
The Council of the University of Southern Queensland, its Faculty of Engineering and
Surveying, and the staffs of the University of Southern Queensland, do not accept any
responsibility for the truth, accuracy or completeness of material contained within or
associated with this dissertation.
Persons using all or any part of this material do so at their own risk, and not at the risk of
the Council of the University of Southern Queensland, its Faculty of Engineering and
Surveying or the staff of the University of Southern Queensland.
This dissertation reports an educational exercise and has no purpose or validity beyond this
exercise. The sole purpose of the course pair entitled “Research Project” is to contribute to
the overall education within the student’s chosen degree program. This document, the
associated hardware, software, drawings, and other material set out in the associated
appendices should not be used for any other purpose: if they are so used, it is entirely at the
risk of the user.
Prof R Smith
Dean
Faculty of Engineering and Surveying
4
CANDIDATE’S CERTIFICATION
I certify that the ideas, designs and experimental work, results, analyses and conclusions set
out in this dissertation are entirely my own effort, except where otherwise indicated and
acknowledged.
I further certify that the work is original and has not been previously submitted for
assessment in any other course or institution, except where specifically stated.
Chua Poh Lian
Student Number: D1231790X
Signature
Date
5
ACKNOWLEDGEMENTS
I am most pleased to acknowledge the assistance given to me by a number of people. Mr.
Bob Fulcher, my supervisor, has given me his advice and suggestions at the various stages
of doing this research project. Ms. Tan Siew Hoon, my superior, has given me great
support and guidance in participating in this company’s innovation project. Panasonic
Electronic Devices, my company, who has provided me with this opportunity to do this
research project.
I would also like to thank my family members, especially my husband, Amos, who has
been a great help at times when I feel so discouraged juggling between work and studies.
CHUA POH LIAN
University of Southern Queensland
November 2006
6
TABLE OF CONTENTS
ABSTRACT 2
DISCLAIMER PAGE 3
CERTIFICATION PAGE 4
ACKNOWLEDGEMENTS 5
CHAPTER 1 – INTRODUCTION
1.1 Outline of the Project 9
1.2 Introduction 9
1.2.1 Lean Enterprise Using Information Technology 9
1.2.2 Performance Measurement System 11
1.3 Towards a Lean Enterprise 12
1.3.1 Key Performance Indicators 13
1.4 Project Objectives 14
1.5 Conclusions: Chapter 1 15
CHAPTER 2 – LITERATURE REVIEW
2.1. Introduction 16
2.2. Importance of lean Operation 16
2.2.1. What is Lean? Why Lean? 16
2.2.2. Elimination of Waste 17
2.2.3. The System Innovation Technology 19
2.2.4. Present versus Future 20
2.3. Evaluation of Current System 22
2.3.1. Order Request and Order Reply 22
2.3.2. Order Confirm 23
2.3.3. Order Ready 23
2.4. Identification of Significant Problems 24
2.4.1. Delay Response of Delivery 24
2.4.2. No Safety Stock-in Inventory 24
7
2.4.3. Lack of Material for Production 25
2.4.4. No linking of Inventory, Sales and Production Data 25
2.4.5. No Key Performance Indicator 25
2.5. Consideration of System Improvement 27
2.5.1. Expansion of Data Server 27
2.5.2. Inventory, Sales and Production Data 28
2.5.3. Material Order System 29
2.5.4. Key Performance Indicator System 29
2.6. Key Performance Indicator 30
2.6.1. Delivery-On-Time 30
2.6.2. Production Lead-Time 30
2.6.3. Order Lead-Time 31
2.6.4. Plan versus Actual Production 31
2.6.5. Sales versus Capacity 32
2.6.6. Work-In-Process and Inventory 33
2.7. Conclusions: Chapter 2 33
CHAPTER 3 – RESEARCH DESIGN AND METHODOLOGY
3.1. Introduction 34
3.2. Delivery-on-Time 35
3.2.1. Data Structure 35
3.2.2. User Interface 37
3.2.3. Result Generation 44
3.3. Production Lead-Time 46
3.3.1. Data Structure 47
3.3.2. User Interface 48
3.3.3. Result Generation 54
3.4. Order Lead-Time 61
3.4.1. Data Structure 61
3.4.2. User Interface 63
8
3.4.3. Result Generation 68
3.5. Sales versus Capacity 69
3.5.1. Data Structure 69
3.5.2. User Interface 73
3.5.3. Result Generation 77
3.6. Plan versus Actual Production 82
3.6.1. Data Structure 82
3.6.2. Result Generation 84
3.7. Work-In-Process & Inventory 84
3.7.1. Data Structure 88
3.7.2. Result Generation 89
3.8. Conclusions: Chapter 3 91
CHAPTER 4 – CONCLUSIONS
4.1. Introduction 92
4.2. Discussions 92
4.3. Results 95
4.4. Future Work & New Ideas 99
4.5. Summary of Chapter 4 100
REFERENCES 101
APPENDICES
A. Project Specification 102
B. Innovation Cycle 103
C. Road Map 104
GLOSSARY 105
9
CHAPTER 1
INTRODUCTION
1.1 Outline of the project
For the last several years, businesses across the globe have been striving to adjust their
processes towards a lean business model. Many companies are set to become a “Lean
Enterprise”. Lean operations are well-known for leading to all the results which
modern enterprises are trying to obtain in today’s highly competitive world – shorter
lead times, improved quality, reduced cost, increased profit, improved productivity and
better customer service. The purpose and scope of this research is detailed in 1.4
Research Objectives.
1.2 Introduction
The lean model originally evolves from the Toyota Production System1 (TPS). It is
based on the elimination of any non value-added processes or practices in the product
or company. This popular performance improvement method helps companies to
redefine entire process stream, link processes more effectively, and drives out waste,
resulting in cost savings and more effective processes.
1.2.1 Lean Enterprise Using Information Technology
A lean culture adopts quantitative systems that measure progress in a non-
judgmental way. Hence, the strategic use of information technology will help
process innovation and performance improvement programs achieve even
greater results. Enterprise information systems or enterprise resource planning
(ERP) systems are common tools now used to enable the functions that will lead
to the creation of a truly lean enterprise. However, systems do not create lean
manufacturing environments, they only support the philosophies.
10
An ERP application is a management tool to support the management and
operation of a manufacturing plant. The ability of ERP systems is to able to
handle large amounts of data and complex calculations and to electronically
transfer or share with everyone in different and remote locations. It is
convenient and transparent.
Before implementing the ERP system, the principles of lean manufacturing
must be established for it to be overlaid.
A few examples of lean manufacturing concepts:
• Kanban control: A rule to determine how much to produce and when to stop
and change over
• Just-in-time (JIT): A system for producing and delivering the right items at
the right time in the right amounts.
• Production smoothing: The creation of the ‘level schedule” by sequencing
orders in a repetitive pattern and smoothing the day-to-day variations in total
orders to correspond to longer-term demand.
Any manufacturer who needs to increase productivity, reduce operating costs,
improve quality and shorten lead times will consider these lean software
applications. That is why there is a surge of ERP vendors.
ERP vendors usually provide advisory and consulting services to help
companies with their information strategy, alignment, planning, evaluation and
systems implementation. They will understand and communicate with the need
to change, identify strategic, operational and tactical issues that hinder
achievements and develop sustainable results-generating solutions for them
through implementing lean systems.
11
1.2.2 Performance Measurement System
Performance measurement is one of the ERP systems to measure the
performance of the company. Performance metrics play an important role in
guiding and shaping the company by reflecting business factors that are critical
to meeting the needs of the marketplace they serve. There are a few elements
that the selection and maintenance of the metrics depends on: First, the
matching of measurements with business strategy. Second, the balancing of
product, process and financial measurements. Third, creating metrics that relate
and correspond to every level of the organization.
After defining these performance metrics, measurements are prominently
displayed in the work areas in the form of boards, charts or graphs. Common
display formats are: Inventory levels, Production rate and Customer service.
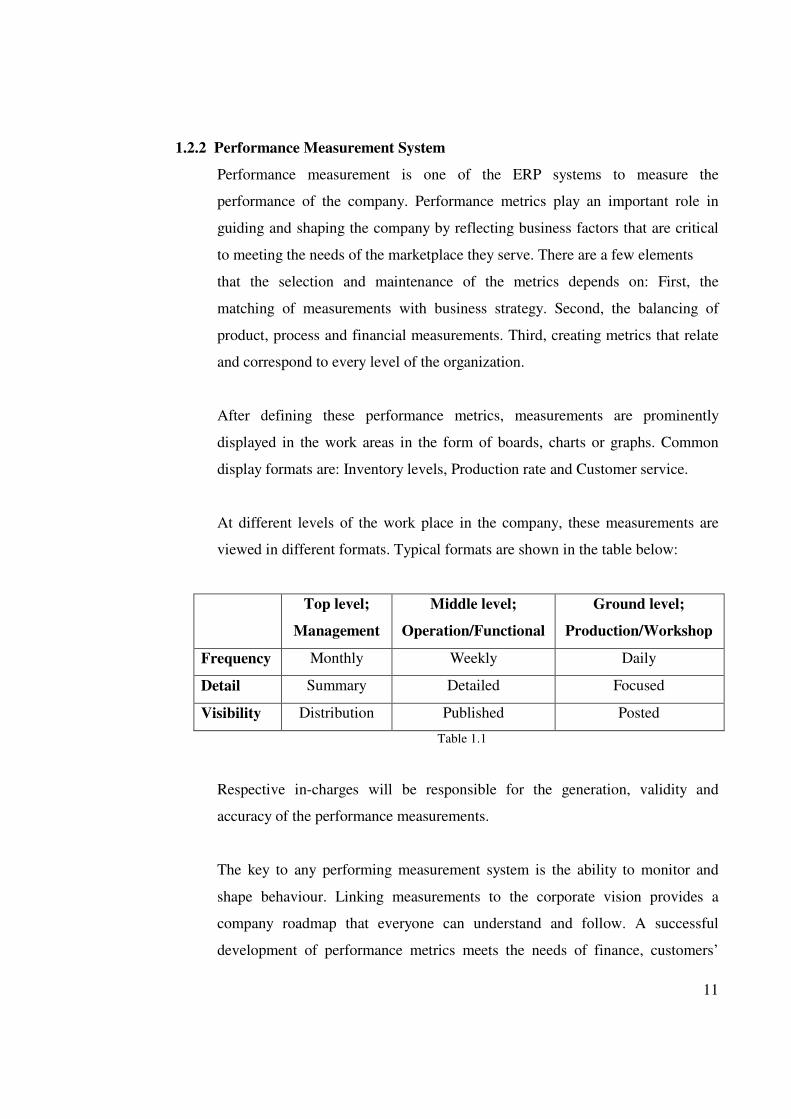
At different levels of the work place in the company, these measurements are
viewed in different formats. Typical formats are shown in the table below:
Top level;
Management
Middle level;
Operation/Functional
Ground level;
Production/Workshop
Frequency Monthly Weekly Daily
Detail Summary Detailed Focused
Visibility Distribution Published Posted
Table 1.1
Respective in-charges will be responsible for the generation, validity and
accuracy of the performance measurements.
The key to any performing measurement system is the ability to monitor and
shape behaviour. Linking measurements to the corporate vision provides a
company roadmap that everyone can understand and follow. A successful
development of performance metrics meets the needs of finance, customers’
12
requirements, business strategy and, innovation and learning factors, at all
levels. Metrics address the questions, “where are we going?”, “how will we
change to meet our business need?”, “what are our critical success factors?”,
“what is our target performance?”, and “where is performance improvement
required?”
If there are no measurements, there will be no improvements; if the
measurements are inaccurate, the result or behaviour will be incorrect.
1.3 Towards a Lean Enterprise
Panasonic Electronic Devices Pte Ltd manufactures electronic components, e.g.
resistors, capacitors, etc, since 1977. It responds to the expectation from global
customers, with the flexible supply capacity of high quality components with
competitive cost. Over the past 29 years, there has been an evolution of competing
philosophies about how to run manufacturing operations. Like many other companies,
Panasonic Electronic Devices constantly keeps a look out and employs effective and
useful philosophies in improving management and operation. With this, it formulates
an innovation cycle2 that promotes continuous improvement through enterprise system
using information technology (IT).
In-house workshop and training began company-wide understanding of lean
principles, generating an awareness of lean concepts and provide employees with the
tools they need. Some lean concepts3 are:
• 5S & 7 Wastes
• Time Study & Motion Mind
• Line Balancing Analysis
• Just In Time (JIT)
• Total Preventive Maintenance (TPM)
1See Appendix B
2See Glossary on the explanation of the lean concepts
13
Quick Model Changeover
• Streamline & Process Analysis
• Toyota Production System
• Material & Information Flowcharts
• Inventory Reduction
Since September 2004, a structure is designed to support the change, to identify and
prioritize opportunities for improvement. Value Stream Mapping is used to analyze
existing processes and identify improvement. Thus, a roadmap4 is created for the
company’s lean journey.
1.3.1 Key Performance Indicators
In the ‘Production Monitoring System’ as shown in the roadmap, key
performance indicators are performance metrics measured and displayed in
graphical formats. They are:
a) Delivery-on-Time (DOT)
b) Production Lead Time
c) Order Lead Time
d) Planned vs. Actual Production
e) Sales vs. Capacity
f) Work-in-process (WIP) & Inventory
More details on the indicators will be covered in the next chapter.
3See Appendix C
14
1.4 Research Objectives
This research comprised of the following:
a) Background information relating to production operation performance and
customers’ satisfaction
b) Evaluation of current systems in use for measuring the performance of production
operation and customers’ satisfaction.
c) Identification of significant problems with current system and consideration of
alternate methods to measure production operation systems and customers’
satisfaction.
d) Design of new tools for performance indicators to analyze production systems.
e) Proposal for improvements to an existing system
f) Cost benefit analysis of the suggested improvements and new indicators
g) Data collection for new implementations
The aim of the research is to increase customers’ satisfaction and improve production
operation system through customizing analysis tools to monitor various performance
metrics e.g. delivery time, production lead time, order lead time, order, sales and
inventory.
The research methodology is divided into six subparts. Each subpart will define
individual metric and present the different types of data required for the measurement
of the metric. Data relationships and logic will be shown and explained to determine
the formula of the measurement.
Data manipulating tools will be created to generate charts and tables for easy
understanding and analysis.
15
1.5 Conclusions: Chapter 1
This dissertation aims to introduce the modern production operation performance
metrics and the methods or formulations to measure the metrics.
The research is expected to result in improved or new data analysis tools to manipulate
the abundant of data so as to generate useful charts and graphs for easy data analysis.
A review of the literature for this research will provide the background information of
the model production operation system and customer’s satisfaction.
Research design and methodology will identify the purpose of the metrics and the
different types of data required for the measurement. Appropriate tools may be devised
for data manipulation purpose.
The outcome of the research will be used in the analysis of the production operation so
as to understand current conditions and promote continuous improvement towards a
lean enterprise.
16
CHAPTER 2
LITERATURE REVIEW
2.1 Introduction
Referring to the research objectives stated in section 1.4, this literature review will
provide a comprehensive information of why it is important for today’s organization to
be lean and how Panasonic Electronic Devices works towards lean operations and
manufacturing. An evaluation of performance measurement systems used in Panasonic
Electronic Devices will be conducted and significant problems will be identified. New
and alternative methods will be proposed and discussed.
2.2 Importance of Lean Operation
For the past several years, businesses across the globe have been striving to adjust
their processes towards a lean business model. Lean operations really equate to all the
results which modern enterprises are trying to obtain in today’s highly competitive
world – shorter lead times, improved quality, reduced cost, increased profit, improved
productivity and better customer service. But becoming lean is not a short or easy
journey. The following four points will give a good explanation of the importance of
Lean Operation.
2.2.1 What is Lean? Why Lean?
Lean is about eliminating waste. It may sound simple but is never easy to
achieve.
A statesman once said, “I can’t define it, but I know it when I see it.” This is
very true if you see how Olympic athletes make their actions look simple only
after so many years of practice, focused on a single goal; the elimination of
wasteful motion.
Anyone standing at the counter of a fast food restaurant has witnessed Lean
Manufacturing. Demands begin at the cash register where upon entry of order,
17
an electronic signal is passed to the kitchen and production begins. There you
find the flexible cell design where all materials are stored at the point of use in
an appropriate sequence. Trained workers assemble each item using
standardized work procedures and production flows according to a standard
rhythm. Production probably ends when the burger is ready to be served to the
customer but customer satisfaction will depend on how fast the server hands the
finished goods to the customer. So this is an example of a lean manufacturing.
2.2.2 Elimination of Waste
What is waste? It is defined, as anything customers would not be willing to pay
for. So, we need to identify them and get rid of them so as to ensure our
customers that they are not paying for waste. During the development of the
Toyota Production System, Taiichi Ohno and Dr. Shigeo Shingo identified
seven distinct forms of waste:
a) Inventory. Traditional accountants define inventory as an asset, Lean
accountants consider it a liability. Excess inventory ties up cash and creates
waste in many forms including storage facilities, tracking, transactions,
movement, damage, and physical counting and adjustment records.
b) Delay. It is understood as the unnecessary wait time that occurs throughout
the production process. Unnecessary wait time may be caused by improper
scheduling, causing people, tools and materials not to appear in the right
place at the right time. Any kinds of delays will affect the delivery of goods.
c) Motion. Unnecessary human motion – the ergonomics of walking, bending,
reaching, twisting, lifting, and handling, requiring two hands instead of one
– not only wastes effort, but may also cause health and safety issues. In
additional to human motion, this form of waste also includes unnecessary
18
machine motion, which causes additional maintenance, energy cost, and
machine wear and tear, leading to quality problems.
d) Transportation. Unnecessary movement of materials, supplies and resources
is waste. Whenever practical, materials should be received in the appropriate
quantities at the point of use.
e) Overproduction. This waste is produced when production makes more or
faster than the customer demands. This is usually caused by improper
demand planning, long setup times, large lot sizes or quality rejects.
Overproduction leads to consumption of extra resources, people, machines,
inventory, storage space, energy and cash tied up in these assets. Producing
earlier than necessary creates excess inventory and consumes material and
capacity that may be required by higher-priority work.
f) Over-processing. It is caused by performing unnecessary work due to wrong
or poorly maintained tools, improper work instructions and inadequate
training. Improperly designed information systems can cause over-
processing in the form of unnecessary transactions. When a process is
simplified, it requires less data to monitor and control. Effort to capture
production data that does not add value is wasted processing and motion.
When this information is recorded by hand and entered into a computer, the
waste is doubled. The time spent storing, managing, printing, distributing
and analyzing unnecessary information only adds to this waste.
g) Defects. This is the cost of poor quality that may result from faulty product
design, insufficient training, lack of standardized work methods and
instructions, improper tooling, unnecessary inspection and quality
countermeasures, and excess processing caused by repair and rework.
Defects waste includes interrupted schedules, missed due dates, uneven
production flow, inspection to catch defects, and unnecessary setup and
runtime caused by unscheduled repair and rework.
19
These seven forms of waste serve as a set of guidelines to determine the
performance metrics and analyze the performance of the production operation
system in this research.
2.2.3 The System Innovation Technology
Since 2002, Panasonic Electronic Devices, triggered by a 10% decrease in
profit, had adopted an innovation plan towards a lean manufacturing and
operation. With the aim of increasing profit and sales, a thorough study with
understanding of customer request and production constraints was being carried
out. Production system was being evaluated and improved to ensure it achieved
the best productivity and throughput.
The procedures in achieving the action plan:
a) By using order analysis tool, produce and understand the characteristic of
order.
b) By comparing to production status, understand the gap between demand and
production.
c) Determine the inventory stock point and production orders that satisfy the
customer demand and cost performance.
d) Consider the order quantity, order lead-time and machine changeability,
utilize standard lot calculation tool to fix the lot size and standard inventory
quantity by part number.
e) Maximize production performance by using the model simulation; develop
the way to make the production plan based on the bottleneck process
capacity.
20
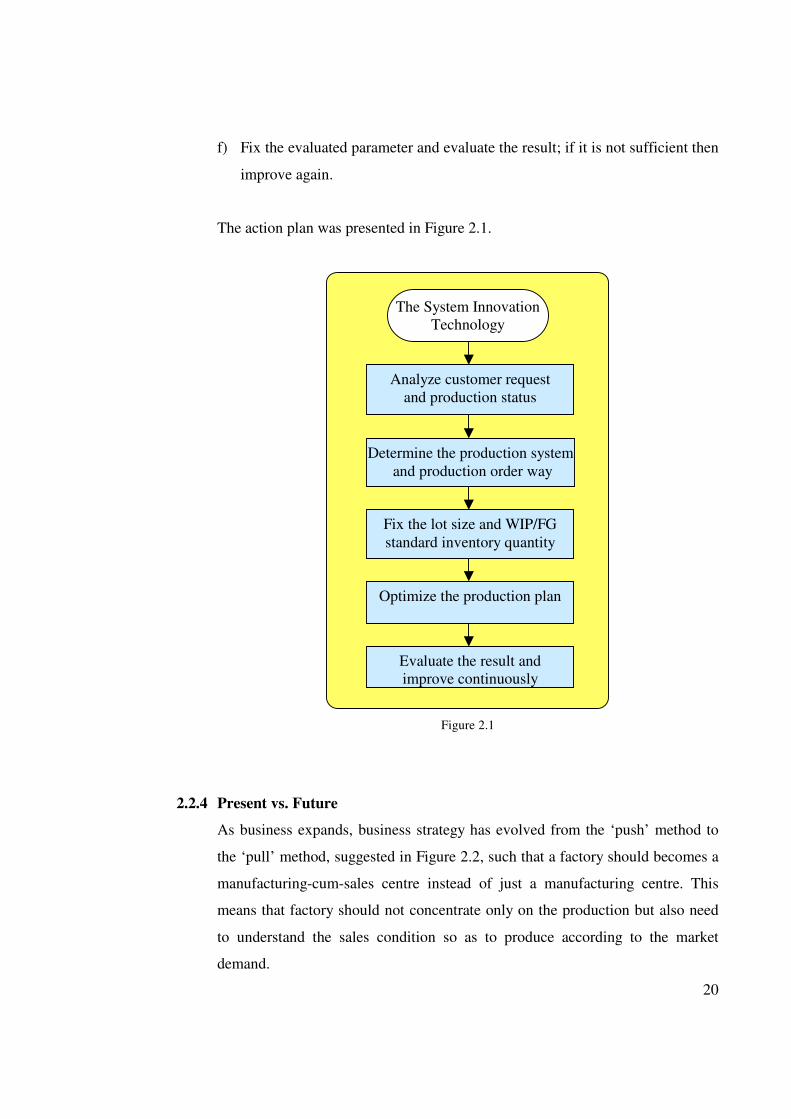
f) Fix the evaluated parameter and evaluate the result; if it is not sufficient then
improve again.
The action plan was presented in Figure 2.1.
Figure 2.1
2.2.4 Present vs. Future
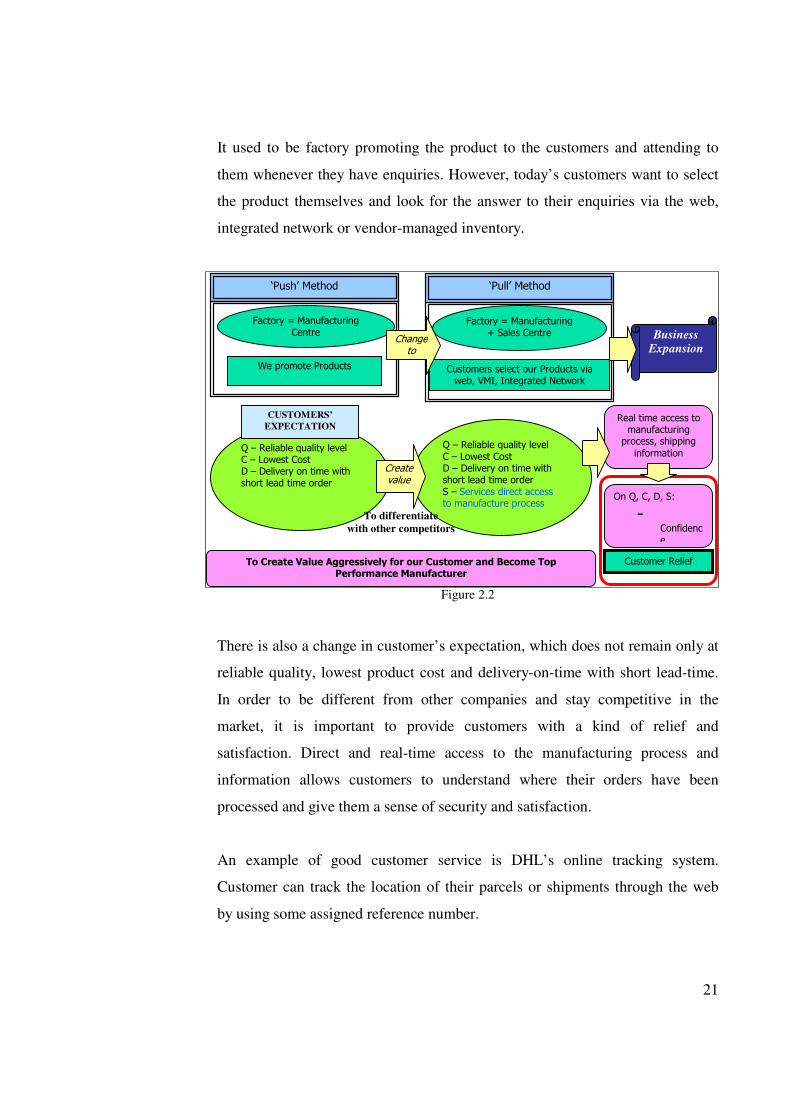
As business expands, business strategy has evolved from the ‘push’ method to
the ‘pull’ method, suggested in Figure 2.2, such that a factory should becomes a
manufacturing-cum-sales centre instead of just a manufacturing centre. This
means that factory should not concentrate only on the production but also need
to understand the sales condition so as to produce according to the market
demand.
The System Innovation
Technology
Analyze customer request
and production status
Determine the production system
and production order way
Fix the lot size and WIP/FG
standard inventory quantity
Optimize the production plan
Evaluate the result and
improve continuously
21
It used to be factory promoting the product to the customers and attending to
them whenever they have enquiries. However, today’s customers want to select
the product themselves and look for the answer to their enquiries via the web,
integrated network or vendor-managed inventory.
Figure 2.2
There is also a change in customer’s expectation, which does not remain only at
reliable quality, lowest product cost and delivery-on-time with short lead-time.
In order to be different from other companies and stay competitive in the
market, it is important to provide customers with a kind of relief and
satisfaction. Direct and real-time access to the manufacturing process and
information allows customers to understand where their orders have been
processed and give them a sense of security and satisfaction.
An example of good customer service is DHL’s online tracking system.
Customer can track the location of their parcels or shipments through the web
by using some assigned reference number.
Real time access to manufacturing
process, shipping
information
On Q, C, D, S:
- Confidence
Customer Relief
Q – Reliable quality level C – Lowest Cost D – Delivery on time with short lead time order
CUSTOMERS’
EXPECTATION
Q – Reliable quality level C – Lowest Cost D – Delivery on time with short lead time order S – Services direct access to manufacture process
Create value
To Create Value Aggressively for our Customer and Become Top Performance Manufacturer
‘Push’ Method
Factory = Manufacturing Centre
We promote Products
Business
Expansion
Factory = Manufacturing + Sales Centre
Customers select our Products via web, VMI, Integrated Network
‘Pull’ Method
Change
to
To differentiate
with other competitors
22
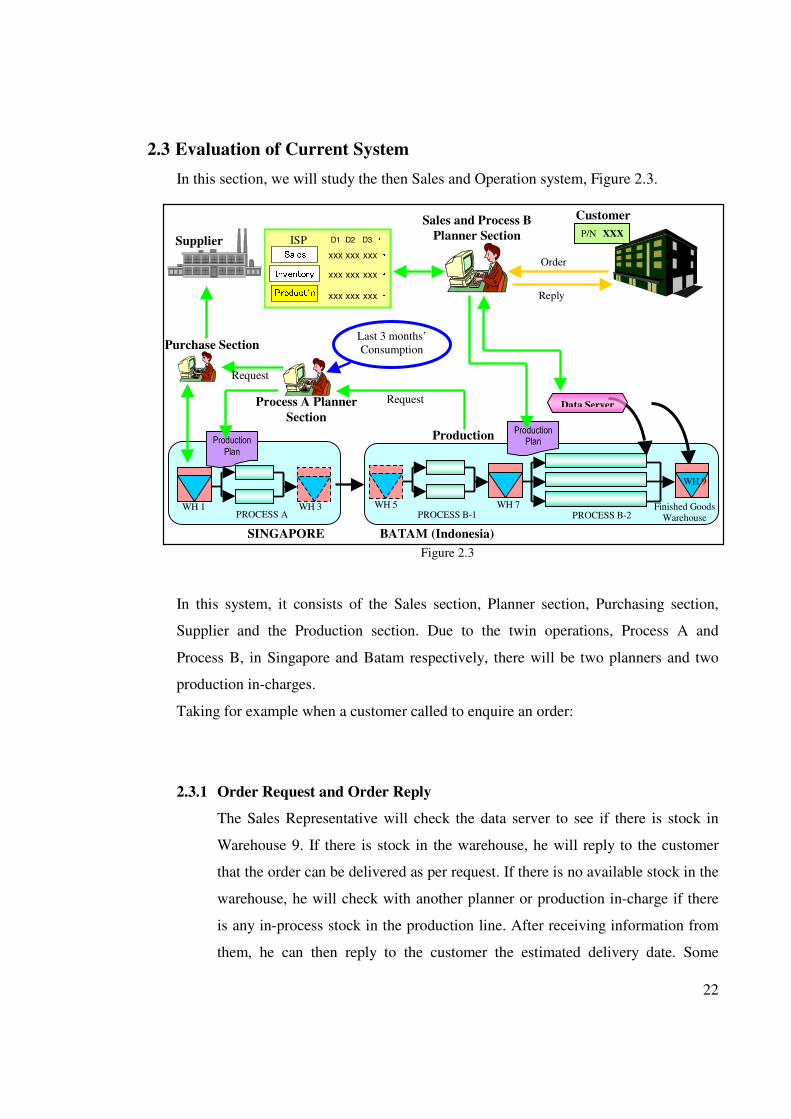
2.3 Evaluation of Current System
In this section, we will study the then Sales and Operation system, Figure 2.3.
Figure 2.3
In this system, it consists of the Sales section, Planner section, Purchasing section,
Supplier and the Production section. Due to the twin operations, Process A and
Process B, in Singapore and Batam respectively, there will be two planners and two
production in-charges.
Taking for example when a customer called to enquire an order:
2.3.1 Order Request and Order Reply
The Sales Representative will check the data server to see if there is stock in
Warehouse 9. If there is stock in the warehouse, he will reply to the customer
that the order can be delivered as per request. If there is no available stock in the
warehouse, he will check with another planner or production in-charge if there
is any in-process stock in the production line. After receiving information from
them, he can then reply to the customer the estimated delivery date. Some
PROCESS B-2Finished Goods
Warehouse PROCESS B-1PROCESS A
Customer
Order
Sales and Process B
Planner Section P/N XXX
Data Server
Supplier
Reply
SINGAPORE BATAM (Indonesia)
Process A Planner
Section
Purchase Section
Product’nInventorySales D1 D2 D3・xxx xxx xxx ・xxx xxx xxx ・xxx xxx xxx ・ISPProduct’nInventorySales D1 D2 D3・xxx xxx xxx ・xxx xxx xxx ・xxx xxx xxx ・ISP
Production
Plan
Last 3 months’
Consumption
Request
Production
Request
Production
Plan
WH 1 WH 3 WH 5 WH 7
WH 9
23
negotiations will go on if the customer cannot wait for a later delivery date.
Because customer is always right, we will always accept urgent orders by
disrupting the existing production.
2.3.2 Order Confirm
Once the order is confirmed, the Sales Representative will issue a production
plan to the production in-charge in Batam (Indonesia). The Process B
production in-charge will prepare for the production. If there is a lack of
material for production at Warehouse 5, he will request material from the
Process A planner to send to Batam. Process A planner will either arrange for
shipment of material to send to Batam or plan for Process A production. If there
is not enough material for Process A production, he will request material from
the Purchaser who will get it from the Supplier. On normal days, he will
purchase the type and quantity of material base on the past three months’
consumption.
2.3.3 Order Ready
After the production for the order has been completed, the product will be
stocked into Warehouse 9 where the production lead-time stops. Once the
product reaches Warehouse 9, the shipping in-charge will arrange for the
product to be sent to the customer as soon as possible. Most of the time, the
customer will receive their goods as per their request.
24
2.4 Identification of Significant Problems
After evaluating the current system, some problems are being identified. These
problems are mainly root causes for late delivery and poor customers’ satisfaction.
2.4.1 Delay Response of Delivery
Customers are annoyed to be kept waiting for delivery date enquiry. The Sales
Representative is not able to give an immediate reply to the customers because
he has to ask a few more persons in order to know the answer. Sometimes, he
also has to wait for their replies.
This problem lies with the ‘data server’ that does not contain the whole
production’s datum. The current data server only contains data for the last
process and Warehouse 9. The Sales Representative is only able to check if
there is extra stock in the warehouse and depends on other sections’ members to
help check in-process stock, hence the delay in replying to the customer on the
delivery date.
2.4.2 No Safety Stock Inventory
Having goods delivered on time is not enough to satisfy customers’ expectation.
Because of the constant-changing market, there is an increase trend of urgent
product request. When customers place urgent request, which is called ‘short
lean-time’ order, we must make sure that we have the products for them because
we value them and we want to provide a better customer service than our
competitors. If we cannot fulfill short lead-time orders, we will lose our
customers gradually. Hence, we have to keep a certain amount and type of
products in the warehouse.
25
2.4.3 Lack of Material for Production
In this current system, there are cases whereby there is not enough material to
run production at both production locations. There is always a breakdown in
communications between the production and planning section. Or perhaps
nobody dares to bear the responsibility if materials were bought but no order
coming in to use them. Very often, materials are purchased or prepared upon
requests from respective sections. This tends to delay the whole process of
making the product, which is called the production lead-time.
The problem lies in no sharing of Inventory, Sales and Production data.
2.4.4 No Linking of Inventory, Sales and Production data
Individual section is operating according to its function and procedures. There is
no common understanding among them. The purchaser only purchases the
material when there is request from the planner. The planner only plans when
there is an order request from the Sales Representative. The production will run
production when the planner issues the planning sheet. Every section acts upon
a request which is time consuming and unproductive. Unnecessary waiting time
is a kind of waste that must be eliminated.
2.4.5 No Key Performance Indicator
There is no performance measurement system in the then Sales and Operation
System. Measurement system is important to gauge the progress and determine
how well or how bad the company is doing. Without this kind of measurement
system, we would not be able to know what problems we are facing and how to
improve on the problems. However, measurement systems may be different at
different sections and places; every measuring system is unique.
26
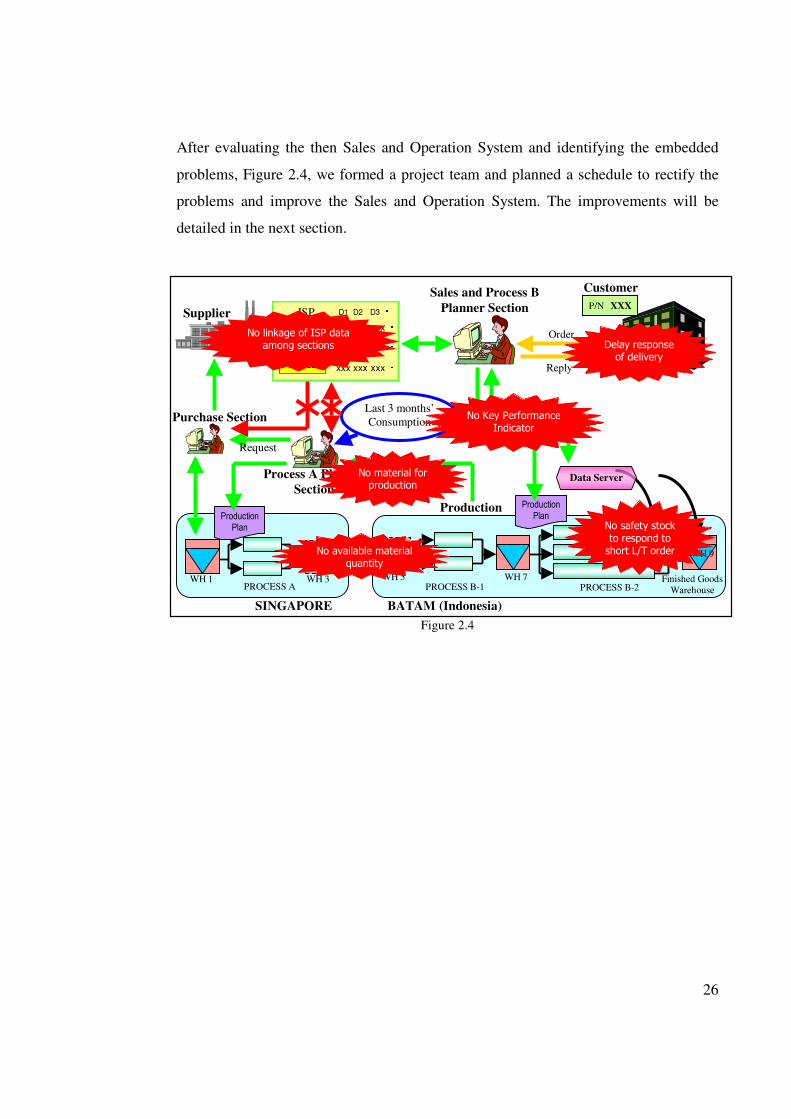
After evaluating the then Sales and Operation System and identifying the embedded
problems, Figure 2.4, we formed a project team and planned a schedule to rectify the
problems and improve the Sales and Operation System. The improvements will be
detailed in the next section.
Figure 2.4
PROCESS B-2Finished Goods
Warehouse PROCESS B-1PROCESS A
Customer
Order
Sales and Process B
Planner Section P/N XXX
Data Server
Supplier
Reply
SINGAPORE BATAM (Indonesia)
Process A Planner
Section
Purchase Section
Product’nInventorySales D1 D2 D3・xxx xxx xxx ・xxx xxx xxx ・xxx xxx xxx ・ISPProduct’nInventorySales D1 D2 D3・xxx xxx xxx ・xxx xxx xxx ・xxx xxx xxx ・ISP
Production
Plan
Last 3 months’
Consumption
Request
Production
Request
Production
Plan
WH 1 WH 3 WH 5 WH 7
WH 9
Delay response of delivery
No available material quantity
No Key Performance Indicator
No material for production
No linkage of ISP data among sections
No safety stock to respond to short L/T order
27
2.5 Considerations of System Improvement
First thing first, in order to response to customers quickly, we need to expand our data
server to all the processes so that we can access to all warehouses located at both
locations.
2.5.1 Expansion of Data Server
In order to improve on the system that is the software side, some improvements
have to be done on the hardware side first.
The hardware side basically consists of:
a) The machines that are used for the production
b) The machine number structure
c) The process number structure
d) The material part number structure
e) The product part number structure
f) The customer database and number structure
g) The warehouses
h) The computers required for bar-code scanning
i) The transfer sheet printing tool (for issuing of planning sheets)
After getting ready the physical hardware side, team members from the
Information Security Department (ISD) will help to set up two data server, Data
Server A and Data Server B, in our company’s intranet for data sharing purpose.
With assigned IP address, authorized members will be able to log into the
database to look for information. ISD member will create a window interface
for users to input information to the server or search for data entry.
A new job flow is devised in individual sections for correct data entry purpose.
Starting from the planner, where planning sheet is issued. The production upon
receiving the planning sheet will ‘draw’ materials from the warehouse, which is
28
called ‘stock-out’. The materials are then send to the first process. At every
process, operators must scan the information before starting the production.
Information details include the material number, the quantity, the machine used,
the end-product part number and the customer number.
At every warehouse where materials or products are being kept, information
must also be keyed into the system, which is called ‘stock-in’. When the end
product is being stock-out to be delivered to customer, the system will be able to
remove the available quantity from the system. The system will also have many
records of how long, starting from the first process, it takes to complete the
production or at every process.
The data servers are ready for use after much testing and improvements, which
took about a year. One of the most important factors is the security and accuracy
of the data.
2.5.2 Inventory, Sales and Production (ISP) Data Sharing
After setting up the data servers, the next thing to do is to share the Inventory,
Sales and Production data among the Purchasing section, Planner section and
Production section. With the sharing of this data, respective team players will
have a better understanding on the actual condition of the market situation and
be able to make advance necessary planning to countermeasure and get ready
for future situation.
The Sales Representative will generate the latest data in the server and the other
sections’ members will be able to retrieve them from the server with their
authorized identification.
29
2.5.3 Material Order System
Old system employs the ‘Push’ method in purchasing the material because they
use the past records or consumptions quantity as guidelines. Towards a lean
enterprise, we need to adopt the ‘Pull’ method that is to purchase only when
needed, but, and will not result time waste. Taking future ISP data and making
necessary analysis can do this.
The material order system will be able to calculate the quantity and type of
material needed for the next one month. The purchaser will use this material
order system.
2.5.4 Key Performance Indicator System
After implementing the necessary improvements, we need to evaluate the new
implementations to achieve better results and promote continuous
improvements. Measuring system is required to capture the result for evaluation
and tells when it must take corrective action. As mentioned earlier, every
measurement system is unique. The design of the systems must be decided by
the Sales and Operation team members as no one will know best what sort of
measurement systems are needed.
In the production and operation field, one of the key factors to measure is
‘delivery-on-time’ indicator that measures how satisfied the customers are.
There are also some other factors to consider e.g. the production lead-time, the
sales versus capacity condition, etc, which will be covered in the next section.
30
2.6 Key Performance Indicators
After some discussions with the team members, some measuring indicators have been
decided upon. Some are existing indicators that need to be improved whereas some are
new measuring indicators that have to be devised. These measuring indicators are
required mainly for monthly reports, market understanding and problem catching
purposes.
2.6.1 Delivery-on-Time
Delivery-On-Time measures the percentage of orders that are delivered to the
customers on time and is categorized under two groups, i.e. DOT by request or
DOT by reply. The former calculates based on the date the customer expects to
receive the goods and the latter calculates based on the date the company
commits to deliver the goods to the customer.
This is an important metric because it is a gauge for customers’ satisfaction. The
higher the DOT, the greater the customers’ satisfaction. In a competive world
like today, prompt delivery is very important for a smooth function. Any delay
may result in heavy penalties, e.g. monetary compensation and bad reputation.
The three main causes for late deliveries are usually due to production, logistic
and order lead time.
2.6.2 Production Lead-Time
Production lead time is the time taken for the product to undergo the first
process to the last process in a production line. Usually all products have a fixed
production lead time which helps to forecast the possible delivery date when
customers enquire. For example, Product A takes 4 days, Product B takes 6
days, etc.
31
Long production time may be due to:
� Old and faulty machines which require frequent repair job during production
� Long changeover time when changing model or changing lot
� Slow handling time by operators, shortage of manpower or lack of material
� Poor production planning
Production, due to any of the above, may take as long as 30 days to complete
and thus affects the DOT metric.
2.6.3 Order Lead-Time
Order lead time counts the days starting from the day the order is being
confirmed to the day the order is being sent to the customer.
For example, there is an order for Product A (five days production lead time)
which is confirmed today and the request date to deliver the goods is tomorrow,
in the case whereby there is no safety stock in the warehouse, it will be
considered a delay due to order lead time. This is because by the time Product A
is being produced and delivered, it would be five days after the order is being
confirmed which is four days late based on the request date to deliver. Order
lead time may be presented in terms of the number of orders or number of
product quantity. Short order lead time is a cause for poor DOT.
2.6.4 Plan versus Actual Production
This metric shows how much daily production has been achieved and those
productions which are unable to be carried out as plan.
Production planning is done everyday by the planner for the next day based on
the number of machines available and their capacity to produce. However, there
are chances that production might not be able to be carried out smoothly as per
planned due to ‘unforeseen circumstances’. Machine may break down, operators
32
may be on sick leave, unexpected incidents may happen, hence actual
production differs from the planned production.
If there is a frequent dis-match between the planned and actual, then more in-
depth studies must be made to understand why it happens.
2.6.5 Sales versus Capacity
‘Sales’ means orders from the customers and ‘capacity’ means machine’s ability
to run production.
One of the reasons to compare these two factors is to give an accurate delivery
reply to the customers. Machine capacities for different processes in a
production line are different. Hence, in order to determine the delivery time of
the order, the guideline is to base on the process that has the lowest capacity, i.e.
the process that takes the longest time to complete.
The second reason is to compare the total production condition against the
market demand. If the market is beaming with huge orders in the next few
months, then there may be a consideration to either increase machine capacity
or machine quantity to prepare for the huge order.
33
2.6.6 Work-In-Process & Inventory
WIP metric shows the quantity of products that is still in the production line
waiting to be processed whereas inventory metric shows the stock available in
the warehouse. These two metrics are important in today’s production guideline
because they are related to producing a lean function. Inventory should be kept
at a safety level so that if there is a big order or short lead-time, delivery is still
possible. This safety level is such that it tallies with the actual demand.
Conventional systems used to make their machine capacity as one of the
performance indicator, the higher the better. Hence producing too many
unwanted goods that nobody knows if anyone wants, thus incurring a big
amount of frozen asset.
2.7 Conclusions: Chapter 2
The literature review has given the background information of modern production
operation system and customer satisfaction. Through the evaluation of the system,
problems have been identified and new improvements and ideas are being proposed
and implemented. The next chapter will detail the methodology of creating the various
key performance indicators tools and the improvements on existing methods. Step-by-
step procedures in using the tools will be shown and discussed.
34
CHAPTER 3
RESEARCH DESIGN AND METHODOLOGY
3.1 Introduction
The methodology employed is to review and destroy the current job flow and to make
a logically job flow and eliminate waste from the job. In order to develop the
measuring systems successfully, the following areas are covered:
a) Study and analyse the business needs in measureable goals
b) Review of the current system
c) Conceptual design of the operation of the new system
d) Equipment requirements
e) Financial analysis of the costs and benefits including budget
f) Forms a project team including programmers, users, and support personnels
In all systems developement, data modelling is required to structure or oragnise the
large quantities of raw data. This process helps to categorise the data, group them and
show the relationship between them.
For different performance metrics, different data fields are reuqired, different data
structures are designed to describe the flow and the relationship of the data. Existing
systems have been revised and proposed with new operation flows to enhance their
features. However, due to confidentiality reason, the source code and product part
structures and details cannot be included in this dissertation. Only some
extractions will be used for explanation.
35
3.2 Delivery-on-Time (DOT)
As explained in section 2.6.1, DOT is a measurement of customers’ satisfaction by
determining orders that are being delivered to the customer on time. For those that are
not being able to deliver on time, they are caused by 3 possible reasons, mainly:
a) Production Delay
b) Short Order Lead-Time
c) Logistic Delay
For example, out of 100 orders, 65 orders reached the customers on time (based on the
date requested by customers). DOT = 65%.
Out of the 35 orders that did not reach the customers on time based on request date,
� 20 orders could not be delivered on time even based on reply date;
� 10 orders were (less than 5 days lead-time) requested by customers urgently;
� 5 orders were delivered on time based on reply date.
This means that 20% was due to Production Delay, 10% was due to Short lead-time
and 5% was due to Logistic Delay.
With the concept given, the next step is to select the data field required for the function
followed by creating the data structure for the tool to work on.
3.2.1 Data Structure
For Delivery-On-time (DOT) measurement, the following data fields are
required:
a) Item Group
b) Item Type
c) Part Number
d) Customer Code
e) Quantity
f) Order Lead-time
36
g) Order Invoice Number
h) Request Date
i) Acceptance Date
j) Warehouse In Date
k) Reply Date
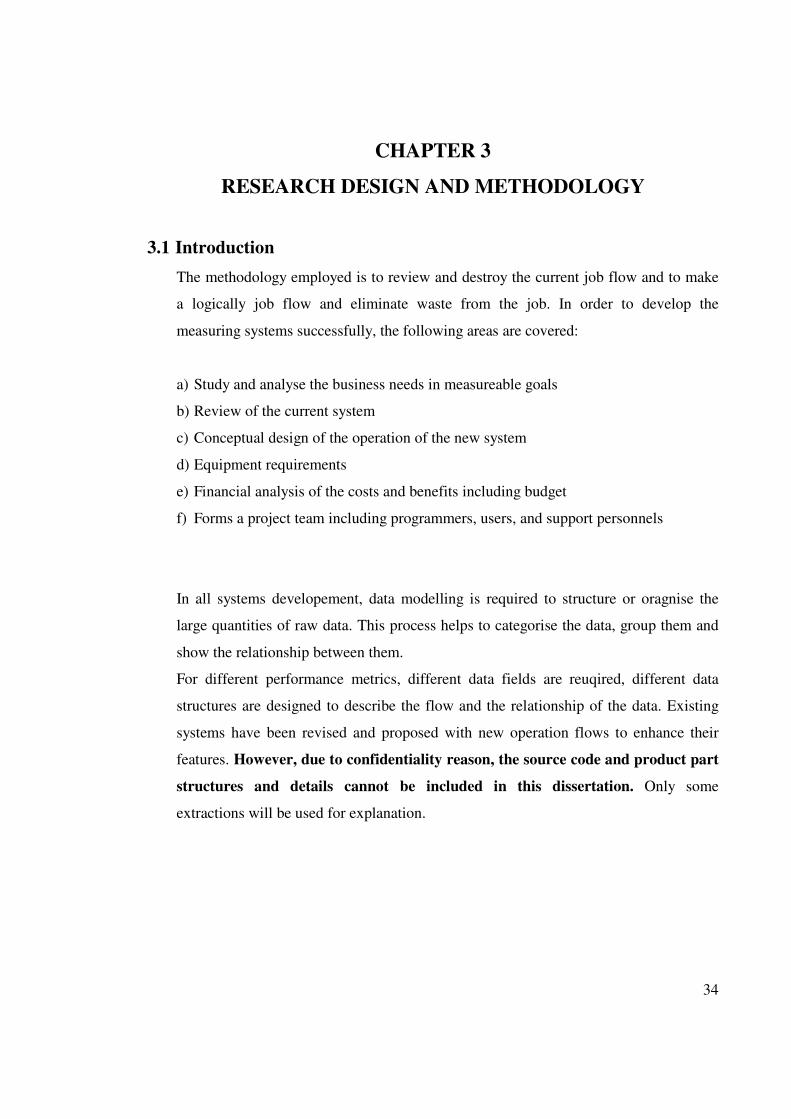
As DOT is calculated based on Request Date and Reply Date, two data tables
are required. With some selections using Tool A Interface1, these data tables can
be downloaded from the Data Server A in text-file format saved as the file name
‘XNPSS771SIREQ010806_310806’ and ‘XNPSS771SIRLY010806_310806’,
Figure 3.1. With a common understanding, the filename always indicates
whether it is by request date or by reply date, and the period of data included.
For example, in Figure 3.1, the filename (‘REQ’) suggests it is by request date
and (‘010806_310806’) suggests it is for the period of August 2006.
Figure 3.1
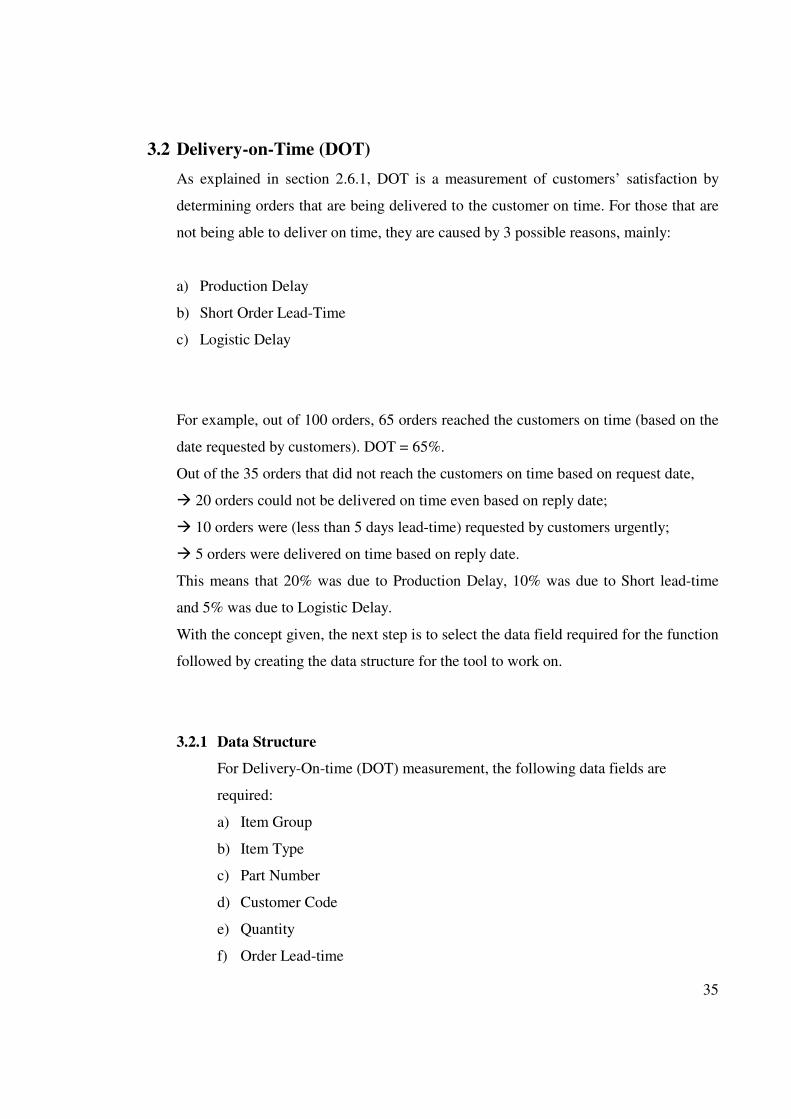
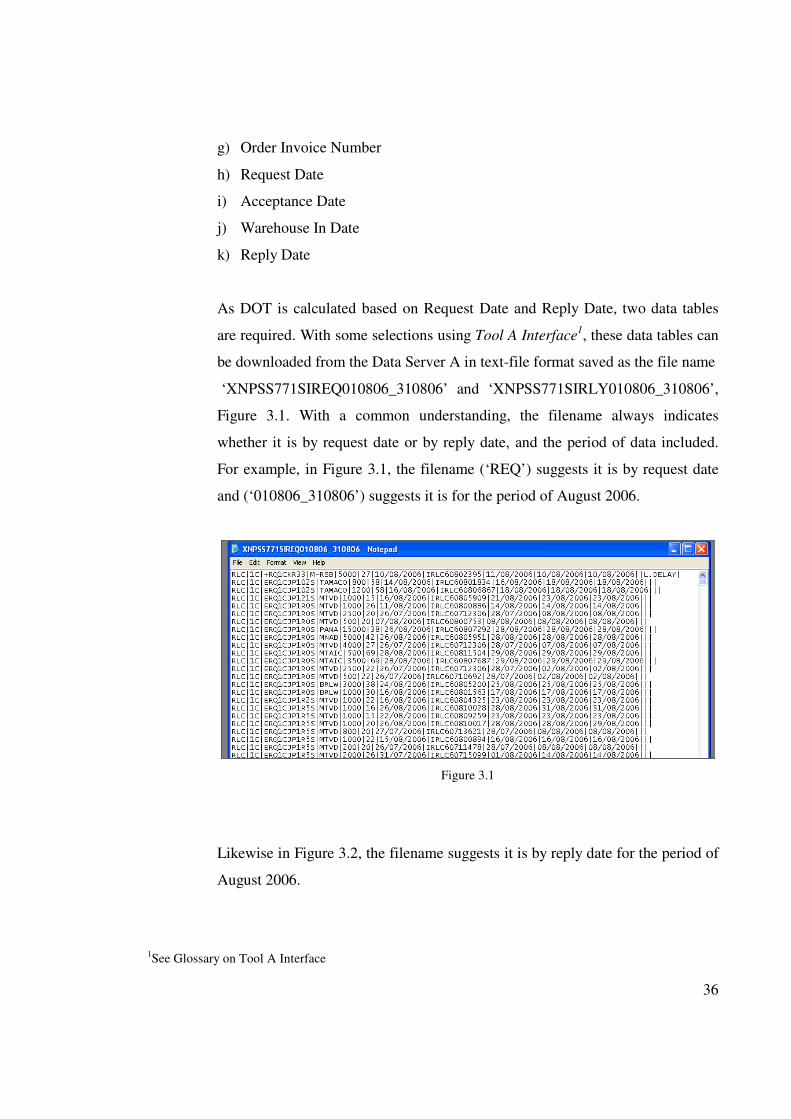
Likewise in Figure 3.2, the filename suggests it is by reply date for the period of
August 2006.
1See Glossary on Tool A Interface
37
Figure 3.2
This text-file data will then be transferred to the tables in the Microsoft Access
Database using the functions created. Always download the text-file DOT data
from the server before using the Microsoft Access Database.
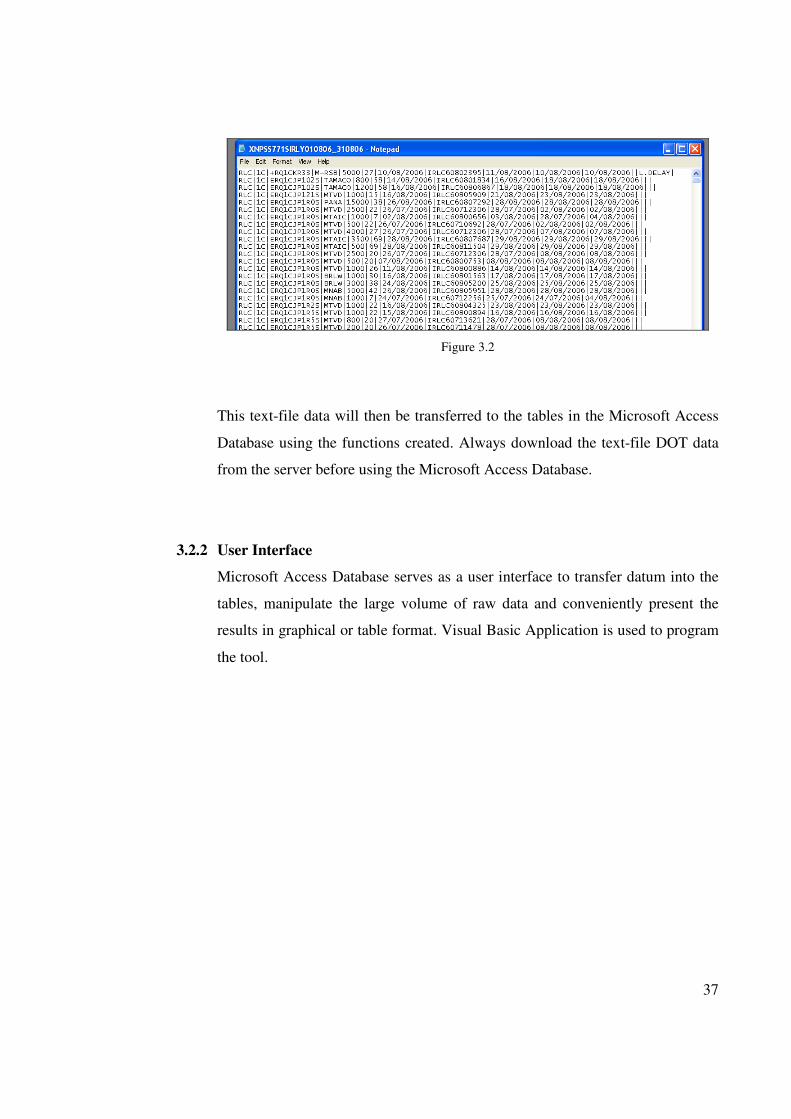
3.2.2 User Interface
Microsoft Access Database serves as a user interface to transfer datum into the
tables, manipulate the large volume of raw data and conveniently present the
results in graphical or table format. Visual Basic Application is used to program
the tool.
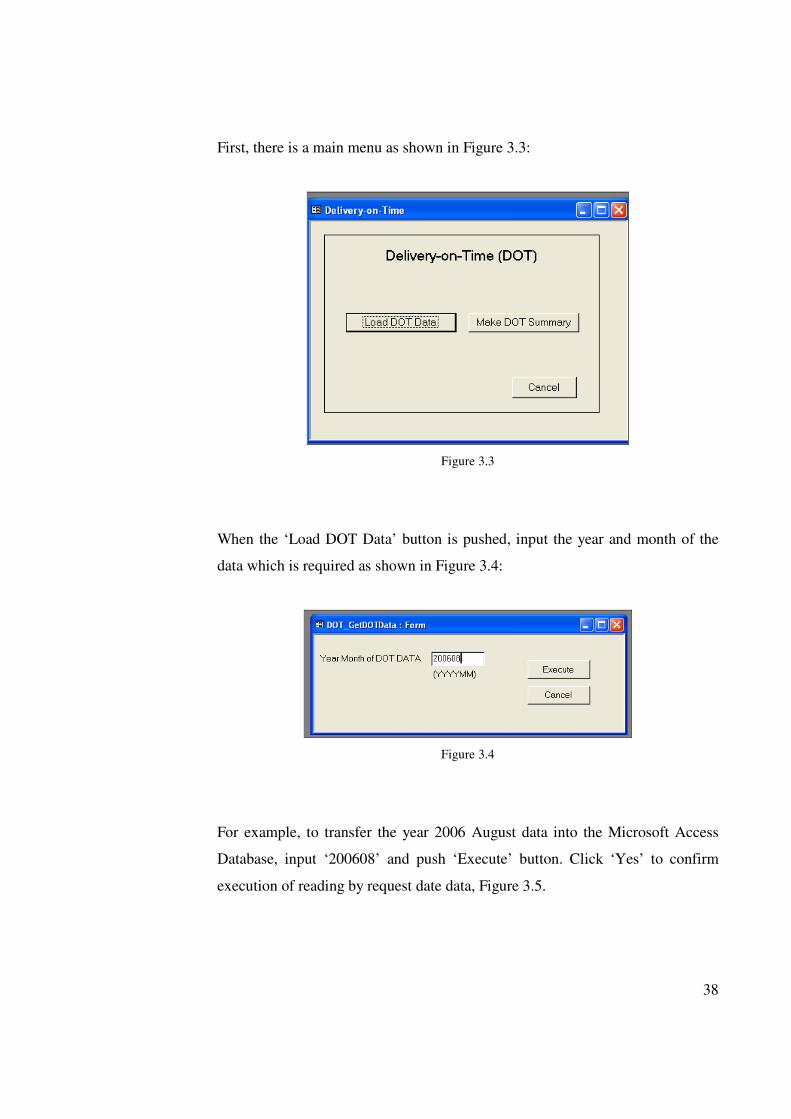
38
First, there is a main menu as shown in Figure 3.3:
Figure 3.3
When the ‘Load DOT Data’ button is pushed, input the year and month of the
data which is required as shown in Figure 3.4:
Figure 3.4
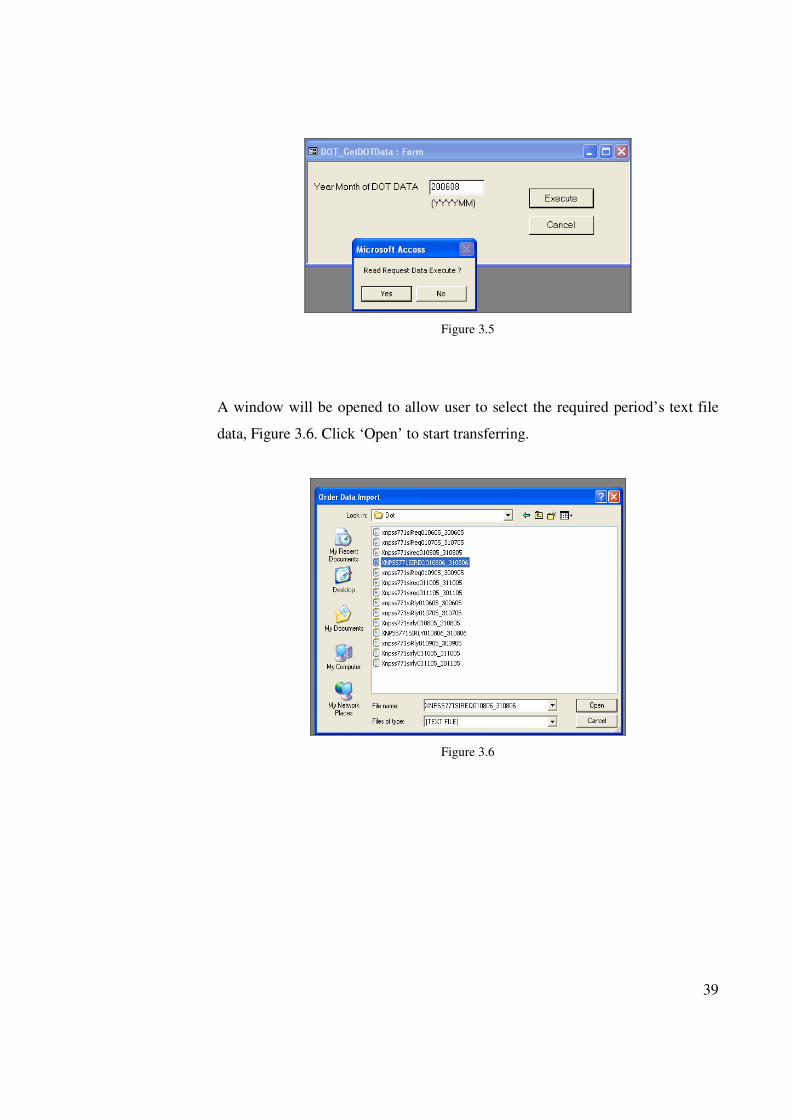
For example, to transfer the year 2006 August data into the Microsoft Access
Database, input ‘200608’ and push ‘Execute’ button. Click ‘Yes’ to confirm
execution of reading by request date data, Figure 3.5.
39
Figure 3.5
A window will be opened to allow user to select the required period’s text file
data, Figure 3.6. Click ‘Open’ to start transferring.
Figure 3.6
40
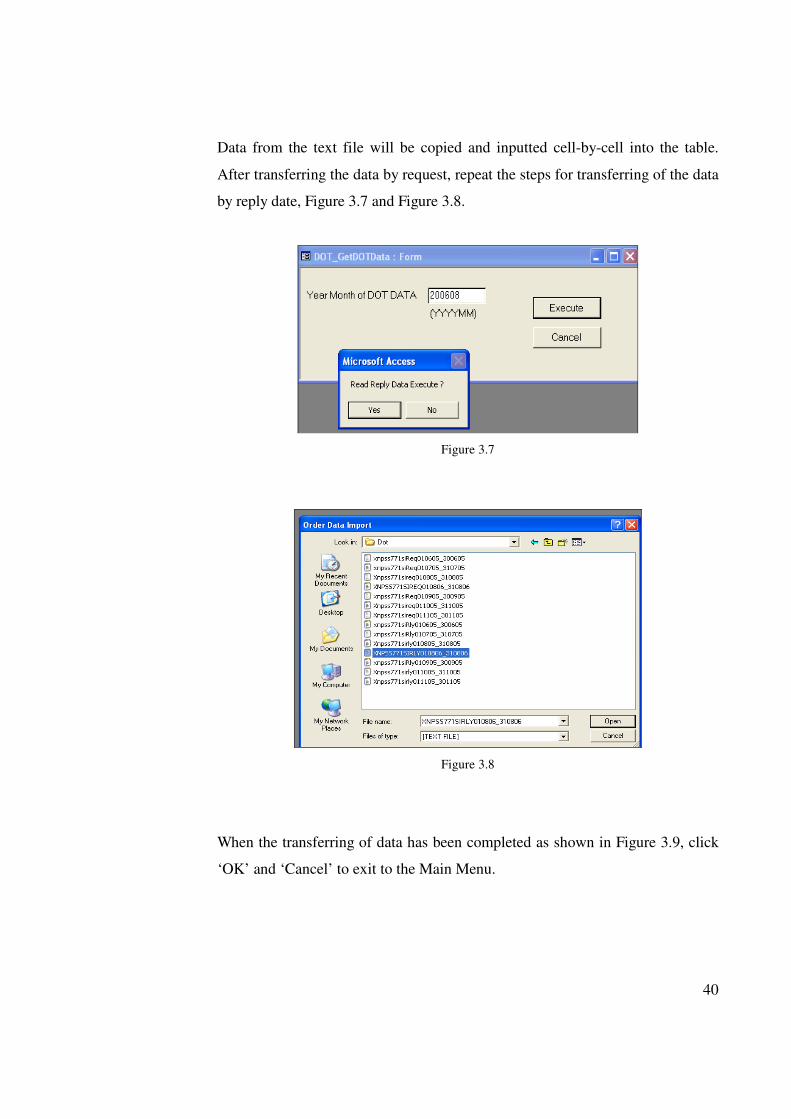
Data from the text file will be copied and inputted cell-by-cell into the table.
After transferring the data by request, repeat the steps for transferring of the data
by reply date, Figure 3.7 and Figure 3.8.
Figure 3.7
Figure 3.8
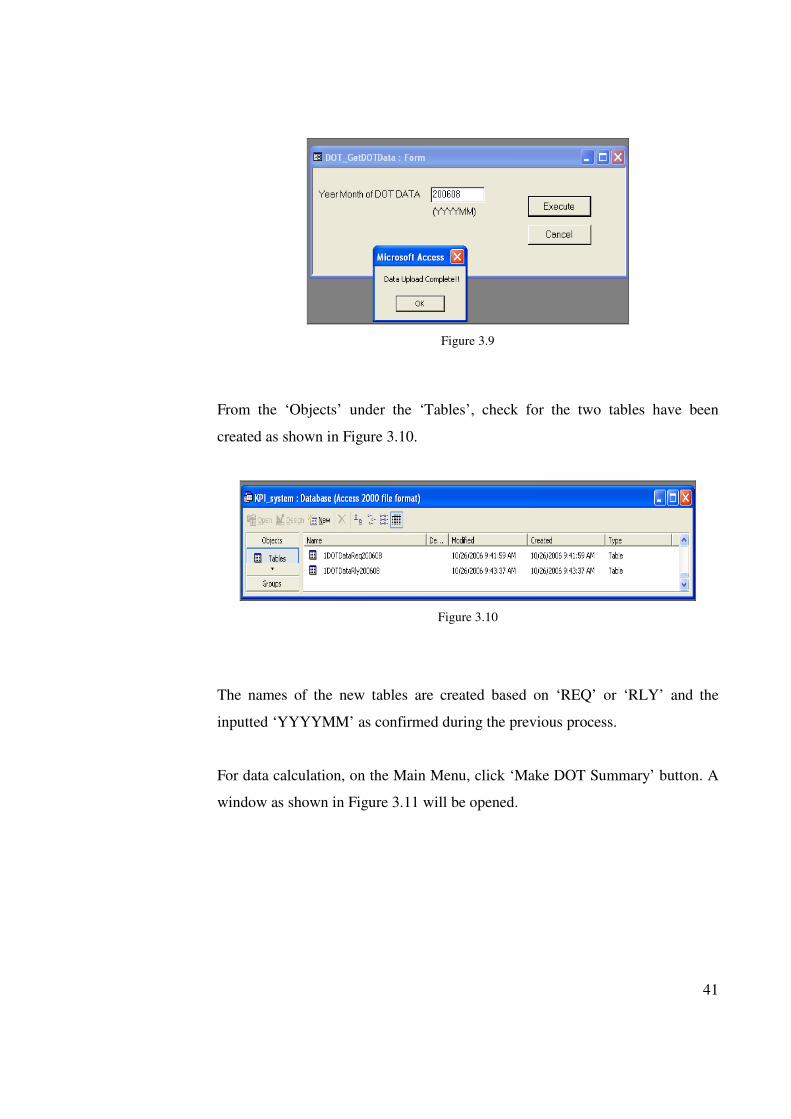
When the transferring of data has been completed as shown in Figure 3.9, click
‘OK’ and ‘Cancel’ to exit to the Main Menu.
41
Figure 3.9
From the ‘Objects’ under the ‘Tables’, check for the two tables have been
created as shown in Figure 3.10.
Figure 3.10
The names of the new tables are created based on ‘REQ’ or ‘RLY’ and the
inputted ‘YYYYMM’ as confirmed during the previous process.
For data calculation, on the Main Menu, click ‘Make DOT Summary’ button. A
window as shown in Figure 3.11 will be opened.
42
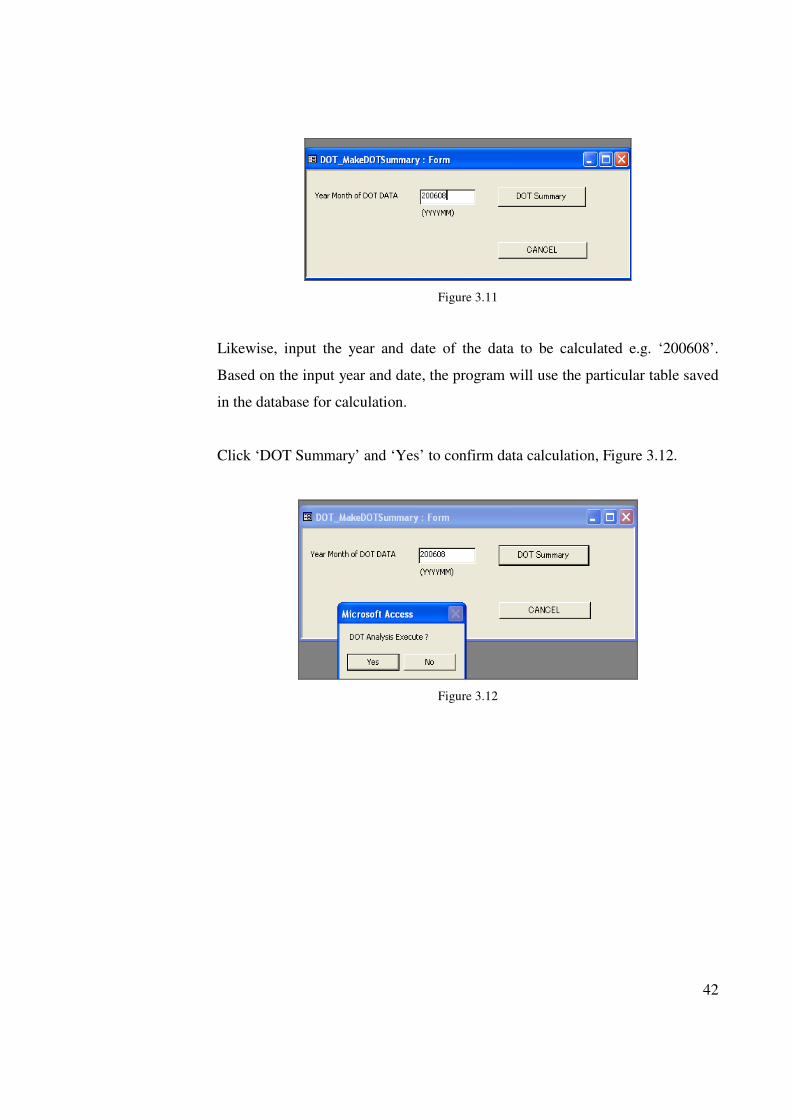
Figure 3.11
Likewise, input the year and date of the data to be calculated e.g. ‘200608’.
Based on the input year and date, the program will use the particular table saved
in the database for calculation.
Click ‘DOT Summary’ and ‘Yes’ to confirm data calculation, Figure 3.12.
Figure 3.12
43
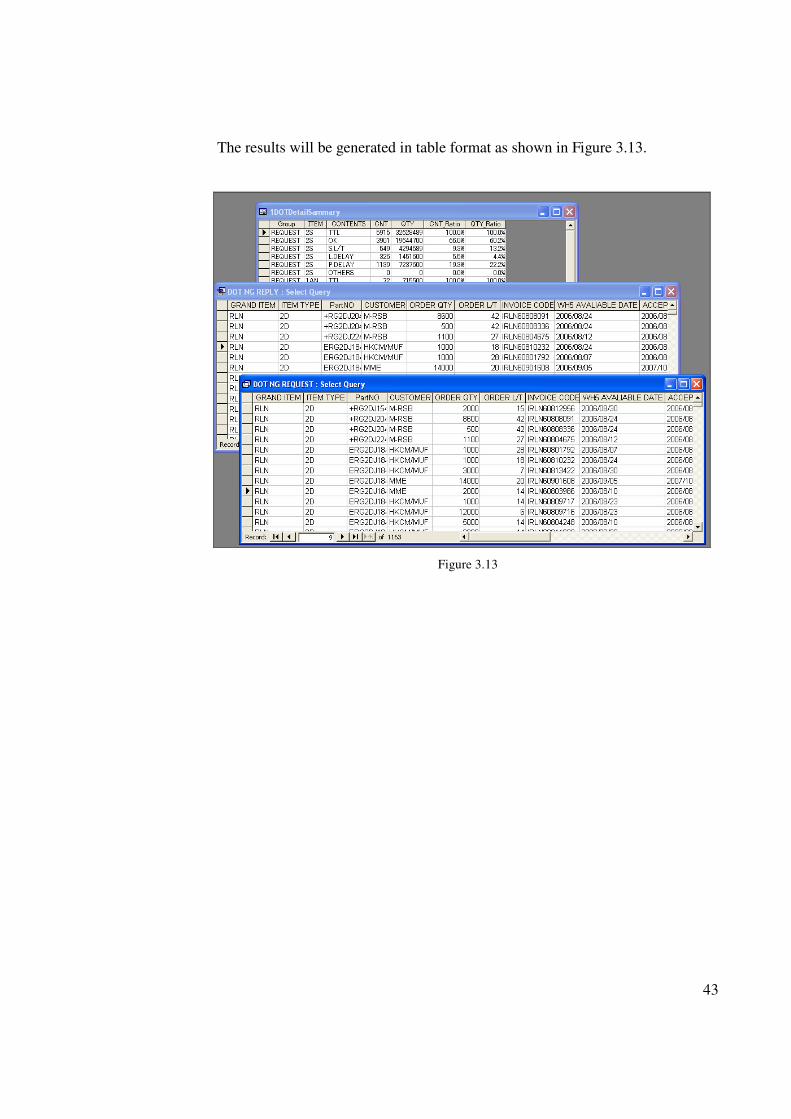
The results will be generated in table format as shown in Figure 3.13.
Figure 3.13
44
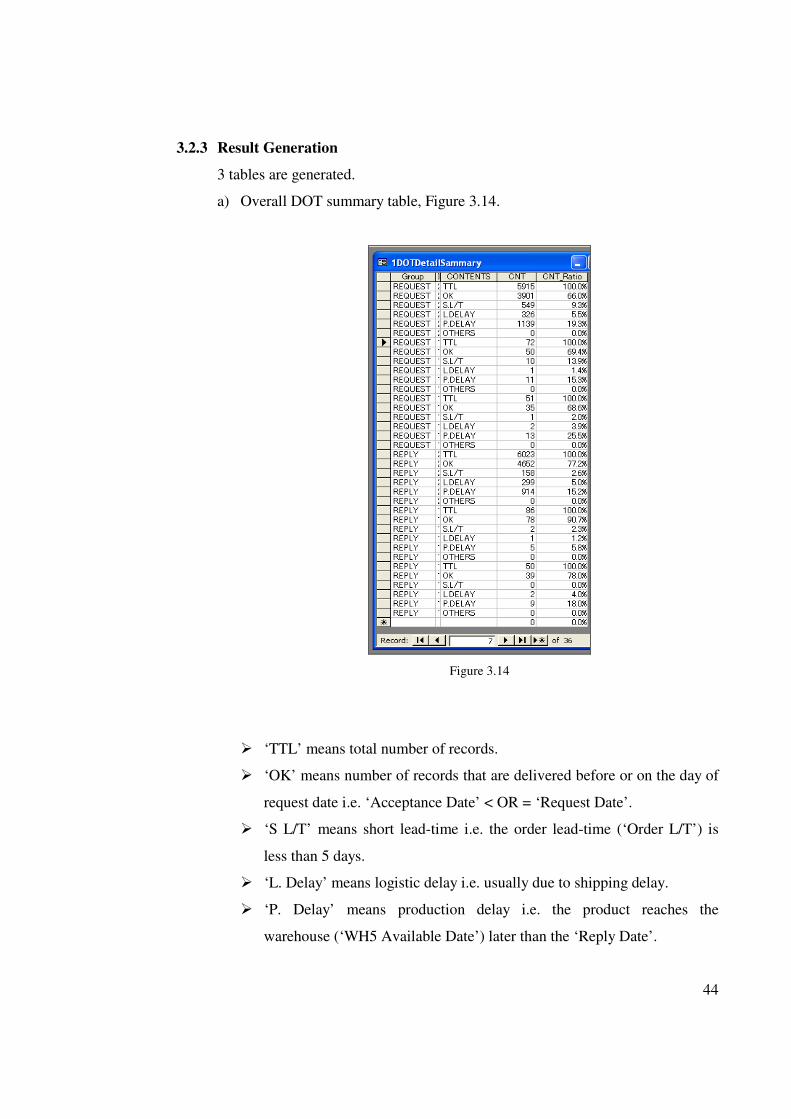
3.2.3 Result Generation
3 tables are generated.
a) Overall DOT summary table, Figure 3.14.
Figure 3.14
� ‘TTL’ means total number of records.
� ‘OK’ means number of records that are delivered before or on the day of
request date i.e. ‘Acceptance Date’ < OR = ‘Request Date’.
� ‘S L/T’ means short lead-time i.e. the order lead-time (‘Order L/T’) is
less than 5 days.
� ‘L. Delay’ means logistic delay i.e. usually due to shipping delay.
� ‘P. Delay’ means production delay i.e. the product reaches the
warehouse (‘WH5 Available Date’) later than the ‘Reply Date’.
45
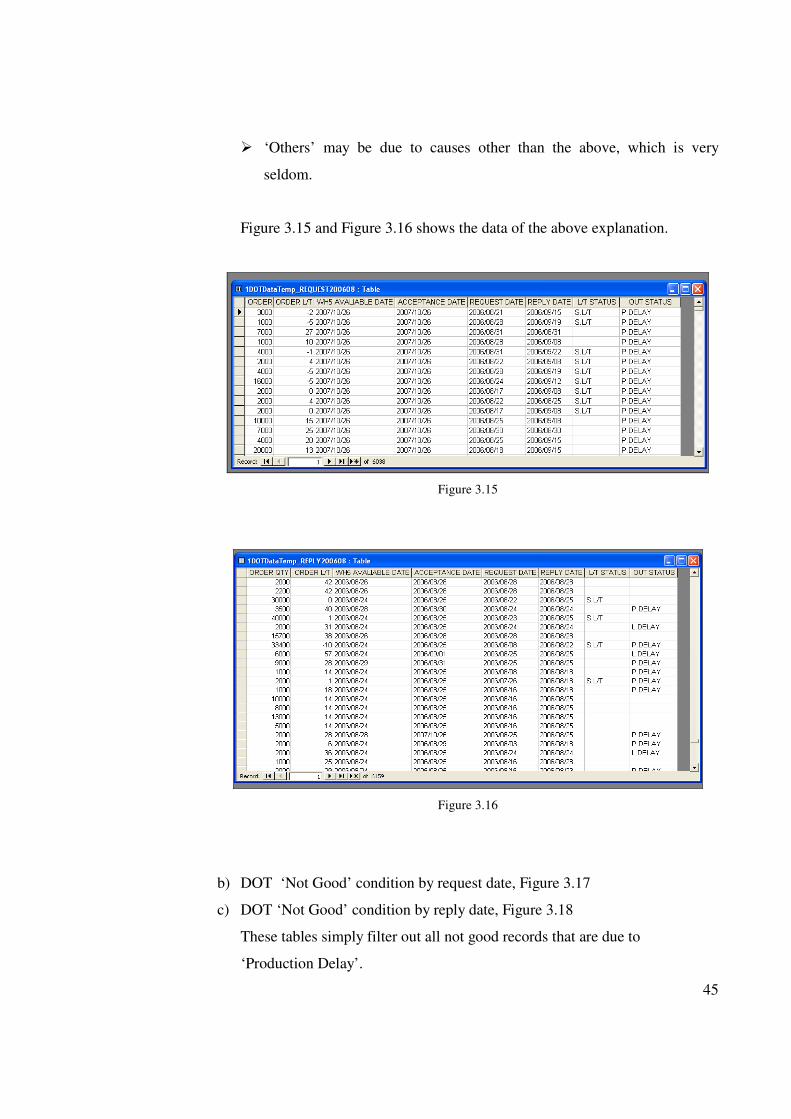
� ‘Others’ may be due to causes other than the above, which is very
seldom.
Figure 3.15 and Figure 3.16 shows the data of the above explanation.
Figure 3.15
Figure 3.16
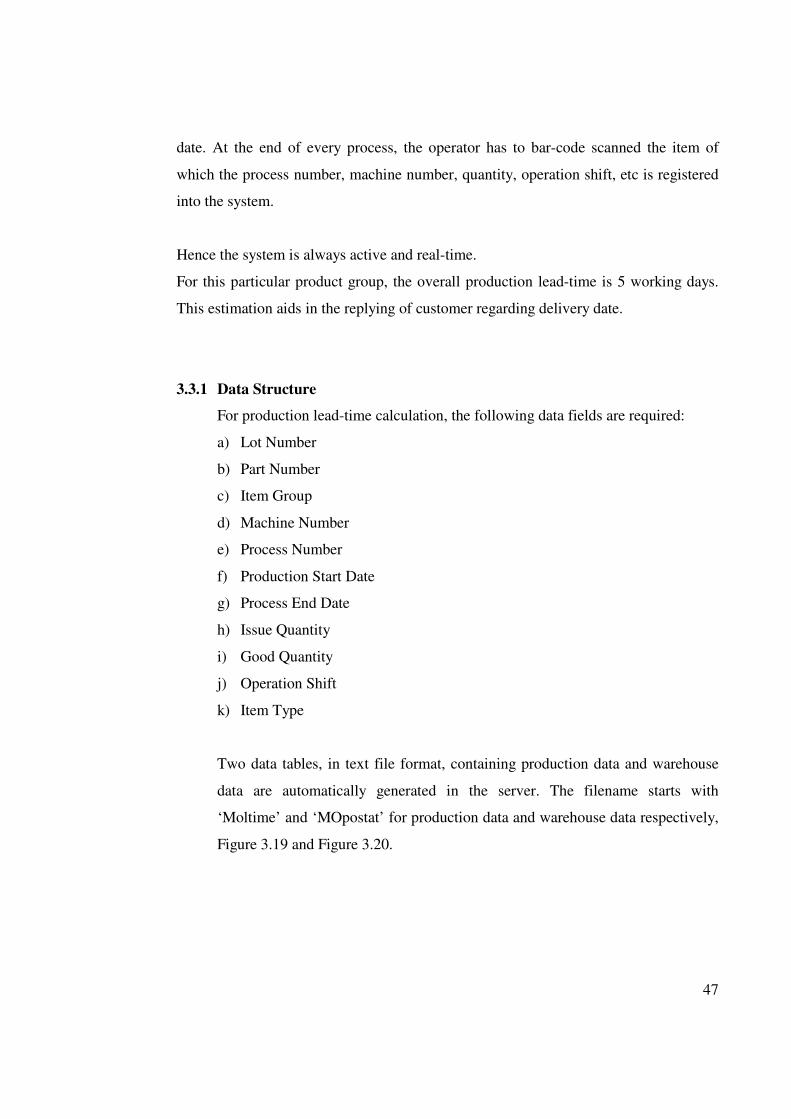
b) DOT ‘Not Good’ condition by request date, Figure 3.17
c) DOT ‘Not Good’ condition by reply date, Figure 3.18
These tables simply filter out all not good records that are due to
‘Production Delay’.
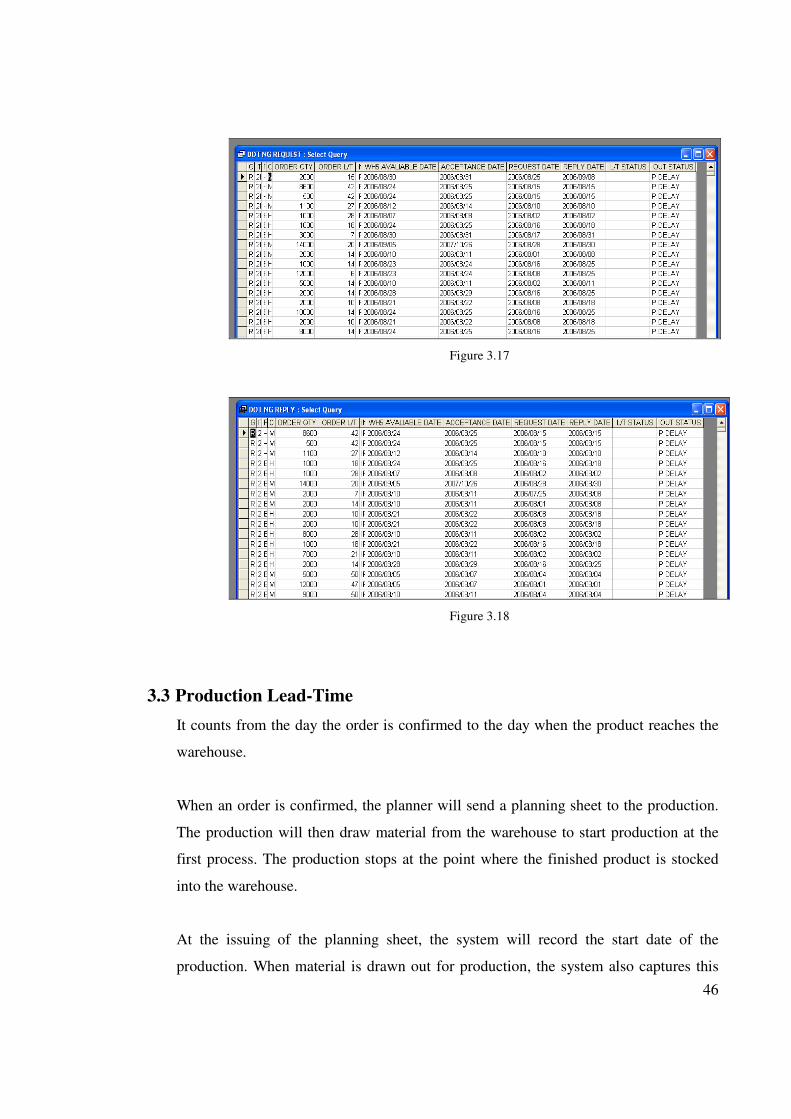
46
Figure 3.17
Figure 3.18
3.3 Production Lead-Time
It counts from the day the order is confirmed to the day when the product reaches the
warehouse.
When an order is confirmed, the planner will send a planning sheet to the production.
The production will then draw material from the warehouse to start production at the
first process. The production stops at the point where the finished product is stocked
into the warehouse.
At the issuing of the planning sheet, the system will record the start date of the
production. When material is drawn out for production, the system also captures this
47
date. At the end of every process, the operator has to bar-code scanned the item of
which the process number, machine number, quantity, operation shift, etc is registered
into the system.
Hence the system is always active and real-time.
For this particular product group, the overall production lead-time is 5 working days.
This estimation aids in the replying of customer regarding delivery date.
3.3.1 Data Structure
For production lead-time calculation, the following data fields are required:
a) Lot Number
b) Part Number
c) Item Group
d) Machine Number
e) Process Number
f) Production Start Date
g) Process End Date
h) Issue Quantity
i) Good Quantity
j) Operation Shift
k) Item Type
Two data tables, in text file format, containing production data and warehouse
data are automatically generated in the server. The filename starts with
‘Moltime’ and ‘MOpostat’ for production data and warehouse data respectively,
Figure 3.19 and Figure 3.20.
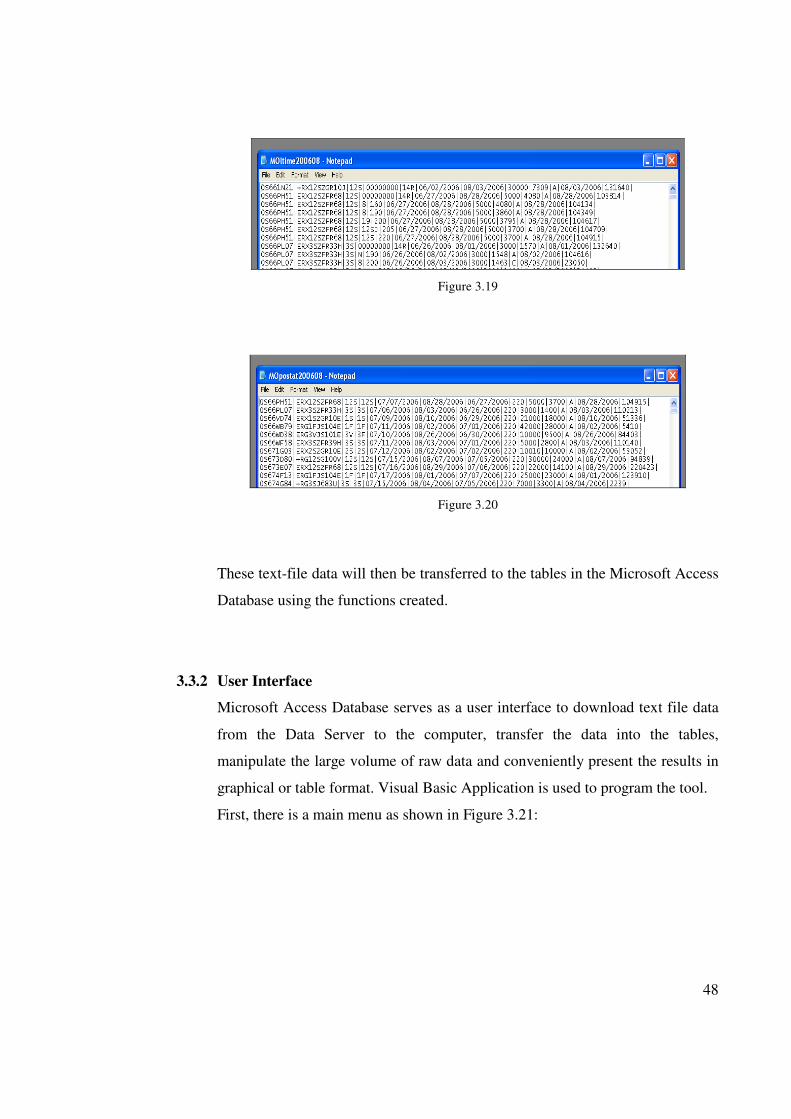
48
Figure 3.19
Figure 3.20
These text-file data will then be transferred to the tables in the Microsoft Access
Database using the functions created.
3.3.2 User Interface
Microsoft Access Database serves as a user interface to download text file data
from the Data Server to the computer, transfer the data into the tables,
manipulate the large volume of raw data and conveniently present the results in
graphical or table format. Visual Basic Application is used to program the tool.
First, there is a main menu as shown in Figure 3.21:
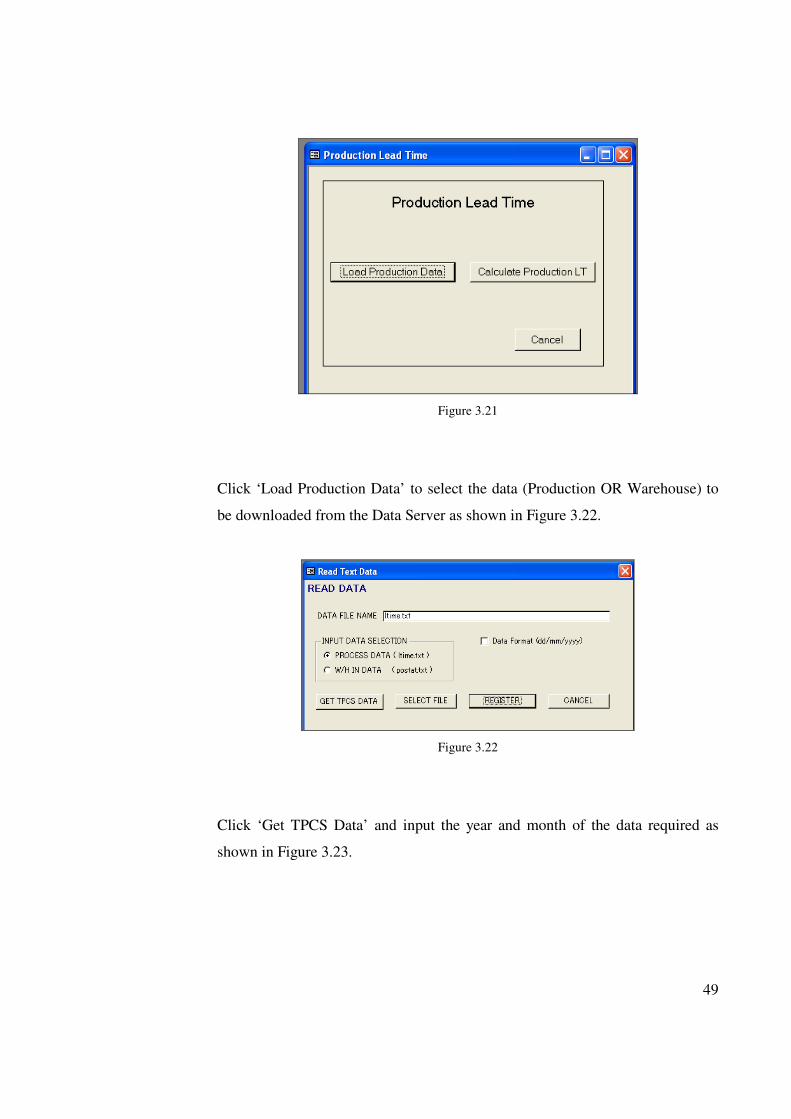
49
Figure 3.21
Click ‘Load Production Data’ to select the data (Production OR Warehouse) to
be downloaded from the Data Server as shown in Figure 3.22.
Figure 3.22
Click ‘Get TPCS Data’ and input the year and month of the data required as
shown in Figure 3.23.
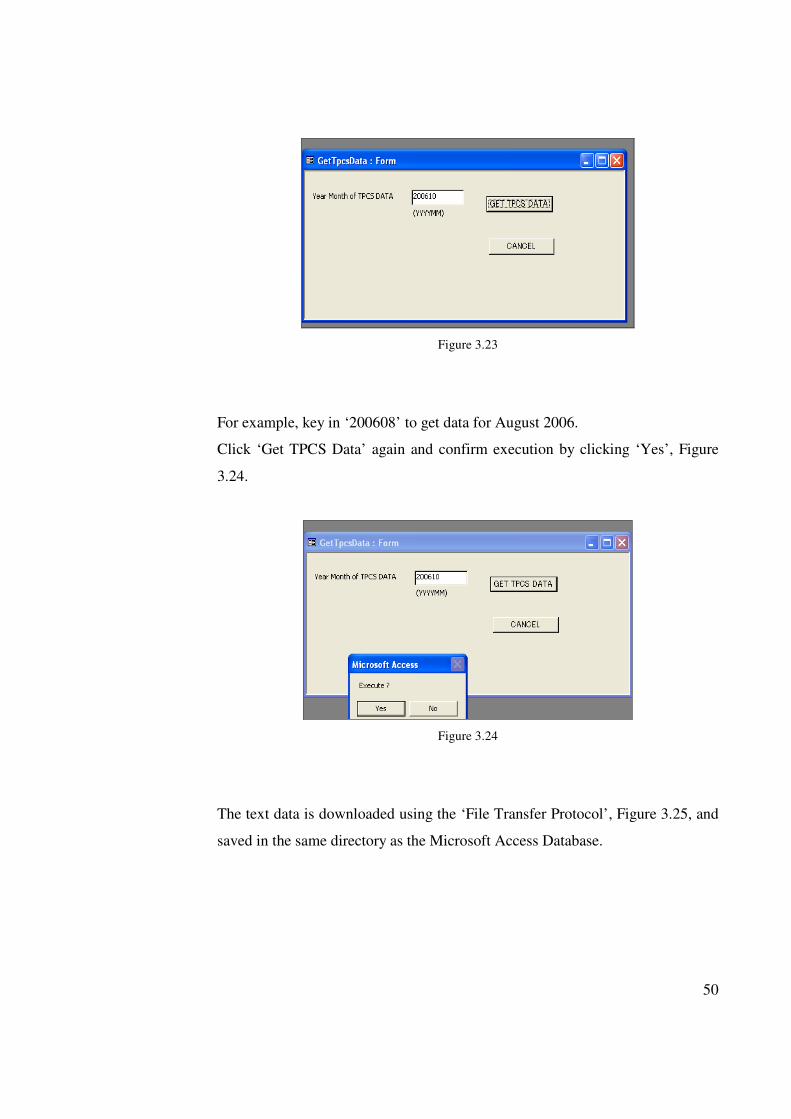
50
Figure 3.23
For example, key in ‘200608’ to get data for August 2006.
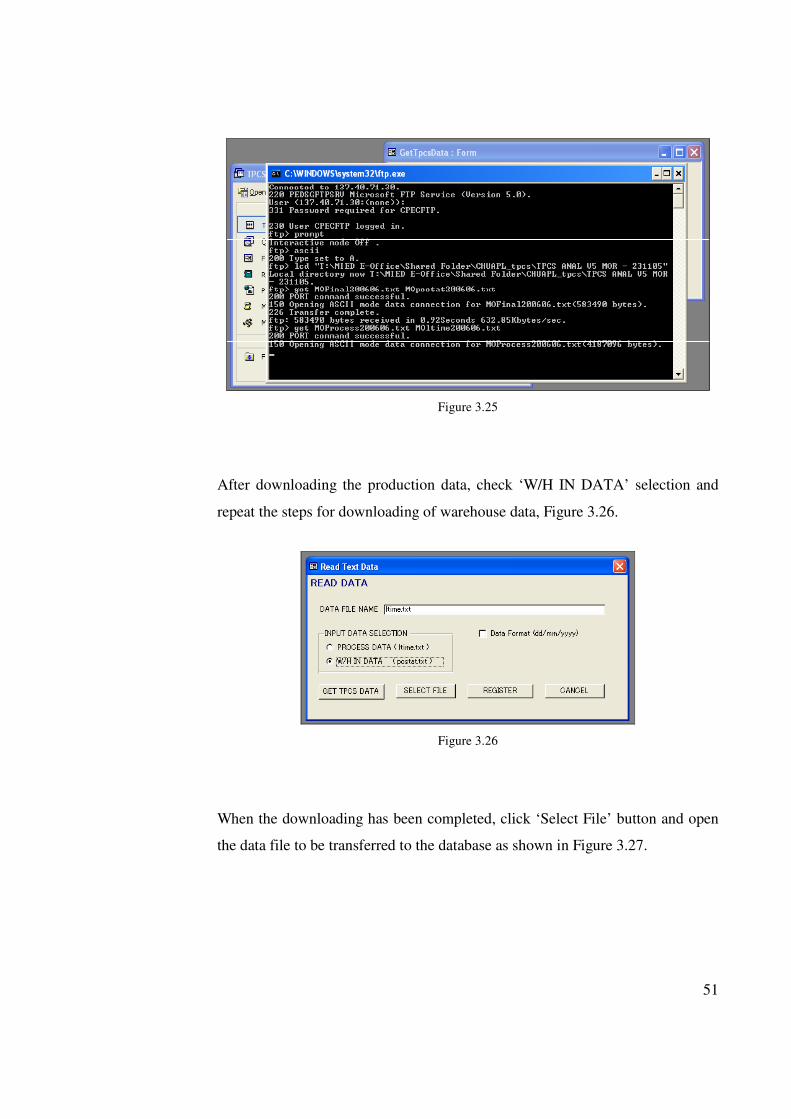
Click ‘Get TPCS Data’ again and confirm execution by clicking ‘Yes’, Figure
3.24.
Figure 3.24
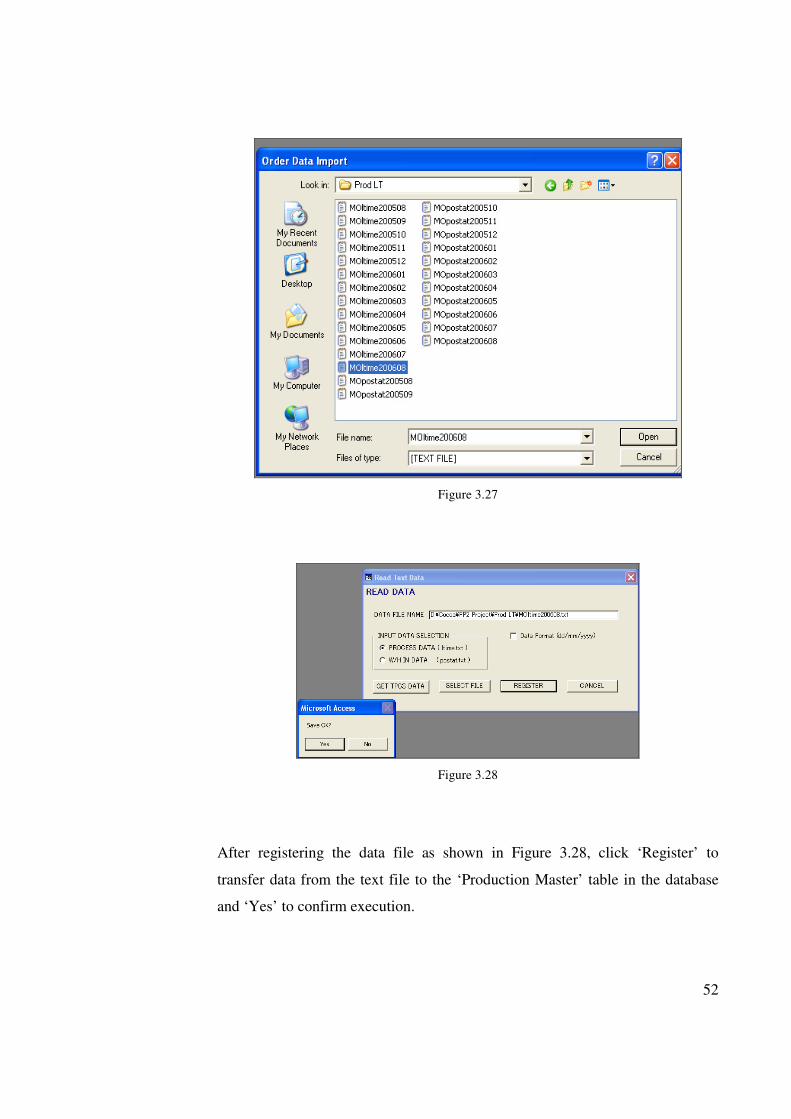
The text data is downloaded using the ‘File Transfer Protocol’, Figure 3.25, and
saved in the same directory as the Microsoft Access Database.
51
Figure 3.25
After downloading the production data, check ‘W/H IN DATA’ selection and
repeat the steps for downloading of warehouse data, Figure 3.26.
Figure 3.26
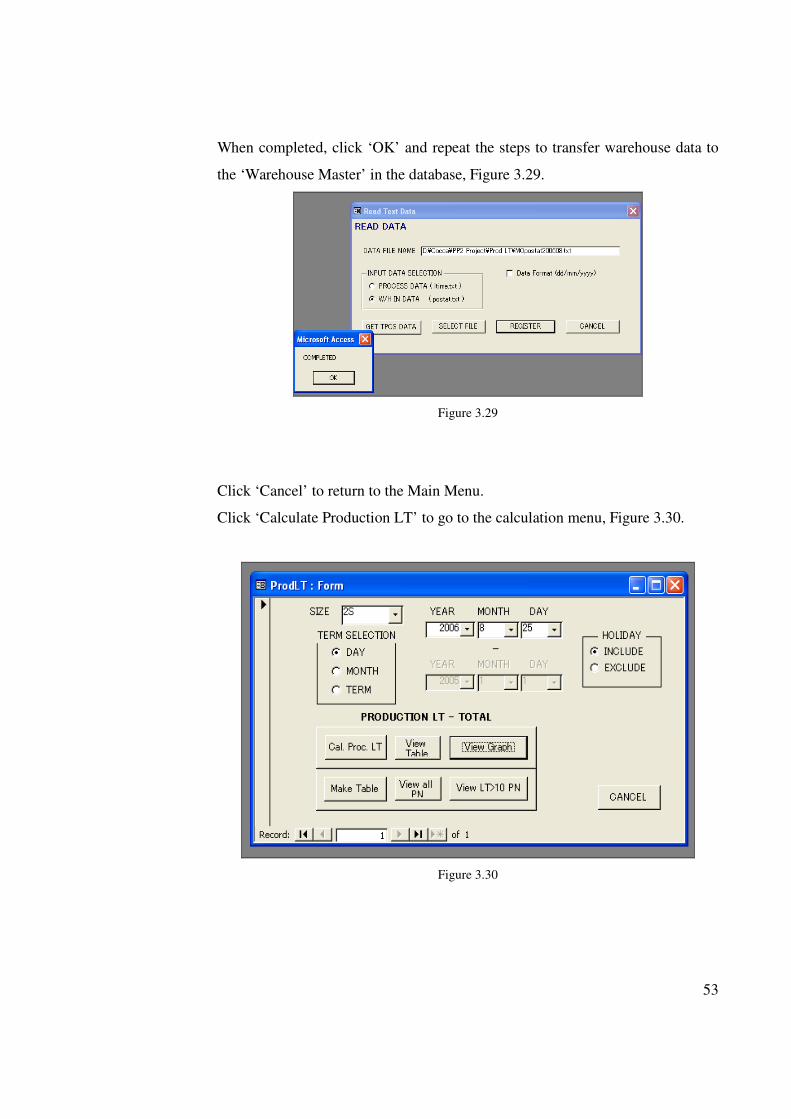
When the downloading has been completed, click ‘Select File’ button and open
the data file to be transferred to the database as shown in Figure 3.27.
52
Figure 3.27
Figure 3.28
After registering the data file as shown in Figure 3.28, click ‘Register’ to
transfer data from the text file to the ‘Production Master’ table in the database
and ‘Yes’ to confirm execution.
53
When completed, click ‘OK’ and repeat the steps to transfer warehouse data to
the ‘Warehouse Master’ in the database, Figure 3.29.
Figure 3.29
Click ‘Cancel’ to return to the Main Menu.
Click ‘Calculate Production LT’ to go to the calculation menu, Figure 3.30.
Figure 3.30
54
In order to calculate the production lead-time, some selections need to be
completed:
a) Product Group
b) Term Selection, i.e. data for a one day, one month or for a specified period.
c) Holidays included or excluded, i.e. to consider working or non-working
days only.
When the selections have completed, click ‘Cal. Proc. LT’ button to generate
the calculation. When the calculation has been completed, click ‘View Graph’
to display the result.
To view the products that has lead-time more than 10 days, click ‘Make Table’
and ‘View LT>10 PN’.
More details on the results will be presented in 3.3.3 Result Generation.
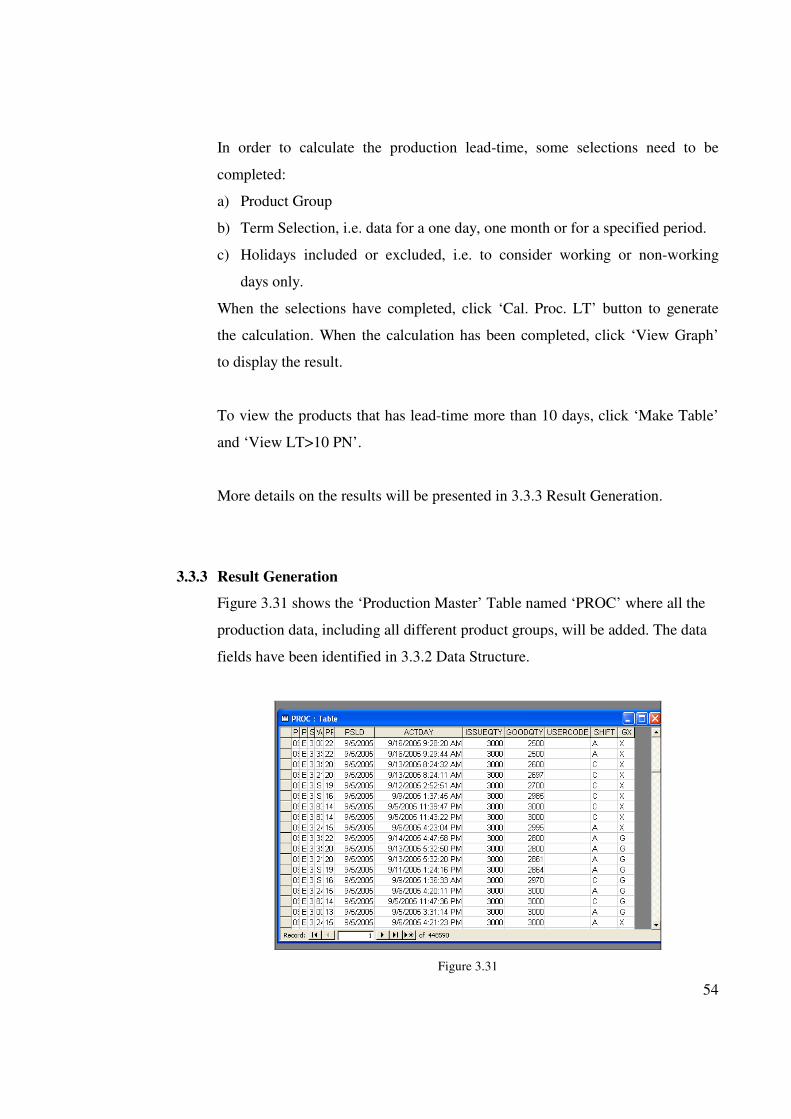
3.3.3 Result Generation
Figure 3.31 shows the ‘Production Master’ Table named ‘PROC’ where all the
production data, including all different product groups, will be added. The data
fields have been identified in 3.3.2 Data Structure.
Figure 3.31
55
Every record is a transaction on the completion of one process.
Hence, for every product lot, the production lead-time will be from the date of
withdrawing the material to the date of last process.
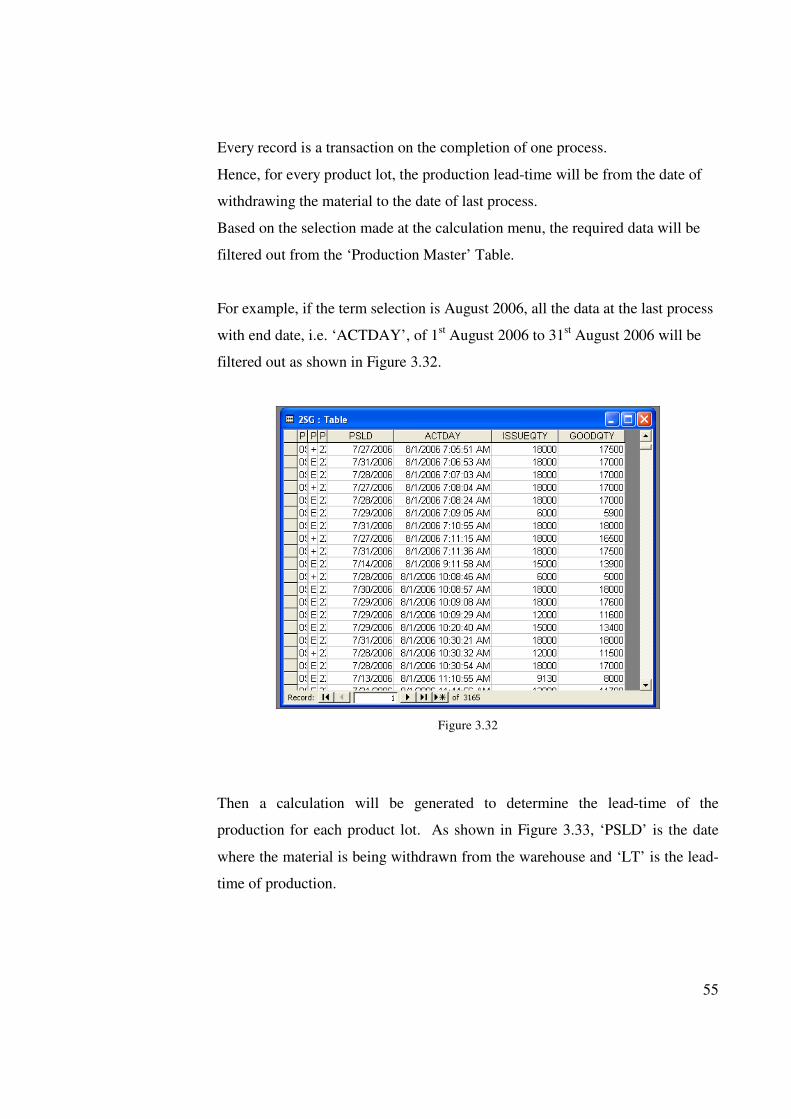
Based on the selection made at the calculation menu, the required data will be
filtered out from the ‘Production Master’ Table.
For example, if the term selection is August 2006, all the data at the last process
with end date, i.e. ‘ACTDAY’, of 1st August 2006 to 31
st August 2006 will be
filtered out as shown in Figure 3.32.
Figure 3.32
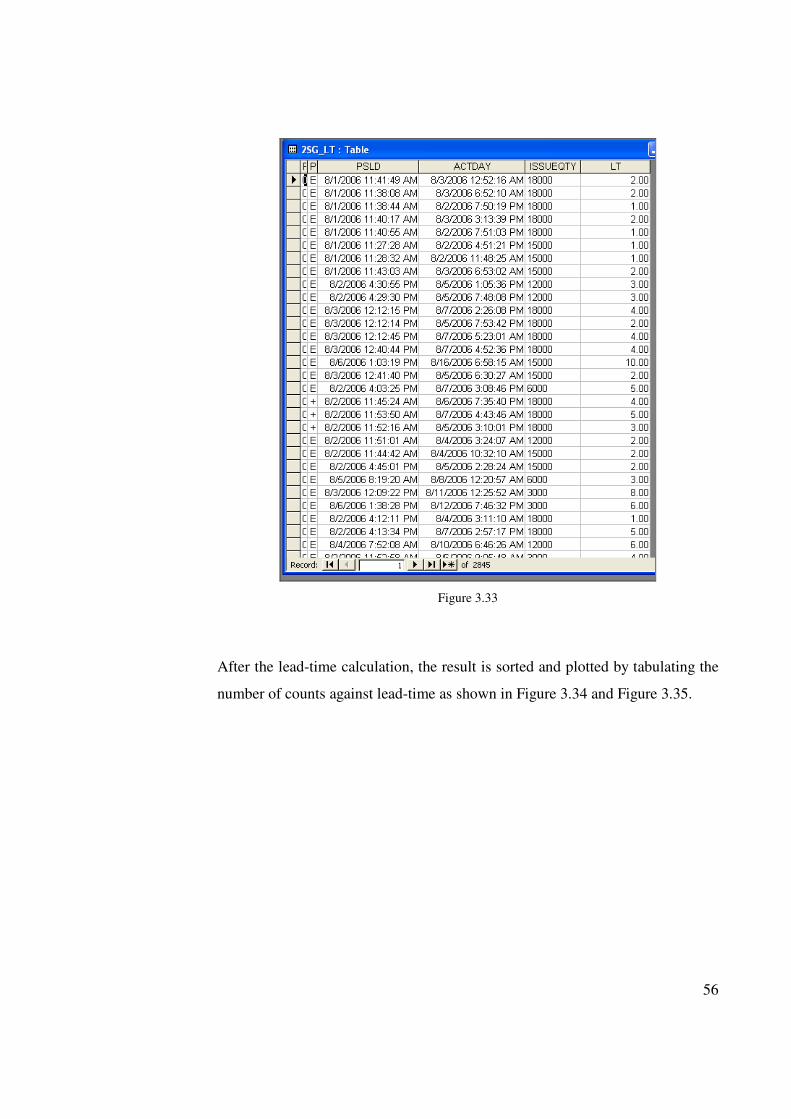
Then a calculation will be generated to determine the lead-time of the
production for each product lot. As shown in Figure 3.33, ‘PSLD’ is the date
where the material is being withdrawn from the warehouse and ‘LT’ is the lead-
time of production.
56
Figure 3.33
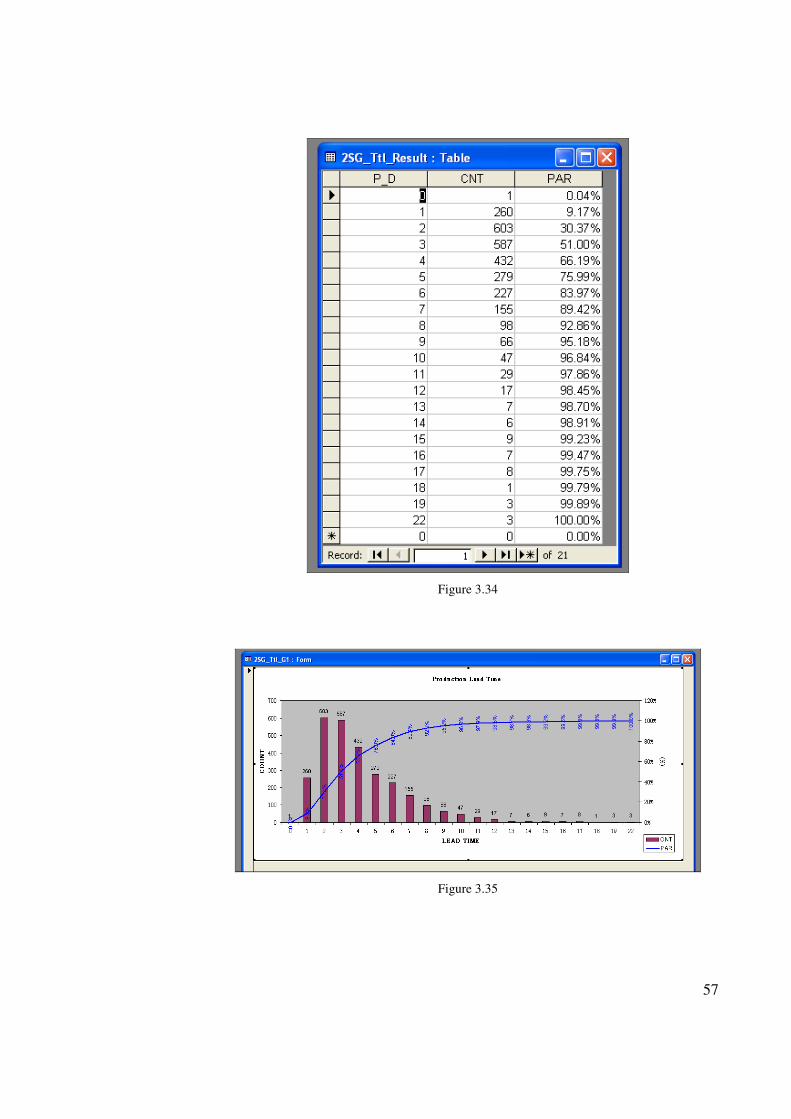
After the lead-time calculation, the result is sorted and plotted by tabulating the
number of counts against lead-time as shown in Figure 3.34 and Figure 3.35.
57
Figure 3.34
Figure 3.35
58
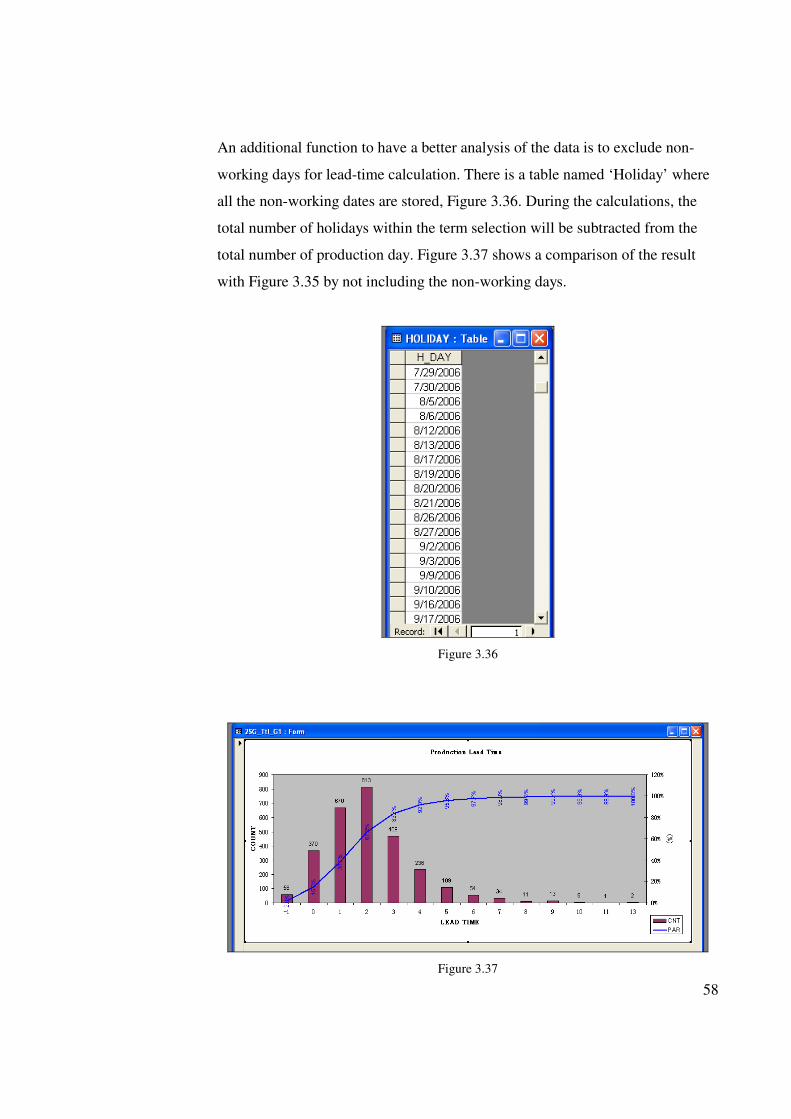
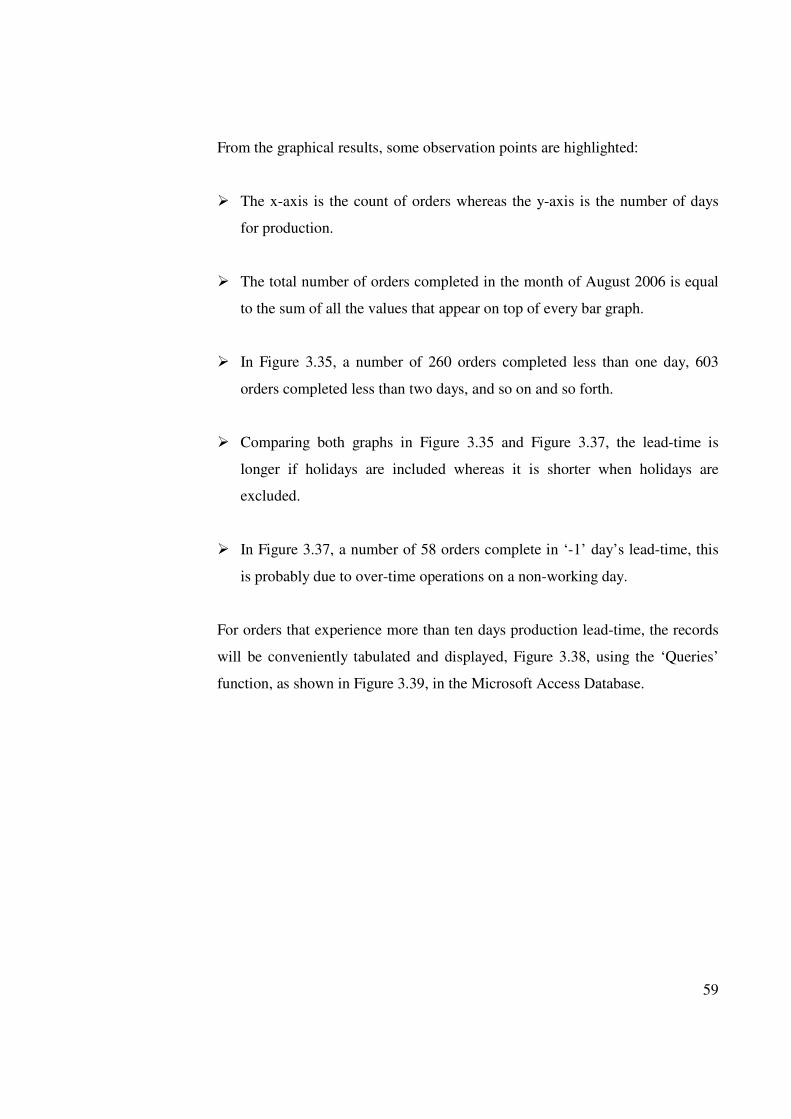
An additional function to have a better analysis of the data is to exclude non-
working days for lead-time calculation. There is a table named ‘Holiday’ where
all the non-working dates are stored, Figure 3.36. During the calculations, the
total number of holidays within the term selection will be subtracted from the
total number of production day. Figure 3.37 shows a comparison of the result
with Figure 3.35 by not including the non-working days.
Figure 3.36
Figure 3.37
59
From the graphical results, some observation points are highlighted:
� The x-axis is the count of orders whereas the y-axis is the number of days
for production.
� The total number of orders completed in the month of August 2006 is equal
to the sum of all the values that appear on top of every bar graph.
� In Figure 3.35, a number of 260 orders completed less than one day, 603
orders completed less than two days, and so on and so forth.
� Comparing both graphs in Figure 3.35 and Figure 3.37, the lead-time is
longer if holidays are included whereas it is shorter when holidays are
excluded.
� In Figure 3.37, a number of 58 orders complete in ‘-1’ day’s lead-time, this
is probably due to over-time operations on a non-working day.
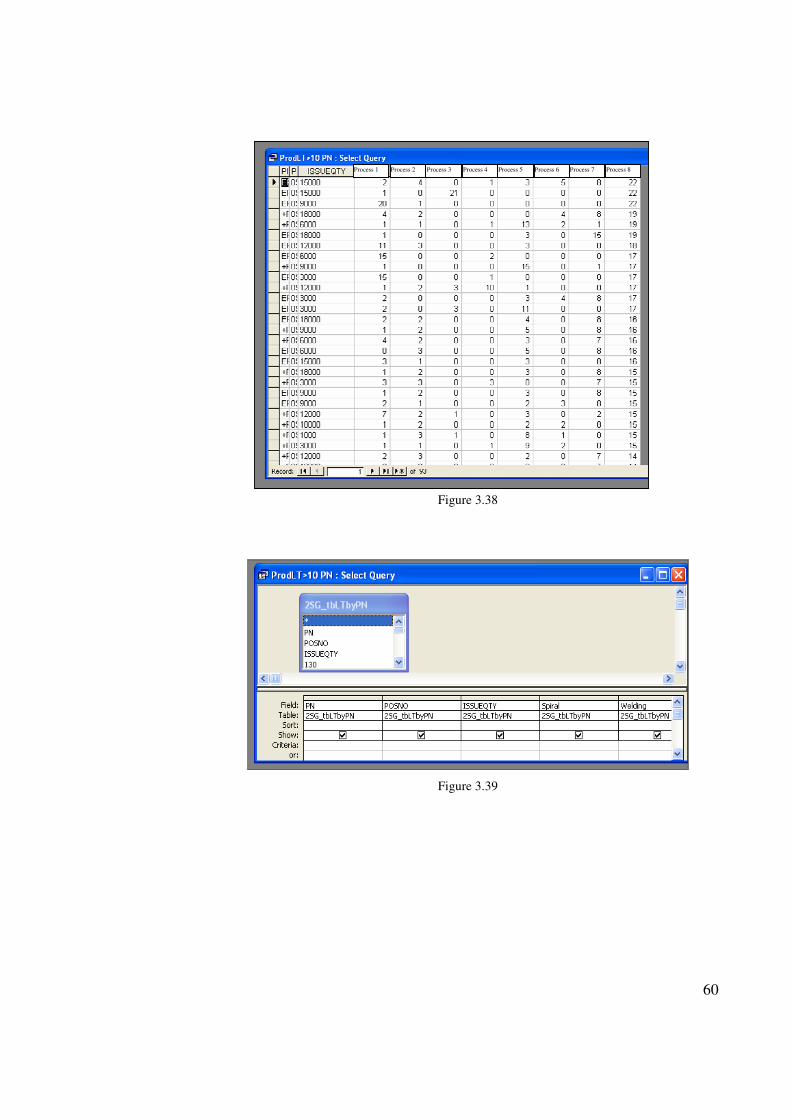
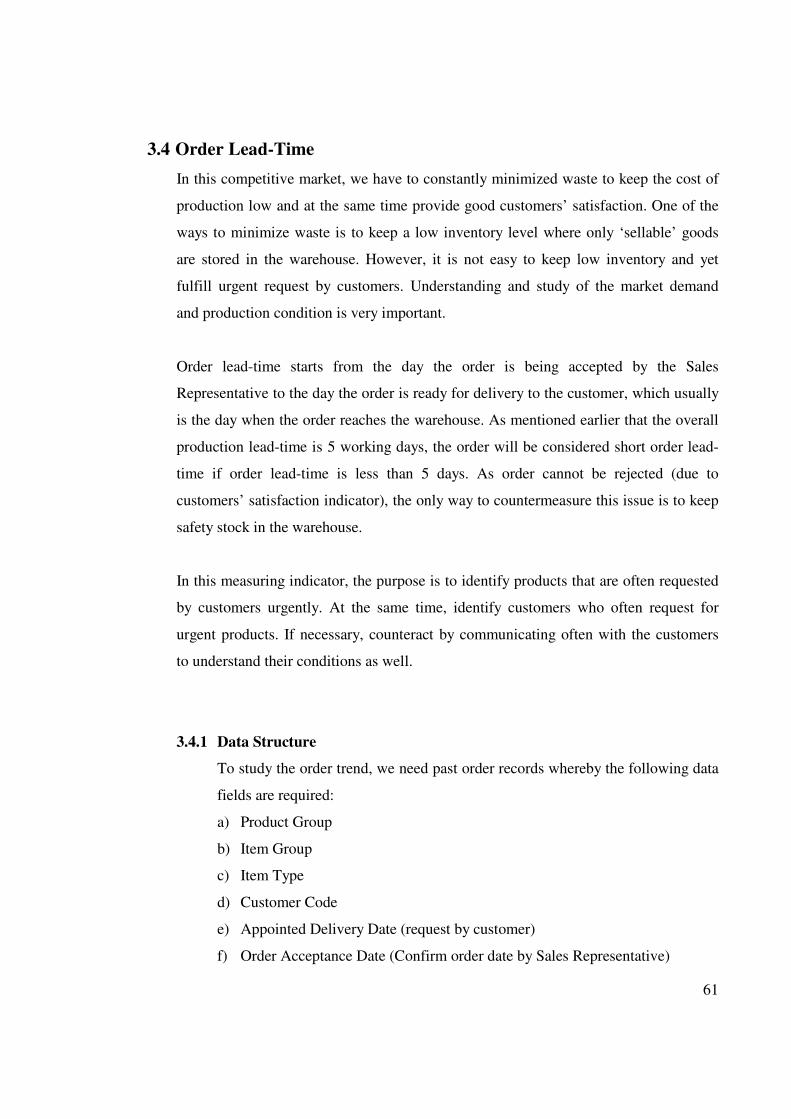
For orders that experience more than ten days production lead-time, the records
will be conveniently tabulated and displayed, Figure 3.38, using the ‘Queries’
function, as shown in Figure 3.39, in the Microsoft Access Database.
60
Figure 3.38
Figure 3.39
Process 1 Process 2 Process 3 Process 4 Process 5 Process 6 Process 7 Process 8
61
3.4 Order Lead-Time
In this competitive market, we have to constantly minimized waste to keep the cost of
production low and at the same time provide good customers’ satisfaction. One of the
ways to minimize waste is to keep a low inventory level where only ‘sellable’ goods
are stored in the warehouse. However, it is not easy to keep low inventory and yet
fulfill urgent request by customers. Understanding and study of the market demand
and production condition is very important.
Order lead-time starts from the day the order is being accepted by the Sales
Representative to the day the order is ready for delivery to the customer, which usually
is the day when the order reaches the warehouse. As mentioned earlier that the overall
production lead-time is 5 working days, the order will be considered short order lead-
time if order lead-time is less than 5 days. As order cannot be rejected (due to
customers’ satisfaction indicator), the only way to countermeasure this issue is to keep
safety stock in the warehouse.
In this measuring indicator, the purpose is to identify products that are often requested
by customers urgently. At the same time, identify customers who often request for
urgent products. If necessary, counteract by communicating often with the customers
to understand their conditions as well.
3.4.1 Data Structure
To study the order trend, we need past order records whereby the following data
fields are required:
a) Product Group
b) Item Group
c) Item Type
d) Customer Code
e) Appointed Delivery Date (request by customer)
f) Order Acceptance Date (Confirm order date by Sales Representative)
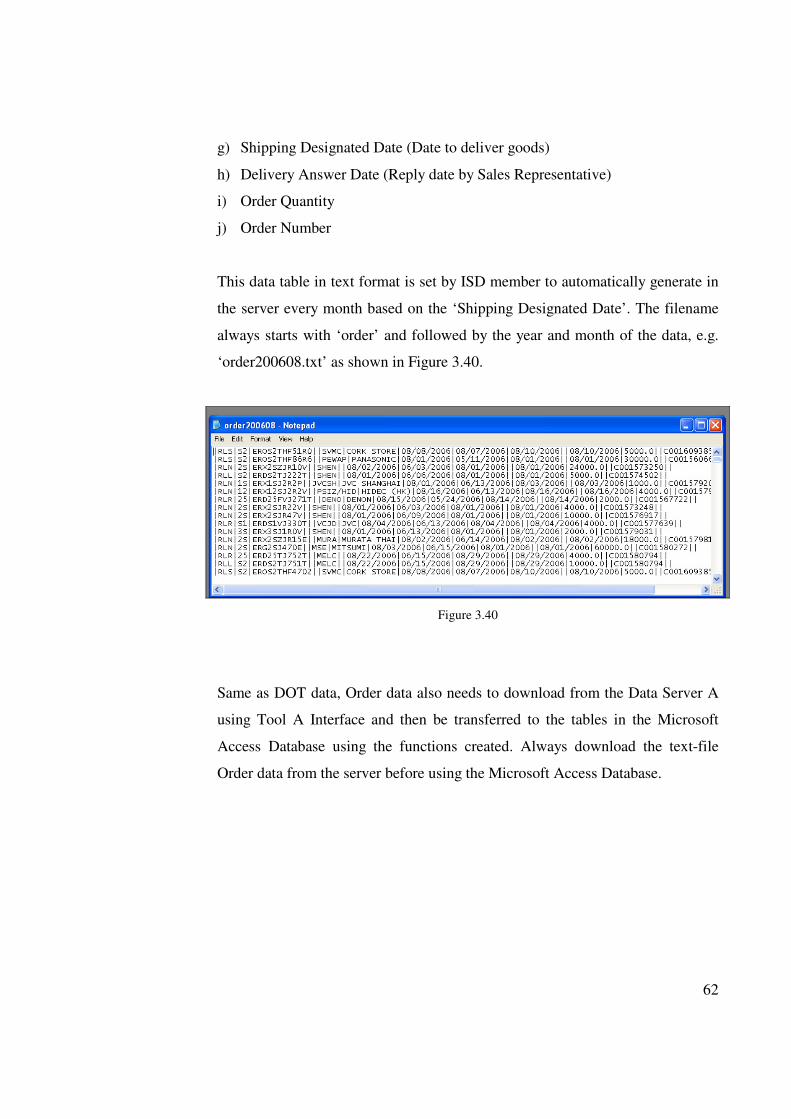
62
g) Shipping Designated Date (Date to deliver goods)
h) Delivery Answer Date (Reply date by Sales Representative)
i) Order Quantity
j) Order Number
This data table in text format is set by ISD member to automatically generate in
the server every month based on the ‘Shipping Designated Date’. The filename
always starts with ‘order’ and followed by the year and month of the data, e.g.
‘order200608.txt’ as shown in Figure 3.40.
Figure 3.40
Same as DOT data, Order data also needs to download from the Data Server A
using Tool A Interface and then be transferred to the tables in the Microsoft
Access Database using the functions created. Always download the text-file
Order data from the server before using the Microsoft Access Database.
63
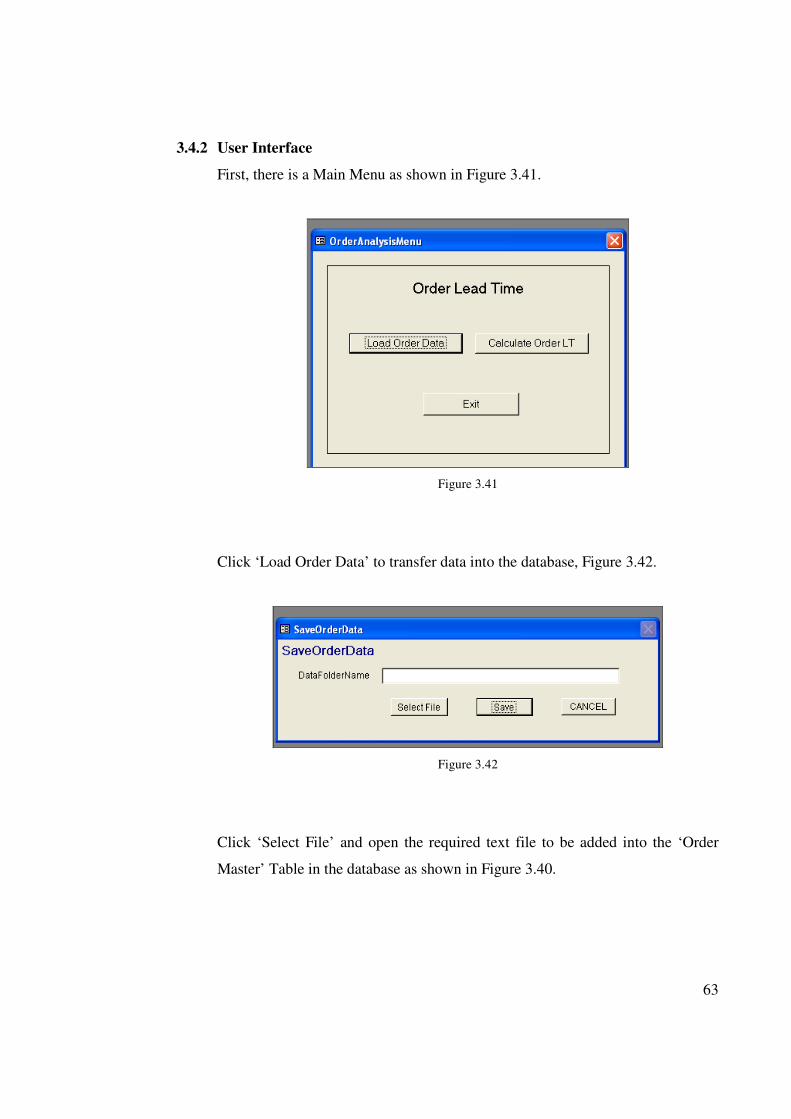
3.4.2 User Interface
First, there is a Main Menu as shown in Figure 3.41.
Figure 3.41
Click ‘Load Order Data’ to transfer data into the database, Figure 3.42.
Figure 3.42
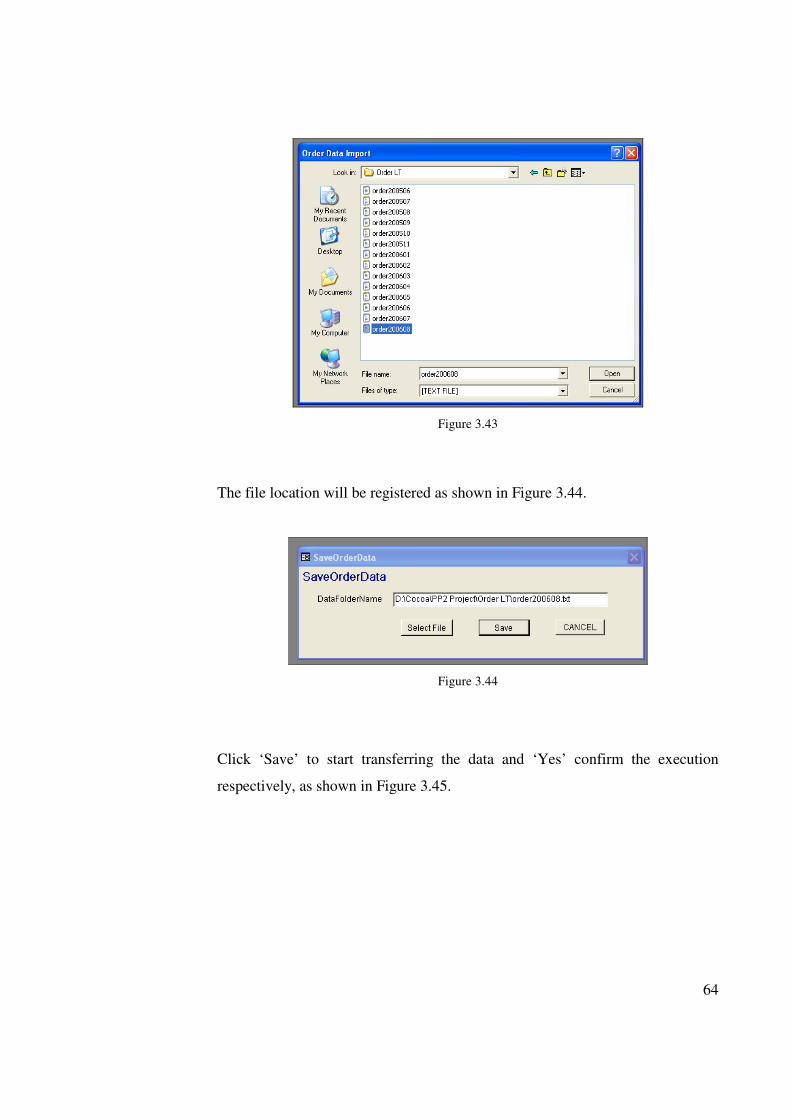
Click ‘Select File’ and open the required text file to be added into the ‘Order
Master’ Table in the database as shown in Figure 3.40.
64
Figure 3.43
The file location will be registered as shown in Figure 3.44.
Figure 3.44
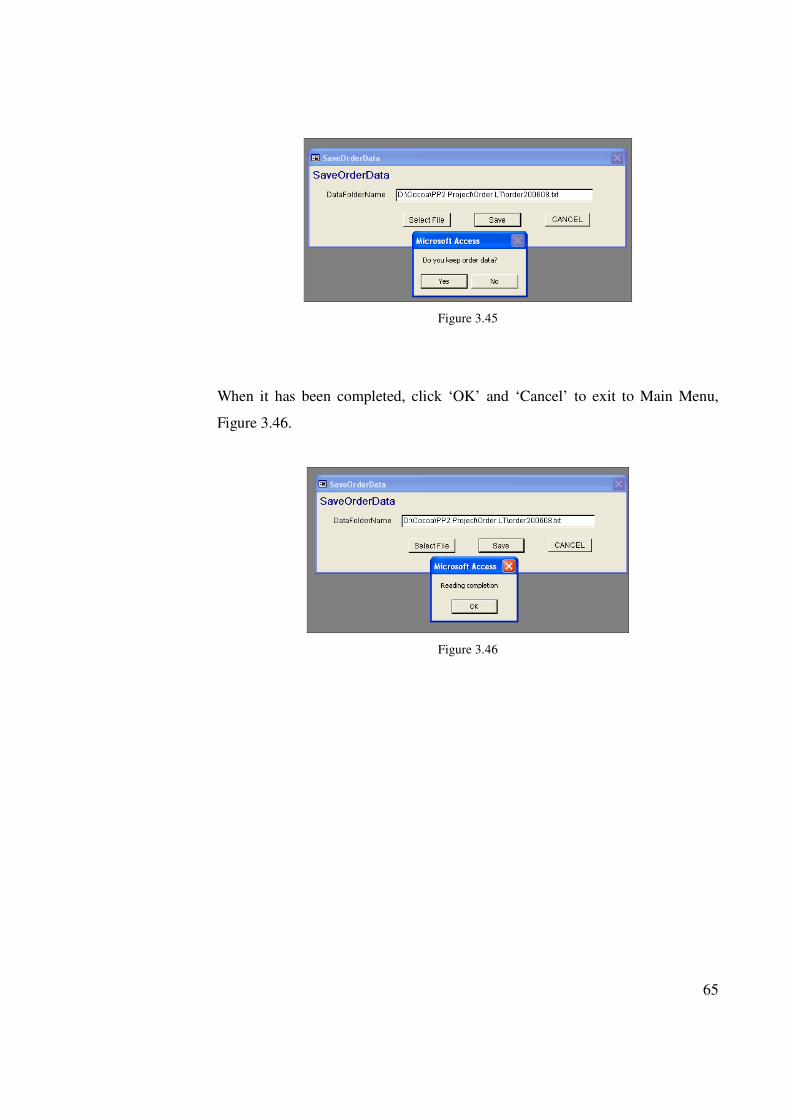
Click ‘Save’ to start transferring the data and ‘Yes’ confirm the execution
respectively, as shown in Figure 3.45.
65
Figure 3.45
When it has been completed, click ‘OK’ and ‘Cancel’ to exit to Main Menu,
Figure 3.46.
Figure 3.46
66
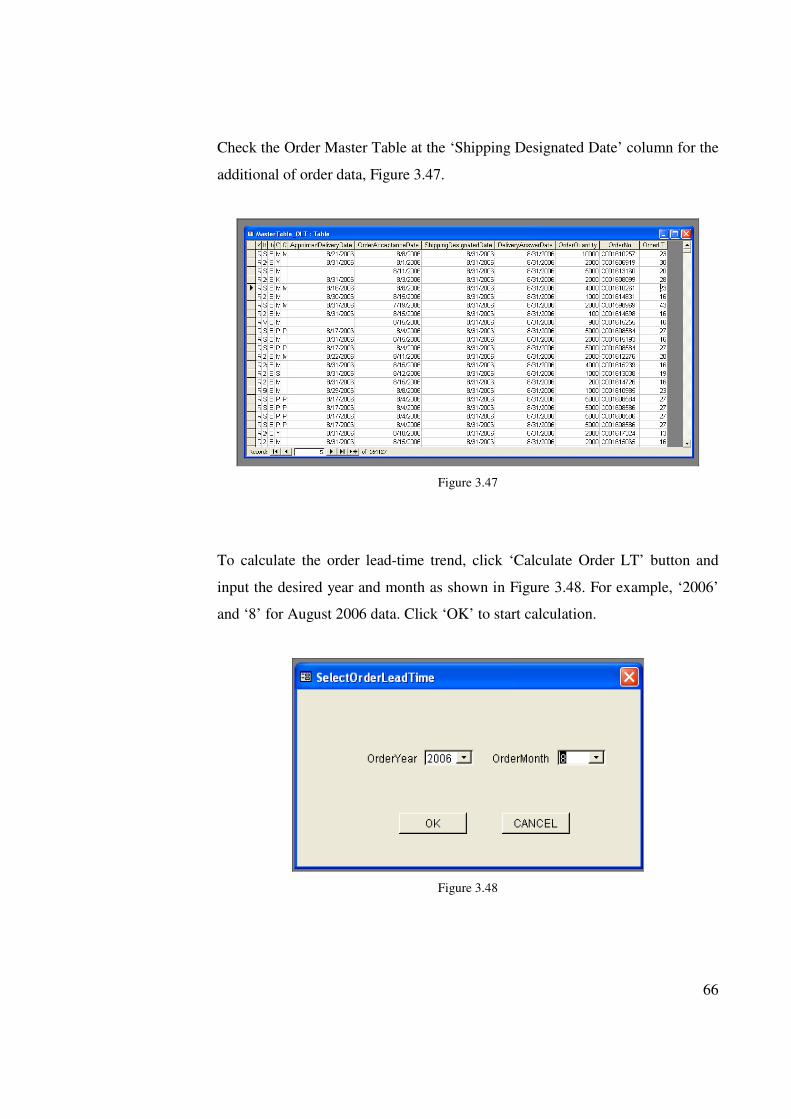
Check the Order Master Table at the ‘Shipping Designated Date’ column for the
additional of order data, Figure 3.47.
Figure 3.47
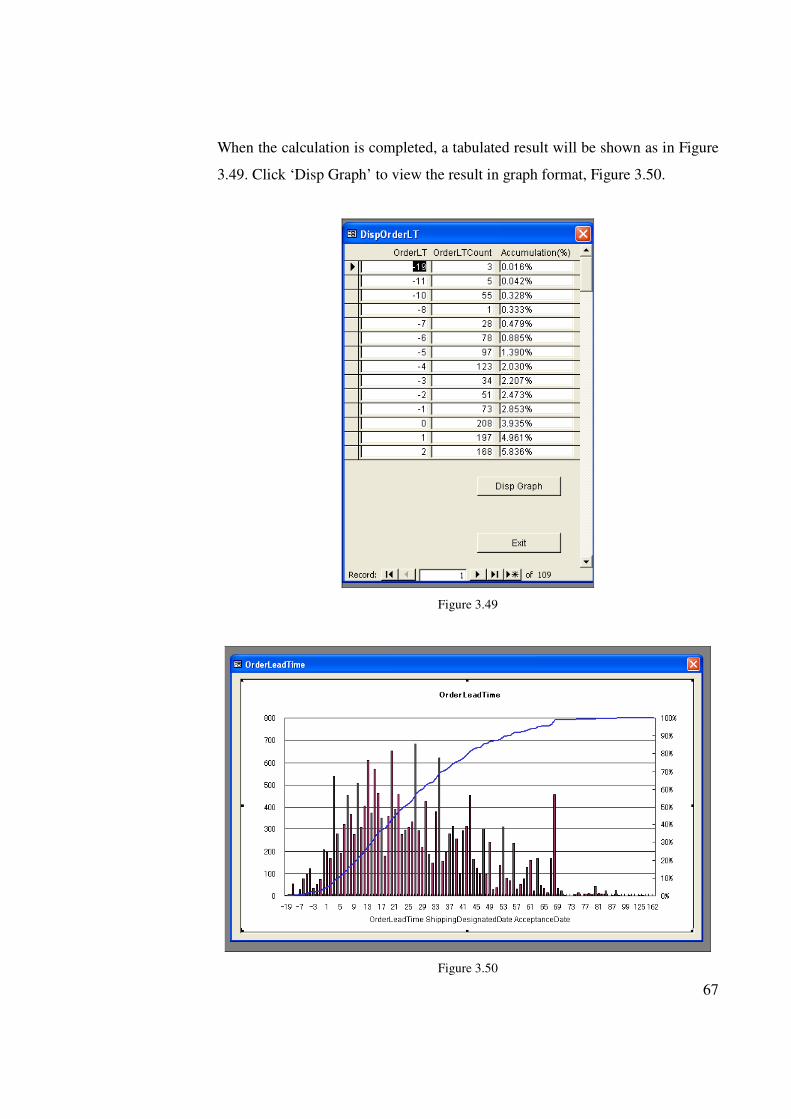
To calculate the order lead-time trend, click ‘Calculate Order LT’ button and
input the desired year and month as shown in Figure 3.48. For example, ‘2006’
and ‘8’ for August 2006 data. Click ‘OK’ to start calculation.
Figure 3.48
67
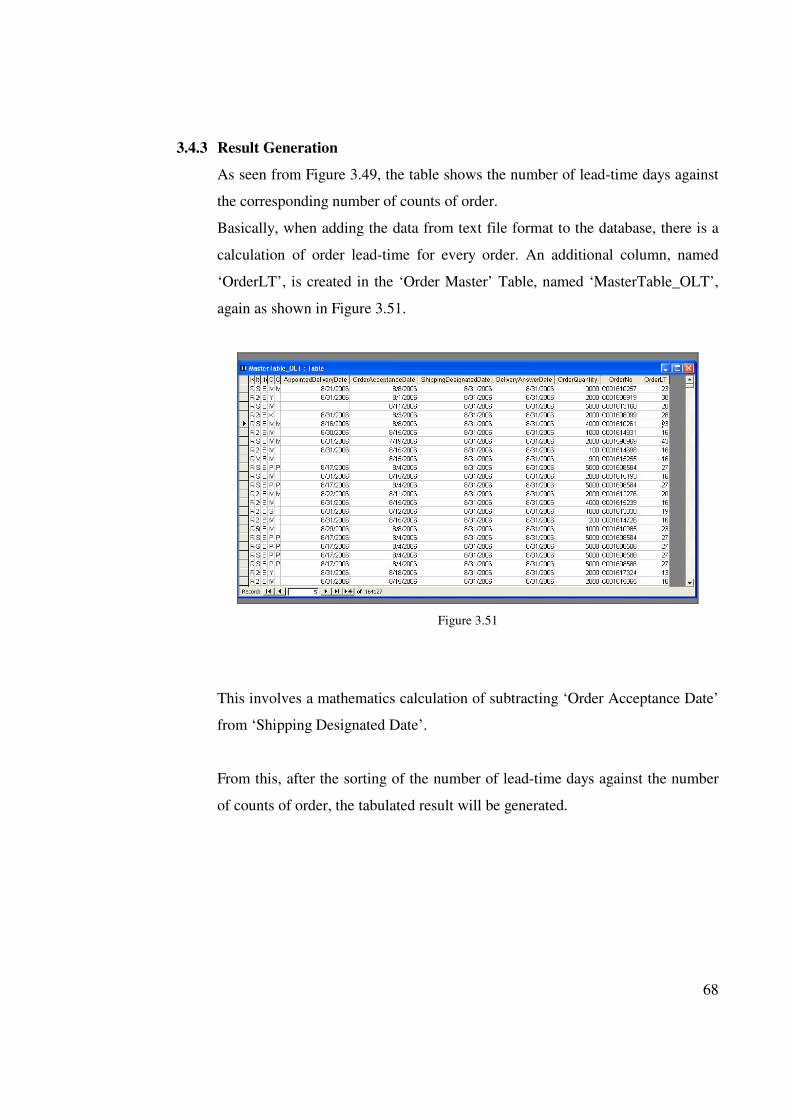
When the calculation is completed, a tabulated result will be shown as in Figure
3.49. Click ‘Disp Graph’ to view the result in graph format, Figure 3.50.
Figure 3.49
Figure 3.50
68
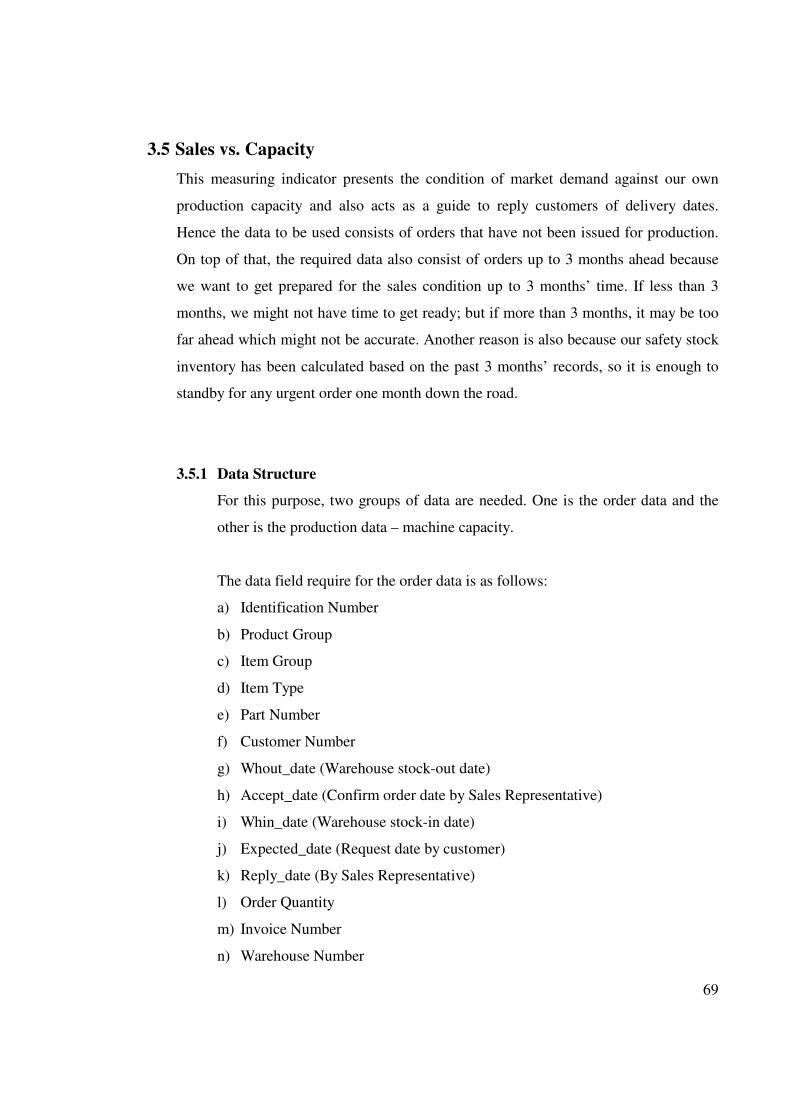
3.4.3 Result Generation
As seen from Figure 3.49, the table shows the number of lead-time days against
the corresponding number of counts of order.
Basically, when adding the data from text file format to the database, there is a
calculation of order lead-time for every order. An additional column, named
‘OrderLT’, is created in the ‘Order Master’ Table, named ‘MasterTable_OLT’,
again as shown in Figure 3.51.
Figure 3.51
This involves a mathematics calculation of subtracting ‘Order Acceptance Date’
from ‘Shipping Designated Date’.
From this, after the sorting of the number of lead-time days against the number
of counts of order, the tabulated result will be generated.
69
3.5 Sales vs. Capacity
This measuring indicator presents the condition of market demand against our own
production capacity and also acts as a guide to reply customers of delivery dates.
Hence the data to be used consists of orders that have not been issued for production.
On top of that, the required data also consist of orders up to 3 months ahead because
we want to get prepared for the sales condition up to 3 months’ time. If less than 3
months, we might not have time to get ready; but if more than 3 months, it may be too
far ahead which might not be accurate. Another reason is also because our safety stock
inventory has been calculated based on the past 3 months’ records, so it is enough to
standby for any urgent order one month down the road.
3.5.1 Data Structure
For this purpose, two groups of data are needed. One is the order data and the
other is the production data – machine capacity.
The data field require for the order data is as follows:
a) Identification Number
b) Product Group
c) Item Group
d) Item Type
e) Part Number
f) Customer Number
g) Whout_date (Warehouse stock-out date)
h) Accept_date (Confirm order date by Sales Representative)
i) Whin_date (Warehouse stock-in date)
j) Expected_date (Request date by customer)
k) Reply_date (By Sales Representative)
l) Order Quantity
m) Invoice Number
n) Warehouse Number
70
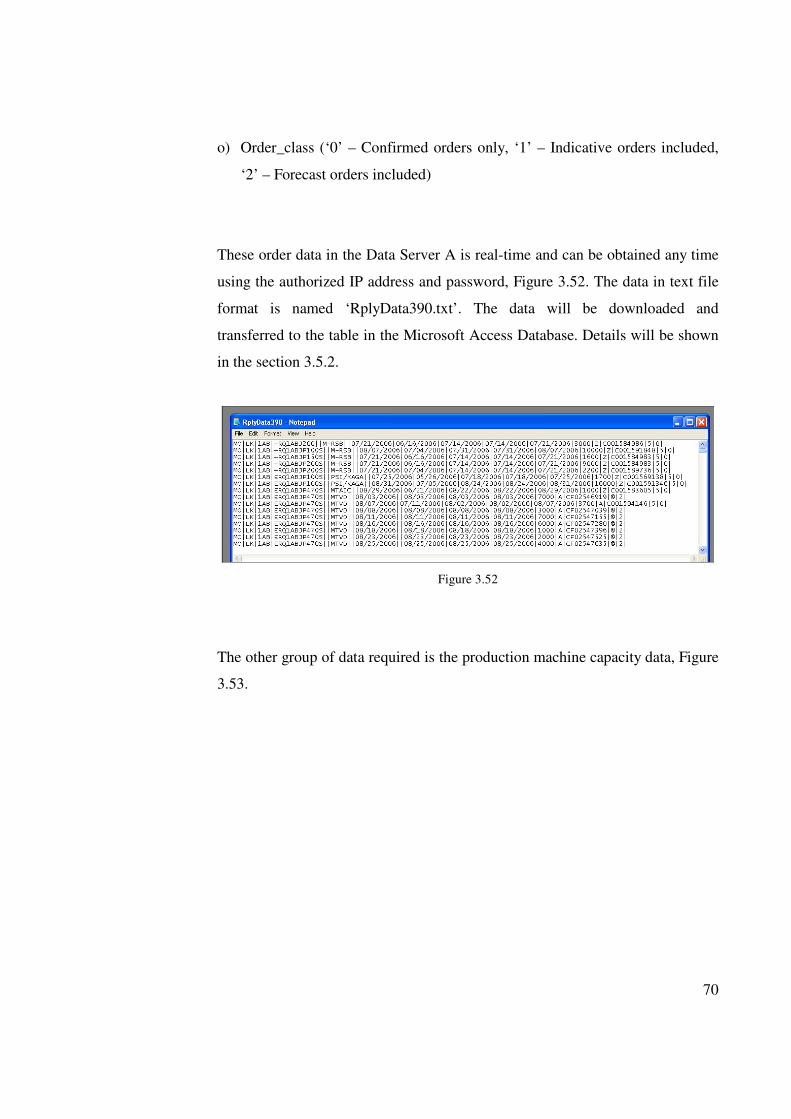
o) Order_class (‘0’ – Confirmed orders only, ‘1’ – Indicative orders included,
‘2’ – Forecast orders included)
These order data in the Data Server A is real-time and can be obtained any time
using the authorized IP address and password, Figure 3.52. The data in text file
format is named ‘RplyData390.txt’. The data will be downloaded and
transferred to the table in the Microsoft Access Database. Details will be shown
in the section 3.5.2.
Figure 3.52
The other group of data required is the production machine capacity data, Figure
3.53.
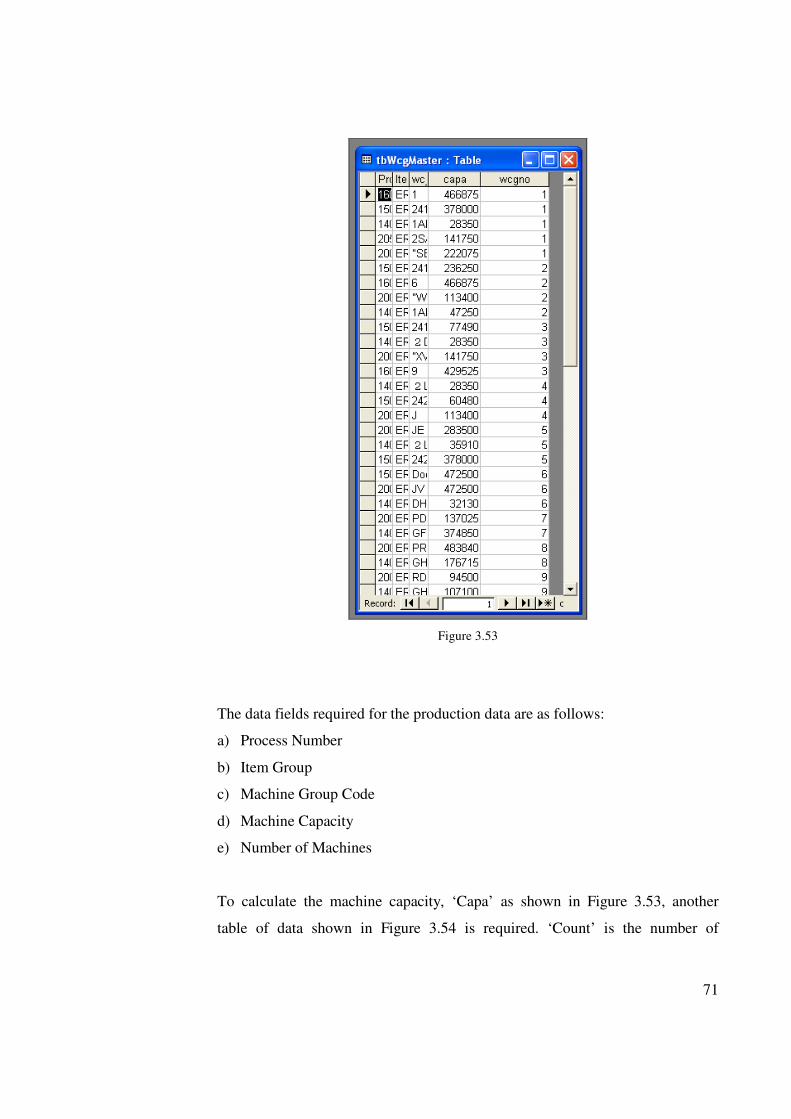
71
Figure 3.53
The data fields required for the production data are as follows:
a) Process Number
b) Item Group
c) Machine Group Code
d) Machine Capacity
e) Number of Machines
To calculate the machine capacity, ‘Capa’ as shown in Figure 3.53, another
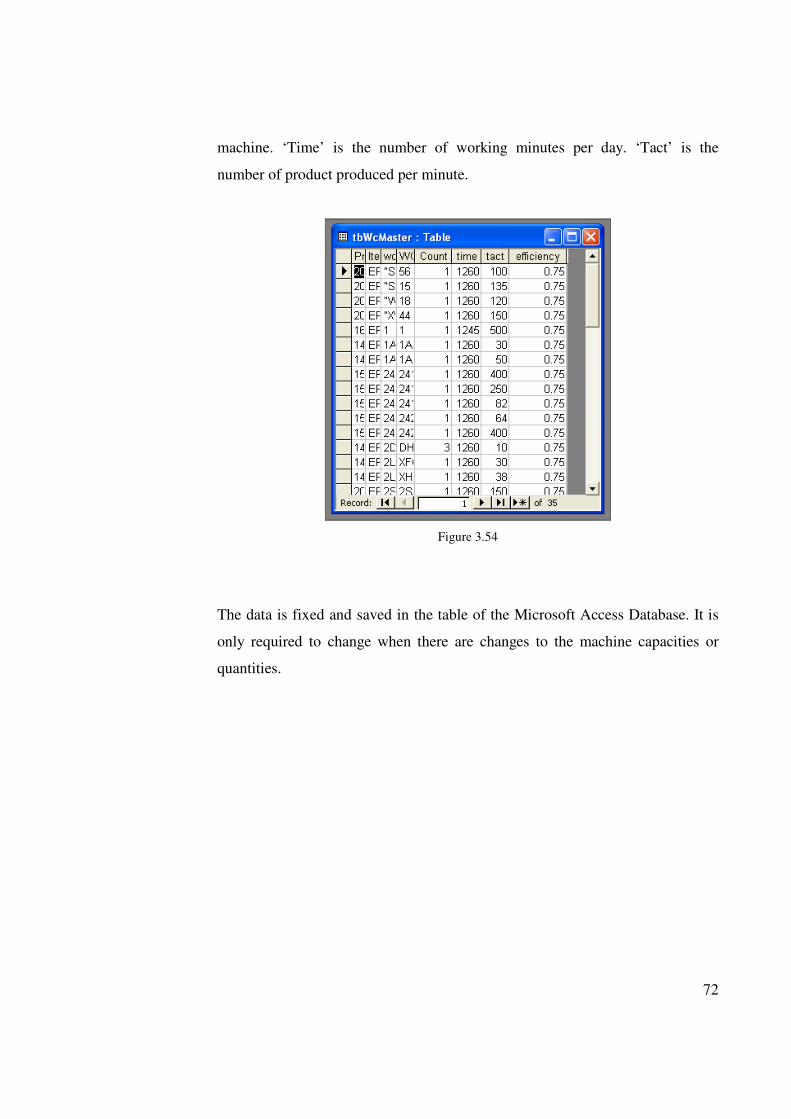
table of data shown in Figure 3.54 is required. ‘Count’ is the number of
72
machine. ‘Time’ is the number of working minutes per day. ‘Tact’ is the
number of product produced per minute.
Figure 3.54
The data is fixed and saved in the table of the Microsoft Access Database. It is
only required to change when there are changes to the machine capacities or
quantities.
73
3.5.2 User Interface
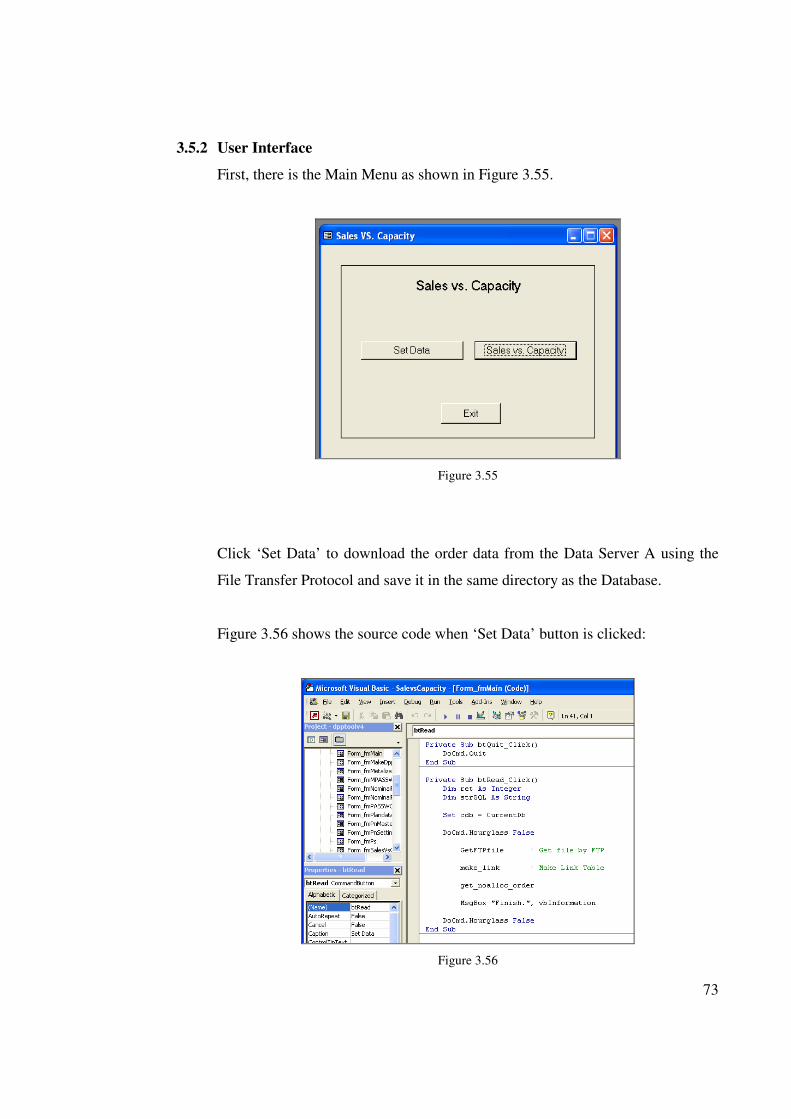
First, there is the Main Menu as shown in Figure 3.55.
Figure 3.55
Click ‘Set Data’ to download the order data from the Data Server A using the
File Transfer Protocol and save it in the same directory as the Database.
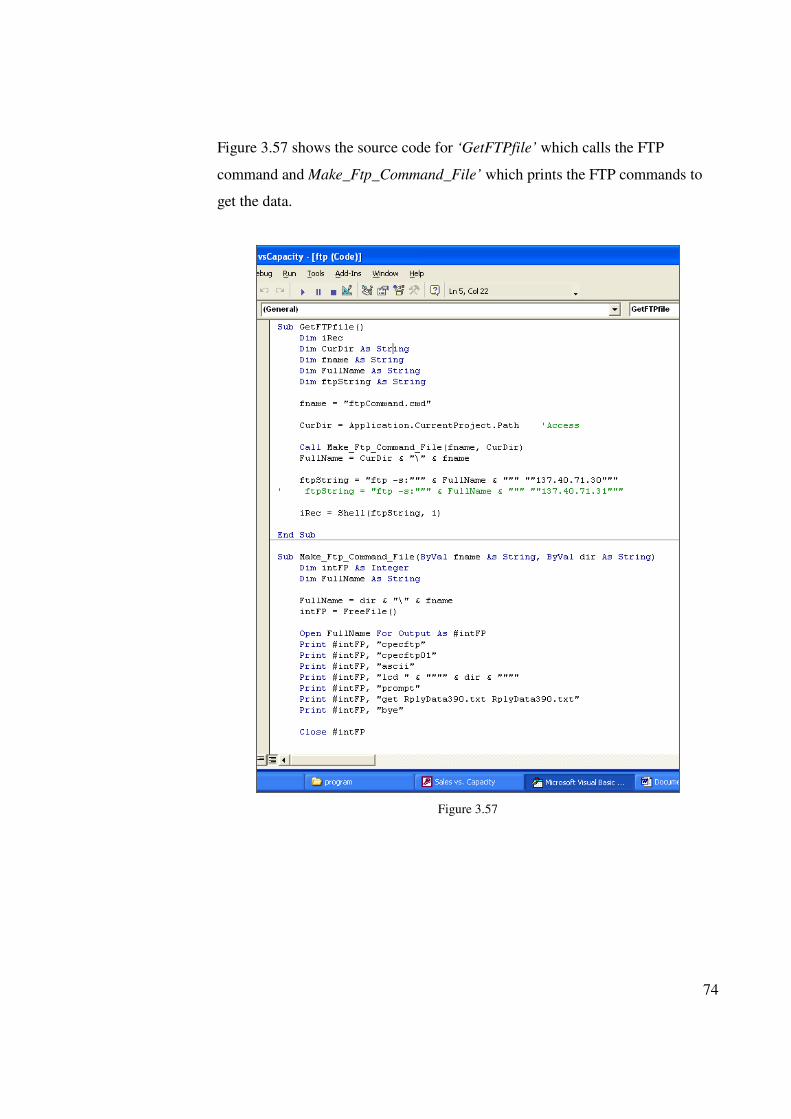
Figure 3.56 shows the source code when ‘Set Data’ button is clicked:
Figure 3.56
74
Figure 3.57 shows the source code for ‘GetFTPfile’ which calls the FTP
command and Make_Ftp_Command_File’ which prints the FTP commands to
get the data.
Figure 3.57
75
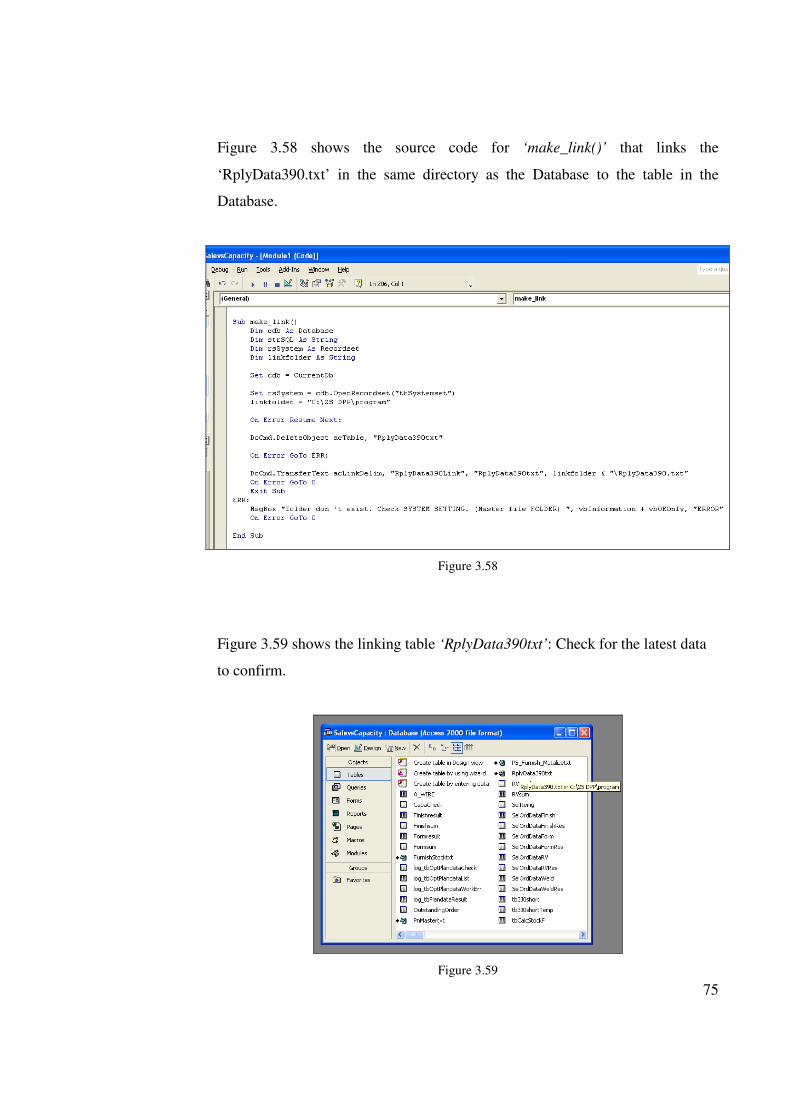
Figure 3.58 shows the source code for ‘make_link()’ that links the
‘RplyData390.txt’ in the same directory as the Database to the table in the
Database.
Figure 3.58
Figure 3.59 shows the linking table ‘RplyData390txt’: Check for the latest data
to confirm.
Figure 3.59
76
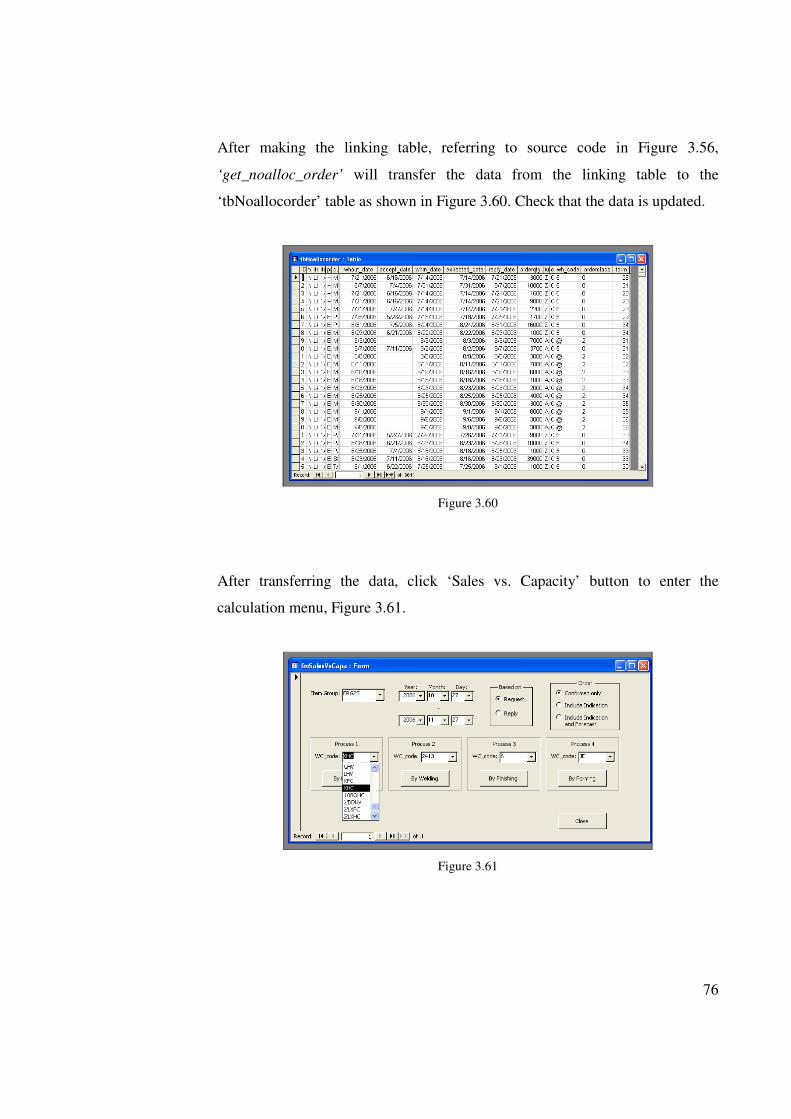
After making the linking table, referring to source code in Figure 3.56,
‘get_noalloc_order’ will transfer the data from the linking table to the
‘tbNoallocorder’ table as shown in Figure 3.60. Check that the data is updated.
Figure 3.60
After transferring the data, click ‘Sales vs. Capacity’ button to enter the
calculation menu, Figure 3.61.
Figure 3.61
77
There are a few selections to be made:
a) Item Group
b) Term Selection – the starting date will the day of usage and the end date can
be selected.
c) By Request Date or by Reply Date
d) Confirmed Order only, Indication Included or Forecast Included
e) Different Process Type
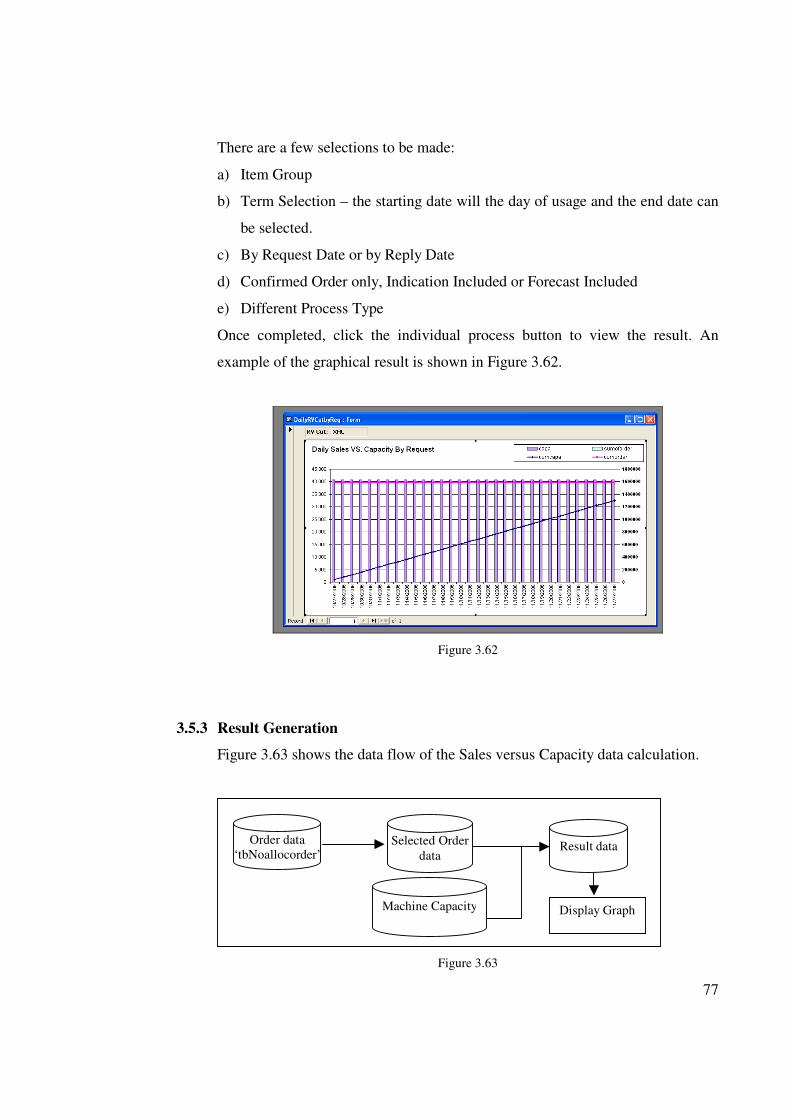
Once completed, click the individual process button to view the result. An
example of the graphical result is shown in Figure 3.62.
Figure 3.62
3.5.3 Result Generation
Figure 3.63 shows the data flow of the Sales versus Capacity data calculation.
Figure 3.63
Selected Order
data
Machine Capacity
Result dataOrder data
‘tbNoallocorder’
Display Graph
78
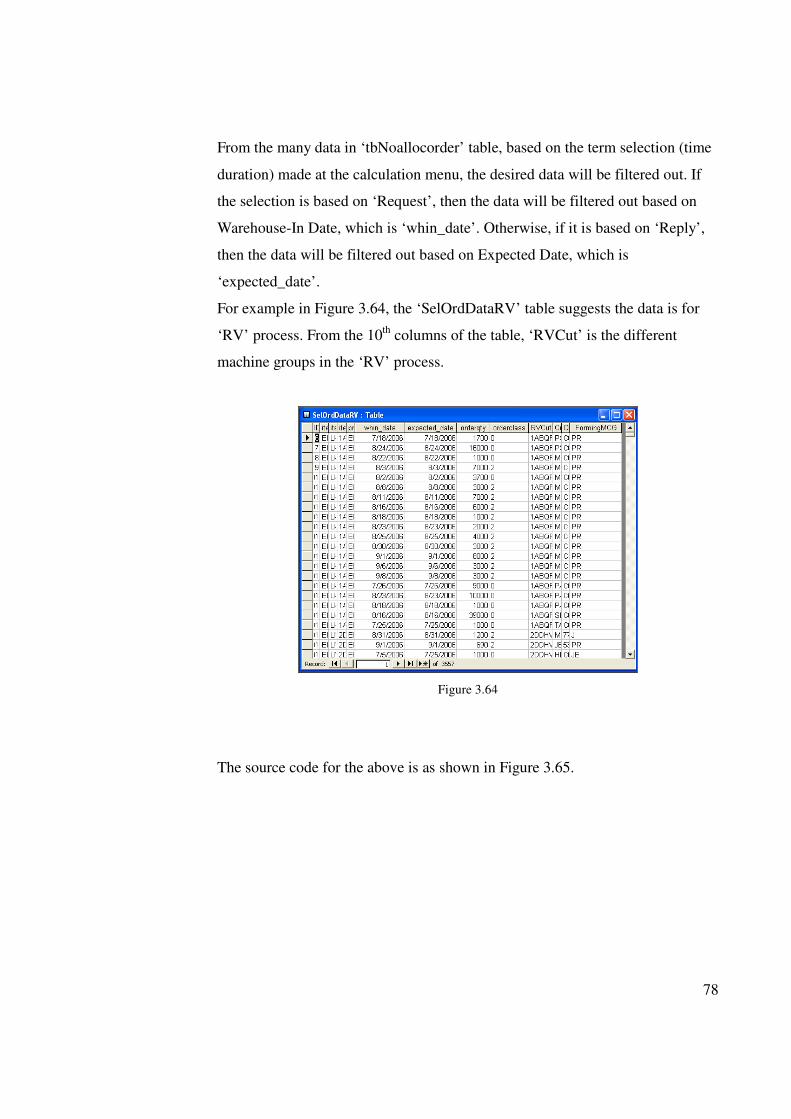
From the many data in ‘tbNoallocorder’ table, based on the term selection (time
duration) made at the calculation menu, the desired data will be filtered out. If
the selection is based on ‘Request’, then the data will be filtered out based on
Warehouse-In Date, which is ‘whin_date’. Otherwise, if it is based on ‘Reply’,
then the data will be filtered out based on Expected Date, which is
‘expected_date’.
For example in Figure 3.64, the ‘SelOrdDataRV’ table suggests the data is for
‘RV’ process. From the 10th
columns of the table, ‘RVCut’ is the different
machine groups in the ‘RV’ process.
Figure 3.64
The source code for the above is as shown in Figure 3.65.
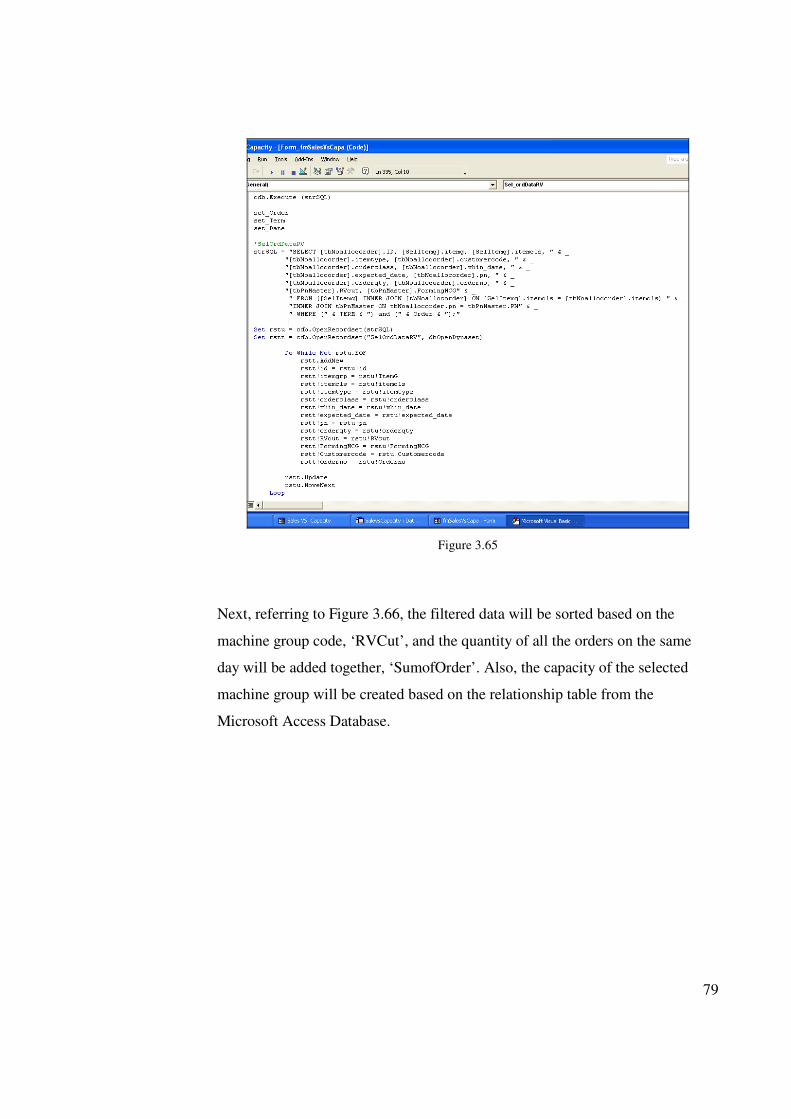
79
Figure 3.65
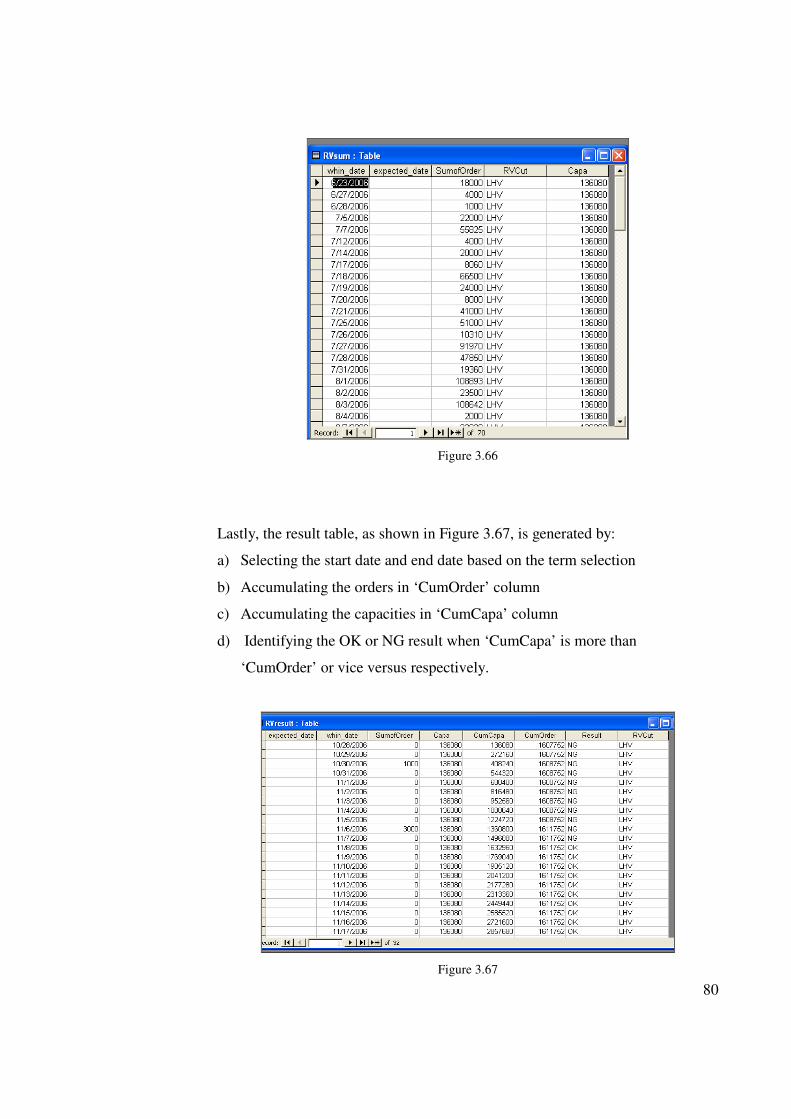
Next, referring to Figure 3.66, the filtered data will be sorted based on the
machine group code, ‘RVCut’, and the quantity of all the orders on the same
day will be added together, ‘SumofOrder’. Also, the capacity of the selected
machine group will be created based on the relationship table from the
Microsoft Access Database.
80
Figure 3.66
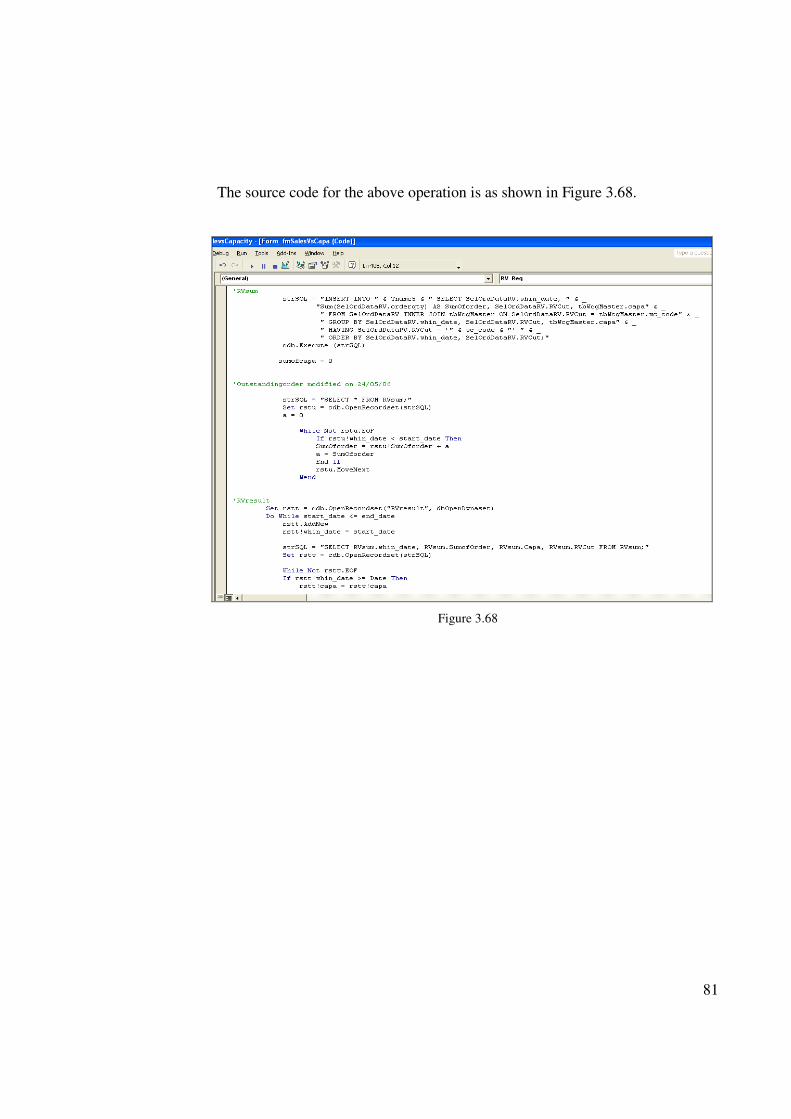
Lastly, the result table, as shown in Figure 3.67, is generated by:
a) Selecting the start date and end date based on the term selection
b) Accumulating the orders in ‘CumOrder’ column
c) Accumulating the capacities in ‘CumCapa’ column
d) Identifying the OK or NG result when ‘CumCapa’ is more than
‘CumOrder’ or vice versus respectively.
Figure 3.67
81
The source code for the above operation is as shown in Figure 3.68.
Figure 3.68
82
3.6 Plan vs. Actual Production
This indicator shows how much the production plan is fulfilled every day. It is a gauge
of how well the production performs and also a monitoring tool to arrest problems if
any arise. It is more for the use of production in-charge who takes care of the daily
production.
The tool for this item is currently at discussion and confirmation stage. However, some
details on the data structure and results generation will be documented.
3.6.1 Data Structure
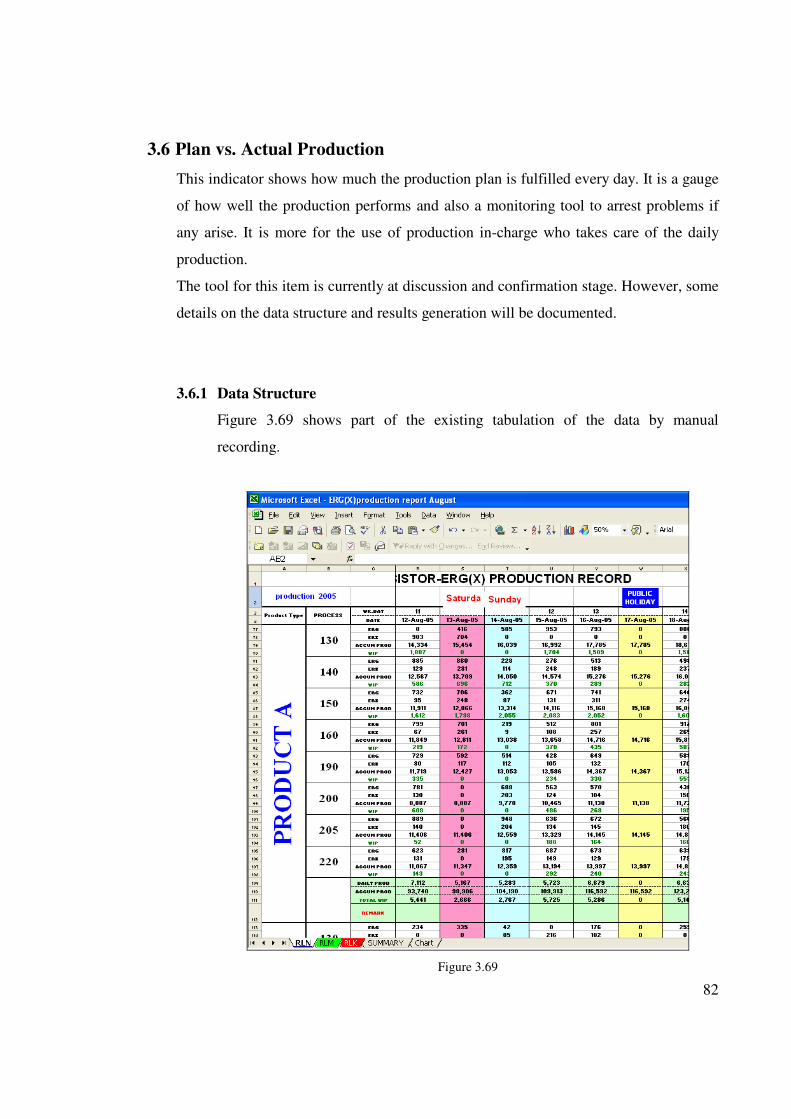
Figure 3.69 shows part of the existing tabulation of the data by manual
recording.
Figure 3.69
83
From the figure, it shows a daily tabulation of Product A at different processes,
i.e. ‘130’, ‘140’, ‘150’, etc, recorded with the different item type production
quantity, accumulated production quantity and work-in-progress quantity.
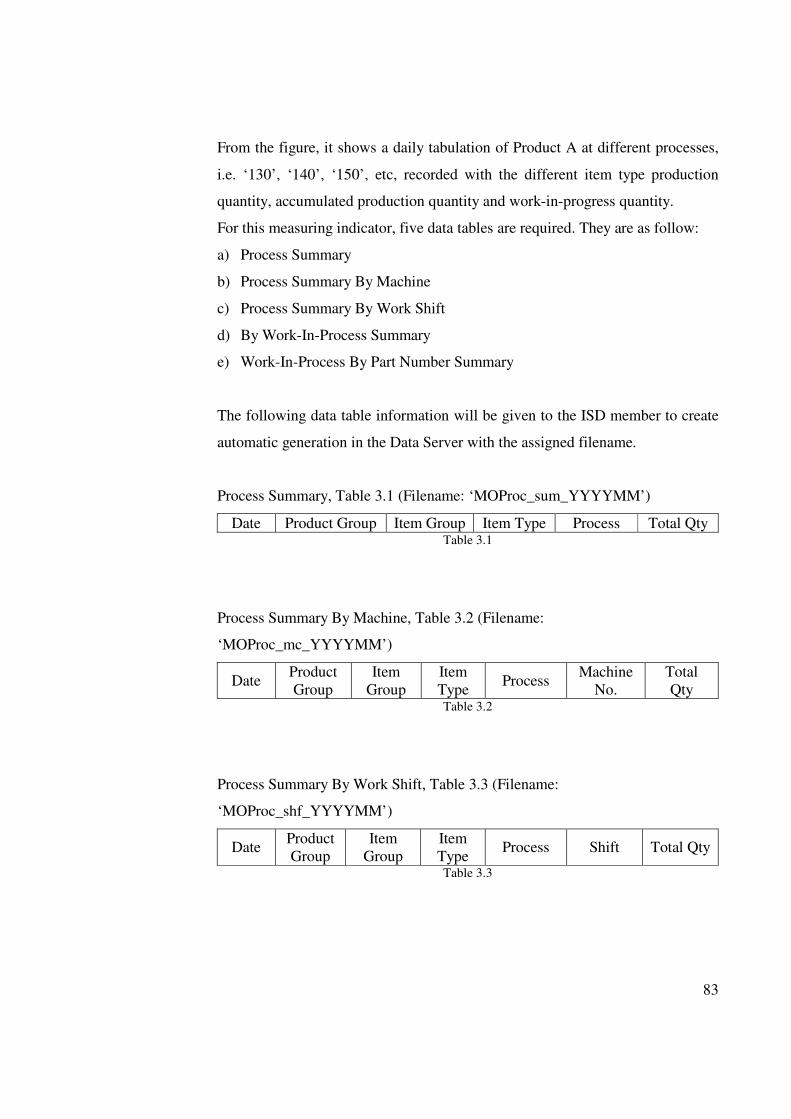
For this measuring indicator, five data tables are required. They are as follow:
a) Process Summary
b) Process Summary By Machine
c) Process Summary By Work Shift
d) By Work-In-Process Summary
e) Work-In-Process By Part Number Summary
The following data table information will be given to the ISD member to create
automatic generation in the Data Server with the assigned filename.
Process Summary, Table 3.1 (Filename: ‘MOProc_sum_YYYYMM’)
Date Product Group Item Group Item Type Process Total Qty Table 3.1
Process Summary By Machine, Table 3.2 (Filename:
‘MOProc_mc_YYYYMM’)
Date Product
Group
Item
Group
Item
Type Process
Machine
No.
Total
Qty Table 3.2
Process Summary By Work Shift, Table 3.3 (Filename:
‘MOProc_shf_YYYYMM’)
Date Product
Group
Item
Group
Item
Type Process Shift Total Qty
Table 3.3
84
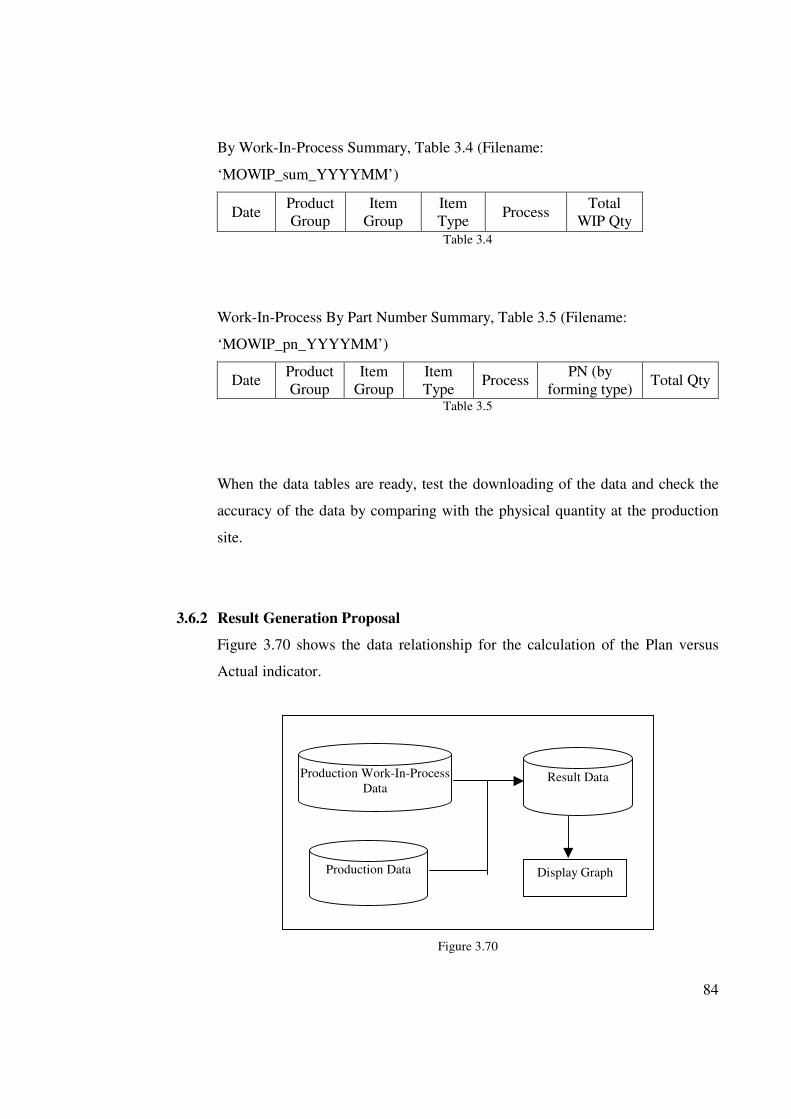
By Work-In-Process Summary, Table 3.4 (Filename:
‘MOWIP_sum_YYYYMM’)
Date Product
Group
Item
Group
Item
Type Process
Total
WIP Qty Table 3.4
Work-In-Process By Part Number Summary, Table 3.5 (Filename:
‘MOWIP_pn_YYYYMM’)
Date Product
Group
Item
Group
Item
Type Process
PN (by
forming type) Total Qty
Table 3.5
When the data tables are ready, test the downloading of the data and check the
accuracy of the data by comparing with the physical quantity at the production
site.
3.6.2 Result Generation Proposal
Figure 3.70 shows the data relationship for the calculation of the Plan versus
Actual indicator.
Figure 3.70
Production Work-In-Process
Data
Production Data
Result Data
Display Graph

85
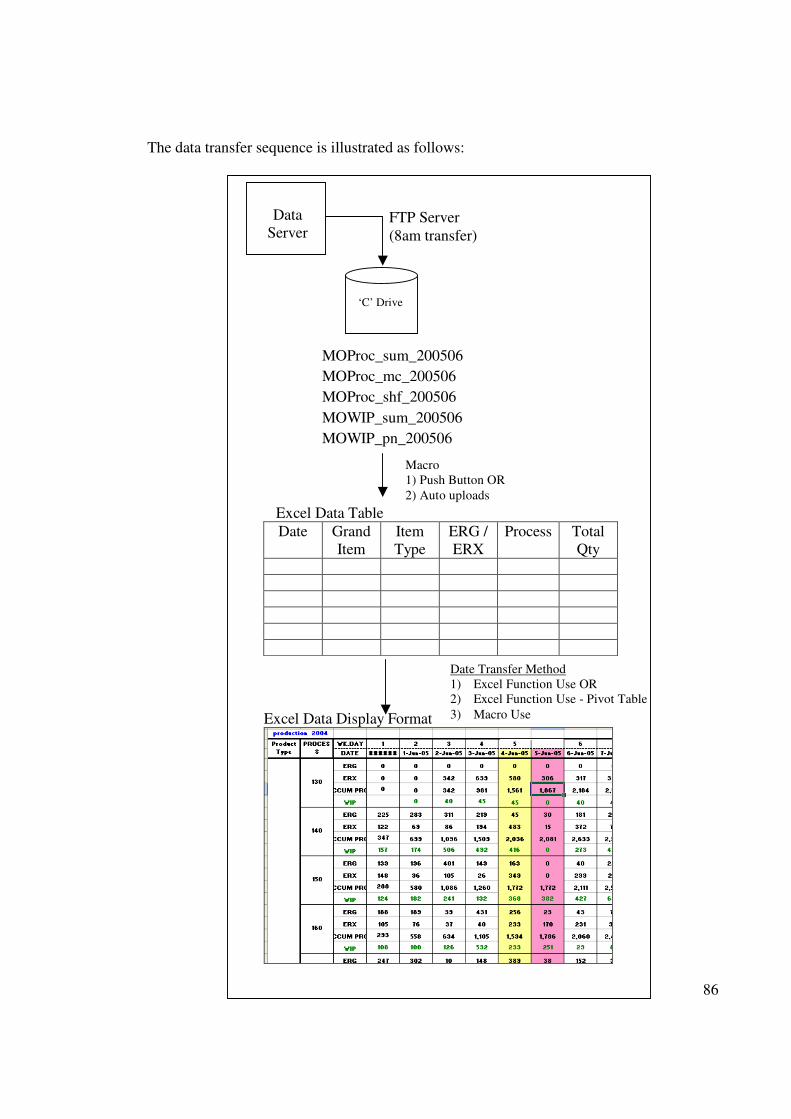
The data tables will be updated every morning 8am in the Data Server. Using
the File Transfer Protocol command, download the data to the ‘C’ drive of the
computer. Then, open the excel file to transfer the data to the excel table. This
data transfer operation can be fulfilled by using Excel function, Pivot Table or
Macro through the use of a command button.
86
The data transfer sequence is illustrated as follows:
MOProc_sum_200506
MOProc_mc_200506
MOProc_shf_200506
MOWIP_sum_200506
MOWIP_pn_200506
Excel Data Table
Date Grand
Item
Item
Type
ERG /
ERX
Process Total
Qty
Excel Data Display Format
Date Transfer Method
1) Excel Function Use OR
2) Excel Function Use - Pivot Table
3) Macro Use
Data
Server FTP Server
(8am transfer)
Macro
1) Push Button OR
2) Auto uploads
‘C’ Drive
87
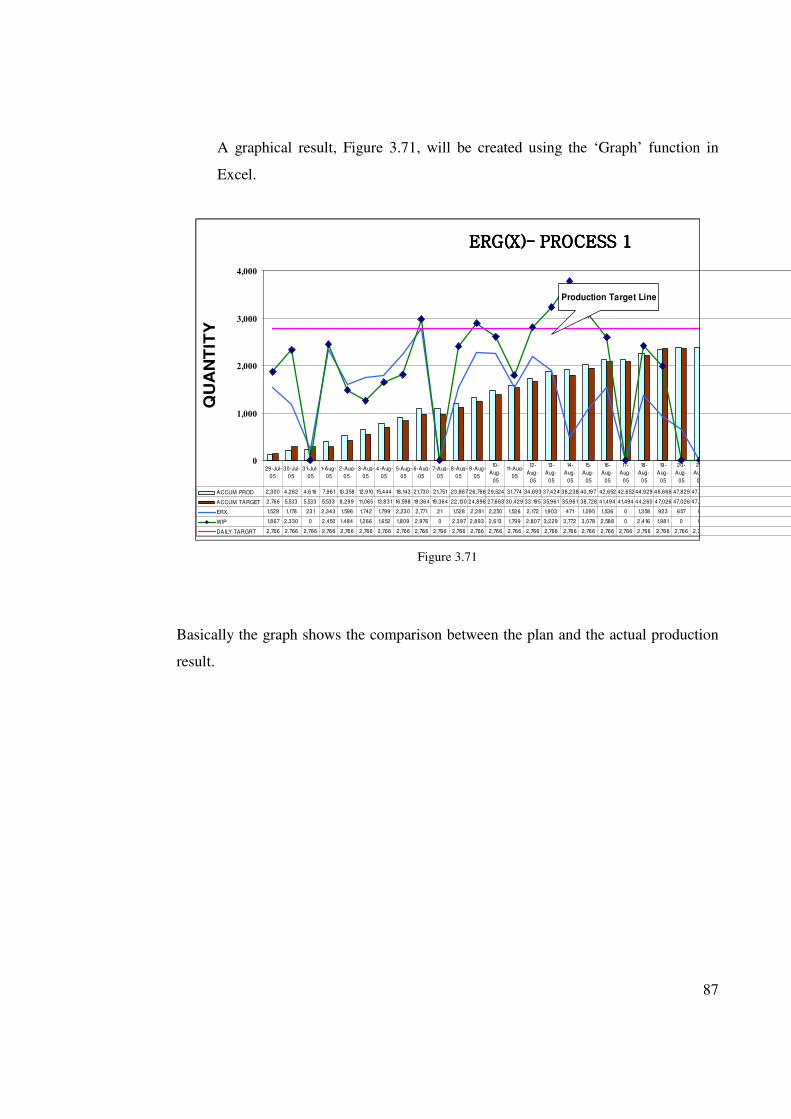
A graphical result, Figure 3.71, will be created using the ‘Graph’ function in
Excel.
ERG(X)- PROCESS 1ERG(X)- PROCESS 1ERG(X)- PROCESS 1ERG(X)- PROCESS 1
0
1,000
2,000
3,000
4,000
QU
AN
TIT
Y
ACCUM PROD 2,300 4,262 4,616 7,961 10,358 12,910 15,444 18,143 21,730 21,751 23,867 26,766 29,524 31,774 34,693 37,424 38,238 40,197 42,652 42,652 44,929 46,666 47,829 47,829
ACCUM TARGET 2,766 5,533 5,533 5,533 8,299 11,065 13,831 16,598 19,364 19,364 22,130 24,896 27,663 30,429 33,195 35,961 35,961 38,728 41,494 41,494 44,260 47,026 47,026 47,026
ERX 1,529 1,178 231 2,343 1,596 1,742 1,799 2,230 2,771 21 1,528 2,281 2,250 1,526 2,172 1,903 471 1,095 1,536 0 1,358 923 657 0
WIP 1,867 2,330 0 2,450 1,484 1,266 1,652 1,809 2,976 0 2,397 2,893 2,613 1,799 2,807 3,229 3,772 3,078 2,588 0 2,416 1,981 0 0
DAILY TARGRT 2,766 2,766 2,766 2,766 2,766 2,766 2,766 2,766 2,766 2,766 2,766 2,766 2,766 2,766 2,766 2,766 2,766 2,766 2,766 2,766 2,766 2,766 2,766 2,766
29-Jul-
05
30-Jul-
05
31-Jul-
05
1-Aug-
05
2-Aug-
05
3-Aug-
05
4-Aug-
05
5-Aug-
05
6-Aug-
05
7-Aug-
05
8-Aug-
05
9-Aug-
05
10-
Aug-
05
11-Aug-
05
12-
Aug-
05
13-
Aug-
05
14-
Aug-
05
15-
Aug-
05
16-
Aug-
05
17-
Aug-
05
18-
Aug-
05
19-
Aug-
05
20-
Aug-
05
21-
Aug-
05
Production Target Line
Figure 3.71
Basically the graph shows the comparison between the plan and the actual production
result.
88
3.7 Work-In-Progress & Inventory
This indicator shows how much stock there is in the production line and warehouse. It
is an important indicator to monitor because excess inventory may tie up cash and
create waste in many forms as explained in 2.2.2.
The tool for this item is currently at discussion and confirmation stage. However, some
details on the data structure and results generation will be documented.
3.7.1 Data Structure
The data fields required for WIP data are as follow:
a) Transaction Date
b) Product Group
c) Item Group
d) Item Type
e) Process Number
f) Part Number
g) Quantity
h) Number of Lots
The data will be automatically updated every morning 8am. WIP data makes up
of the products that started production but have not reached the warehouse.
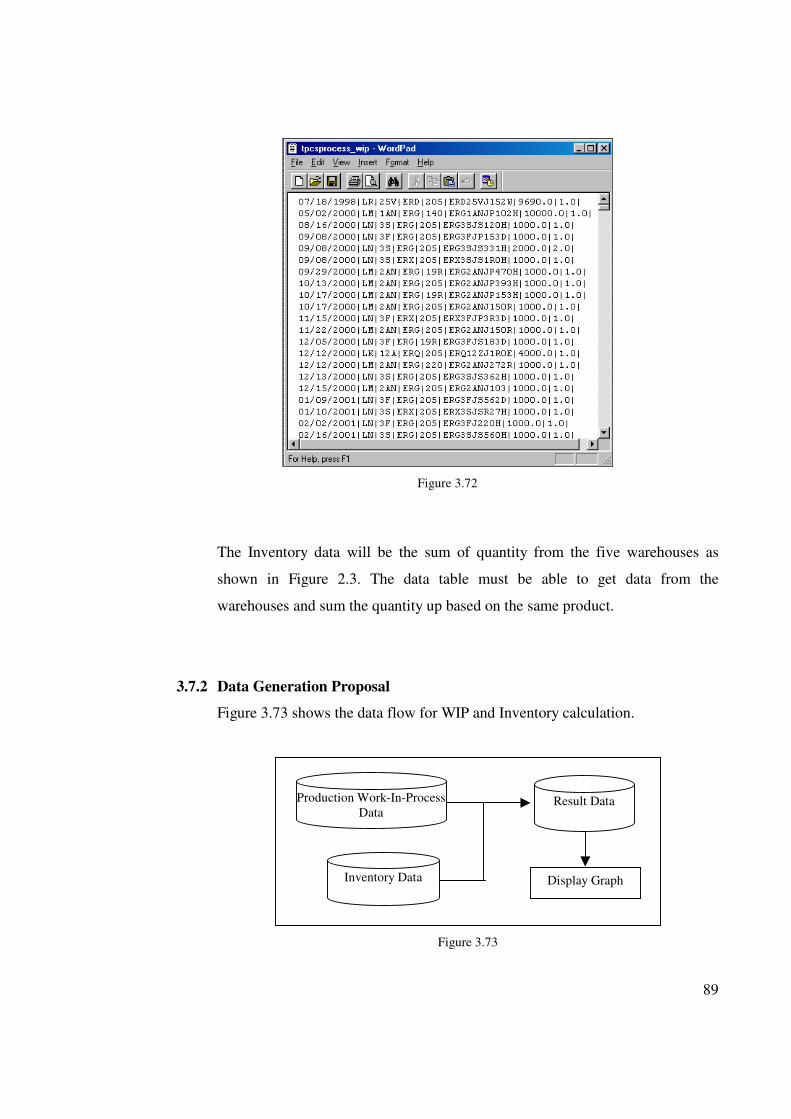
89
Figure 3.72
The Inventory data will be the sum of quantity from the five warehouses as
shown in Figure 2.3. The data table must be able to get data from the
warehouses and sum the quantity up based on the same product.
3.7.2 Data Generation Proposal
Figure 3.73 shows the data flow for WIP and Inventory calculation.
Figure 3.73
Result Data
Display Graph Inventory Data
Production Work-In-Process
Data
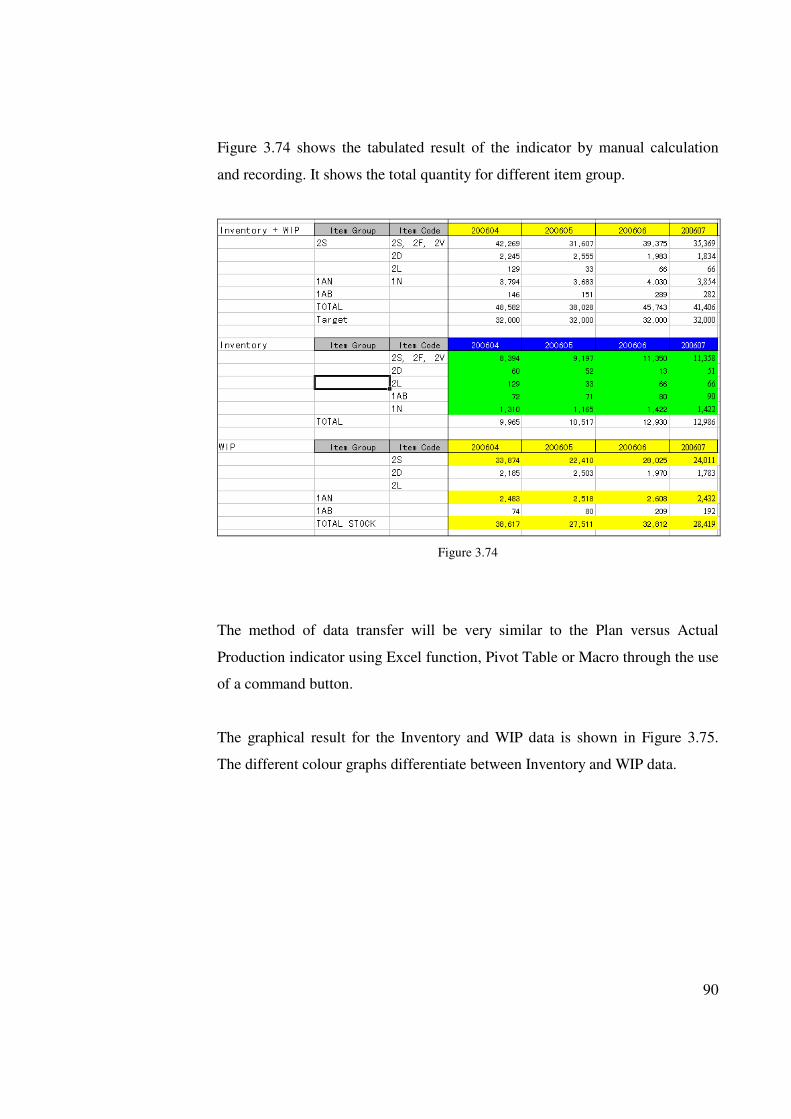
90
Figure 3.74 shows the tabulated result of the indicator by manual calculation
and recording. It shows the total quantity for different item group.
Figure 3.74
The method of data transfer will be very similar to the Plan versus Actual
Production indicator using Excel function, Pivot Table or Macro through the use
of a command button.
The graphical result for the Inventory and WIP data is shown in Figure 3.75.
The different colour graphs differentiate between Inventory and WIP data.
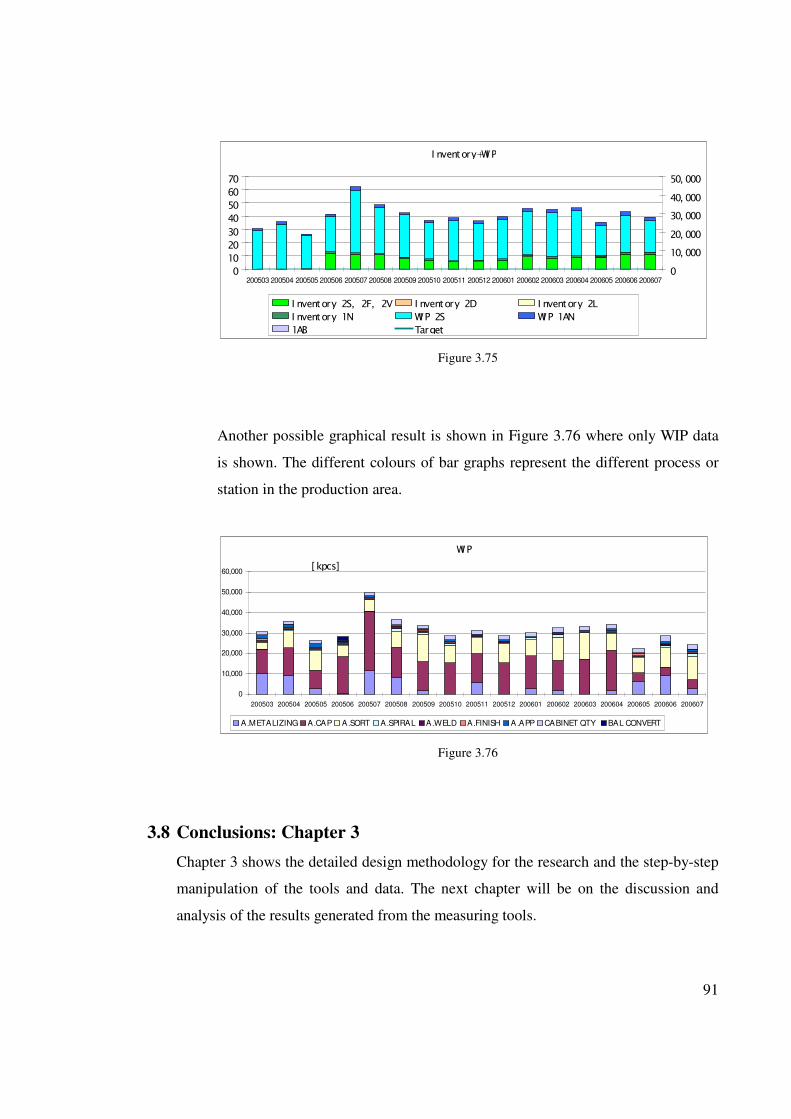
91
I nventory+WI P
0
10
20
30
40
50
60
70
200503 200504 200505 200506 200507 200508 200509 200510 200511 200512 200601 200602 200603 200604 200605 200606 2006070
10, 000
20, 000
30, 000
40, 000
50, 000
I nventory 2S, 2F, 2V I nventory 2D I nventory 2L
I nventory 1N WI P 2S WI P 1AN
1AB Target
Figure 3.75
Another possible graphical result is shown in Figure 3.76 where only WIP data
is shown. The different colours of bar graphs represent the different process or
station in the production area.
WI P
0
10,000
20,000
30,000
40,000
50,000
60,000
200503 200504 200505 200506 200507 200508 200509 200510 200511 200512 200601 200602 200603 200604 200605 200606 200607
[ kpcs]
A.METALIZING A.CAP A.SORT A.SPIRAL A.WELD A.FINISH A.APP CABINET QTY BAL CONVERT
Figure 3.76
3.8 Conclusions: Chapter 3
Chapter 3 shows the detailed design methodology for the research and the step-by-step
manipulation of the tools and data. The next chapter will be on the discussion and
analysis of the results generated from the measuring tools.
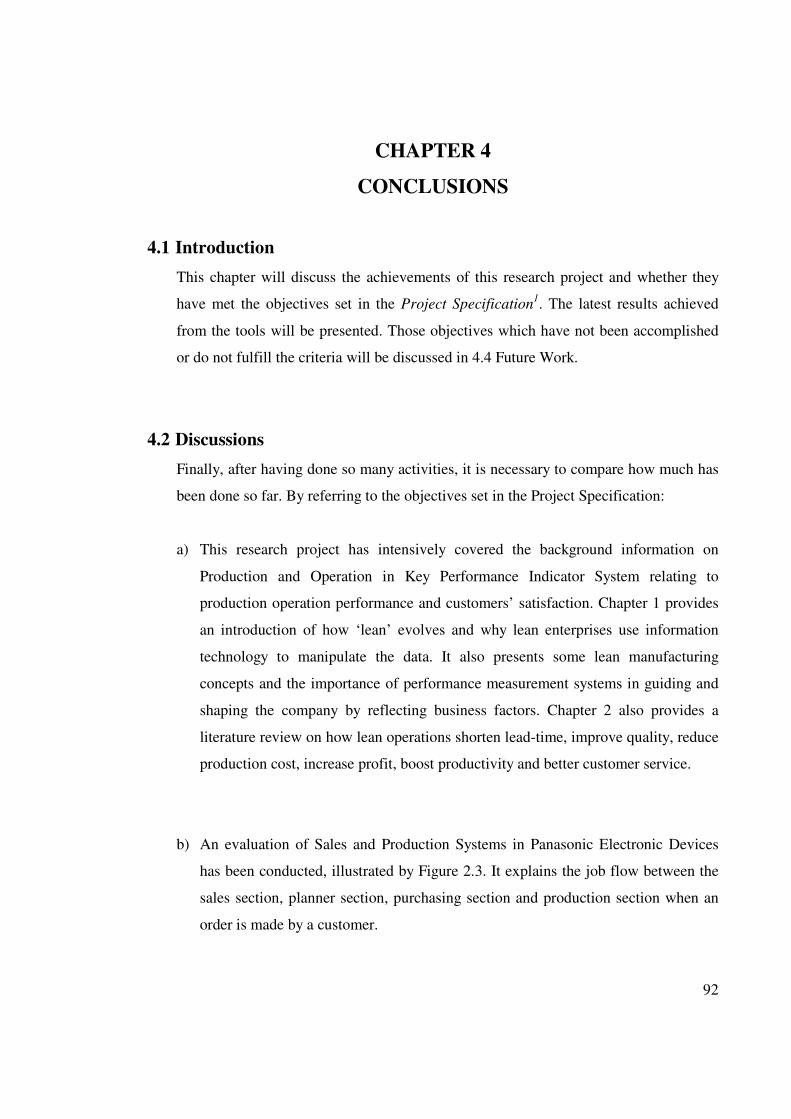
92
CHAPTER 4
CONCLUSIONS
4.1 Introduction
This chapter will discuss the achievements of this research project and whether they
have met the objectives set in the Project Specification1. The latest results achieved
from the tools will be presented. Those objectives which have not been accomplished
or do not fulfill the criteria will be discussed in 4.4 Future Work.
4.2 Discussions
Finally, after having done so many activities, it is necessary to compare how much has
been done so far. By referring to the objectives set in the Project Specification:
a) This research project has intensively covered the background information on
Production and Operation in Key Performance Indicator System relating to
production operation performance and customers’ satisfaction. Chapter 1 provides
an introduction of how ‘lean’ evolves and why lean enterprises use information
technology to manipulate the data. It also presents some lean manufacturing
concepts and the importance of performance measurement systems in guiding and
shaping the company by reflecting business factors. Chapter 2 also provides a
literature review on how lean operations shorten lead-time, improve quality, reduce
production cost, increase profit, boost productivity and better customer service.
b) An evaluation of Sales and Production Systems in Panasonic Electronic Devices
has been conducted, illustrated by Figure 2.3. It explains the job flow between the
sales section, planner section, purchasing section and production section when an
order is made by a customer.
93
c) After evaluating the Sales and Production Systems, significant problems are
identified in Figure 2.4 and improvements on the hardware i.e. the Data Server and
implementations of additional operation systems i.e. the Material Order System,
Key Performance Indicator, etc are carried out.
d) New tools for measuring key performance indicators like Delivery-On-Time,
Production Lead-Time, Order Lead-Time and Sales versus Capacity are designed,
tested and implemented for data collection and analysis. However, there are two
measuring indicators i.e. Plan versus Actual production and Work-In-Process &
Inventory that are still under discussion and confirmation stage due to the
implementation of the previous four measuring indicators. With these two
measuring indicators implemented, the KPI system will be more complete.
e) Delivery-On-Time and Order Lead-Time tools are modified from ‘existing’ tools
because their data manipulations are previously done manually by using Pivot-
Table. The logic of results generation is the same but the manipulation of data is
different. The previous one is by manual filtering of data and the latter is through
the use of command button and Visual Basic Applications in Microsoft Access
Database. A very good advantage of having it automatic is to reduce one of the
seven wastes i.e. waiting time.
f) A proper cost benefit analysis has not been conducted because improvement jobs
through the data analysis have not been done on the data collected. Currently the
data collected is only used to produce monthly reports and understand market
conditions. No improvement activities have been suggested to be carried out. A
more concrete cost benefit analysis can be obtained when improvement activities
are being implemented, only then can the cost benefit be analyzed correctly.
94
Just by creating measuring systems will not generate benefits unless people use
them to improve on areas which link directly to sales. However, the suggested
improvements and new functions do save a lot of time on manual work, especially
for Delivery-On-Time and Order Lead-Time tools. Another advantage is that real
and accurate data is being collected which will give a more correct analysis thus
more appropriate improvement actions.
g) Up till now, the four completed measuring tools have been used by the respective
sections to generate reports and study on improvement activities to be carried out.
Once the improvement activities are carried out, a period of monitoring time will be
required before evaluation of the new production operation systems and KPI
measuring tools.
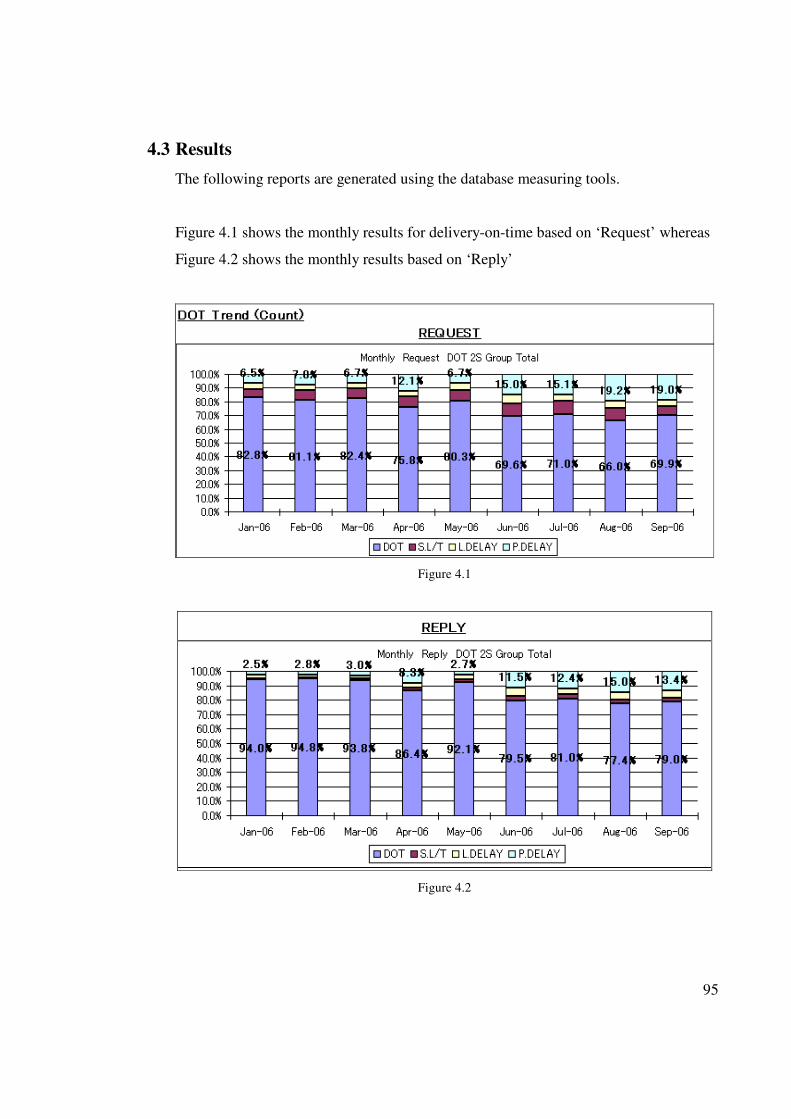
95
4.3 Results
The following reports are generated using the database measuring tools.
Figure 4.1 shows the monthly results for delivery-on-time based on ‘Request’ whereas
Figure 4.2 shows the monthly results based on ‘Reply’
Figure 4.1
Figure 4.2
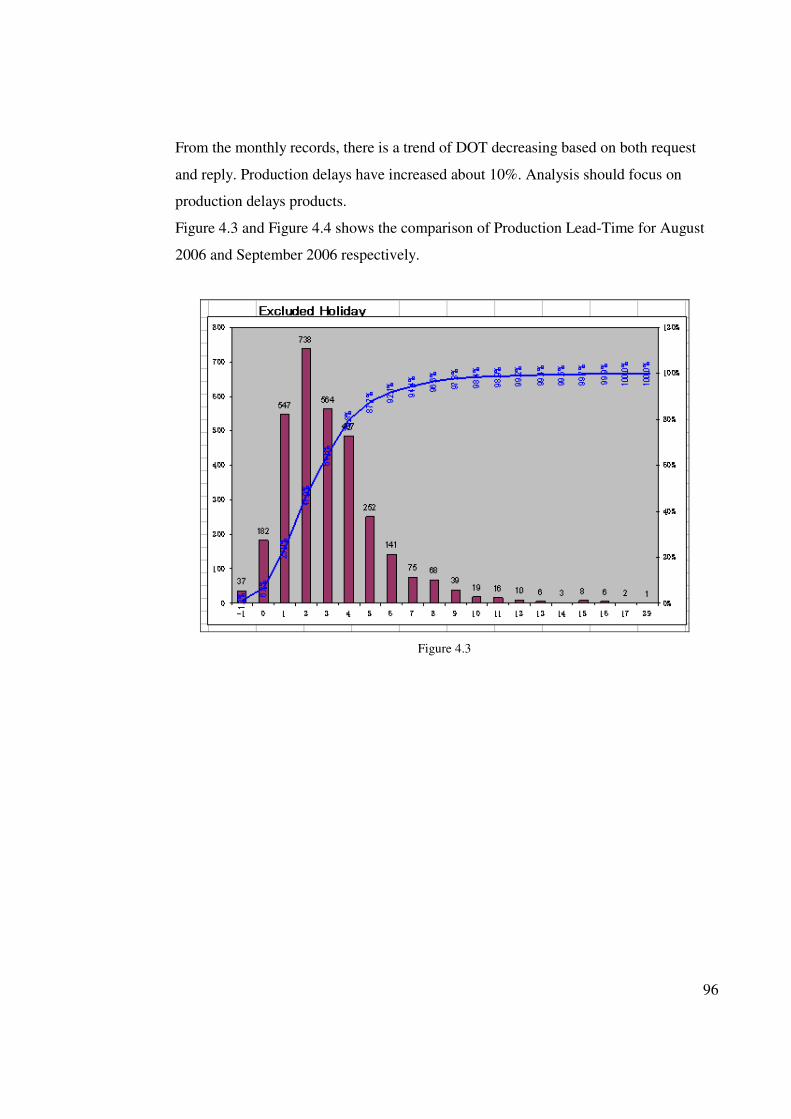
96
From the monthly records, there is a trend of DOT decreasing based on both request
and reply. Production delays have increased about 10%. Analysis should focus on
production delays products.
Figure 4.3 and Figure 4.4 shows the comparison of Production Lead-Time for August
2006 and September 2006 respectively.
Figure 4.3
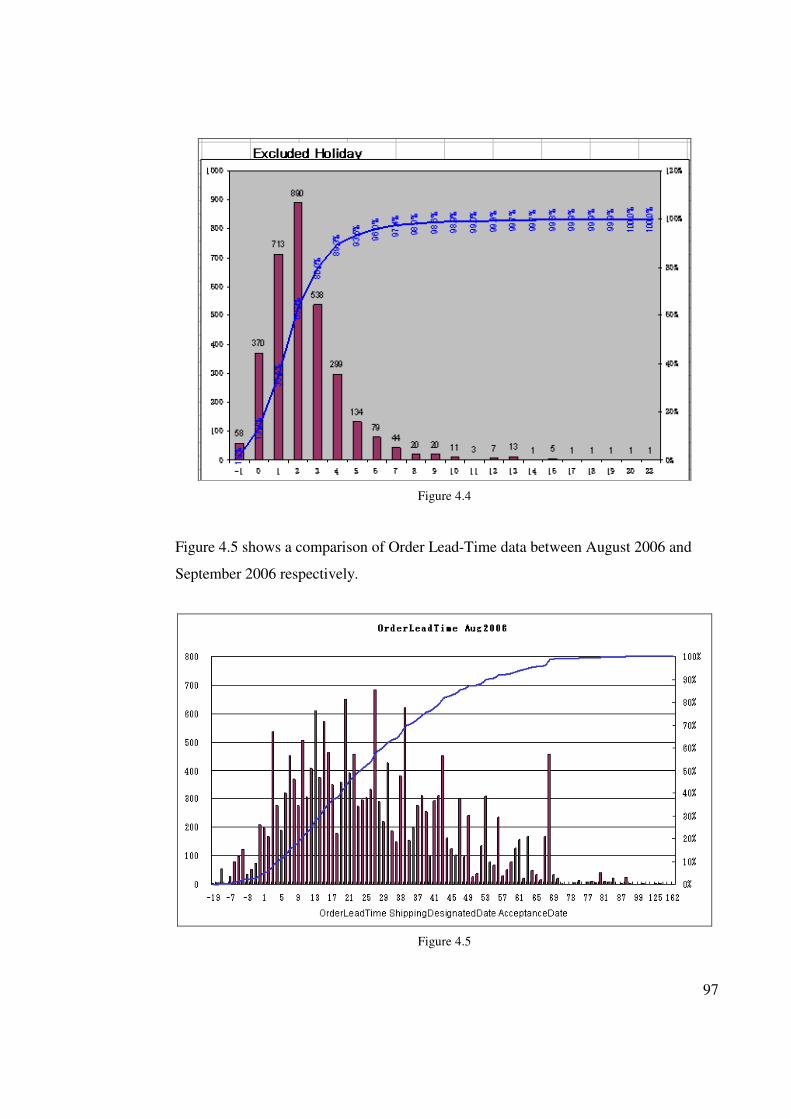
97
Figure 4.4
Figure 4.5 shows a comparison of Order Lead-Time data between August 2006 and
September 2006 respectively.
Figure 4.5
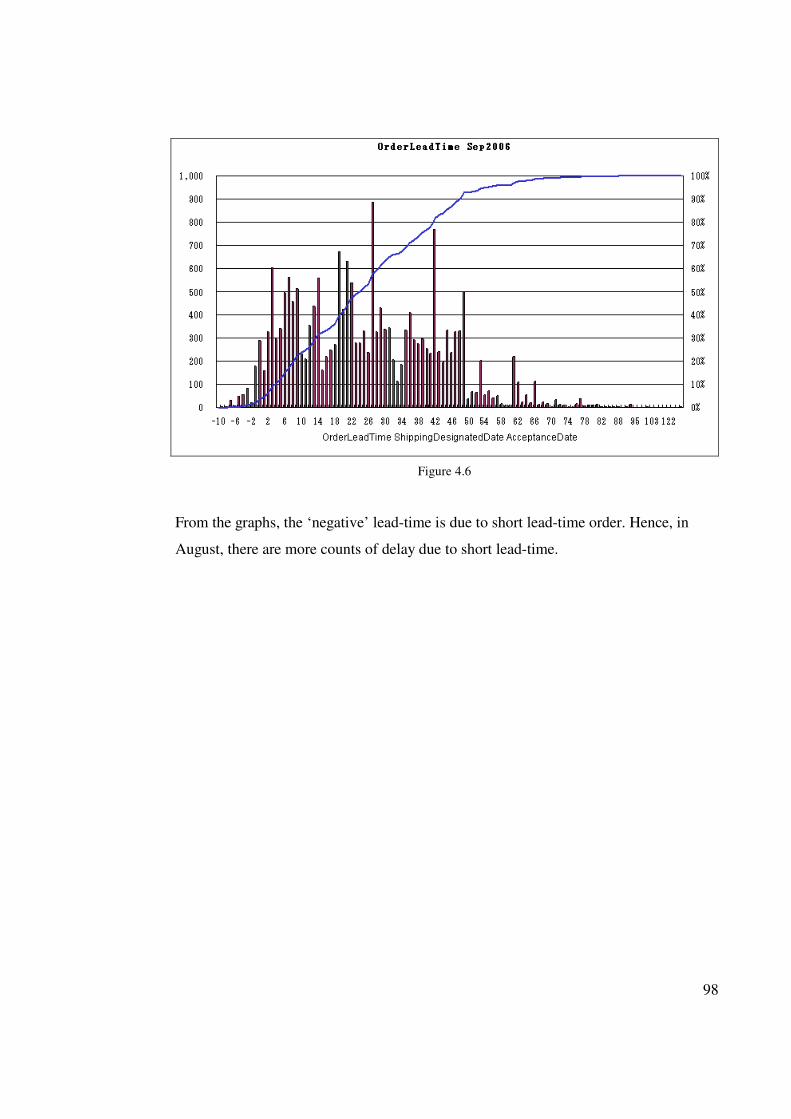
98
Figure 4.6
From the graphs, the ‘negative’ lead-time is due to short lead-time order. Hence, in
August, there are more counts of delay due to short lead-time.
99
4.4 Future Work and New Ideas
This research project does not end here; there are a few tasks to be continued and a few
enhancements on the new tools to make them more efficient. They are:
a) WIP & Inventory and Plan versus Actual Production activities will be continued to
complete the measuring tool.
b) Improvement activities need to be carried out after KPI data analysis
c) An evaluation on new measuring tools will be conducted by assessing the values
created from the improvement actions carried out.
d) For Delivery-On-Time measuring tool, after sorting the data into OK and NG
delivery, and breaking down the NG data into short lead-time, production delay
and logistic delay, details, e.g. lot number and part number, should be listed out so
that studies can be done on why these lots or products encounter long production
lead-time. This is to aid in focusing the problem products or maybe machines.
e) For Production Lead-Time measuring tool, a couple of enhancements can be added
because the production data consists of many other data fields which is useful. For
example, there is process number data in the production data which can calculate
the average lead-time of each process. We can also calculate the production lead-
time for each machine since the machine number is available. In this way, we will
be able to see which process is the bottleneck or identify machines that need to be
serviced or modified.

100
4.5 Summary of Chapter 4
Chapter 4 summarizes the activities done in this research project and assesses how
many of the objectives have been fulfilled. The more recent results have been shown
to understand the sales and production conditions. Any incomplete tasks will be
continued and improvement activities will be continuous. Constant evaluating and
improvement actions are necessary lean operations.
101
REFERENCES
Advanced Manufacturing Magazine, 15th
Sept 2000
James P. Womack and Daniel T. Jones, C 1996, Lean Thinking – Banish Waste and Create
Wealth in your Corporrtion, United States of America
John M. Gross Kenneth R. Mclnnis, C 2003, Kanban Made Simple: Demystifying and
Applying Toyota’s Legendary Manufacturing Process, United States of America
PharmaChem Magazine, February Issue
Steve Bell, C 2006 by John Wiley & Sons, Inc., Lean Enterprise Systems – Using IT for
Continuous Improvement, Hoboken, New Jersey
Tiaan Grobbelaar, 9 Nov 2005, ERP and the lean enterprise, The Technology News Site
http://www.ieaust.org.au/about_us/res/downloads/Code_of_Ethics_2000.pdf
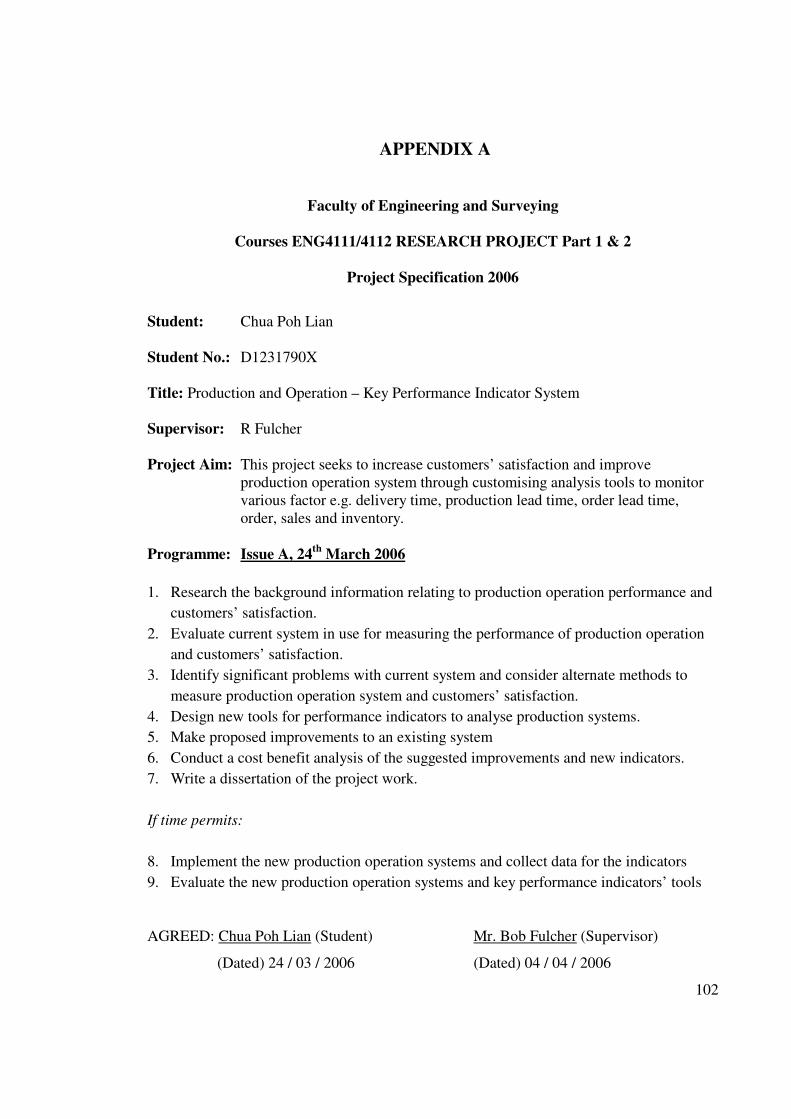
102
APPENDIX A
Faculty of Engineering and Surveying
Courses ENG4111/4112 RESEARCH PROJECT Part 1 & 2
Project Specification 2006
Student: Chua Poh Lian
Student No.: D1231790X
Title: Production and Operation – Key Performance Indicator System
Supervisor: R Fulcher
Project Aim: This project seeks to increase customers’ satisfaction and improve
production operation system through customising analysis tools to monitor
various factor e.g. delivery time, production lead time, order lead time,
order, sales and inventory.
Programme: Issue A, 24th
March 2006
1. Research the background information relating to production operation performance and
customers’ satisfaction.
2. Evaluate current system in use for measuring the performance of production operation
and customers’ satisfaction.
3. Identify significant problems with current system and consider alternate methods to
measure production operation system and customers’ satisfaction.
4. Design new tools for performance indicators to analyse production systems.
5. Make proposed improvements to an existing system
6. Conduct a cost benefit analysis of the suggested improvements and new indicators.
7. Write a dissertation of the project work.
If time permits:
8. Implement the new production operation systems and collect data for the indicators
9. Evaluate the new production operation systems and key performance indicators’ tools
AGREED: Chua Poh Lian (Student) Mr. Bob Fulcher (Supervisor)
(Dated) 24 / 03 / 2006 (Dated) 04 / 04 / 2006
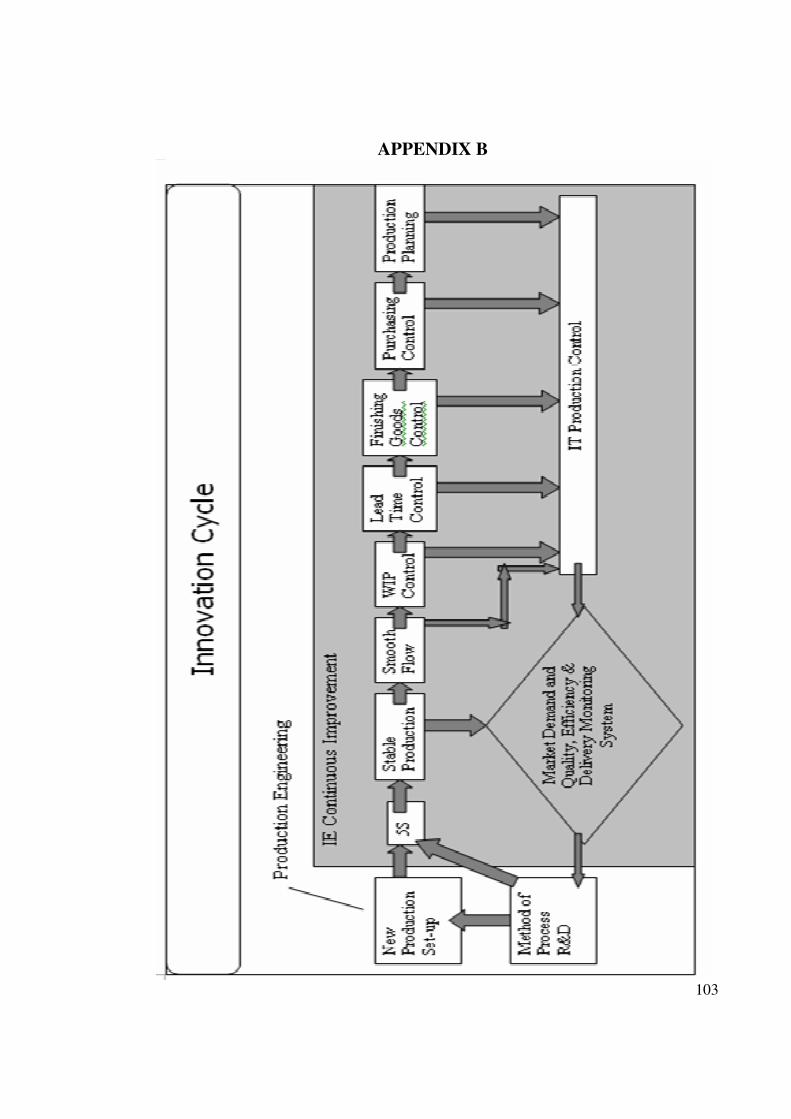
103
APPENDIX B
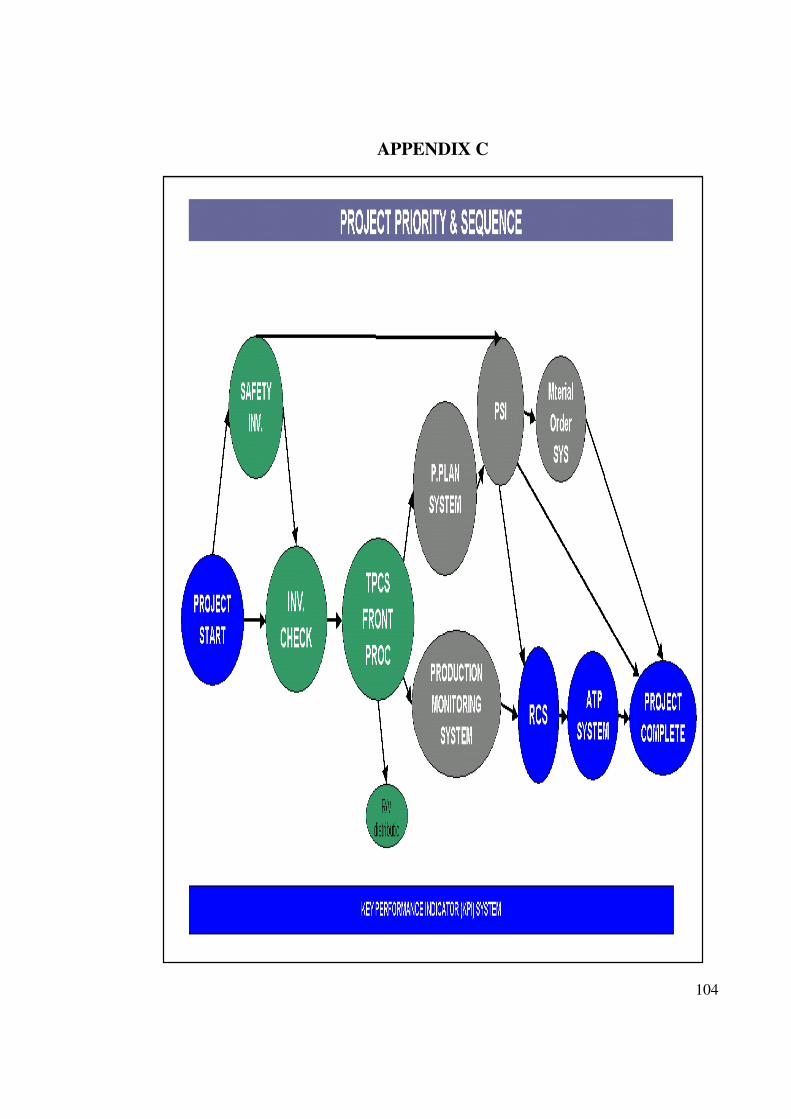
104
APPENDIX C
105
GLOSSARY
5S --- Five terms beginning with ‘S’ utilized to create a workplace sutied for visual control
and lean production. Seiri means to separate needed tools, parts, and instructions from
unneeded materials and to remove the latter. Seiton means to neatly arrange and identify
parts and tools for ease of use. Seiso means to conduct a clean-up campaign. Seiketsu
means to conduct seiri, seiton and seiso at frequent, indeed daily, intervals to maintain a
workplace in perfect condition. Shitsuke means to form the habit of always following the
first four Ss.
7 Wastes --- Taiichi Ohni’s original enumeration of the wastes commonly found in physical
production. These are overproduction ahead of demand, waiting for the next processing
step, unneccessary transport of materials (for example, between process villages or
facilities), overprocessing of parts due to poor tool and product design, inventories more
than the absolute minimum, unneccessary movement by employees during the course of
their work (looking for parts, tools, prints, help, etcetera), and production of defective parts.
Just-in-Time --- A system for producing and delivering the right items at the right time in
the right amounts. Just-in-Time approaches just-on-time when upstream activities occur
minutes or seconds before downstream activities, so single-piece flow is possible. The key
elements of Just-in-Time are flow, pull, standard work (with standard in-process
inventories), and takt time.
Total Production Maintenance (TPM) --- A series of methods, originally pioneered by
Nippondenso (a member of the Toyota group), to ensure that every machine in a production
process is always able to perform its required tasks so that production is never interrupted.