SWOT FINAL Poland - ChemLog Project · Chemical Logistics Cooperation in Central and Eastern Europe...
90
Chemical Logistics Cooperation in Central and Eastern Europe SWOT‐Analysis Poland Weaknesses Strengths Opportunities Threats
Transcript of SWOT FINAL Poland - ChemLog Project · Chemical Logistics Cooperation in Central and Eastern Europe...
Chemical Logistics Cooperation in Central and Eastern Europe
SWOT‐Analysis
Poland
Weaknesses
Strengths
Opportunities
Threats

SWOT‐Analysis Project ChemLog
Project Partner: Poland Page 2/90
TABLE OF CONTENT 1 STRUCTURE .......................................................................................................................................................................... 4
2 INTRODUCTION TO REGION / COUNTRY ....................................................................................................................................... 5
2.1 TERRITORY .................................................................................................................................................................. 5 2.2 POPULATION ............................................................................................................................................................... 6 2.3 POLAND IN NUMBERS .................................................................................................................................................... 7
3 DESCRIPTION OF CHEMICAL INDUSTRY ........................................................................................................................................ 9
3.1 EMPLOYMENT IN CHEMICAL INDUSTRY ............................................................................................................................... 9 3.2 CHEMICALS SALES ................................................................................................................................................. 11 3.3 COMPANY STRUCTURE – SIZE OF ENTERPRISES AND EMPLOYMENT ......................................................................................... 12 3.4 INTERNATIONAL TRADE ................................................................................................................................................ 13 3.5 REGIONAL STRUCTURE OF CHEMICAL INDUSTRY ................................................................................................................. 15
4 DESCRIPTION OF TRANSPORT INFRASTRUCTURE ........................................................................................................................... 17
4.1 INTRODUCTION .......................................................................................................................................................... 17 4.2 INTERMODAL TRANSPORT ............................................................................................................................................. 17
4.2.1 ACTUAL AND PLANNED FIGURES ............................................................................................................................ 18 4.2.2 MAIN CORRIDORS AND MAJOR INFRASTRUCTURE ...................................................................................................... 19 4.2.3 GOVERNMENT PLANS AND POLITICAL PROGRAMS ...................................................................................................... 20
4.3 ROAD TRANSPORT ...................................................................................................................................................... 21 4.3.1 ROADS INFRASTRUCTURE .................................................................................................................................... 23 4.3.2 ACTUAL AND PLANNED FIGURES ............................................................................................................................ 25 4.3.3 MAIN CORRIDORS AND MAJOR INFRASTRUCTURE ...................................................................................................... 26 4.3.4 GOVERNMENT PLANS AND POLITICAL PROGRAMS ...................................................................................................... 28
4.4 RAILWAY TRANSPORT .................................................................................................................................................. 28 4.4.1 ACTUAL AND PLANNED FIGURES ............................................................................................................................ 31 4.4.2 MAIN CORRIDORS AND MAJOR INFRASTRUCTURE ...................................................................................................... 31 4.4.3 GOVERNMENT PLANS AND POLITICAL PROGRAMS ...................................................................................................... 33
4.5 3.5 WATERWAY TRANSPORT THE BASIC WATERWAYS NETWORK IN POLAND ............................................................................ 35 4.5.1 ACTUAL AND PLANNED FIGURES ............................................................................................................................ 38 4.5.2 FORECASTS ABOUT DEVELOPMENT OF WATERWAY TRANSPORT : ................................................................................... 39 4.5.3 MAIN CORRIDORS AND MAJOR INFRASTRUCTURE ...................................................................................................... 39 4.5.4 GOVERNMENT PLANS AND POLITICAL PROGRAMS ...................................................................................................... 41 4.5.5 THE INLAND WATERWAYS INFRASTRUCTURE DEVELOPMENT DIRECTIONS IN POLAND .......................................................... 41
4.6 PIPELINE TRANSPORT .................................................................................................................................................. 42 4.6.1 NATURAL GAS .................................................................................................................................................. 43 4.6.2 CRUDE OIL/FUELS ............................................................................................................................................ 50 4.6.3 ACTUAL AND PLANNED FIGURES ............................................................................................................................ 56 4.6.4 MAIN CORRIDORS AND MAJOR INFRASTRUCTURE ...................................................................................................... 58 4.6.5 GOVERNMENT PLANS AND POLITICAL PROGRAMS ...................................................................................................... 59
5 DESCRIPTION OF CHEMICAL LOGISTICS IN THE REGION / COUNTRY ................................................................................................... 63
6 INTERNAL STRENGTHS OF CHEMICAL COMPANIES AND LOGISTIC PROVIDERS ....................................................................................... 65
6.1 STRENGTHS IN PROCUREMENT ....................................................................................................................................... 66 6.2 STRENGTHS IN WAREHOUSING OF RAW MATERIALS, SEMI‐FINISHED AND FINISHED PRODUCTS ....................................................... 66 6.3 STRENGTHS IN PRODUCTION LOGISTICS ............................................................................................................................ 67 6.4 STRENGTHS IN DISTRIBUTION AND TRANSPORT ................................................................................................................... 67 6.5 STRENGTHS IN PLANNING AND CONTROLLING .................................................................................................................... 67 6.6 STRENGTHS IN ORDER PROCESSING ................................................................................................................................. 68 6.7 STRENGTHS IN INFORMATION LOGISTICS ........................................................................................................................... 68
SWOT‐Analysis Project ChemLog
Project Partner: Poland Page 3/90
7 INTERNAL WEAKNESSES OF CHEMICAL COMPANIES AND LOGISTIC PROVIDERS ..................................................................................... 69
7.1 WEAKNESSES IN PROCUREMENT ..................................................................................................................................... 69 7.2 WEAKNESSES IN WAREHOUSING OF RAW MATERIALS, SEMI‐FINISHED AND FINISHED PRODUCTS ..................................................... 69 7.3 WEAKNESSES IN PRODUCTION LOGISTICS .......................................................................................................................... 69 7.4 WEAKNESSES IN DISTRIBUTION AND TRANSPORT ................................................................................................................ 70 7.5 WEAKNESSES IN PLANNING AND CONTROLLING .................................................................................................................. 70 7.6 WEAKNESSES IN ORDER PROCESSING ............................................................................................................................... 70 7.7 WEAKNESSES IN INFORMATION LOGISTICS ........................................................................................................................ 70
8 EXTERNAL OPPORTUNITIES AND CHANCES FOR CHEMICAL LOGISTICS IN CENTRAL AND EASTERN EUROPE .................................................... 71
8.1 7.1 ECONOMIC TRENDS ............................................................................................................................................... 71 8.2 SOCIAL AND CULTURAL TRENDS ...................................................................................................................................... 72 8.3 TECHNOLOGICAL TRENDS .............................................................................................................................................. 72 8.4 ENVIRONMENT AND ENERGY ......................................................................................................................................... 72 8.5 POLITICS AND INNOVATION ........................................................................................................................................... 72 8.6 TRANSPORT INFRASTRUCTURE ....................................................................................................................................... 73
8.6.1 RAILWAY ........................................................................................................................................................ 73 8.6.2 WATERWAY ..................................................................................................................................................... 74 8.6.3 ROAD ............................................................................................................................................................. 74 8.6.4 INTERMODAL ................................................................................................................................................... 74 8.6.5 PIPELINE ......................................................................................................................................................... 75
8.7 SAFETY AND SECURITY ................................................................................................................................................. 77 8.8 INDUSTRY SECTOR AND COMPETITION .............................................................................................................................. 77
8.8.1 CUSTOMERS .................................................................................................................................................... 77 8.8.2 SUPPLIERS ....................................................................................................................................................... 77 8.8.3 ACCESS TO THE MARKET ..................................................................................................................................... 78 8.8.4 SUBSTITUTES ................................................................................................................................................... 78
9 EXTERNAL THREATS, PROBLEMS AND BARRIERS FOR CHEMICAL LOGISTICS IN CENTRAL AND EASTERN EUROPE ............................................. 79
9.1 ECONOMIC TRENDS ..................................................................................................................................................... 79 9.2 SOCIAL AND CULTURAL TRENDS ...................................................................................................................................... 79 9.3 TECHNOLOGICAL TRENDS .............................................................................................................................................. 79 9.4 ENVIRONMENT AND ENERGY ......................................................................................................................................... 79 9.5 POLITICS AND INNOVATIONS .......................................................................................................................................... 80 9.6 TRANSPORT INFRASTRUCTURE ....................................................................................................................................... 80
9.6.1 8.6.1 RAILWAY ................................................................................................................................................ 80 9.6.2 WATERWAY ..................................................................................................................................................... 81 9.6.3 ROAD ............................................................................................................................................................. 81 9.6.4 INTERMODAL ................................................................................................................................................... 81 9.6.5 PIPELINE ......................................................................................................................................................... 82
9.7 SAFETY AND SECURITY ................................................................................................................................................. 82 9.8 INDUSTRY SECTOR AND COMPETITION .............................................................................................................................. 82
9.8.1 CUSTOMERS .................................................................................................................................................... 82 9.8.2 SUPPLIERS ....................................................................................................................................................... 82 9.8.3 ACCESS TO THE MARKET ..................................................................................................................................... 83 9.8.4 SUBSTITUTES ................................................................................................................................................... 83
10 NEEDS FOR FUTURE ACTIONS AND IMPROVEMENTS ‐ CONCLUSIONS ................................................................................................. 84
10.1 CONCLUSIONS FOR CHEMICAL PRODUCERS SECTOR ......................................................................................................... 84 10.2 CONCLUSIONS FOR ROAD SECTOR .............................................................................................................................. 84 10.3 CONCLUSIONS FOR RAILWAY SECTOR .......................................................................................................................... 84 10.4 CONCLUSIONS FOR INLAND WATERWAY SECTOR ........................................................................................................... 85 10.5 CONCLUSIONS FOR INTERMODAL SECTOR ..................................................................................................................... 85 10.6 CONCLUSIONS FOR PIPELINE SECTOR ........................................................................................................................... 85
11 LITERATURE ....................................................................................................................................................................... 87
11.1 LIST OF RELEVANT LITERATURE, STUDIES, SURVEYS, POLICY DOCUMENTS .............................................................................. 87
SWOT‐Analysis Project ChemLog
Project Partner: Poland Page 4/90
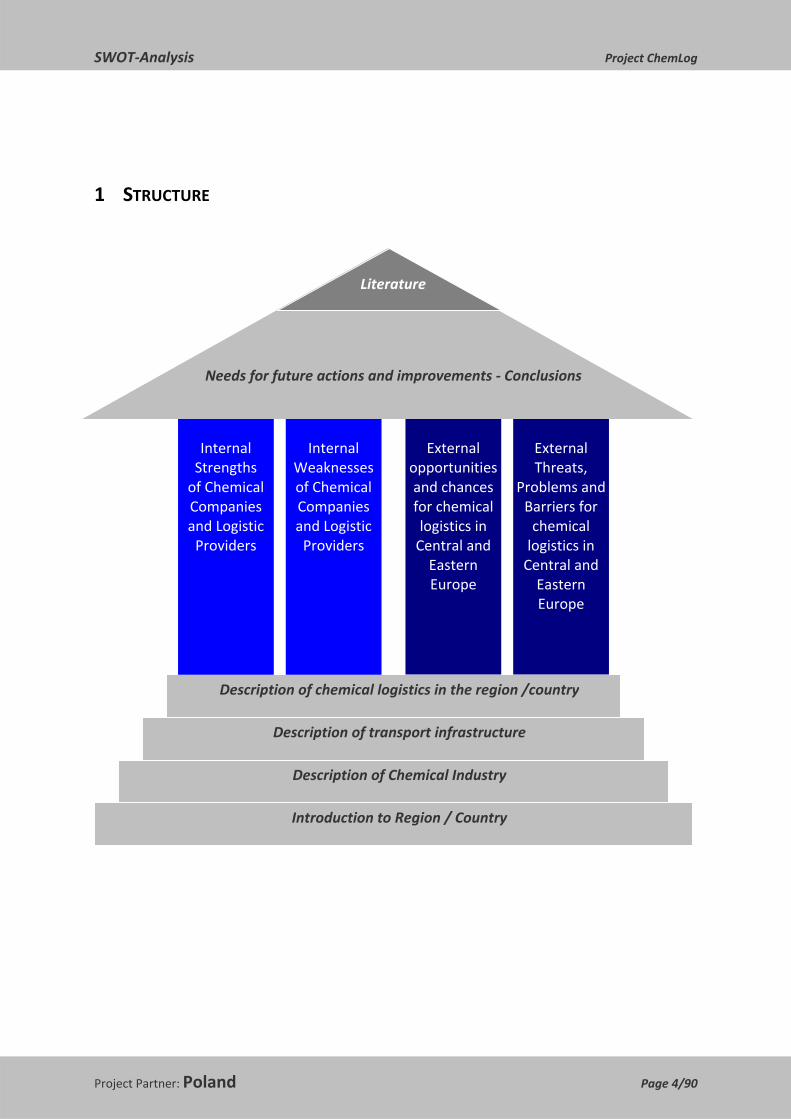
1 STRUCTURE
Introduction to Region / Country
Description of Chemical Industry
Description of transport infrastructure
Description of chemical logistics in the region /country
Internal Strengths of Chemical Companies and Logistic Providers
Internal Weaknesses of Chemical Companies and Logistic Providers
External opportunities and chances for chemical logistics in Central and Eastern Europe
External Threats,
Problems and Barriers for chemical logistics in Central and Eastern Europe
Needs for future actions and improvements ‐ Conclusions
Literature

SWOT‐Analysis Project ChemLog
Project Partner: Poland Page 5/90
2 INTRODUCTION TO REGION / COUNTRY
2.1 TERRITORY Poland is located to the North of the central European area on the Baltic Sea. Our country is one of the largest in Europe according to its territory. Poland is in the Central European time zone (GMT ‐1). Poland is 322,575 km2 in size; placing it in eighth place in Europe(disregarding the European territory of Russia).
Poland’s western border is with Germany; the south‐western border is with the Czech Republic and to the south with Slovakia, to the North is the Baltic Sea and the Russian border (the Kaliningrad enclave); to the north‐east is the short Lithuanian border and to the east ‐ borders with Belarus and Ukraine.
The country’s total length of borders is 3,504 kilometres. The Russian Kaliningrad enclave border is 210 km, the border with Belarus ‐ 418 km and the Ukrainian border is 535 km, all of which form the EU’s external border which jointly totals 1,163 kilometres. Poland’s border with Lithuania is 210 km, with Germany ‐ 467 km, Slovakia ‐ 541 km and with the Czech Republic is 790 km – all these form internal EU borders and total 1,902 kilometres.
To the north Poland has a coastline of 520 km on the Baltic Sea, the southern border is formed by the Karpaty and Sudety mountains. The eastern border is formed by the river Bug and that on the west, by the Odra and Nysa Luzycka rivers.
The distance between the northern and southern borders is 649 km and between the western and eastern borders ‐ 689 km. The country’s land surface area is 312,685 km2, whilst the territorial waters cover 8.7 thou. km2 and the area of the Szczecin and Vistula estuaries cover 1.2 thou. km2.
SWOT‐Analysis Project ChemLog
Project Partner: Poland Page 6/90
2.2 POPULATION Poland’s social structure has been radically changed since WW II. The major factors of these changes have been both of political and economic nature. A significant factor dividing Poland’s social structures, have been the inherent regional differences that relate to the level of economic development. Whereas prior to WW II Poland was a multicultural state,today it can be said to be made up of one national group.
There are 38,230,080 people living permanently in Poland, i.e. a figure of 122 residents per 1 km2 of land. But, the population isn’t distributed evenly. The largest numbers of residentsare to be found in the voivodships of: Mazowsze, Slask, Wielkopolska and Malopolska; the least in Podlasie, Opole and the Lubuskie regions. The density of the population in particulararea is directly related to the development of industry and the infrastructure in the region.Thus, urban residents form 61.8% of the country’s population, of which the largestconcentrations are found in the voivodships of: Dolny Slask, Zachodniopomorskie and Pomorze; whereas of the 38.2% of people living in rural areas, the largest ratios were in theLublin, Podkarpacie and the Swietokrzyskie regions.
36,968,487 of the population claim to be ethnically Polish, i.e. 96.7%. Of the remaining 3.3% of the populace, some declare themselves to be: German, Belarusian, Ukrainian andRomany, with 2.1% not stating their ethnic origin. 96.4% of the populace was born in Poland,while only 2% were born abroad, with 1.6% not stating their place of birth. The largest percentage of foreign births among residents, were recorded in the voivodships of: Dolny Slask, Lubuskie, Opole, Zachodniopomorskie and the Warminsko ‐ Mazurskie regions; this is related to their locations adjacent to foreign borders. 97% of the population has Polish citizenship alone, 1.2% dual citizenship (inc. Polish) and 0.1% is not Polish citizens; the citizenship of 1.7% of residents, was not ascertained. In total 98.2% of the population withinthe Polish borders have Polish citizenship rights.
2007
Inhabitants in Mio* 38,115.6
Area in square km 312,679Source: Central Statistical Office (GUS)
*31st of Dec., 2007(migration factor: ‐ 0.0005)

SWOT‐Analysis Project ChemLog
Project Partner: Poland Page 7/90
2.3 POLAND IN NUMBERS The Polish economy is one of the fastest developing in Europe. Our country’s GDP grew by 7.4%, in the first quarter and by 6.7%, in the second quarter of 2007. Such impressive resultshave led to the high level of growth of investments, exports and the level of industrialproduction.
Variable 2000 2001 2002 2003 2004 2005 2006 2007 I‐II Q 2008
GDP (bn PLN)* 744 780 809 843 925 983 1,060 1,175 605
GDP change (preceding year=100)*
104.3 101.2 101.4 103.9 105.3 103.6 106.2 106.7 104.8a)
FDI inflow (bn EUR)**
10,334 6,372 4,371 4,067 10,237 8,330 15,741 16,674 11,213b)
Unemployment rate (%)*
15.1 17.5 20.0 20.0 19.0 17.6 14.8 11.2 9.5c)
Exports (bn EUR)**
39,022 46,537 49,338 53,836 65,847 77,562 93,406 105,893 140,981
Imports (bn EUR)**
52,349 55,094 57,039 58,913 70,399 79,804 98,945 118,262 157,185
External trade turnover (bn EUR)**
91,371 101,631 106,377 112,749 136,246 157,366 192,351 224,155 298,166
External trade balance (bn EUR)**
‐13,327 ‐8,557 ‐7,701 ‐5,077 ‐4,552 ‐2,242 ‐5,539 ‐12,369 ‐16,204
Inflation rate (CPI, preceding year=100)*
110.1 105.5 101.9 100.8 103.5 102.1 101.0 102.5 104.2d)
Source: *Central Statistical Office (GUS), **National Bank of Poland (NBP)
Gross Domestic Product in million EUR:
2000 2001 2002 2003 2004 2005 2006 2007
185 713.8 212 293.8 209 617.4 191 643.8 204 236.5 244 420.1 272 088.9 310 612.9Source: Eurostat

SWOT‐Analysis Project ChemLog
Project Partner: Poland Page 8/90
Gross Domestic Product / capita:
2000 2001 2002 2003 2004 2005 2006 2007
4,852 7,137 8,105 Source: Poland in Figures 2008, GUS
GDP per capita in Purchasing Power Standards (PPS) (EU‐27 = 100)
2000 2001 2002 2003 2004 2005 2006 2007
48.3 47.6 48.3 48.9 50.6 51.3 52.3 53.7 Source: Eurostat

SWOT‐Analysis Project ChemLog
Project Partner: Poland Page 9/90
3 DESCRIPTION OF CHEMICAL INDUSTRY
Prompt development of the whole industry in Poland, also observed in 2007, is more systematic and stable. The acceleration of the economic development in 2007 that amounted to the level of 6.5% was the result of both consumption growth and the investments, creating solid base for its further development. The Polish chemical industry has a potential which, being used in a proper way, should positively influence the whole economy.
In 2007 sales value of chemical industry achieved the level of 24,762.6 Mio EUR, i.e. 9.3% more than in 2006, what was nearly 10% of the total value of sales for the whole industry (the increase by 4.4% in comparison to 2006) and 8.2% of the manufacturing industry sales. A slight increase of 3.7% was noted as for the income earned from the sales of chemical goods and a significant growth (18.6%) in sales of rubber and plastic products.
The financial results of chemical companies achieved in 2007 show a significant improvement of their financial position. In comparison with 2006, in 2007 the total net revenues of the chemical industry total 1,655.6 Mio EUR of which production of chemical products contributed with 1,087.9 Mio EUR (by 35.5% more than in 2006) and the production of rubber and plastics with 567.7 Mio EUR (i.e. 47.1% higher in comparison to the previous year).
However, the analysis of the chemical products trade balance have been also indicating highest deficit in pharmaceuticals and some kind of plastics, as well as in special organic chemicals. There is also a significant deficit in production of basic chemicals and this is directly the reason of low plastics production.
3.1 EMPLOYMENT IN CHEMICAL INDUSTRY
In comparison to the end of 2006, the number of employees in the processing industry increased by 4.3%, at the production of chemical products by 0.8% and at the production of rubber and plastic products by over 9%.
SWOT‐Analysis Project ChemLog
Project Partner: Poland Page 10/90
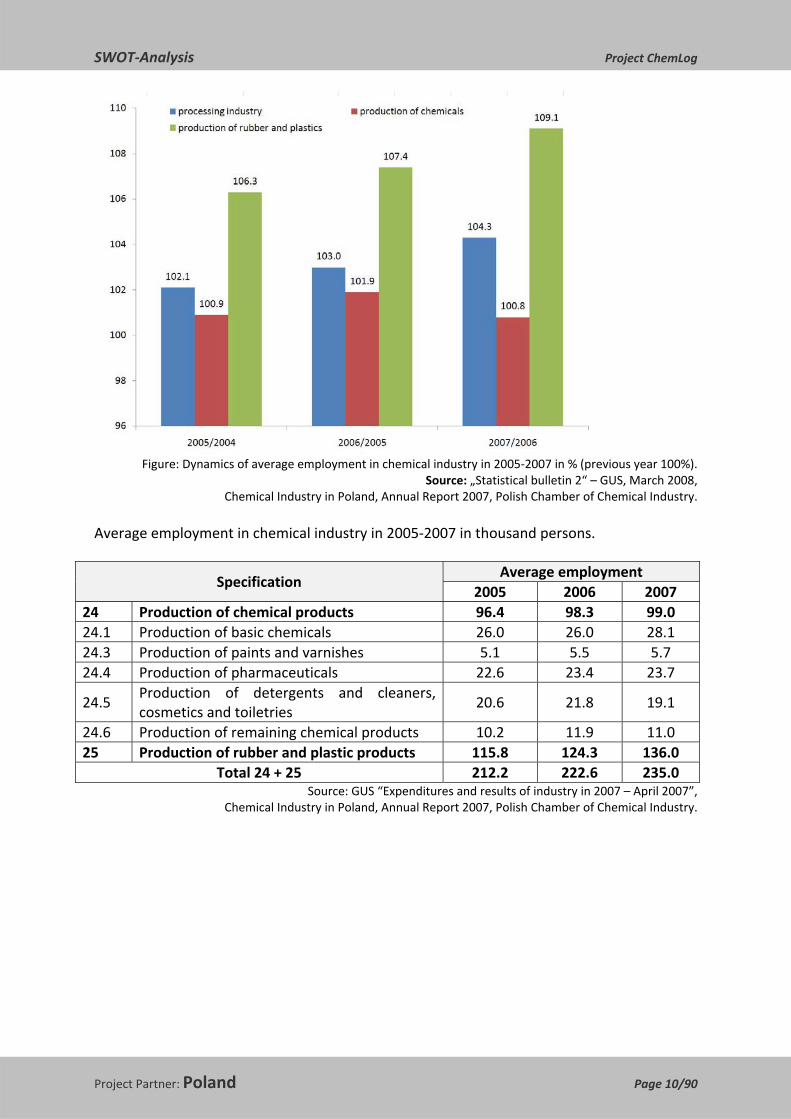
Figure: Dynamics of average employment in chemical industry in 2005‐2007 in % (previous year 100%).
Source: „Statistical bulletin 2“ – GUS, March 2008, Chemical Industry in Poland, Annual Report 2007, Polish Chamber of Chemical Industry.
Average employment in chemical industry in 2005‐2007 in thousand persons.
Specification Average employment
2005 2006 2007 24 Production of chemical products 96.4 98.3 99.0 24.1 Production of basic chemicals 26.0 26.0 28.1 24.3 Production of paints and varnishes 5.1 5.5 5.7 24.4 Production of pharmaceuticals 22.6 23.4 23.7
24.5 Production of detergents and cleaners, cosmetics and toiletries
20.6 21.8 19.1
24.6 Production of remaining chemical products 10.2 11.9 11.0 25 Production of rubber and plastic products 115.8 124.3 136.0
Total 24 + 25 212.2 222.6 235.0 Source: GUS “Expenditures and results of industry in 2007 – April 2007”,
Chemical Industry in Poland, Annual Report 2007, Polish Chamber of Chemical Industry.

SWOT‐Analysis Project ChemLog
Project Partner: Poland Page 11/90
The average labour efficiency in the enterprises of chemical industry in total, calculated as the value of income per one employee, increased by 3.5% in 2007. This indicator totalled 2.9% at the production of chemical products and 8.4% at the production of rubber and plastic products.
In 2008 the GDP increased 4.8% in comparison to 2007. The GDP growth rate was high (6.0%‐5.8%) during the first two quarters of 2008. In the third and fourth quarter the rate of GDP product slowed down significantly reaching 2.9% in the end of the year.
The decline of the sold production of manufacturing industry was observed in the second half of the last year. On the year‐over‐year basis the dynamics of sold production of manufacturing industry in 2008 dropped to 2.8% what is 10.7 percentages less than in 2007 when it was 13.5%. In 2008 the value of dynamic of chemicals and chemical products manufacturing and sold production decreased by 4.8% on year‐over‐year basis, while the value of dynamic of rubber and plastic products manufacturing has grown by 5.0%. The share of chemical industry in the structure of sold production of the whole manufacturing industry amounted to 12.3%.
The foreign trade deficit underwent further deepening to 9,334.7 Mio EUR ‐ 884 Mio EUR more than in 2007.
Chemical industry in Poland requires reorientation of production structure and further consolidation. Regarding the production structure basic chemicals amounts to 53.0%. In consequence increase of manufacturing of higher value added products is required.
3.2 CHEMICALS SALES Sales of chemical industry in Mio EUR:
2000* 2001* 2002*2003** 2004** 2005** 2006** 2007**
Manufacture of basic chemicals*
n.a. n.a. n.a. n.a. n.a. 4,026.0 4,939.2 5,804.0
Manufacture of pesticides and other agro‐chemical products
n.a. n.a. n.a. n.a. n.a. 82.2
Manufacture of paints, varnishes and similar coatings, printing ink and mastics
n.a. n.a. n.a. n.a. n.a.
610.6 758.9 864.7

SWOT‐Analysis Project ChemLog
Project Partner: Poland Page 12/90
Manufacture of pharmaceuticals, medicinal chemicals and botanical products**
n.a. n.a. n.a. n.a. n.a.
2,410.6 2,760.9 3,042.6
Manufacture of soap and detergents, cleaning and polishing preparations, perfumes and toilet preparations
n.a. n.a. n.a. n.a. n.a.
3,204.4 3,411.7 3,098.9
Manufacture of other chemical products***
n.a. n.a. n.a. n.a. n.a. 690.8 877.5 908.8
Manufacture of man‐made fibres
n.a. n.a. n.a. n.a. n.a. n.a. n.a. 84.3
Manufacture of chemicals and chemical products
5,891.5 7,675.9 7,780.48,305.2 9,431.8 1,190.4 3,006.4 3,885.6
Manufacture of rubber products****
n.a. n.a. n.a. n.a. n.a. n.a. n.a. n.a.
Manufacture of plastic products*****
n.a. n.a. n.a. n.a. n.a. n.a. n.a. n.a.
Manufacture of plastic and rubber products
3,820.7 4,815.0 5,192.94,472.0 5,150.3 6,370.6 7,826.8 9,561.9
Explanations: *‐ sold production, **‐ sales income, n.a. – not available Share of chemical sales in processing industry in %
2000 2001 2002 2003 2004 2005 2006 2007
Manufacture of chemicals and chemical products
7.9 7.3 7.6 7.8 7.3 7.3 7.3 7.3
Manufacture of plastic and rubber product
4.8 4.6 5.1 5.6 5.2 5.4 5.6 5.8
3.3 COMPANY STRUCTURE – SIZE OF ENTERPRISES AND EMPLOYMENT Number of enterprises 2000* 2001* 2002* 2003 2004 2005 2006 2007
Manufacture of chemicals and chemical products
n.a. n.a. n.a. 741 727 758 750 743
49‐249* 215 206 215 n.a. n.a. n.a. n.a. n.a.
1 ‐ 49 employees n.a. n.a. n.a. 458 443 469 455 440
50‐249 employees n.a. n.a. n.a. 211 211 217 220 226
250 and more employees 82 73 70 72 73 72 75 77

SWOT‐Analysis Project ChemLog
Project Partner: Poland Page 13/90
Manufacture of plastic and rubber product
n.a. n.a. n.a. 1,996 2,034 2,086 2,078 2,069
49‐249* 461 425 435 n.a. n.a. n.a. n.a. n.a.
1 ‐ 49 employees n.a. n.a. n.a. 1,507 1,515 1,545 1,492 1,442
50‐249 employees n.a. n.a. n.a. 437 459 476 511 539
250 ‐ … employees 45 41 49 52 60 65 74 88 Number of employees in thousand persons
2000 2001 2002 2003 2004 2005 2006 2007
Manufacture of chemicals and chemical products
105.0 103.0 97.0 95.0 95.5 96.4 98.3 99.0
Manufacture of plastic and rubber product
102.0 99.7 100.0 103.3 109.0 115.8 124.3 136.0
Explanations: * Data published by GUS are given in range of 49 – 249 enterprises.
3.4 INTERNATIONAL TRADE Export quota in % 2000 2001 2002 2003 2004 2005 2006 2007
Manufacture of chemicals and chemical products
6.2 6.0 5.9 6.0 5.9 6.1 6.1 6.2
Manufacture of plastic and rubber products
3.8 4.3 4.9 5.1 5.0 5.2 5.6 5.8
Import of chemicals in Mio EUR
2000 2001 2002 2003 2004 2005 2006 2007
Manufacture of basic chemicals*
n.a. n.a. n.a. n.a. n.a. n.a. n.a. n.a.
Manufacture of pesticides and other agro‐chemical products
n.a. n.a. n.a. n.a. n.a. n.a. n.a. n.a.
Manufacture of paints, varnishes and similar coatings, printing ink and mastics
685.4 702.0 740.9 780.9 868.6 919.2 1,020.8 1,126.0
Manufacture of pharmaceuticals, medicinal chemicals and botanical products**
1,663.1 2,034.9 2,160.02,085.0 2,252.3 2,486.8 2,947.4 3,336.1

SWOT‐Analysis Project ChemLog
Project Partner: Poland Page 14/90
Manufacture of soap and detergents, cleaning and polishing preparations, perfumes and toilet preparations
741.7 773.8 866.7 871.9 1,011.9 1,057.1 1,232.4 1,523.5
Manufacture of other chemical products***
730.0 795.5 856.8 852.6 904.7 1,043.9 1,232.4 1,304.2
Manufacture of man‐made fibres
984.7 1,033.2 969.0 905.6 1,035.0 959.2 1,027.7 1,095.8
Manufacture of chemicals and chemical products
7,693.0 8,381.7 8,751.68,841.4 10,150.5 1,364.7 3,199.2 14,943.8
Manufacture of rubber products****
643.0 691.5 788.1 884.1 1,082.2 1,267.5 1,641.3 1,992.3
Manufacture of plastic products*****
1,726.1 1,848.9 1,991.22,155.8 2,383.3 3,613.9 3,047.4 3,488.0
Manufacture of plastic and rubber products
2,369.1 2,540.4 2,779.33,039.9 3,465.5 3,881.4 4,688.8 5,480.3
Geographic breakdown of chemicals export in %
2000 2001 2002 2003 2004 2005 2006 2007
EU 27 ‐ ‐ ‐ ‐ ‐ ‐ ‐ 73.2
EU 15 54.9 52.4 53.2 55.0 52.4 50.8 52.9 52.7
Estonia, Latvia, Lithuania, Malta, Poland, Slovakia, Slovenia, Czech Republic, Hungary, Cyprus
‐ ‐ ‐ ‐ ‐ ‐ ‐ ‐
Bulgaria, Rumania ‐ ‐ ‐ ‐ ‐ ‐ ‐ ‐
Rest of Europe ‐ ‐ ‐ ‐ ‐ ‐ ‐ ‐
NAFTA ‐ ‐ ‐ ‐ ‐ ‐ ‐ ‐
Latin America and the Caribbean ‐ ‐ ‐ ‐ ‐ ‐ ‐ ‐
Asia ‐ ‐ ‐ ‐ ‐ ‐ ‐ ‐
Africa ‐ ‐ ‐ ‐ ‐ ‐ ‐ ‐
Australia / Oceania ‐ ‐ ‐ ‐ ‐ ‐ ‐ ‐

SWOT‐Analysis Project ChemLog
Project Partner: Poland Page 15/90
Geographic breakdown of chemicals import in %
2000 2001 2002 2003 2004 2005 2006 2007
EU 27 ‐ ‐ ‐ ‐ ‐ ‐ ‐ 85.7
EU 15 73.2 72.5 72.8 72.7 75.1 77.3 76.4 75.5
Estonia, Latvia, Lithuania, Malta, Poland, Slovakia, Slovenia, Czech Republic, Hungary, Cyprus
‐ ‐ ‐ ‐ ‐ ‐ ‐ ‐
Bulgaria, Rumania ‐ ‐ ‐ ‐ ‐ ‐ ‐ ‐
Rest of Europe ‐ ‐ ‐ ‐ ‐ ‐ ‐ ‐
NAFTA ‐ ‐ ‐ ‐ ‐ ‐ ‐ ‐
Latin America and the Caribbean ‐ ‐ ‐ ‐ ‐ ‐ ‐ ‐
Asia ‐ ‐ ‐ ‐ ‐ ‐ ‐ ‐
Africa ‐ ‐ ‐ ‐ ‐ ‐ ‐ ‐
Australia / Oceania ‐ ‐ ‐ ‐ ‐ ‐ ‐ ‐
3.5 REGIONAL STRUCTURE OF CHEMICAL INDUSTRY Major Companies and chemical sites Turnover 2007
in Mio EUR* Location /
chemical site Number of employees in
2007
PKN ORLEN S.A. 15,966.78 Plock 22,927
Rafineria Trzebinia S.A. 259.08 Trzebinia 223
CIECH S.A. 954.49 Warsaw 7,420
Zaklady Azotowe PULAWY S.A. 698.18 Pulawy 3,316
Instytut Nawozow Sztucznych Pulawy 10.60 Pulawy 293
Zaklady Chemiczne POLICE S.A. 501.45 Police 2,912
ANIWIL SA 577.13 Wloclawek 1,437
Zaklady Azotowe KEDZIERZYN S.A. 463.70
Kedzierzyn Kozle
1,705
Zaklady Azotowe in Tarnow‐Moscice S.A.
361.44 Tarnow 2,500
PCC ROKITA S.A. 201.28 Brzeg Dolny 757
BRENNTAG POLSKA Sp. z o.o. 297.59
Kedzierzyn Kozle
441
BIS IZOMAR Sp. z o.o. 43.49 Warsaw 942.8 Source: Chemical Industry in Poland, Annual Report 2007, Polish Chamber of Chemical Industry.
* Turnover in Mio EUR = Total income in Mio EUR EUR/PLN = 3,5820 in 2007/12/31

SWOT‐Analysis Project ChemLog
Project Partner: Poland Page 16/90
Explanations:
Ministry of Treasury owns shares in the following Polish companies: Zaklady Chemiczne POLICE S.A., Zaklady Azotowe PULAWY S.A., CIECH S.A., ANWIL SA, Zaklady Azotowe Tarnow‐Moscice S.A., Zaklady Azotowe KEDZIERZYN S.A.
According to the Nafta Polska S.A. the activity is aimed at full privatization of all companies and creation of two chemical groups as the final goal:
I. Ciech S.A., Zaklady Azotowe KEDZIERZYN S.A., Zaklady Azotowe in Tarnow‐Moscice S.A. and optionally ANWIL SA
II. Zaklady Azotowe PULAWY S.A. and Zaklady Chemiczne POLICE S.A.
Efficient and effective privatization combined with consolidation should provide: development of strong chemical groups, easier access to innovative technology, implementation of investment programs, easier access to raw materials and enhancement of synergy.

SWOT‐Analysis Project ChemLog
Project Partner: Poland Page 17/90
4 DESCRIPTION OF TRANSPORT INFRASTRUCTURE
4.1 INTRODUCTION
Due to the AGR – European Agreement on Main Traffic Arteries, AGC – European Agreement on Main International Railways Lines and AGTC – European Agreement on Important International Combined Transport and Related Installations, Poland is an important transit country at West – East and North – South directions.
4.2 INTERMODAL TRANSPORT
The intermodal transport in Poland is still a young market with slow, but stable growth.
Within railway intermodal transport in 2007, there were carried 33.1 % containers (loaded and empty) more than in 2006, while above 82.3 % was realized in international transport. The number of swap bodies was on the similar level as in previous year.
Fig: Terminals in Poland for intermodal transport

SWOT‐Analysis Project ChemLog
Project Partner: Poland Page 18/90
4.2.1 ACTUAL AND PLANNED FIGURES
Goods traffic according to transport modes ‐ quantity
Goods traffic according to transport modes – quantity (millions of tons)
Goods traffic in Mio tons
2000 2001 2002 2003 2004 2005 2006 2007
Total 1 271.529 1 241.382 1 233.209 1 238.842 1 324.511 1 422.576 1 480.259 1 532.278
Road 1 006.705 166.856 931.190 911.997 956.939 1 079.761 1 113.880 1 213.246
Railway 187.247 996.517 222.908 241.629 282.919 269.553 291.420 245.346
Inland waterway
10.433 10.255 7.729 7.968 8.747 9.607 9.271 9.792
Pipeline 44.342 45.301 46.132 51.782 53.378 54.259 55.631 52.866
Source: Statistical Yearbook of the Republic of Poland
Goods traffic – performance in 1000 tkm (quantity * km):
Goods traffic in Mio tons‐km
2000 2001 2002 2003 2004 2005 2006 2007
Total 284 740 n.a. 254 324 260 868 290 899 228 216 248 907 267 309
Road 75 023 77 228 80 318 85 989 110 481 119 740 136 490 159 527
Railway 54 448 47 913 47 756 49 595 52 332 49 972 53 622 54 253
Inland waterway
1 173 1 264 1 126 872 1 066 1 277 1 237 1 338
Pipeline 20 354 21093 20 854 23 871 24 806 25 388 25 588 23 513Source: Statistical Yearbook of the Republic of Poland
Explanations:
In 2007, all modes of transport carried 1532.7 million tonnes of goods, which is 7.4% more than in the previous year, and the transport performance amounted to 267.3 billion tonne‐kilometres, which is 7.5% more than in previous year. Transport of goods by all modes increased, except for pipeline transport.

SWOT‐Analysis Project ChemLog
Project Partner: Poland Page 19/90
Changes in the dynamic and structure of goods and transport performance are illustrated with the following data:
Source: Central Statistic Yearbook of Transport/2008
4.2.2 MAIN CORRIDORS AND MAJOR INFRASTRUCTURE
Main corridors of road transport
Logistic nodes / Terminals
Regional integration in European Transport Corridors
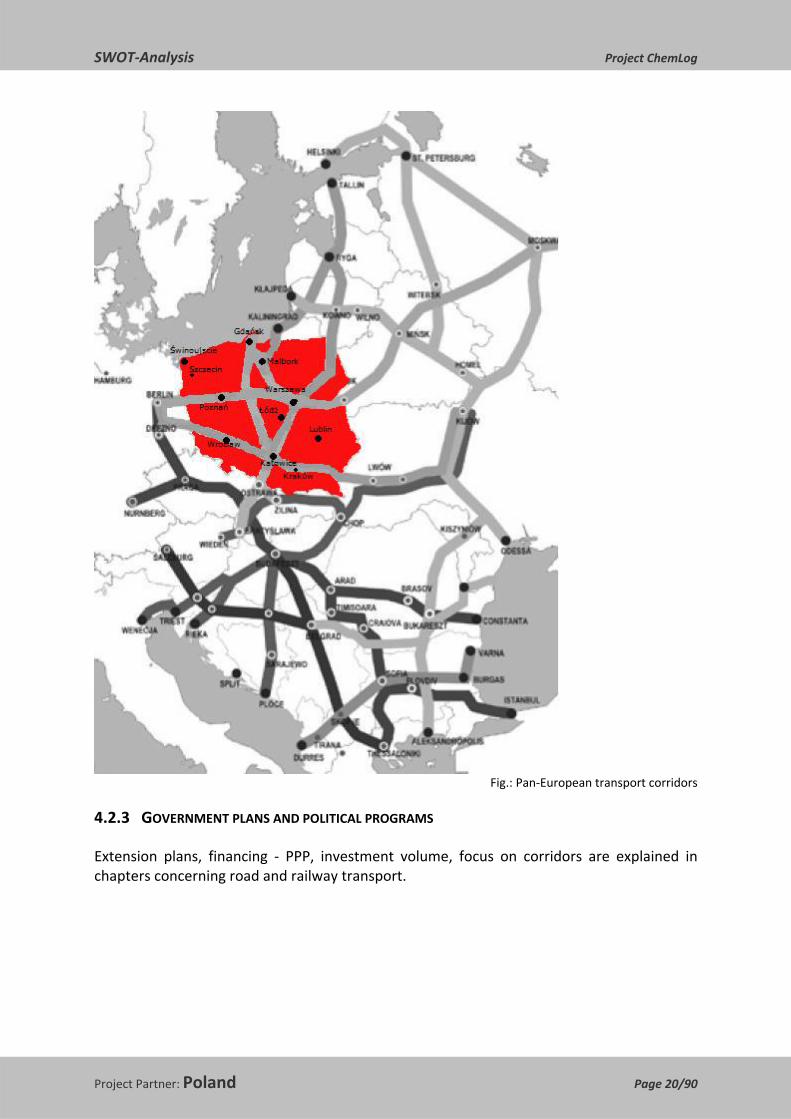
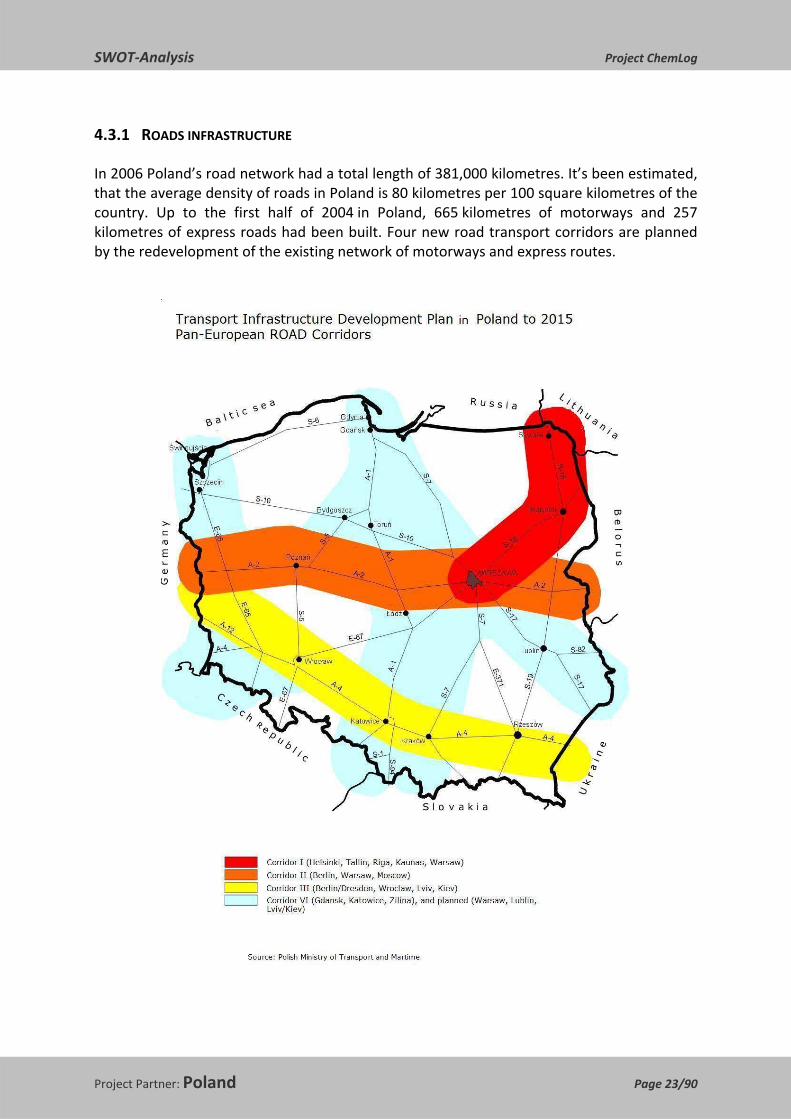
Due to AGR, AGC, and AGTS agreements and Crete/Helsinki Conferences, four Pan‐European Corridors are passing through Poland’s territory:
I. North – South via Baltica: Tallin ‐ Kaliningrad – Gdansk , and its branch: Tallin – Vilnius – Warsaw,
II. West – East: Berlin ‐ Warsaw – Moscow III. West – East: Dresden – Krakow – Lviv – Kiev VI. North – South: Gdansk – Katowice – Zilina, and its branch: Gdansk – Poznan
SWOT‐Analysis Project ChemLog
Project Partner: Poland Page 20/90
Fig.: Pan‐European transport corridors
4.2.3 GOVERNMENT PLANS AND POLITICAL PROGRAMS
Extension plans, financing ‐ PPP, investment volume, focus on corridors are explained in chapters concerning road and railway transport.
SWOT‐Analysis Project ChemLog
Project Partner: Poland Page 21/90
4.3 ROAD TRANSPORT
In 2007, 1 213.2 million tonnes of goods were carried by road transport, which is 8.9 % more than in 2006 and transport performance in tonne‐kilometres was higher by 16.9 %.
Achieved volume of goods carried in road transport in tonne‐kilometres accounted for over 7 % of total road freight transport of European Union that gave Poland 6th position among EU‐25 behind Germany, Spain, Italy, France and the UK.
In international transport Poland has even higher share (over 11 %) and was on the 2nd position between Germany and Spain.
The increase of almost 9% has been noted in national transport in comparison to 2006, while transport performance in tonne‐kilometres was higher by above 10 %
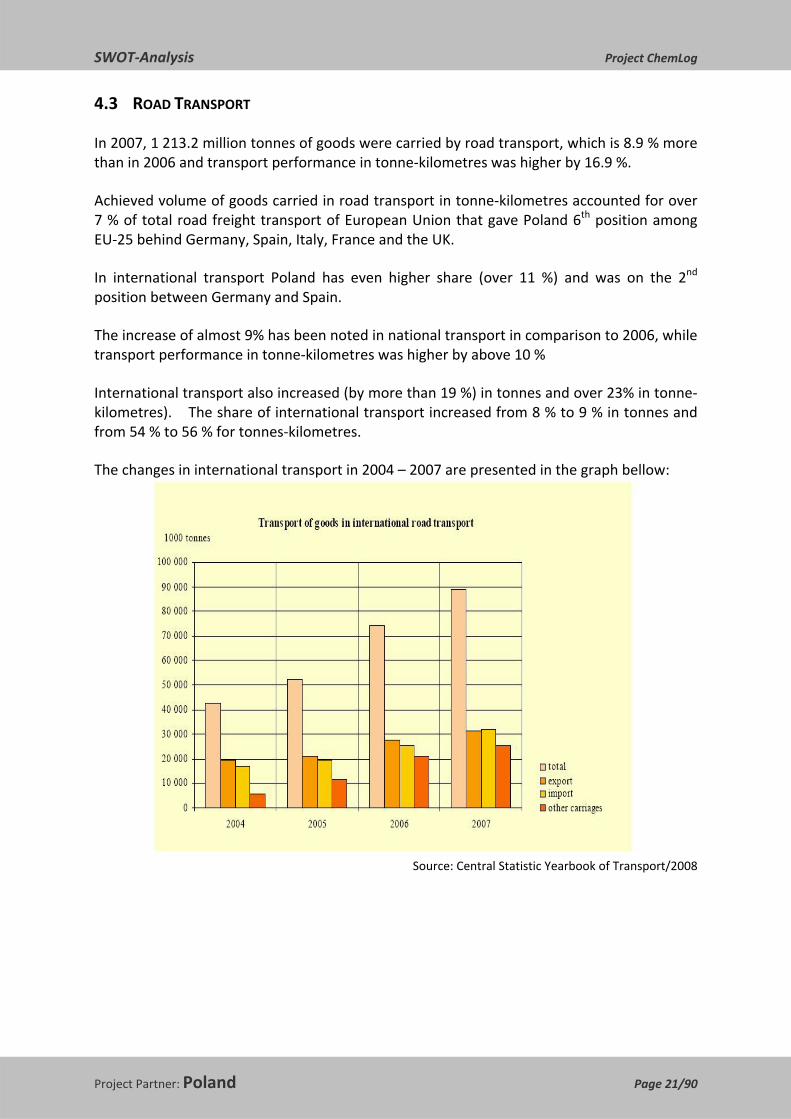
International transport also increased (by more than 19 %) in tonnes and over 23% in tonne‐kilometres). The share of international transport increased from 8 % to 9 % in tonnes and from 54 % to 56 % for tonnes‐kilometres.
The changes in international transport in 2004 – 2007 are presented in the graph bellow:
Source: Central Statistic Yearbook of Transport/2008

SWOT‐Analysis Project ChemLog
Project Partner: Poland Page 22/90
The following graphs present structure of export and import of goods by countries in 2007:
Source: Central Statistic Yearbook of Transport/2008
Similarly to the previous year, the dominant share both in export and import accounted for carriage to/from Member States of EU, of which mainly in relation with Germany.
The following graph illustrates structure of road freight transport by group of goods (aggregated in 10 categories) in 2007:
Source: Central Statistic Yearbook of Transport/2008
SWOT‐Analysis Project ChemLog
Project Partner: Poland Page 23/90
4.3.1 ROADS INFRASTRUCTURE
In 2006 Poland’s road network had a total length of 381,000 kilometres. It’s been estimated, that the average density of roads in Poland is 80 kilometres per 100 square kilometres of the country. Up to the first half of 2004 in Poland, 665 kilometres of motorways and 257 kilometres of express roads had been built. Four new road transport corridors are planned by the redevelopment of the existing network of motorways and express routes.

SWOT‐Analysis Project ChemLog
Project Partner: Poland Page 24/90
Source: GDDKiA (Head Office for National Roads and Motorways)
The creation of a north‐south route is planned from Gdansk, to Lodz, to Krakow and Katowice and then further south to Cieszyn. A second project is planned for the east‐west route, providing links between Warsaw, through Lodz and Poznan in the direction of Germany; and from Krakow through Katowice also to the direction of Germany. At a later date these communications routes will become sections of the transport corridors linking the north of Europe with the south and west to east.
According to the Government plans, by 2013 there will be 2,085 km of motorways and 5,466 km of express roads in Poland.

SWOT‐Analysis Project ChemLog
Project Partner: Poland Page 25/90
Source: GDDKiA (Head Office for National Roads and Motorways)
4.3.2 ACTUAL AND PLANNED FIGURES Actual and planned road network in km in
operation in progress planned total
Highway 663 220 1 779 2 662
State road 18 521 320 2 274* 21 115 Goods traffic in % according to traffic area – road (thousand tons)
2000 2001 2002 2003 2004 2005 2006 2007
Domestic traffic n.a. n.a. n.a. n.a. 94.2 93.7 91.7 91.0
Cross‐border entrance n.a. n.a. n.a. n.a. 2.4 2.2 2.8 3.2
Cross‐border dispatch n.a. n.a. n.a. n.a. 2.7 2.5 3.1 3.2
Transit n.a. n.a. n.a. n.a. 0.2 0.2 0.3 0.3
Other transportation abroad (cabotage)
n.a. n.a. n.a. n.a. 0.2 0.3 0.5 0.3
SWOT‐Analysis Project ChemLog
Project Partner: Poland Page 26/90
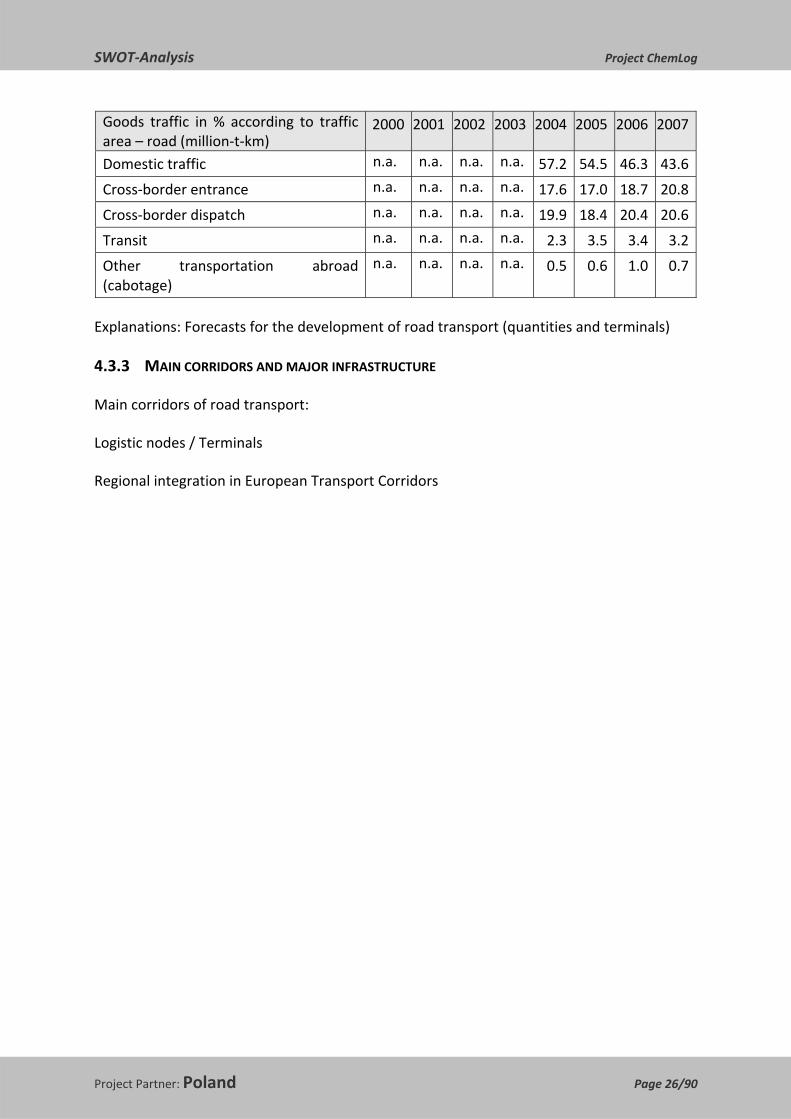
Goods traffic in % according to traffic area – road (million‐t‐km)
2000 2001 2002 2003 2004 2005 2006 2007
Domestic traffic n.a. n.a. n.a. n.a. 57.2 54.5 46.3 43.6
Cross‐border entrance n.a. n.a. n.a. n.a. 17.6 17.0 18.7 20.8
Cross‐border dispatch n.a. n.a. n.a. n.a. 19.9 18.4 20.4 20.6
Transit n.a. n.a. n.a. n.a. 2.3 3.5 3.4 3.2
Other transportation abroad (cabotage)
n.a. n.a. n.a. n.a. 0.5 0.6 1.0 0.7
Explanations: Forecasts for the development of road transport (quantities and terminals)
4.3.3 MAIN CORRIDORS AND MAJOR INFRASTRUCTURE
Main corridors of road transport:
Logistic nodes / Terminals
Regional integration in European Transport Corridors

SWOT‐Analysis Project ChemLog
Project Partner: Poland Page 27/90

SWOT‐Analysis Project ChemLog
Project Partner: Poland Page 28/90
4.3.4 GOVERNMENT PLANS AND POLITICAL PROGRAMS
Extension plans, financing ‐ PPP, investment volume, focus on corridors.
Construction Programme of National Roads for 2008 ‐2012, financed by the Polish Government, EU Founds and PPP system, to amount of 121 billion PLN (ca. 30 bn. EUR)
1. 1779 kilometres of motorways network development according to the Plan - A‐1 - A ‐2 - A‐4 2. 2274 kilometres of express roads network development according to the Plan, - S‐3, S‐5, S‐7, S‐8, S‐17, S‐19, S‐69 3. Strengthening roads construction for wheel load capacity up to 115 kN/axle 4. 54 ring roads sections construction for cities and agglomerations (428 km), 5. Safety improvement on the particular roads sections, 6. Improvement of the transit conditions through big cities, 7. Improvement of road quality (up to good quality indicator of 75%) of national road
network for 2013.
According to Construction Programme of National Roads for 2008 ‐2012, is expected to be build 632 kilometres of highways, plus 473 km of highways build in Public – Private Partnership system, 1980 kilometres of express roads, 54 ring road sections (a sum of 428 kilometres). There will be also re‐build or strengthened 1560 kilometres of national roads.
Focusing on TEN‐T corridors: 4816 kilometres of national roads belong to corridor I, II, III, and VI. There are the highest traffic tracks, also in transit.
The priority of investments is as follows:
- Corridor I: Budzisko – Warsaw, - Corridor II: Swiecko – Kukuryki (with the end of investment on the section Siedlce –
Terespol in 2020), - Corridor III: Olszyna/Zgorzelec – Korczowa, - Corridor VI: Gdansk – Cieszyn/Gorzyczki/Zwardon.
4.4 RAILWAY TRANSPORT
Short introduction about railway transportation and infrastructure in the region / country (graphs or maps).
The total length of railways was 20.100 thousand kilometres in 2007, of which state meaning railways were 11.400 thousand kilometres and were shorter by 0.3 % as compared to the previous year. The network belongs to PKP (state owned rail operator) – total length of 19.400 thousand kilometres.

SWOT‐Analysis Project ChemLog
Project Partner: Poland Page 29/90
Electrified railways lines amounted to 60.1 % of total standard and large gauge railway lines (98 % of the total length of railway lines). In railway network was situated 1498 railway stations in 2007, of which 365 junction stations (in 2006 – 1507, of which 364 junction stations).
An advantage of the national rail network is the existing broad gauge rail connections with Russia and the Commonwealth of Independent States. These ensure the fast and safe transport of goods to eastern markets. The broad gauge network covers 400 kilometres of track and the route begins in Slawkow, in Gorny Slask, where Poland’s largest loading ramp is located and it carries on to Hrubieszow which lies on the EU’s border with the Ukraine.
Inventory number of stock of electric and diesel locomotives amounted to 4.400 thousand, which is 16,0 % more than in 2006, while more than 81 % belonged to (state owned) PKP group. Inventory number of fright wagons increased by 1.4 % and amounted to 105.0 thousand, of which 77.4 % belonged to PKP group.
In 2007 all polish rail transport carried 245 million tonnes of goods, which is 3.0 % more than in 2006, and the transport performance increased by 1.5 %.
PKP company carried 153 million tonnes of goods (1.9 % less than previous year) and their transport performance amounted to 43.6 billion tonne‐kilometres (1.7 % less). Other operators, who had railway fright transport licences carried 92.0 million tonnes of goods (12.5 % more than in 2006), and the transport performance of these operators reached 10.7 billion tonne‐kilometres (17.6 % more than in previous year). Besides, shunting amounted to 51 million tonnes (5.1 % less) and 18.7 billon tonne‐kilometres (4.2 % less than in 2006).
The volume of goods carried by rail transport in tonne‐kilometres accounted for 13 % of total rail freight transport declared by EU countries, what gives Poland the 2nd place among the EU‐25 countries between Germany and France. In international transport, Polish rail share of 9 % is located also on the 2nd place after Germany.
The overall increase of rail freight transport was caused by the growth of carriage in most of the groups of goods, of which mainly lignite, briquettes and coke (by 14 %), petroleum products (by 16%), cement, lime, manufactured construction materials (by 20 %), crude oil and manufactured minerals (by 29 %). The following groups of goods decreased: hard coal (by 5%), chemicals other than coal, chemicals and tar (by 4 %), foodstuff and animal fodder (by 19 %), and metal products (by 3 %).
The carriage by narrow gauge rail in 2007 was 6.3 lower than in previous year, because the length of the operated lines decreased from 413 km in 2006 to 310 km in 2007.
The structure of rail freight transport by group of goods (aggregated in 10 categories) is shown in the graph bellow:

SWOT‐Analysis Project ChemLog
Project Partner: Poland Page 30/90
Source: Central Statistic Yearbook of Transport/2008
Source: W. Suchorzewski: New tendencies in transport and Polish transport infrastructure development
connected to Europe, 2001

SWOT‐Analysis Project ChemLog
Project Partner: Poland Page 31/90
4.4.1 ACTUAL AND PLANNED FIGURES Actual and planned railway network in km in
operation in progress planned total
Main railroads – public n.a. n.a. n.a.
Standard gauge – public 19 797 n.a. n.a. n.a.
Broad gauge (Russian standard) 400 n.a. n.a. n.a.
Narrow gauge – public 310 n.a. n.a. n.a.
Private 700 n.a. n.a. n.a.
Total 20 107 n.a. n.a. n.a.
Explanations: Poland has one of the highest densities of railways in Europe, but huge expenditures for their modernization are necessary.
Goods traffic in % according to traffic area ‐ railway
2000 2001 2002 2003 2004 2005 2006 2007
Domestic traffic 61.0 n.a. 68.6 68.6 74.5 73.4 72.1 68.7
Cross‐border entrance 14.4 n.a. 10.3 11.7 11.2 10.2 11.6 14.8
Cross‐border dispatch 22.0 n.a. 18.8 17.1 12.5 14.6 14.2 14.0
Transit 2.6 n.a. 2.5 2.6 1.7 1.8 2.1 2.5
Explanations: Forecasts about development of railway transportation (quantities and terminals):
4.4.2 MAIN CORRIDORS AND MAJOR INFRASTRUCTURE
The main railway tracks are:
o E 20, international track binding Berlin to Minsk and Moscow, • through Kunowice (German border) – Poznan – Kutno – Lowicz – Warsaw –
Siedlce – Biala Podlaska – Terespol (Belorussian border), o equipped with broad gauge from Malaszewicze Terminal to Minsk and Moscow o E 20 is located in Corridor II of Trans‐European Transport Network o Gdansk (Baltic Sea Port) – Malbork – Dzialdowo – Warsaw ‐ Pilawa – Lublin – Chelm,
Dorohusk (Belorussian border), • International track binding Warsaw to Kiew, • equipped with broad gauge from Zawadowka to the Belorussian border,
o Rejowiec – Hrebenne is a section of the international track from Warsaw – Rawa Ruska‐ to Lviv in Ukraine,
o Broad gauge track (400 kilometres long) LHS: Slawkow Terminal – Hrubieszow (Ukrainian border) binding Upper Silesia Region and “Katowice” steelworks to Ukraine without necessity of re‐loading goods at the border.

SWOT‐Analysis Project ChemLog
Project Partner: Poland Page 32/90

SWOT‐Analysis Project ChemLog
Project Partner: Poland Page 33/90
4.4.3 GOVERNMENT PLANS AND POLITICAL PROGRAMS
According to the Master Plan for Rail Transport in Poland to 2030, prepared on Dec., 2008, within the EU Conjunction Fund Project, the investments expenditures in railway infrastructure during period 2007 – 2030 are planned on the level of 115 032 100 thousands PLN (ca. 30 billion EUR).
Investments costs in railway infrastructure to year 2030 (thousands PLN)
Title Period 2007 ‐2013 2014 – 2020 2021 ‐ 2030
1. New tracks construction 312 000 20 790 000 3 000 000 2. Modernization of operated
tracks 26 184 600 22 458 500 19 121 000
3. Re‐construction investments 7 053 600 7 242 400 7 000 0004. Economical Steering Systems 280 000 590 000 1 000 000 TOTAL 33 830 200 51 080 900 30 121 000
Source: Master Plan for Railway Transport in Poland to 2030, Ministry of Infrastructure.

SWOT‐Analysis Project ChemLog
Project Partner: Poland Page 34/90
However the length of operated railway network in Poland decreased by 22% ,from 24 100 kilometres to 19 041 kilometres, the new build tracks sections are planned, mostly at the big agglomerations, where “bottleneck” occurrence happened and traffic increasing is expected.
The new steering and governing systems will be installed parallel for synergy effect achievement.
After necessary modernization it is planned to raise speed limit at the selected railway sections after year 2030, as shown on the map above.
Modernization of Warsaw – Krakow inter‐city track, which has the highest attendance, is the first stage of high speed tracks planned.
The most important element of future high speed network will be track Wroclaw / Poznan – Lodz – Warsaw, which will allow dividing passenger and goods traffic into two independent streams.
Similarly to the European tendencies, also in Poland specialization of the railway tracks for split passengers’ movement from transport of goods is planned. The New Opera and PERFN (Primary European Rail Freight Network), initiative of European Commission, has the crucial meaning as competitiveness element of railway and intermodal transport, because of the higher effectiveness and traffic flow.

SWOT‐Analysis Project ChemLog
Project Partner: Poland Page 35/90
Due to the Master Plan, specialization will cover all tracks belonging to TEN‐T Corridors network and others sections having a critical meaning for Polish economy.
The systems dedicated railway tracks and those, which will remain operated by both streams: passengers and goods are given on the graph bellow.
4.5 3.5 WATERWAY TRANSPORT THE BASIC WATERWAYS NETWORK IN POLAND
Short introduction about waterway transportation and infrastructure in the region / country.
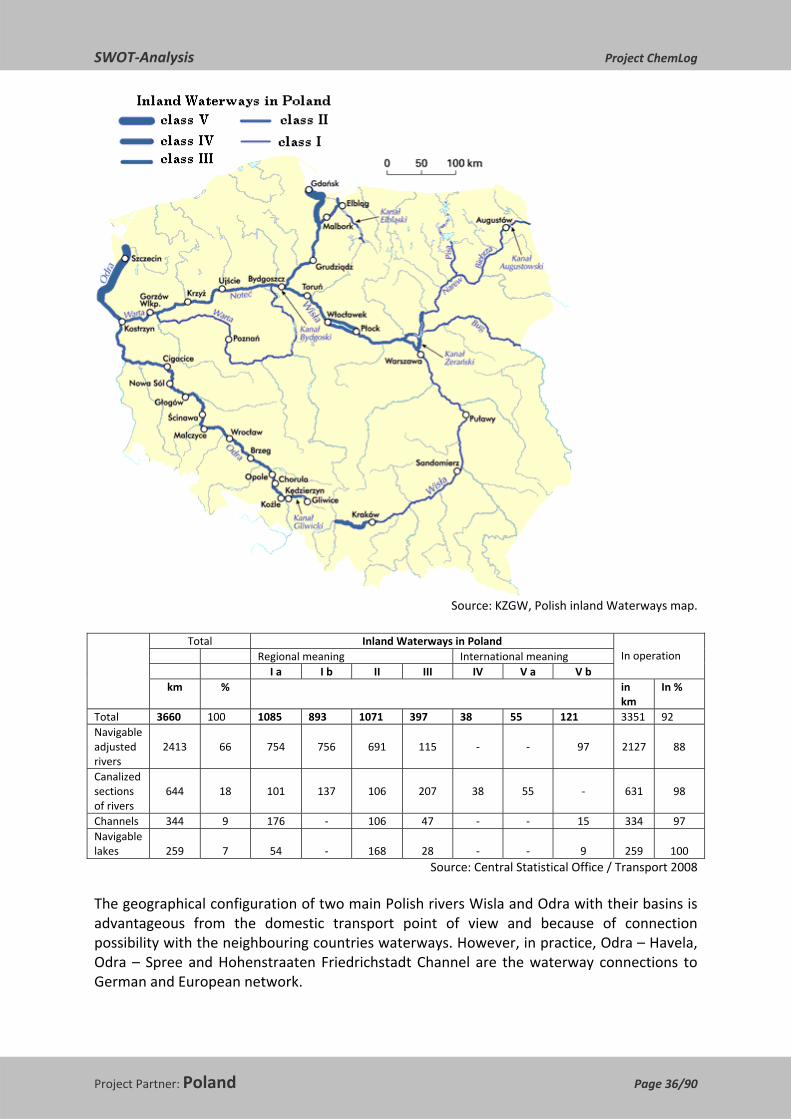
There are 3,640 kilometres of inland waterways in Poland. The basic waterways network consists of:
o rivers: Odra, Wisla, Warta, Notec, Biebrza, Brda, Pisa, Parnica, Regalica, o channels: Gliwicki, Kedzierzynski, Slesinski, Gornonotecki, Bydgoski, Elblaski,
Jagiellonski, Laczanski, Zeranski, Augustowski, Bartnicki, o lakes: Dabie, Goplo, Mazurian Lakes system.
SWOT‐Analysis Project ChemLog
Project Partner: Poland Page 36/90
Source: KZGW, Polish inland Waterways map.
Total Inland Waterways in Poland
In operation Regional meaning International meaning I a I b II III IV V a V b km % in
km In %
Total 3660 100 1085 893 1071 397 38 55 121 3351 92 Navigable adjusted rivers
2413
66
754
756
691
115
‐
‐
97
2127
88
Canalized sections of rivers
644
18
101
137
106
207
38
55
‐
631
98
Channels 344 9 176 ‐ 106 47 ‐ ‐ 15 334 97 Navigable lakes
259
7
54
‐
168
28
‐
‐
9
259
100
Source: Central Statistical Office / Transport 2008
The geographical configuration of two main Polish rivers Wisla and Odra with their basins is advantageous from the domestic transport point of view and because of connection possibility with the neighbouring countries waterways. However, in practice, Odra – Havela, Odra – Spree and Hohenstraaten Friedrichstadt Channel are the waterway connections to German and European network.

SWOT‐Analysis Project ChemLog
Project Partner: Poland Page 37/90
Fig. European Waterways Network.
Costs Comparison in different transport modes:
Costs category Inland
Waterway Railway Road
Engine power (hp) necessary to pass 1 tonne of load
0,25 hp 2,0 hp 7,0 hp
Distance (km) possible to pass 1 tonne of load with using of 1 litre of engine fuel
127 km 97 km 50 km
Load Weight (tonnes) possible to pass for distance of 1 km, with using 1 kWh energy
3‐4 0,375 0,11
Energy demand (kJ/tkm) for 1 tonne‐kilometre
584 677 2889
Air pollution by engine for 1 tonne‐kilometre (total emissions (g/tkm) including: CO2, CH4, NOx, CO) / (CO2)
42,73 (33.4)
48.1 (41,31)
213,4 (164.0)
External costs of transport / 1000 km 5 EUR 12,97 EUR 24,12 EUR
Source: Ministry of Infrastructure, 2003

SWOT‐Analysis Project ChemLog
Project Partner: Poland Page 38/90
4.5.1 ACTUAL AND PLANNED FIGURES Goods traffic in thousand tons according to traffic area ‐ waterway
2000 2001 2002 2003 2004 2005 2006 2007
Domestic traffic n.a. n.a. n.a. 4959 5010 4466 4461 9792
Cross‐border entrance 551 673 444 307 386 588 300 348
Cross‐border dispatch 3946 3076 1936 1859 1832 2086 1824 1602
Transit 421 n.a. n.a. 353 68 27 24 48
Transport of goods between foreign ports
490 n.a. n.a. 490 1451 2440 2662 3788
TOTAL 10433 10255 7729 7968 8747 9607 9271 15578 Goods traffic in million tons‐km according to traffic area ‐ waterway
2000 2001 2002 2003 2004 2005 2006 2007
Domestic traffic n.a. n.a. n.a. 238 243 185 184 n.a.
Cross‐border entrance 171 225 181 103 121 155 81 87
Cross‐border dispatch 554 611 488 420 465 510 432 383
Transit 85 n.a. n.a. 68 16 8 7 14
Transport of goods between foreign ports
75 n.a. n.a. 43 222 418 533 708
TOTAL 1173 1264 1126 872 1066 1276 1237 n.a.
Explanations:
In 2007 domestic inland waterway transport carried 9.8 Mio. tonnes of goods and 5.6% more than in 2006. The overall increase of carriage by inland waterway was caused by the growth in international transport (by 20.3% in comparison with 2006. Within international transport, whose share in total carriage of goods by inland waterways accounted for 59.1% was noted the increase of transit of goods (by 100%), foreign goods carriage between foreign ports (by 41.9%) and import of goods by 16%, but export of goods decreased by 12.2%. The share of carriage between foreign ports in international transport of goods increased in 55.3% in 2006 to 65.3% in 2007. The share of export decreased from 39.7% in 2006 to 27.7% in 2007. The share of import of goods decreased from 6.2% in 2006 to 6.0% in 2007.
In Domestic waterway transport (9792 thou. tonnes), 604 tonnes (6.2 %) are chemicals and chemical products, carried by average distance 184 kilometres.
The most commonly transported materials are sand, gravel, coal, metal ores and fertilizers.

SWOT‐Analysis Project ChemLog
Project Partner: Poland Page 39/90
Because of too low water levels in part of Polish waterways network, and bad functional quality of infrastructure, average of 50% of Polish Inland Waterway Fleet is operating on foreign markets.
ODRATRANS S.A., the biggest Polish inland waterway freight carrier settled in Wroclaw, bought, on April 20th, 2007, 72% share of Deutsche Binnenreederei AG (DBR AG) settled in Berlin. The new company, after fusion is operating with almost 1000 ships/vessels, carried in 2006 over 12 million tonnes of goods, concentrating their activity at Rhine and Odra river basins, also sea ports of Hamburg, Bremen and Szczecin servicing. In 2006 the Odratrans/DBR Group achieved turnover level of 64 Mio. EUR (Odratrans ‐ 31,5 Mio. EUR, DBR ‐ 32,5 Mio. EUR). The next activity area of Odratrans/DBR Group is expected at North Sea and Baltic Sea.
4.5.2 FORECASTS ABOUT DEVELOPMENT OF WATERWAY TRANSPORT :
According to “NAIADES” ‐ Integrated European Action Program for Inland Waterways Development presented by EU on Jan. 17th 2006, there is planned to increase of carriage by inland waterways, with elimination of bottlenecks caused by weak infrastructure, fleet, markets, employment, etc., taking care of environment.
4.5.3 MAIN CORRIDORS AND MAJOR INFRASTRUCTURE
Main corridors of waterway:
Logistic nodes / Terminals
Regional integration in European Transport Corridors
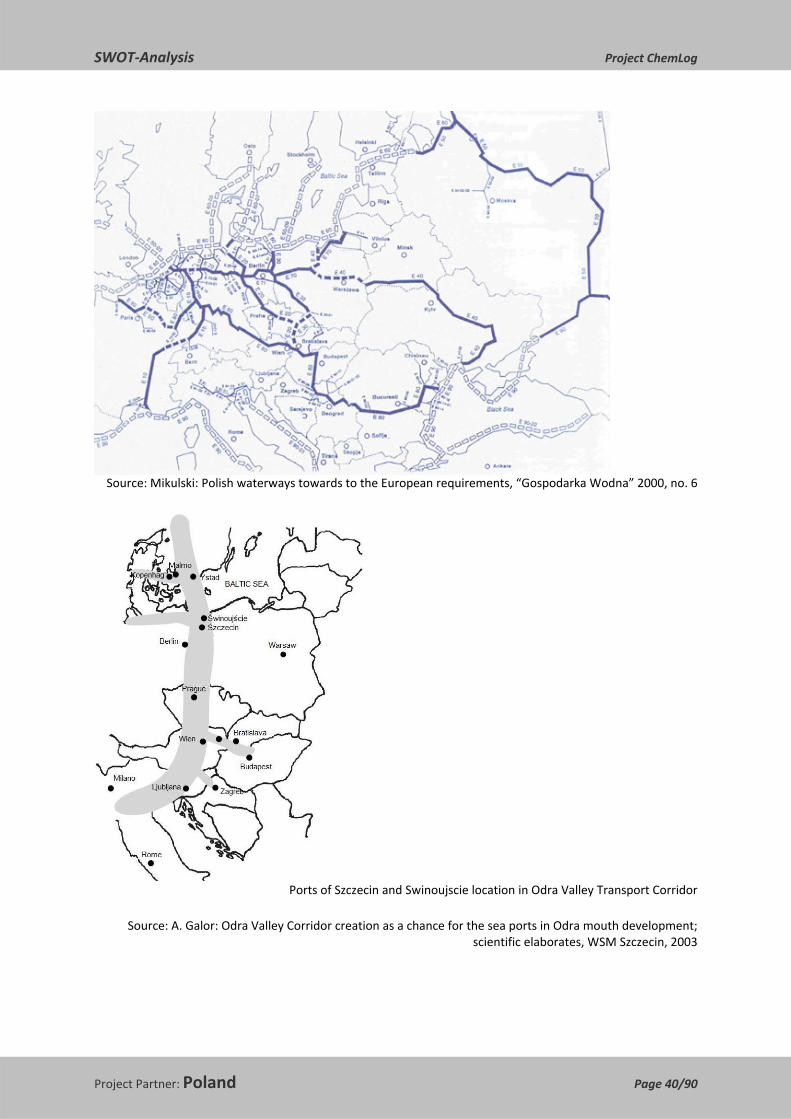
According to ADN Agreement (European Agreement on Main Inland Waterway of International Importance), connecting 27 European countries, and due to “Blue Book”,
3 European waterways tracks have been covered by territory of Poland:
o E 30: connecting Baltic Sea to Danube River in Bratislava ( Odra in Polish territory), o E 40: connecting Baltic Sea (Gdansk) to Dniepr (near Chernobyl) – Kiev –Kherson
(Black Sea), (Wisla from Gdansk to Warsaw, than Narew and Bug in Brzesc at the Polish territory)
o E 70: connecting The Netherlands with Russia and Lithuania (Odra from Odra – Havela Channel , Warta Narew (Bydgoszcz), Wisla to Bay of Gdansk).
SWOT‐Analysis Project ChemLog
Project Partner: Poland Page 40/90
Source: Mikulski: Polish waterways towards to the European requirements, “Gospodarka Wodna” 2000, no. 6
Ports of Szczecin and Swinoujscie location in Odra Valley Transport Corridor
Source: A. Galor: Odra Valley Corridor creation as a chance for the sea ports in Odra mouth development;
scientific elaborates, WSM Szczecin, 2003

SWOT‐Analysis Project ChemLog
Project Partner: Poland Page 41/90
4.5.4 GOVERNMENT PLANS AND POLITICAL PROGRAMS
The Lower Odra Corridor is a main part of the North – South Transport Corridor linking Scandinavia with countries of the South Europe. It has got great importance in western part of Baltic Sea Region because of predicted significant economic growth in Scandinavian and Baltic Countries during next 10 – 15 years.
According to such predicted economic growth is assumed that one existing North – South Corridor is not enough for goods and passenger traffic, and it is expected to open the second North – South direction Corridor via Odra Valley (E59). Those two meridional Transport Corridors across Poland are complex offer for sea – land transport connection between the North and South Europe.
Comparing both mentioned above corridors we can assume their meaningful similarities, as follows:
o Both are natural Sea – land transport corridors, with sea ports of Gdansk / Gdynia and Szczecin / Swinoujscie – as a transport nodes
o Both are multimodal corridors concentrating on it’s territory • Railway transport (for Corridor VI ‐ railway track C‐E 65, for Odra Valley –
railway tracks C‐E 59 and C‐ 59) • Road transport (for Corridor VI – A1 motorway, for Odra Valley S‐3 express
road , and in prospective after 2015, A3 motorway) • Inland waterway (for Corridor VI – Wisla river, for Odra Valley – Odra river) • Air transport (for Corridor VI – Gdansk – Rebiechowo , Bydgoszcz, Warsaw –
Okecie, Krakow – Balice, Katowice – Pyrzowice airports, and for Odra Valley – Szczecin – Goleniow, Zielonagora – Babimost, Poznan – Lawica, Wroclaw – Strachowice airports)
The other arguments for Odra Valley Corridor are, as follows:
o It is a shortest connection from Scandinavia to Mediterranean Sea and Adriatic Sea basins
o Odra river is navigable on sections, mainly in its lower part.
The main negative feature is lack of motorway from Szczecin towards Czech Republic border.
4.5.5 THE INLAND WATERWAYS INFRASTRUCTURE DEVELOPMENT DIRECTIONS IN POLAND
Due to the authors of “Inland Waterways Development in Poland”, there is still lack of definition of “the superior public matter” in inland waterway infrastructure.
The main topics are: infrastructure investments in waterway sector and water power plant development support for equalization differences in economic growth by pro‐ecologic solutions to similar level as in EU. (Waterway share among different transport modes in Poland is less than 1%, when in Holland 46%, in Belgium 40%, in Germany 20%, in France 12%). In the meanwhile, the environment protection is the critical barrier in inland waterway development in Poland.

SWOT‐Analysis Project ChemLog
Project Partner: Poland Page 42/90
The Inland Waterway operating depends on proper maintenance and modernization of their infrastructural elements, to stop degradation and improve parameters waterway tracks, what is necessary for European network integration.
According to the above, the priorities are:
o The “Odra 2006 Program” with necessary update in sections of tasks, timelines and costs.
o Work out and implementation of infrastructure modernization of lower section of Wisla River and Odra – Wisla connecting waterway.
o Continued actions for Odra Valley set‐up as TEN – T Corridor XII o AGN Agreement ratification o Multimodal transport and terminals development based on waterway mode of
transport.
4.6 PIPELINE TRANSPORT
Short introduction about pipeline network and infrastructure in the region / country. (graphs or maps)
Constantly increasing customers’ requirements, transport and storage of products and raw chemical materials became the main reasons for separation of transport and logistics in the economic activity.
For this paper we define pipeline as a gas pipe or pipe system for transportation of substances, raw materials and chemical compounds. Typical pipeline system contains also pumping stations and other points or equipment being their integrated parts.
The use of pipelines for the transportation of large quantities of natural gas to industrial as well as to commercial and domestic consumers represents a safe and environmentally friendly mode of transport.
Moreover, the transport of chemical products by pipeline system possesses number of advantages in comparison with other means of transport – by rail or by tank trucks. These are as follows:
o certainty of products transport; o high‐availability of pipeline transport aside from weather conditions; o opportunity of mass transport of chemical products; o low level of installation failure frequency; o lower transportation costs; o elimination of product losses in the transhipment processes; o reduction of human influence on the transportation process.

SWOT‐Analysis Project ChemLog
Project Partner: Poland Page 43/90
General pipeline system information is given per year on pipeline length categorized according to:
o diameter; o pressure; o year of construction, o type of coating, o depth of cover, o grade of material, o wall thickens.
4.6.1 NATURAL GAS
European Infrastructure
The most extensive pipeline systems are used for natural gas transport from producers to local distribution networks. European natural gas market has been created in the sixties. At the beginning natural gas was transported by pipeline from Holland to its neighbouring countries.
The total length of European gas transmission pipeline systems is constantly increasing. In 2007 the total length of high pressure transmission network (more than 2,5MPa) was over 222 000 km while the length of low pressure distribution network was 1.5 Mio km.
The evolution of the total length of the system is presented in the table and is also given per category (diameter, pressure, year of construction) in figures below.

SWOT‐Analysis Project ChemLog
Project Partner: Poland Page 44/90
2007 European Countries gas sales & customers – pipelines length and number of service pipes.
Country Commercial data Pipeline length
Service pipes
Gas customers
Gas sales [TWh/y]
Transmission [km]
Distribution [km]
Total [km]
Austria 1,338,891 96,00 2,589 33,447 36,036 0 Belgium 2,717,204 190,41 3,818 59,629 63,447 n.a. Czech
Republic 2,822,068 97,00 3,647 70,911 74,558 1,483,849
Denmark 367,633 45,18 3,389 15,132 18,521 387,000 France 11,500,000 512,00 36,510 191,542 228,052 7,020,475 Germany 15.912.151 897,50 75,600 325,108 400,708 8,938,766 Greece 61,652 29,89 971 3,620 4,591 52,331 Hungary 3,428,023 137,43 5,278 81,854 87,132 2,257,805 Ireland 576.241 51,00 2,164 9,765 11,929 569,072 Italy 20,011,600 910,53 33,489 195,250 228,739 11,370,000The
Netherlands 7,118,637 460,00 11,600 123,681 135,281 n.a.
Norway 0 3,24 0 0 0 0 Romania 2,438,012 n.a. 11,757 32,981 44,738 n.a. Slovakia 1,461,517 66,29 8,577 25,347 33,924 652,831 Spain 6,476,778 391,00 9,231 49,467 58,698 na
Switzerland 475,000 33,00 2,220 17,058 19,278 290,000 United Kingdom
21,405,168 1,046,34 11,708 295,037 306,745 21,000,000
Total (18 Members)
98,110,575 4.967 222,548 1,529,829 1,752,377 54,022,129
Gas transmission pipeline systems in EGIG (European Gas pipeline Incident data Group)
Information presented on the trends of the European gas transmission system not only shows the evolution of the exposure but also key design parameters. This gives a figure of European gas transmission systems from 1970 up to 2007.

SWOT‐Analysis Project ChemLog
Project Partner: Poland Page 45/90
Figure : Total length of gas transmission pipeline systems in EGIG. Source: 7th Report of the European Gas Pipeline Incident Data Group, 2008.
Figure 2 shows the increase in length of gas transmission pipeline systems in EGIG, which has significant step changes in the years 1970, 1990, 2000 and 2007. These changes correspond to new members joining the EGIG. In fact the EGIG is now covering more than 50% of all natural gas transmission pipelines in Europe.
The next figure demonstrates that the 5 – 10 inch and 11 – 17 inch classes are still the most commonly used. However, the trend is to use more pipelines with a diameter larger than 17 inch.
Figure Total length of pipeline systems per diameter class.
Source: 7th Report of the European Gas Pipeline Incident Data Group, 2008.
SWOT‐Analysis Project ChemLog
Project Partner: Poland Page 46/90
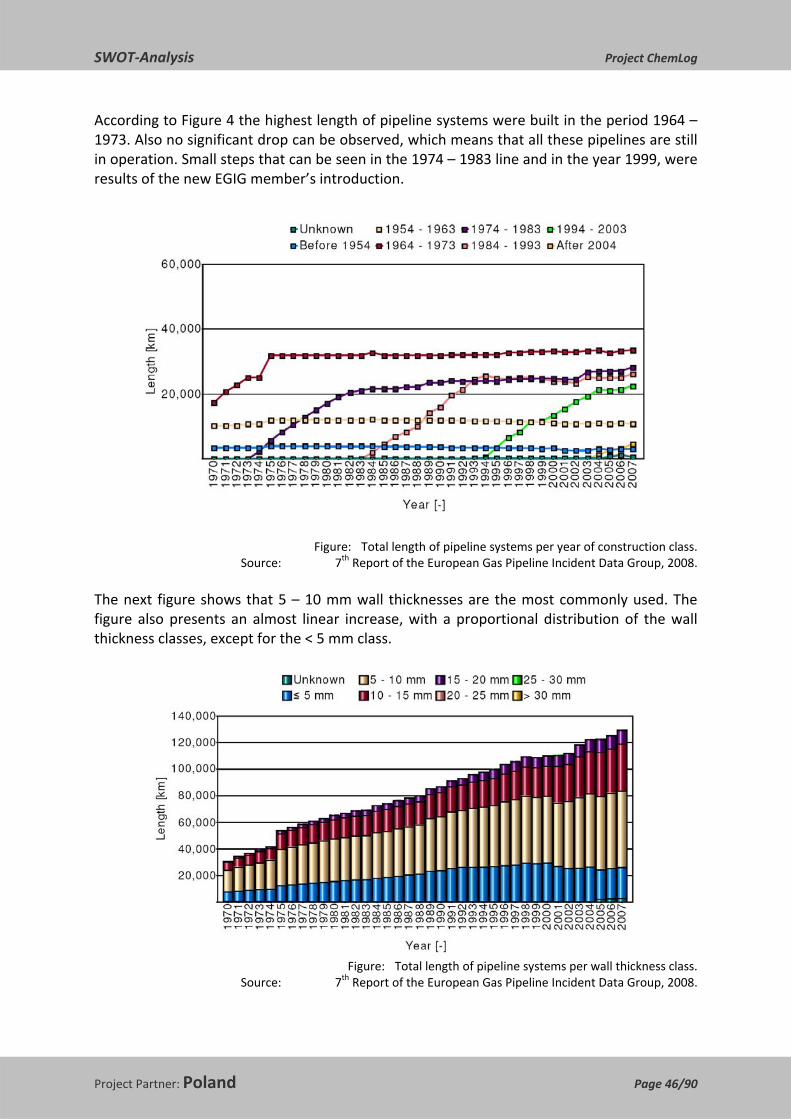
According to Figure 4 the highest length of pipeline systems were built in the period 1964 – 1973. Also no significant drop can be observed, which means that all these pipelines are still in operation. Small steps that can be seen in the 1974 – 1983 line and in the year 1999, were results of the new EGIG member’s introduction.
Figure: Total length of pipeline systems per year of construction class. Source: 7th Report of the European Gas Pipeline Incident Data Group, 2008.
The next figure shows that 5 – 10 mm wall thicknesses are the most commonly used. The figure also presents an almost linear increase, with a proportional distribution of the wall thickness classes, except for the < 5 mm class.
Figure: Total length of pipeline systems per wall thickness class.
Source: 7th Report of the European Gas Pipeline Incident Data Group, 2008.

SWOT‐Analysis Project ChemLog
Project Partner: Poland Page 47/90
Figure clearly shows a predominance of high pressure pipelines, with a trend to design pipelines at 66 bar and above in the last years.
Figure: Total length of pipeline systems per maximum operating pressure class.
Source: 7th Report of the European Gas Pipeline Incident Data Group, 2008.
Figure shows the increase of the total system exposure expressed in kilometres/year. For the period 1970 – 2007, the total system exposure was 3.15 million km/year. Such increase was resulted by the construction of new pipelines as well as introduction of new operators into EGIG.
Figure: Evaluation of the exposure.
Source: 7th Report of the European Gas Pipeline Incident Data Group, 2008.
SWOT‐Analysis Project ChemLog
Project Partner: Poland Page 48/90
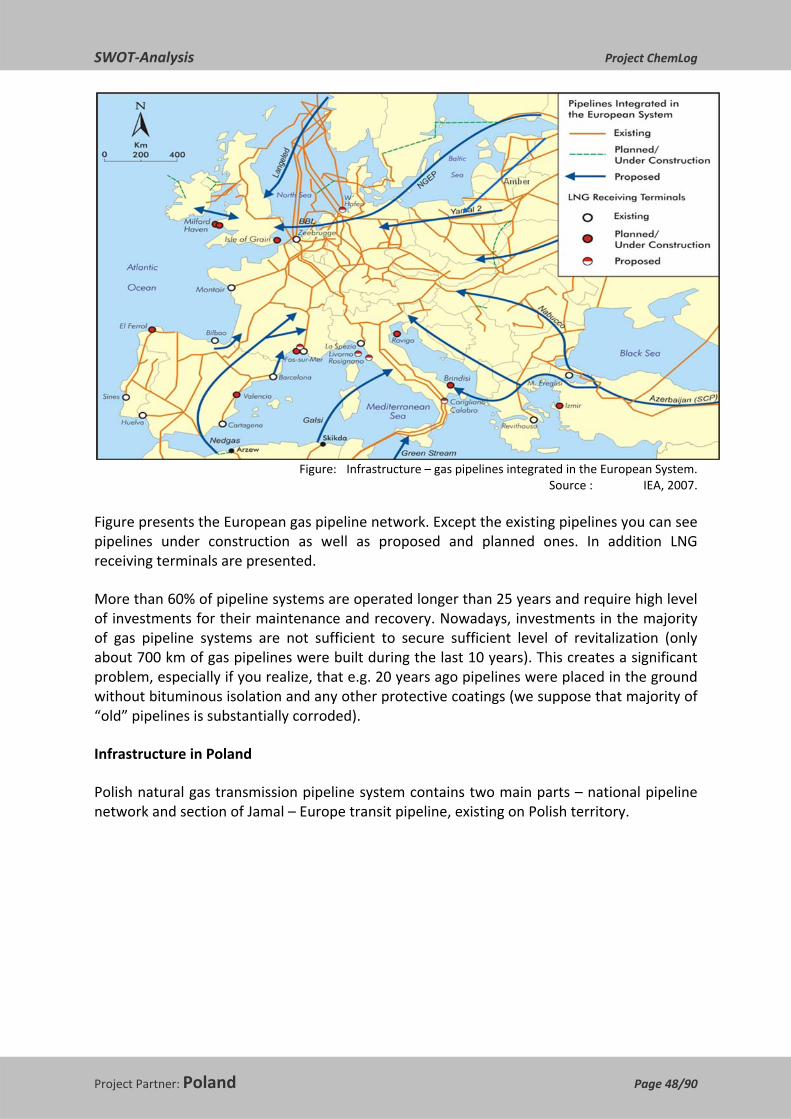
Figure: Infrastructure – gas pipelines integrated in the European System.
Source : IEA, 2007.
Figure presents the European gas pipeline network. Except the existing pipelines you can see pipelines under construction as well as proposed and planned ones. In addition LNG receiving terminals are presented.
More than 60% of pipeline systems are operated longer than 25 years and require high level of investments for their maintenance and recovery. Nowadays, investments in the majority of gas pipeline systems are not sufficient to secure sufficient level of revitalization (only about 700 km of gas pipelines were built during the last 10 years). This creates a significant problem, especially if you realize, that e.g. 20 years ago pipelines were placed in the ground without bituminous isolation and any other protective coatings (we suppose that majority of “old” pipelines is substantially corroded).
Infrastructure in Poland
Polish natural gas transmission pipeline system contains two main parts – national pipeline network and section of Jamal – Europe transit pipeline, existing on Polish territory.

SWOT‐Analysis Project ChemLog
Project Partner: Poland Page 49/90
Figure: Scheme of Polish transmission pipeline system managed by Gaz‐System S.A.
Source: www.gaz‐system.pl, www.gazoprojekt.com.pl and personal elaboration.
The main operator of the Polish gas transmission system is a Gaz‐System S.A. (after 2005), fully owned by the State Treasury.
The system managed by Gaz‐System S.A. contains transmission pipelines with total length about 9.8 thousand km (9,803 km), 14 pump stations, 57 gas hubs and 973 exit points. In working year 2007/2008 about 14.9 billion m3 of natural gas, both high methane and nitrate ones have been transmitted (Lw and Ls). High methane pipeline systems compose of two major transmission thread configurations. The first one, so called southern branch runs through Hermanowice – Jaroslaw – Pogorska Wola – Tworzen – Odolanow, whereas the second one, northern branch runs through Jaroslaw – Wronow – Rembelszczyzna – Gustrzyn – Odolanow.
The Polish pipeline system is supplied by both imported and domestic natural gas. The high methane gas system is supplied from domestic resources (system covers only Lubuskie Voivodship and ‐ partially ‐ Dolnoslaskie and Wielkopolskie Voivodships). The overall length of the network amounts to 0.8 thousand km.
Additionally, the figure below presents completed Polish gas infrastructure as well as pipelines, underground storages, pump stations, distribution points and mixing points.

SWOT‐Analysis Project ChemLog
Project Partner: Poland Page 50/90
Figure : Polish infrastructure.
Source : PGNiG.
4.6.2 CRUDE OIL/FUELS
Polish crude oil transmission system
The Polish crude oil transmission system consists of long‐range underground pipelines, used for transmission of crude oil and petroleum products. Total length of the pipeline system is about 2.5 thousand km. The integrated parts of this system are storage sites, with PERN as the owner of three of them (total storage capacity of crude oil is 2.77 Mio m3). In addition, some final product pipelines are used for transmission of fuels to six storage bases allocated on the Polish territory. More than one‐third (34%) of Polish pipelines are over 40 years old. The age of the following 35% is between 35 – 40 years. It means, that significant number of Polish pipelines will require renovation or replacement in nearest future.

SWOT‐Analysis Project ChemLog
Project Partner: Poland Page 51/90
Figure : Polish infrastructure.
Source: PERN.
In 1960 the first line of “Przyjazn” (“Druzhba”) pipeline was created. Three years later it was activated. Due to the crude oil transportation growing demand in Poland it was decided to built the second branch of the Druzhba pipeline in 1970). This eastern branch (connecting Plock and Adamowo) was put into operation in 1972. One year later the last part of “Druzhba” (Plock – Schwedt) has started the operation.
Successively, in 1975 the two‐way Pomeranian pipeline (Plock – Gdansk) was finished and put to use. From this time, sea supplies of crude have been (loading and unloading of tankers, storage of crude oil with different chemical and physical properties).
During the next years PERN increased the transmission possibilities, building two pump stations: one in Lasin (1993) and one in Rypin (1999).
However, a little bit earlier in 1991, the “Naftoport” company has been created. At this time in the Gdansk Northern Harbor, “Naftoport” has built two new crude oil reloading facilities.
The coherent infrastructure of Pomeranian pipeline and “Naftoport” has a strategic meaning for Poland. It gives alternative source of petroleum supply for domestic refineries. It is also used for transit of Russian crude through the territory of Poland.
Druzhba is also used for the transportation of raw materials (from 2002). In addition Polish domestic crude is also transported to Germany by the “Druzhba” western branch.
Moreover, PERN has built product pipelines. These go from PKN ORLEN’s refinery in Plock in three directions: Plock – Bydgoszcz – Poznan, Plock – Warsaw, and Plock – Czestochowa. These pipelines transport fuels to six storage bases located in: Mosciska, Emilianow, Nowa Wies Wielka, Rejowiec, Koluszki and Boronow.

SWOT‐Analysis Project ChemLog
Project Partner: Poland Page 52/90
European crude oil transmission system
Simplified scheme of the European crude oil infrastructure is presented in figure below.
Figure : European infrastructure Source: PERN.
There are three corridors that allow for the transportation of crude to Central Europe (Poland, Hungary, Czech Republic and Slovakia:
o eastern direction (from Russia via “Druzhba” pipeline – the major corridor), o southern direction (from Triest Harbor to Czech republic), o northern direction (from Baltic Sea, North Sea and Middle East)
In 2004 the following amount of crude oil was transported from Russia via “Druzhba”:
o 17.2 Mio tons to Polish refineries, o 4.4 Mio tons to Czech Republic refineries, o 6.0 Mio tons to Slovak refineries, o 6.1 Mio tons to Hungry refineries, o 22.0 Mio tons to German refineries.

SWOT‐Analysis Project ChemLog
Project Partner: Poland Page 53/90
Figure: European infrastructure.
Source: World Energy Atlas 2007 edition
Chemical products
Olefins ‐ mainly ethylene and propylene ‐ are the main building blocks of the chemical industry, and, as such, are the key to the production of essential consumer products.
About 60% of the production of these olefins (i.e. 20 Mio tons) is used locally (at the production site), 40% (i.e. 15 Mio tons/pa) is moved mainly by pipes (70%) and ships (20%); the rest by barges or rail. Most of the chemical derivatives produced out of these olefins are moved to customers by road, some by rail.
The development of a Trans‐European olefins pipeline network would have a positive impact on transport, environment, safety, economy and the creation of the single European market. It would contribute to the EU Transport Policy Strategy, by, amongst other things, shifting the transport of chemicals from surface to underground and enabling connection to remote regions of the EU.
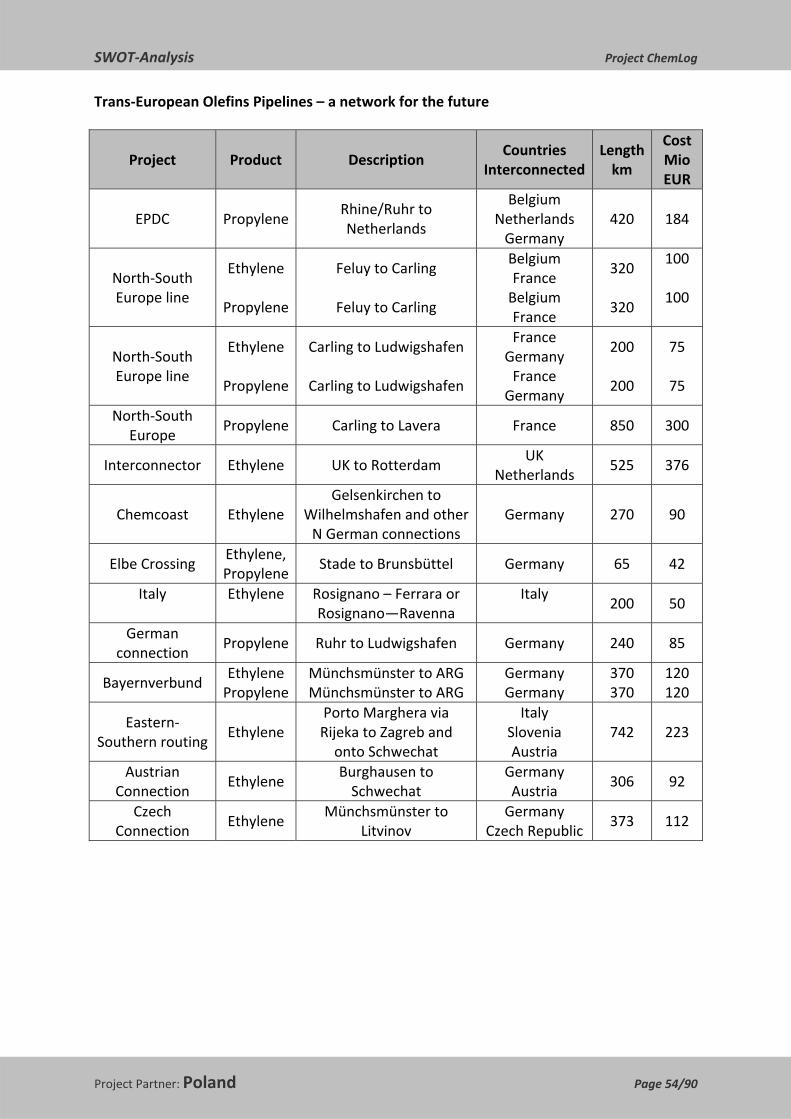
SWOT‐Analysis Project ChemLog
Project Partner: Poland Page 54/90
Trans‐European Olefins Pipelines – a network for the future
Project Product Description Countries
Interconnected Length km
Cost Mio EUR
EPDC Propylene Rhine/Ruhr to Netherlands
Belgium Netherlands Germany
420 184
North‐South Europe line
Ethylene
Propylene
Feluy to Carling
Feluy to Carling
Belgium France Belgium France
320
320
100
100
North‐South Europe line
Ethylene
Propylene
Carling to Ludwigshafen
Carling to Ludwigshafen
France Germany France Germany
200
200
75 75
North‐South Europe
Propylene Carling to Lavera France 850 300
Interconnector Ethylene UK to Rotterdam UK
Netherlands 525 376
Chemcoast Ethylene Gelsenkirchen to
Wilhelmshafen and other N German connections
Germany 270 90
Elbe Crossing Ethylene, Propylene
Stade to Brunsbüttel Germany 65 42
Italy
Ethylene
Rosignano – Ferrara or Rosignano—Ravenna
Italy
200 50
German connection
Propylene Ruhr to Ludwigshafen Germany 240 85
Bayernverbund Ethylene Propylene
Münchsmünster to ARG Münchsmünster to ARG
Germany Germany
370 370
120 120
Eastern‐Southern routing
Ethylene Porto Marghera via Rijeka to Zagreb and onto Schwechat
Italy Slovenia Austria
742 223
Austrian Connection
Ethylene Burghausen to Schwechat
Germany Austria
306 92
Czech Connection
Ethylene Münchsmünster to
Litvinov Germany
Czech Republic 373 112

SWOT‐Analysis Project ChemLog
Project Partner: Poland Page 55/90
Polish
Connection Ethylene Bohlen to Plock
Germany Poland
663 190
West‐Mediterranean
Line Ethylene Berre to Tarragona
France Spain
300 100
West‐East Line Europe
Ethylene Schwechat to Burgas
Austria Hungary Romania Bulgaria
900 320
Total 7634 2751
Recently completed projects comprise of: the 150km extension to the UK system to connect Humberside to Teesside, 400 km of the French system linking Carling and storage facilities in central & southern France, and a 400 km pipeline connecting Stade (North Sea coast) with Bohlen (Central Germany) ‐ bi‐directional for ethylene and propylene transportation.
Polish chemical products transmission system consists of the ethylene pipeline Plock – Wloclawek. It connects refinery in Plock with ANWIL chemical works.
Figure : Polish ethylene pipeline. Source: APPE, 2005. The Total length of ethylene pipeline is about 40 km and its maximum flow capacity amounts to 200 thousand tons of ethylene per year.

SWOT‐Analysis Project ChemLog
Project Partner: Poland Page 56/90
4.6.3 ACTUAL AND PLANNED FIGURES Pipeline transport: Pipeline transport 2000 2001 2002 2003 2004 2005 2006 2007
Natural gas*
Gas pipelines in billion m3/year 2.32 2.58 2.34 2.58 2.68 2.72 2.74 2.74
Gas transit pipeline (Jamal) in billion m3/year**
30 30 30 30 30 30 30 30
Planned – Baltic Pipe (2.5 – 3 billion m3/year)
‐ ‐ ‐ ‐ ‐ ‐ ‐ ‐
Crude oil/Fuels in Mio tons/year
Gasoline pipeline Plock – Mosciska ‐ Emilianow
0.6 0.6 0.6 0.6 0.6 0.6 0.6 0.6
Gasoline pipeline Plock – Nowa Wies 1.25 1.25 1.25 1.25 1.25 1.25 1.25 1.25
Gasoline pipeline Nowa Wies ‐ Rejowiec
0.85 0.85 0.85 0.85 0.85 0.85 0.85 0.85
Gasoline pipeline Plock – Koluszki 2.3 2.3 2.3 2.3 2.3 2.3 2.3 2.3
Gasoline pipeline Koluszki ‐ Boronow 0.6 0.6 0.6 0.6 0.6 0.6 0.6 0.6
Chemical products in thousands of tons/year
Ethylene pipeline Plock – Wloclawek***
140 140 140 140 140 140 140 140
Explanations:
* data included in the table above show gas consumption rate in the Large Chemical Synthesis.
** the maximum capacity of the Jamal pipeline is about 34 billion m3 of natural gas per year
*** the theoretical capacity of the ethylene pipeline is about 200 thousand tons per year. Maximum quantities of transported ethylene didn't exceed 140 thousand tons.
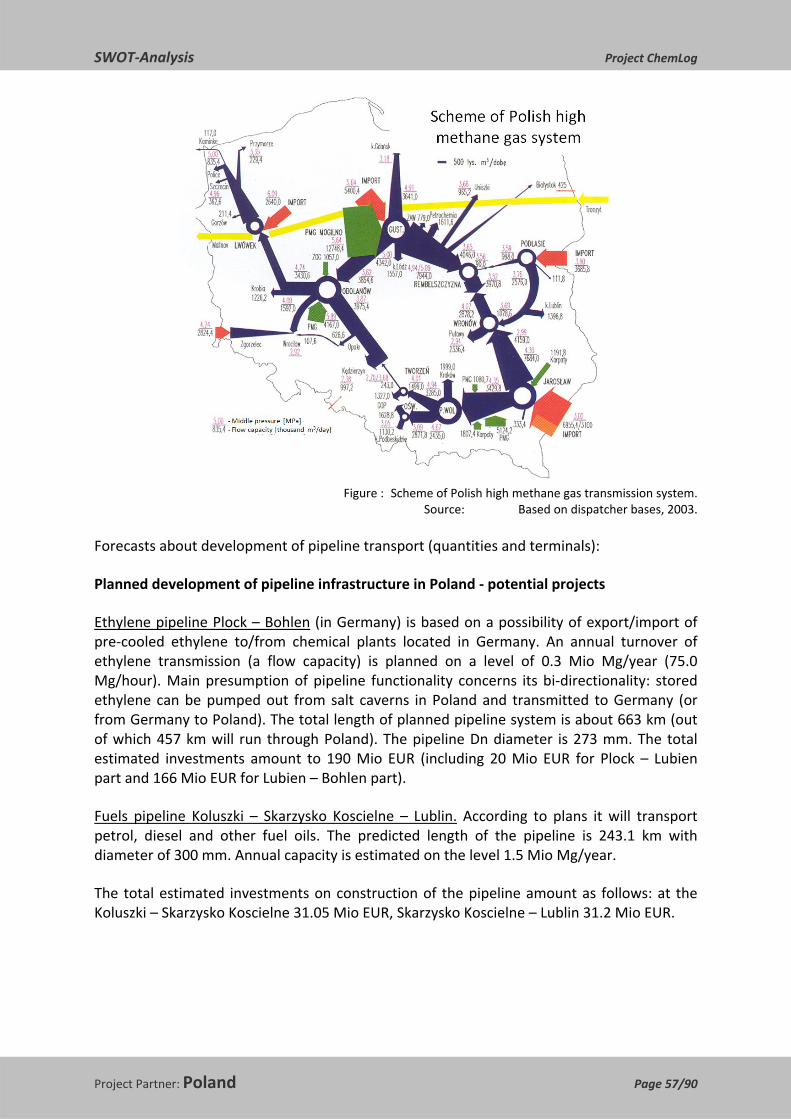
SWOT‐Analysis Project ChemLog
Project Partner: Poland Page 57/90
Figure : Scheme of Polish high methane gas transmission system.
Source: Based on dispatcher bases, 2003.
Forecasts about development of pipeline transport (quantities and terminals):
Planned development of pipeline infrastructure in Poland ‐ potential projects
Ethylene pipeline Plock – Bohlen (in Germany) is based on a possibility of export/import of pre‐cooled ethylene to/from chemical plants located in Germany. An annual turnover of ethylene transmission (a flow capacity) is planned on a level of 0.3 Mio Mg/year (75.0 Mg/hour). Main presumption of pipeline functionality concerns its bi‐directionality: stored ethylene can be pumped out from salt caverns in Poland and transmitted to Germany (or from Germany to Poland). The total length of planned pipeline system is about 663 km (out of which 457 km will run through Poland). The pipeline Dn diameter is 273 mm. The total estimated investments amount to 190 Mio EUR (including 20 Mio EUR for Plock – Lubien part and 166 Mio EUR for Lubien – Bohlen part).
Fuels pipeline Koluszki – Skarzysko Koscielne – Lublin. According to plans it will transport petrol, diesel and other fuel oils. The predicted length of the pipeline is 243.1 km with diameter of 300 mm. Annual capacity is estimated on the level 1.5 Mio Mg/year.
The total estimated investments on construction of the pipeline amount as follows: at the Koluszki – Skarzysko Koscielne 31.05 Mio EUR, Skarzysko Koscielne – Lublin 31.2 Mio EUR.
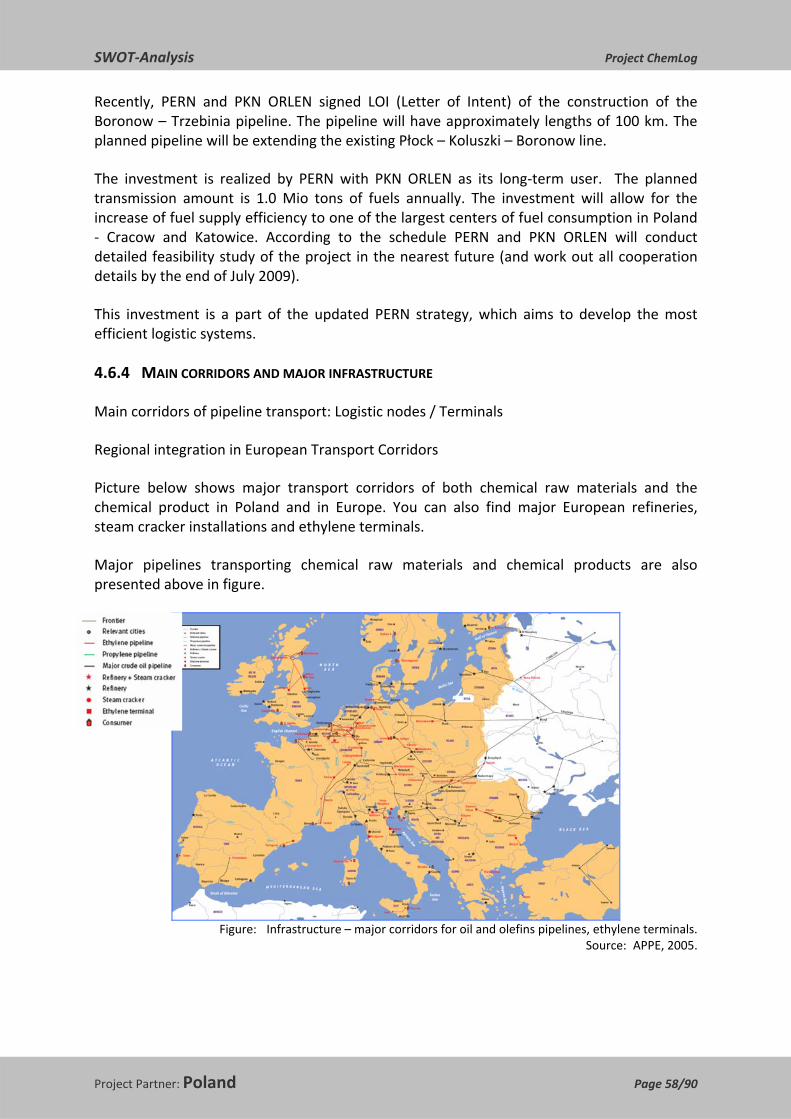
SWOT‐Analysis Project ChemLog
Project Partner: Poland Page 58/90
Recently, PERN and PKN ORLEN signed LOI (Letter of Intent) of the construction of the Boronow – Trzebinia pipeline. The pipeline will have approximately lengths of 100 km. The planned pipeline will be extending the existing Płock – Koluszki – Boronow line.
The investment is realized by PERN with PKN ORLEN as its long‐term user. The planned transmission amount is 1.0 Mio tons of fuels annually. The investment will allow for the increase of fuel supply efficiency to one of the largest centers of fuel consumption in Poland ‐ Cracow and Katowice. According to the schedule PERN and PKN ORLEN will conduct detailed feasibility study of the project in the nearest future (and work out all cooperation details by the end of July 2009).
This investment is a part of the updated PERN strategy, which aims to develop the most efficient logistic systems.
4.6.4 MAIN CORRIDORS AND MAJOR INFRASTRUCTURE
Main corridors of pipeline transport: Logistic nodes / Terminals
Regional integration in European Transport Corridors
Picture below shows major transport corridors of both chemical raw materials and the chemical product in Poland and in Europe. You can also find major European refineries, steam cracker installations and ethylene terminals.
Major pipelines transporting chemical raw materials and chemical products are also presented above in figure.
Figure: Infrastructure – major corridors for oil and olefins pipelines, ethylene terminals.
Source: APPE, 2005.

SWOT‐Analysis Project ChemLog
Project Partner: Poland Page 59/90
As seen in the picture Russia is the dominating supplier of natural gas to Central and Eastern Europe countries (CEE) and is an important supplier to Western Europe.
Due to the natural gas growing demand EU promotes new gas pipelines construction gas (east direction: Baltic, Amber, Jamal II, south: Nabucco; also other in the western part of EU).
4.6.5 GOVERNMENT PLANS AND POLITICAL PROGRAMS
Extension plans, financing ‐ PPP, investment volume, focus on corridors, etc.
Extension plans
Olefin products
An above mentioned structure of the ethylene pipeline Plock‐Bohlen is one of main projects planned (see below).
Figure: Polish olefin pipeline – the project.
Source: APPE, 2005.
The main justifications for construction of the ethylene pipeline are:
o establishing the strong business cooperation with the German partner, o focus on the possibility of the ethylene export to Germany, o focus on the possibility of the implementation of the project with other possible
pipelines for propylene and LPG transmission.

SWOT‐Analysis Project ChemLog
Project Partner: Poland Page 60/90
The total estimated investment spending amount to 190 Mio EUR.
You can find more details on ethylene and fuel pipelines in the chapter “Forecasts about development of pipeline transport (quantities and terminals)”.
Natural gas projects
Government plan concerning the Poland’s energy security includes the profitability analysis and conditions of the construction of two new gas pipelines.
The first project discussed assumes connection of the Polish gas network with Austrian gas hub in Baumgarten. This pipeline, stretching out through Turkey, Bulgaria, Romania, Hungary and Austria, is supposed to enable Central and Southern Europe, an access to the natural gas from the Caspian Sea.
The second project concerns the short Baltic Pipe, which would link Poland with the Danish gas system. According to 2007 plans, this pipeline was supposed to be ready in 2010 allowing for transportation of 2.5 – 3 billon m3 of natural gas (annually) from the Norwegian gas deposits at the North Sea. At present, on the order of the Prime Minister the profitability analysis of the project is prepared by the Gaz‐System.
Figure : Projected gas connectors in the Baltic Sea region.
Source: Gazeta Wyborcza, 2007.
The stability of gas supplies can be also increased by new strategic gas reserves. The construction of new gas storages in Wierzchowice has been started to achieve this goal. The first stage of the project should end up at 2011/2012. The government also plans to extend the gas storage facilities in Mogilno and to build the new one in Kosakowo. These projects will increase Polish storage capacity from 1.6 billion m3 to 3.8 billion m3.
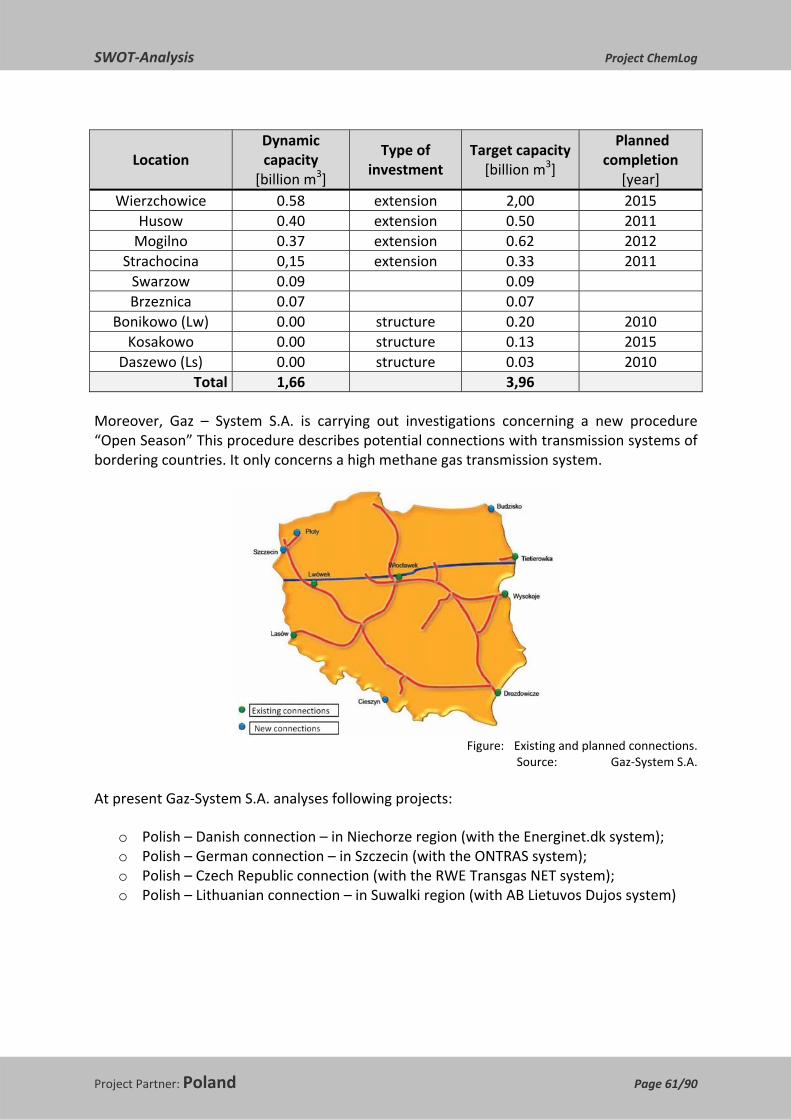
SWOT‐Analysis Project ChemLog
Project Partner: Poland Page 61/90
Location Dynamic capacity
[billion m3]
Type of investment
Target capacity [billion m3]
Planned completion
[year] Wierzchowice 0.58 extension 2,00 2015
Husow 0.40 extension 0.50 2011 Mogilno 0.37 extension 0.62 2012
Strachocina 0,15 extension 0.33 2011 Swarzow 0.09 0.09 Brzeznica 0.07 0.07
Bonikowo (Lw) 0.00 structure 0.20 2010 Kosakowo 0.00 structure 0.13 2015
Daszewo (Ls) 0.00 structure 0.03 2010 Total 1,66 3,96
Moreover, Gaz – System S.A. is carrying out investigations concerning a new procedure “Open Season” This procedure describes potential connections with transmission systems of bordering countries. It only concerns a high methane gas transmission system.
Figure: Existing and planned connections.
Source: Gaz‐System S.A.
At present Gaz‐System S.A. analyses following projects:
o Polish – Danish connection – in Niechorze region (with the Energinet.dk system); o Polish – German connection – in Szczecin (with the ONTRAS system); o Polish – Czech Republic connection (with the RWE Transgas NET system); o Polish – Lithuanian connection – in Suwalki region (with AB Lietuvos Dujos system)

SWOT‐Analysis Project ChemLog
Project Partner: Poland Page 62/90
Independently of mentioned above connections, Gaz‐System is planning, up to 2014, a structure of gas pipelines in north‐western Poland. The total length amounts more than 600 km. The investment value is being estimated at over 450 Mio EUR. In plans are pipelines: Swinoujscie – Szczecin, Szczecin – Lwowek, Szczecin – Gdansk and Gdynia – Wloclawek – Odolanow.
LNG
One of the key elements of the Polish natural gas supplies diversification program is the construction of the LNG regasification terminal gas (“Gazoport”) in Swinoujscie. The planed installation capacity amounts to 2.5 billion m3 annually. The Installation is supposed to be finished in 2013, or in 2014 at the latest. The total estimated investment spendings amount to the 450 Mio EUR.
Crude Oil
From Polish government point of view, it is crucial to construct large, new storage facilities to secure and stabilize crude oil supplies. According to government plans, in the nearest future in Kosakowo region, the fuel and crude storages are supposed to be built. The total planned capacity of storages exceeds 12 Mio m3.

SWOT‐Analysis Project ChemLog
Project Partner: Poland Page 63/90
5 DESCRIPTION OF CHEMICAL LOGISTICS IN THE REGION / COUNTRY
Short description of chemical logistics, Transported chemical goods share of modes road / rail / river
There are 23000 road transport companies in Poland operating national and international. 80% of them are small (less than 5 trucks), others are medium, big size and global.
8% of road transport firms is carrying chemicals (hazardous, due to ADR and non hazardous).
The Safety and Quality Assessment System SQAS by CEFIC is present in Poland since 2003. Till the end of 2008, 80 SQAS assessments has been made (in all modules), most of them in road transport service.
The biggest railway company is state owned PKP CARGO, however another 25 private owned firms are also very active (with 10% share) in chemical transport . The biggest 2 are: CTL Group and PCC Rail.
Within 6 inland waterway companies 2 are most important for transport of goods: ODRA Trans settled in Wroclaw and operating at Odra river and in Germany, and Zegluga Bydgoska settled in Bydgoszcz and operating at lower Wisla, Notec, Warta and Bydgoski Channel.
Intermodal transport is based mostly on rail / road or sea /road terminals, and need more big terminals with access to all operators.
Actual, the majority of chemical products are transported by road, what is shown on graphs below.

SWOT‐Analysis Project ChemLog
Project Partner: Poland Page 64/90
Transported chemical goods – share of transportation modes
Transported chemical goods
2000 2001 2002 2003 2004 2005 2006 2007
Road n.a. n.a. n.a. n.a. 48,545 55,704 74,030 74,167
Railway n.a. n.a. n.a. 25,683 26,397 25,818 27,156 29,411
Waterway n.a. n.a. n.a. 570 490 677 596 604
Pipeline
Natural gas*
8,306 9,236 8,377 9,236 9,666 9,737.6 9,809.2 9,809.2
Crude oil 12,537 12,318 12,474 11,724 12,194 12,569 13,612 13,646
Fuels** 8,369 8,409 8,175 7,886 8,344 8,557 8,543 8,563
Chemical products – ethylene ***
140 140 140 140 140 140 140 140
Total 105,776 113,194.6 133,886.2 136,340.2
Source: PGNiG. * natural gas density (0.716 kg/m3) was used for calculation;
** the calculated amounts are taking into account average using pipelines which is oscillating on level 60%;
*** total flow capacity of pipeline amounts 200 thousands of tons of ethylene. In the table an average annual quantity of transported ethylene was accepted.
SWOT‐Analysis Project ChemLog
Project Partner: Poland Page 65/90
6 INTERNAL STRENGTHS OF CHEMICAL COMPANIES AND LOGISTIC PROVIDERS
SWOT Analysis interviews has been carried in a group of:
1. Chemical Producers representing the following industry sectors:
o Organic and Inorganic Chemicals, o Fertilizers, o Plastic Raw Materials and reclaimed materials, o Plastic Products, o Rubber Raw Materials and reclaimed materials, o Rubber Goods, o Resins and Resin Products, o Detergents Raw Materials, Soaps, Washing, Cleaning and Personal Care Products, o Industrial Gases, o Adhesives and Glues, o Paints, Varnishes, Printing Inks, Fillers, Mordant, Wood Preservatives, o Pharmaceuticals, o Disinfectants, o Fats, Oils, Pastes, Lubricants and Waxes, o Miscellaneous Additives, o Biocides, o Other Chemical Products, o Engine Fuels.
2. group of Logistic Service Providers representing:
o Road Transport, o Rail Transport , o Inland Waterway, o Intermodal Transport, o Pipelines (for crude oil and gas, also chemical / petrochemical products)
has been interviewed the same way.

SWOT‐Analysis Project ChemLog
Project Partner: Poland Page 66/90
6.1 STRENGTHS IN PROCUREMENT o Procurement lead time for raw material and intermediates: 70% of chemical
producers consider it as strength (production planning, supplier’s flexibility, development of new distribution channels), 20% as weakness, but logistic providers / transport companies answers are 60% negative (potential delay causes in fines or contract loosing).
o Suppliers' availability, reliability and flexibility: 85% of respondents in both groups consider it as strength; however 15% has different opinion.
o Collaboration demand planning: majority answers (59%)are positive (higher quality of logistics service, easier production planning) vs. 8% negative, 33% neutral
o Sourcing strategies (global versus single): answers are divided by half positive (vs. negative
o Research and Development of sourcing markets: 82% positive answers vs. 18% neutral
o Supplier assessment and management: 80% positive answers vs. 20% neutral o Quality of product and packaging: 83 % positive answers vs. 17% neutral o Terms of payment and delivery: 67% answers for strength, 25% weakness, 8%
neutral o Communication to the supplier (key contact, support service, etc.): 70% positive,
10% negative, 20% neutral
Explanations: The majority of producers consider research and development of sourcing markets, supplier assessment, product/packaging quality and communication to the supplier as crucial parameters in procurement.
6.2 STRENGTHS IN WAREHOUSING OF RAW MATERIALS, SEMI‐FINISHED AND FINISHED PRODUCTS
o Safety stock level o Inventory strategy o Outsourcing of warehousing
Explanations: The majority of interviewed companies expect more strength in good inventory strategy or outsourcing of warehousing (73% positive versus 27% neutral).
They agreed that inventory generate costs, expired inventory generates problems and costs, but on the other hand safety stock of inventory level depend on very good cooperation with suppliers, and “just in time” delivery system is risky for production stability.

SWOT‐Analysis Project ChemLog
Project Partner: Poland Page 67/90
6.3 STRENGTHS IN PRODUCTION LOGISTICS
The most of chemical producers and logistic providers consider complexity within the production processes, utilization of machines and production lines, flexibility and stability within production processes as its internal strength.
The other production logistic factors such as:
susceptance of damage within production processes, duration production change‐over / set‐up, (although in opinion of 10% of respondents the new investments could be a potential to develop new logistics solutions), production costs and scrap rate are considered mostly as weakness or neutral.
6.4 STRENGTHS IN DISTRIBUTION AND TRANSPORT
The majority of respondents stated the main strength in distribution and transport as:
o Payload optimization: 81% strength, 19% neutral o Flexibility within distribution processes o Stability within distribution processes o Outsourcing of Distribution and Transport (lower own costs), but also o Disposition of transports; 81% strength (own specialized transport gives better
selling possibility) 9% weakness (costs), 10% neutral o Coordination and communication with Logistic Service Providers o Consolidation of shipments on selected products and destinations: 70% strength
10%weakness (waiting time), 20% neutral
The other elements observed more as strength than weaknesses are:
o Delivery time and performance: 67% strength (development of new logistics solutions), 33% weakness (too small assets for infrastructure investments)
o Structure and degree of centralisation of the distribution network: 73% strength 9% weakness, 18% neutral
o Mode of transport: 58% s (when accessible), 23% weakness (when specialized equipment necessary is not easy to access), 19% neutral
6.5 STRENGTHS IN PLANNING AND CONTROLLING
Almost all responders consider as strength:
o Accuracy and Flexibility in Demand and Supply Planning, Forecasting with customers o Accuracy and Flexibility in Planning of inventory levels, production planning and
Delivery Planning are strong strength elements in planning and controlling. o A bit less interest, (but also positive) result is for event management (45% strong,
55% neutral)

SWOT‐Analysis Project ChemLog
Project Partner: Poland Page 68/90
6.6 STRENGTHS IN ORDER PROCESSING
The most important strength elements in order processing in opinion of the majority responders are:
o Coordinated order processing o Flexibility within order processing o Stability within order processing, o as optimisation of purchasing strategy
The second group of elements are considered as more risky elements and they are evaluated half by half:
o Available‐to‐promise 40% strength, 40 % weakness, 20% neutral o Order fulfilment cycle time 50% strength, 36% weakness (In mass goods production
max. production line ability determined), 14% neutral
6.7 STRENGTHS IN INFORMATION LOGISTICS o ERP‐ and MRP systems in procurement: 77% strength, 7% weakness, 16% neutral o ERP‐ and MRP systems in inventory management: 83% strength, 17% neutral o PPS‐System in production planning: 75% strength, 8% weakness, 16% neutral o Supply Chain Event Management: 81% strength, 9% weakness, 10% neutral
Explanations: The majority of responders both: chemical producers and transport / logistics providers considers the management supporting systems ERP, MRP, PPS and Supply Chain Management system as helpful instruments and strengths in logistics enlarging production and selling planning and optimization possibilities.

SWOT‐Analysis Project ChemLog
Project Partner: Poland Page 69/90
7 INTERNAL WEAKNESSES OF CHEMICAL COMPANIES AND LOGISTIC PROVIDERS
7.1 WEAKNESSES IN PROCUREMENT o Procurement lead time for raw material and intermediates: logistic providers /
transport companies answers are 60% consider it as a threat (potential delay causes in fines or contract loosing), however chemical producers group answers 80% for strength.
o Sourcing strategies (global versus single): answers divided by half. o Terms of payment and delivery: 25% of responders consider as the weakness vs.
67% strength and 8 % neutral.
7.2 WEAKNESSES IN WAREHOUSING OF RAW MATERIALS, SEMI‐FINISHED AND FINISHED PRODUCTS
Some key words (according to the guideline):
o Safety stock level o Inventory level o Returned products o Expired inventory o Range of inventory o Inventory costs
Explanations: Part of respondents 40% – 63% answered that above mentioned factors are weaknesses, because of increased warehousing costs and loses caused by expired inventory.
7.3 WEAKNESSES IN PRODUCTION LOGISTICS
Some key words (according to the guideline):
o Susceptance of damage within production processes: weakness ‐ according to 87% respondents; neutral 13 %
o Duration production change‐over / set‐up: 45% weakness, 55% neutral
o Production costs: 72% of weakness

SWOT‐Analysis Project ChemLog
Project Partner: Poland Page 70/90
7.4 WEAKNESSES IN DISTRIBUTION AND TRANSPORT
Some key words (according to the guideline):
o Freight costs 67% weakness (Freight costs have a strong impact on selling costs; higher freight costs, when specialized equipment necessary), 33% strength (better freights for bigger scale)
o Distance to customers: 48% weakness, 14% neutral o Mode of transport: may be treated as weakness in case of difficulties in achievement
of specialized / not common used transport mode for their product.
7.5 WEAKNESSES IN PLANNING AND CONTROLLING o All respondents answer positive; no weaknesses
7.6 WEAKNESSES IN ORDER PROCESSING
Part of the chemical producers 43% ‐ 52% considered two factors:
o Available‐to‐promise o Order fulfilment cycle time
as a weaknesses.
7.7 WEAKNESSES IN INFORMATION LOGISTICS o Almost all respondents answer positive; no weaknesses in modern production
planning and information.
Summary weaknesses of Chemical Industry in Poland:
1. Strong dependence from raw materials sources’ 2. Too low expenditure for research and implementation of modern technologies, 3. High costs of new technologies transfer, 4. High differentiation among production enterprises, 5. Concentration on low added value products 6. High production costs 7. High Energy costs 8. High wage level 9. Lack of long‐term support policy

SWOT‐Analysis Project ChemLog
Project Partner: Poland Page 71/90
8 EXTERNAL OPPORTUNITIES AND CHANCES FOR CHEMICAL LOGISTICS IN
CENTRAL AND EASTERN EUROPE
What are external non influential opportunities and chances for chemical logistics in Central and Eastern Europe?
To be summarised by project partners on the basis of discussion in Regional Stakeholder Meetings.
8.1 7.1 ECONOMIC TRENDS
Some key words (according to the guideline):
o Internationalization of selling markets: 69% Chance (free trade) ; 23% threat (increasing competitions, threat from the cheap Asian products), 8% neutral
o Internationalization of sourcing markets: 80% (wider access to sources) S; 20% W (higher prices or low quality)
o Market concentration/intensified competition: by half 43% S (force out monopoly); 42% W (increasing not always honest competition), 18% N
o Individualization of products and services: 62% S (faster development, possible market segmentation); 7% W, 31% N (not critical in mass products)
o Eastern European expansion of the EU: 86% S (expected faster development, similar ecology standards),
o Access to international selling markets 78% S o Access to international sourcing markets o Actual world‐wide economic development: (expected increasing of consumption /
selling) o Regional economic development: 80% S (increasing of investment and selling level) o World‐wide economic structure: 52% S o Regional economic structure: 50% S o Actual regional wage‐level development 21% S, 50% W, o Adjustment of Eastern European wage‐level to Central European’s level : as above o Regional development of production costs: almost all responders treat it as threat
(worst competition condition)
Explanations: almost all factors (except market concentration / intensified competition, actual regional wage level development, and regional development of production costs) are considered as opportunities and chances.

SWOT‐Analysis Project ChemLog
Project Partner: Poland Page 72/90
8.2 SOCIAL AND CULTURAL TRENDS o Educational standards: 77% chances, o Availability of human resources in the field of logistics: 71% opportunity , o Skills of employees in the field of logistics (professional, social and intercultural): all
responders classified as chance
8.3 TECHNOLOGICAL TRENDS
Some key words (according to the guideline):
o Information and Communication Technologies o Innovations in transports o Innovations in transhipment o Innovations in warehousing / storage o Trends in inter‐company collaborations o Acceptance of railway and waterway
All responders answered positive: opportunity and chances
8.4 ENVIRONMENT AND ENERGY
The only positive estimated issues are renewable energy sources (78% chances)
8.5 POLITICS AND INNOVATION
Explanations:
o The most positive answers( chances) are : International harmonization of transport and traffic related laws and regulations
o Prioritization of traffic infrastructure issues within the political programs o Financing of traffic infrastructure projects o Financing of traffic infrastructure projects
The other issues are estimated rather negative, because of usage costs, usually people want new developed roads and factories but not accept it nearby.

SWOT‐Analysis Project ChemLog
Project Partner: Poland Page 73/90
8.6 TRANSPORT INFRASTRUCTURE
8.6.1 RAILWAY
Some key words (according to the guideline):
Opportunities and chances:
o Location and structure of the railway system: o Well developed / big density of railway network.
o Over 5000 kilometres of main transit rail tracks included to trans‐European network (TEN – T)
o Convenient railway connections between industrial centres and other entities o High capacity of carriage o Low energy costs of 1 tonne‐km o Low external costs o Availability and capacity of railway wagons o High adaptation of rolling stock to mass products o High safety level of hazardous loads carriage o Possibility of long distance carriage o State‐owned railway systems (stability) o Interoperability – international standards o The existing broad gauge rail connection with Russia and the Commonwealth of
Independent States are the advantage for the national rail network, ensuring fast and safe transport of goods to eastern markets. The broad gauge network covers 400 kilometres of track and the route begins in Slawkow, in Gorny Slask, where Poland’s largest loading ramp is located and it carries on to Hrubieszow which lies on the EU’s border with the Ukraine.
o The infrastructure (rail tracks and nodes) modernization, also purchasing and modernization of rolling stock with European funds use,
o Railway transport development according to sustainable development idea, o Transit position of Poland (due to pan‐European corridors), o Liberalization process of railway market continuation, o Privatization continuation o PPP investments in railway sector, o Increasing demand for railway carriage because of Poland’s economic growth o Road haulage diminishing tendency according to the EU regulations, o Engine fuels prices rise, generating higher costs of road transport, o Development of increase in road tool, o Higher competition level pressing for quality development o Increasing demand for energy production (hard coal transport)
SWOT‐Analysis Project ChemLog
Project Partner: Poland Page 74/90
8.6.2 WATERWAY
Some key words (according to the guideline):
o Location and structure of the waterway network o Location of inland ports o Capacity and efficiency of waterway o Access to ports o Availability and capacity of water vessels o Interoperability – international standards
Explanations: Inland Waterway is network is advantageous located and fits to pan – European corridors, but it is not enough efficient because of not stable water level at the naturally flow of the rivers sections. Waterways and ports infrastructure needs high investments. Polish Inland Waterway operates with big fleet. Half of it is used in Western Europe waterways network.
8.6.3 ROAD
o Location and structure of the road network: o Transit position of Poland (due to pan‐European corridors I, II, III, VI), o big density of roads network actually ca. 19 200 km, in near future (2012) planned
increasing up to ca. 23 800 km. o Capacity and efficiency of motorways: up to the end of 2008, there was 674
kilometres of motorways in Poland, but according to the Construction Programme of National Roads 2008 ‐2012, it is planned to develop motorways up to 1779 km and express roads up to 2274 km (to the end of 2012),
o Development of increase in road toll: most of responders answered positive (64% : shorter time of delivery, more effective logistics), however 36% answered negatively, because of toll price increasing transport costs
o All responders (100%) consider Interoperability / international standards as standardisation of procedures and rules obliged in EU
8.6.4 INTERMODAL
The majority of chemical producers expect in intermodal transport the opportunity to better logistics and lower transport costs, higher safety and less damages of load, however, on the other hand, they indicate the necessity of enlargement intermodal nodes and terminals.
Transport and logistics providers opinion is divided depend on represented transport mode, what is intelligible because of competition between different modes of transport.
SWOT‐Analysis Project ChemLog
Project Partner: Poland Page 75/90
o Location, structure and capacity of intermodal nodes; there is expected to build a big size rail/road/waterway terminals with access to all operators
o Handling technology road‐rail‐waterway/sea; the best way of mobility, lower freight rates
o Technology for means of transportation; possibility to handle “difficult” chemicals o Information and communication technologies within intermodal transport; load
tracing means safety and “just in time” delivery o Interoperability – international standards; better logistics based on harmonized EU
rules
Explanations: Poland’s geographical location at the crossing of four pan‐European corridors is the main strength and chance for all transport modes, especially for intermodal transport.
8.6.5 PIPELINE
Some key words (according to the guideline):
o Location and structure of the pipeline network o Capacity and efficiency of pipeline network
Explanations:
1. Ethylene pipeline Plock ‐ Bohlen
The main justifications for construction of the ethylene pipeline are:
o establishing the strong business cooperation with the German partner, o focus on the possibility of the ethylene export to Germany, o focus on the possibility of the implementation of the project with other possible
pipelines for propylene and LPG transmission. 2. Odessa – Brody – Plock Pipeline (the length about 550 km)
By the pipeline could be possible to transport of petroleum from oil pool in the Caspian Sea, mainly from Azerbaijan. The total estimated investments on construction of the pipeline amount approximately 500 – 600 Mio EUR.
3. Baltic Pipe, Skanled
Diversification gas supply to Poland from Scandinavian direction (planned flow capacity amounts 2.5 – 3 billion m3/year)

SWOT‐Analysis Project ChemLog
Project Partner: Poland Page 76/90
4. Nord Stream pipeline
Nord Stream is a gas pipeline to link Russia and the European Union via the Baltic Sea. It will carry natural gas to supply both businesses and households. The pipeline will transport up to 55 billion m3 of gas each year.
5. Nabucco pipeline
The Nabucco project represents a new gas pipeline connecting the Caspian region, Middle East and Egypt via Turkey, Bulgaria, Romania, Hungary with Austria and further on with the Central and Western European gas markets. The pipeline length is approximately 3,300 km, starting at the Georgian/Turkish and/or Iranian/Turkish border respectively, leading to Baumgarten in Austria. Estimated investment costs including financing costs for a complete new pipeline system amount to approximately 7.9 billion EUR.
6. LNG regasification terminal (“Gazoport” in Swinoujscie)
The planed installation capacity amounts to 2.5 billion m3 annually. This project contributes to the growth of the gas diversification process in Poland.
7. Amber pipeline
An advantage of the gas pipeline would be the gas‐supply to Warmia and Mazury regions.
8. Expansion of the gas pipeline Gdansk‐Plock
The structure of the second gas pipeline along the Pomeranian pipeline will increase the flow capacity of the pipeline. It will allow for independent transmission oil in both directions. Predicted length of the pipeline amounts 240 km.
9. Construction of pipeline Plock – Gdansk or Nowa Wies Wielka – Gdansk
Construction of pipeline for liquid fuels transport, which will let connecting fuel existing pipelines with the refinery and Naftoport in Gdansk. Predicted length of the Plock – Gdansk pipeline amounts 240 km and Nowa Wies Wielka – Gdansk amounts 180 km.
10. Construction of pipeline linking Naftoport and storage base in Gdansk
This investment is connected with construction of underground storages for petroleum and liquid fuels in Kosakowo. The pipeline can be located on the bottom of Gdansk Bay.

SWOT‐Analysis Project ChemLog
Project Partner: Poland Page 77/90
11. New storage base in Gdansk
Planned investment will increase the stock manual capacity of petroleum and oil products. Predicted capacity of storage base amounts 1 Mio m3. Planned localization: Tarnobrzeg region or Gdansk northern region.
12. Expansion of the raw materials base in Plock
This investment will increase the capacity of the central PERN base. It will enable commercial storing of petroleum and the separation of different grades of oil.
8.7 SAFETY AND SECURITY
Opportunities and chances:
o International safety standards; unified safety and security standards within Eastern and Western Europe
o Tracking & Tracing of cargo; optimization of production process o Information flow in intermodal transports; tracing the load by customer generates
optimization of production
8.8 INDUSTRY SECTOR AND COMPETITION
8.8.1 CUSTOMERS
Chances:
o Degree of concentration o Level of product standardisation o Potential for backward integration o Relevance and importance of the industry sector for the customers o Collaborations among customers
8.8.2 SUPPLIERS
For all respondents the following issues:
o Degree of concentration o Level of product standardisation o Potential for forward integration o Relevance and importance of the industry sector for the suppliers o Collaborations among suppliers
are chances.
SWOT‐Analysis Project ChemLog
Project Partner: Poland Page 78/90
8.8.3 ACCESS TO THE MARKET
Explanations: Access to the market is the chance in development and work with economies of scale, but generates costs for entry. Great chance is brand identity, access to channels of distribution. Public economic policy can impact both as a chance or threats depend on undertaken political decisions.
8.8.4 SUBSTITUTES
Most producers consider substitutes as threat

SWOT‐Analysis Project ChemLog
Project Partner: Poland Page 79/90
9 EXTERNAL THREATS, PROBLEMS AND BARRIERS FOR CHEMICAL LOGISTICS IN
CENTRAL AND EASTERN EUROPE
What are external non influencing threats, problems and barriers for chemical logistics in Central and Eastern Europe?
To be summarised by project partners on the basis of discussion in Regional Stakeholder Meetings.
9.1 ECONOMIC TRENDS o Internationalization of selling markets: 23% threat: (increasing competitions, threat
from the cheap Asian products), 8% neutral o Internationalization of sourcing markets: 20% Threat (higher prices or low quality) o Market concentration/intensified competition: by half, 42% Threat (increasing not
always honest competition), 18% N o Individualization of products and services: 31% Threat (not critical in mass products) o Actual regional wage‐level development: Threat 50% o Adjustment of Eastern European wage‐level to Central European’s level : as above o Regional development of production costs: almost all responders considers it as
threat (worst competition condition)
Explanations: Most critical threat factors are: market concentration / intensified competition, actual regional wage level development, and regional development of production costs.
9.2 SOCIAL AND CULTURAL TRENDS
Public image of the chemical industry is treated by chemical producers as a big barrier, because people still are afraid of hazardous chemicals in neighbourhood.
9.3 TECHNOLOGICAL TRENDS
Technological trends are treated as chances.
9.4 ENVIRONMENT AND ENERGY o Climate change o Carbon dioxide emissions o Availability of non‐renewable energy sources o Accessibility to non‐renewable energy sources o Energy costs

SWOT‐Analysis Project ChemLog
Project Partner: Poland Page 80/90
Explanations: all factors mentioned above are seemed by chemical producers as treats.
9.5 POLITICS AND INNOVATIONS
Barriers:
o Infrastructure employment costs (costs of usage) o Prioritization passenger traffic o Cross‐border capacity planning of traffic infrastructure across‐the‐carriers
9.6 TRANSPORT INFRASTRUCTURE
9.6.1 8.6.1 RAILWAY
Some key words (according to the guideline):
o Very bad condition of the railway tracks infrastructure; most of railway tracks are class C (20 tonnes weight per axle) instead of class D (22,5 tonnes weight per axle) obligatory standard in Western Europe countries
o The class C railway tracks are not allowed to the modern rail tank cars – according to the RID, TSI etc. rules all new rail tank cars registered after Jan. 1st 2007 have to be adapted (load weight/tank capacity) to class D railway tracks, what is also preferable by customers (chemical producers/distributors/clients) because of lower cost per tonne carried.
o Location of terminals: there are 23 terminals through Poland. According to the EU norm it should be 40 of them.
o Low availability and capacity of specialized railway wagons o Obsolete rolling stock o Capacity and efficiency of terminals: most of terminals are small or “temporary
mode” equipped with mobile re‐loading devices; some of terminals only are equipped with overhead travelling crane and 600 metres railway siding track.
o Access to terminals o State‐owned railway systems; almost all railway track infrastructure and high % of
rolling stock belong to state owned rail company.

SWOT‐Analysis Project ChemLog
Project Partner: Poland Page 81/90
9.6.2 WATERWAY
Barriers:
o Structure of the waterway network (sections of low water level) o Capacity and efficiency of waterway o bottlenecks o Problems with rivers engineering regulations o The lack of funds for improvement of infrastructure according to EU standards o Barriers in legal acts
9.6.3 ROAD o Location and structure of the road network o Capacity and efficiency of trunk road: usually driven through the centres of cities and
villages, wheel load capacity is much lower than required to 115 kN/axle (usually 80 kN/axle)
o Capacity and efficiency of motorways: there is lack of coherence of motorways and expressways network,
o Safety of road traffic (high accidents indicator) o Bad condition of road infrastructure (28,5% are in good condition only)
9.6.4 INTERMODAL o Location, structure and capacity of intermodal nodes: o To small amount and their capacity / transfer ability o Lack of efficient, modern, high capacity / transfer ability terminals for all transport
modes (rail/road/inland waterways/sea) o High construction cost of the high developed logistic terminals, o Handling technology road‐rail‐waterway/sea o Technology for means of transportation: o Small operational flexibility of railway sector o Low speed average of railway , in practice o To long waiting time for containers/tank‐containers necessary to form train or full
shipment in comparison with road transport o Information and communication technologies within intermodal transport

SWOT‐Analysis Project ChemLog
Project Partner: Poland Page 82/90
9.6.5 PIPELINE
The main barriers were identified in the implementation of new infrastructure projects.
1. Barriers in development of new infrastructure corridors There are very often politically motivated decisions.
2. Barriers in legal acts. Barriers in both regulations and administrative procedures. They increase total costs of the investment infrastructure projects.
3. Barriers resulting from the hierarchical structure of spatial planning. The hierarchical structure of planning should be permanently written in the Committee of Spatial Country Developing. In addition, the planning structure should be coherent with building code provisions, with act on forests and environment protection laws.
9.7 SAFETY AND SECURITY
All respondents consider safety and security standards as opportunity,
9.8 INDUSTRY SECTOR AND COMPETITION
9.8.1 CUSTOMERS
Factors presented bellow are seemed as chances by most of the respondents:
o Degree of concentration o Level of product standardisation o Potential for backward integration o Relevance and importance of the industry sector for the customers o Collaborations among customers
9.8.2 SUPPLIERS
Factors presented bellow are seemed as chances by most of the respondents:
o Degree of concentration o Level of product standardisation o Potential for forward integration o Relevance and importance of the industry sector for the suppliers o Collaborations among suppliers
SWOT‐Analysis Project ChemLog
Project Partner: Poland Page 83/90
9.8.3 ACCESS TO THE MARKET
Barriers:
o Public economic policy : 54% Threats, 46% opportunity o funds needed for market entry o Cost advantages of existing market players
Explanations:
Access to the market is an chance in development and work with economies of scale , but costs for entry may be a barrier
9.8.4 SUBSTITUTES
Potential product substitution 65% Threats for producers.
Explanations:
Substitutes are rather threat by producers and logistic providers, because they force out original product from the market.

SWOT‐Analysis Project ChemLog
Project Partner: Poland Page 84/90
10 NEEDS FOR FUTURE ACTIONS AND IMPROVEMENTS ‐ CONCLUSIONS
10.1 CONCLUSIONS FOR CHEMICAL PRODUCERS SECTOR 1. Acceleration of privatization process, 2. Necessity switch chemical producers to world production trends in dynamic
development of processing simple chemicals to high specific product with high level of added value,
3. Private and PPP investments development, 4. Innovations in chemical industry sector expectations 5. Higher founds necessity for research and new technology implementation, 6. Diminishing of energy costs, production costs, transport costs, 7. National chemical industry promotion necessary, 8. Necessary change of negative chemical facilities perception (people and environment
safety)
10.2 CONCLUSIONS FOR ROAD SECTOR 1. The funds intensification necessary for roads network development 2. Transit roads network development due to the pan – European corridors, 3. Strengthening roads construction for wheel load capacity up to 115 kN/axle 4. Ring roads sections construction for cities and agglomerations 5. Safety improvement on the particular roads sections, 6. Necessary improvement of road traffic safety (high accidents indicator) 7. The improvement of road infrastructure condition (28,5% are in good condition only) 8. Improvement of the transit conditions through big cities, 9. Improvement of road quality (up to good quality indicator of 75%) of national road
network.
10.3 CONCLUSIONS FOR RAILWAY SECTOR 1. The investments intensification for infrastructure (rail tracks and nodes)
modernization, also purchasing and modernization of rolling stock with European funds use,
2. Railway transport development according to sustainable development idea, 3. Effectively utilize transit position of Poland (due to pan‐European corridors), 4. Continuation of railway market liberalization process, 5. Continuation of privatization 6. PPP investments in railway sector, 7. Effectively utilize of increasing demand for railway carriage because of Poland’s
economic growth, 8. Improvement of re‐loading infrastructure 9. Railway tracks specialization for transport of goods necessity, 10. The railway connection necessity to the main sea ports in Poland 11. Increasing the amount of new specialized rolling stock fit to modern technologies

SWOT‐Analysis Project ChemLog
Project Partner: Poland Page 85/90
10.4 CONCLUSIONS FOR INLAND WATERWAY SECTOR 1. The development and integration of European inland waterway transport according
to European Agreement on Main Inland Waterway of International Importance (AGN), o The improvement of strategic “bottleneck” Odra river section: Widuchowa –
Szczecin o Basic “bottlenecks”:
• Odra river, section: Kozle – Widuchowa, and Gliwicki Channel • Wisla river, sections: Warsaw – Plock, Wloclawek – Gdansk • Bug river, section Brzesc – Zegrzynskie Lake • Zeranski Channel, section Zegrzynskie Lake – Wisla river • Wanting connections: Odra – Dunabe ‐ Labe Channel
2. Necessary rivers engineering regulations 3. The investments in improvement of infrastructure according to EU standards, 4. Implementation of “Odra Programme ‐2006” 5. Preparation and implementation of modernization program concerning lower section
of Wisla river and Wisla – Odra waterway connection 6. AGN Agreement ratification
10.5 CONCLUSIONS FOR INTERMODAL SECTOR 1. Necessity of investment in modern nodes and terminals accessible to all operators
especially in the centre of Poland, in sea ports and at the Eastern border, 2. The improvement of infrastructure according to EU standards, 3. Necessity of better co‐operation between private and state‐owned logistic providers 4. Necessity of government support for intermodal sector 5. Necessity of creation long‐term strategic plans, 6. Need of wider experienced operating professional intermodal logistic service
providers, who will be able to solve all customer’s needs, 7. Necessity of increase customers’ knowledge concerning advantages of intermodal
transport, 8. Promotion of Polish intermodal transport among other countries.
10.6 CONCLUSIONS FOR PIPELINE SECTOR 1. Amongst the existing modes of transport, pipelines are the lowest system for energy
consumption, CO2 emissions, air, water, noise pollution, safety and visual impact. 2. The development of an interconnected pipeline network in Central and Eastern
Europe will provide a better balance spread of economic activity and employment. It will prevent decline of remote regions and provide a cheap alternative to financial and employment impact of regional obsolescence.
3. The external effects and costs of pipelines are almost negligible and limited to the construction of the infrastructures and the energy production for the pumping installation. It is therefore obvious that a modal shift in favour of pipelines is in line with the EU Transport Policy and constitutes an excellent opportunity to integrate transport in sustainable development and promote European regional cohesion.

SWOT‐Analysis Project ChemLog
Project Partner: Poland Page 86/90
4. To the improvement of gas infrastructure, diversification gas supply projects from
Scandinavian direction (Baltic Pipe, Skanled) have the key importance for Poland. Also construction of LNG terminal can contribute to the growth of the diversification (prospect for years 2013‐2014).
5. Moreover, construction of new cross‐border connection (Amber pipeline) is potentially possible. In the future Gdansk – Szczecin pipeline would be his part (prospect for years 2015 – 2033). An advantage of the gas pipeline would be the gas‐supply to Warmia and Mazury regions.
6. The forecast accepted by PEP 2030 is making practically impossible the growth of natural gas consumption in Poland because above ¼ of the country is not gasified.

SWOT‐Analysis Project ChemLog
Project Partner: Poland Page 87/90
11 LITERATURE
This Report has been prepared for Polish Chamber of Chemical Industry in Warsaw, a Partner of the ChemLog Project by:
1. Pawel Mularz, a.m.‐p.m. FPUH, Krakow, Poland (Chapters: 1, 3.1, 3.2, 3.3, 3,4, 3.5, 4, 5, 6, 7, 8, 9.1, 9.2, 9.3, 9.4, 9.5, 10)
2. Mariusz Kaczmarek, ISE, Warsaw, Poland (Chapters: 2, 3.6, 7.6.5, 8.6.5, 9.6, part of 10‐pipelines)
11.1 LIST OF RELEVANT LITERATURE, STUDIES, SURVEYS, POLICY DOCUMENTS 1. Statistical Yearbook of the Republic of Poland 2008, Central Statistical Office, Warsaw 2. EUROSTAT, Yearbook 2008 3. PAIZ , Polish Information and Foreign Investment Agency, 4. Domestic Roads Construction Program for 2008 ‐2012, appendix to Ministry Council
of Polish Government resolution no. 163/2007 5. Master Plan for Rail Transport in Poland till year 2030, Ministry of Infrastructure
Republic of Poland, Warsaw, Dec., 2008 6. Strategy for Transport Infrastructure Development in 2004 – 2006 and the Following
Years, Ministry of Infrastructure, Warsaw, July 2003 7. Ministerstwo Infrastruktury, 2004. Załozenia Narodowej Strategii Rozwoju Transportu
na lata 2007‐2013 i lata dalsze. Listopad 2004. 8. Ministerstwo Infrastruktury, 2004. Polityka transportowa do roku 2025. (Projekt).
Listopad 2004 9. MTiGM,1995, Polityka transportowa. Ministerstwo Transportu i Gospodarki Morskiej 10. MtiGM, 1998. Plan rozwoju infrastruktury transportowej w Polsce do roku 2015.
Ministerstwo Transportu i Gospodarki Morskiej. 11. MTiGM,2001. Government Policy for Balanced Development 2001‐2015,
Ministry of Transport and Martime of Poland 12. Burnewicz J., Pawłowska B.,1994, Dostosowanie polskiego transportu do Unii
Europejskiej, koszty i korzyści. Przegląd Komunikacyjny, nr 10/94. 13. Burnewicz J., 1997. Transport w narodowej strategii integracji. Przegląd
Komunikacyjny, nr7‐8/97. 14. European Commission, 2001. European Transport Policy for 2010 – time to decide.
WhitePaper, Brussels 12.09.2001 15. Koszarek M., Szultka S.: Strategia Rozwoju Zachodniopomorskiego Klastra
Chemicznego, Instytut Badań nad Gospodarką Rynkową, Gdansk, 2006 16. Suchorzewski, W., 2001. Transport Policies in the Countries of Central and Eastern
Europe. A decade of integration: results and new challenges. ECMT Transport Policy Forum, Paris
17. Suchorzewski, W., 2001. Transport Demand in Transition Economies ‐ Trends and Possible
18. Ways of Management. ECMT Seminar, Brussels December 2002.

SWOT‐Analysis Project ChemLog
Project Partner: Poland Page 88/90
19. Suchorzewski W., 2003. Main Issues in Transport Policies in Transitional Economies in
Central and Eastern Europe. In: 50 Years of Transport Policy ‐ Successes, Failures and New Challenges. European Conference of Ministers of Transport. Paris 2003
20. Suchorzewski W., 1996. Transport Infrastructure In Poland: Main Issue Transportation
21. Infrastructure; Environmental Challenges in Poland and Neighbouring Countries. Springer1996. Berlin.
22. Strategia gospodarowania wodami w Polsce – projekt. Ministerstwo Środowiska. Warszawa 2000.
23. Transport – wyniki działalności w 2007r. Główny Urząd Statystyczny. Warszawa, 2008. 24. Transport – wyniki działalności w 2005r. Główny Urząd Statystyczny. Warszawa, 2006 25. Transport – wyniki działalności w 2003r. Główny Urząd Statystyczny. Warszawa, 2004 26. Transport – wyniki działalności w 2002r. Główny Urząd Statystyczny. Warszawa, 2003 27. Woś Krzysztof: Kierunki aktywizacji działalności żeglugi śródlądowej w rejonie ujścia
Odry w warunkach integracji Polski z unią Europejską. Oficyna Wydawnicza „Sadyba”. Warszawa 2005.
28. Rozporządzenie Rady ministrów z dnia 07 maja 2002r. w sprawie klasyfikacji śródlądowych dróg wodnych (Dz. U. z 2002r., nr 77, poz. 695).
29. Piskozub A.: Rzeki w dziejach cywilizacji. Wydawnictwo Adam Marszałek. Toruń 2001r.
30. Miłkowski M: Rzeka Wag i alternatywne połączenie Odra – Dunaj. „Przegląd komunikacyjny” 1995, nr 4.
31. Commission Staff working document. Annex to the Communication from the Commission on the promotion of inland waterway transport „NAIADES”. Brussels 17.012006 SEC (2006) 34/3 com (2006) 6 Final
32. White paper. European transport Policy for 2010: time to decide. Luxembourg 2001. 33. Development durable en Europe pur monde meilleur:strategie de l’Union
europeenne en faveur du developpement durable (proposition de la Commission en vue du Conseil europeen de Goteborg). Commision de Communautes europeenes. COM (2001)264. Bruksela 2001.
34. Kamiński T., Rusam M.,: Umowa AGN narzędziem w procesie integracji europejskich dróg wodnych śródlądowych „Gospodarka Wodna”1997, nr 7.
35. Mikulski: Polskie drogi wodne wobec wymogów europejskich. „Gospodarka Wodna” 2000, nr 6.
36. Grzelakowski A.: Szanse i zagrożenia rozwoju żeglugi śródlądowej w Polsce, w : Perspektywy transportu śródlądowego w Polsce. Sympozjum. Polski Rejestr Statków w Gdańsku. Gdańsk 2001r.
37. Zarządzanie gospodarką wodną w Polsce. Pr. zbiorowa pod kierunkiem H. Słoty. Regionalny Zarząd Gospodarki Wodnej w Krakowie. Kraków 2000.
38. Słota H: Zarządzanie systemami gospodarki wodnej. Instytut Meteorologii i Gospodarki Wodnej. Warszawa 1997.
39. Zasady gospodarowania na obszarze Natura 2000 dolinach rzek. Warszawa 2005. 40. Wojewódzka‐Król K., Rolbecki R.: Koncepcja strategii rozwoju śródlądowych dróg
wodnych w Polsce. Sopot 2007.

SWOT‐Analysis Project ChemLog
Project Partner: Poland Page 89/90
41. Gallor A., Szyszko M.: The Meaning of Ports of Odra Valley Corridor in Baltic Sea Region; WSM, Szczecin
42. Chwesiuk K.: Transport Corridors Development in the Baltic Sea Region; WSM, Szczecin
43. Muller R. , Zolder A. : Elaboration of a Decision Pattern for the Regulation of a Shipping Transit Lane in the Baltic Sea; Schiffahrtsinstitut Warnemunde E.V.; Warnemunde, 2003
44. Wasserstrassenkarte Europa; Binnenschiffahrts – Verlag GmbH, Dammstrasse 15‐17, 47119 Duisburg 1998.
45. ‐ Srodladowe drogi wodne w Polsce (Inland Waterways in Poland) map, Krajowy Zarzad Gospodarki Wodnej / Copernicus / PPWK, Warszawa, 2007
46. „Raport o wpływie uregulowań prawnych na warunki eksploatacji i rozwoju infrastruktury technicznej liniowej sektora paliwowo – energetycznego decydującej o bezpieczeństwie energetycznym kraju”, GAZ‐SYSTEM S.A., Izba Gospodarcza Gazownictwa, Polskie Towarzystwo Przesyłu i Rozdziału Energii, Polskie Sieci Elektroenergetyczne Operator S.A., Towarzystwo Rozwoju Infrastruktury ProLinea, Izba Gospodarcza CIEPŁOWNICTWO POLSKIE, PERN "Przyjaźń" S.A., Warsaw, February 2009.
47. “7th Report of the European Gas Pipeline Incident Data Group”, EGIG, December 2008.
48. “Annual Report 2007”, Polish Oil and Gas Company, 2007. 49. “Annual Report 2006”, Polish Oil and Gas Company, 2006. 50. “Annual Report 2005”, Polish Oil and Gas Company, 2005. 51. M. Wawrzonek, „Odessa – Brody – Plock Pipeline as an Part of Polish and Ukraine
Strategy Partnership”, 2006. 52. B. Filar, T. Kwilowicz, “Development Possibilities of Underground Storages in Poland”,
Energy Politics, 2008. 53. S. Rychlicki, J. Siemek, “Directions of Gas Supplies to Europe ‐ The Current State and
Future Tendencies”, Energy Politics, 2007. 54. Annual Report, PKN ORLEN, 2007. 55. “Poland in 2005 – Report on The Industry State”, Ministry of the Economy, Warsaw
2005. 56. G. Feller, “Critical Pan‐European Oil Pipeline Moves Forward”, Pipeline & Gas Journal,
December 2008. a. Barden , I. Storey, “Commissioning and Maintenance of Ethylene Pipelines and
Process Systems”, Amsterdam, 1992. 57. “Trans European Olefins Pipeline Network (TEPN)”, Cefic, Appe, April 2004. 58. D. Pinchback, “Critical Infrastructure Protection in the European Gas Industry ‐ an
R&D Perspective”, Austria, September 2007. 59. W. Lubiewa‐Wielezynski, “Chemical Logistics in Poland”, Workshop – Development of
Central and Eastern European Feedstock Network/ Chemical Logistics in an enlarged Europe, Magdeburg, February 2008.

SWOT‐Analysis Project ChemLog
Project Partner: Poland Page 90/90
60. P. Skelley, “The Trans European Olefins Pipelines Network Project – Benefits to the
European Industry”, High Level Group on the Competitiveness of the Chemical Industry Energy, Feedstock, Logistics, February 2008.
61. “Expert Project of the Spatial Conception of Country Developing”, Warsaw, December 2008.
62. “Energy Politics of Poland to 2030”, Warsaw, March 2009.


![SWOT FINAL Germany - ChemLog Project · feedstock materials to final products. One generic feature of clusters is a concentration of value ... SWOT‐Analysis Project [ChemLog] ...](https://static.fdocuments.us/doc/165x107/5afb2f257f8b9a2d5d8f3e20/swot-final-germany-chemlog-materials-to-final-products-one-generic-feature-of.jpg)

