Supporting Online Material for - Columbia...
35
www.sciencemag.org/cgi/content/full/324/5927/622/DC1 Supporting Online Material for High-Frequency Holocene Glacier Fluctuations in New Zealand Differ from the Northern Signature Joerg M. Schaefer,* George H. Denton, Michael Kaplan, Aaron Putnam, Robert C. Finkel, David J. A. Barrell, Bjorn G. Andersen, Roseanne Schwartz, Andrew Mackintosh, Trevor Chinn, Christian Schlüchter *To whom correspondence should be addressed. E-mail: [email protected] Published 1 May 2009, Science 324, 622 (2009) DOI: 10.1126/science.1169312 This PDF file includes: Materials and Methods SOM Text Figs. S1 to S4 Tables S1 to S4 References
Transcript of Supporting Online Material for - Columbia...

www.sciencemag.org/cgi/content/full/324/5927/622/DC1
Supporting Online Material for
High-Frequency Holocene Glacier Fluctuations in New Zealand Differ from the Northern Signature
Joerg M. Schaefer,* George H. Denton, Michael Kaplan, Aaron Putnam, Robert C. Finkel, David J. A. Barrell, Bjorn G. Andersen, Roseanne Schwartz, Andrew
Mackintosh, Trevor Chinn, Christian Schlüchter
*To whom correspondence should be addressed. E-mail: [email protected]
Published 1 May 2009, Science 324, 622 (2009)
DOI: 10.1126/science.1169312
This PDF file includes:
Materials and Methods SOM Text Figs. S1 to S4 Tables S1 to S4 References

Materials and Methods
I. Samples, geochemistry and analyses Samples
Large boulders are common on the Holocene moraines near Mt. Cook, and are predominantly hard, quartzo-feldspathic, fine-grained greywacke sandstone. Rock samples were taken from the most stable-looking section (typically from the center) of flat-topped, large greywacke boulders embedded in the tops of moraines (Fig. S3). We focused on sampling the top 2 cm. Target rocks were measured, described and photographed. The greywacke lithology is very resistant to erosion (e.g. (S1)), therefore we assume the erosion of the sampled surface to be close to zero over the relatively short time-scales discussed here. All samples were processed at the cosmogenic dating laboratory of the Lamont-Doherty Earth Observatory. At the laboratory, the rock samples were crushed to 125 μm – 710 μm. Geochemistry
We separated and decontaminated quartz from the whole-rock samples and measured the 10Be concentration from the quartz using isotope dilution techniques. In the past, fine-grained greywacke has proven very problematic to process for 10Be SED, primarily because it is difficult to clean the quartz to levels required by standard processing protocols without digesting most of the quartz. In order to separate sufficient quartz material (up to 100 g) from the whole rock for the low-level 10Be analysis, it was necessary to process up to 2500 g of whole rock (table S2). Accordingly, we designed an updated geochemical processing protocol based on the strategies presented by Licciardi (S2) and by the cosmogenic dating group at University of Washington, Seattle (http://depts.washington.edu/cosmolab/chem.html). Boiling of the crushed rock sample in Ortho-Phosphoric Acid prior to successive leaching in diluted hydrofluoric/nitric acid on the shaker table and in a heated ultrasonic bath has proven to be the key for the successful processing of greywacke samples for 10Be SED (http://www.ldeo.columbia.edu/res/pi/tcn/LDEO_Cosmogenic_Nuclide_Lab/Chemistry.html). Also fundamental to the success of this work is the low process blank at the Lamont cosmogenic nuclide laboratory. It is based on a 9Be spike from a natural, deep-mine beryl crystal, that is very pure (10Be/9Be ratio of about 5 x 10-16 (table S2)). We added between 0.18-0.2 ml of the 9Be spike to each sample and measured a process blank (a 9Be spike processed identically to the samples) with each sample batch. The 20 process blanks range between 5-20 x 10-16 (table S2), corresponding to a low 10Be contamination during the chemical sample processing between 6,000 to 26,000 10Be atoms/g. AMS analysis of very low 10Be/9Be ratios
The 10Be/9Be analyses were performed at the Accelerator Mass Spectrometry (AMS) facility at the Lawrence Livermore National Laboratory (LLNL). Due to the self-designed ion source at the AMS facility at the LLNL and high purity of the samples, 9Be
2
currents for our samples were high (table S1; 9Be currents range from 7 to 33 μA with a mean of 18 ± 6 μA), yielding high precision of the 10Be measurement. Individual AMS sample targets were measured between 2-5 times in total, providing an internal control of the stability of the AMS. The corrections for boron -10 (10B), an interfering isobar of 10Be, were typically lower than 1%, but were 3% or higher for six samples out of 75) thanks to chemical suppression of the boron levels in the quartz samples and good separation of the 10Be and 10B peaks in the detector (Fig. S4). Overall background corrections, including boron correction, correction for process blank, and sensitivity variations of the AMS during analysis, range from a few % (for most of the samples) up to >20% for six out of 75 samples (table S2). However, the consistent 10Be process blank over the various AMS runs measured with uncertainties of 10% or better for the ‘high background’ samples leaves us confident that even for the six samples with highest background correction, the reported 10Be/9Be ratio is precise within given uncertainties. Because the LLNL AMS facility allows for 10Be/9Be measurements in the 1x10-14 range within about 5% (1 σ), the analytical uncertainties of a single AMS analysis for samples exposed for 500 years and longer (at 700 m altitude) correspond to less than 50 years. Even for the youngest samples only 150 years in age the 1-σ uncertainty is better than 10 %, translating into an error (1σ) of 15 years. All analytical details and errors are given in table S2. II. 10Be Surface Exposure Dating of the Holocene moraines of Mueller, Hooker and
Tasman glaciers Reviews of the method of surface exposure dating (SED) using cosmogenic
nuclides are given in (S3-6). In this study, we present 10Be dating of very young moraines (from several thousand years in age down to 150 years, at elevations of less than 1000 m), pushing the 10Be technique to new limits. 10Be is the appropriate cosmogenic nuclide for SED on the short timescales discussed here due to the very low blanks and the excellent analytical precision. All input parameters needed to calculate the 10Be ages discussed in this paper are given in table S2. Table S2 also presents all geochemical and analytical details. We present all the ages based on different, currently accepted scaling schemes summarized in (S7) (table S3). A recently completed 10Be production rate calibration study by Balco et al. (S8) obtained production rates, for latitudes above 40º and elevations below 1000m, that are about 7% to 12% lower than the global calibration data set (S7). We include ages based on this revised production rate in table S3 and base our discussion on those ages (errors of moraine ages include 1σ analytical error and 5% production rate uncertainty given by (S8), see also Fig. S1). Note that the age differences depending on the scaling scheme are small, not affecting any of the conclusions drawn here.
The data show excellent internal consistency and agreement between chronology
and stratigraphic position (Figs. 1, 2, 3, S1). As the ages were derived from three different glacier systems and 74 individual boulders of differing settings, shapes and surface lithologies, it appears that none of the geomorphic processes listed in the 'Supporting Text- Section II ' (below), which may affect individual boulders to differing degrees, contributed significantly to the exposure ages obtained. However, the presented
3

data are precise enough to provide evidence for a small pre-exposure (inheritance) signal discernable in some of the youngest boulders, corresponding to less than 100 years, reflected in the trend towards higher χ2 values for the 10Be age distributions for the younger moraines (in particular the '400 year' and the '270 year' moraines, see Fig. S1). We discuss this issue in detail below (Section II of the 'Supporting Text').
The unprecedented consistency and the general lack of outliers of this 10Be chronology warrant explanation. We consider that it reflects the rapid rate of uplift-driven erosion in the Southern Alps, providing continuous supplies of freshly exhumed rock debris (S9). The main source of large boulder input to these glaciers is by large rockfall events (rock avalanches) which are common in the Southern Alps (S10). Such rockfalls are deep-seated and of large volume (S11), meaning that most of the failed rock material was not exposed at the rock outcrop surface prior to the rockfall event. This implies that a large proportion of the rockfall material has no pre-exposure to cosmic radiation. We consider that this accounts for the consistency of this 10Be chronology of the Holocene moraines of the Mt. Cook area.
It is likely, however, that considerable rockfall onto the large Mt. Cook valley glaciers occurs in the ablation zone, because valley walls are steep, with large extents of exposed rocks. Most of the debris falling onto the ablation zone will be transported supraglacially and exposure during transport on the glacier is likely to account for some of the multi-decade variations in boulder ages from individual moraines. Additionally, reworking of a boulder exposed on a previouly-formed moraine cannot be excluded and may account for the few instances of 'old' outliers in the data set (see Section II of the 'Supporting Text'). III. Radiocarbon dating of till stratigraphy in moraine walls
Downwasting of the Tasman Glacier has exposed the deposits within its lateral moraines, including sequences of buried soils. Each soil represents a period of reduced ice surface height, which allowed the moraine to stabilize and become vegetated, followed by a rise in the ice height which deposited till over the soil (see (S12)). Table S4 summarizes the data from (S12) (and references therein), recalculated to modern standards and calibrated using INTCAL04, including the Southern Hemisphere correction for samples younger than 1,175 14C years BP. We have normalized the AD/BC calibrated ages to years before AD 2005, when most of the 10Be samples were collected for this study. In Figure S2 we show probability distributions and statistics of these individual ages obtained from the three most widely recognized 14C dated soils. Calculated arithmetic means with 1σ uncertainty from these 14C ages are normalized to AD 2005 to allow direct comparison with the presented 10Be ages (table S4, Fig. 3).
4

Supporting Text I. Setting of the Southern Alps and their glaciers
Physiography The Southern Alps are an elongate mountain chain on the western side of the
South Island of New Zealand. This 500 km long and 60 km wide belt of mountains, with peaks typically exceeding 1800 m, is deeply dissected by formerly glaciated valleys. A well-defined drainage divide, universally known as the Main Divide, lies about 20 km east of the western margin of the mountain range (i.e. 40 km west of the eastern margin). Midway along the chain are the highest peaks of the Southern Alps, with many rising to more than 3000 m, including Mt. Cook (3764 m). Temperate glaciers are widespread on the highest parts of the range near the Main Divide. More than 3000 individual glaciers cover an area of 1158 km2 and volume of 53 km3 (S13). Locally, the ice fields coalesce to form valley glaciers that drain east or west off the range. Geology
The western margin of the Southern Alps is the Alpine Fault, the local boundary between the Australian and Pacific plates. Strike-slip displacement with a minor reverse component has been instrumental in formation of the Southern Alps. The bedrock of the Southern Alps is Mesozoic-age greywacke, but near and west of the Main Divide, this passes into increasingly metamorphosed schist. The combination of ongoing rapid uplift, high precipitation and rapid erosion has produced deep, high-sided valleys. Rockfall is the main source of sediment generation, and major earthquakes occur every 200 to 300 years on the Alpine Fault (e.g. (S11)). In this study area on the eastern side of the Main Divide near Mt Cook, the rock is greywacke, with subsidiary low-grade schist.
Climate
The Southern Alps forms a 500 km long barrier to the prevailing westerlies, in a temperate maritime montane climate. The mountain chain induces a strong orographic precipitation regime. Mean annual precipitation increases rapidly from 3000 mm along the narrow western coastal plains to a maximum of more than 10,000 mm on the western flank of the Southern Alps close to the Main Divide. Further eastward, there is an approximately exponential decline in precipitation to about 1,000 mm at the eastern margin of the Southern Alps (S14). New Zealand’s temperate climate reflects the interaction of sub-tropical and sub-polar air and water masses. Contemporary annual to multi-annual variability results from the El Nino-Southern Oscillation (ENSO). El Nino conditions bring a greater frequency of southwesterly winds, increased precipitation in the Southern Alps, and generally cooler air and sea surface temperatures (S15). Its contrasting condition (La Nina) brings more frequent northerly winds, warmer air and sea surface temperatures and less precipitation in the Southern Alps. An Interdecadal Pacific Oscillation (IPO) (S16) has recently been proposed as a lower-frequency pattern within ENSO (S17). Positive phases of the IPO comprise more frequent and more prolonged El Nino events, while negative IPO phases are characterized by a predominance of La Nina conditions (S15).
5

Glacier behavior Numerical modelling indicates that Southern Alps glaciers are primarily sensitive
to temperature change and less responsive to changes in precipitation (S18, 19). Historical and climatic data from the 20th century indicate some correlation between mass-balances of glaciers in the Southern Alps and ENSO patterns. In the late 1970s the IPO switched from a negative phase, which had persisted since the 1940s, to a positive phase which continues today. During the negative phase, substantial glacier retreat occurred throughout the Southern Alps. The present positive phase has been accompanied by substantial advance of the steep, fast-flowing, Franz Josef and Fox glaciers west of the Main Divide. To the east, except for glaciers whose equilibrium has been disrupted by the formation of terminal lakes into which the glaciers calve, the glaciers have generally ceased retreating and re-advance is evident in some places (S20).
II. Mueller, Hooker, and Tasman glaciers and their moraine records Setting
Mueller, Hooker and Tasman are large, valley glaciers draining the eastern slopes of the Main Divide (for details see table S1). All three glaciers receive intense precipitation in their upper reaches (largely as snow during all seasons except summer) but precipitation volumes decrease progressively eastward to around 4500 mm/yr at the glacier termini. The terminal moraines lie at relatively low altitudes (700 to 900 m). Contemporary snow cover is slight, with a 1 m snowfall being an exceptional event and melting within a few weeks. For most of the winter, the moraines are free of snow. The lowermost few kilometres of the glacier trunks have surface debris covers that, although extensive, are rarely more than 1 m thick (S21).
Historic behavior
Mt Cook glaciers began downwasting in the late 1800s, while elsewhere in New Zealand, a very slow retraction of glaciers began that was replaced by very rapid retreat commencing in the late 1930s (S22-S24). From the early 1980s, lakes began to develop at the termini of Mueller, Hooker and Tasman glaciers, and have progressively expanded up valley. The most responsive of New Zealand glaciers (Fox and Franz Josef) began to advance at that time, and remain in advanced positions today. Similarly, the retraction of glaciers east of the Main Divide has largely ceased over the last 10 years (S17) and some have begun to re-advance. In contrast, Swiss glaciers began to retreat rapidly about AD 1860 and, when they temporarily stabilized in the 1920s, had accomplished about half of their retreat to today’s positions. Further retreat, continuing today, was punctuated by a re-expansion in the 1970s and 1980s. Although the initiation of retraction in about AD 1860 appears to have been a globally-widespread phenomenon, the detail of glacier response in both regions has been attributed to regional climatic influences (S24, 25).
Holocene moraine records
The most comprehensive moraine sequence is preserved around the Mueller Glacier. The Hooker Glacier has a less well preserved suite of Late Holocene moraines. The Tasman is dominated by a loop of historic moraines (mid/late 19th to late 20th
6

century) with remnants of older Holocene moraines in a localized area near its right-lateral terminus (Fig. 1). Individual moraine ridges are typically at least 10 m high and have several hundred meters lateral continuity. The Mueller Glacier Holocene moraine record (Fig. 1) is divided into 8 distinct age groups, at least two of which comprise more than one successive moraine ridge, and thus are of ‘composite age’. Collectively, the Mueller moraine sequence reflects at least 10 distinct moraine-forming events. Fewer sets of ridges are preserved around the Hooker and Tasman glaciers (Fig. 1).
Published chronologies for the Holocene moraines of the Mt. Cook area rely to a considerable extent upon relative dating methods of surface geomorphologies, particularly lichenometry and weathering-rind dating (see review in (6)). Recently, Schmidt hammer techniques have been applied (17). The only direct numeric calibration of the relative dating methods applied to the morainal deposits near Mt Cook is radiocarbon dating (11); however it has not been possible to robustly compare the 14C data of subsurface deposits at Mt Cook to the characteristics of ground surface proxies such as lichen size or rock weathering rinds. It is not our intent in this paper to re-examine the published ages derived from relative dating methods. However, the 10Be ages presented here provide some direct numeric constraint that could be used elsewhere to re-evaluate and improve the local calibration of the relative dating methods.
Interpretation of moraine records
Our conceptual model is that lateral or terminal moraine ridges are constructed at times when a glacier is in, or close to, equilibrium with prevailing climate. The reaction of a glacier in equilibrium to a superimposed climate change is almost immediate. Surface sediments on a moraine ridge represent the culmination of construction of the ridge, and we assume that ridge construction ceased due to withdrawal of the glacier from that position. Thus, we regard the surface exposure age of a boulder on a moraine ridge as recording the onset of a glacier retreat. There are at least four potentially complicating ‘geologic’ factors:
• A boulder may have an inherited age, representing prior exposure to cosmic radiation, for example if it had been part of an exposed rock face, had been reworked from the surface of a previously formed moraine, or was transported on top of the glacier surface (boulder gives an age older than the time of its deposition on the moraine);
• Boulders on a single morphologic ridge may not necessarily be from a single depositional event; ice may have reoccupied a pre-existing moraine ridge, and deposited boulders without leaving distinctive morphologic indicators. Boulders on a moraine of composite age should show at least two age populations, if within the resolution of analytic uncertainties.
• A boulder may have been moved after retreat of the glacier, for instance due to melting of stagnant ice buried within the moraine (boulder gives an age younger than the time of its deposition on the moraine);
• A boulder may have been deposited after formation of the moraine, by non-glaciogenic processes such as rock-fall from nearby slopes.
Other surficial processes can produce exposure ages that are younger than the
boulder-deposition age, such as erosion, snow-cover, and post-depositional exhumation
7

of boulders. The exceptional consistency of ages obtained in this study, and presence of very few outlier ages provides confidence that such complications do not introduce discernable variation at this study site.
Therefore, apart from the possible small influence of pre-exposure (see below), we conclude that exposure ages of surface sediments on moraines represent the onset of glacier retreat in immediate response to a climate signal, i.e. we date ‘terminations’ of glacier advances.
In this study we assume that the Mueller, Hooker and Tasman glaciers have experienced similar and simultaneous responses to climate signals during the Holocene. Our justifications are that their catchments are side by side, have similar aspect and altitudes, and that the amounts and timing of their downwasting in response to the climate changes of the past century have been approximately the same.
Pre-exposure of rock surfaces
The precision of the reported ages allows for consideration of small effects of pre-exposure/inheritance. Supraglacial transport of boulders will undoubtedly result in cosmic radiation during their travel on the ice. Such boulders are likely to be reoriented continuously during transport, by processes such as ice surface deformation via pressure ridges, and dynamically-varying ice surface relief generated by differential ablation. Boulder reorientation reduces the likelihood of pre-exposure being concentrated on any particular part of a boulder surface, but also means that all parts of a supraglacial boulder are more likely to carry some degree of pre-exposure.
Prominent innermost moraines of the Mueller Glacier were assessed by previous workers as being of historic age (i.e. younger than approximately AD 1860, when the first European explorers described the area). There are differing interpretations of specific moraine ages (e.g. (S26) versus (S27)) due to equivocal evidence. Perhaps the clearest evidence comes from a photo looking across the Mueller Glacier terminus taken in AD 1895 by J. J. Kinsey, cited by (S27) and accessible online at National Library of New Zealand, reference number: PA1-q-137. Combining this photograph with a perspective from a similar location accessed in Google Earth, it appears unambigous that the innermost moraine dated in this study (samples Kiwi-942, -943, -944) was outboard of the glacier in AD 1895. The glacier did not re-advanced beyond this 1895 ice-front position subsequently (S28). Thus, from historical evidence, the age of this moraine, at the sample sites and relative to the sampling year AD 2005, is at least 110 years. The arithmetic mean age of samples Kiwi-942, -943, -944 is 160 ± 30 years. At face value, this implies a mean pre-exposure of no more than 80 years. A maximum estimate of pre-exposure of 97 years, based on this limited data set of three samples, comes from sample -943 whose older bound is 207 years.
For comparison, we derive an indicative estimate of transport time for rocks on the Mueller Glacier surface. There is no record of flow rate measurements on the Muller Glacier in the 19th century, when the glacier was in an advanced state, presumably at or close to equilibrium with climate. However, a mean cross-sectional flow rate of 30 m/yr was measured on Hooker Glacier in 1889 (S29). The Hooker and Mueller glaciers are of comparable length and topographic setting. We assume to a first approximation that the lower half (i.e. 6.85 km) of the 13.7 km long Mueller Glacier equates to its ablation zone. The reason for considering just the ablation zone is that a boulder falling within the
8

accumulation zone would be buried by snow and would become incorporated within the glacier ice. Adopting the flow rate of 30 m/yr for Mueller Glacier under equilibrium conditions, the transport time down the lower half of the glacier, for a rock sitting on the ice surface, would be 228 years. For any part of such a rock to gain the full 228 years of exposure to cosmic rays would require that it be transported without any rotation, and come to rest in the moraine with the same surface facing upward. Thus, we regard such a value as being a conservative upper limit of pre-exposure that is likely to have been gained by any supraglacial boulder during transport on the Mueller Glacier. In addition, any population of boulders in a terminal moraine is likely to include some which were transported largely or entirely englacially. Thus within a moraine boulder population, the inheritance age gained during transport on Mueller Glacier would lie between 0 and a conservative upper limit of 228 years. Hence, these estimates are broadly compatible with the estimates of pre-exposure of rocks on the historic moraines, as implied by the 10Be results (see above).
Summarizing these different considerations, we infer that for the Mueller moraines, the surface boulders would, on average, have less than 100 years worth of pre-exposure. Thus, the mean ages may overestimate the time since ice retreat from that moraine by not more than 100 years. We assume to a first approximation that such values are also applicable to the moraines of the Hooker Glacier and right-lateral moraines of the Tasman Glacier.
As a reality check, it is instructive to consider the c. 1,000 year old moraine, best preserved around Hooker Glacier, but with possible correlatives at Mueller and Tasman glaciers (Fig. S1(vii) – mean age 1,020 ± 70 years). There is a widely represented buried soil of about the same age (Fig. S2(iii) – mean age 1,000 ± 80 years). Conceptually, the model is that the advancing glaciers overrode and buried the soils, after which the glaciers constructed latero-terminal moraines. The surface boulders on the moraines represent the withdrawal of ice after construction of the moraines. Although not a necessary assumption given the error limits, if we were to assume that there is an average of 100 years pre-exposure in the boulder population, it would imply an age of 920 ± 70 years for ice withdrawal from the moraines. This would fit better with burial of the soils during the initial advance, prior to construction of the moraines. It would also provide a tighter match to a period of reduced summer temperatures indicated by tree ring records between about 1,000 and 900 years ago (21 – see Fig. 3).
Incompleteness of moraine records
Moraine sequences represent discontinuous records of glacier behavior. A moraine ridge formed at the culmination of a glacier advance may be overwhelmed and obliterated during subsequent, more extensive ice advance(s). Latero-terminal moraines are potentially vulnerable to erosion by meltwater streams or burial by aggrading sediment. These factors make it unlikely that any moraine sequence contains a complete record of glacier behavior. This is illustrated in this study, where the Tasman and Hooker glaciers have a less complete sequence of moraines than does the Mueller. In all cases, we regard the number of preserved moraine sets as representing a minimum estimate for Holocene glacier advances in the Mt Cook area.
9

III. Potential non climatic drivers of glacier events
Recent hypotheses propose large rock fall events onto glaciers as an important cause of glacier advance and subsequent moraine construction in New Zealand’s Southern Alps (e.g. (S21, S30)). Larsen et al. (S31) point to an apparent correlation between the timing of glacier advances and great earthquake events on the Alpine Fault, which independent evidence points to having occurred most recently at ~ AD 1717, AD 1620, AD 1425 and AD 1220 (S32). While rock fall is clearly an important source of sediment input to mountain glaciers, considerable reliance should be placed on the well-established empirical and observational connections between climate and glacier behavior. We assume that all of the moraines in this study represent glacier margin positions associated with climatic fluctuations. Our reasons for not favoring the hypothesis that rock falls are a primary cause of Holocene glacier fluctuations at Mt Cook, particularly in response to large earthquakes on the Alpine Fault, include:
• At least two sets of moraines are associated with glacier advances of the last ~200 years, and thus are younger than the most recent earthquake on the Alpine Fault.
• A very large rock avalanche (12 million cubic meters) onto the Tasman Glacier in 1991 has had no discernable effect on the behavior of the glacier (S21).
• There is no direct evidence that large earthquakes on the Alpine Fault have caused widespread rock falls throughout the catchments of the three glaciers included in this study.
• The historic observation that the Mueller, Hooker and Tasman glaciers have downwasted approximately simultaneously during the 20th century is difficult to reconcile with an earthquake-induced landslide driver.
10

Fig. S1. Probability distributions of 10Be boulder and moraine ages. Individual boulder ages (table S3) are shown by thin black curves within
2σ-uncertanties, the thick black line represents the probability distribution of the respective boulder age population from the moraine (normalized to 1). Arithmetic means of all distributions are indicated by the vertical blue line, 1σ range is given by grey, 2σ range given by red, and 3σ range given by green lines. The individual sample names of each distribution from young to old are listed in the header of each plot. We give different means within respective uncertainties. For the moraine ages we use the arithmetic mean within standard deviation (1σ) of all boulder ages from one moraine and include the production rate uncertainty given by (S8) of 5% (numbers underlined below). We also give the reduced χ2 statistic for each age population. This number indicates to what extent the measured scatter in the 10Be ages of boulders from one moraine can be explained by the analytical 1σ uncertanties. A reduced χ2 value below 2 is considered good, many published 10Be data sets show a reduced χ2 value around 10 or higher (S8).
(i) The 6,500 year moraine (n=6: Kiwi-610-2, -801B, -915, -609, -627, -626-2); Mueller and Tasman
glaciers
Statistics: Arithmetic mean/1 sigma uncertainty: 6,520 ± 160 yrs Including production rate uncertainty: 6,520 ± 360 yrs Weighted mean/weighted uncertainty: 6,540 ± 70 yrs Peak Age: 6,530 yrs Median/Interquartile Range: 6,530 ± 210 yrs Reduced χ2: 0.8
11

(ii) The 3,200 year moraine (n=4: Kiwi-902, -905, -938, -937); Mueller Glacier
note that, in agreement with the stratigraphy, the two younger samples -902 and -905 (~ 3100 years) are from the inner part of the moraine ridge, while -938 and -937 (~ 3300 yr) are from the outer part of the moraine ridge (Figs. 1 and 2). Statistics: Arithmetic mean/1 sigma uncertainty: 3,230 ± 150 yrs Including production rate uncertainty: 3,230 ± 220 yrs Weighted mean/weighted uncertainty: 3,210 ± 70 yrs Peak Age: 3,210 yrs Median/Interquartile Range: 3,250 ± 250 yrs Reduced χ2: 1.3
12

(iii) The 2,000 year moraine (n=2: Kiwi-955, -956); Mueller Glacier
note that one sample from the right later moraine, Kiwi-X66, yielded a consistent age of 2,100 ± 100 years (see Fig. 2).. Statistics: Arithmetic mean/1 sigma uncertainty: 2,000 ± 110 yrs Including production rate uncertainty: 2,000 ± 150 yrs Weighted mean/weighted uncertainty: 2,000 ± 60 yrs Peak Age: 1,990 yrs Median/Interquartile Range: 2,000 ± 150 yrs Reduced χ2: 1.5
13

(iv) The 1,800 year moraines (n=7: Kiwi-X70, -X74, -X73, -X79, -957, -926, -X71); Mueller Glacier
Statistics: Arithmetic mean/1 sigma uncertainty: 1,840 ± 90 yrs Including production rate uncertainty: 1,840 ± 130 yrs Weighted mean/weighted uncertainty: 1,820 ± 20 yrs Peak Age: 1,800 yrs Median/Interquartile Range: 1,820 ± 130 yrs Reduced χ2: 2.6 Note that these samples come from at least two distinct moraine ridges within the outermost left lateral Mueller moraine sequence (Fig. 1), but their ages are statistically indistinguishable.
14

(v) The 1,650 year moraine (Kiwi-628, -971, -700_1 & -700_3 (weighted mean of 700_1 and 700_3)); Tasman Glacier
Statistics: Arithmetic mean/1 sigma uncertainty: 1,650 ± 70 yrs Including production rate uncertainty: 1,650 ± 110 yrs Weighted mean/weighted uncertainty: 1,680 ± 30 yrs Peak Age: 1,620 yrs Median/Interquartile Range: 1,620 ± 100 yrs Reduced χ2: 2.0
15

(vi) The 1,400 year moraine (n=6: Kiwi-X51, -967, -968, -X49, -X52, -X53); Hooker Glacier
Statistics: Arithmetic mean/1 sigma uncertainty: 1,370 ± 170 yrs Including production rate uncertainty: 1,370 ± 180 yrs Weighted mean/weighted uncertainty: 1,310 ± 20 yrs Peak Age: 1,430 yrs Median/Interquartile Range: 1,420 ± 200 yrs Reduced χ2: 24 Statistics (based on 5 samples; Kiwi-X51, outlier defined at 1σ level, excluded): Arithmetic mean/1 sigma uncertainty: 1,430 ± 100 yrs Including production rate uncertainty: 1,430 ± 120 yrs Weighted mean/weighted uncertainty: 1,440 ± 20 yrs Peak Age: 1,430 yrs Median/Interquartile Range: 1,430 ± 110 yrs Reduced χ2: 2.4
16

(vii) The 1,000 year moraine (n=5: Kiwi -X76, -X54, -969, -X77, -932-1); Hooker Glacier
Statistics: Arithmetic mean/1 sigma uncertainty: 1,020 ± 50 yrs Including production rate uncertainty: 1,020 ± 70 yrs Weighted mean/weighted uncertainty: 1,000 ± 20 yrs Peak Age: 990 yrs Median/Interquartile Range: 1,000 ± 80 yrs Reduced χ2: 1.4 Tasman Glacier A single sample from a Tasman Glacier moraine ridge, Kiwi-972, yielded an arithmetic mean/2 σ uncertainty of 970 ± 100 years (2 σ uncertainty is given because it is a single sample). Hooker Glacier inner moraine ridge A single sample from a small ridge just inside the 1000 yr moraine on the Hooker right lateral (Kiwi-927), yielded an age or 810 ± 70 years. It might date a remnant of moraine from a readvance of the glacier about 800 years ago. Soil evidence from Tasman Glacier left lateral moraines (Table S4) indicates that the Tasman Glacier readvanced after about 850 yr. It is possible that the moraine ridge sampled by Kiwi-927 formed during a coeval advance of Hooker Glacier, with this ridge providing the only morphologic remnant of this event so far found preserved.
17

(viii) The 570 year moraine (n=12: Kiwi-940, -912, -901, -911, -936, -909, -903, -941, -939, -X65, -900, [-904] ); Mueller Glacier
Statistics: Arithmetic mean/1 sigma uncertainty: 590 ± 90 yrs Including production rate uncertainty: 590 ± 100 yrs Weighted mean/weighted uncertainty: 600 ± 10 yrs Peak Age: 600 yrs Median/Interquartile Range: 600 ± 70 yrs Reduced χ2: 8.0 Statistics (based on 11 samples; Kiwi-904, outlier defined at 2σ level, excluded): Arithmetic mean/1 sigma uncertainty: 570 ± 60 yrs Including production rate uncertainty: 570 ± 70 yrs Weighted mean/weighted uncertainty: 580 ± 10 yrs Peak Age: 600 yrs Median/Interquartile Range: 590 ± 80 yrs Reduced χ2: 3.4
18

(ix) The 400 year moraine (n=9: Kiwi-X44, -X42, -X43, -X45, -X63, -X36, -X62, -X46, -X38); Mueller Glacier
Statistics: Arithmetic mean/1 sigma uncertainty: 400 ± 70 yrs Including production rate uncertainty: 400 ± 70 yrs Weighted mean/weighted uncertainty: 390 ± 10 yrs Peak Age: 410 yrs Median/Interquartile Range: 410 ± 80 yrs Reduced χ2: 11 Note
These samples were collected from a moraine complex of composite morphology and age. The mean age is an average age that encompasses at least two separate glacier retreat events. This is reflected in the large reduced χ2 value.
19

(x) The 270 year moraine (n=10: Kiwi-X57, -908, -913, -X61, -914, -X58, -X59, -907, -906, [-X60]); Mueller Glacier
Statistics (based on all 10 samples): Arithmetic mean/1 sigma uncertainty: 300 ± 100 yrs Including production rate uncertainty: 300 ± 100 yrs Weighted mean/weighted uncertainty: 270 ± 10 yrs Peak Age: 280 yrs Median/Interquartile Range: 280 ± 70 yrs Reduced χ2: 28 Statistics (based on 9 samples; Kiwi-X60, outlier defined at 2σ level, excluded): Arithmetic mean/1 sigma uncertainty: 270 ± 50 yrs Including production rate uncertainty: 270 ± 50 yrs Weighted mean/weighted uncertainty: 260 ± 10 yrs Peak Age: 280 yrs Median/Interquartile Range: 270 ± 70 yrs Reduced χ2: 12 Note
These samples were collected from a moraine complex of composite morphology and age. The mean age is an average age that encompasses at least two separate glacier retreat events. This is reflected in the large reduced χ2: value.
20

(xi) The 220 year moraine (n=2: Kiwi-958, -959); Mueller Glacier
Statistics (n=2): We give the details below although statistics based on n=2 is questionable; to stress the difference in reliability, we plot the number in italic; Arithmetic mean/1 sigma uncertainty: 220 ± 10 yrs Including production rate uncertainty: 220 ± 10 yrs Weighted mean/weighted uncertainty: 220 ± 10 yrs Peak Age: 220 yrs Median/Interquartile Range: 220 ± 10 yrs Reduced χ2: 0.7
21

(xii) Mid/late 19th century moraine (n=3: Kiwi-942, -944, -943); Mueller Glacier
Statistics: Arithmetic mean/1 sigma uncertainty: 160 ± 30 yrs Including production rate uncertainty: 160 ± 30 yrs Weighted mean/weighted uncertainty: 160 ± 10 yrs Peak Age: 180 yrs Median/Interquartile Range: 160 ± 40 yrs Reduced χ2: 7.5
22

Fig. S2. Probability distributions of the 14C ages of the three best dated soils at Tasman Glacier from(S12); see also table S4. Consistent to Fig. S1, individual 14C ages are given within 2σ analytical uncertainties, the arithmetic mean within standard deviation is used for the ‘soil age’ and plotted in Fig. 3. (i) The 1,000 year soil (n=8: NZ- 4509, -4507, -5505, -4405, -4404, -4403, -5329, -5507); Tasman and Mueller glaciers
Statistics: Arithmetic mean/1 sigma uncertainty: 1,000 ± 80 yrs Weighted mean/weighted uncertainty: 990 ± 20 yrs Peak Age: 960 yrs Median/Interquartile Range: 990 ± 80 yrs Reduced χ2: 1.7
23

(ii) The 1,650 year soil (n=3: NZ- 5500, -5332, -4406); Tasman Glacier
Statistics: Arithmetic mean/1 sigma uncertainty: 1,650 ± 80 yrs Weighted mean/weighted uncertainty: 1,650 ± 40 yrs Peak Age: 1,620 yrs Median/Interquartile Range: 1,610 ± 100 yrs Reduced χ2: 1.1
24

(iii) The 3,400 year soil (n=4: NZ- 5508, -5503, -5502, -5501); Tasman Glacier
Statistics: Arithmetic mean/1 sigma uncertainty: 3,400 ± 150 yrs Weighted mean/weighted uncertainty: 3,450 ± 40 yrs Peak Age: 3,500 yrs Median/Interquartile Range: 3,440 ± 230 yrs Reduced χ2: 3.3
25

Fig. S3. Example of a boulder on a Holocene moraine: Kiwi-907, embedded in the right lateral section of the ‘270 year moraine’ of Mueller Glacier (see also Fig. 1).
26

Fig. S4. Detector spectrum of the CAMS facility showing the good separation of 10Be (yellow dots) from 10B (white dots) during a low level 10Be measurement (10Be/9Be ≈ 4 x 10-16)
27
28
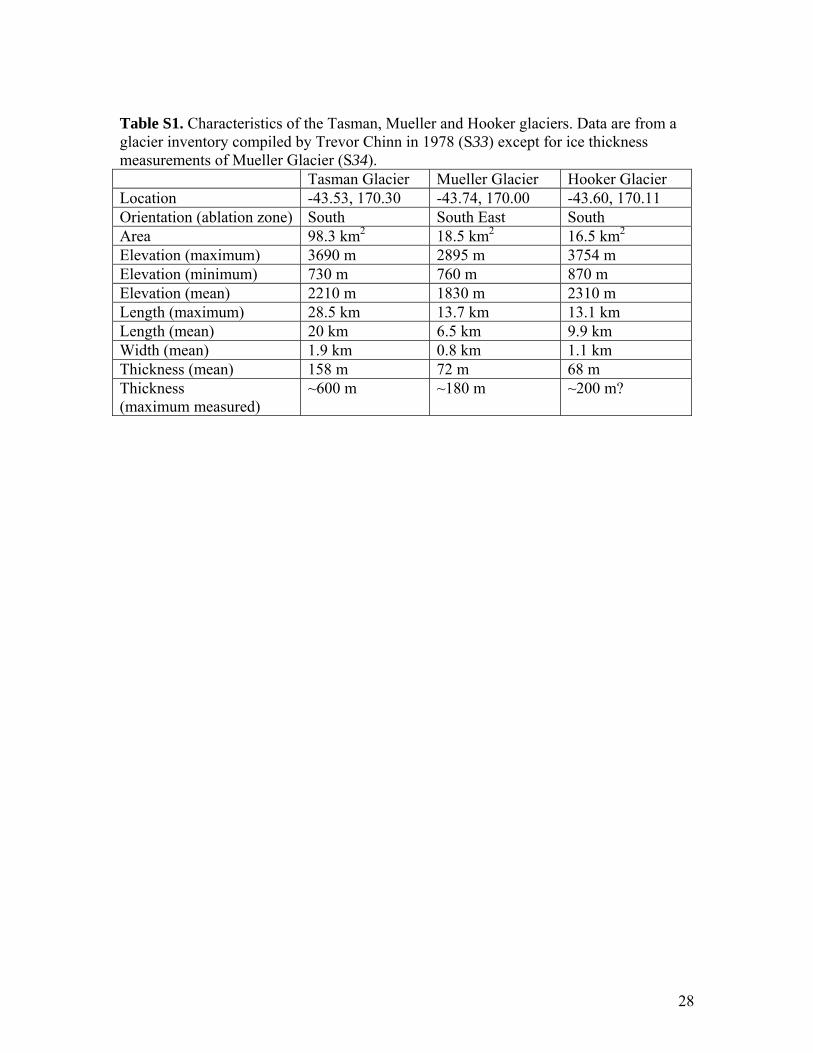
Table S1. Characteristics of the Tasman, Mueller and Hooker glaciers. Data are from a glacier inventory compiled by Trevor Chinn in 1978 (S33) except for ice thickness measurements of Mueller Glacier (S34). Tasman Glacier Mueller Glacier Hooker Glacier Location -43.53, 170.30 -43.74, 170.00 -43.60, 170.11 Orientation (ablation zone) South South East South Area 98.3 km2 18.5 km2 16.5 km2 Elevation (maximum) 3690 m 2895 m 3754 m Elevation (minimum) 730 m 760 m 870 m Elevation (mean) 2210 m 1830 m 2310 m Length (maximum) 28.5 km 13.7 km 13.1 km Length (mean) 20 km 6.5 km 9.9 km Width (mean) 1.9 km 0.8 km 1.1 km Thickness (mean) 158 m 72 m 68 m Thickness (maximum measured)
~600 m ~180 m ~200 m?

Table S2. Geographical and analytical data for the 75 samples. 20 procedural blanks, consisting of 0.18-0.20 ml 9Be carrier, were processed as samples with each batch yielding ratios of 10Be/9Be = (5 – 20) x 10-16, corresponding to blank levels of about 6,000 to 26,000 atoms 10Be compared to typical levels of 70,000 to 1,000,000 atoms 10Be in our samples (background correction is given for each sample). We also measured an unprocessed 9Be carrier with each sample batch yielding ratios of about 5 x 10-16. All 10Be/9Be values and 10Be concentrations are normalized to the KNSTD3310 standard.
29

Table S2 continued
30

Table S3. 10Be ages in years of all 75 samples based on six different scaling protocols documented in(S7): ‘St/Lal ntd’ based on (S35), giving an update to (S6), scaling parameters assumed constant with time; ‘St/Lal td’ being the time dependent version of ‘St/Lal ntd’; ‘Du’: scaling according to (S36); ‘Li’: scaling according to (S37); ‘De’: scaling given by (S38); and ‘De updated PR: scaling according to (S38), updated by a new production rate calibration experiment relevant for latitudes higher 40º and altitudes below 1000m, yielding about 7-10% lower production rate values in this case (S8).
31

Table S3 continued
32

33
Table S4. Radiocarbon data of wood buried in soil, covered by till ((S12)and references therein). To be able to directly compare given 14C and 10Be ages, we have nomalized the AD/BC calibrated 14C ages to years before AD 2005, when most of the 10Be samples were collected for this study.

Supplementary References S1. P. W. Birkeland, Geological Society of America Bulletin 93, 433 (1982). S2. J. M. Licciardi, PhD, Oregon State University (2000). S3. T. E. Cerling, H. Craig, Annual Reviews of Earth and Planetary Sciences 22, 273
(1994). S4. J. C. Gosse, F. M. Phillips, Quaternary Science Reviews 20, 1475 (2001). S5. M. D. Kurz, E. J. Brook, in Dating in exposed and surface contexts C. Beck, Ed.
(University of New Mexico Press, 1994) pp. 139-159. S6. D. Lal, Earth and Planetary Science Letters 104, 424 (1991). S7. G. Balco, J. O. Stone, N. A. Lifton, T. J. Dunai, Quaternary Geochronology 3,
174 (2008). S8. G. Balco, J. P. Briner, J. Rayburn, J. C. Ridge, J. M. Schaefer, Quaternary
Geochronology 4, 93 (2009). S9. R. J. Norris, A. F. Cooper, Eds., A continental plate boundary: tectonics at South
Island, New Zealand (AGU Geophysical Monograph 175, 2007), pp. 159-178. S10. I. E. Whitehouse, New Zealand Journal of Geology and Geophysics 26, 271
(1983). S11. S. C. Cox, D. J. A. Barrell, GNS Science, New Zealand (2007). S12. C. J. Burrows, New Zealand Journal of Geology and Geophysics 39, 205 (1989). S13. T. J. Chinn, Institute of Geological and Nuclear Sciences (1991). S14. R. D. Henderson, S. M. Thompson, Journal of Hydrology (New Zealand) 38, 309
(1999). S15. B. B. Fitzharris, G. R. Clare, J. Renwick, Global and Planetary Change 59, 159
(2007). S16. M. Salinger, J. Renwick, A. B. Mullan, International Journal of Climatology 21,
1705 (2001). S17. A. Lorrey, A. M. Fowler, J. Salinger, Palaeogeography, Palaeoclimatology,
Palaeoecology 253, 407 (2007). S18. B. Anderson, A. Mackintosh, Geology 34, 121 (2006). S19. J. Oerlemans, Science 264, 243 (1994). S20. T. Chinn, J. Salinger, B. B. Fitzharris, A. Willsman, Bulletin of the Federated
Mountain Clubs of New Zealand 171, 1 (2008). S21. M. P. Kirkbride, C. R. Warren, Global and Planetary Change 22, 11 (1999). S22. C. J. Burrows, Julius Haast in the Southern Alps (Canterbury University Press,
Christchurch, New Zealand, 2005), pp. 215. S23. A. F. Gellatly, T. J. H. Chinn, F. Roethlisberger, Quaternary Science Reviews 7,
227 (1988). S24. M. Kirkbride, Geografiska Annaler Series A-Physical Geography 77A, 147
(1995). S25. G. H. Denton, W. S. Broecker, Quaternary Science Reviews 27, 1939 (2008). S26. C. J. Burrows, New Zealand Journal of Geology and Geophysics 16, 831 (1973). S27. A. F. Gellatly, The Geographical Journal 151, 86 (1985). S28. A. F. Gellatly, New Zealand Journal of Geology and Geophysics 26, 311 (1983). S29. M. P. Hochstein, I. M. Watson, B. Malengrau, D. C. Nobes, I. Owens, New
Zealand Journal of Geology and Geophysics 41, 203 (1998).
34

35
S30. D. Santamaria Tovar, J. Shulmeister, T. R. Davies, Nature Geoscience 1, 520 (2008).
S31. S. H. Larsen, T. R. Davies, M. J. McSaveney, New Zealand Journal of Geology and Geophysics 48, 311 (2005).
S32. A. Wells, M. D. Yetton, R. P. Duncan, G. H. Stewart, Geology 27, 995 (1999). S33. T. J. Chinn, New Zealand Journal of Geology and Geophysics 39, 415 (1996). S34. K. Röhl, University of Otago, PhD (2006). S35. J. Stone, Journal of Geophysical Research 105, 23753 (2000). S36. J. T. Dunai, Earth and Planetary Science Letters 176, 157 (2000). S37. N. A. Lifton et al., Earth and Planetary Science Letters 239, 140 (2005). S38. D. Desilets, M. Zreda, Earth and Planetary Science Letters 206, 21 (2003).