Supporting Online Material for - Home | Math
29
www.sciencemag.org/cgi/content/full/science.1194140/DC1 Supporting Online Material for How Learning to Read Changes the Cortical Networks for Vision and Language Stanislas Dehaene,* Felipe Pegado, Lucia W. Braga, Paulo Ventura, Gilberto Nunes Filho, Antoinette Jobert, Ghislaine Dehaene-Lambertz, Régine Kolinsky, José Morais, Laurent Cohen *To whom correspondence should be addressed. E-mail: [email protected] Published 11 November 2010 on Science Express DOI: 10.1126/science.1194140 This PDF file includes Materials and Methods SOM Text Figs. S1 to S8 Tables S1 to S3 References
Transcript of Supporting Online Material for - Home | Math

www.sciencemag.org/cgi/content/full/science.1194140/DC1
Supporting Online Material for
How Learning to Read Changes the Cortical Networks for Vision and Language
Stanislas Dehaene,* Felipe Pegado, Lucia W. Braga, Paulo Ventura, Gilberto Nunes Filho, Antoinette Jobert, Ghislaine Dehaene-Lambertz, Régine Kolinsky, José Morais,
Laurent Cohen
*To whom correspondence should be addressed. E-mail: [email protected]
Published 11 November 2010 on Science Express DOI: 10.1126/science.1194140
This PDF file includes
Materials and Methods SOM Text Figs. S1 to S8 Tables S1 to S3 References
1
Supplementary materials to
“How learning to read changes the cortical networks for vision and language”
Contents:
I. Materials and methods .............................................................................................................. 2 1) Terminology ...................................................................................................................... 2 2) Definition of groups and participant selection................................................................... 2 3) Behavioural tests ................................................................................................................ 4 4) Behavioural profiles of the participants ............................................................................. 5 5) fMRI data acquisition ........................................................................................................ 6 6) fMRI analyses .................................................................................................................... 9
II. Supplementary results ......................................................................................................... 13
1) Behavioral results during fMRI ....................................................................................... 13 2) fMRI Activation specific to ex-illiterates ........................................................................ 14 3) Regions of interest surrounding individual peaks of responsivity to faces and houses ... 14 4) fMRI effects of lexicality during the lexical decision task .............................................. 15
III. Supplementary Figures ........................................................................................................ 16
1) Figure S1. Reading scores in the six groups of participants. ........................................... 16 2) Figure S2. Examples of stimuli used in the localizer run (translated into English) ........ 17 3) Figure S3. Examples of stimuli used in the visual runs ................................................... 17 4) Figure S4. Brain-imaging evidence of participants’ compliance, comprehension , and literacy. ....................................................................................................................................... 18 5) Figure S5. Activation specific to ex-illiterates during sentence reading. ........................ 19 6) Figure S6. Analyses of cortical competition induced by literacy at and around the individual peak responses to faces and houses. ......................................................................... 20 7) Figure S7. Plots of fMRI responses at a-priori peaks within left-hemispheric perisylvian language areas. ........................................................................................................................... 21 8) Figure S8. Comparison of activations to written and spoken sentences. ......................... 22
IV. Supplementary tables .......................................................................................................... 23
1) Table S1. Schooling and behavioral profiles of the six groups of participants ............... 23 2) Table S2. Additional tests performed on peaks identified by the main SPM analysis .... 24
V. References for supplementary materials ............................................................................. 28

2
I. Materials and methods
1) Terminology
Throughout this study, the term literacy refers specifically to the acquired capacity to read and write. The term schooling refers to the broader experience acquired by attending school during childhood, which includes abilities such as literacy, numeracy, mathematics, social skills, executive control, etc. The factors of schooling and literacy are thus nested inside each other, but can be partially uncorrelated because literacy can also be acquired later in life, during adulthood, and therefore without early schooling. We refer to this experience as late literacy, and to those who achieved it as ex-illiterates. An important question for the present research is whether late literacy can fully mimic the effects of early schooling, or whether early schooling has a unique impact on some brain systems.
It is important to recognize that literacy is neither a one-dimensional, nor an all-or-none variable, as learning to read can have dissociated and graded effects on different tasks such as letter knowledge, rapid naming, phonemic awareness, etc (S1). Here, as a first approximation, we summarize the inter-individual variations in speed and ease of reading by a single measure of reading performance, defined as the number of words and pseudowords that could be read accurately per minute (see figure S1).
2) Definition of groups and participant selection
Our aim was to assemble, both in Brazil and in Portugal, three groups of participants: literates, ex-illiterates, and illiterates. Ex-illiterate and illiterate subjects were defined as adults who had received no schooling during childhood, or extremely little. Among this population, ex-illiterates were defined as those who had received a sufficient amount of adult education and informal training to be able to read at least a few simple words, while illiterates were those who were still unable to read even simple words (but could identify some letters). Finally, literate subjects, who had received a normal education to literacy at an early age and were all normal readers, were matched to these groups in age and sex.
All our subjects were fully functional in their daily lives, socially integrated and in good health at the time of the tests. All anatomical MRIs were analyzed by an experienced clinical radiologist in order to rule out brain anomalies. One subject (from the Portugal literate group) presented MRI images compatible with Budd-Chiari syndrome, absolutely asymptomatic.
Portuguese subjects were mostly recruited in Portugal, pre-tested behaviorally at the Faculty of Psychology of the University of Lisbon, and flown to the NeuroSpin Center (Saclay, France) for neuroimaging. For simplicity, seven literate Portuguese subjects were also recruited in the greater Paris area through announcements on the radio and on internet sites dedicated to the Portuguese community. The Portuguese ex-illiterates were recruited through Portuguese governmental agencies. Brazilian illiterate and ex-illiterate subjects were recruited in the greater Brasilia area, either through community searches or through adult literacy courses. They were pre-tested at local community schools or at home and underwent neuroimaging scans at the Brasilia unit of the SARAH Network of Neurorehabilitation Hospitals. The literate Brazilian subjects constituted 2 groups: one recruited from the illiterate community (family or neighbors), matched to some extent on socio-economic and cultural characteristics; and another, consisting of college-graduate professionals from the SARAH Network.
Efforts were made to standardize data collection in Portugal, France and Brazil, using the same subject instructions, assessment criteria, fMRI and ERP equipment, MR sequences, and analysis scripts.

3
Participants tested in France received 80 Euros for their participation, and those flying from Portugal were housed for 3 nights and invited to a one-day tourist visit of Paris. Since Brazilian legislation does not permit remunerating participants of scientific studies, allowing only for reimbursement of related expenses, volunteers tested in Brasília were given food items equivalent to one day’s work. All participants were motivated by the study itself and will be shown the results of the research when it is published.
A total of sixty-three subjects (41 from Brazil and 22 from Portugal and France) participated in the study. Six groups were formed according to the participant’s literacy status and place of origin (Brazil or Portugal). Table S1 lists their characteristics. All subjects were right-handed (Edinburgh inventory), had normal or corrected-to-normal visual acuity (Snellen or Jagger chart), normal audition, and reported no neurological diseases. All participants gave their written informed consent (the consent form was read aloud and explained to illiterates). Clinical examination ensured that all subjects did not have any counter-indication to MRI scanning. Illiterates. The illiterate participants (n=10) were from rural areas (5 subjects) or urban centers in the Brasilia vicinity. Participants were illiterates for social reasons, with no history of special difficulty other than lack of access to schools. The families of all these participants were originally from rural areas, and their parents had been illiterate rural workers. The average age of the illiterates was 53.3. Between 44 and 48 years ago, according to estimates in Brazilian records, the rate of illiteracy was 39.6% of the total population and was particularly prevalent in rural areas. There were almost no accessible schools in these communities, nor public transportation to bring children from these removed regions to areas with schools. As a result, most of the participants in our illiterates group did not attend school at all as children, and only two attended it very inconsistently, starting at 10 years of age (either once a week, or only 2 months a year for a number of years). One was able to identify 15 letters and the other, 16, but they were unable to read words or pseudowords. A few illiterates later reported attending adult alphabetization classes but only for a few months and with insufficient focus to impact on literacy (e.g. the maximum reported was 3.5 years of very inconsistently attended evening classes, but this person still could not read a single word or pseudoword). Four women were housewives, the others were all employed as rural workers, housemaid, street vendor, public servant, or construction worker.
In spite of our efforts, we did not manage to form a group of Portuguese adult illiterates of comparable size. In both Portugal and Brazil, many adults now receive some reading education once they are identified as illiterate by associations or social services. Furthermore, Portuguese participants had to engage in a long series of questionnaires and behavioral tests, pass several behavioral and medical criteria for fMRI (e.g. absence of ferrous metals in the body), and finally accept a three-day trip and a day of examination with unfamiliar fMRI and ERP techniques. These constraints exceedingly reduced the number of Portuguese illiterate subjects willing to participate. Ex-illiterates. The Brazilian ex-illiterates (n=10) had backgrounds similar to those of the illiterates (illiterate parents from rural areas), but now lived in suburban settings in greater Brasilia. Like the illiterates, their early education was quite poor: eight had not attended school during childhood, and two attended it for 1 and 3 years, respectively. All had attended adult courses, and their total education was quite variable, ranging from 0.5 to 7 years. However, even those who reported a total education of less than 2 years (6 participants) reached the criterion for reading ability, suggesting they had found enough stimulation for learning to read outside of official courses. Three were housewives, four were construction workers while the others worked as electrician, taxi driver or dressmaker. In Portugal, among the unschooled subjects, we could only recruit ex-illiterate participants (n=11). Only one of them attended school in childhood, and in this case only during the first half of the school year. They all attended alphabetization classes for adults (from 1 to 5 years, mean 2.4) for a longer period than Brazilian ex-illiterates did (from 0.8 to 4 years, mean 1.4).

4
However, compared to these, they displayed lower and more variable reading skills as described below. Five were janitors or maids, two were unemployed, one was retired, the others worked as taxi driver, mason or receptionist. Literates. The Brazilian literates (n=21) were separated into two groups: the LB1 group (n=10) comprised only college graduates (16 years or more of formal education), with a medium to high socio-economic status, while the LB2 group (n=11) comprised participants from the same social community as the illiterate group, but with 2 to 7 years of early education. Thus, while the LB1 group included two systems analysts, two psychologists, two nurses, one physician, one architect, one teacher, and one translator, the LB2 group included three construction workers, two maids, one housewife, one rural worker, one watchman, one yardman, one dressmaker, and one unemployed person. The literate Portuguese group (LP, n=11) comprised a mixture of participants from various SES groups: four of them had limited education (5 years of both early and total education) and came from the same social background as the Portuguese ex-illiterates; two had, respectively, 9 and 10 years of both early and total educational, and the remaining five had college-level education and upper background. Group matching and potential confounding variables. When testing participants with distinct, often life-long histories of education, it is difficult to ensure that other social or environmental variables are perfectly matched. However, note that all of the Brazilian participants in the illiterate (ILB), ex-illiterate (EXB) and low-SES literate groups (LB2) belonged to the same social communities and occupational classification (natural resources, construction and maintenance), with an average minimum monthly salary of US$292 or EU$230. Thus, restricted comparisons involving these groups are tightly controlled. We cannot fully exclude that literacy led to changes in exposure to faces or houses (e.g. in magazines). However, all of the subjects in the 4 Brazilian groups, including the illiterates, had TVs at home. Watching TV is a common habit of all households in Brazil, irrespective of socio-economic status. Furthermore, previous studies have demonstrated that illiterates typically have normal scores in basic-level object naming and do not differ from ex-illiterates in a variety of psychophysical tests. On a part-verification task, as long as enantiomorphy (left-right discrimination) is avoided, there is a large effect of schooling but no effect of literacy (S2, S3). Similarly, in the domain of cognitive styles, the Frame-Line Test revealed a large effect of culture (Thaïland vs Portugal) and schooling in the Western world, but not of literacy (S4). As regards general cognitive abilities, the mini-mental state examination (MMSE), once discarding the two items that examine reading and writing abilities, typically reveals no difference between illiterates and ex-illiterates, but only between illiterates and schooled literates (S3).
3) Behavioural tests
Prior to imaging, all participants underwent a battery of simple neuropsychological tests, in order to verify their reading skills (see table S1). In the letter identification task, the participants were asked to name the 23 printed letters of the Latin alphabet commonly used in the Portuguese language. The word reading task comprised 36 words (12 simple, 12 complex and 12 irregular) to be read aloud. For pseudoword reading, 8 simple and 8 complex pseudowords were created by changing the first phoneme of real words (e.g. "tavalo" instead of "cavalo", which means 'horse' in Portuguese). The sentence reading task was a validated Portuguese version of the "Lobrot" test (S5), which comprises 36 sentences that must be completed by one word, chosen among 5 options, in 5 min or less. In reading fluency tasks, the participants were given one minute to read, as fast as possible, a list of printed words or, separately, of pseudowords. The lexical decision task consisted
5
of an audio presentation of pseudowords and real words (recorded in separate Portuguese and Brazilian versions), and the participants were asked to press one button for real words and another one for pseudowords (again created by changing the first phoneme of the corresponding real word). Prior to this task, we conducted an elementary button press test to ensure that all participants were able to correctly press the right and left buttons; this was particularly important with the illiterates and ex-illiterates, who were not very familiar with this testing situation. Finally, we also included a picture naming task with simple line drawings to be named, which all participants completed accurately.
4) Behavioural profiles of the participants Figure S1 shows a boxplot of five distinct behavioral measures of reading performance for the six groups of participants, demonstrating graphically that (1) all but the illiterate subjects could decipher words and pseudowords, albeit with great variability in the two ex-illiterate groups, (2) reading speed systematically differentiated the six groups according to a fixed order. Table S1 reports the behavioral profile of the six groups (mean, SD, range of performance in each task). The following results are noteworthy: Illiterates. Most of the subjects in the illiterate group had difficulties recognizing even single letters, and none could read simple words or pseudowords. Ex-illiterates. Ex-illiterates identified virtually all single letters, and many were very good at reading simple words. Performance deteriorated, however, when they were asked to read words with complex graphemes, irregular words, or pseudowords. Reading speed was also quite slow for ex-illiterates, as evidenced by the pseudoword and word reading fluency tasks. In a sentence-level reading test (Lobrot), this group was also clearly worse than literates. Furthermore, as a group, ex-illiterates were characterized by a great degree of inter-individual variability, with some participants reading quite accurately, albeit always slowly, while others struggled with even elementary-level reading. Unexpectedly, ex-illiterates from Brazil had better reading performances compared to ex-illiterates from Portugal: for example, the mean number of words read in one minute was about 30 and 15, respectively. In this test, there was no overlap in the distribution of the Brazilian ex-illiterates and the Brazilian literate LB1 group (all the subjects of this group read more than 100 words), but some Brazilian ex-illiterates read more words than the worst LB2 participant. Among the Portuguese, all ex-illiterates read fewer words in a minute than the worst literate participant. Literates. As expected, reading performance was good in most literate participants, and excellent in some. Nevertheless, the three groups differed. In the Portuguese literate group (LP), the mean number of words read in a minute was 95, better than the Brazilian LB2 group mean (69) but poorer than the LB1’s (128). More than half (7) of the Portuguese literate participants had worst scores than the worst LB1 participant, and some (4) LB2 participants scored below the level of the worst LP subject. It may seem surprising that the literate subjects made occasional errors in letter naming, but the test consisted of lower case Arial letters, whose streamlined geometrical shape occasionally induced confusions (mostly consisting in naming the lower-case letter l (l) as “i”, which can barely be considered erroneous). There was only a very slight age difference between groups (F(5,57) = 2.57, p = 0.04). However, there was no age difference between the LB2 and illiterate groups (p= 0.46) or between the EXB and illiterate groups (p=0.33), which provided a suitable direct comparison between these SES matched groups.

6
5) fMRI data acquisition
We used identical 3-Tesla whole body system (Siemens Trio, Germany) in both testing sites. Identical sequences were used for fMRI: gradient-echo planar imaging sequence sensitive to brain oxygen-level dependent (BOLD) contrast (40 contiguous axial slices, 3 mm thickness; TR=2400 ms; Flip angle = 81º, TE = 30 ms, in-plane resolution = 3 x 3 mm, matrix = 64 x 64). The number of repetitions varied with each experiment and appears below. Two dummy scans were automatically added at the beginning of each run and discarded from data analysis.
At both testing sites, auditory stimuli were presented via high-fidelity stereo headphones (MR Confon). At Neurospin (France), visual stimuli were projected onto a translucid screen, 640 pixels wide (VGA mode), subtending 42.5 cm width and viewed through a mirror from a distance of 125 cm, for an overall angular size of 19.3 degrees. At the SARAH hospital (Brasilia), an MR compatible LCD screen (12 x 17 cm) was used to present visual stimuli. The image on the screen was seen after reflecting on two mirrors, with a global visual angle of 17.3 degrees. Participants were trained on all tasks inside a mock scanner before starting real data acquisition. A post-acquisition debriefing served to ensure that the subject correctly understood and performed the tasks. Localizer scan The localizer, originally designed by Philippe Pinel, has been described in detail elsewhere (S6-8), and was translated to both European and Brazilian Portuguese. Briefly, this short fMRI scan was primarily designed to isolate, in a reliable and individual manner, the brain correlates of early vision, left- and right-hand motor commands, sentence reading, speech listening and mental calculation. Ten different types of stimuli were presented in random order, at a rhythm of approximately one every 4.8 s (see figure S2 for examples). Twenty flashing checkerboard sectors were displayed to identify retinotopic areas. They comprised 10 horizontal and 10 vertical angular sectors of ±25 degrees on each side of the vertical or horizontal meridian, and extended up to an excentricity of ±10.9 degrees on each side of fixation, reversing contrast every 200 ms. Twenty rest periods (black screen) served as null events for better hemodynamic deconvolution. The rest of the stimuli comprised 20 short meaningful sentences (e.g. “One can easily find a taxi in Paris”), 20 verbal commands to click the right or the left button, and twenty simple one-digit subtraction problems (a task selected to ensure a strong activation of the various components of the number processing system, see ref. (S9)). In each of these categories, 10 stimuli were presented auditorily, as spoken sentences (1.2-1.7 s long), while 10 were presented visually through rapid serial visual presentation (four successive screens of 1-3 words and 250 ms duration, separated by 100 ms intervals). Naturally, the illiterate subjects were not expected to perform the tasks with written materials. We reasoned that this would offer a direct fMRI assessment of their lack of reading skills. With spoken input, we anticipated observing standard language comprehension and calculation networks that could be compared across literate, ex-illiterates and illiterate subjects.
To ensure good comprehension, stimulus presentation was slowed down from the original localizer scan (approximately one trial every 4.8 s). With 2 initial training trials, there was a total of 102 trials for a total duration of 8 min 11 s (491 s or just under 205 TRs of 2.4 s).
The experimental protocol was organized as a fast event-related paradigm. The 100 trials were presented in a fixed sequence with a stochastic SOA (4200ms, 4500ms, 4800ms, 5100ms or 5400 ms; mean SOA = 4.8 sec) for better deconvolution of the hemodynamic signal. This sequence was optimized for both statistical detection and hemodynamic response estimation using a Matlab script inspired by the genetic algorithm of ref. (S10). An original feature of our procedure was to optimize the sequence according to more than one contrast. Eight contrasts of interest were selected: right vs. left hand response, vertical vs. horizontal checkerboards, auditory stimuli vs. rest, visual stimuli vs. rest, auditory calculations vs. auditory non-numerical stimuli, visual calculations

7
vs. visual non-numerical stimuli, auditory stimuli vs. visual stimuli and visual stimuli vs. checkerboards. Inside the MR, prior to the localizer, participants were presented with pre-recorded and computerized instructions which informed them that this part would involve many different tasks: 1) reading the visual sentences (or just looking at them if they were unable to read); 2) listening to the spoken sentences; 3) performing a motor command upon verbal request (e.g., pressing the right button 3 times); 4) silently calculating the answer to a subtraction problem; 5) fixating the central cross at all times and particularly during the flashing checkerboards.
Visual runs
The main goal of this experiment was to visualize the organization of the ventral visual system in response to five categories of images (faces, houses, tools, letter strings, and false-font strings), plus a control condition (moving checkerboards). These images were presented in short blocks of 12 stimuli (10.5 s), separated by a brief resting period with a fixation point only (3 s).
The five main categories of stimuli were faces, houses, tools, letter strings, and false-font strings, each comprising 24 different items. The stimuli were presented in mini blocks comprising 7 trials from the same category, for a total block duration of 10.5 s. On each trial, whose total duration was 1.5 s, a pair of stimuli from the same category was presented. The first element of the pair was flashed for 200 ms, followed by a 200 ms fixation point, followed by the second element for 500 ms, and finally a 600-ms fixation point.
All stimuli were black on a white background. Faces, houses and tools were highly contrasted gray-level photographs matched for size and overall luminance. They subtended ~160 x 160 pixels or about 4.9 x 4.9 degrees of visual angle in France and 4.3 x 4.3 degrees in Brazil. Faces (11 female, 13 male) were front or slightly lateral views of non-famous people. Tools were common hand-held household objects (e.g. knife, hairdryer) presented in normal orientation. Houses comprised exterior pictures of common houses, apartments and buildings. Letter strings were pseudo-words, four letters long, made of the lower-case letters ‘bdmnpqiou’, and were orthographically legal in Portuguese. A false font was designed in which the pseudo-letters were matched one-to-one in stroke complexity with the letters used in the pseudo-word stimuli. The 24 false font strings were generated by one-to-one replacement of the letters in the pseudo-word strings with the false-font letters. Strings and false-fonts were ~130 pixel wide x 40 pixel high or 4 x 1.2 degrees in France, and 3.5 x 1.1 degrees in Brazil. Finally the circular checkerboard was an expanding circular grid of black-and-white designed to broadly cover the entire region where other stimuli could be presented. It was presented in a constantly expanding motion, starting at size 184 pixels (5.5 degrees in France, 4.9 in Brazil) and ending at 211 pixels for the first checkerboard (duration 200 ms, 6.4 or 5.6 degrees) and 267 pixels for the second checkerboard (duration 500 ms, 8.0 or 7.1 degrees).
During rest and inter-trial intervals, a small fixation cross was constantly presented in order to minimize eye movements. A total of 34 mini blocks were presented during each fMRI run (six of each of the five main categories, plus four of the moving checkerboard condition). With 34 blocks+rest segments of 13.5 s each, the total run duration was 7 min 39 s (this is 459 s or just under 192 TRs of 2.4 s).
Throughout all blocks, the subject’s sole task was to monitor for the presence of an occasional target stimulus (a black star) by clicking a right-hand button. A single target appeared at a random location within half of the mini blocks, in the position of the first stimulus in a pair. This task was chosen for its extreme simplicity, ensuring that there were no differences between participants in their performance level. Indeed, performance was consistently high (see below).

8
For reference, the visual experiment also included a manipulation of repetition priming, inspired by our earlier work (S11), but which yielded no significant results, probably for lack of statistical power, and is therefore not reported in detail here. For each category except checkerboards, across blocks, the relation between the first image (“prime”) and the second image (“target”) of each pair was varied. There was one block with “repeated” trials in which those images were identical. Another block consisted of “mirror” trials in which the prime was the mirror-reversed image of the target by a left-right inversion. Finally, the third block consisted of “different” trials in which the prime and target were unrelated images of the same category. For the latter case, each image was paired with another fixed unrelated image for the entire duration of the experiment. To permit such left-right inversion, the pseudo-words were all mirror-reversible pseudo-words such as “obli/ildo”, written exclusively with the lowercase letter set ‘bdmnpqiou’, and using a slightly modified font where letters were strictly reversible, so that even in mirror image the stimuli still looked like possible pseudo-words.
Spoken language runs
The main goal of the spoken language runs was to probe the impact of literacy on spoken language processing and, in particularly, to replicate and extend previous results by Castro-Caldas and collaborators with auditory lexical decision (S12). The participants performed a lexical decision task on single spoken words and pseudowords. They responded by pressing one of two hand-held response keys if the spoken stimulus was a word in Portuguese, and another key if it was a pseudo-word. Forty words and 40 pseudowords had been recorded, separately for European and Brazilian Portuguese, by native speakers (the European Portuguese version had already been used in ref. (S13)). The average duration of the stimuli was 660 ms for Brazilian Portuguese and 457 ms for European Portuguese. Within one fMRI run, all 80 stimuli were presented in random order, intermixed with an additional 20 rest trials in which no sound was presented. Each trial lasted 3.2 s and consisted in a short (100 ms) dimming of the fixation point, which served as a warning signal, followed 500 ms later by the presentation of a single word. There was an initial blank duration of 4 s, for a total duration of 5 min 24 s (324 s or exactly 135 TRs of 2.4 s). Each of these runs was repeated 4 times in a different random order, with a random initial assignment of response hands and a switch after two runs.
For reference, this study included a manipulation of orthographic consistency, a factor that has been shown to influence on-line measures of spoken words and pseudo-words (S13-22). Consistency was manipulated in the European Portuguese material at the level of the rhyme: consistent words have a rhyme with a unique orthographic transcription, e.g., the ending /um/ is necessarily transcribed as “ume”, as in “lume”, ‘light’; in contrast, the rhyme in inconsistent words can be spelled either with or without a mute vowel “e” (e.g. /εl/ can be transcribed as in “pele”, ‘skin’, or in “mel”, ‘honey’), or with different consonants (e.g., /ɔs/ can be transcribed as in “posse”, ‘possession’ or in “coce”, ‘scratch’). Given that the final vowel “e” is not mute in Brazilian Portuguese, in the case of the Brazilian material, consistency was manipulated at the level of the onset of the second syllable: consistent words, like “povo” (‘people’) have a second consonant (/v/) that is always transcribed with the letter “v”; in contrast, in inconsistent words, the intervocalic consonant /s/ can be transcribed as either “ç” (“poço”, ‘well’) or “ss” (“osso”, ‘bone’). For each language, 20 words had consistent orthographies and 20 inconsistent. Given that pseudowords had been constructed by substituting the initial phoneme of each word, the consistency factor was also well defined for pseudo-words.
Unfortunately, we only observed erratic behavioral effects of the consistency factor, with inconsistent results in the two countries, and no fMRI effect. Therefore, these analyses are not

9
described in detail. Note that previous studies of orthographic consistency, all performed in a standard psychological laboratory, used large numbers of educated participants (e.g. 28 participants in ref. (S13)) and yielded only small effects (28 ms in this particular study). The present results were obtained with a relatively small number of trials, under listening conditions that were compromised by the noise of the fMRI and the hearing-protection devices used, and with relatively slow response times. Any of these complicating factors could explain our failure to obtain an orthographic consistency effect.
6) fMRI analyses Functional images were first corrected for head motion, resampled every 3 mm using sinc
interpolation, normalized to the standard MNI brain space, and spatially smoothed with an isotropic Gaussian filter (5 mm full width at half maximum). A two-level analysis was then implemented in SPM5 software (Wellcome Department of Cognitive Neurology, London, UK).
Whole-brain individual analyses. For each participant, consecutive normalized fMRI images were high-pass filtered at 128 s and smoothed with a 4 s Gaussian kernel. The data was then modelled, within each fMRI run, by regressors obtained by convolution of the experimental conditions with the canonical SPM hemodynamic response function and its time derivative. The model for the localizer scan included 10 conditions: horizontal checkers, vertical checkers, and sentences, instructions for left or right button pressing, and arithmetic problems, the latter four conditions being presented either visually or auditorily. For visual runs, 17 conditions were modelled: 15 conditions formed by the factorial product of 5 categories (faces, houses, tools, letter strings, false fonts) x 3 repetition types (same, mirror, different), plus the checkerboard condition and the target star condition. Finally, for spoken lexical decision, 4 conditions were modelled, formed by the 2x2 product of lexicality (word or pseudoword) and consistency (consistent or inconsistent spelling) factors. Whole-brain group analyses. For each participant and each condition, the above first-level SPM model yielded a beta weight image of activation relative to rest (expressed as a percentage of the whole-brain BOLD signal). All of these images, except the target star condition, were then entered into several second-level whole-brain ANOVAs. The main ANOVA had reading performance as a covariate of interest (average number of words and pseudowords read per minute), ranging from 0 for illiterates to 136 items/minute for our best reader. This analysis was used as the most sensitive measure of the overall impact of literacy, because it relied on the entire set of participants and took into account their variable reading scores (capturing for instance the high variability in reading performance inside the ex-illiterate groups). In another ANOVA we modelled separately the six groups of participants (ILL, EXP, EXB, LB2, LP, LB1), permitting more focused contrasts: ILL<LIT (main effect of literacy, confounded with schooling), ILL<LB2 (effect of literacy, confounded with schooling, but matched for SES), and ILL<EX (effect of literacy acquired in adulthood, unconfounded by schooling or SES). For greater sensitivity of the latter contrast, taking into consideration the variability in reading scores, we also reanalyzed the effect of reading performance restricted to the illiterates and ex-illiterates. For all of these whole-brain analyses, unless otherwise stated, we used a threshold of p<0.001 uncorrected at the voxel level, and report only regions where such voxels grouped together to form a contiguous cluster whose extent was significant at p<0.05, corrected for multiple comparisons across the brain volume. This analysis is appropriate for detecting significant effects with a sufficient cortical extension (~150 contiguous voxels were needed to achieve cluster-extent significance). Occasionally, effects with a smaller
10
cortical extent but a high peak-voxel Z statistic achieved significance only with the False Detection Rate (FDR) statistic, in which case they are marked by “FDR” in the text. Asymmetry analyses. For testing inter-hemispheric differences in neural activation, for each contrast and each participant we further created a left-right flipped image by applying to each original contrast image a spatial transformation specific to each participant, appropriate for aligning the flipped anatomical image to the MNI template. We then computed a hemispheric difference image by subtracting the flipped contrast images from the original contrast images. These images of left-right differences were then submitted to the same ANOVA models as above, in order to estimate the hemispheric differences for each effect of interest. Plots. Once a significant peak was identified, illustrative plots of effects were generated by extracting the beta weight of SPM regressions of individual participants’ data with the hemodynamic functions of the appropriate stimulus categories, and then plotting the mean and standard error of these beta weights in the six groups of participants. These values thus estimate, in arbitrary units, the size of the fMRI activation relative to the implicit rest baseline that separates trials. Additional regressions. Once SPM analysis identified a significant cortical effect by correlation of activation with reading performance across all groups, we extracted the percent activation in each condition and for each subject, and plotted their distribution in each group (table S2). We also submitted these measures to further analyses, aimed at testing whether the brain changes associated with literacy involve a sensitive period in childhood or, alternatively, can occur in adulthood and depend solely on the literacy level which is eventually attained. Table S2 reports the results of this detailed analysis. The first two statistics in table 2 are controls probing whether the observed effect can be genuinely attributed to literacy, once other variables are unconfounded.
- Main impact of reading score, corrected for age and country. This is a regression analysis testing for a significant impact of literacy (i.e. average reading speed for words and pseudowords), with age and country as additional covariates
- Impact of schooling within low-SES adults (LB2-ILB). This is a restricted group comparison between the Brazilian illiterates and the matched group of Brazilian literates with the same social origins and socio-economic level.
The next three statistics attempt to separate the effects of literacy, schooling and eventual expertise: - Pure effect of late literacy (rs in EX+IL). This statistic probed whether the observed brain
change occurs when literacy is acquired in adulthood, which is the best situation for controlling for other effects of schooling and socio-economic background. We contrasted the ex-illiterates with the illiterates – two adult populations, both deprived of early schooling, only one of which had the opportunity to acquire reading in adulthood. In order to achieve greater sensitivity and take into account the large variability in the reading scores of the ex-illiterates, we actually tested for the effect of reading score, restricted to the ex-illiterate and illiterate groups (in the latter the reading score is zero by definition). A significant effect indicates that the studied neural system varies specifically with literacy, even when acquired late, and is not just dependent on early schooling.
- Pure effect of early schooling (LB2-EXB|rs). This statistic probed the impact of early schooling by comparing the LB2 and EXB groups, who had learned to read, respectively, as children and as adults, but were otherwise from similar social backgrounds. In order to keep eventual literacy level as similar as possible, we focused our analysis on the Brazilian LB2 and EXB subjects, i.e. the schooled versus unschooled subjects whose reading scores were
11
most comparable (excluding the LP and LB1 groups with high literacy, and the EXP group with low literacy). Because the LB2 and EXB groups still differed slightly in their literacy level, reading performance was introduced as an additional covariate of non-interest. Thus, a significant effect on this test indicates a significant advantage for childhood compared to adult reading acquisition, after adjustment for reading performance.
- Impact of eventual proficiency within the early schooled (rs in LIT). This statistic tested whether, in literates, the observed brain change depends on the level of literacy eventually attained. Thus, we restricted the analysis to literate participants and tested a regressor for reading performance. A significant effect indicates that the studied neural system does not solely require a minimal exposure to reading in childhood, but continues to change with increasing literacy level.
Avoiding circularity. Circularity can occur when a cortical peak is selected by one analysis and then further analyzed by additional statistics or plots that are not independent of the original selection criterion (S23, 24). The following steps were taken to avoid these problems.
First, the majority of our inferences were based on classical whole-brain search in SPM5, using a corrected-level cluster-size significance of p<0.05 after correction for multiple tests at the whole brain level. Such inferences, which merely localize the cortical regions affected by literacy, do not suffer from statistical circularity (see figure 4 in reference 24).
Second, when required, secondary analyses of previously identified voxels were based on data and/or statistical tests that were independent of the initial voxel selection criterion. Our analyses of the VWFA peak (section entitled “Competition with other visual categories in occipito-temporal cortex”) are based on, first, localizing the peak of the group effect of literacy in the localizer runs, then testing it in the independent visual runs. Similarly, in the section entitled “The visual word form area: a major correlate of literacy”, we first isolated the voxel showing the largest difference between written sentences and checkerboards in the localizer, then probed its response during the independent visual runs. For our analyses of the individually defined FFA and its surrounding voxels, we isolated the peak response to faces>houses in each subject, then studied an orthogonal test (the effect of literacy on faces – rest). Finally, for analyses reported in table S2, most inferences are based on fMRI data from conditions independent of those used to identify the cortical peak (cells noted in light gray). For reference, we also report the results of the same statistics ran on the original fMRI data; very little difference was seen, suggesting that voxel selection effects are not prominent in our data set.
Third, even simple data plots can also be affected by a form of circularity, inasmuch as the test used to isolate a voxel introduces a bias towards the selection of voxels in which, by chance alone, noise leans in the direction of the contrast being tested (S24, 25). To sidestep this problem, whenever possible, we plotted the profile of activation at coordinates derived from an independent data set (figures 2, 3A, 3D, and 5). For plots of the localizer runs (figures 2 and 5), we identified peak voxels by correlation of reading performance with the written-sentence activation, then plotted the average activation to all other conditions in which written or spoken sentences were presented (motor commands + calculation problems). For plots of the auditory runs (figure 5), we plotted only peak voxels identified from independent spoken-sentence or written-sentence conditions. A similar approach was adopted for plots of the visual runs (figure 3A and 3D). For faces, houses, and horizontal/vertical checkers, however, independent data were not available, but it still seemed important to visualize the mean activation in regions identified by SPM analysis, particularly to compare it across regions and conditions, while keeping in mind that some but not all of the plots’ features can be affected by circularity. To address this problem, Vul and Kanwisher (S25) suggest “full disclosure”, i.e. that “Authors should explicitly state whether the plot corresponds to the same (non-independent) data used for the selection criteria, or different, independent data.” We adopted

12
this approach in the present paper, by precisely stating the voxel-selection criteria and by noting the absence of independent data in figures 3BCE.
Vul and Kanwisher (S25) also note that “what would clearly be impressive would be analyzing the data of a second study using the anatomical markers identified in an earlier study (e.g., the Talairach coordinates) and then testing the correlation in that specific region.” To further test the validity of our findings, we implemented this approach by selecting a priori the seven peak coordinates reported in the language lateralization study by Pinel et al. (S6), who used an equivalent localizer as in the present study in a large group of French adults. Figure S7 shows the corresponding plots, analogous to those reported in figures 2, 3A and 5B of the main paper. Both the coordinates and the profiles of responses were highly similar to those originally reported by our SPM methods, and regressions with reading performance revealed similar effects (see figure S7), again suggesting that voxel selection effects were minimized in our data set with 63 participants.
13
II. Supplementary results
1) Behavioral results during fMRI
1. Target detection during the visual runs
Performance was high and comparable across groups (F(5,55) = 0.82, n.s.). The mean hit rates ± standard deviation were: Portuguese literates, 97% ± 6, Brazilian literates 1, 97% ± 5, Portuguese ex-illiterates, 96% ± 3, Brazilian ex-illiterates, 95% ± 11, Brazilian illiterates, 93% ± 5, and Brazilian literates 2, 89% ± 14. Reaction times were also not different when the groups were compared within each country (Brazilians, F(3,35)=0.62, p>0.6; Portuguese, F(1,19)=1.65, p>0.1), though a significant difference existed between the two test sites, F(1,60)=154.0, p<0.001), presumably due to differences in button hardware or instructions. One subject from the Portuguese ex-illiterate group was excluded from this analysis because of an erratic response pattern during MRI, even if she did perform well during the training session and reported no particular anxiety or other problems during the scan.
2. Lexical decision during the spoken language runs ANOVAs were performed separately for each country for two reasons: first, the stimulus materials were different between countries, and second the number of groups was also different between countries, leading to an incomplete design. ANOVAs were performed separately for RTs and accuracy with lexicality (pseudowords vs. words) as within-subject factors, and group as between-subjects factor. Portugal: Analyses on RTs revealed only an effect of lexicality (F(1, 20)= 23.85, p < .001, MSe= 9844) with words (1106 ms, standard error [SE] = 29 ms) responded more quickly than pseudowords (1210 ms, SE= 35 ms). Neither the main effect of group, nor the Group x Lexicality interaction were significant. In the accuracy analysis, there was a significant effect of group (F(1,20)= 8.65, p < .05, MSe = .03), with better overall performance for literates (88% correct) than ex-illiterates (78% correct). The lexicality effect approached significance (F(1, 20)= 3.96, p = .06, MSe= .02), with higher scores for words than pseudowords (87% and 80%, respectively). The interaction lexicality x group which was reported in a previous study (S12) was not significant, but approached conventional levels of significance in the appropriate direction (F(1, 20)= 3.03, p= .097, MSe= .02): whereas for literates the accuracy between words and pseudowords were similar (89% and 88%, respectively, F<1), ex-illiterates had marginally more accurate responses for words than pseudowords (84% and 72% correct (F(1, 10)=4.16, p= .07, Mse= .04). Brazil: Analyses on RTs revealed an effect of lexicality (F(1, 37)= 49.86, p < .001, MSe= 8519), with words responded more quickly than pseudowords (996 ms, SE= 21 ms, versus 1098 ms, SE= 25 ms). Neither the main effect of group, nor the interaction of lexicality with group were significant (both Fs < 1). In the analyses on accuracy, there was an effect of group (F(3, 37)= 12.08, p < .001, MSe= .03). The literate LB1 group had the highest performance (93% correct), followed by the literate LB2, ex-illiterates and illiterates (78%, 80% and 71% correct, respectively), with no differences between these three groups. Neither the main effect of lexicality (F(1, 37)= 2.78, p= .10, MSe= .03) nor the interaction lexicality x group were significant (F < 1). Accuracy was 83% correct for words and 78% for pseudowords.

14
2) fMRI Activation specific to ex-illiterates
Although we primarily searched for activations monotonically related to reading scores, non-monotonic effects might arise if the ex-illiterates, in order to read, had to mobilize a broader network than either literates or illiterates. To explore this possibility, we used the contrast EXB>ILB during written sentences in the localizer (p<0.001, cluster-extent p<0.05, corrected). As shown in figure S5, Brazilian ex-illiterates show more activation than illiterates in a large stretch of bilateral ventral visual cortex including fusiform (-50, -56, -10, Z=5.14; 52, -50, -8, Z=5.04) and lingual regions (-34, -50, -8, Z=4.90; 40, -50, -2, Z=5.03), in bilateral posterior parietal cortex (30, -64, 32, Z=8.17; -22, -60, 38, Z=6.37), intraparietal sulcus (-40, 40, 44, Z= 5.24; 42, -38, 40, Z=5.55) as well as several precentral and prefrontal peaks (e.g. -34, 0, 28, Z=5.93; 38, -2, 56, Z=5.27). Parts of these regions are unique to ex-illiterates, inasmuch as they activate more in Brazilian ex-illiterates than in Brazilian literates (EXB>LB1&LB2, same threshold). The regions passing the latter test are the bilateral mesial fusiform/parahippocampal areas (-34, -60, 0, Z=5.34; 38, -50, -2, Z=4.54) and right superior posterior parietal cortex (24, -62, 38, Z=4.70; 12, -58, 60, Z=4.16). Their localization fits with previous studies of a parieto-ventral network for serial effortful reading (S26). In agreement with this interpretation, their activation was not found in the absence of explicit reading instructions, i.e. during the mere presentation of letter strings forming pseudo-words during the visual runs.
3) Regions of interest surrounding individual peaks of responsivity to faces and houses
In addition to classical SPM analyses, we also implemented analyses inspired by a previous study of visual specificity in the course of the development, performed by Golarai et al. (S27). The goal was to examine the cortical peaks of responsivity to houses, faces and tools, taking into account the inter-individual variability in the location of these peaks. Golarai et al. showed that, during development, the peak responses to faces and places already have an adult level of stimulus selectivity in children aged 7-11. Development, however, occurred primarily in the surrounding cortices, as demonstrated by extracting the signal from concentric “shells”, i.e. hollow spheres centered around the subject-specific peaks and characterizing the response at a certain distance from the peak. With age, the selectivity of the response to faces and houses increased in shells surrounding the individual peak response, suggesting a cortical expansion process. We thus wondered whether the putative competitive effects of literacy would occur at the peak or in the surrounding cortex, which, according to Golarai et al., appears to be less determined during development.
Within each subject, we first searched for the peak responsivity for faces>houses (or, in a second analysis, houses>faces). We were primarily interested in the effects happening in the vicinity of the VWFA, hence we searched for this peak within a 10-mm sphere centered on the group coordinates of the peak effect of reading performance on visual sentences (-44, -50, -14). We then extracted the activation to faces (respectively houses) at this peak as well as in increasingly larger shells of 2, 4, 6 or 8 voxel radius surrounding it. We regressed this value against the participants’ reading performance scores. A significantly negative regression weight indicated that, with increasing literacy, there was a decrease in activation to faces (resp. houses).
For plotting purposes, we transformed the beta weight of the regression into an estimate of the size of the competition effect, expressed as a percentage of the mean activation within this region, and estimated as minus the slope of the regression of activation by performance, divided by the mean activation across all groups, and multiplied by 100 (given that the reading performance variable ranges from 0 in illiterates to a mean ~100 in the LB1 group). With this measure, a positive effect indicates cortical competition, such that increasing literacy leads to a stronger percentage attenuation of the cortical response to faces (resp. houses).

15
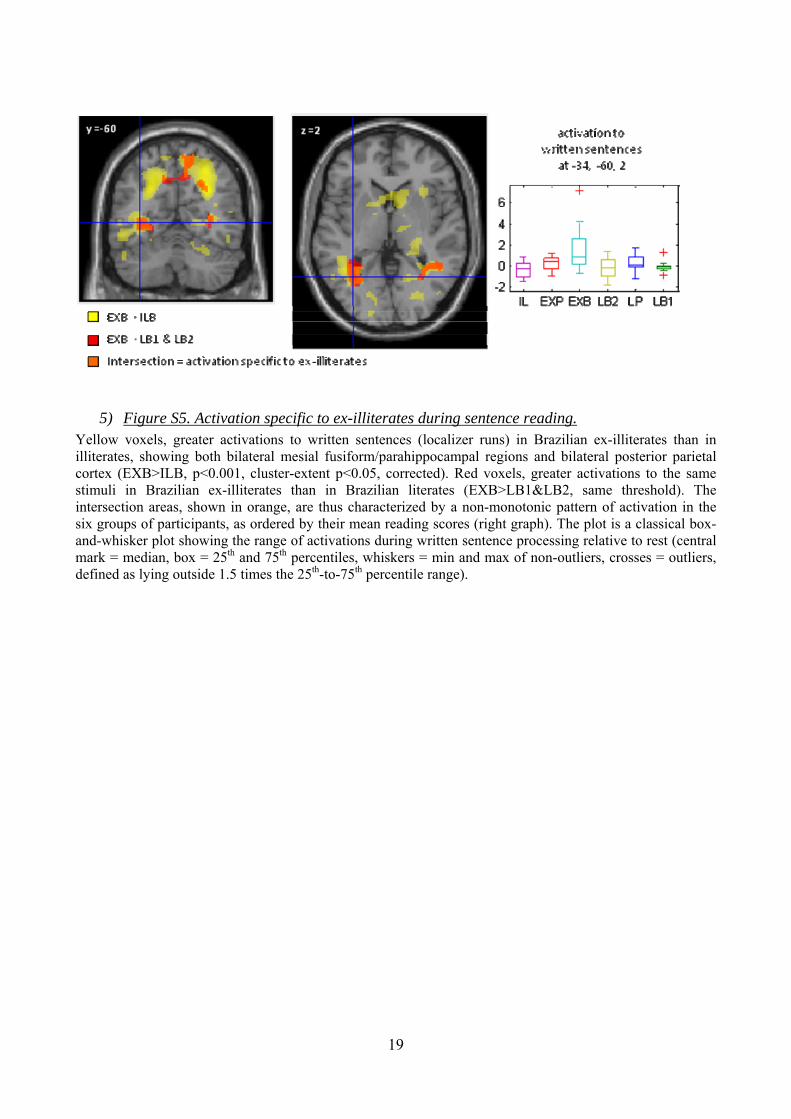
As shown in figure S6, such a competition effect was not identified at the peak itself, but within concentric shells relatively distant from the peak. Significance (p<0.05) was attained at 12 and 16 mm of the peak for faces, and at 16 mm of the peak for houses.
4) fMRI effects of lexicality during the lexical decision task
fMRI analyses revealed that there was no significant effect of reading performance on the difference in brain activation to spoken words versus pseudowords. The main effect of lexicality (words > pseudowords) identified a large network comprising the left posterior and anterior middle temporal gyrus (-60, -50, -2, Z=5.30; and -64, -16, -18, Z=4.04), left parieto-temporal junction (-46, -64, -26, Z=4.98, with subpeaks in the inferior parietal region, -34, -78, 38, Z=4.72; and -56, -48, 38, Z=4.06), precuneus (-4, -40, 38, Z=4.64) and mesial ventral prefrontal cortex (-6, 46, 4, Z=4.10). Most of these regions belong to the "default mode" network and, accordingly, the observed difference corresponded to a greater deactivation by pseudowords than by words. The only exception was the left posterior MTG, where activation was mildly positive to spoken words relative to rest, and mildly negative for pseudowords.

16
III. Supplementary Figures
A B
DC
E
1) Figure S1. Reading scores in the six groups of participants. A, B: Speed of reading a list of words (A) and pseudowords (B) (unit = words per minute; central mark = median, box = 25th and 75th percentiles, whiskers = min and max across participants). C, D, Accuracy in reading isolated words (C) and pseudowords (D) without time constraint. E, sentence reading and comprehension task (Lobrot), comprising 36 sentences that should be completed by one word in 5 min or less.

17
2) Figure S2. Examples of stimuli used in the localizer run (translated into English)
3) Figure S3. Examples of stimuli used in the visual runs

18
spoken writtenLeft Right Left Right
0
2
4
6
Response at [40, -16, 54]
Left Right Left Right
0
2
4
6Response at [-38, -20, 52]
Sentence Math Sentence Math
0
1
2
3
4
Response at [-32, -64, 38]
A. Motor commands
B. Calculation commands
Sentence Math Sentence Math
0
1
2
3
Response at [38, -56, 38]
LB1LPLB2EXB
ILBEXP
z=54
L R
z=38
spoken written
spoken written spoken written
LB1LPLB2EXB
ILBEXP
L R
4) Figure S4. Brain-imaging evidence of participants’ compliance, comprehension , and literacy.
A, Modulation by literacy of the contrast ‘written motor command versus written sentence’, showing a classic motor network. Plots indicate activation relative to rest for left versus right-clicking instructions, separately for instructions presented in spoken and written modalities. B, Modulation by literacy of the contrast ‘written calculation command versus written sentence’, showing a classical calculation network. Plots indicate activation relative to rest for sentence listening versus calculation instructions, separately for instructions presented in spoken and written modalities.
19
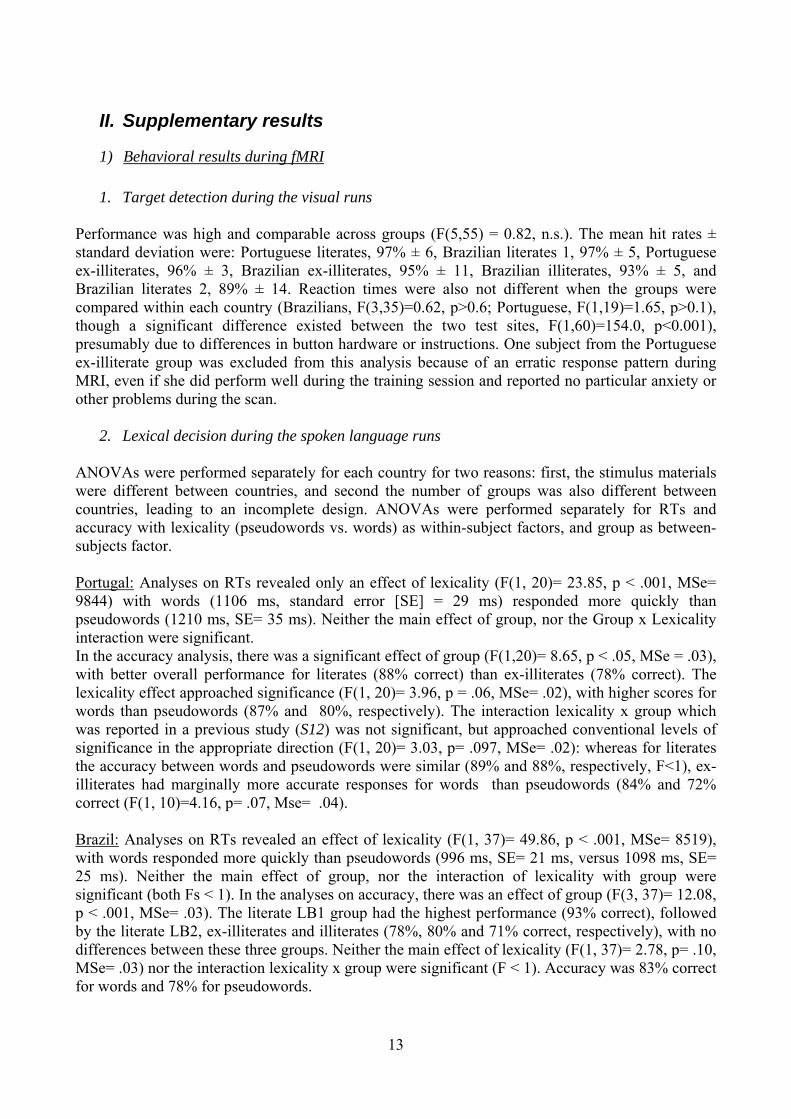
5) Figure S5. Activation specific to ex-illiterates during sentence reading. Yellow voxels, greater activations to written sentences (localizer runs) in Brazilian ex-illiterates than in illiterates, showing both bilateral mesial fusiform/parahippocampal regions and bilateral posterior parietal cortex (EXB>ILB, p<0.001, cluster-extent p<0.05, corrected). Red voxels, greater activations to the same stimuli in Brazilian ex-illiterates than in Brazilian literates (EXB>LB1&LB2, same threshold). The intersection areas, shown in orange, are thus characterized by a non-monotonic pattern of activation in the six groups of participants, as ordered by their mean reading scores (right graph). The plot is a classical box-and-whisker plot showing the range of activations during written sentence processing relative to rest (central mark = median, box = 25th and 75th percentiles, whiskers = min and max of non-outliers, crosses = outliers, defined as lying outside 1.5 times the 25th-to-75th percentile range).
20
6) Figure S6. Analyses of cortical competition induced by literacy at and around the individual peak responses to faces and houses.
In each graph, the blue curve shows the mean activation induced by faces (left) or houses (right) relative to rest, at the individual peak of the relevant contrast (faces-houses or houses-faces) and in successive concentric shells of increasing radius (one voxel = 2 mm). The red curve shows an estimate of the competitive effect of literacy (decrease in activation with increasing reading performance). P values indicate the significance of a linear regression assessing the impact of the reading score on the activation to faces in the given region of interest.

21
7) Figure S7. Plots of fMRI responses at a-priori peaks within left-hemispheric perisylvian language areas.
Seven a-priori cortical areas were defined from the coordinates reported in the language lateralization study by Pinel et al. (S6), who used the same localizer as in the present study in a large group of French adults. Plots indicate the fMRI BOLD signal relative to rest in each condition (for the localizer runs, activation was pooled across sentences, motor commands, and calculation problems, separately for the spoken and written modalities). One-tailed p values identify conditions in which a significant effect of reading performance was found (linear regression; n.s. = p>0.05, one-tailed). The plots largely replicate the findings of figures 2, 3A and 5B, which are based on peaks identified by the effect of literacy on the activation to written sentences.

22
8) Figure S8. Comparison of activations to written and spoken sentences. Left columns show the raw activation to spoken and written sentences relative to rest in the localizer runs (for greater comparability between groups with different numbers of subjects, the figure does not show statistical t maps, but BOLD signal maps arbitrarily thresholded at 0.50% of the mean BOLD signal over the whole brain; similar results were seen with t maps). The regions in orange, corresponding to the overlap of spoken and written conditions, increase considerably with literacy to encompass the entire left perisylvian language network in literates, with the exception of primary auditory cortex and its vicinity. Nevertheless, the statistical maps at right show a remaining advantage to spoken language in the temporal lobe, but not the frontal lobe.
23
IV. Supplementary tables
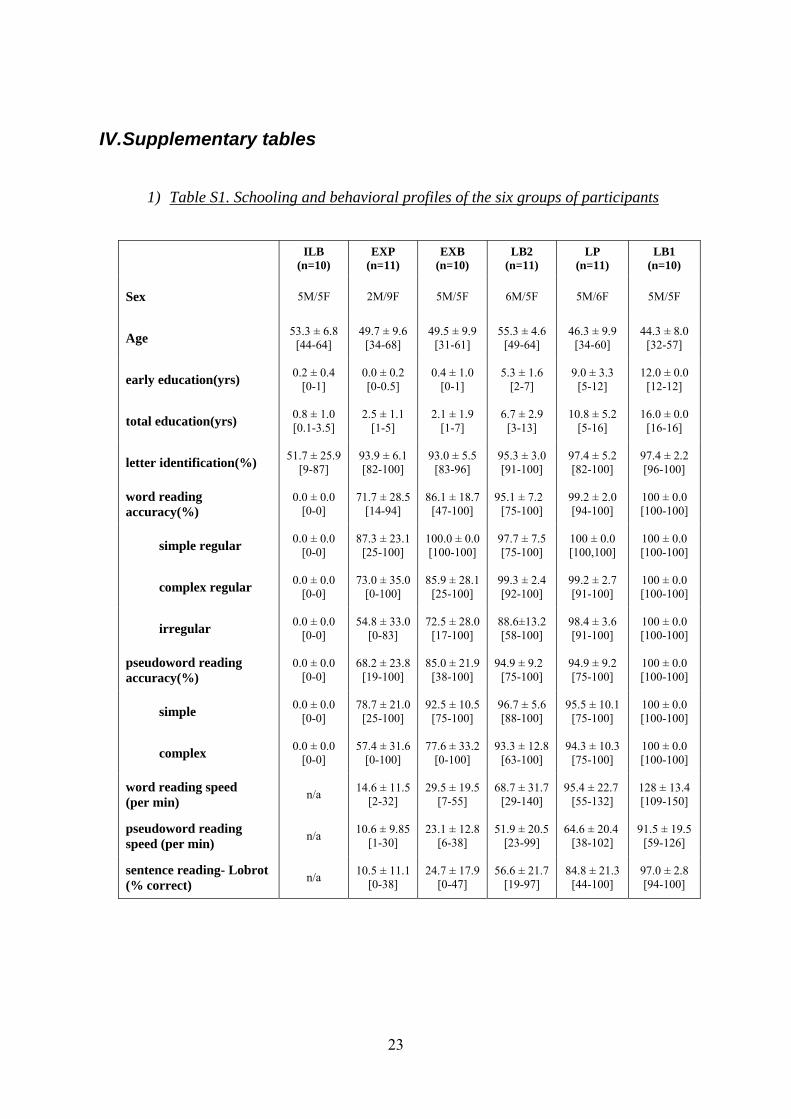
1) Table S1. Schooling and behavioral profiles of the six groups of participants
ILB (n=10)
EXP (n=11)
EXB (n=10)
LB2 (n=11)
LP (n=11)
LB1 (n=10)
Sex 5M/5F 2M/9F 5M/5F 6M/5F 5M/6F 5M/5F
Age 53.3 ± 6.8 [44-64]
49.7 ± 9.6 [34-68]
49.5 ± 9.9 [31-61]
55.3 ± 4.6 [49-64]
46.3 ± 9.9 [34-60]
44.3 ± 8.0 [32-57]
early education(yrs) 0.2 ± 0.4 [0-1]
0.0 ± 0.2 [0-0.5]
0.4 ± 1.0 [0-1]
5.3 ± 1.6 [2-7]
9.0 ± 3.3 [5-12]
12.0 ± 0.0 [12-12]
total education(yrs) 0.8 ± 1.0 [0.1-3.5]
2.5 ± 1.1 [1-5]
2.1 ± 1.9 [1-7]
6.7 ± 2.9 [3-13]
10.8 ± 5.2 [5-16]
16.0 ± 0.0 [16-16]
letter identification(%) 51.7 ± 25.9 [9-87]
93.9 ± 6.1 [82-100]
93.0 ± 5.5 [83-96]
95.3 ± 3.0 [91-100]
97.4 ± 5.2 [82-100]
97.4 ± 2.2 [96-100]
word reading accuracy(%)
0.0 ± 0.0 [0-0]
71.7 ± 28.5 [14-94]
86.1 ± 18.7 [47-100]
95.1 ± 7.2 [75-100]
99.2 ± 2.0 [94-100]
100 ± 0.0 [100-100]
simple regular 0.0 ± 0.0 [0-0]
87.3 ± 23.1 [25-100]
100.0 ± 0.0 [100-100]
97.7 ± 7.5 [75-100]
100 ± 0.0 [100,100]
100 ± 0.0 [100-100]
complex regular 0.0 ± 0.0 [0-0]
73.0 ± 35.0 [0-100]
85.9 ± 28.1 [25-100]
99.3 ± 2.4 [92-100]
99.2 ± 2.7 [91-100]
100 ± 0.0 [100-100]
irregular 0.0 ± 0.0 [0-0]
54.8 ± 33.0 [0-83]
72.5 ± 28.0 [17-100]
88.6±13.2 [58-100]
98.4 ± 3.6 [91-100]
100 ± 0.0 [100-100]
pseudoword reading accuracy(%)
0.0 ± 0.0 [0-0]
68.2 ± 23.8 [19-100]
85.0 ± 21.9 [38-100]
94.9 ± 9.2 [75-100]
94.9 ± 9.2 [75-100]
100 ± 0.0 [100-100]
simple 0.0 ± 0.0 [0-0]
78.7 ± 21.0 [25-100]
92.5 ± 10.5 [75-100]
96.7 ± 5.6 [88-100]
95.5 ± 10.1 [75-100]
100 ± 0.0 [100-100]
complex 0.0 ± 0.0 [0-0]
57.4 ± 31.6 [0-100]
77.6 ± 33.2 [0-100]
93.3 ± 12.8 [63-100]
94.3 ± 10.3 [75-100]
100 ± 0.0 [100-100]
word reading speed (per min) n/a
14.6 ± 11.5 [2-32]
29.5 ± 19.5 [7-55]
68.7 ± 31.7 [29-140]
95.4 ± 22.7 [55-132]
128 ± 13.4 [109-150]
pseudoword reading speed (per min) n/a
10.6 ± 9.85 [1-30]
23.1 ± 12.8 [6-38]
51.9 ± 20.5 [23-99]
64.6 ± 20.4 [38-102]
91.5 ± 19.5 [59-126]
sentence reading- Lobrot (% correct) n/a
10.5 ± 11.1 [0-38]
24.7 ± 17.9 [0-47]
56.6 ± 21.7 [19-97]
84.8 ± 21.3 [44-100]
97.0 ± 2.8 [94-100]

24
2) Table S2. Additional tests performed on peaks identified by the main SPM analysis
The first column indicates the brain location under analysis and its coordinates in the Montreal Neurological Institute coordinate system.
The second column indicates the literacy effect which is being analyzed. For instance, “increased activation to written sentences” means that the effect tested in this line is whether the activation to written sentences increased with increasing reading scores. For a given brain location, the first line, highlighted in light blue, always indicates the contrast that was used to identify the peak coordinates in the whole-brain SPM analysis. The next lines, highlighted in light gray, probe additional effects obtained at the same location in other statistically independent experimental conditions.
The next five columns report various additional statistics testing whether the observed effect can be attributed to schooling, literacy, and proficiency, once other variables are controlled for. See supplementary Methods section for detailed descriptions of these statistics. For each statistic, the table gives the signed t-test indicating the direction of the effect (plus sign = activation increases with reading score; minus sign = activation decreases with reading score), as well as the one-tailed p values (since we are testing only for the predicted direction of the effect). Values in white arise parentheses are only bordering on significance (0.05<p<0.10) and should be considered only as indicative. Ns = not significant (p>0.10).
Finally, the last column reports the value of the contrast within each group of subjects, in the same format as figure S5 (central mark = median, box = 25th and 75th percentiles, whiskers = min and max of non-outliers, crosses = outliers, defined as lying outside 1.5 times the 25th-to-75th percentile range).

25

26

27

28
V. References for supplementary materials S1. P. E. Turkeltaub, L. Gareau, D. L. Flowers, T. A. Zeffiro, G. F. Eden, Nat Neurosci 6, 767
(Jul, 2003). S2. R. Kolinsky, J. Morais, A. Content, L. Cary, Perception 16, 399 (1987). S3. R. Kolinsky et al., Enantiomorphy through the Looking-Glass: Literacy effects on mirror-
image discrimination. Manuscript submitted to JEP: General, in 2nd revision, (2010). S4. P. Ventura et al., J Exp Child Psychol 100, 79 (Jun, 2008). S5. A. Sucena, S. L. Castro, Aprender a ler e avaliar a leitura. O TIL, Teste de Idade de Leitura
(2ª edição actualizada). (Almedina, Coimbra, 2009). S6. P. Pinel, S. Dehaene, J Cogn Neurosci, (Jan 13, 2009). S7. B. Thirion et al., Neuroimage 35, 105 (Mar, 2007). S8. P. Pinel et al., BMC Neurosci 8, 91 (2007). S9. F. Chochon, L. Cohen, P. F. van de Moortele, S. Dehaene, J. Cog. Neurosci. 11, 617 (1999). S10. T. D. Wager, T. E. Nichols, Neuroimage 18, 293 (Feb, 2003). S11. S. Dehaene et al., Neuroimage 49, 1837 (Jan 15, 2010). S12. A. Castro-Caldas, K. M. Petersson, A. Reis, S. Stone-Elander, M. Ingvar, Brain 121, 1053
(1998). S13. P. Ventura, J. Morais, R. Kolinsky, Cognition 105, 547 (Dec, 2007). S14. J. C. Ziegler, L. Ferrand, Psychonomic Bulletin & Review 5, 683 (1998). S15. J. C. Ziegler, A. Petrova, L. Ferrand, J Exp Psychol Learn Mem Cogn 34, 643 (May, 2008). S16. P. Ventura, R. Kolinsky, C. Pattamadilok, J. Morais, J Exp Child Psychol 100, 135 (Jun,
2008). S17. J. C. Ziegler, M. Muneaux, Psychon Bull Rev 14, 75 (Feb, 2007). S18. J. C. Ziegler, L. Ferrand, M. Montant, Mem Cognit 32, 732 (Jul, 2004). S19. L. Perre, J. C. Ziegler, Brain Res 1188, 132 (Jan 10, 2008). S20. L. Perre, C. Pattamadilok, M. Montant, J. C. Ziegler, Brain Res 1275, 73 (Jun 12, 2009). S21. C. Pattamadilok, R. Kolinsky, S. Luksaneeyanawin, J. Morais, Quarterly journal of
experimental psychology (2006) 61, 1515 (Oct, 2008). S22. C. Pattamadilok, L. Perre, S. Dufau, J. C. Ziegler, J Cogn Neurosci 21, 169 (Jan, 2009). S23. E. Vul, C. Harris, P. Winkielman, H. Pashler, Perspectives in Psychological Science 4, 274
(2009). S24. N. Kriegeskorte, W. K. Simmons, P. S. Bellgowan, C. I. Baker, Nat Neurosci 12, 535 (May,
2009). S25. E. Vul, N. Kanwisher, Begging the Question: The Non-Independence Error in fMRI Data
Analysis, in Foundational issues for human brain mapping, S. Hanson, M. Bunzl, Eds. (MIT Press, Cambridge, Mass., 2010), pp. 71-92.
S26. L. Cohen, S. Dehaene, F. Vinckier, A. Jobert, A. Montavont, Neuroimage 40, 353 (Mar 1, 2008).
S27. G. Golarai et al., Nat Neurosci 10, 512 (Apr, 2007).