Supplementary information Disrupting Hepatocyte … Supplementary information Disrupting Hepatocyte...
25
1 Supplementary information Disrupting Hepatocyte Cyp51 from Cholesterol Synthesis Leads to Progressive Liver Injury in the Developing Mouse and Decreases RORC Signalling Žiga Urlep 1 , Gregor Lorbek 1 , Martina Perše 2 , Jera Jeruc 3 , Peter Juvan 1 , Madlen Matz-Soja 4 , Rolf Gebhardt 4 , Ingemar Björkhem 5 , Jason A. Hall 6 , Richard Bonneau 7 , Dan R. Littman 6,8 and Damjana Rozman 1* 1 Centre for Functional Genomics and Bio-Chips, Institute of Biochemistry, Faculty of Medicine, University of Ljubljana, Ljubljana, Slovenia 2 Medical Experimental Centre, Institute of Pathology, Faculty of Medicine, University of Ljubljana, Ljubljana, Slovenia 3 Institute of Pathology, Faculty of Medicine, University of Ljubljana, Ljubljana, Slovenia 4 Institute of Biochemistry, Faculty of Medicine, University of Leipzig, Leipzig, Germany 5 Department of Laboratory Medicine, Division of Clinical Chemistry, Karolinska Institute, Karolinska University Hospital, Huddinge, Sweden 6 The Kimmel Center for Biology and Medicine of the Skirball Institute, New York University School of Medicine, New York, New York 10016, USA 7 New York University & Simons Foundation for Data Analysis, New York, NY 10010, USA 8 Howard Hughes Medical Institute, New York University School of Medicine, New York, New York 10016, USA
Transcript of Supplementary information Disrupting Hepatocyte … Supplementary information Disrupting Hepatocyte...

1
Supplementary information Disrupting Hepatocyte Cyp51 from Cholesterol Synthesis Leads to Progressive Liver Injury in the Developing Mouse and Decreases RORC Signalling
Žiga Urlep1, Gregor Lorbek1, Martina Perše2, Jera Jeruc3, Peter Juvan1, Madlen
Matz-Soja4, Rolf Gebhardt4, Ingemar Björkhem5, Jason A. Hall6, Richard Bonneau7,
Dan R. Littman6,8 and Damjana Rozman1*
1Centre for Functional Genomics and Bio-Chips, Institute of Biochemistry, Faculty of
Medicine, University of Ljubljana, Ljubljana, Slovenia
2Medical Experimental Centre, Institute of Pathology, Faculty of Medicine, University
of Ljubljana, Ljubljana, Slovenia
3Institute of Pathology, Faculty of Medicine, University of Ljubljana, Ljubljana,
Slovenia
4Institute of Biochemistry, Faculty of Medicine, University of Leipzig, Leipzig,
Germany
5Department of Laboratory Medicine, Division of Clinical Chemistry, Karolinska
Institute, Karolinska University Hospital, Huddinge, Sweden
6The Kimmel Center for Biology and Medicine of the Skirball Institute, New York
University School of Medicine, New York, New York 10016, USA
7New York University & Simons Foundation for Data Analysis, New York, NY 10010,
USA
8Howard Hughes Medical Institute, New York University School of Medicine, New
York, New York 10016, USA

2
Supplementary methods
Animals
The generation of Cyp51 heterozygous (Cyp51-/flox, Alb-Cre-; designated as Cyp51+/-)
mice and hepatocyte specific Cyp51 knockout mice (Cyp51flox/flox, Alb-Cre+;
designated as Cyp51+/+ HCyp51-/-) has been reported previously1-3. Briefly, Cyp51+/- or
Cyp51+/+ (Cyp51flox/flox, Alb-Cre-) mice on a mixed genetic background ((up to 10 %)
129/Pas x (at least 90 %) C57BL/6J) were cross-bred with Alb-Cre+ mice (B6.Cg-
Tg(Alb-cre)21Mgn/J; backcrossed 5 times to the C57BL/6J background) to generate
the hepatocyte specific knockouts (HCyp51-/-) on either the wild type (Cyp51+/+) or the
heterozygous (Cyp51+/-) background. The offspring were genotyped based on gDNA
from the tail or ear and the deletion of Cyp51 exons 3 and 41. Mice were housed at
the Medical experimental center’s animal facility under controlled conditions –
temperature of 22±1 ºC, humidity 55±10% and 12:12-hour light–dark cycle (7:00–
19:00 light) with unlimited access to water and diet (Altromin 1324, Germany).
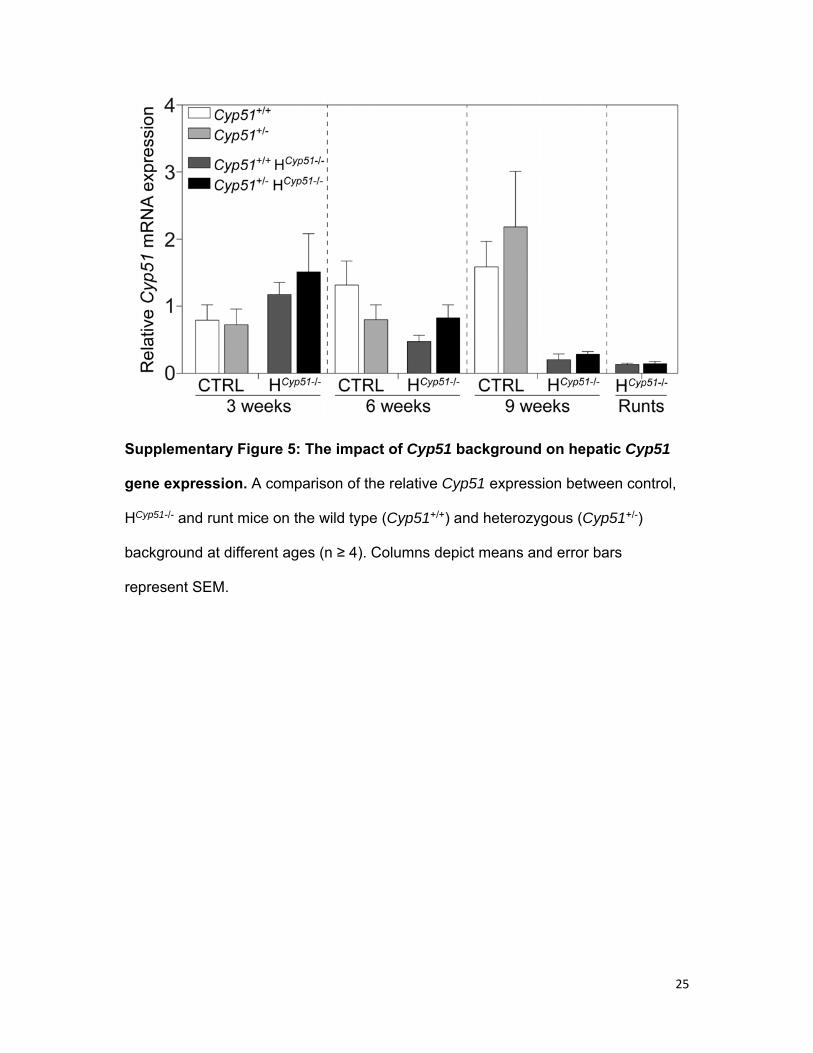
For experiments, the knockout and the control mice were pooled into two groups
(HCyp51-/-; CTRL) regardless of the Cyp51 background (excluding the microarrays
experiment, where only mice on the Cyp51+/+ background were used), due to the
absence of significant background effect on Cyp51 expression and mouse
development (Supplementary Fig. 5).
All procedures involving animals were approved by the Administration of the
Republic of Slovenia for Food Safety, Veterinary and Plant Protection (Permit No.
4401-31/2011/4 and 34401-52/2012/3). Animal care and treatment were conducted
in accordance with the national legislation and international laws and guidelines
(Directive 2010/63/EU on the protection of animals used for scientific purposes,
National Institute of Health guidelines for work with laboratory animals).
3
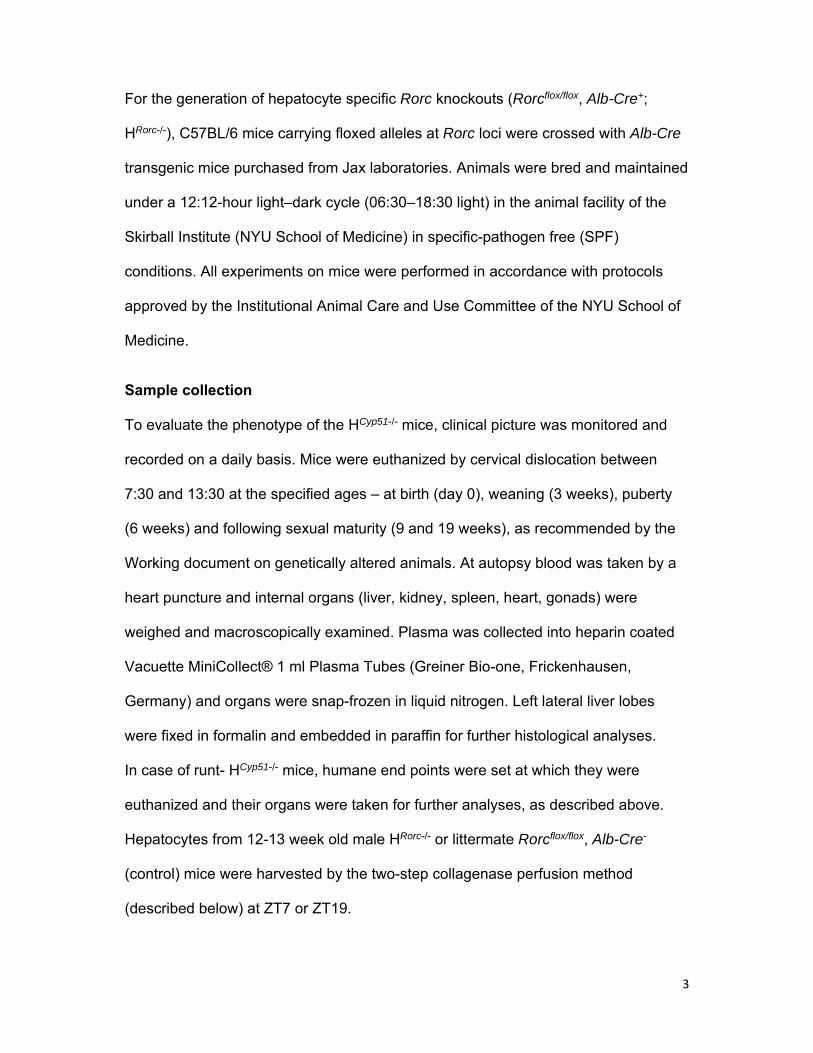
For the generation of hepatocyte specific Rorc knockouts (Rorcflox/flox, Alb-Cre+;
HRorc-/-), C57BL/6 mice carrying floxed alleles at Rorc loci were crossed with Alb-Cre
transgenic mice purchased from Jax laboratories. Animals were bred and maintained
under a 12:12-hour light–dark cycle (06:30–18:30 light) in the animal facility of the
Skirball Institute (NYU School of Medicine) in specific-pathogen free (SPF)
conditions. All experiments on mice were performed in accordance with protocols
approved by the Institutional Animal Care and Use Committee of the NYU School of
Medicine.
Sample collection
To evaluate the phenotype of the HCyp51-/- mice, clinical picture was monitored and
recorded on a daily basis. Mice were euthanized by cervical dislocation between
7:30 and 13:30 at the specified ages – at birth (day 0), weaning (3 weeks), puberty
(6 weeks) and following sexual maturity (9 and 19 weeks), as recommended by the
Working document on genetically altered animals. At autopsy blood was taken by a
heart puncture and internal organs (liver, kidney, spleen, heart, gonads) were
weighed and macroscopically examined. Plasma was collected into heparin coated
Vacuette MiniCollect® 1 ml Plasma Tubes (Greiner Bio-one, Frickenhausen,
Germany) and organs were snap-frozen in liquid nitrogen. Left lateral liver lobes
were fixed in formalin and embedded in paraffin for further histological analyses.
In case of runt- HCyp51-/- mice, humane end points were set at which they were
euthanized and their organs were taken for further analyses, as described above.
Hepatocytes from 12-13 week old male HRorc-/- or littermate Rorcflox/flox, Alb-Cre-
(control) mice were harvested by the two-step collagenase perfusion method
(described below) at ZT7 or ZT19.

4
Collagenase perfusion
Following anesthetization of mice with isoflurane, an intraperitoneal incision was
made to expose the portal vein and vena cava. A 24-gauge perfusion needle (BD
Nexiva 24 GA IV catheter) was then inserted into the portal vein. Once secured, the
vena cava was cut and perfusion of the liver was performed. Perfusion was carried
out with, 1) chelating solution (0.5 mM EGTA and 0.05 M Hepes) for 5 min. Flow
from the vena cava was intermittently blocked to ensure correct needle insertion.
Mice were subsequently switched to, 2) digestion solution (5% fetal calf serum, 1.0
mg/mL of Collagenase D (Roche), 100 µg/mL DNase I (Sigma), 0.1 U/mL Dispase
(Worthington), 4.8 mM CaCl2, and 0.05 M Hepes) for 5 min. Each solution was
prepared in Ca/Mg free HBSS (GIBCO) and degassed prior to being administered at
a flow rate of 10mL/min from a water bath maintained at 42 °C. Upon digestion, the
liver was carefully excised and teased apart atop a 100 µm filter. William’s E medium
(GIBCO) supplemented with 2% FCS and 2 mM glutaMAX (GIBCO) was then
passed over the tissue while swirling the tip of a pipet to further break apart the
tissue. Cells were centrifuged at 50 g for 4 min to prevent the collection of dead cells
and non-hepatocytes and washed 3x in William’s E medium. Cells were
resuspended in Trizol (Life Technologies), passed through a 20-gauge needle to
create a homogenate and flash frozen to store RNA.
Histological analysis
Paraffin embedded liver was sectioned to 5 μm on glass slides and stained with
haematoxylin and eosin (HE) for general histological assessment or with Sirius red
(SR; 0,1 % direct red 80, 1,2 % picric acid in water) to evaluate the degree of
fibrosis.

5
HE staining was done at the Institute for Pathology, Medical Faculty, University of
Ljubljana. Samples were checked for hepatocyte morphology and viability
(apoptosis, mitosis), presence of steatosis, infiltration and localization of immune
cells and ductular abnormalities.
For SR staining, samples were deparaffinized by incubating at 70 °C for 10 min and
sequential washing in Xylene (2x), 100% ethanol, 95% ethanol, 70% ethanol and
water (2x). Glass slides were incubated with SR solution for 1 h and briefly destained
in diluted acetic acid (10 mL concentrated acetic acid in 22 mL water). Afterwards,
samples were dehydrated sequential washing in 70 % ethanol, 95 % ethanol, 100 %
ethanol and Xylene (2x) and fixed with Roti Histokitt II (Carl Roth GmbH + Co. KG,
Germany). Stained samples were qualitatively evaluated for the degree of fibrosis
(score of 0 to 3, with 0 being absent and 3 being very strong with bridging).
Immunohistochemistry
Paraffin embedded liver was sectioned to 4 μm on glass slides. Samples were
deparaffinised and rehydrated, followed by heat-induced epitope retrieval in 0.01 M
citrate buffer (pH = 6) for 20 min in a 900 W microwave oven. After cooling, samples
were incubated in 3% H2O2 in TBS at room temperature (RT) for 10 min to block
endogenous peroxidases and in 5% goat serum (G9023, Sigma-Aldrich, St. Louis,
MO, USA) for 1h at RT to prevent unspecific antibody binding. To stain
cholangiocytes, we used primary rabbit anti-cytokeratin 19 antibodies (LS Bioscience
LS-B5801; dilution 1:500) in 1 % goat serum in 0.1% TBST and incubated overnight
at 4°C. For detection, we used the DAKO EnVision Detection System (K5007,
Agilent Technologies DAKO, Glostrup, Denmark) according to the manufacturer’s
instructions.
6
RNA isolation and cDNA synthesis
Total RNA from Cyp51+/+ and HCyp51-/- mice was isolated using Fuji QuickGene-810
(Fujifilm, Singapore) with the QuickGene Tissue Kit S II according to the
manufacturer’s instructions from cca. 30 mg of frozen liver tissue. RNEasy Mini Kit
(Qiagen) was used in the case of RNA isolation from HRorc-/- and control mice. RNA
concentration was measured using NanoDrop 1000 spectrophotometer (Thermo
Fischer Scientific, Waltham, MA, USA) and quality was checked with Agilent 2100
BioAnalyzer (Agilent Technologies, Santa Clara, CA, USA). Prior to reverse
transcription, RNA was subjected to treatment with DNase I (Roche, Basel,
Switzerland) to limit DNA contamination. Reverse transcription was done from 2 μg
of RNA with Transcriptor Universal cDNA Master (Roche, Basel, Switzerland)
according to manufacturer’s instructions.
Gene expression analysis by qPCR
Gene expression was measured by quantitative reverse transcription polymerase
chain reaction (qRT-PCR) using Roche LightCycler 480 (Roche, Basel, Switzerland).
A minimum of 3 samples per group were used and for each sample 3 technical
replicas were made. The PCR reaction contained: 0.75 μL of cDNA, 0.6 μL of primer
mix (2.5 μM concentration of each primer), 2.5 μL of Sybr Green I Master (Roche,
Basel, Switzerland) and 1.15 μL of PCR grade water, to a final volume of 5 μL per
reaction. The thermocycling program consisted of: 10 min incubation at 95 °C; 45
cycles of 10 s at 95 °C, 20 s at 60 °C and 20 s at 72 °C. Relative expression was
calculated as previously described4. Hmbs and Ppib were chosen as reference
genes for normalization by using the NormFinder5 and BestKeeper6 algorithms.
Primer sequences are listed in a separate table (Supplementary Table 8). One-way
ANOVA was used for analysing data with only one relevant factor. Two-way ANOVA

7
was used to evaluate the effects of multiple factors. Holm-Sidak correction for
multiple comparisons was used and a p value threshold of 0.05 was used as a
measurement of significance.
Protein isolation and Western blot analysis
Total proteins were isolated using lysis buffer (20 mM Tris/HCl pH 7.5, 150 mM
NaCl, 1% NP-40, 5 mM EDTA) containing 1 mM PMSF and cOmplete protease
inhibitor cocktail (Roche, Basel, Switzerland). Approximately 30 mg of tissue was
homogenized in complete lysis buffer and incubated for 2 h at 4°C. Following
centrifugation at 12,000 g, 4°C for 15 min, protein concentration was measured using
PierceTM BCA Protein Assay Kit (Thermo Fischer Scientific, Waltham, MA, USA)
according to manufacturer’s instructions.
Samples were pooled together in equal amounts based on their age, sex and
genotype (except for 9-week HCyp51-/- females, where only 1 sample was obtained)
and mixed with NuPAGE® LDS Sample Buffer (Thermo Fischer Scientific, Waltham,
MA, USA) at a ratio of 1:3. Samples (10 μg per sample pool) were separated on a
12% SDS-PAGE gel and transferred to a PVDF membrane (Immobilon-P
Membranes, Millipore, Billerica, MA, USA). The membrane was blocked using 5%
(w/V) non-fat dry milk in PBST (0.1% Tween 20) for 1 h at room temperature. Next
followed the incubation with anti-mouse-CYP51 antibodies (self-made rabbit
polyclonal antibody against peptide QRLKDSWAERLDFNPDRY; 1:250) and
subsequently with peroxidase conjugated goat anti-rabbit antibodies (A0545, Sigma-
Aldrich, St. Louis, MO, USA; 1:10000). Visualization was done with SuperSignal™
West Pico Chemiluminescent Substrate (Thermo Fischer Scientific, Waltham, MA,
USA) and chemiluminescence recorded using LAS-4000 camera (Fujifilm,

8
Singapore). To control for protein loading, membranes were stained with Ponceau S
solution.
Plasma measurements
Total, HDL and LDL cholesterol, alanine aminotransferase (ALT), aspartate
aminotransferase (AST), direct and total bilirubin were analysed by Veterinarska
ambulanta BTC (Ljubljana, Slovenia) with Architect ci8200 analyser (Abbott
Diagnostics, Abbott Park, IL, USA), >5 samples per group. Concentrations of lipid
parameters are given in mmol/L, direct bilirubin in μmol/L and the activity of
aminotransferases was measured as µkat/L. Two-way ANOVA was used to evaluate
the effects of multiple factors (e.g. age and genotype). Holm-Sidak correction for
multiple comparisons was used and a p-value threshold of 0.05 was used as a
measurement of significance.
Total sterol extraction and GC/MS analysis
Sterols extraction from frozen liver and coupled gas chromatography/mass
spectrometry (GC/MS) analysis were conducted as previously described7, 8. A
minimum of 3 samples per group were analysed. Sterol amounts are expressed as
ng of compound per mg of wet liver tissue. One-way ANOVA was used to analysing
the impact of one factor (e.g. genotype) and two-way ANOVA for multiple factors
(e.g. age and genotype). Holm-Sidak correction for multiple comparisons was used
and a p-value threshold of 0.05 was used as a measurement of significance.
Microarray-based gene expression profiling
We used 30 Affymetrix GeneChip® Mouse Gene 2.0 ST Arrays (Affymetrix, Santa
Clara, CA, USA), with 2 chips per group (age-sex-genotype) in the case of control
and HCyp51-/- mice on the wild type background and 3 in the case of runts on the wild

9
type background. The experiment was performed as previously described 3. Briefly,
250 ng of starting RNA with a RIN > 8.0 was reverse transcribed as per
manufacturer’s instructions. After a 16 h hybridization step at 45°C, arrays were
washed and stained on GeneChip Fluidics Station 450 and subsequently scanned
on Affymetrix GeneChip Scanner 3000 7G. Image analysis and quality check were
done using Affymetrix Expression Console™ version 1.3.
Quality check and gene expression analysis were done using R and Bioconductor
packages. Quality control and RMA-based normalization of gene expression data
were performed using xps package9. Raw (CEL) as well as normalized data were
deposited to GEO under accession number GSE78892. Package limma10 was used
to infer differential expression of genes and enrichment of gene sets using three
predictor variables (age, sex and genotype) and their interactions (age x genotype,
age x sex, sex x genotype). Gene sets were constructed using KEGG pathways11
and TRANSFAC database12. Sets containing over 5 elements were tested for
enrichment using the PGSEA package13. In the case of transcription factor
enrichment, factors were merged based on their ID irrespective of their binding sites.
For RORC and RORA, target genes were updated based on the literature14-16
(RORalpha – original gene set based on TRANSFAC; Rora – updated gene set).
False discovery rate (FDR) was used to account for multiple hypothesis testing.
Significance level α = 0.05 was used to control the rate of Type I error for the
differential gene expression as well as for the pathway enrichment. The network
diagram (Supplementary Fig. 3) was created using Cytoscape program17 and
ClueGo plugin18. Analysis of KEGG pathways with kappa score set to 0.2. Gene set
enrichment on the proposed RORC target genes was conducted using the FIDEA
tool19. The Interactome tool20, 21 was used on selected up- or downregulated

10
enriched transcription factors to evaluate their interaction and identify central nodes
of regulation.
Library construction and sequencing
RNASeq libraries were prepared using the Illumina TruSeq Stranded Total RNA
library prep, with Ribozero Gold, starting from 500 ng of total RNA, following the
manufacturer’s protocol, with the exception that 13 cycles of PCR were performed to
amplify the libraries, to keep the duplication rate lower than with the recommended
15 cycles. The amplified libraries were purified using AMPure beads, quantified by
Qubit and QPCR, and visualized in an Agilent Bioanalyzer. The libraries were pooled
equimolarly, and loaded at 8 pM, on high output HiSeq 2500 flow cells, using v4
reagents, as paired 50 nucleotide reads. Libraries were pooled and distributed
uniformly across 3 lanes in order to generate 60-80 million reads per sample.
RNA-Seq Analysis
RNA-seq alignments were performed using STAR (v2.4.2a modified)22. Alignments
were filtered to remove those having a quality score less than 30; subsequently
reads mapping to exons were counted using featureCounts (v1.4.6)23 and
summarized by gene. TDF views (IGV v2.3.32)24 were generated from the quality
filtered alignments. The UCSC genes annotation (May 23, 2014)25, and primary
assembly (Dec. 2011 GRCm38/mm10)26, for mm10 were obtained from iGenomes
(https://support.illumina.com/sequencing/sequencing_software/igenome.html), and
were used respectively as annotation and reference genome. Where parameters are
not explicitly stated below, defaults of the specified software versions were applied.
DESeq227 for R was used to normalize the counts and infer gene differential
expression.

11
PARAMETERS:
STAR --outFilterType BySJout --outFilterMultimapNmax 20 --alignSJoverhangMin 8 --alignSJDBoverhangMin 1 --outFilterMismatchNmax 999 --outFilterMismatchNoverLmax 0.04 --alignIntronMin 20 --alignIntronMax 1000000 --alignMatesGapMax 1000000 featureCounts -t exon -g gene_id

12
Supplementary references
1. Keber, R. et al. Mouse knockout of the cholesterogenic cytochrome P450
lanosterol 14alpha-demethylase (Cyp51) resembles Antley-Bixler syndrome. J
Biol Chem 286, 29086-29097 (2011).
2. Lewinska, M. et al. Hidden disease susceptibility and sexual dimorphism in
the heterozygous knockout of cyp51 from cholesterol synthesis. PLoS One 9,
e112787 (2014).
3. Lorbek, G. et al. Lessons from hepatocyte-specific cyp51 knockout mice:
impaired cholesterol synthesis leads to oval cell-driven liver injury. Sci Rep 5,
8777 (2015).
4. Vandesompele, J. et al. Accurate normalization of real-time quantitative RT-
PCR data by geometric averaging of multiple internal control genes. Genome
Biol 3, RESEARCH0034 (2002).
5. Andersen, C.L., Jensen, J.L. & Orntoft, T.F. Normalization of real-time
quantitative reverse transcription-PCR data: a model-based variance
estimation approach to identify genes suited for normalization, applied to
bladder and colon cancer data sets. Cancer Res 64, 5245-5250 (2004).
6. Pfaffl, M.W., Tichopad, A., Prgomet, C. & Neuvians, T.P. Determination of
stable housekeeping genes, differentially regulated target genes and sample
integrity: BestKeeper--Excel-based tool using pair-wise correlations.
Biotechnol Lett 26, 509-515 (2004).
7. Lorbek, G., Perse, M., Horvat, S., Bjorkhem, I. & Rozman, D. Sex differences
in the hepatic cholesterol sensing mechanisms in mice. Molecules 18, 11067-
11085 (2013).

13
8. Acimovic, J. et al. Combined gas chromatographic/mass spectrometric
analysis of cholesterol precursors and plant sterols in cultured cells. J
Chromatogr B Analyt Technol Biomed Life Sci 877, 2081-2086 (2009).
9. Stratowa, C., Edn. R package version 1.30.0 (
10. Smyth, G.K. Linear models and empirical bayes methods for assessing
differential expression in microarray experiments. Stat Appl Genet Mol Biol 3,
Article3 (2004).
11. Kanehisa, M. & Goto, S. KEGG: kyoto encyclopedia of genes and genomes.
Nucleic Acids Res 28, 27-30 (2000).
12. Matys, V. et al. TRANSFAC and its module TRANSCompel: transcriptional
gene regulation in eukaryotes. Nucleic Acids Res 34, D108-110 (2006).
13. Furge, K. & Dykema, K., Edn. R package version 1.44.0 (
14. Takeda, Y., Jothi, R., Birault, V. & Jetten, A.M. RORgamma directly regulates
the circadian expression of clock genes and downstream targets in vivo.
Nucleic Acids Res 40, 8519-8535 (2012).
15. Takeda, Y. et al. Retinoic acid-related orphan receptor gamma (RORgamma):
a novel participant in the diurnal regulation of hepatic gluconeogenesis and
insulin sensitivity. PLoS Genet 10, e1004331 (2014).
16. Takeda, Y. et al. Retinoid acid-related orphan receptor gamma, RORgamma,
participates in diurnal transcriptional regulation of lipid metabolic genes.
Nucleic Acids Res 42, 10448-10459 (2014).
17. Shannon, P. et al. Cytoscape: a software environment for integrated models
of biomolecular interaction networks. Genome Res 13, 2498-2504 (2003).

14
18. Bindea, G. et al. ClueGO: a Cytoscape plug-in to decipher functionally
grouped gene ontology and pathway annotation networks. Bioinformatics 25,
1091-1093 (2009).
19. D'Andrea, D., Grassi, L., Mazzapioda, M. & Tramontano, A. FIDEA: a server
for the functional interpretation of differential expression analysis. Nucleic
Acids Res 41, W84-88 (2013).
20. Neph, S. et al. Circuitry and dynamics of human transcription factor regulatory
networks. Cell 150, 1274-1286 (2012).
21. Stergachis, A.B. et al. Conservation of trans-acting circuitry during
mammalian regulatory evolution. Nature 515, 365-370 (2014).
22. Dobin, A. et al. STAR: ultrafast universal RNA-seq aligner. Bioinformatics 29,
15-21 (2013).
23. Liao, Y., Smyth, G.K. & Shi, W. featureCounts: an efficient general purpose
program for assigning sequence reads to genomic features. Bioinformatics
30, 923-930 (2014).
24. Robinson, J.T. et al. Integrative genomics viewer. Nature biotechnology 29,
24-26 (2011).
25. Meyer, L.R. et al. The UCSC Genome Browser database: extensions and
updates 2013. Nucleic Acids Res 41, D64-69 (2013).
26. Mouse Genome Sequencing, C. et al. Initial sequencing and comparative
analysis of the mouse genome. Nature 420, 520-562 (2002).
27. Love, M.I., Huber, W. & Anders, S. Moderated estimation of fold change and
dispersion for RNA-seq data with DESeq2. Genome Biol 15, 550 (2014).

15
16
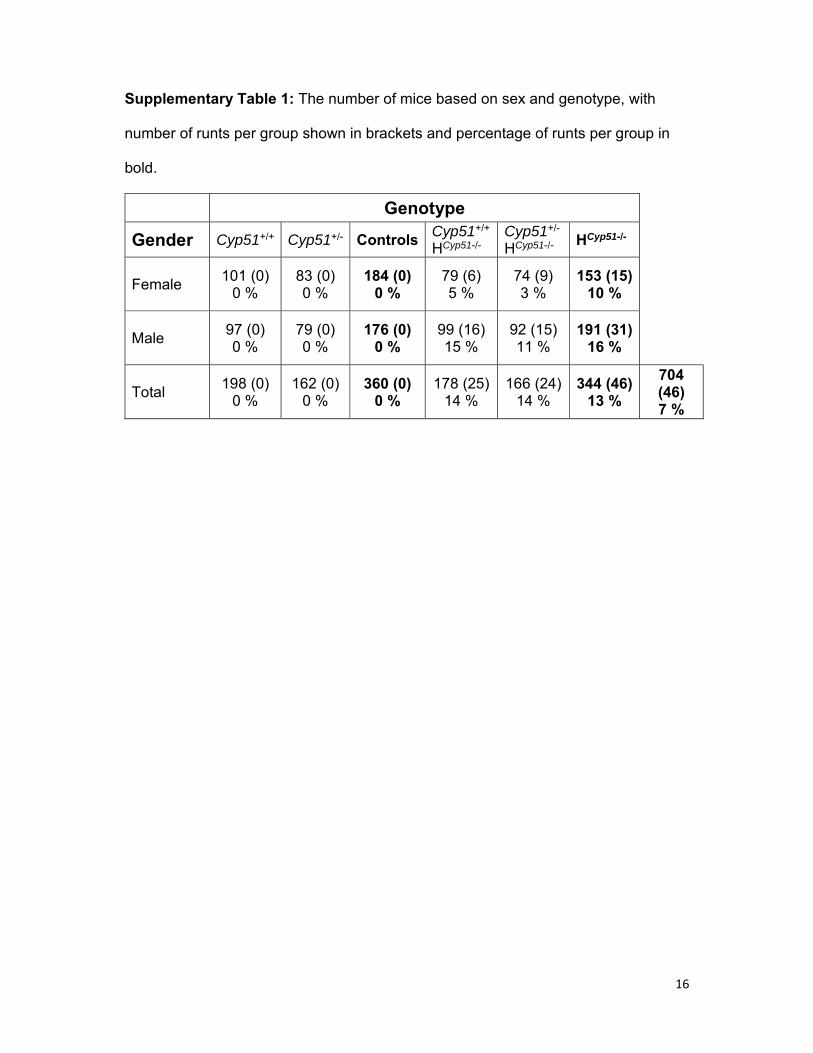
Supplementary Table 1: The number of mice based on sex and genotype, with
number of runts per group shown in brackets and percentage of runts per group in
bold.
Genotype
Gender Cyp51+/+ Cyp51+/- ControlsCyp51+/+ HCyp51-/-
Cyp51+/- HCyp51-/-
HCyp51-/-
Female 101 (0)
0 % 83 (0) 0 %
184 (0) 0 %
79 (6) 5 %
74 (9) 3 %
153 (15) 10 %
Male 97 (0) 0 %
79 (0) 0 %
176 (0) 0 %
99 (16) 15 %
92 (15) 11 %
191 (31) 16 %
Total 198 (0)
0 % 162 (0)
0 % 360 (0)
0 % 178 (25)
14 % 166 (24)
14 % 344 (46)
13 %
704 (46) 7 %
17
Supplementary Table 2: A list of differentially expressed genes with the
corresponding log-fold change (logFC) and adjusted p-values comparing HCyp51-/- and
control mice on the Cyp51+/+ background by genotype or by sex at 3, 6 and 19
weeks of age. Runt mice are compared to 6-week Cyp51+/+ mice. HRorc-/- mice were
compared with controls based on genotype or based on the isolation time (ZT7=day;
ZT19=night). An empty list signifies that no differentially expressed genes were
found for the selected comparison.
Supplementary Table 3: A list of enriched KEGG pathways with the corresponding
logFC and adjusted p-values comparing HCyp51-/- and control mice on the Cyp51+/+
background by genotype or by sex at 3, 6 and 19 weeks of age. Runt mice were
compared to 6-week Cyp51+/+ mice. HRorc-/- mice are compared with controls based
on genotype or based on the isolation time (ZT7=day; ZT19=night). An empty list
signifies that no enriched pathways were found for the selected comparison.
Supplementary Table 4: A list of enriched transcription factors with the
corresponding logFC and adjusted p-values comparing HCyp51-/- and control mice on
the Cyp51+/+ background by genotype or by sex at 3, 6 and 19 weeks of age. Runt
mice were compared to 6-week Cyp51+/+ mice. HRorc-/- mice are compared with
controls based on genotype or based on the isolation time (ZT7=day; ZT19=night).
An empty list signifies that no enriched transcription factors were found for the
selected comparison.
Supplementary Table 5: Overlapping differentially expressed genes (p<0.05) for
comparisons A-H based on Figure 8 with appropriate fold-change values.
18
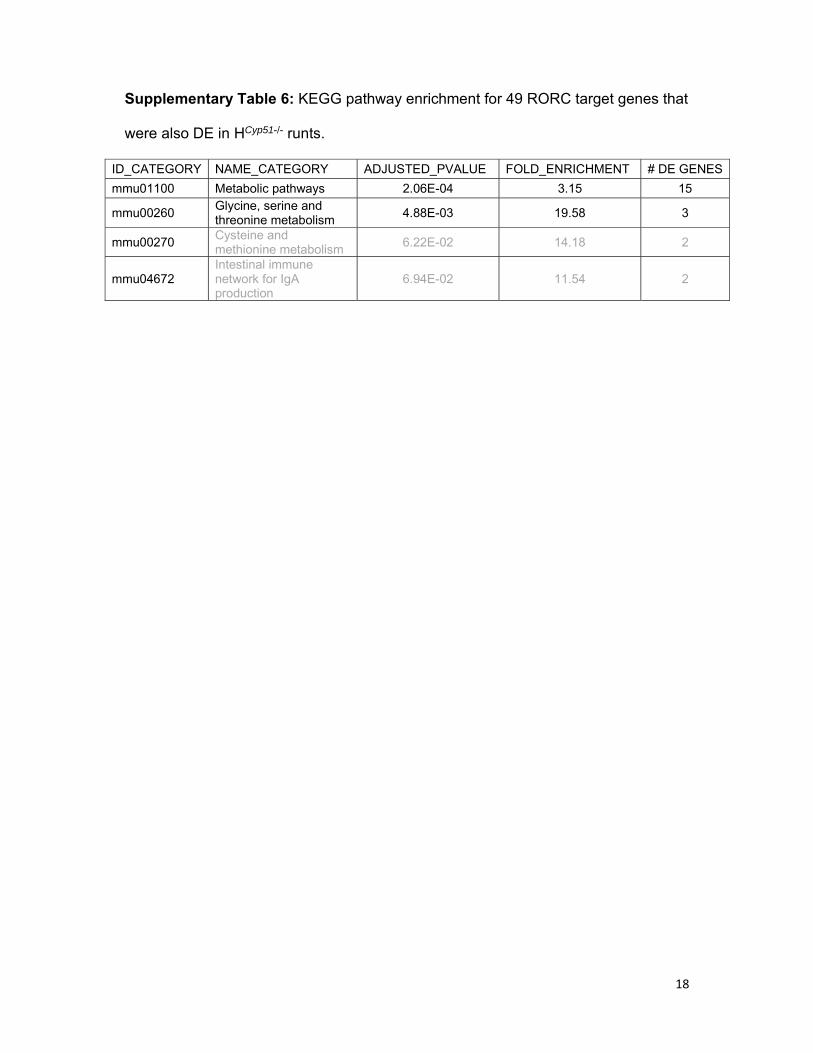
Supplementary Table 6: KEGG pathway enrichment for 49 RORC target genes that
were also DE in HCyp51-/- runts.
ID_CATEGORY NAME_CATEGORY ADJUSTED_PVALUE FOLD_ENRICHMENT # DE GENES
mmu01100 Metabolic pathways 2.06E-04 3.15 15
mmu00260 Glycine, serine and threonine metabolism
4.88E-03 19.58 3
mmu00270 Cysteine and methionine metabolism
6.22E-02 14.18 2
mmu04672 Intestinal immune network for IgA production
6.94E-02 11.54 2

19
Supplementary Table 7: Gene ontology (GO) biological process enrichment for 49
RORC target genes that were also DE in HCyp51-/- runts.
ID_CATEGORY NAME_CATEGORY #DE GENES
FOLD_ENRICHMENT ADJUSTED_PVALUE
GO:0009069 serine family amino acid metabolic process
3 33.47 3.42E-02
GO:0006565 L-serine catabolic process 2 215.73 3.42E-02
GO:0006082 organic acid metabolic process
9 5.17 3.42E-02
GO:0009063 cellular amino acid catabolic process
4 19.61 3.42E-02
GO:0046335 ethanolamine biosynthetic process
2 129.44 3.42E-02
GO:0042866 pyruvate biosynthetic process
2 129.44 3.42E-02
GO:0006646 phosphatidylethanolamine biosynthetic process
2 129.44 3.42E-02
GO:0006580 ethanolamine metabolic process
2 107.86 4.37E-02
GO:0043436 oxoacid metabolic process 8 4.72 4.64E-02
GO:0006563 L-serine metabolic process
2 80.9 4.64E-02
GO:1901162 primary amino compound biosynthetic process
2 80.9 4.64E-02
GO:0044281 small molecule metabolic process
13 3.01 4.64E-02
GO:0046337 phosphatidylethanolamine metabolic process
2 92.45 4.64E-02
GO:0019752 carboxylic acid metabolic process
8 4.72 4.64E-02
GO:0042180 cellular ketone metabolic process
8 4.56 5.09E-02
GO:0006520 cellular amino acid metabolic process
5 8.25 5.18E-02
GO:0051917 regulation of fibrinolysis 2 64.72 6.12E-02
GO:0046395 carboxylic acid catabolic process
4 10.7 6.86E-02
GO:0016054 organic acid catabolic process
4 10.7 6.86E-02
GO:0009070 serine family amino acid biosynthetic process
2 53.93 7.59E-02
GO:0009071 serine family amino acid catabolic process
2 46.23 9.93E-02

20
Supplementary Table 8: A list of used RT-qPCR primers and their respective
sequences.
Gene name
Sequence Sense Antisense
Hmbs TCCCTGAAGGATGTGCCTA AAGGGTTTTCCCGTTTGC Ppib GGAGATGGCACAGGAGGAAA CGTAGTGCTTCAGTTTGAAGTTCTCyp51 ACGCTGCCTGGCTATTGC TTGATCTCTCGATGGGCTCTATCRora TTACGTGTGAAGGCTGCAAG GGAGTAGGTGGCATTGCTCT Rorc ACCTCTTTTCACGGGAGCA TCCCACATCTCCCACATTG Avpr1a GGGATACCAATTTCGTTTGG AAGCCAGTAACGCCGTGAT Lipc ACAAGGCGTGGGAACAGA TGGCTTCTTTAATGGCTTGC

21
Supplementary Figure 1: Schematic representation of the experimental design.
Mice of both sexes and the four genotypes were euthanized at the designated time
points (0, 3, 6, 9 and 19 weeks). Runt mice were present only in the Cyp51 knockout
group, regardless of the Cyp51 background. They appeared at 4–10 weeks of age
and died or were euthanized at reasonably/humanely set time points.

22
Supplementary Figure 2: Network of related KEGG pathways in HCyp51-/- runts.
KEGG pathway enrichment was done using Cytoscape and ClueGO plugin as
described in the supplementary methods section. Orange colour depicts upregulated
pathways, blue downregulated. Circle size correlates with the significance level
(p<0.05 in all nodes). Colour intensity correlates to the overlap between the listed DE
genes and the genes in a given pathway. Line width correlates with the degree of
connectivity between the corresponding terms.

23
Supplementary Figure 3: Overview of the effects of hepatocyte Cyp51
disruption on liver development. Schematic representation of the progressive
changes observed during the development of the HCyp51-/- mice (orange lines) in
comparison with controls (blue dashed lines). H, histological features; S, liver sterol
concentrations; GE, changes in gene expression.

24
Supplementary Figure 4: The impact of Cyp51 disruption on liver homeostasis.
Shown is the proposed mechanism of disease development in HCyp51-/- mice and the
interaction between cholesterol synthesis and RORC pathways. AA – amino acid; FA
– fatty acid.
25
Supplementary Figure 5: The impact of Cyp51 background on hepatic Cyp51
gene expression. A comparison of the relative Cyp51 expression between control,
HCyp51-/- and runt mice on the wild type (Cyp51+/+) and heterozygous (Cyp51+/-)
background at different ages (n ≥ 4). Columns depict means and error bars
represent SEM.