Summer 2017 Nonprofit Fundraising Study (NFS)€¦ · Summer 2017 Nonprofit Fundraising Study (NFS)...
25
Summer 2017 Nonprofit Fundraising Study (NFS) Charitable Receipts at Nonprofit Charitable Organizations in the first half of 2017 in the United States and Canada Plus What Nonprofits are Doing to Reach People of Different Generations A Study From
Transcript of Summer 2017 Nonprofit Fundraising Study (NFS)€¦ · Summer 2017 Nonprofit Fundraising Study (NFS)...
Summer 2017 Nonprofit Fundraising Study (NFS)Charitable Receipts at Nonprofit Charitable Organizations in the first half of 2017 in the United States and Canada
Plus What Nonprofits are Doing to Reach People of Different Generations
A Study From

i | Nonprofit Fundraising Survey October 2017
AcknowledgementsThe Nonprofit Research Collaborative (NRC) thanks all respondents who took the survey in August
and September 2017. Your willingness to share information about your organization makes it possible
for this report to appear.
Members of the Nonprofit Research Collaborative are
© Summer 2017 Nonprofit Fundraising Survey
Nonprofit Research Collaborative
PowerPoint slides with the graphs are also available, at npresearch.org for a small fee.
Project management by
For permission to cite or reproduce, please contact Melissa Brown at [email protected]. This
report, PowerPoint slides based on graphics in this report, infographics on selected NRC findings,
and links to earlier reports can be found at www.NPResearch.org.
2 | Nonprofit Fundraising Survey October 2017
Contents
WHAT WE STUDIED ..................................................................................................................................... 1
STRONG RESULTS MID-YEAR SUGGEST A GOOD YEAR OVERALL .....................................................2
Nearly 6 in 10 organizations saw an increase in charitable receipts ................................................................ 2
Historically at mid-year a lower percentage report increased charitable revenue than we see by year-end .................................................................................................................................. 2
Mid-year results average 9 pts lower than year-end findings ............................................................................3
Smallest organizations continued to struggle to increase charitable revenue ............................................3
There were no differences by region of the U.S. or between U.S. and Canada ...........................................4
Half or more of organizations of all types, except religion, reported increased charitable revenue from January to June 2017 ........................................................................................................5
THREE-QUARTERS OF CHARITIES REPORTED BEING ON-TRACK TO MEET THEIR 2017 FUNDRAISING GOAL .............................................................................................6
Historically, the share mid-year that are on-track to meet goal is very close to year-end result .....................................................................................................................................................6
Larger charities were more likely to be on track to meet goal than were the smallest organizations ................................................................................................................................................ 7
Based on percentage on track to meet goals, the U.S. West led ...................................................................... 7
Arts organizations were more likely to be struggling to meet goal as of mid-2017 ..................................8
Percentage of organizations reporting increased revenue is lower in 2017 for nearly all methods when compared to prior years ............................................................................................... 10
RESULTS FOR METHODS TO REACH DIFFERENT GENERATIONS ...................................................... 11
Three-quarters (76%) reported adapting some fundraising method(s) to reach people of different generations. ........................................................................................................................11
Tactics range from 32% creating a “Young Professionals” group to 78% using photos in printed materials .............................................................................................................................................12
Small organizations are more likely to be reaching out for volunteers in the younger generation(s) ......................................................................................................................................................12
By sub-sector, Health organizations are most likely to be engaging in numerous approaches to reach different generations ..............................................................................................................13
Response to fundraising methods appears to be driven by the individual, not the generation ............................................................................................................................................................. 14
CONCLUSION .............................................................................................................................................. 15
METHODOLOGY ......................................................................................................................................... 16
ABOUT THE NONPROFIT RESEARCH COLLABORATIVE .................................................................... 21
1 | Nonprofit Fundraising Survey October 2017
WHAT WE STUDIEDThe Nonprofit Research Collaborative (NRC) asks the same questions twice a year, and each
time, adds question on a special topic. This report covers the survey that was in the field in late
August and early September 2017.
Regular questions ask participants to compare fundraising results with the prior year
at the same timeThe NRC’s regular questions ask study participants to report their fundraising receipts com-
pared with a year previously. For the survey we sent out in August 2017, we asked organiza-
tions about charitable receipts for January through June. This excludes any disaster giving
that might have occurred from Hurricane Harvey and later events, in August and September.
The regular questions asked about total fundraising receipts, whether the organization is on
track to meet its fundraising goal, and whether receipts are increased, decreased, or the same
by different fundraising approaches. The approaches ranged from major gifts and board giving
to online giving and corporate funding.
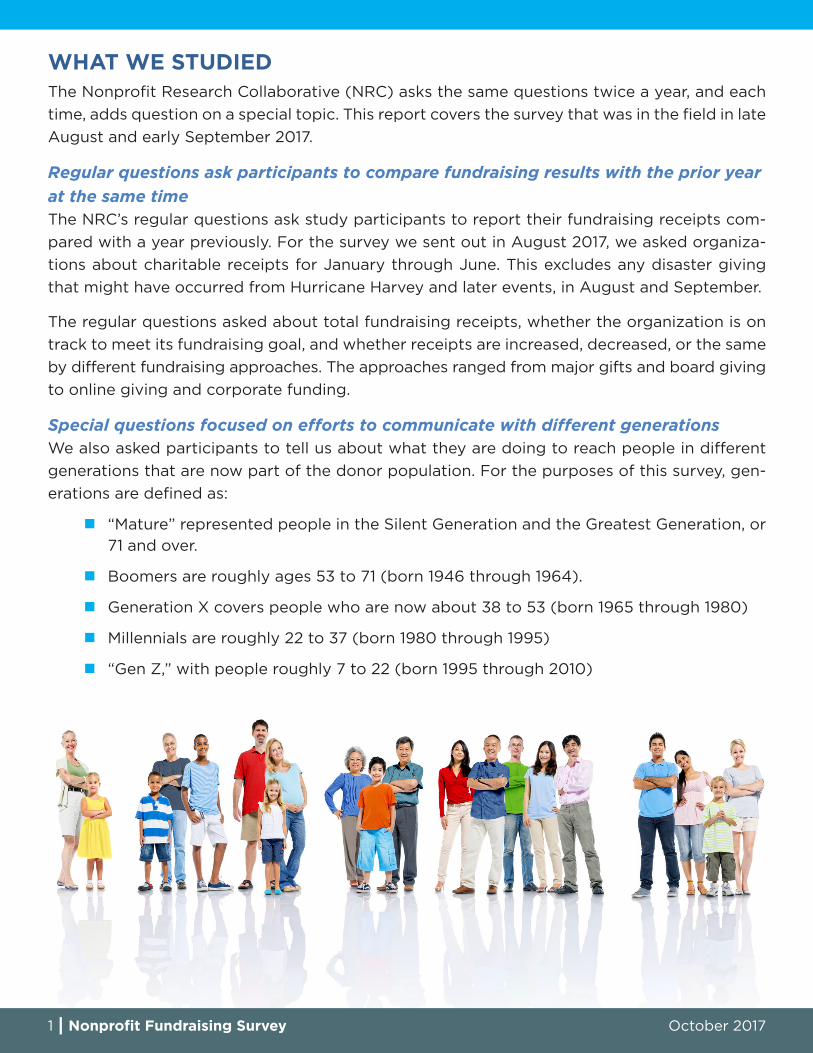
Special questions focused on efforts to communicate with different generationsWe also asked participants to tell us about what they are doing to reach people in different
generations that are now part of the donor population. For the purposes of this survey, gen-
erations are defined as:
n “Mature” represented people in the Silent Generation and the Greatest Generation, or
71 and over.
n Boomers are roughly ages 53 to 71 (born 1946 through 1964).
n Generation X covers people who are now about 38 to 53 (born 1965 through 1980)
n Millennials are roughly 22 to 37 (born 1980 through 1995)
n “Gen Z,” with people roughly 7 to 22 (born 1995 through 2010)

2 | Nonprofit Fundraising Survey October 2017
Decreased20%
Stayed the same23%
Increased57%
Nearly 6 in 10
organizations saw an
increase in charitable
revenue in the first
half of 2017.
STRONG RESULTS MID-YEAR SUGGEST A GOOD YEAR OVERALLThe NRC began its mid-year surveys in 2011. Consistently since then, the share of organiza-
tions with an increase in charitable revenue has been lower in summer than we see in the end-
of-year survey conducted after December. The results suggest that, even before any disaster
relief giving that has occurred since the survey, 2017 will finish strong for charitable fundraising.
Historically, at
mid-year a lower
percentage report
increased charitable
revenue than we
see by year-end.44%
46%
58%
52%
59%
49%*
53%
58%
62%
65%
65%
60%
2011
2012
2013
2014
2015
2016% with increased receipts by year-end
% with increased receipts mid-year
The NRC began asking about mid-year results in 2011. For every year, the
share of organizations with an increase in charitable revenue as of June
has been lower than the percentage of organizations that report a
growth in charitable revenue by December. The average gap is 9 per-
centage points, although the range is from 4 points to 13 points.
* In 2016, the NRC believes—but cannot prove—that there was an effect due to the U.S. elections.
3 | Nonprofit Fundraising Survey October 2017
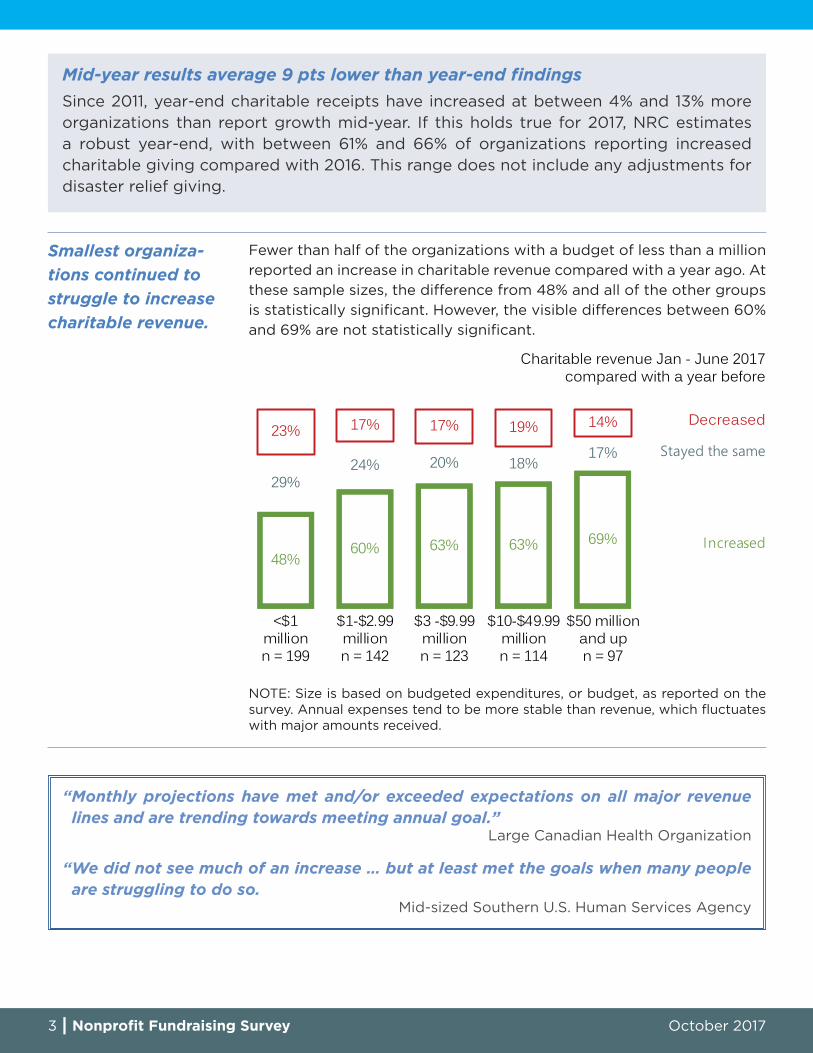
Mid-year results average 9 pts lower than year-end findings
Since 2011, year-end charitable receipts have increased at between 4% and 13% more organizations than report growth mid-year. If this holds true for 2017, NRC estimates a robust year-end, with between 61% and 66% of organizations reporting increased charitable giving compared with 2016. This range does not include any adjustments for disaster relief giving.
“ Monthly projections have met and/or exceeded expectations on all major revenue lines and are trending towards meeting annual goal.”
Large Canadian Health Organization
“ We did not see much of an increase … but at least met the goals when many people are struggling to do so.
Mid-sized Southern U.S. Human Services Agency
Smallest organiza-
tions continued to
struggle to increase
charitable revenue.
Fewer than half of the organizations with a budget of less than a million
reported an increase in charitable revenue compared with a year ago. At
these sample sizes, the difference from 48% and all of the other groups
is statistically significant. However, the visible differences between 60%
and 69% are not statistically significant.
NOTE: Size is based on budgeted expenditures, or budget, as reported on the survey. Annual expenses tend to be more stable than revenue, which fluctuates with major amounts received.
Decreased
Stayed the same
Increased
Charitable revenue Jan - June 2017 compared with a year before
48%60% 63% 63% 69%
29%24% 20% 18%
17%23% 17% 17% 19% 14%
<$1millionn = 199
$1-$2.99millionn = 142
$3 -$9.99millionn = 123
$10-$49.99millionn = 114
$50 millionand upn = 97

4 | Nonprofit Fundraising Survey October 2017
“ Our fund raising goal for 2017 is DOUBLE what it was in 2016. To date, we are at 53% of our goal - and, typically, 60 -70% of our annual revenue is received in the last quarter of the year. So, Lord willing, we will achieve our goal for 2017.”
Small, Midwestern U.S. Human Services Charity
There were no
differences by
region of the U.S.
or between U.S.
and Canada.
Across all four Census regions in the United States and compared with
Canada, roughly equal shares of organizations reported receiving more
charitable revenue compared with a year ago.
Decreased
Stayed the same
Increased
Charitable revenue Jan - June 2017 compared with a year before
58% 57% 62% 60% 63%
19% 26% 19% 26% 16%
23% 17% 18% 15% 20%
U.S.Northeast
n = 120
U.S. Southn = 204
U.S.Midwestn = 157
U.S. Westn = 137
Canadan = 79
“ Most of our money comes in the last quarter of the year but we are moving forward with everything we planned and so far we are expecting to meet or exceed last year’s numbers.”
Small Western Public-Society Benefit Organization

5 | Nonprofit Fundraising Survey October 2017
Half or more of
organizations of
all types, except
religion, reported
increased charitable
revenue from
January to
June 2017.
Statistically, the percentages of organizations by subsector that reported
increased charitable revenue are the same except for religion. However,
the number of study participants from religious organizations is too low
to draw a firm conclusion. The figure below shows only the percentages
reporting an increase in charitable revenue.
58% 65% 70% 62% 58% 56% 54% 50%37%
18%20%
17%19% 27%
22% 29%21%
30%
24%16% 13% 19% 15% 22% 18%
29% 33%
Artsn = 79
Educationn =161
EnvironmentAnimalsn = 46
Healthn = 127
HumanServicesn = 190
Inter-national
n = 10
Grants,volunteers
n= 28
Publicsocietybenefitn = 34
Religionn = 27
Note: Results from fewer than 30 organizations should be used with caution.

6 | Nonprofit Fundraising Survey October 2017
THREE-QUARTERS OF CHARITIES REPORTED BEING ON-TRACK TO MEET THEIR 2017 FUNDRAISING GOALNot all organizations seek to increase charitable revenue every year. Some end campaigns and
lower their overall goals. Others might change fundraising tactics and adjust goals to reflect
those shifts. For summer 2017, 75% of participating organizations report being on track to meet
their fundraising goal.
Historically, the
share mid-year that
are on-track to meet
goal is very close to
year-end result.
In past years, the percentage reporting that they are “on-track” to meet
their total fundraising goal is very close to the percentage that report
actually meeting the goal once the year is ended. The NRC has tracked
this for 2013 through 2016.
Among organizations that say they are not on track to meet goal, several
mentioned staff turnover and others identified increased goals because
of changes in government funding or other reductions in expected
revenue (grants not received, events that generated less than planned,
or board members giving less than projected).
67%
70%
74%
71%
75%
67%
73%
73%
75%
2013
2014
2015
2016
2017 On-track to meet goal as of mid-year
“ We have a very small staff and there isn’t one person dedicating all his/her time to fundraising.”
Small Northeastern U.S. Arts & Cultural Organization
“ The financial fundraising objective has increased dramatically because of a govern-ment grant that requires matching.”
Large Canadian Health Organization
7 | Nonprofit Fundraising Survey October 2017
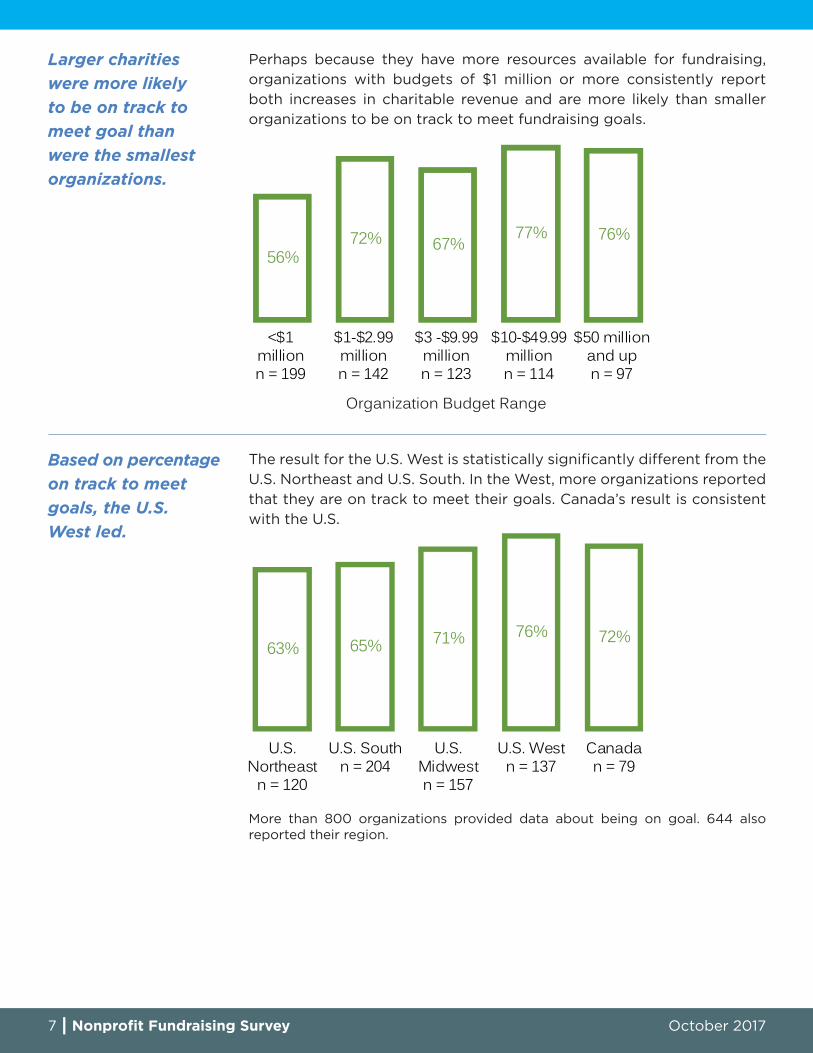
Larger charities
were more likely
to be on track to
meet goal than
were the smallest
organizations.
Perhaps because they have more resources available for fundraising,
organizations with budgets of $1 million or more consistently report
both increases in charitable revenue and are more likely than smaller
organizations to be on track to meet fundraising goals.
56%72% 67% 77% 76%
<$1millionn = 199
$1-$2.99millionn = 142
$3 -$9.99millionn = 123
$10-$49.99millionn = 114
$50 millionand upn = 97
Organization Budget Range
Based on percentage
on track to meet
goals, the U.S.
West led.
The result for the U.S. West is statistically significantly different from the
U.S. Northeast and U.S. South. In the West, more organizations reported
that they are on track to meet their goals. Canada’s result is consistent
with the U.S.
More than 800 organizations provided data about being on goal. 644 also reported their region.
63% 65% 71% 76% 72%
U.S.Northeast
n = 120
U.S. Southn = 204
U.S.Midwestn = 157
U.S. Westn = 137
Canadan = 79

8 | Nonprofit Fundraising Survey October 2017
Arts organizations
were more likely to
be struggling to meet
goal as of mid-2017.
Just over 6 in 10 arts organizations (61%) said they were on track
to meet their fiscal year 2017 fundraising goal, compared with the
next-highest share of 69% of human services charities. This difference
meets tests for statistical significance and is based on sample sizes
above 30.
Note: Results from fewer than 30 organizations are not shown.
Artsn = 79
Educationn =161
EnvironmentAnimalsn = 46
Healthn = 127
HumanServicesn = 190
61%76% 72% 72% 69%

9 | Nonprofit Fundraising Survey October 2017
RESULTS BY FUNDRAISING METHODSThe NRC survey asks each participant to report whether charitable revenue has increased,
stayed the same, or decreased based on various approaches or fundraising strategies. For the
summer 2017 survey, the questions were limited to nine possibilities, because several “tech-
nology aided” approaches were combined into “Online giving.”
Charitable revenue
from major gifts
increased at half
of the survey
organizations.
Most organizations use a range of fundraising approaches. From January
through June 2017, only one method—major gifts—generated increased
revenue at half of the responding charities. Event revenue and online
giving increased at 47% and 48% of participating charities, respectively.
50%34% 39% 38% 35%
47% 48% 39%28%
33%52% 41% 46% 44%
33%45%
44%52%
18% 14% 20% 16% 21% 20%7% 17% 20%
Maj
or G
ifts
Boar
d
Bequ
ests
rece
ived
Plan
ned
gift
com
mitm
ents
Dire
ct m
ail
Even
ts
Onl
ine
givi
ng
Foun
datio
ns
Cor
pora
tions

10 | Nonprofit Fundraising Survey October 2017
Percentage of orga-
nizations reporting
increased revenue
is lower in 2017 for
nearly all methods
when compared to
prior years.
In the mid-year survey, the NRC has asked about changes in charitable
revenue received by fundraising method in some years but not all years.
We can compare 2017 mid-year results with 2013, 2014, and 2015. Except
for online giving, which shows results in 2017 that are similar to those
earlier, in 2017, fewer participating organizations reported increased
charitable revenue for major gifts, special event, bequests and other
types of fundraising studied.
25%
30%
35%
40%
45%
50%
55%
60%
2013 2014 2015 2017
Perc
enta
ge re
port
ing
incr
ease
d re
venu
e by
met
hod
Major gifts
Special events
Planned giving
Foundation grants
Direct mail
Board giving
Corporate giving
Sample sizes and distribution by size of organization remained similar
for 2015 and 2017, suggesting that the differences cannot be traced to
the size of organizations or the number of the organizations that partic-
ipated in the study.
All of the differences shown from 2015 to 2017 meet tests for statistical
significance.
% REPORTING INCREASED CHARITABLE REVENUE FROM
Method/Vehicle 2013 2014 2015 2017
Major gifts 50% 48% 54% 50%
Special events 56% 54% 53% 47%
Direct mail 40% 40% 43% 35%
Board giving 42% 40% 41% 34%
Bequests received 41% 42% 47% 39%
Foundation grants 43% 43% 49% 39%
Corporate giving 39% 38% 44% 28%
The NRC asks only
whether receipts are
increased, decreased
or the same. We do
not ask about the
magnitude of change.
Thus a large increase
in any one category
can increase the total.
11 | Nonprofit Fundraising Survey October 2017
RESULTS BY METHODS TO REACH DIFFERENT GENERATIONSThe NRC asked survey participants about what generations they want to reach and the specific
methods they use with the intent to reach those generations. This is a baseline report, the
first of its kind to ascertain exactly what communications tools and tactics are being used
sector-wide.
Boomers are the single generation most likely to be the focus of charitable organizations’
communications as of mid-2017. This fits other research that shows that Boomers currently
control a significant portion of discretionary income and a large portion of the wealth of the
country.
There are differences in the tactics used for the various generations but few of those differ-
ences are strongly associated with more successful fundraising from the generation.
Overall organizations use a range of channels and messaging to reach donors of all types and
interests.
Three-quarters (76%)
reported adapting
some communica-
tions method(s)
to reach people of
different generations.
33% sought to reach people age 70 and over.
50% of the respondents deliberately implemented
tactics to reach Boomers.
36% worked to reach Generation X.
24% had initiatives to reach Millennials
10% had strategies to engage so-called “Gen Z”
(born roughly 2000 and later).
A high percentage of organizations in this study use many of the tactics generally, not
to reach a specific generation or two. Among the methods used, the most frequent is using
photographs in printed materials. The results are shown in the figure that follows.
12 | Nonprofit Fundraising Survey October 2017
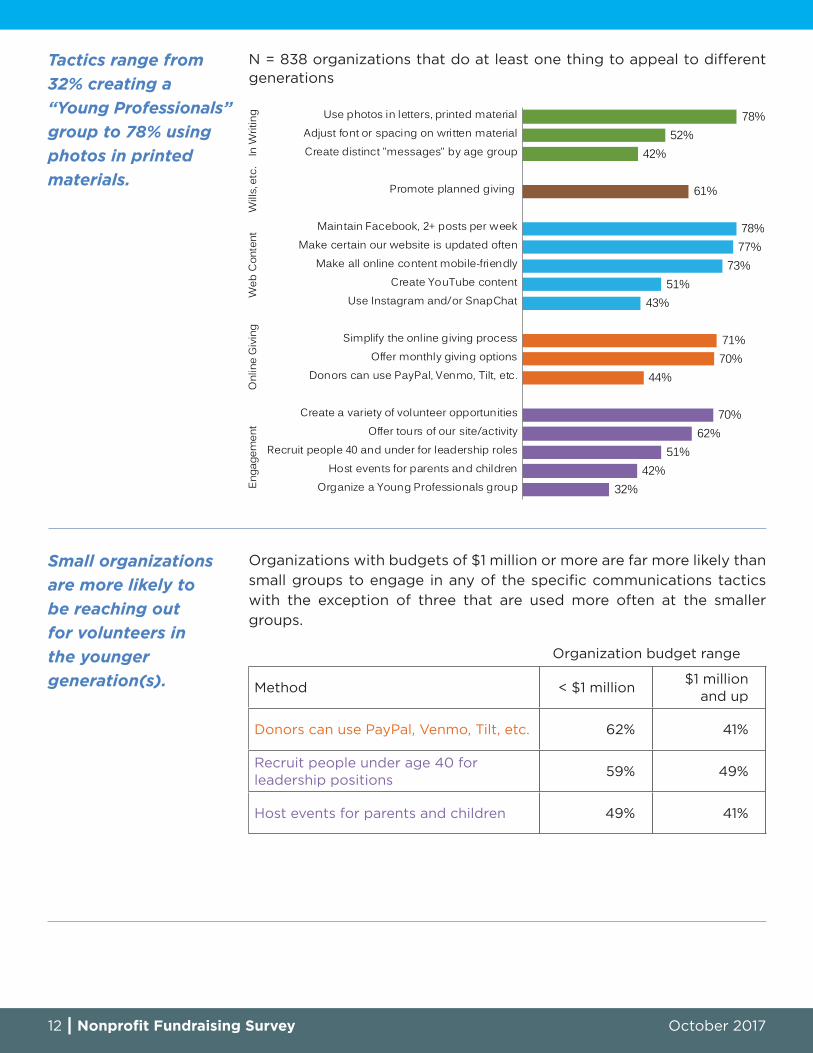
Tactics range from
32% creating a
“Young Professionals”
group to 78% using
photos in printed
materials.
N = 838 organizations that do at least one thing to appeal to different generations
78%52%
42%
61%
78%77%
73%51%
43%
71%70%
44%
70%62%
51%42%
32%
Use photos in letters, printed materialAdjust font or spacing on written materialCreate distinct "messages" by age group
Promote planned giving
Maintain Facebook, 2+ posts per weekMake certain our website is updated often
Make all online content mobile-friendlyCreate YouTube content
Use Instagram and/or SnapChat
Simplify the online giving processOffer monthly giving options
Donors can use PayPal, Venmo, Tilt, etc.
Create a variety of volunteer opportunitiesOffer tours of our site/activity
Recruit people 40 and under for leadership rolesHost events for parents and children
Organize a Young Professionals groupEnga
gem
ent
O
nlin
e G
ivin
g
W
eb C
onte
nt
W
ills,
etc
. In
Writ
ing
Small organizations
are more likely to
be reaching out
for volunteers in
the younger
generation(s).
Organizations with budgets of $1 million or more are far more likely than
small groups to engage in any of the specific communications tactics
with the exception of three that are used more often at the smaller
groups.
Organization budget range
Method < $1 million$1 million
and up
Donors can use PayPal, Venmo, Tilt, etc. 62% 41%
Recruit people under age 40 for leadership positions
59% 49%
Host events for parents and children 49% 41%

13 | Nonprofit Fundraising Survey October 2017
By sub-sector, Health
organizations are
most likely to be
engaging in numerous
approaches to reach
different generations.
We have enough responses for four different types of organizations to
examine generational engagement strategies: Arts, Education, Health,
and Human Services. In these groups, a higher share of Health organiza-
tions are using specific methods. A comparatively low percentage of
Human Services organizations are using these methods. Arts and
Education fall in the middle. Methods that are not shown are used with
approximately the same frequency by the different organization types.
Percentage using the methods by organization type Methods that are not shown are used with approximately the same
frequency by the different organization types.
All
Arts
Education
Health
Human Services
Use photographs 78% 76% 86% 82% 88%
Change messages by age of recipient
42% 40% 52% 36% 43%
Promote planned giving
61% 55% 68% 74% 77%
Post to Facebook 2x weekly
78% 87% 81% 94% 77%
Update website often
88% 83% 78% 90% 80%
Use Instagram/ Snapchat
43% 60% 51% 66% 33%
Donors can use PayPal, Venmo, Tilt, etc.
44% 48% 42% 56% 37%
Create multiple volunteer opportunities
70% 81% 72% 80% 66%
Host events for parents and children
42% 59% 54% 56% 33%
Text colors correspond to the figure on page 12. Shaded cells = highest value for the row. Italic (red) font = lowest value for the row.
14 | Nonprofit Fundraising Survey October 2017
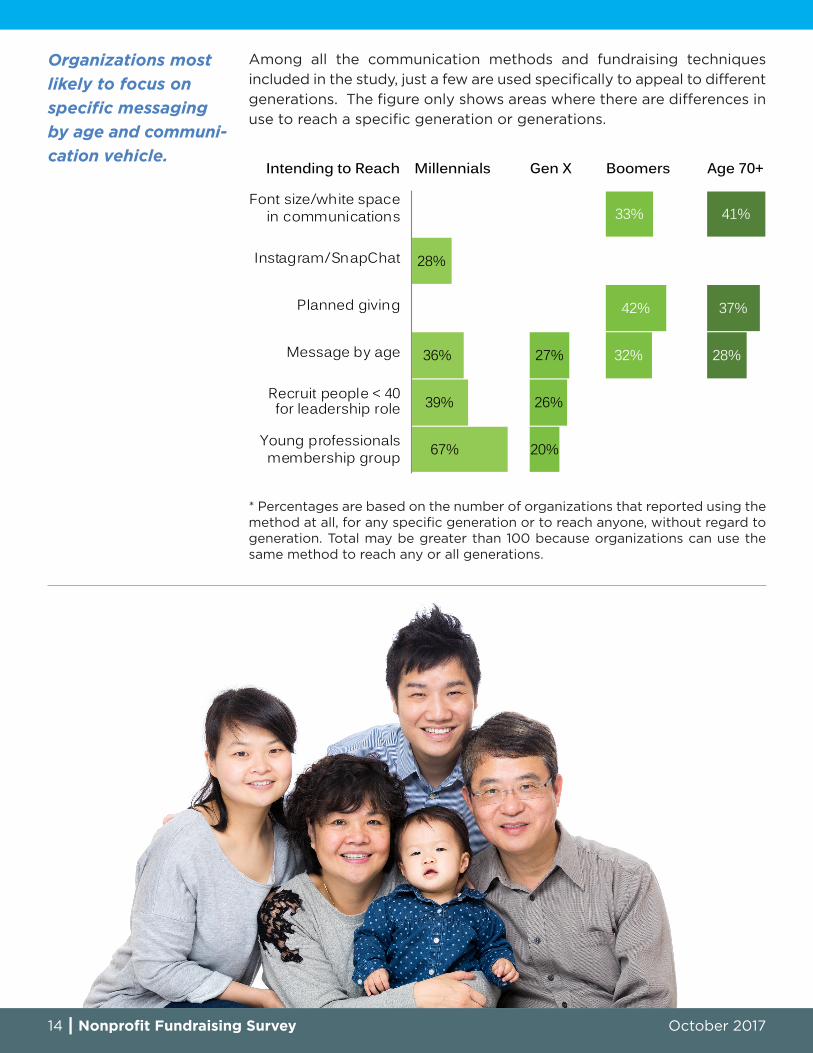
Organizations most
likely to focus on
specific messaging
by age and communi-
cation vehicle.
Among all the communication methods and fundraising techniques
included in the study, just a few are used specifically to appeal to different
generations. The figure only shows areas where there are differences in
use to reach a specific generation or generations.
* Percentages are based on the number of organizations that reported using the method at all, for any specific generation or to reach anyone, without regard to generation. Total may be greater than 100 because organizations can use the same method to reach any or all generations.
67%
39%
36%
28%
20%
26%
27% 32%
42%
33%
28%
37%
41%
Young professionalsmembership group
Recruit people < 40for leadership role
Message by age
Planned giving
Instagram/SnapChat
Font size/white spacein communications
Intending to Reach Millennials Gen X Boomers Age 70+

15 | Nonprofit Fundraising Survey October 2017
* N = 823 organizations. This shows the percentage that said they are intending to focus efforts on the generation** Of those reporting specific method(s) to focus on the generation, the share that report success at raising money or recruiting volunteers from that generation.
Organizations are experimenting with four methods to reach Millennials:
popular social media such as Instagram or Snapchat; changing the
content of a letter or other approach based on age of the intended
audience; and two approaches that apply only to the two youngest gen-
erations: recruiting people under 40 for leadership roles and organizing
a young professionals group.
Whatever approaches you take, recognize that Gen X and older are likely
donors. Gen X and Boomers are likely volunteers. As of mid-2017, fewer
than half of the organizations in this project said that they are raising
money from or recruiting volunteers from the Millennial generation,
despite trying, as shown below.
% trying that are succeeding in securing**
% of orgs that are
focusing*Generation
Raising money
Recruiting volunteers
10% “Gen Z” Not enough data
25%Millennial
Born 1981-199530% 40%
37%Gen X
Born 1965-198064% 76%
51%Boomer
Born 1946-196479% 59%
34%“Mature”
Born before 194677% 39%

16 | Nonprofit Fundraising Survey October 2017
Success in dollars or securing volunteers from any generation in this
project is not associated with any one method or set of methods used
to reach that age cohort. That is, across all of the various methods, none
are clearly preferred to approach donors in any of the generations we
examined.
In a sense, we know this. Numerous studies show that women age 40
and above are likely to use Facebook, but certainly many do not. So re-
lying on Facebook to reach women is one strategy, but not THE strategy.
Similarly, some “mature” donors shop and give through online portals;
many much younger donors will not. Utilize a range of tools and where
you can, use coding, tags, and other methods to track who responds to
each approach. Knowing your donors and their communication prefer-
ences can be more helpful than selecting one tool to use with one age
group.
As you move forward, when new technologies come out, try new things
in small ways to test them out before investing major amounts. There are
no bad ideas – only ideas that will or might not work for you right now.
Response to
fundraising methods
appears to be driven
by the individual,
not the generation.
“ Donors have confidence that they can part with gift dollars without eating into their personal budgets. We are doing a better job of describing our impact. We often work with families and take a multigenerational approach.”
Large Western U.S. Public-Society Benefit Organization
“ We engage in peer to peer crowdfunding with local college/university partners (i.e. fraternities, clubs) to engage Millennials with our cause.”
Mid-sized Northeastern U.S. Human Services Charity

17 | Nonprofit Fundraising Survey October 2017
CONCLUSIONThe survey from summer 2017 shows a strong fundraising year across the U.S. and Canada,
even before any contributions made for the hurricanes, fire, flood, and earthquakes that struck
beginning in late August.
Major gift contributions rose at half of the organizations, with most other fundraising methods
likely to yield roughly the same dollars so far in 2017 as organizations saw in 2016. The trends
for this year are consistent with earlier strong years for fundraising increases.
Study participants are trying new initiatives including events segmented to different genera-
tions, youth advisory councils, and efforts to engage young men (a “Guys Give” program). The
NRC intends to continue to explore this topic in future years with 2017 as a benchmark.
Analysis of different communications methods finds little clear evidence that any one method
or group of methods is most suited to any one generation. As of mid-2017, it appears that
donors continue to want to hear from the organizations they support through a variety of
channels.
“ We have created our 5-year vision with plans to expand. We have also worked to build gifts and support to move us towards our goal of expansion. Our major donors and leadership donors fit into the ‘Silent,’ ‘Boomer,’ and Gen X generations. A large part of our social media and online campaigns are directed at the Millennials and Gen Z. We have a great volunteer program and are developing our alumni engagement.”
Mid-sized Canadian organization providing education for at-risk youth

18 | Nonprofit Fundraising Survey October 2017
METHODOLOGYThe survey invitation was sent by email and through social media postings beginning on
August 21, 2017. The online-only questionnaire remained open through September 13. There
were 1,167 responses total. After removing duplicates and ineligible responses from countries
other than the U.S. and Canada, analysis is based on 1,104 total responses. Some respondents
did not answer all questions.
Invitations were sent by email and using social media to several distinct groups:
n Prior participants in NRC surveys
n Individuals who have signed up to receive communications from NRC (sign up is at
www.npresearch.org)
n Members of the Association of Fundraising Professionals (AFP) located in the United
States
n Members of AFP in Canada
n Members of the Association of Philanthropic Counsel and from them to their nonprofit
clients
n Individuals on the email lists maintained by the National Association of Charitable Gift
Planners, by CFRE International, and by TopNonprofits
n Client organizations of consulting firms that are members of Giving USA
n A contact list for Melissa S. Brown & Associates
n Readers of the Facebook group Nonprofit Happy Hour and LinkedIn pages maintained
by any of the sponsors.
Email reminders were sent at least once, and sometimes twice, to people on the email lists.
In addition, members of the NRC used notices in newsletters and via social media outlets
to recruit additional survey participants. By source of list, response numbers are shown after
removing duplicates and ineligible responses.
List source for records included in analysis Number receivedPercentage of
responses analyzed
Association of Fundraising Professionals 262 24%
Association of Philanthropic Counsel 41 4%
CFRE International 279 25%
Giving USA 33 3%
Melissa S. Brown & Associates 28 2%
NRC list 84 8%
National Association of Charitable Gift Planners 116 10%
TopNonprofits 261 24%
Total 1,104 100%

19 | Nonprofit Fundraising Survey October 2017
The Summer 2017 Nonprofit Fundraising Survey received 1,104 non-duplicated responses rep-
resenting organizations with at least $12 billion in combined revenue.
In this file of responding charities, regions defined by the Census Bureau are roughly equally
represented based on the number of registered charities within each.
Charities by Census region compared with charities registered with the IRS687 charities in the US responded to this question. The sum is 100 by region—that is, add
North, South, Midwest, and West for any of the categories of charity to get 100. All light blue
bars together = 100, for example.)
18%
26%
32%
24%
19%
25%
33%
23%
Northeast Midwest South West
RegisteredResponding
Registered = In the IRS Business Master File Responding = Response provided in this survey.
With 144 responses from Canadian charities, this survey reached <0.1 percent of the eligible
participants in that country. The number of respondents in the U.S. is also 0.1 percent of the
charities for which expense data are available, although there are more than 1 million registered.
This study asked participants to report their organizations’ annual operating budget by cate-
gory (< $250,000 through > $10 million). We compared these responses to data about expen-
diture amounts on IRS Forms 990. Thus only reporting charities, which provide expenditure
information to the IRS, could be coded for size using official data.

20 | Nonprofit Fundraising Survey October 2017
Charities expenditure total, compared with reporting charities filing IRS forms 540 U.S. organizations provided information about their total operating budget. The study
captures data about a large share of organizations with comparatively large budgets ($1 million
and up).
Reporting = filing an IRS Form 990 or Form 990EZ or 990-N ePostcard. Only non-religion registered charities with revenue of $5,000 or more are required to report. Expenditure information for non-reporting charities is not available at a national level for registered nonprofit 501(c)(3) organizations. Canadian respondents not included in this graph.
67%
11% 10%8%
4%
19%
10%
21%19%
17%
< $500,000 $500,000 - $999,999 $1 million -$2.99 million
$3 million -$9.99 million
$10 - $49.99 million
RegisteredResponding
21 | Nonprofit Fundraising Survey October 2017
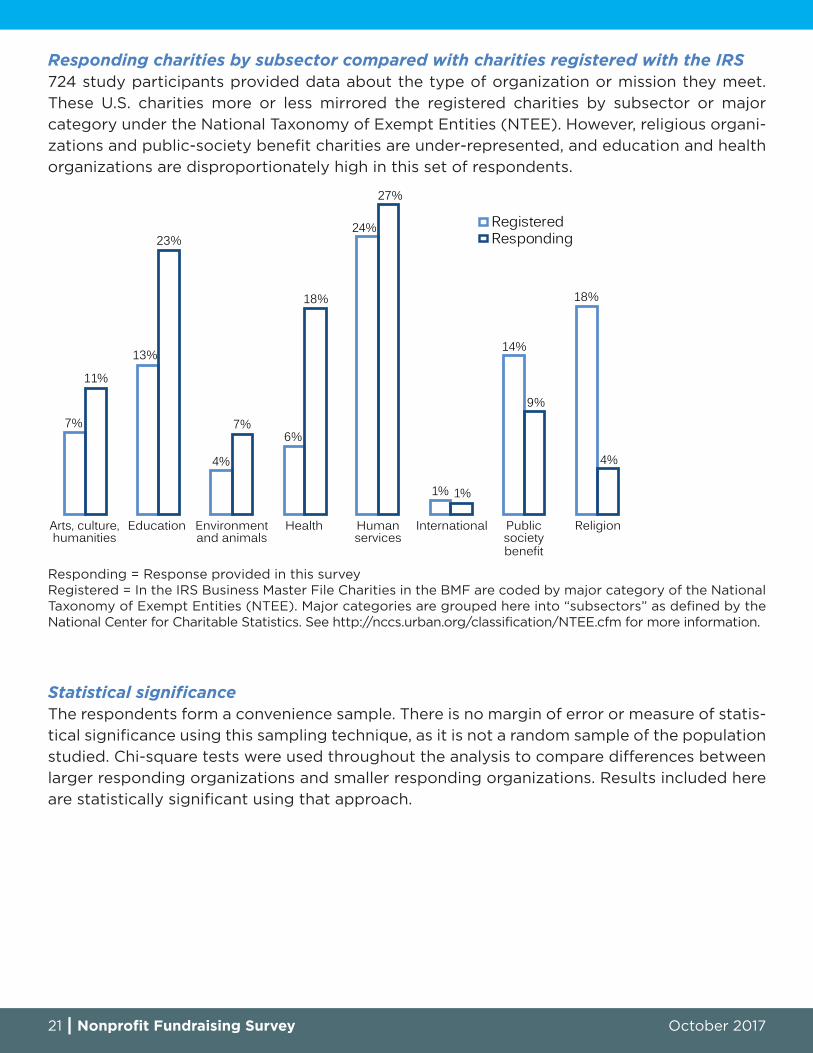
Statistical significanceThe respondents form a convenience sample. There is no margin of error or measure of statis-
tical significance using this sampling technique, as it is not a random sample of the population
studied. Chi-square tests were used throughout the analysis to compare differences between
larger responding organizations and smaller responding organizations. Results included here
are statistically significant using that approach.
Responding charities by subsector compared with charities registered with the IRS 724 study participants provided data about the type of organization or mission they meet.
These U.S. charities more or less mirrored the registered charities by subsector or major
category under the National Taxonomy of Exempt Entities (NTEE). However, religious organi-
zations and public-society benefit charities are under-represented, and education and health
organizations are disproportionately high in this set of respondents.
7%
13%
4%
6%
24%
1%
14%
18%
11%
23%
7%
18%
27%
1%
9%
4%
Arts, culture,humanities
Education Environmentand animals
Health Humanservices
International Publicsocietybenefit
Religion
RegisteredResponding
Responding = Response provided in this surveyRegistered = In the IRS Business Master File Charities in the BMF are coded by major category of the National Taxonomy of Exempt Entities (NTEE). Major categories are grouped here into “subsectors” as defined by the National Center for Charitable Statistics. See http://nccs.urban.org/classification/NTEE.cfm for more information.
22 | Nonprofit Fundraising Survey October 2017
ABOUT THE NONPROFIT RESEARCH COLLABORATIVESeveral organizations formed the NRC. These entities have a decade or more of direct expe-
rience collecting information from nonprofits concerning charitable receipts, fundraising prac-
tices, and/or grantmaking activities.
n Association of Fundraising Professionals surveyed members for an annual state of
fundraising study from 2002 through 2010.
n Association of Philanthropic Counsel, an international professional association of con-
sultants whose members survey nonprofit organizations as part of their services.
n CFRE International encourages research that helps fundraising professional achieve
the highest standards of professional competence and ethical practice.
n Giving USA Foundation has published the Giving USA Annual Report on Philanthropy
for more than 60 years.
n The National Association of Charitable Gift Planners conducts research, education,
advocacy, community dialogue and the setting of standards and best practices in phil-
anthropic planning.
n TopNonprofits provides online, helpful and actionable nonprofit know-how, featuring
examples, tips, lists, webcasts, posts, podcasts, and more.
The collaborative effort reduces the burden on charities, which receive fewer requests for
survey participation. Survey respondents will form a panel over time, allowing for trend com-
parisons among the same organizations. This approach provides more useful benchmarking
information than repeated cross-sectional studies.
Reports and other information from the NRC appear at www.npresearch.org.
The Nonprofit Research Collaborative (NRC) conducts surveys twice a year. Melissa S. Brown
& Associates manages the NRC. She can be reached at [email protected] or at
530-690-5746.