guide to forming a charitable, tax-exempt, nonprofit corporation in california
Upload
nguyenmienCategory
view
218download
0
Winter 2017 Nonprofit Fundraising Study (NFS)
Covering Charitable Receipts at Nonprofit Charitable Organizations in 2016
United States and Canada
FOR RELEASE
May 1, 2017
A Study From
Nonprofit Fundraising Survey May 2017
Acknowledgements
The Nonprofit Research Collaborative (NRC) thanks all respondents who took the survey in January and February 2017. Your willingness to share information about your organization makes it possible for this report to appear.
Members of the Nonprofit Research Collaborative are
© Winter 2017 Nonprofit Fundraising Survey
Nonprofit Research Collaborative
PowerPoint slides with the graphs are also available, at npresearch.org for a small fee.
Project management by
For permission to cite or reproduce, please contact Melissa Brown at [email protected]. This report, PowerPoint slides based on graphics in this report, infographics on selected NRC findings, and links to earlier reports can be found at www.NPResearch.org.
Nonprofit Fundraising Survey i May 2017
Contents LIST OF FIGURES ................................................................................................................... III KEY FINDINGS FOR THE U.S. ................................................................................................ 1 KEY FINDINGS FOR CANADA .............................................................................................. 2 INTRODUCTION ...................................................................................................................... 3 SECTION I: 2016 RESULTS - OVERALL .............................................................................. 5
A declining share, 60% down from 65%, report increase in charitable gifts .............. 5
Little difference in changes in charitable receipts by organizational size ................. 6
Higher education and public-society benefit organizations less likely to see increase; otherwise few differences by type of organization ........................................ 7
Predicted change in charitable receipts compared with actual results ....................... 8
2016 sees a significant decline in share that met their fundraising goal ................... 9 SECTION II: FUNDRAISING METHODS ............................................................................ 11
Several specific fundraising methods show drops in the percentage of survey participants that reported growth in funds received.................................................... 14
Findings support the benefits of using multiple fundraising methods .................... 14
Donor-focus might mean thinking about what else is demanding attention .......... 15
The U.S. and Canada had similar experiences by method of fundraising ................ 16 BEQUESTS ............................................................................................................................ 17
In this study, 7 in 10 reported that they raise funds with bequests ......................... 17
Bequest amounts received varied widely ........................................................................ 17
.Average bequest amount most frequently between $25,000 and $100,000 ............ 18
Even mid-sized organizations receive bequests of $10,000 or more ........................ 18 OUTLOOK FOR 2017 ......................................................................................................... 20
Three types of challenges to fundraising expressed .................................................... 21 SECTION II: NONPROFIT FUNDRAISING SURVEY RESULTS FOR CANADA ............ 22
Just over half (54%) of Canadian organizations reported growth .............................. 22
Growth in charitable receipts consistent with 2014, lower than 2015 ..................... 23
7 in 10 met fundraising goal in 2016 in Canada ............................................................ 24
Bequests in Canada are likely to be between $25,001 and $100,000 ........................ 25
Expectations for 2017 in Canada ...................................................................................... 26
Nonprofit Fundraising Survey ii May 2017
Canadians likely to cite economy or major gift relationships as challenges for 2017 ........................................................................................................................................ 27
SECTION III: NONPROFIT FUNDRAISING SURVEY RESULTS FOR THE U.S. ............ 28
6 in 10 reported increase in amounts raised in 2016 ................................................... 28
No difference in change in charitable receipts by region ............................................. 29
2016 results for the share seeing an increase were comparable to 2015, for all regions in the U.S. ........................................................................................................... 30
No difference by organizational size in U.S. ................................................................... 31
The 2016 results were similar to 2015 ............................................................................ 32
Roughly 7 in 10 charities in the U.S. reached fundraising goals in 2016 ................. 33
Individual bequests in the U.S. likely to be less than $25,000 .................................... 34
Two-thirds of U.S. charities predicted growth for 2017 ............................................... 35 THE U.S. ELECTION AND CHARITABLE GIVING ......................................................... 37
The campaign season affected more than a third of survey participants, most often negatively .................................................................................................................... 37
Major gift donors had multiple reasons to shift their giving ...................................... 40
Election results also affected charitable receipts, with mixed motives expressed by donors ........................................................................................................ 40
SECTION IV: WHAT WORKED IN GROUPS THAT RAISED 15% OR MORE IN 2016 ........................................................................................................................................ 42 SECTION V: METHODOLOGY ............................................................................................ 45
Statistical significance ......................................................................................................... 48 ABOUT THE NONPROFIT RESEARCH COLLABORATIVE ............................................ 49
Nonprofit Fundraising Survey iii May 2017
LIST OF FIGURES Figure 1: Percentage of responding organizations reporting change in charitable
receipts, 2016 compared with 2015 – All respondents ................................................... 5
Figure 2: Percentage of responding organizations reporting change in charitable receipts by size (operating budget), 2016 compared with 2015 — All respondents .............................................................................................................................. 6
Figure 3: Percentage of responding organizations reporting change in charitable receipts by subsector, 2016 — All respondents ................................................................ 7
Figure 4: Predicted results for 2016 compared with actual results ...................................... 8
Figure 5: Did your organization meet its fiscal year 2016 fundraising goal? ..................... 9
Figure 6: Trend in percentage of organizations meeting fundraising goal, 2010-2016 ........................................................................................................................................... 9
Figure 7: Did your organization meet its fiscal year 2016 fundraising goal? – by organization size (operating budget) - All respondents .............................................. 10
Figure 8: Positive and negative aspects of fundraising success in 2016 ........................... 10
Figure 9: Percentage of all responding organizations that use fundraising method ...... 11
Figure 10: Percentage of organizations reporting change in charitable receipts by most frequently used fundraising methods, 2016 compared with 2015, Methods of Asking in Person – All respondents ............................................................. 12
Figure 11: Percentage of organizations reporting change in charitable receipts by fundraising method, 2016 compared with 2015, Methods of “Annual Fund” requests, not electronic – All respondents ....................................................................... 12
Figure 12: Percentage of organizations reporting change in charitable receipts, Annual Fund Methods, Electronic – All respondents ..................................................... 13
Figure 13: Percentage of organizations reporting change in chartable receipts – Institutional Donors – All respondents ............................................................................. 13
Figure 14: Lower shares see growth in funds from each of eight methods, 2016 comparted with 2015 – All respondents that use the method ..................................... 14
Figure 15: No statistically significant change in percentage reporting an increase for six fundraising methods – All respondents that use the method ......................... 15
Figure 16: A lower share of Canadian respondents report growth in charitable receipts by postal mail ......................................................................................................... 16
Figure 17: Percentage of responding organizations that received bequests in 2016 by total amount of bequest dollars .................................................................................... 17
Nonprofit Fundraising Survey iv May 2017
Figure 18: Range for the average amount of an individual bequest – All respondents ............................................................................................................................ 18
Figure 19: Average bequest amount is likely to be in the $10,001-$100,000 range for most sizes of charity ...................................................................................................... 19
Figure 20: Anticipated direction of change in charitable receipts, 2017 compared with 2016 – All survey participants ................................................................................... 20
Figure 21: 54% of Canadian study participants report an increase in charitable funds for 2016 ....................................................................................................................... 22
Figure 22: No difference in the share seeing growth in fundraising revenue by size of organization ....................................................................................................................... 22
Figure 23: Percentage of responding organizations reporting an increase in charitable receipts, Canada, 2016 compared with 2015 and 2014 ............................. 23
Figure 24: Did your organization meet its fiscal year 2016 fundraising goal? – Canada ..................................................................................................................................... 24
Figure 25: Percentage of respondents reporting average amount of an individual bequest – Canada and U.S. ................................................................................................... 25
Figure 26: Canadian organizations’ predictions for fundraising results in 2017 ............ 26
Figure 27: More than 1/3rd cite economy as a challenge for Canadian fundraising in 2017 ......................................................................................................................................... 27
Figure 28: 61% of U.S. charities in this study saw an increase in charitable receipts ..... 28
Figure 29: Percentage of responding organizations reporting change in charitable receipts by region – United States ...................................................................................... 29
Figure 30: Percentage of responding organizations reporting an increase in charitable receipts by U.S. region, 2016 compared with 2015 ..................................... 30
Figure 31: Percentage of responding organizations reporting change in charitable receipts by organization budget range (size) – United States ...................................... 31
Figure 32: No differences in the share seeing an increase in gifts received based on size of the responding charity – U.S. respondents ......................................................... 32
Figure 33: Did your organization meet its fiscal year 2016 fundraising goal? – U.S. ...... 33
Figure 34: Range for the average amount of an individual bequest – U.S. and Canada ..................................................................................................................................... 34
Figure 35: U.S. organizations’ predictions for fundraising results in 2017 ...................... 35
Figure 36: More than 1/3rd cite some aspect of government as a challenge for U.S. fundraising in 2017 ............................................................................................................... 35
Nonprofit Fundraising Survey v May 2017
Figure 37: 39% of participating organizations attribute changes to campaign season; A similar share (36%) say election results drove shifts in charitable receipts from Nov-Dec .......................................................................................................... 37
Figure 38: Major donors’ giving to political campaigns was associated with lower overall charitable receipts*; major donors’ giving to a charitable organization that was an “issue” in a political campaign is associated with receiving more overall** ................................................................................................................................... 40
Figure 39: Major donors gave various reasons * and no strong trends drove change in total receipts ...................................................................................................................... 41
Figure 39: Percentage of responding charities by Census region compared with registered charities in the IRS Business Master File, July 2013 .................................... 46
Figure 40: Responding charities expenditure total, compared with reporting charities filing IRS forms ..................................................................................................... 47
Figure 41: Responding charities by subsector compared with charities registered with the IRS ............................................................................................................................. 48
Nonprofit Fundraising Survey 1 May 2017
KEY FINDINGS FOR THE U.S.
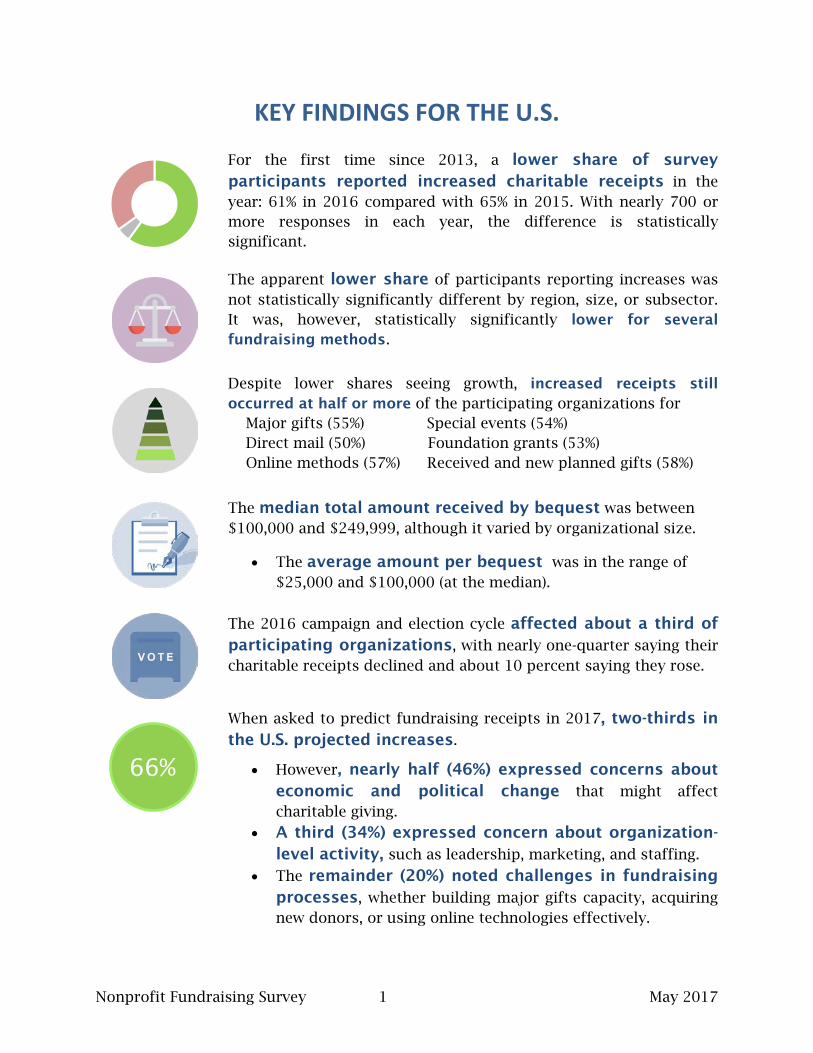
For the first time since 2013, a lower share of survey participants reported increased charitable receipts in the year: 61% in 2016 compared with 65% in 2015. With nearly 700 or more responses in each year, the difference is statistically significant.
The apparent lower share of participants reporting increases was not statistically significantly different by region, size, or subsector. It was, however, statistically significantly lower for several fundraising methods.
Despite lower shares seeing growth, increased receipts still occurred at half or more of the participating organizations for Major gifts (55%) Special events (54%) Direct mail (50%) Foundation grants (53%) Online methods (57%) Received and new planned gifts (58%)
The median total amount received by bequest was between $100,000 and $249,999, although it varied by organizational size.
• The average amount per bequest was in the range of $25,000 and $100,000 (at the median).
The 2016 campaign and election cycle affected about a third of participating organizations, with nearly one-quarter saying their charitable receipts declined and about 10 percent saying they rose.
When asked to predict fundraising receipts in 2017, two-thirds in the U.S. projected increases.
• However, nearly half (46%) expressed concerns about economic and political change that might affect charitable giving.
• A third (34%) expressed concern about organization-level activity, such as leadership, marketing, and staffing.
• The remainder (20%) noted challenges in fundraising processes, whether building major gifts capacity, acquiring new donors, or using online technologies effectively.
66%
Nonprofit Fundraising Survey 2 May 2017
KEY FINDINGS FOR CANADA
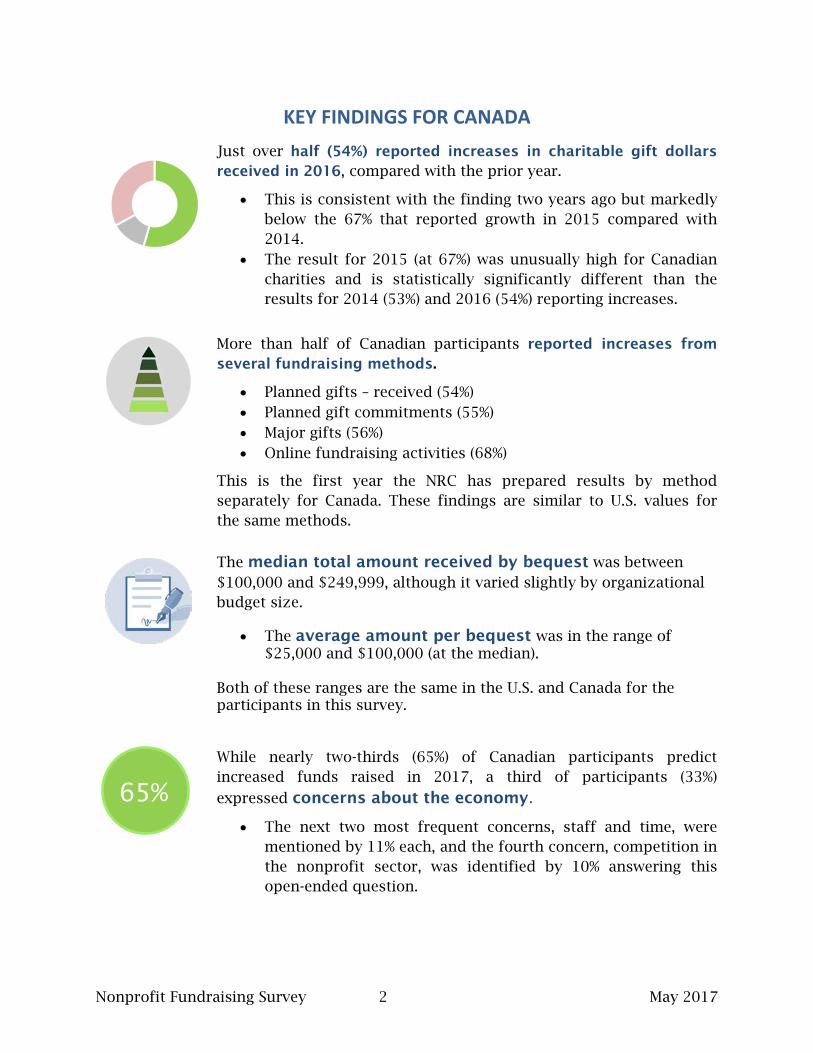
Just over half (54%) reported increases in charitable gift dollars received in 2016, compared with the prior year.
• This is consistent with the finding two years ago but markedly below the 67% that reported growth in 2015 compared with 2014.
• The result for 2015 (at 67%) was unusually high for Canadian charities and is statistically significantly different than the results for 2014 (53%) and 2016 (54%) reporting increases.
More than half of Canadian participants reported increases from several fundraising methods.
• Planned gifts – received (54%) • Planned gift commitments (55%) • Major gifts (56%) • Online fundraising activities (68%)
This is the first year the NRC has prepared results by method separately for Canada. These findings are similar to U.S. values for the same methods.
The median total amount received by bequest was between $100,000 and $249,999, although it varied slightly by organizational budget size.
• The average amount per bequest was in the range of $25,000 and $100,000 (at the median).
Both of these ranges are the same in the U.S. and Canada for the participants in this survey.
While nearly two-thirds (65%) of Canadian participants predict
increased funds raised in 2017, a third of participants (33%)
expressed concerns about the economy.
• The next two most frequent concerns, staff and time, were mentioned by 11% each, and the fourth concern, competition in the nonprofit sector, was identified by 10% answering this open-ended question.
65%
Nonprofit Fundraising Survey 3 May 2017
INTRODUCTION The 2016 calendar year brought challenges and opportunities to fundraising for the charitable nonprofit sector in the United States and Canada, including:
• Low prices for fossil fuels, which negatively affected the economies in states and provinces with extraction industries, such as Alaska, Texas, and Oklahoma in the U.S. and Alberta in Canada;
• Acrimonious political campaigns in the United States, which some charitable leaders identified as a contributing factor to lowered funds raised;
• A volatile stock market, creating financial uncertainty throughout the year,
although the year-end results in the U.S. showed stock market gains; and • A four-percent increase in disposable income (income after taxes), somewhat
ahead of inflation, which is usually a good signal for fundraising.
Fundraising trends noted by the NonProfit Times and the Chronicle of Philanthropy during the year included:
• Major capital campaigns underway, especially at arts organizations and museums;
• An increase in gifts of $1 million or more, from individuals, foundations, and
estates;
• Continued investment in online channels;
• Outreach to engage people in the “Millennial” generation (born roughly 1980 to 2000); and
• Growth in “Giving Days,” whether Giving Tuesday (national) or organization-specific such as Give to Purdue or The Big Give (The Columbus (OH) Foundation).
These and other factors are found in the results from the 2016 year-end Nonprofit Fundraising Survey (NFS) conducted by the Nonprofit Research Collaborative. Over 900 organizations participated in the early 2017 survey about charitable receipts from January through December 2016, or fiscal 2016 for some organizations. Responding charitable groups included large and small organizations (by budget size) and organizations from every subsector, Arts through Religion. Findings are based on responses remaining after data cleaning, 941 total, including 144 from Canada.

Nonprofit Fundraising Survey 4 May 2017
Questions ranged from changes in charitable receipt amounts in 2016, compared with 2015, to expectations for 2017. These findings can help an organization plan for its fundraising efforts.
One of the unique features of the NFS is our consideration of more than a dozen different fundraising methods. This report includes information about which methods in the U.S. and in Canada saw gains compared with 2015.
The survey also asked about expectations for charitable receipts in 2017 and gave respondents a chance to comment on specific challenges or trends they anticipate affecting their fundraising this year.
This report four distinct components
• Findings overall, for the U.S. and Canada together, which is most comparable to prior years’ editions of the Nonprofit Fundraising Survey;
• A section covering Canada;
• A section covering the U.S. and within the section about the United States, a discussion of the perceived impact of elections in the U.S on charitable giving; and
• A section covering some common themes found in organizations that raised
15 percent or more over their 2015 results.
Nonprofit Fundraising Survey 5 May 2017
SECTION I: 2016 RESULTS - OVERALL This section presents overall results, results by size (operating budget), by subsector, and by region.
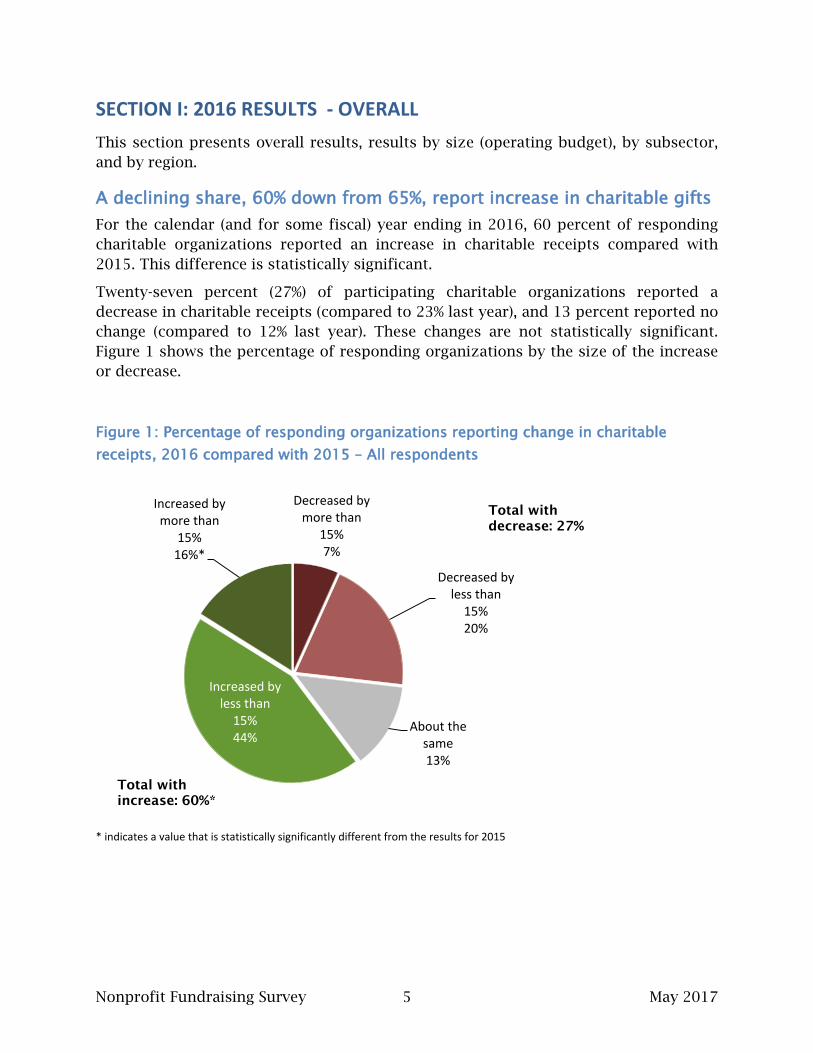
A declining share, 60% down from 65%, report increase in charitable gifts For the calendar (and for some fiscal) year ending in 2016, 60 percent of responding charitable organizations reported an increase in charitable receipts compared with 2015. This difference is statistically significant.
Twenty-seven percent (27%) of participating charitable organizations reported a decrease in charitable receipts (compared to 23% last year), and 13 percent reported no change (compared to 12% last year). These changes are not statistically significant. Figure 1 shows the percentage of responding organizations by the size of the increase or decrease.
Figure 1: Percentage of responding organizations reporting change in charitable receipts, 2016 compared with 2015 – All respondents
* indicates a value that is statistically significantly different from the results for 2015
Decreased by more than
15% 7%
Decreased by less than
15% 20%
About the same 13%
Increased by less than
15% 44%
Increased by more than
15% 16%*
Total with increase: 60%*
Total with decrease: 27%
Nonprofit Fundraising Survey 6 May 2017
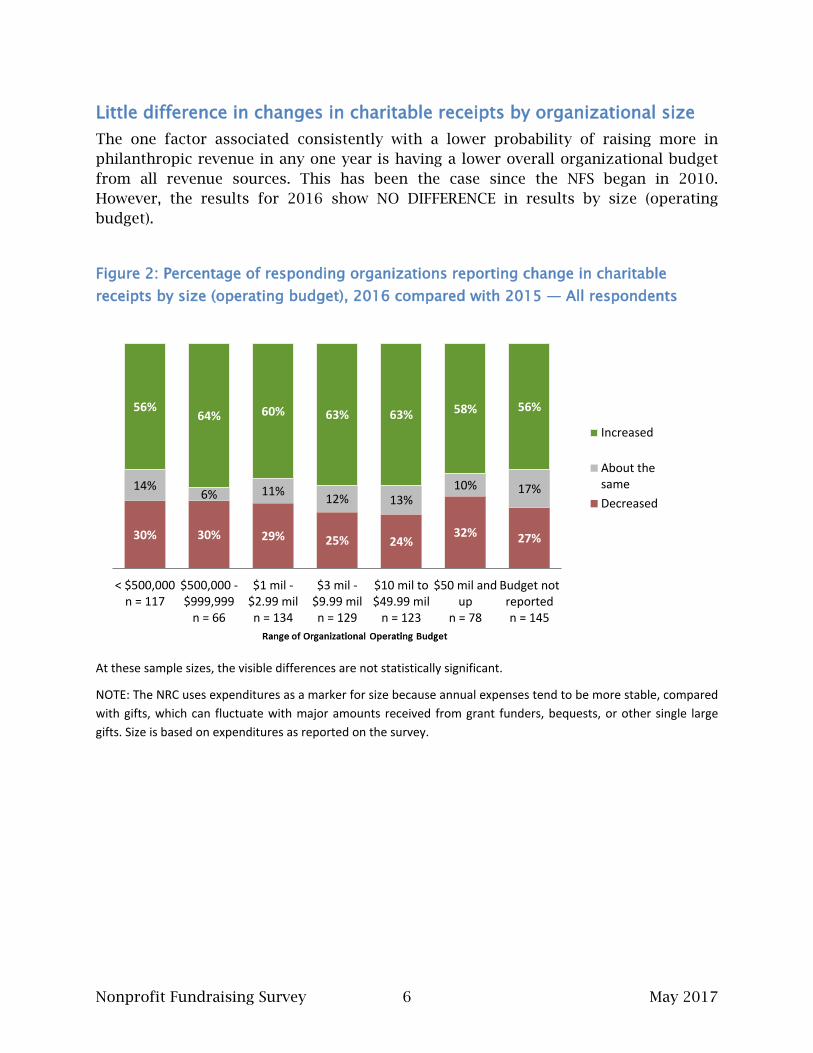
Little difference in changes in charitable receipts by organizational size The one factor associated consistently with a lower probability of raising more in philanthropic revenue in any one year is having a lower overall organizational budget from all revenue sources. This has been the case since the NFS began in 2010. However, the results for 2016 show NO DIFFERENCE in results by size (operating budget).
Figure 2: Percentage of responding organizations reporting change in charitable receipts by size (operating budget), 2016 compared with 2015 — All respondents
At these sample sizes, the visible differences are not statistically significant.
NOTE: The NRC uses expenditures as a marker for size because annual expenses tend to be more stable, compared with gifts, which can fluctuate with major amounts received from grant funders, bequests, or other single large gifts. Size is based on expenditures as reported on the survey.
30% 30% 29% 25% 24% 32% 27%
14% 6% 11% 12% 13%
10% 17%
56% 64% 60% 63% 63% 58% 56%
< $500,000n = 117
$500,000 -$999,999
n = 66
$1 mil -$2.99 miln = 134
$3 mil -$9.99 miln = 129
$10 mil to$49.99 mil
n = 123
$50 mil andup
n = 78
Budget notreportedn = 145
Increased
About thesameDecreased
Nonprofit Fundraising Survey 7 May 2017
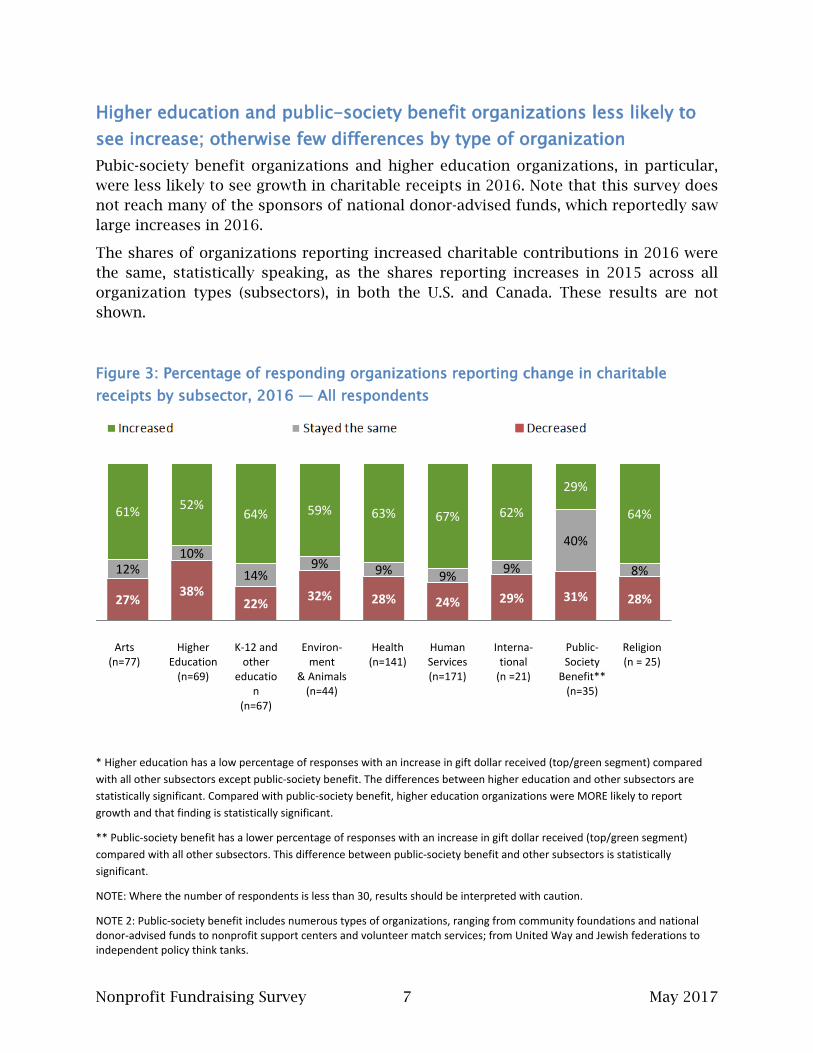
Higher education and public-society benefit organizations less likely to see increase; otherwise few differences by type of organization Pubic-society benefit organizations and higher education organizations, in particular, were less likely to see growth in charitable receipts in 2016. Note that this survey does not reach many of the sponsors of national donor-advised funds, which reportedly saw large increases in 2016.
The shares of organizations reporting increased charitable contributions in 2016 were the same, statistically speaking, as the shares reporting increases in 2015 across all organization types (subsectors), in both the U.S. and Canada. These results are not shown.
Figure 3: Percentage of responding organizations reporting change in charitable receipts by subsector, 2016 — All respondents
* Higher education has a low percentage of responses with an increase in gift dollar received (top/green segment) compared with all other subsectors except public-society benefit. The differences between higher education and other subsectors are statistically significant. Compared with public-society benefit, higher education organizations were MORE likely to report growth and that finding is statistically significant.
** Public-society benefit has a lower percentage of responses with an increase in gift dollar received (top/green segment) compared with all other subsectors. This difference between public-society benefit and other subsectors is statistically significant.
NOTE: Where the number of respondents is less than 30, results should be interpreted with caution.
NOTE 2: Public-society benefit includes numerous types of organizations, ranging from community foundations and national donor-advised funds to nonprofit support centers and volunteer match services; from United Way and Jewish federations to independent policy think tanks.
27% 38% 22% 32% 28% 24% 29% 31% 28%
12% 10%
14% 9% 9% 9% 9%
40%
8%
61% 52% 64% 59% 63% 67% 62%
29%
64%
Arts (n=77)
Higher Education
(n=69)
K-12 and other
education
(n=67)
Environ-ment
& Animals (n=44)
Health (n=141)
Human Services (n=171)
Interna- tional
(n =21)
Public-Society
Benefit** (n=35)
Religion (n = 25)
Nonprofit Fundraising Survey 8 May 2017
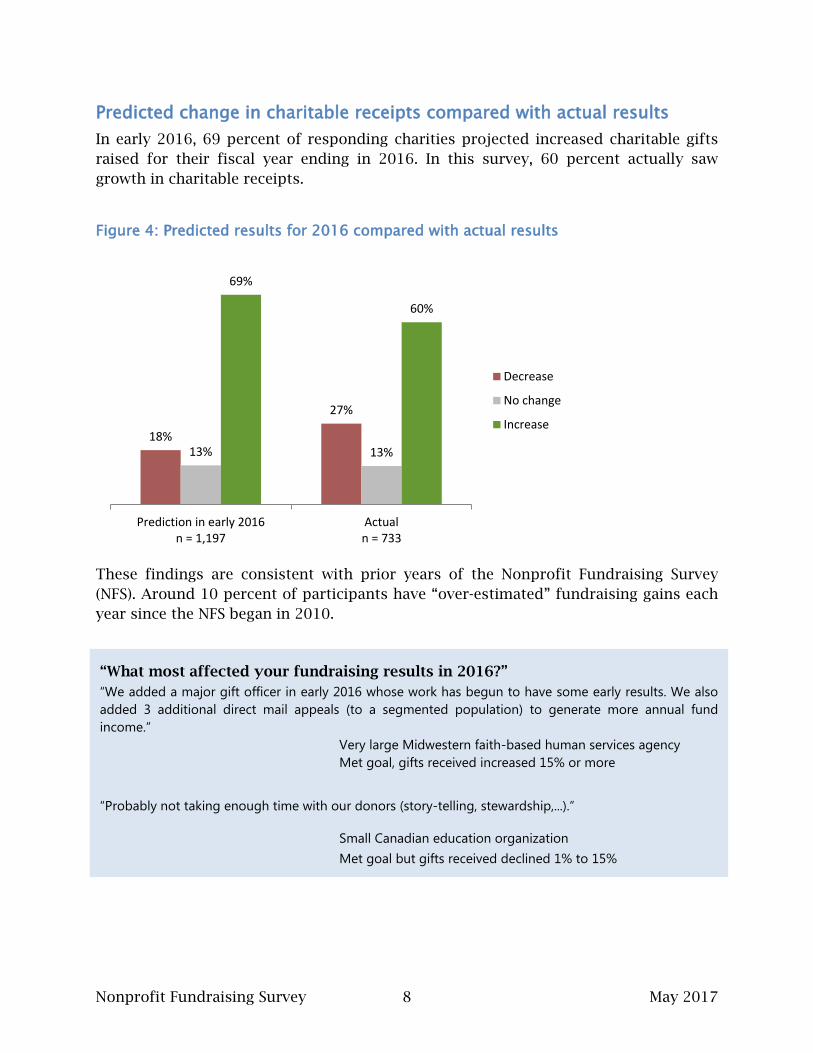
Predicted change in charitable receipts compared with actual results In early 2016, 69 percent of responding charities projected increased charitable gifts raised for their fiscal year ending in 2016. In this survey, 60 percent actually saw growth in charitable receipts.
Figure 4: Predicted results for 2016 compared with actual results
These findings are consistent with prior years of the Nonprofit Fundraising Survey (NFS). Around 10 percent of participants have “over-estimated” fundraising gains each year since the NFS began in 2010.
18%
27%
13% 13%
69%
60%
Prediction in early 2016n = 1,197
Actualn = 733
Decrease
No change
Increase
“What most affected your fundraising results in 2016?” “We added a major gift officer in early 2016 whose work has begun to have some early results. We also added 3 additional direct mail appeals (to a segmented population) to generate more annual fund income.” Very large Midwestern faith-based human services agency Met goal, gifts received increased 15% or more
“Probably not taking enough time with our donors (story-telling, stewardship,...).”
Small Canadian education organization Met goal but gifts received declined 1% to 15%
Nonprofit Fundraising Survey 9 May 2017
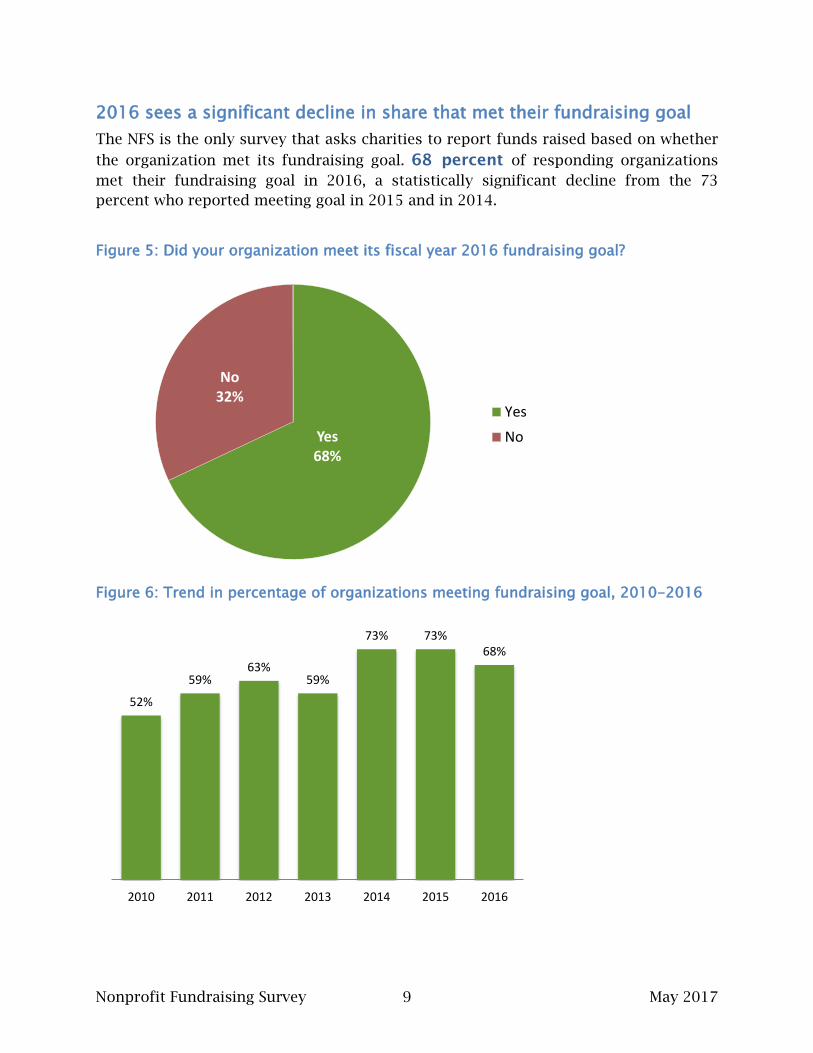
2016 sees a significant decline in share that met their fundraising goal The NFS is the only survey that asks charities to report funds raised based on whether
the organization met its fundraising goal. 68 percent of responding organizations met their fundraising goal in 2016, a statistically significant decline from the 73 percent who reported meeting goal in 2015 and in 2014.
Figure 5: Did your organization meet its fiscal year 2016 fundraising goal?
Figure 6: Trend in percentage of organizations meeting fundraising goal, 2010-2016
Yes 68%
No 32%
YesNo
52%
59% 63%
59%
73% 73% 68%
2010 2011 2012 2013 2014 2015 2016
Nonprofit Fundraising Survey 10 May 2017
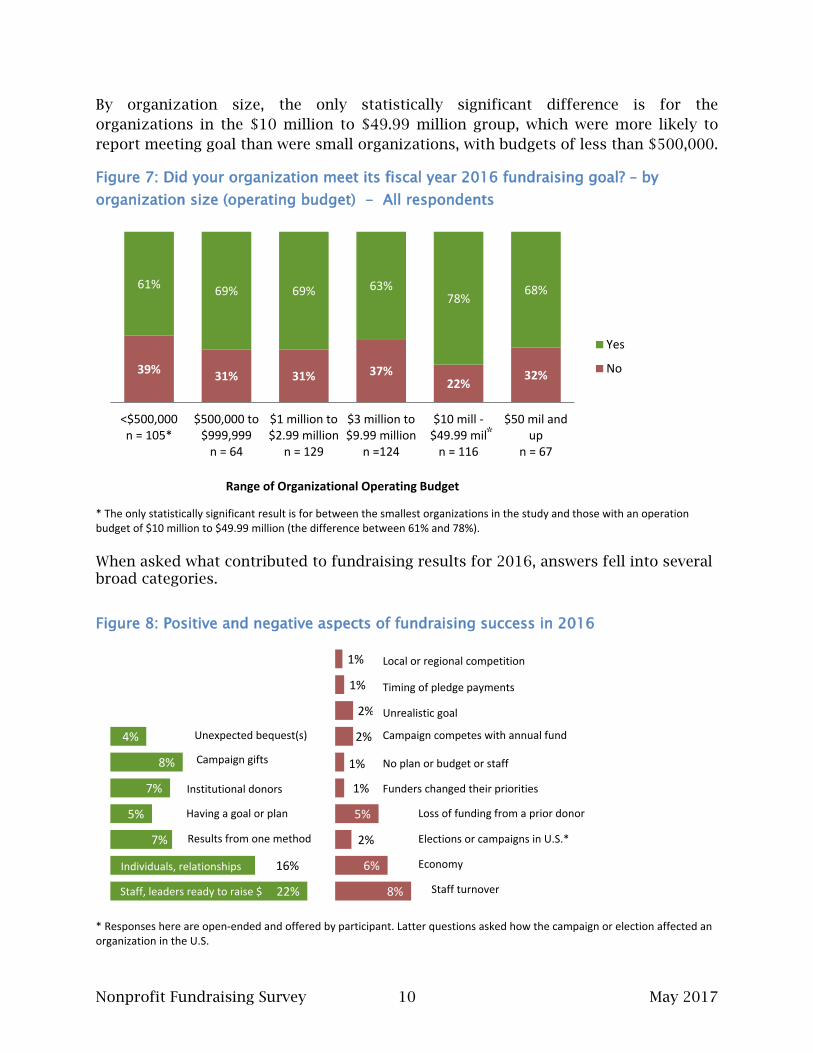
By organization size, the only statistically significant difference is for the organizations in the $10 million to $49.99 million group, which were more likely to report meeting goal than were small organizations, with budgets of less than $500,000.
Figure 7: Did your organization meet its fiscal year 2016 fundraising goal? – by organization size (operating budget) - All respondents
* The only statistically significant result is for between the smallest organizations in the study and those with an operation budget of $10 million to $49.99 million (the difference between 61% and 78%). When asked what contributed to fundraising results for 2016, answers fell into several broad categories.
Figure 8: Positive and negative aspects of fundraising success in 2016
* Responses here are open-ended and offered by participant. Latter questions asked how the campaign or election affected an organization in the U.S.
39% 31% 31% 37% 22%
32%
61% 69% 69% 63% 78%
68%
<$500,000n = 105*
$500,000 to$999,999
n = 64
$1 million to$2.99 million
n = 129
$3 million to$9.99 million
n =124
$10 mill -$49.99 mil
n = 116
$50 mil andup
n = 67
Range of Organizational Operating Budget
Yes
No
22%
16%
7%
5%
7%
8%
4%
8%
6%
2%
5%
1%
1%
2%
2%
1%
1%
Staff, leaders ready to raise $
Individuals, relationships I
*
Unexpected bequest(s) Campaign competes with annual fund
Unrealistic goal
Timing of pledge payments
Local or regional competition
No plan or budget or staff
Funders changed their priorities
Loss of funding from a prior donor
Elections or campaigns in U.S.*
Economy
Staff turnover
Campaign gifts
Institutional donors
Having a goal or plan
Results from one method
Nonprofit Fundraising Survey 11 May 2017
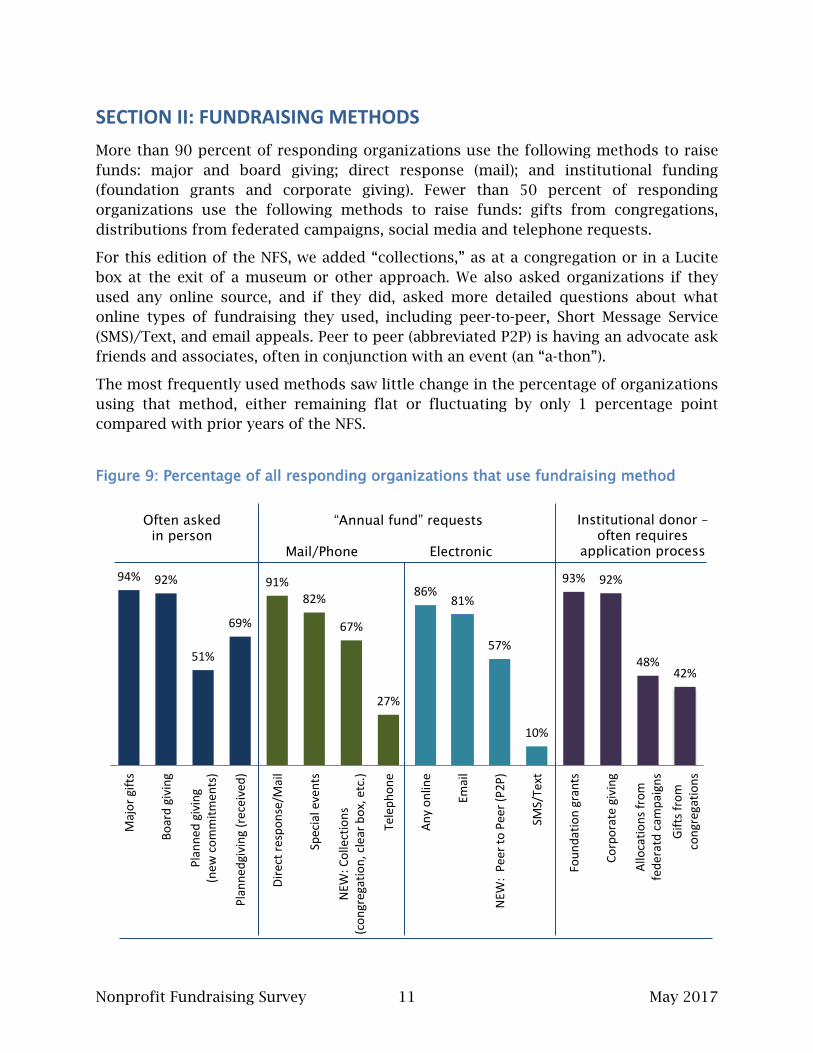
SECTION II: FUNDRAISING METHODS More than 90 percent of responding organizations use the following methods to raise funds: major and board giving; direct response (mail); and institutional funding (foundation grants and corporate giving). Fewer than 50 percent of responding organizations use the following methods to raise funds: gifts from congregations, distributions from federated campaigns, social media and telephone requests.
For this edition of the NFS, we added “collections,” as at a congregation or in a Lucite box at the exit of a museum or other approach. We also asked organizations if they used any online source, and if they did, asked more detailed questions about what online types of fundraising they used, including peer-to-peer, Short Message Service (SMS)/Text, and email appeals. Peer to peer (abbreviated P2P) is having an advocate ask friends and associates, often in conjunction with an event (an “a-thon”).
The most frequently used methods saw little change in the percentage of organizations using that method, either remaining flat or fluctuating by only 1 percentage point compared with prior years of the NFS.
Figure 9: Percentage of all responding organizations that use fundraising method
94% 92%
51%
69%
91% 82%
67%
27%
86% 81%
57%
10%
93% 92%
48% 42%
Maj
or g
ifts
Boar
d gi
ving
Plan
ned
givi
ng(n
ew c
omm
itmen
ts)
Plan
nedg
ivin
g (r
ecei
ved)
Dire
ct re
spon
se/M
ail
Spec
ial e
vent
s
NEW
: Col
lect
ions
(con
greg
atio
n, c
lear
box
, etc
.)
Tele
phon
e
Any
onlin
e
Emai
l
NEW
: Pe
er to
Pee
r (P2
P)
SMS/
Text
Foun
datio
n gr
ants
Corp
orat
e gi
ving
Allo
catio
ns fr
omfe
dera
td c
ampa
igns
Gift
s fro
mco
ngre
gatio
ns
Often asked in person
“Annual fund” requests Mail/Phone Electronic
Institutional donor – often requires
application process
Nonprofit Fundraising Survey 12 May 2017
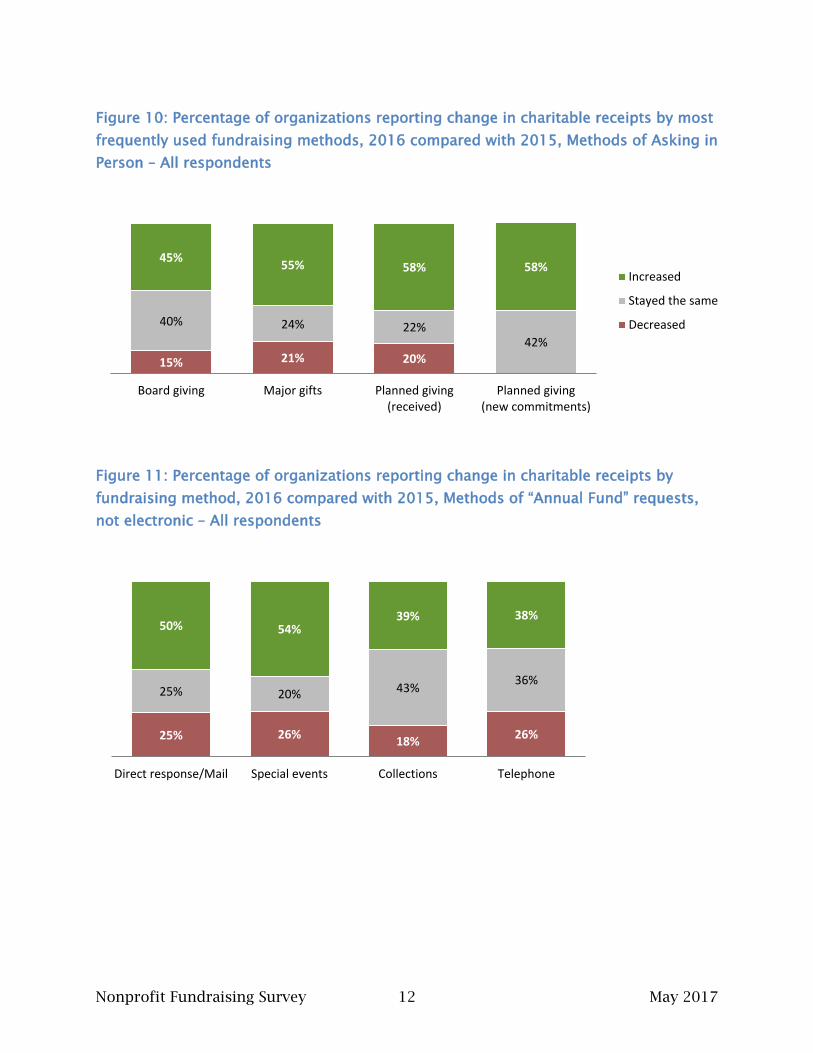
Figure 10: Percentage of organizations reporting change in charitable receipts by most frequently used fundraising methods, 2016 compared with 2015, Methods of Asking in Person – All respondents
Figure 11: Percentage of organizations reporting change in charitable receipts by fundraising method, 2016 compared with 2015, Methods of “Annual Fund” requests, not electronic – All respondents
15% 21% 20%
40% 24% 22% 42%
45% 55% 58% 58%
Board giving Major gifts Planned giving(received)
Planned giving(new commitments)
Increased
Stayed the same
Decreased
25% 26% 18% 26%
25% 20% 43% 36%
50% 54% 39% 38%
Direct response/Mail Special events Collections Telephone
Nonprofit Fundraising Survey 13 May 2017
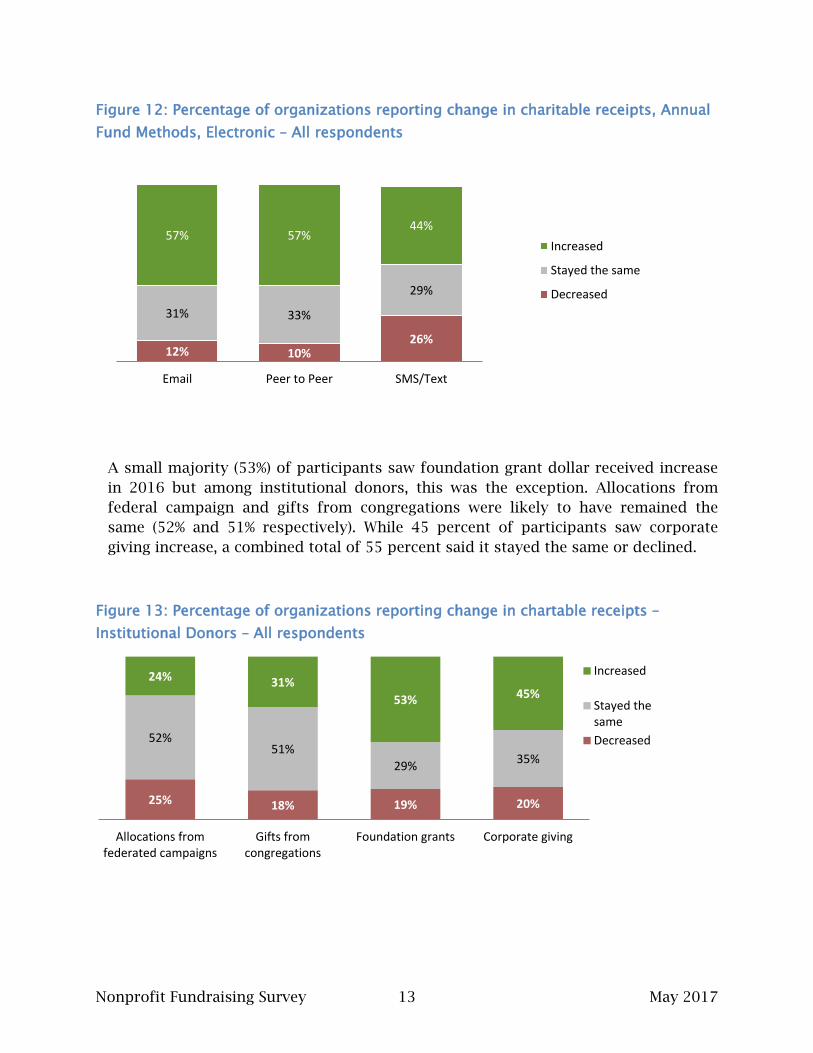
Figure 12: Percentage of organizations reporting change in charitable receipts, Annual Fund Methods, Electronic – All respondents
A small majority (53%) of participants saw foundation grant dollar received increase in 2016 but among institutional donors, this was the exception. Allocations from federal campaign and gifts from congregations were likely to have remained the same (52% and 51% respectively). While 45 percent of participants saw corporate giving increase, a combined total of 55 percent said it stayed the same or declined.
Figure 13: Percentage of organizations reporting change in chartable receipts – Institutional Donors – All respondents
12% 10% 26%
31% 33%
29%
57% 57% 44%
Email Peer to Peer SMS/Text
Increased
Stayed the same
Decreased
25% 18% 19% 20%
52% 51%
29% 35%
24% 31% 53% 45%
Allocations fromfederated campaigns
Gifts fromcongregations
Foundation grants Corporate giving
Increased
Stayed thesameDecreased
Nonprofit Fundraising Survey 14 May 2017
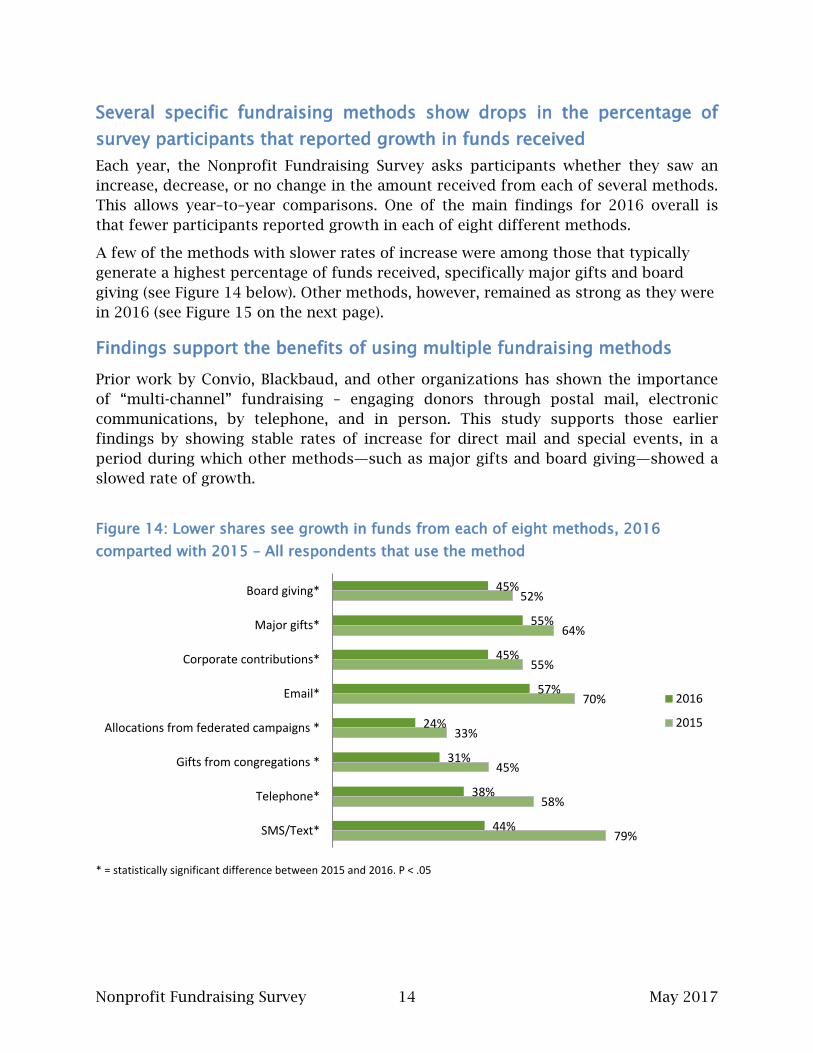
Several specific fundraising methods show drops in the percentage of survey participants that reported growth in funds received Each year, the Nonprofit Fundraising Survey asks participants whether they saw an increase, decrease, or no change in the amount received from each of several methods. This allows year–to–year comparisons. One of the main findings for 2016 overall is that fewer participants reported growth in each of eight different methods.
A few of the methods with slower rates of increase were among those that typically generate a highest percentage of funds received, specifically major gifts and board giving (see Figure 14 below). Other methods, however, remained as strong as they were in 2016 (see Figure 15 on the next page).
Findings support the benefits of using multiple fundraising methods
Prior work by Convio, Blackbaud, and other organizations has shown the importance of “multi-channel” fundraising – engaging donors through postal mail, electronic communications, by telephone, and in person. This study supports those earlier findings by showing stable rates of increase for direct mail and special events, in a period during which other methods—such as major gifts and board giving—showed a slowed rate of growth.
Figure 14: Lower shares see growth in funds from each of eight methods, 2016 comparted with 2015 – All respondents that use the method
* = statistically significant difference between 2015 and 2016. P < .05
45%
55%
45%
57%
24%
31%
38%
44%
52%
64%
55%
70%
33%
45%
58%
79%
Board giving*
Major gifts*
Corporate contributions*
Email*
Allocations from federated campaigns *
Gifts from congregations *
Telephone*
SMS/Text*
2016
2015
Nonprofit Fundraising Survey 15 May 2017
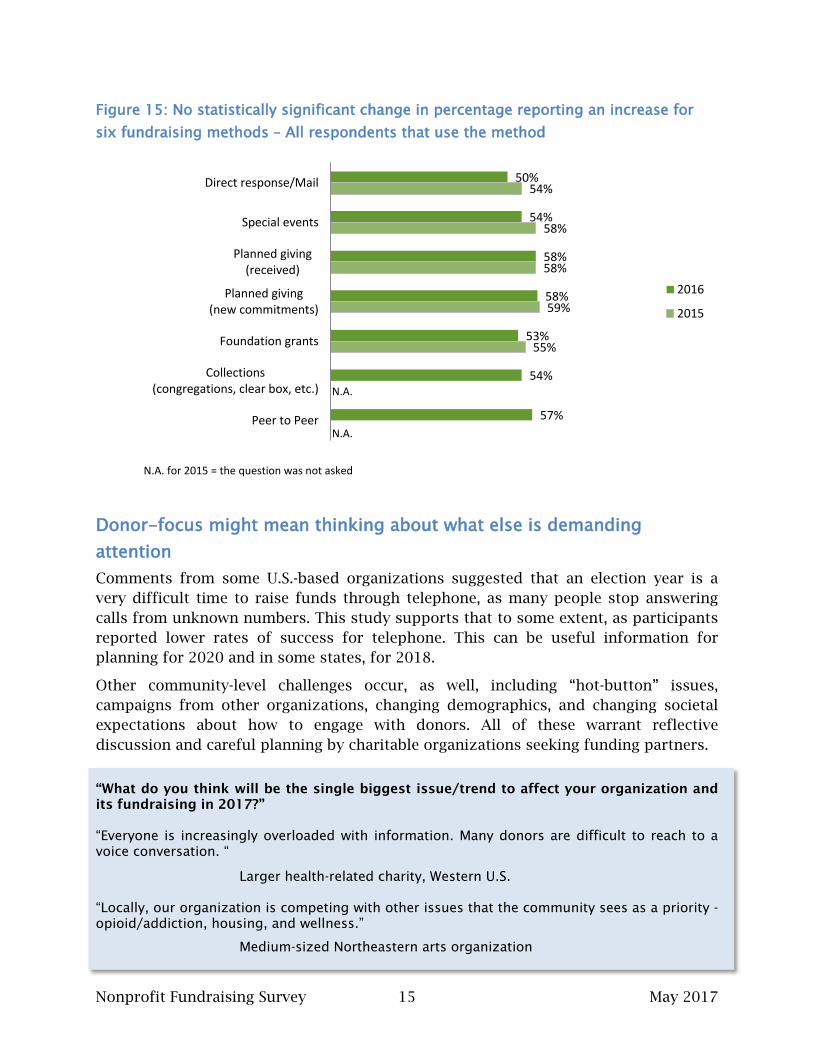
Figure 15: No statistically significant change in percentage reporting an increase for six fundraising methods – All respondents that use the method
N.A. for 2015 = the question was not asked
Donor-focus might mean thinking about what else is demanding attention Comments from some U.S.-based organizations suggested that an election year is a very difficult time to raise funds through telephone, as many people stop answering calls from unknown numbers. This study supports that to some extent, as participants reported lower rates of success for telephone. This can be useful information for planning for 2020 and in some states, for 2018.
Other community-level challenges occur, as well, including “hot-button” issues, campaigns from other organizations, changing demographics, and changing societal expectations about how to engage with donors. All of these warrant reflective discussion and careful planning by charitable organizations seeking funding partners.
“What do you think will be the single biggest issue/trend to affect your organization and its fundraising in 2017?” “Everyone is increasingly overloaded with information. Many donors are difficult to reach to a voice conversation. “
Larger health-related charity, Western U.S. “Locally, our organization is competing with other issues that the community sees as a priority - opioid/addiction, housing, and wellness.”
Medium-sized Northeastern arts organization
50%
54%
58%
58%
53%
54%
57%
54%
58%
58%
59%
55%
Direct response/Mail
Special events
Planned giving(received)
Planned giving(new commitments)
Foundation grants
Collections(congregations, clear box, etc.)
Peer to Peer
2016
2015
N.A.
N.A.
Nonprofit Fundraising Survey 16 May 2017
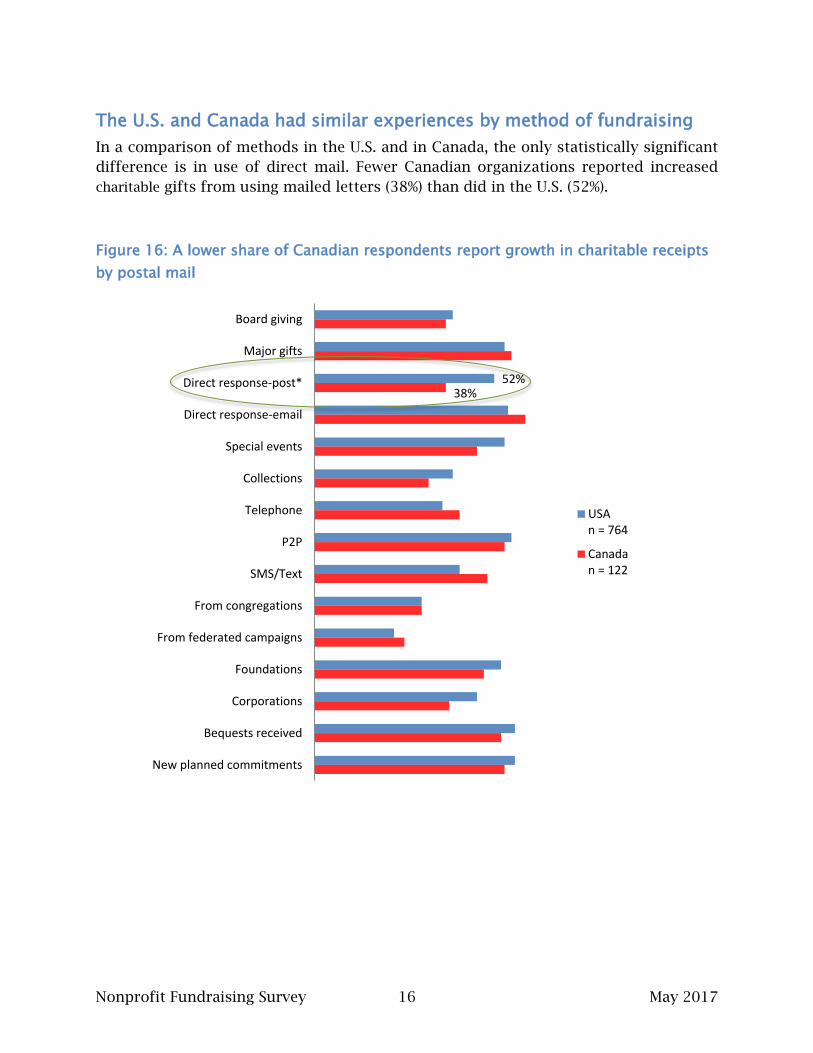
The U.S. and Canada had similar experiences by method of fundraising In a comparison of methods in the U.S. and in Canada, the only statistically significant difference is in use of direct mail. Fewer Canadian organizations reported increased charitable gifts from using mailed letters (38%) than did in the U.S. (52%).
Figure 16: A lower share of Canadian respondents report growth in charitable receipts by postal mail
52% 38%
Board giving
Major gifts
Direct response-post*
Direct response-email
Special events
Collections
Telephone
P2P
SMS/Text
From congregations
From federated campaigns
Foundations
Corporations
Bequests received
New planned commitments
USAn = 764
Canadan = 122
Nonprofit Fundraising Survey 17 May 2017
BEQUESTS The Nonprofit Research Collaborative (NRC) asked several questions about bequests, including how many organizations received gifts through bequests and average amount of bequests.
In this study, 7 in 10 reported that they raise funds with bequests Of all survey respondents, 69 percent reported either bequests or new commitments for planned gifts (see Figure 9 on page 11). Of those that use planned giving,
58% reported increased planned gift receipts in 2016, which is consistent
with 2015.
58% reported an increase in the number of new planned gift
commitments.
This wave of the Nonprofit Fundraising Survey asked additional questions about the amounts received from estates in 2016. For this group of questions, 371 survey participants responded.
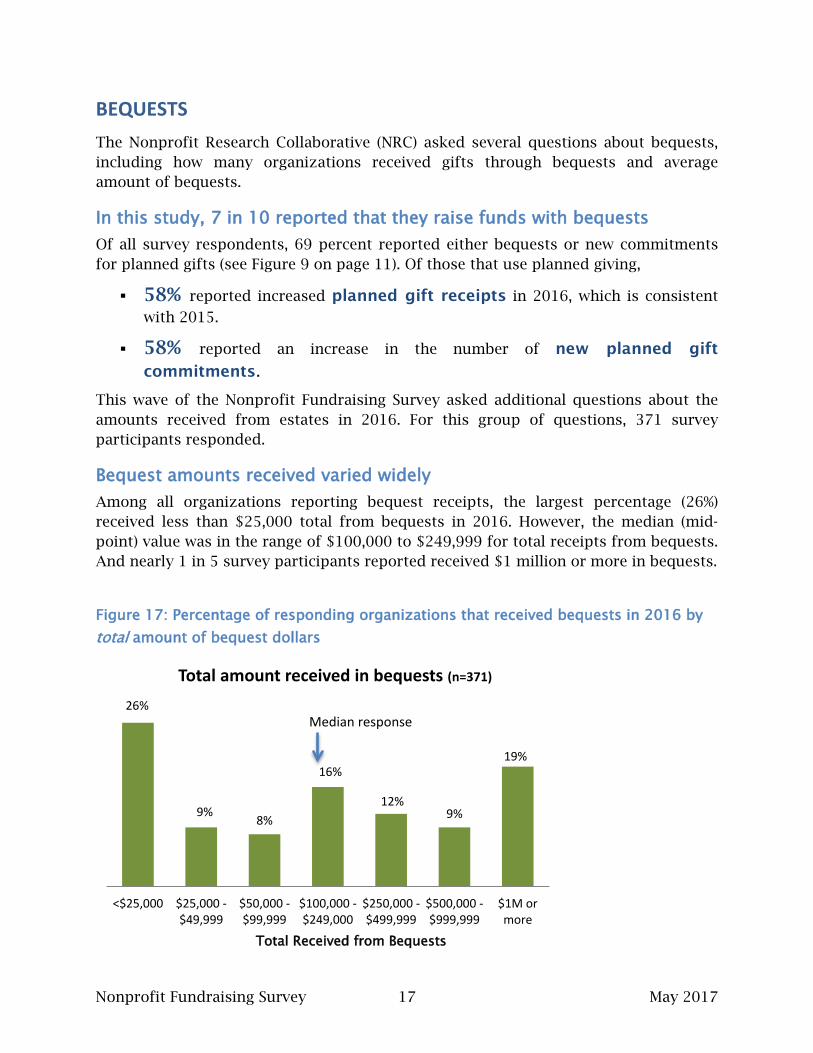
Bequest amounts received varied widely Among all organizations reporting bequest receipts, the largest percentage (26%) received less than $25,000 total from bequests in 2016. However, the median (mid-point) value was in the range of $100,000 to $249,999 for total receipts from bequests. And nearly 1 in 5 survey participants reported received $1 million or more in bequests.
Figure 17: Percentage of responding organizations that received bequests in 2016 by total amount of bequest dollars
26%
9% 8%
16%
12% 9%
19%
<$25,000 $25,000 -$49,999
$50,000 -$99,999
$100,000 -$249,000
$250,000 -$499,999
$500,000 -$999,999
$1M ormore
Total amount received in bequests (n=371)
Total Received from Bequests
Median response
Nonprofit Fundraising Survey 18 May 2017
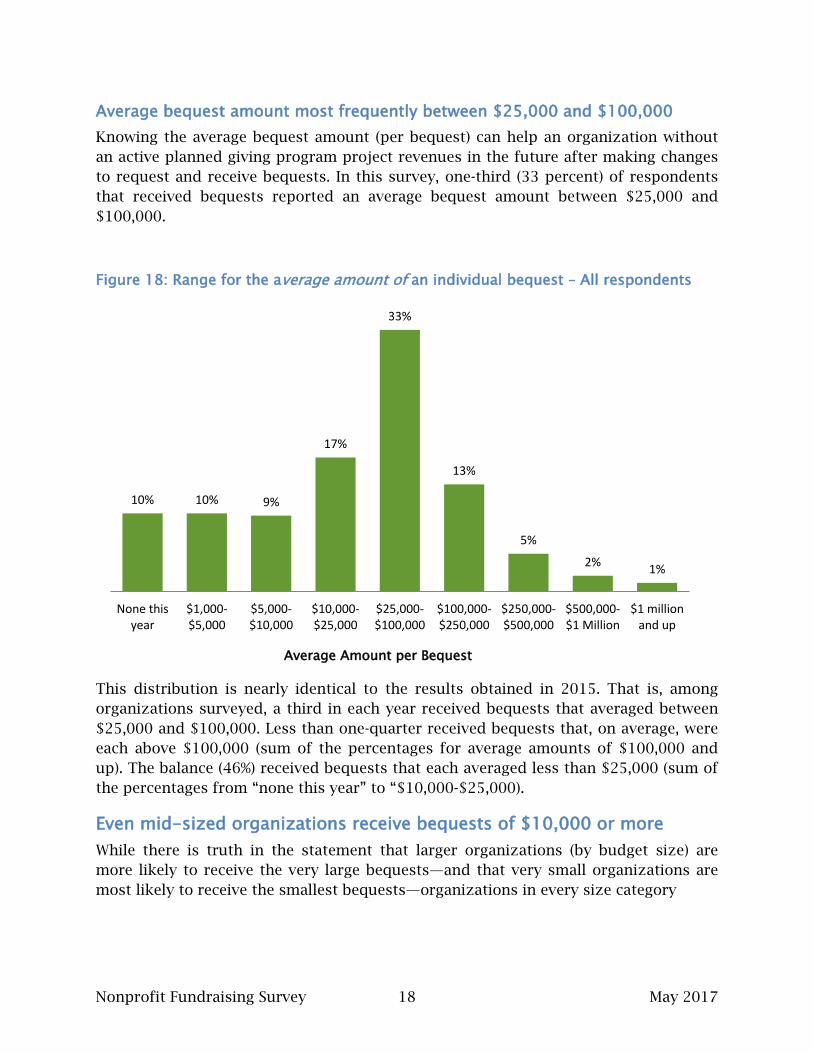
Average bequest amount most frequently between $25,000 and $100,000 Knowing the average bequest amount (per bequest) can help an organization without an active planned giving program project revenues in the future after making changes to request and receive bequests. In this survey, one-third (33 percent) of respondents that received bequests reported an average bequest amount between $25,000 and $100,000.
Figure 18: Range for the average amount of an individual bequest – All respondents
This distribution is nearly identical to the results obtained in 2015. That is, among organizations surveyed, a third in each year received bequests that averaged between $25,000 and $100,000. Less than one-quarter received bequests that, on average, were each above $100,000 (sum of the percentages for average amounts of $100,000 and up). The balance (46%) received bequests that each averaged less than $25,000 (sum of the percentages from “none this year” to “$10,000-$25,000).
Even mid-sized organizations receive bequests of $10,000 or more While there is truth in the statement that larger organizations (by budget size) are more likely to receive the very large bequests—and that very small organizations are most likely to receive the smallest bequests—organizations in every size category
10% 10% 9%
17%
33%
13%
5%
2% 1%
None thisyear
$1,000-$5,000
$5,000-$10,000
$10,000-$25,000
$25,000-$100,000
$100,000-$250,000
$250,000-$500,000
$500,000-$1 Million
$1 millionand up
Average Amount per Bequest
Nonprofit Fundraising Survey 19 May 2017
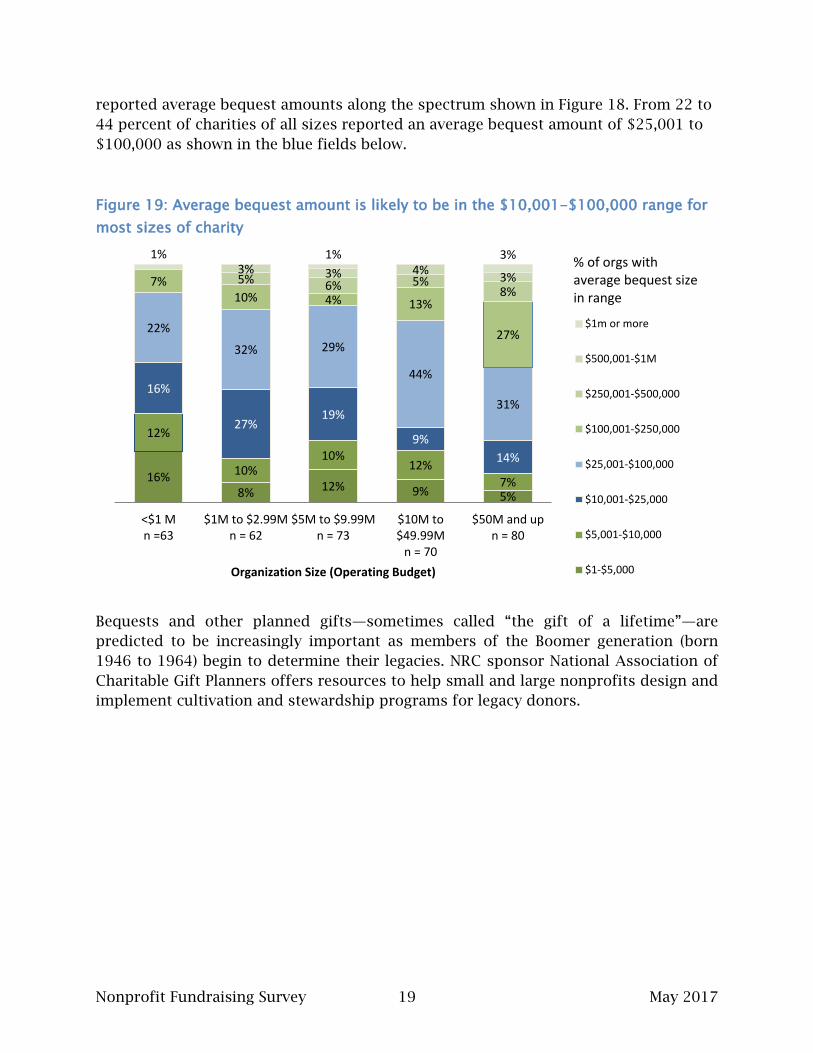
reported average bequest amounts along the spectrum shown in Figure 18. From 22 to 44 percent of charities of all sizes reported an average bequest amount of $25,001 to $100,000 as shown in the blue fields below.
Figure 19: Average bequest amount is likely to be in the $10,001-$100,000 range for most sizes of charity
Bequests and other planned gifts—sometimes called “the gift of a lifetime”—are predicted to be increasingly important as members of the Boomer generation (born 1946 to 1964) begin to determine their legacies. NRC sponsor National Association of Charitable Gift Planners offers resources to help small and large nonprofits design and implement cultivation and stewardship programs for legacy donors.
16% 8% 12% 9% 5%
12%
10% 10%
12% 7%
16%
27% 19%
9% 14%
22%
32% 29%
44%
31%
7% 10% 4% 13%
27%
5% 6% 5% 8%
3% 3% 4% 3%
1% 1% 3%
<$1 Mn =63
$1M to $2.99Mn = 62
$5M to $9.99Mn = 73
$10M to$49.99M
n = 70
$50M and upn = 80
Organization Size (Operating Budget)
$1m or more
$500,001-$1M
$250,001-$500,000
$100,001-$250,000
$25,001-$100,000
$10,001-$25,000
$5,001-$10,000
$1-$5,000
% of orgs with average bequest size in range
Nonprofit Fundraising Survey 20 May 2017
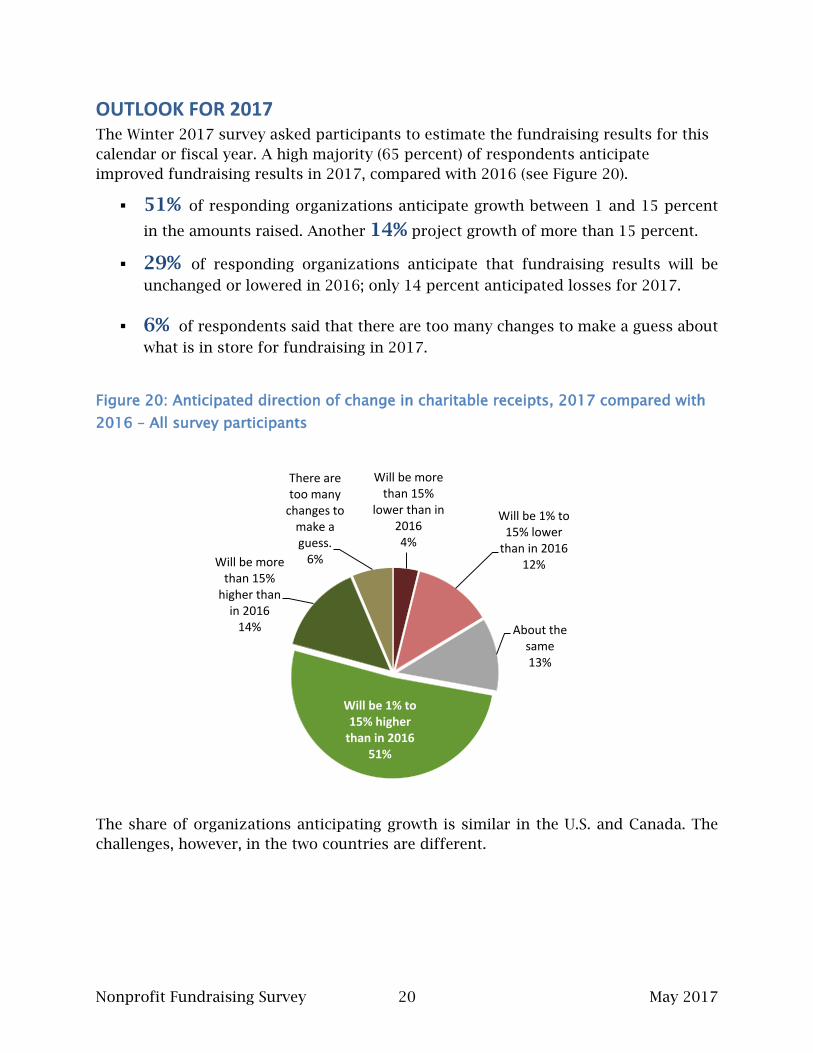
OUTLOOK FOR 2017 The Winter 2017 survey asked participants to estimate the fundraising results for this calendar or fiscal year. A high majority (65 percent) of respondents anticipate improved fundraising results in 2017, compared with 2016 (see Figure 20).
51% of responding organizations anticipate growth between 1 and 15 percent
in the amounts raised. Another 14% project growth of more than 15 percent.
29% of responding organizations anticipate that fundraising results will be
unchanged or lowered in 2016; only 14 percent anticipated losses for 2017.
6% of respondents said that there are too many changes to make a guess about
what is in store for fundraising in 2017.
Figure 20: Anticipated direction of change in charitable receipts, 2017 compared with 2016 – All survey participants
The share of organizations anticipating growth is similar in the U.S. and Canada. The challenges, however, in the two countries are different.
Will be more than 15%
lower than in 2016 4%
Will be 1% to 15% lower
than in 2016 12%
About the same 13%
Will be 1% to 15% higher
than in 2016 51%
Will be more than 15%
higher than in 2016
14%
There are too many
changes to make a guess.
6%
Nonprofit Fundraising Survey 21 May 2017
Three types of challenges to fundraising expressed The Nonprofit Fundraising Survey asked participants to identify the greatest challenges or opportunities for fundraising in 2017. The responses, as coded by NRC analysts, fall into several broad categories:
• Regional, national or global issues 49%
These include the economy, political issues, stock market uncertainty, and international affairs. In the U.S., all of these appeared in comments; in Canada, the external concerns were largely about the economy, both nationally and locally. Competition from other organizations in the same community was also placed here.
o In Canada, the challenges in this group were 40% of all responses and focused largely on economic issues. See more information on page 27.
o In the U.S. these challenges came to 50% of all responses and focused largely on governmental actions. See more information on page 35.
• Aspects of the development function 33%
This theme included staffing for fundraising; successfully executing plans for donor acquisition, retention, and upgrading; building relationships with potential major donors; effective use of online resources; better stewardship and communications with donors
o Staffing or time for fundraising was the single largest aspect for respondents in both countries.
• Organization-level concerns beyond development function 18%
These include the readiness of leadership staff and board to be fundraising partners, funding for development, organizational strategy, plans, and marketing, the mission statement, and similar issues.
“The single biggest challenge will remain the type of organization we are - we're not a hospital, not a religious organization, not a youth-based entity, and we don't have puppies, so we're low on the priority list for many philanthropists.”
Large education organization in the Western U.S. “To convince donors their contribution won't go to waste given the current situation.”
Very small civic organization in Canada
Nonprofit Fundraising Survey 22 May 2017
SECTION II: NONPROFIT FUNDRAISING SURVEY RESULTS FOR CANADA This wave of the Nonprofit Fundraising Survey received more than 140 responses from Canadian charitable organizations. This section presents results for this group of survey participants.
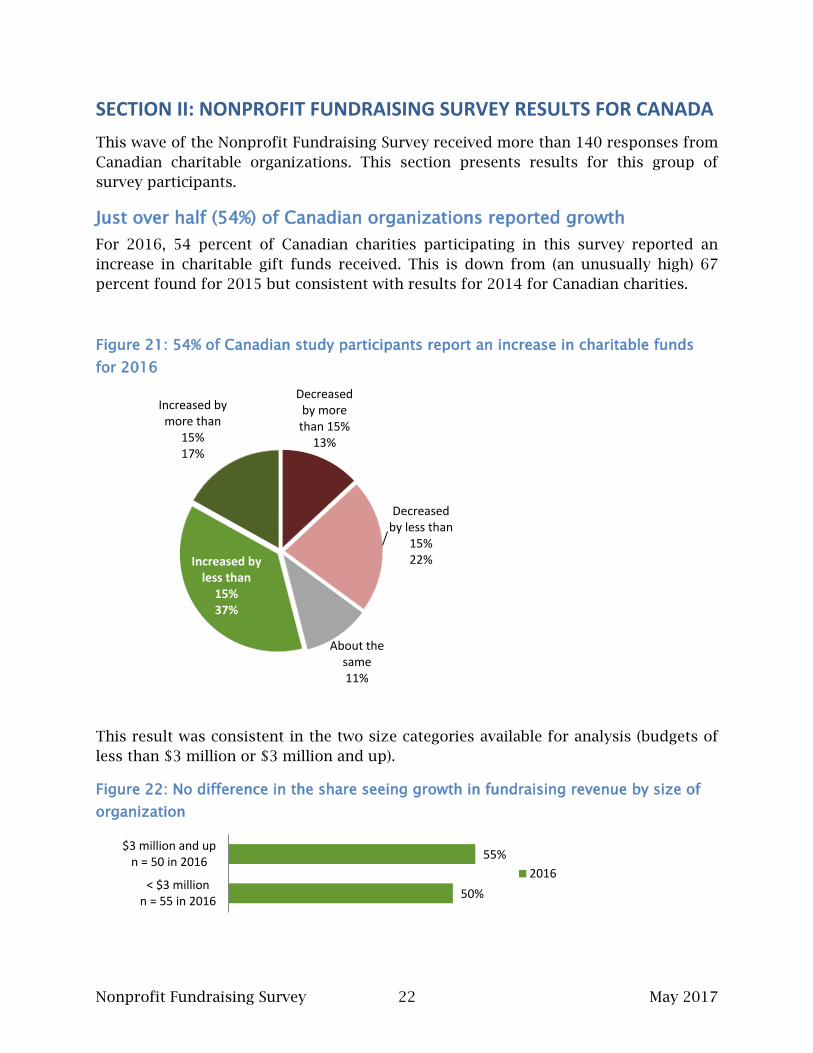
Just over half (54%) of Canadian organizations reported growth For 2016, 54 percent of Canadian charities participating in this survey reported an increase in charitable gift funds received. This is down from (an unusually high) 67 percent found for 2015 but consistent with results for 2014 for Canadian charities.
Figure 21: 54% of Canadian study participants report an increase in charitable funds for 2016
This result was consistent in the two size categories available for analysis (budgets of less than $3 million or $3 million and up).
Figure 22: No difference in the share seeing growth in fundraising revenue by size of organization
Decreased by more
than 15% 13%
Decreased by less than
15% 22%
About the same 11%
Increased by less than
15% 37%
Increased by more than
15% 17%
50%
55%
< $3 millionn = 55 in 2016
$3 million and upn = 50 in 2016
2016
Nonprofit Fundraising Survey 23 May 2017
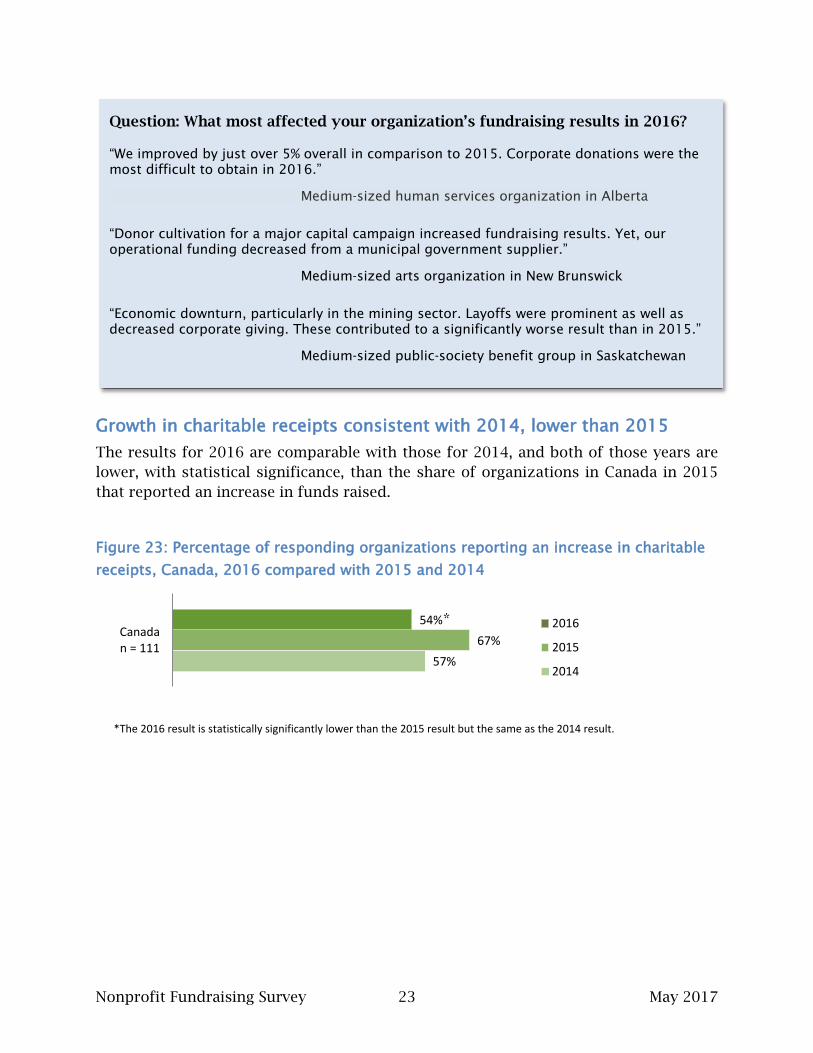
Growth in charitable receipts consistent with 2014, lower than 2015 The results for 2016 are comparable with those for 2014, and both of those years are lower, with statistical significance, than the share of organizations in Canada in 2015 that reported an increase in funds raised.
Figure 23: Percentage of responding organizations reporting an increase in charitable receipts, Canada, 2016 compared with 2015 and 2014
*The 2016 result is statistically significantly lower than the 2015 result but the same as the 2014 result.
57% 67%
54% Canadan = 111
2016
2015
2014
Question: What most affected your organization’s fundraising results in 2016?
“We improved by just over 5% overall in comparison to 2015. Corporate donations were the most difficult to obtain in 2016.”
Medium-sized human services organization in Alberta
“Donor cultivation for a major capital campaign increased fundraising results. Yet, our operational funding decreased from a municipal government supplier.”
Medium-sized arts organization in New Brunswick
“Economic downturn, particularly in the mining sector. Layoffs were prominent as well as decreased corporate giving. These contributed to a significantly worse result than in 2015.”
Medium-sized public-society benefit group in Saskatchewan
*
Nonprofit Fundraising Survey 24 May 2017
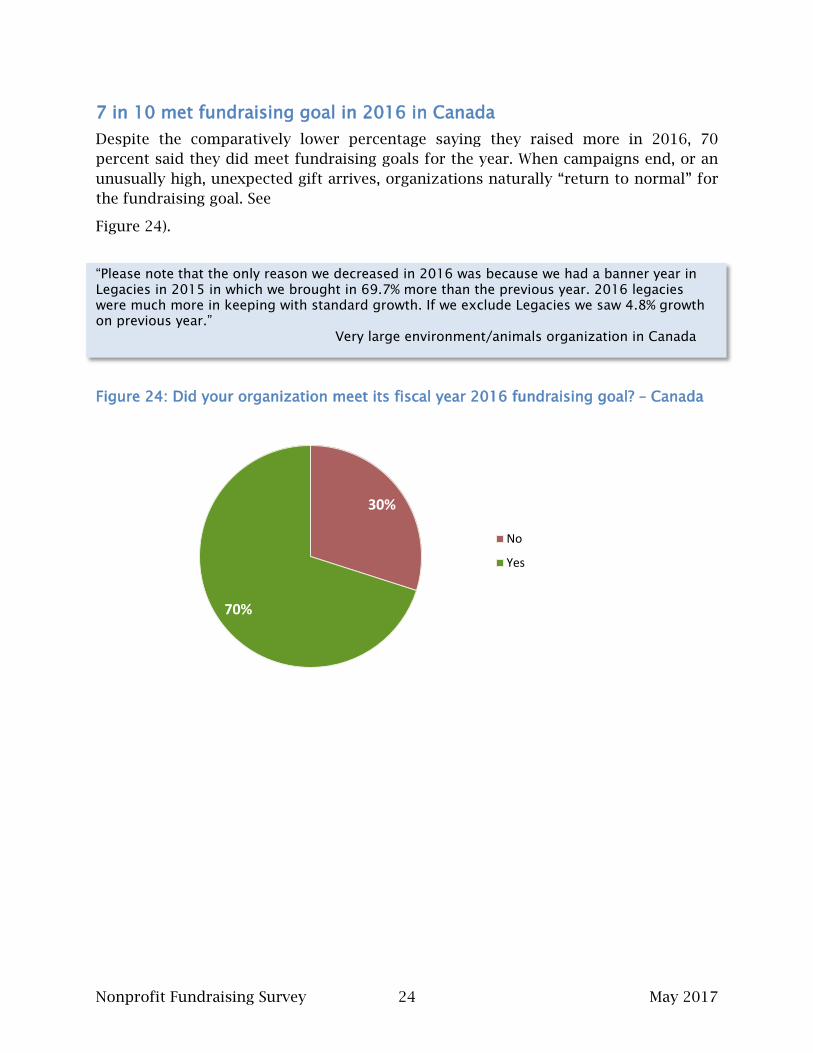
7 in 10 met fundraising goal in 2016 in Canada Despite the comparatively lower percentage saying they raised more in 2016, 70 percent said they did meet fundraising goals for the year. When campaigns end, or an unusually high, unexpected gift arrives, organizations naturally “return to normal” for the fundraising goal. See
Figure 24).
“Please note that the only reason we decreased in 2016 was because we had a banner year in Legacies in 2015 in which we brought in 69.7% more than the previous year. 2016 legacies were much more in keeping with standard growth. If we exclude Legacies we saw 4.8% growth on previous year.” Very large environment/animals organization in Canada
Figure 24: Did your organization meet its fiscal year 2016 fundraising goal? – Canada
30%
70%
No
Yes
Nonprofit Fundraising Survey 25 May 2017
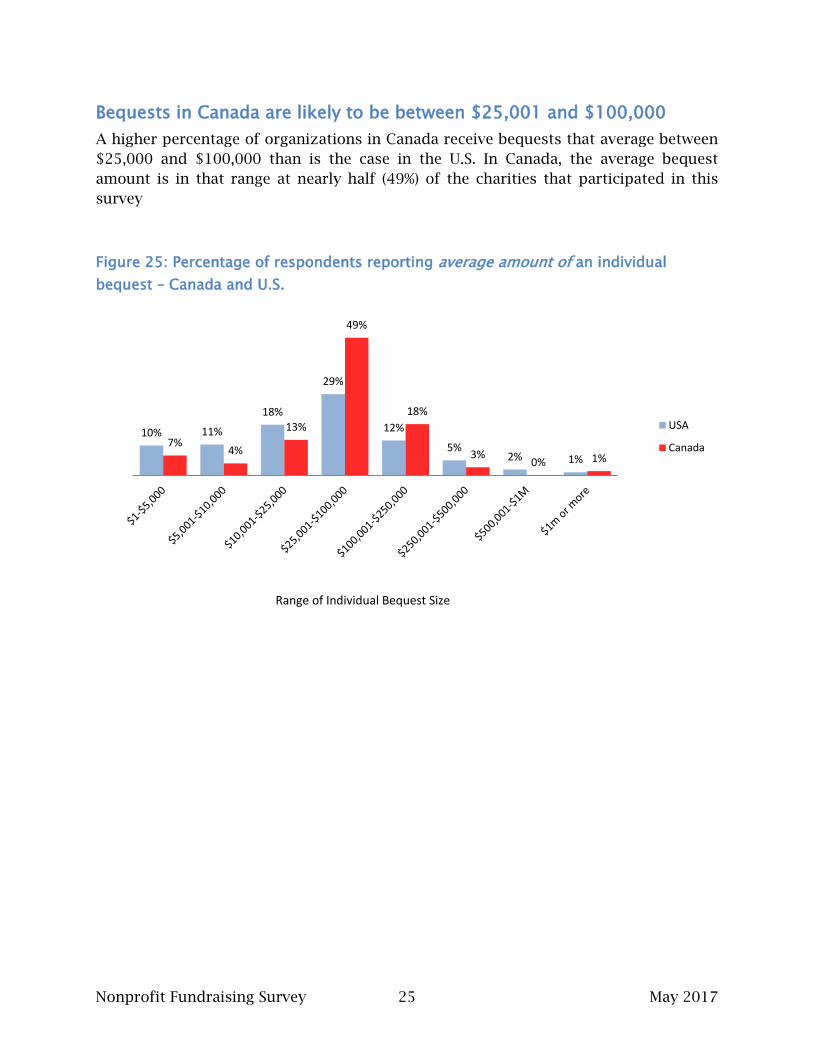
Bequests in Canada are likely to be between $25,001 and $100,000 A higher percentage of organizations in Canada receive bequests that average between $25,000 and $100,000 than is the case in the U.S. In Canada, the average bequest amount is in that range at nearly half (49%) of the charities that participated in this survey
Figure 25: Percentage of respondents reporting average amount of an individual bequest – Canada and U.S.
10% 11%
18%
29%
12%
5% 2% 1%
7% 4%
13%
49%
18%
3% 0% 1%
USA
Canada
Range of Individual Bequest Size
Nonprofit Fundraising Survey 26 May 2017
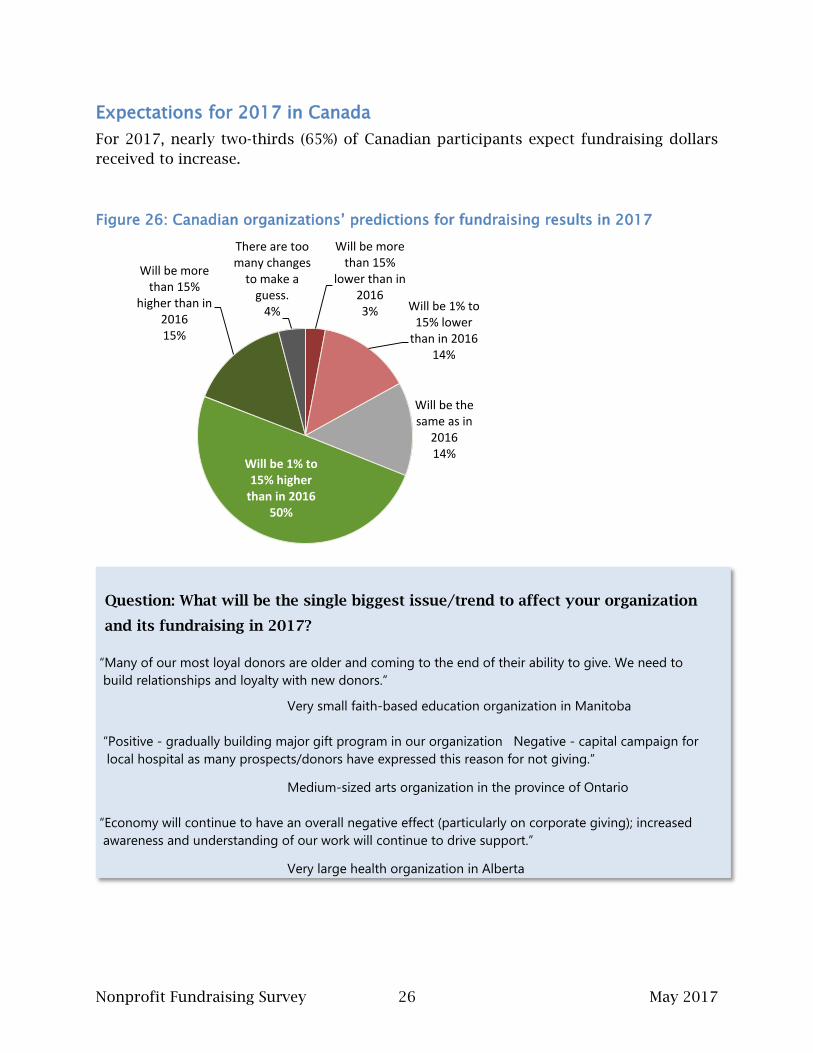
Expectations for 2017 in Canada For 2017, nearly two-thirds (65%) of Canadian participants expect fundraising dollars received to increase.
Figure 26: Canadian organizations’ predictions for fundraising results in 2017
Question: What will be the single biggest issue/trend to affect your organization
and its fundraising in 2017?
“Many of our most loyal donors are older and coming to the end of their ability to give. We need to build relationships and loyalty with new donors.”
Very small faith-based education organization in Manitoba “Positive - gradually building major gift program in our organization Negative - capital campaign for local hospital as many prospects/donors have expressed this reason for not giving.”
Medium-sized arts organization in the province of Ontario “Economy will continue to have an overall negative effect (particularly on corporate giving); increased awareness and understanding of our work will continue to drive support.”
Very large health organization in Alberta
Will be more than 15%
lower than in 2016 3% Will be 1% to
15% lower than in 2016
14%
Will be the same as in
2016 14%
Will be 1% to 15% higher
than in 2016 50%
Will be more than 15%
higher than in 2016 15%
There are too many changes
to make a guess.
4%
Nonprofit Fundraising Survey 27 May 2017
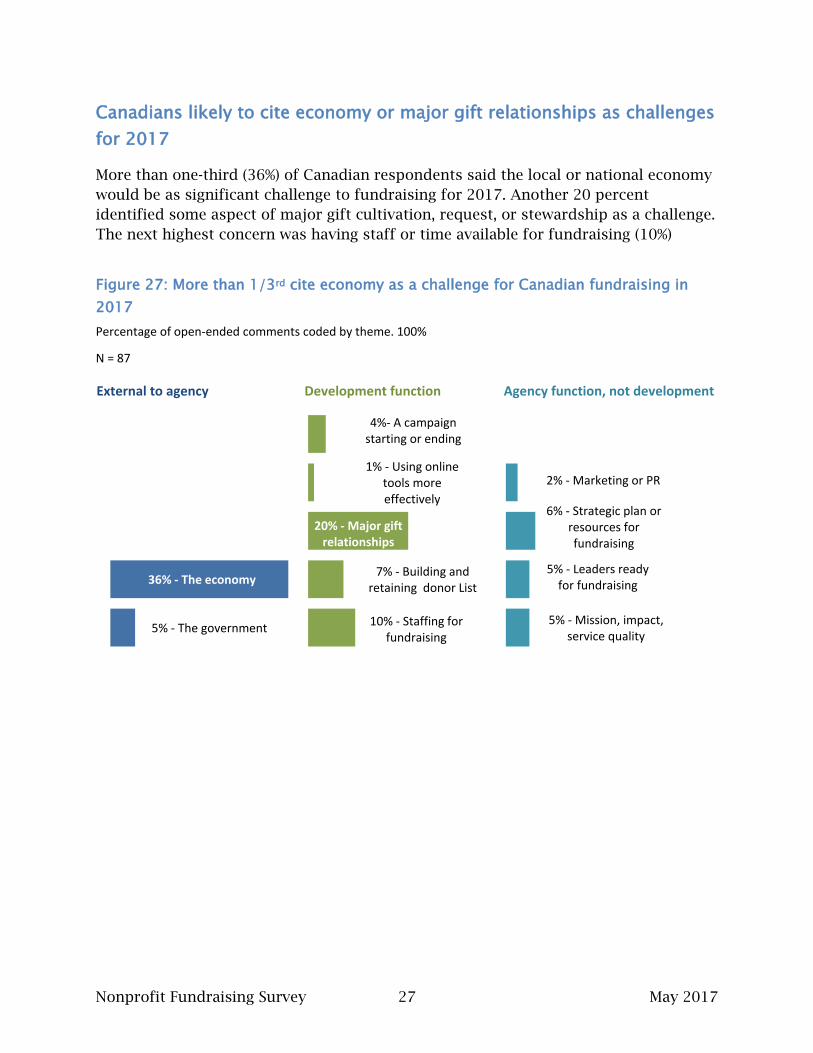
Canadians likely to cite economy or major gift relationships as challenges for 2017 More than one-third (36%) of Canadian respondents said the local or national economy would be as significant challenge to fundraising for 2017. Another 20 percent identified some aspect of major gift cultivation, request, or stewardship as a challenge. The next highest concern was having staff or time available for fundraising (10%)
Figure 27: More than 1/3rd cite economy as a challenge for Canadian fundraising in 2017 Percentage of open-ended comments coded by theme. 100%
N = 87
5% - The government
36% - The economy
10% - Staffing for fundraising
7% - Building and retaining donor List
20% - Major gift relationships
1% - Using online tools more effectively
4%- A campaign starting or ending
5% - Mission, impact, service quality
5% - Leaders ready for fundraising
6% - Strategic plan or resources for fundraising
2% - Marketing or PR
External to agency Development function Agency function, not development
Nonprofit Fundraising Survey 28 May 2017
SECTION III: NONPROFIT FUNDRAISING SURVEY RESULTS FOR THE U.S.
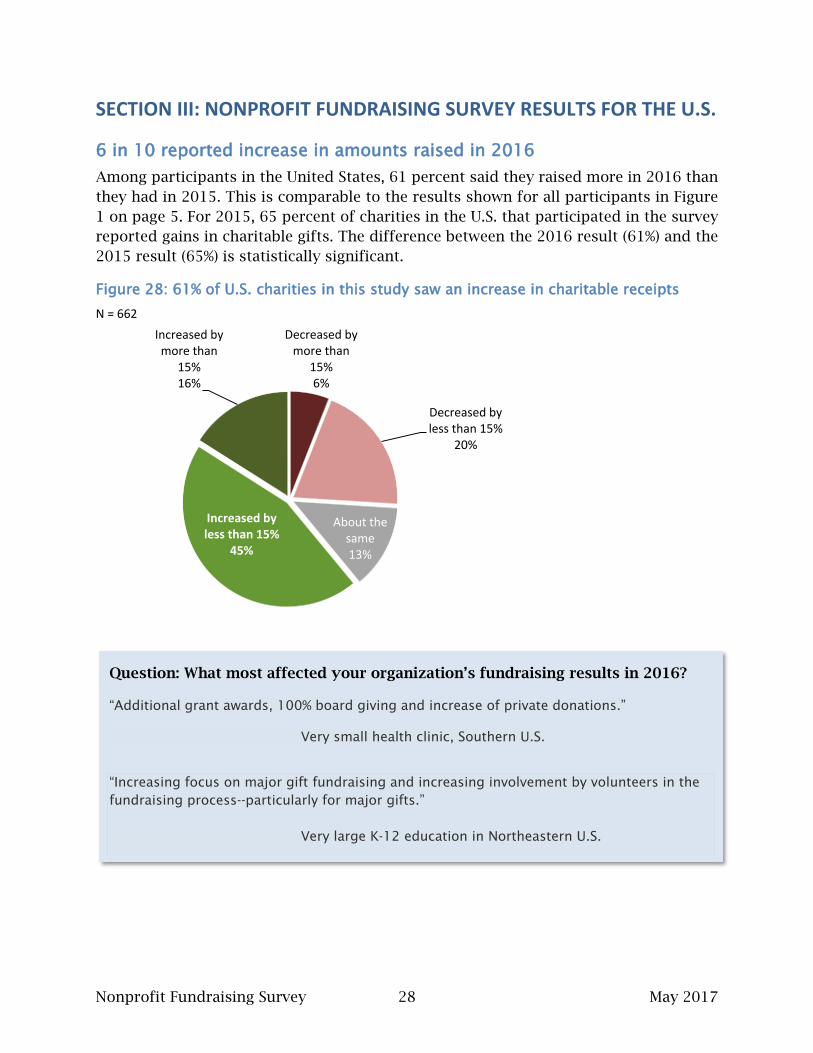
6 in 10 reported increase in amounts raised in 2016 Among participants in the United States, 61 percent said they raised more in 2016 than they had in 2015. This is comparable to the results shown for all participants in Figure 1 on page 5. For 2015, 65 percent of charities in the U.S. that participated in the survey reported gains in charitable gifts. The difference between the 2016 result (61%) and the 2015 result (65%) is statistically significant.
Figure 28: 61% of U.S. charities in this study saw an increase in charitable receipts N = 662
Decreased by more than
15% 6%
Decreased by less than 15%
20%
About the same 13%
Increased by less than 15%
45%
Increased by more than
15% 16%
Question: What most affected your organization’s fundraising results in 2016?
“Additional grant awards, 100% board giving and increase of private donations.” Very small health clinic, Southern U.S. “Increasing focus on major gift fundraising and increasing involvement by volunteers in the fundraising process--particularly for major gifts.” Very large K-12 education in Northeastern U.S.
Nonprofit Fundraising Survey 29 May 2017
24% 27% 28% 25%
14% 12% 12% 10%
62% 61% 60% 65%
Northeastn= 100
Midwestn = 195
Southn = 237
Westn = 135
Increased
Stayed thesameDecreased
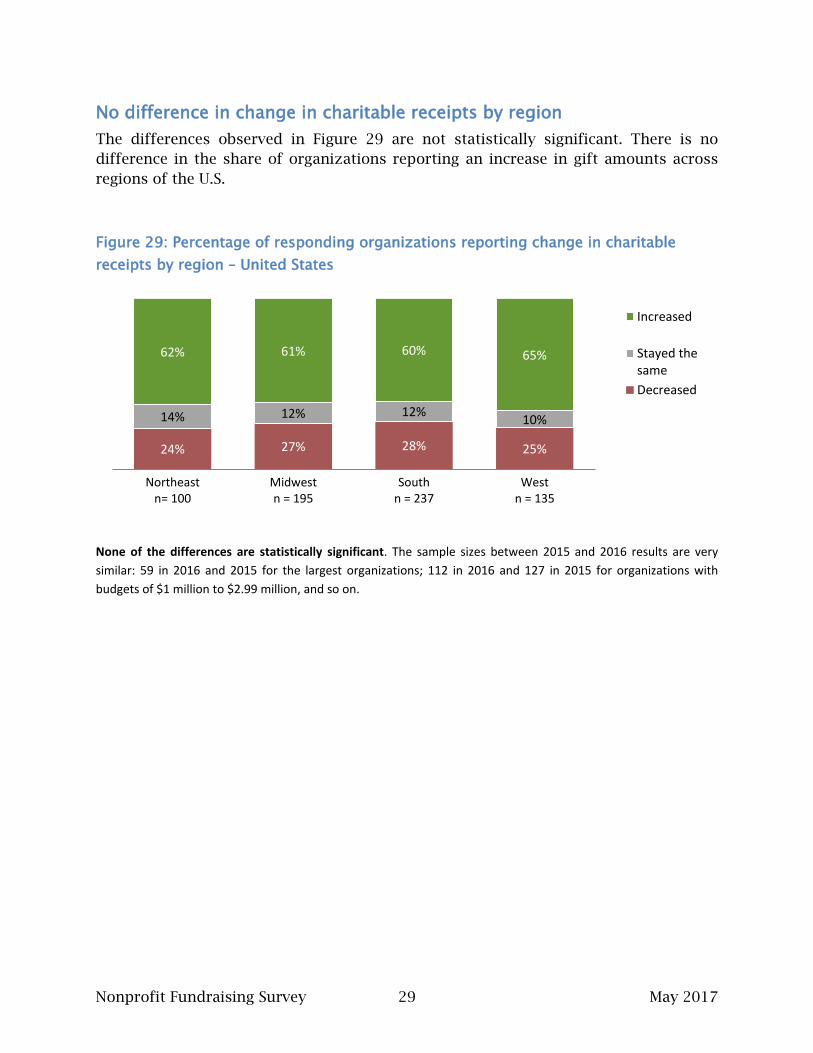
No difference in change in charitable receipts by region The differences observed in Figure 29 are not statistically significant. There is no difference in the share of organizations reporting an increase in gift amounts across regions of the U.S.
Figure 29: Percentage of responding organizations reporting change in charitable receipts by region – United States None of the differences are statistically significant. The sample sizes between 2015 and 2016 results are very similar: 59 in 2016 and 2015 for the largest organizations; 112 in 2016 and 127 in 2015 for organizations with budgets of $1 million to $2.99 million, and so on.
Nonprofit Fundraising Survey 30 May 2017
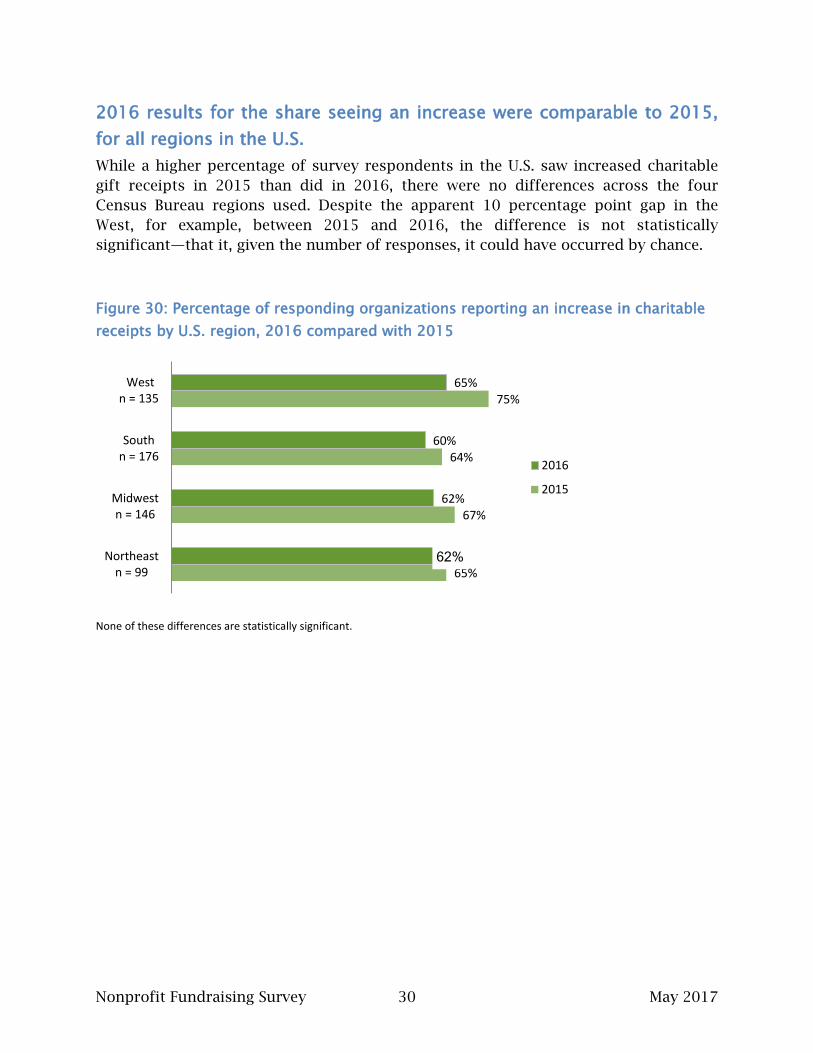
2016 results for the share seeing an increase were comparable to 2015, for all regions in the U.S. While a higher percentage of survey respondents in the U.S. saw increased charitable gift receipts in 2015 than did in 2016, there were no differences across the four Census Bureau regions used. Despite the apparent 10 percentage point gap in the West, for example, between 2015 and 2016, the difference is not statistically significant—that it, given the number of responses, it could have occurred by chance.
Figure 30: Percentage of responding organizations reporting an increase in charitable receipts by U.S. region, 2016 compared with 2015
None of these differences are statistically significant.
65%
67%
64%
75%
62%
62%
60%
65%
Northeastn = 99
Midwestn = 146
Southn = 176
Westn = 135
2016
2015
Nonprofit Fundraising Survey 31 May 2017
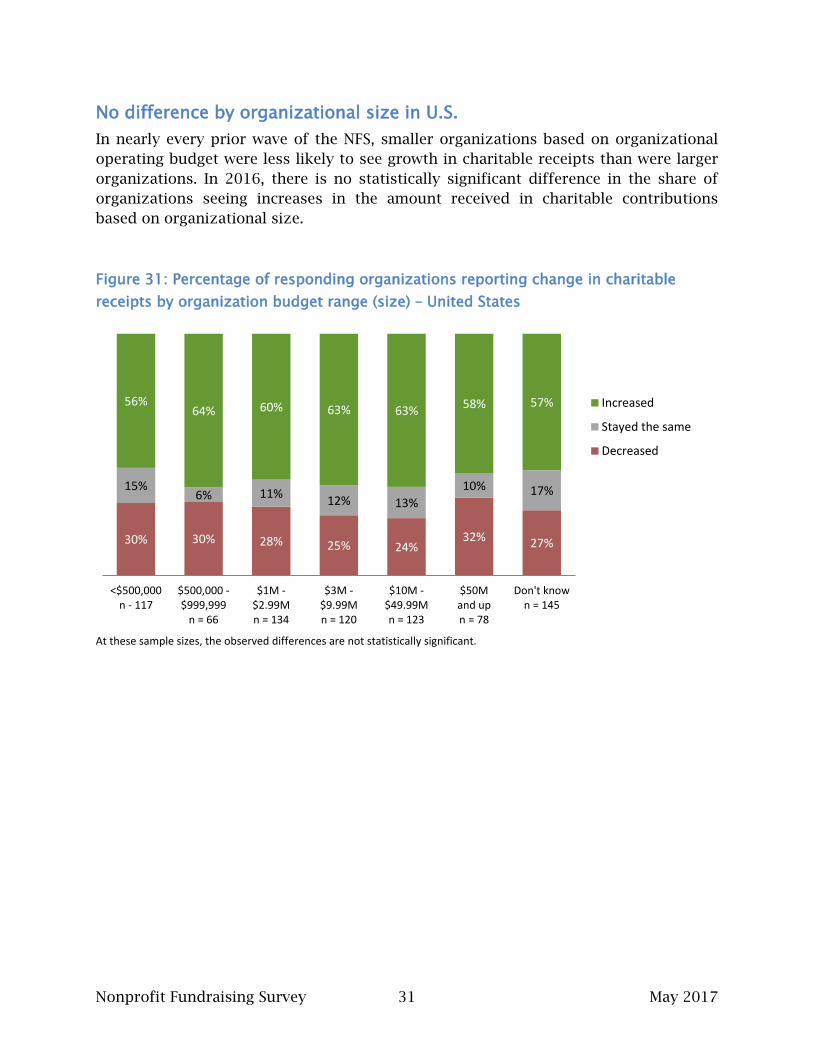
No difference by organizational size in U.S. In nearly every prior wave of the NFS, smaller organizations based on organizational operating budget were less likely to see growth in charitable receipts than were larger organizations. In 2016, there is no statistically significant difference in the share of organizations seeing increases in the amount received in charitable contributions based on organizational size.
Figure 31: Percentage of responding organizations reporting change in charitable receipts by organization budget range (size) – United States
At these sample sizes, the observed differences are not statistically significant.
30% 30% 28% 25% 24% 32% 27%
15% 6% 11% 12% 13%
10% 17%
56% 64% 60% 63% 63% 58% 57%
<$500,000n - 117
$500,000 -$999,999
n = 66
$1M -$2.99Mn = 134
$3M -$9.99Mn = 120
$10M -$49.99Mn = 123
$50Mand upn = 78
Don't known = 145
Increased
Stayed the same
Decreased
Nonprofit Fundraising Survey 32 May 2017
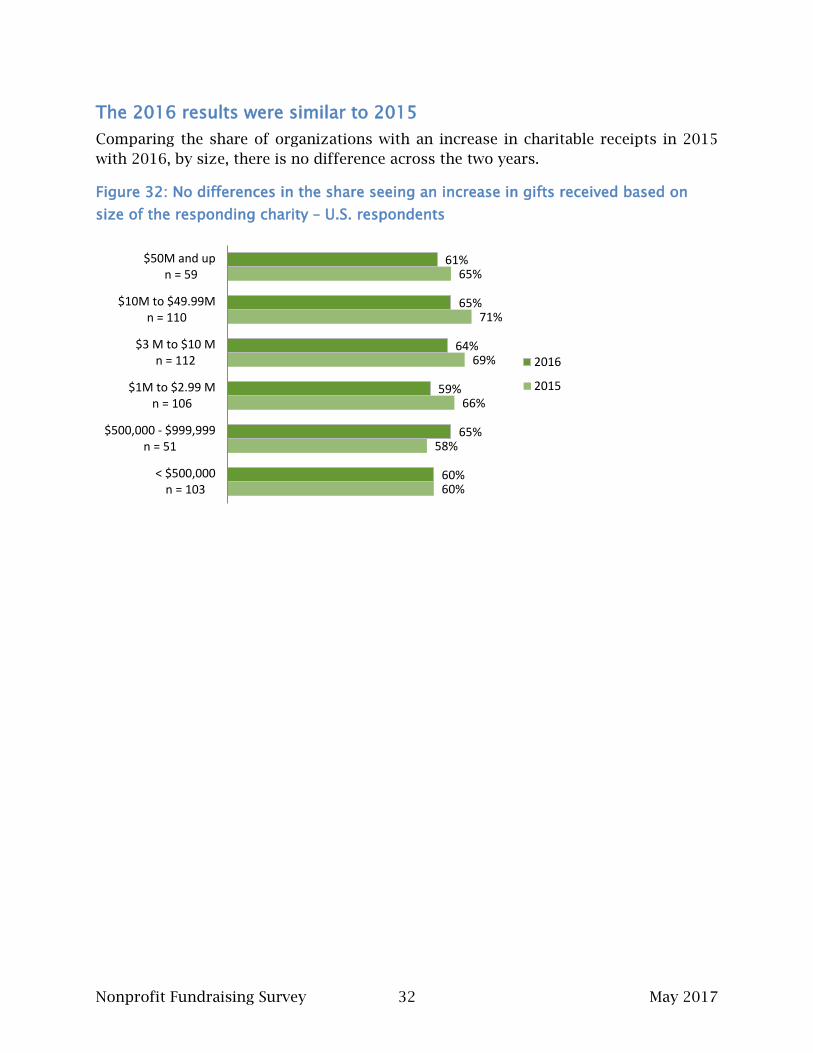
The 2016 results were similar to 2015 Comparing the share of organizations with an increase in charitable receipts in 2015 with 2016, by size, there is no difference across the two years.
Figure 32: No differences in the share seeing an increase in gifts received based on size of the responding charity – U.S. respondents
60%
58%
66%
69%
71%
65%
60%
65%
59%
64%
65%
61%
< $500,000n = 103
$500,000 - $999,999n = 51
$1M to $2.99 Mn = 106
$3 M to $10 Mn = 112
$10M to $49.99Mn = 110
$50M and up n = 59
2016
2015
Nonprofit Fundraising Survey 33 May 2017
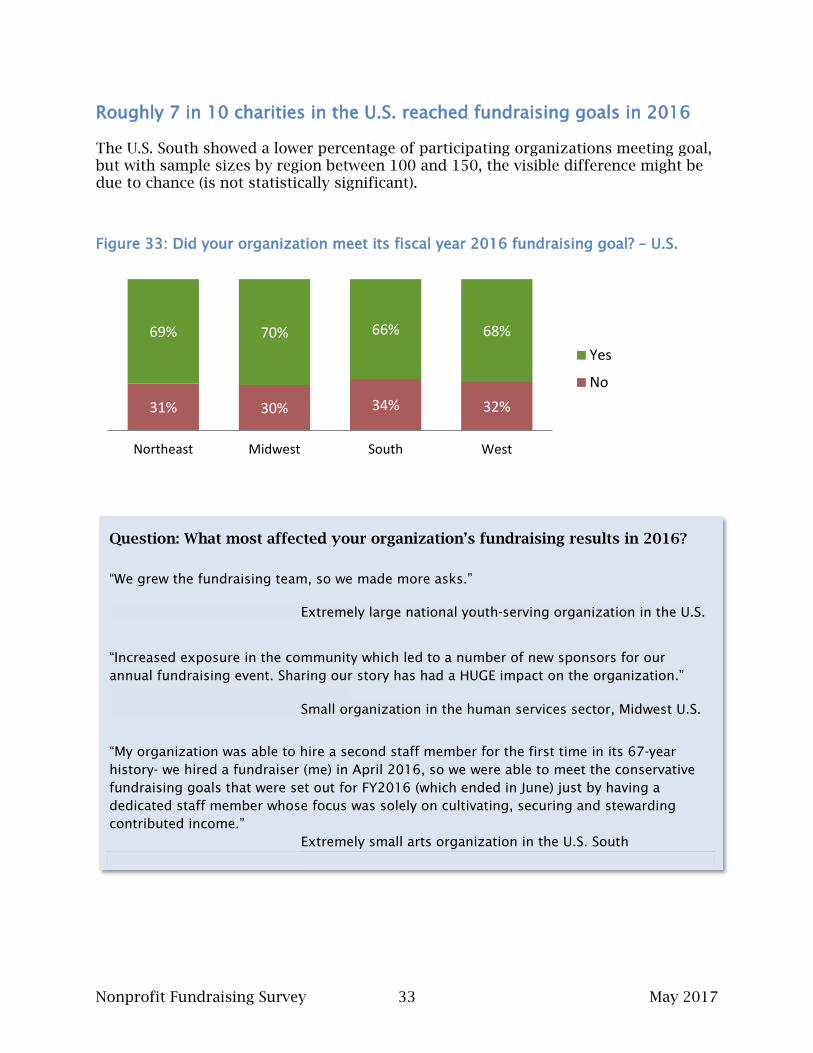
Roughly 7 in 10 charities in the U.S. reached fundraising goals in 2016 The U.S. South showed a lower percentage of participating organizations meeting goal, but with sample sizes by region between 100 and 150, the visible difference might be due to chance (is not statistically significant).
Figure 33: Did your organization meet its fiscal year 2016 fundraising goal? – U.S.
31% 30% 34% 32%
69% 70% 66% 68%
Northeast Midwest South West
Yes
No
Question: What most affected your organization’s fundraising results in 2016?
“We grew the fundraising team, so we made more asks.”
Extremely large national youth-serving organization in the U.S. “Increased exposure in the community which led to a number of new sponsors for our annual fundraising event. Sharing our story has had a HUGE impact on the organization.” Small organization in the human services sector, Midwest U.S.
“My organization was able to hire a second staff member for the first time in its 67-year history- we hired a fundraiser (me) in April 2016, so we were able to meet the conservative fundraising goals that were set out for FY2016 (which ended in June) just by having a dedicated staff member whose focus was solely on cultivating, securing and stewarding contributed income.” Extremely small arts organization in the U.S. South
Nonprofit Fundraising Survey 34 May 2017
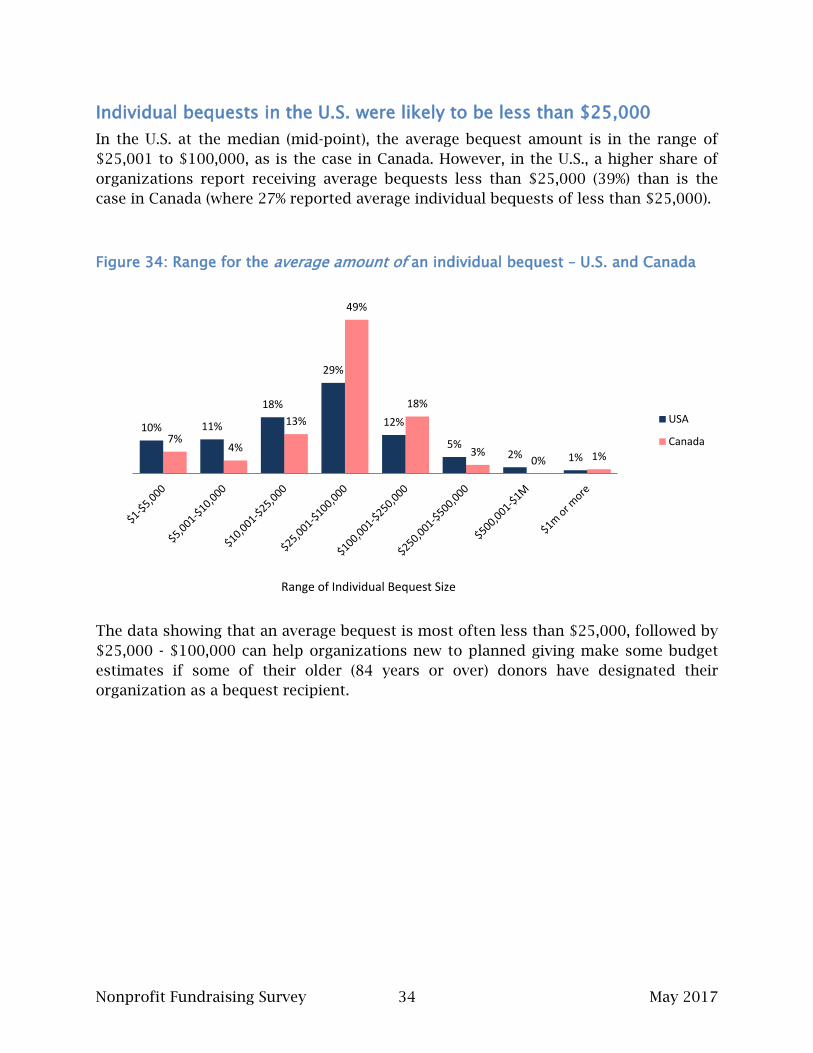
Individual bequests in the U.S. were likely to be less than $25,000 In the U.S. at the median (mid-point), the average bequest amount is in the range of $25,001 to $100,000, as is the case in Canada. However, in the U.S., a higher share of organizations report receiving average bequests less than $25,000 (39%) than is the case in Canada (where 27% reported average individual bequests of less than $25,000).
Figure 34: Range for the average amount of an individual bequest – U.S. and Canada
The data showing that an average bequest is most often less than $25,000, followed by $25,000 - $100,000 can help organizations new to planned giving make some budget estimates if some of their older (84 years or over) donors have designated their organization as a bequest recipient.
10% 11%
18%
29%
12%
5% 2% 1%
7% 4%
13%
49%
18%
3% 0% 1%
USA
Canada
Range of Individual Bequest Size
Nonprofit Fundraising Survey 35 May 2017
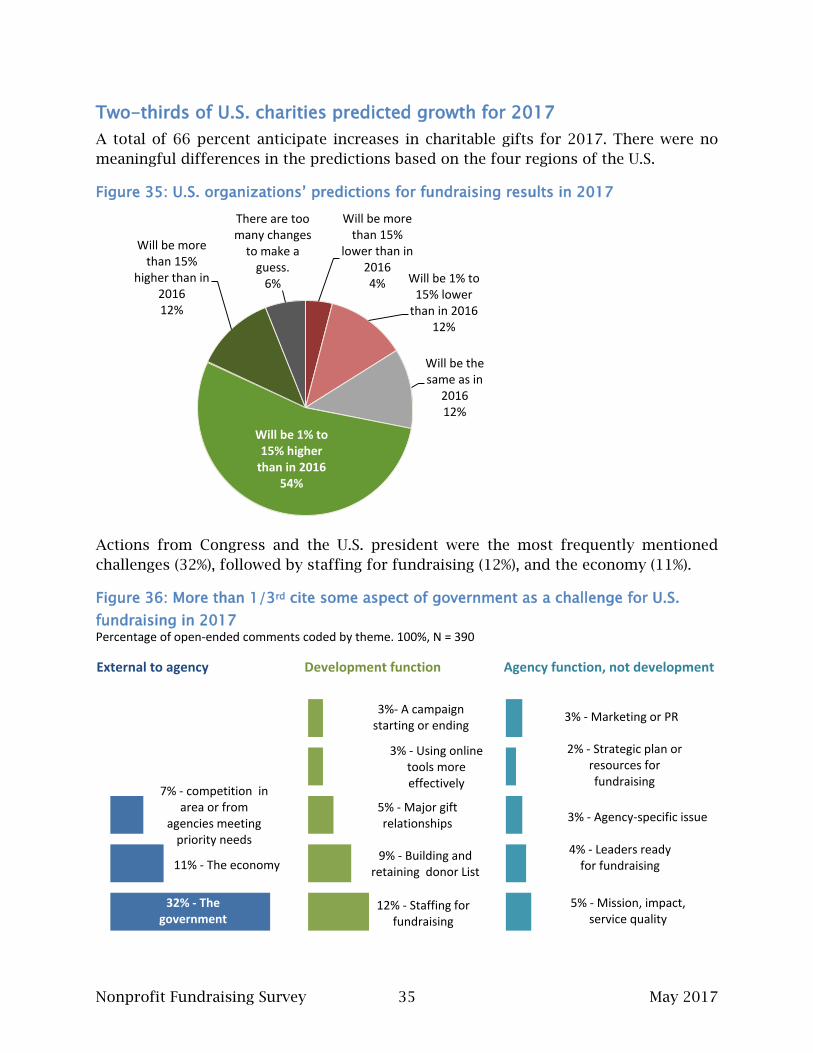
Two-thirds of U.S. charities predicted growth for 2017 A total of 66 percent anticipate increases in charitable gifts for 2017. There were no meaningful differences in the predictions based on the four regions of the U.S.
Figure 35: U.S. organizations’ predictions for fundraising results in 2017
Actions from Congress and the U.S. president were the most frequently mentioned challenges (32%), followed by staffing for fundraising (12%), and the economy (11%).
Figure 36: More than 1/3rd cite some aspect of government as a challenge for U.S. fundraising in 2017 Percentage of open-ended comments coded by theme. 100%, N = 390
Will be more than 15%
lower than in 2016 4% Will be 1% to
15% lower than in 2016
12%
Will be the same as in
2016 12%
Will be 1% to 15% higher
than in 2016 54%
Will be more than 15%
higher than in 2016 12%
There are too many changes
to make a guess.
6%
32% - The government
11% - The economy
7% - competition in area or from
agencies meeting priority needs
12% - Staffing for fundraising
9% - Building and retaining donor List
5% - Major gift relationships
3% - Using online tools more effectively
3%- A campaign starting or ending
5% - Mission, impact, service quality
4% - Leaders ready for fundraising
2% - Strategic plan or resources for fundraising
3% - Marketing or PR
3% - Agency-specific issue
External to agency Development function Agency function, not development
Nonprofit Fundraising Survey 36 May 2017
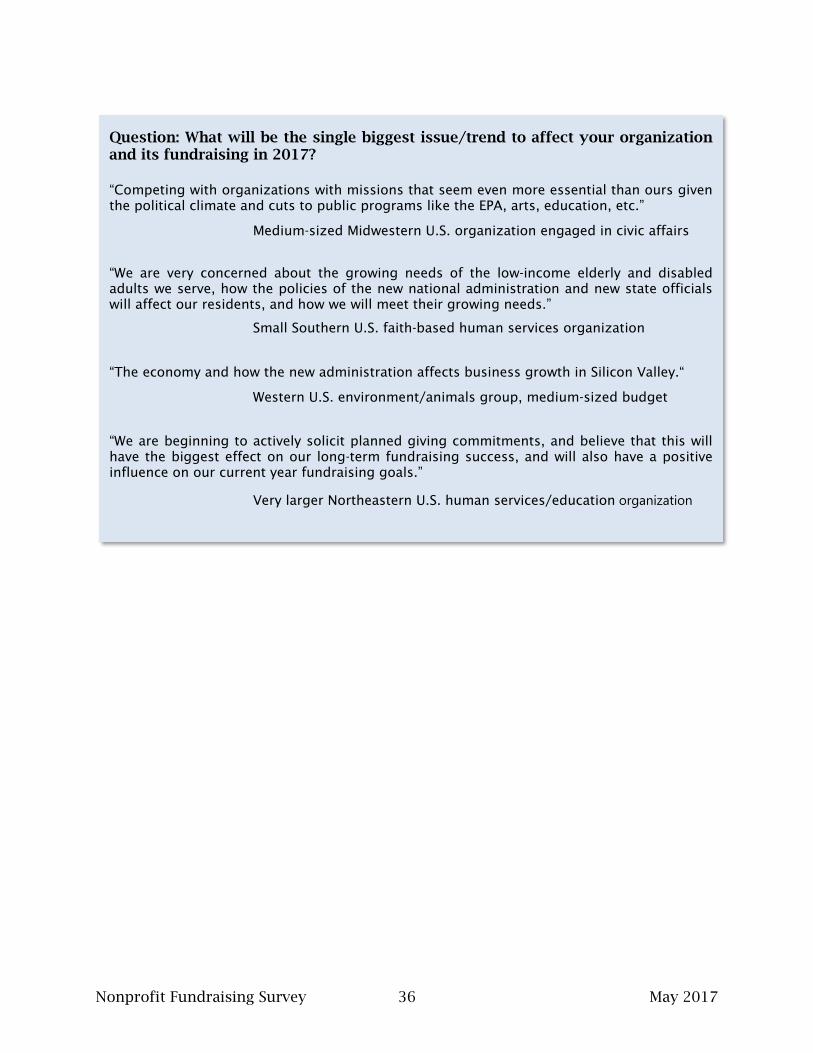
Question: What will be the single biggest issue/trend to affect your organization and its fundraising in 2017?
“Competing with organizations with missions that seem even more essential than ours given the political climate and cuts to public programs like the EPA, arts, education, etc.”
Medium-sized Midwestern U.S. organization engaged in civic affairs
“We are very concerned about the growing needs of the low-income elderly and disabled adults we serve, how the policies of the new national administration and new state officials will affect our residents, and how we will meet their growing needs.”
Small Southern U.S. faith-based human services organization
“The economy and how the new administration affects business growth in Silicon Valley.“
Western U.S. environment/animals group, medium-sized budget
“We are beginning to actively solicit planned giving commitments, and believe that this will have the biggest effect on our long-term fundraising success, and will also have a positive influence on our current year fundraising goals.”
Very larger Northeastern U.S. human services/education organization
Nonprofit Fundraising Survey 37 May 2017
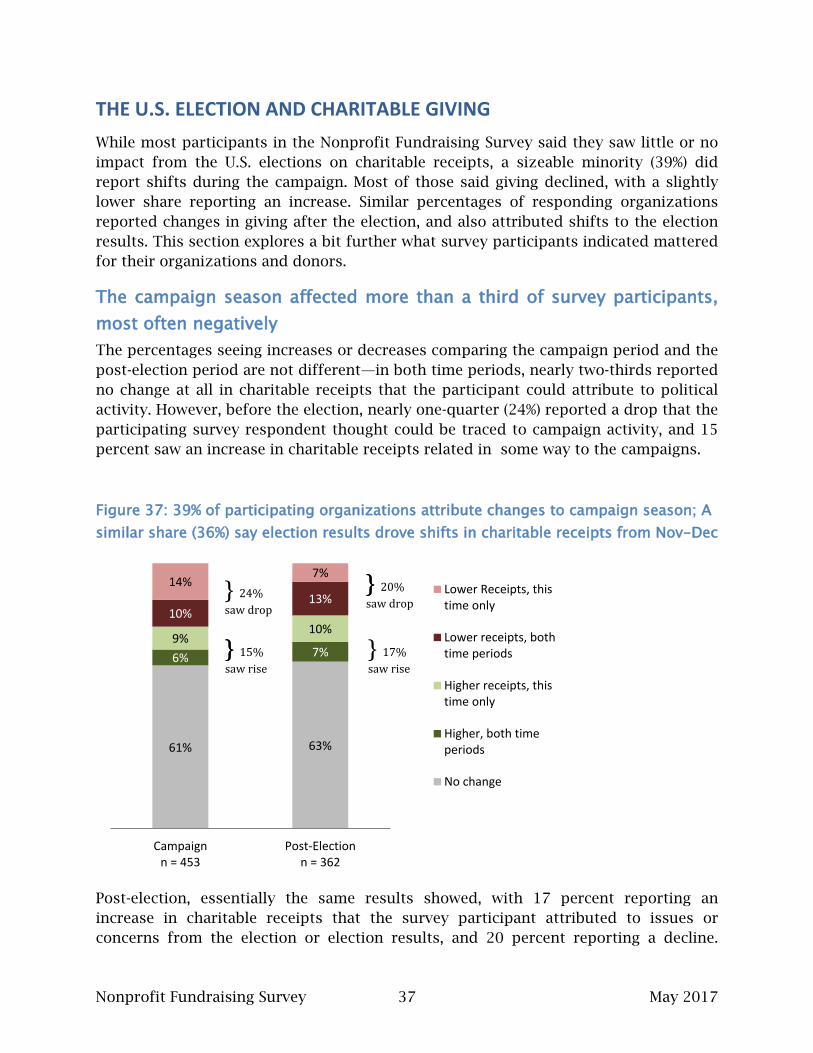
THE U.S. ELECTION AND CHARITABLE GIVING While most participants in the Nonprofit Fundraising Survey said they saw little or no impact from the U.S. elections on charitable receipts, a sizeable minority (39%) did report shifts during the campaign. Most of those said giving declined, with a slightly lower share reporting an increase. Similar percentages of responding organizations reported changes in giving after the election, and also attributed shifts to the election results. This section explores a bit further what survey participants indicated mattered for their organizations and donors.
The campaign season affected more than a third of survey participants, most often negatively The percentages seeing increases or decreases comparing the campaign period and the post-election period are not different—in both time periods, nearly two-thirds reported no change at all in charitable receipts that the participant could attribute to political activity. However, before the election, nearly one-quarter (24%) reported a drop that the participating survey respondent thought could be traced to campaign activity, and 15 percent saw an increase in charitable receipts related in some way to the campaigns.
Figure 37: 39% of participating organizations attribute changes to campaign season; A similar share (36%) say election results drove shifts in charitable receipts from Nov-Dec
Post-election, essentially the same results showed, with 17 percent reporting an increase in charitable receipts that the survey participant attributed to issues or concerns from the election or election results, and 20 percent reporting a decline.
61% 63%
6% 7% 9%
10% 10%
13% 14%
7%
Campaignn = 453
Post-Electionn = 362
Lower Receipts, thistime only
Lower receipts, bothtime periods
Higher receipts, thistime only
Higher, both timeperiods
No change
} 24% saw drop
} 20% saw drop
} 15% saw rise
}
} } 17% saw rise
Nonprofit Fundraising Survey 38 May 2017
There were no differences by size of organizational budget. Survey participants could write about what drove charitable receipts up or down based on their observations of political campaigns and election results. The following are quotations from survey participants, organized into themes by NRC analysts.
Comments from organizations that saw a decline during the campaign season DURING CAMPAIGN SEASON, DONOR PRIORITIES SHIFTED
• As an environmental 501(c)3, we saw more funding given to social service organizations or election campaigns in 2016.
• We heard from … luncheon table hosts that filling tables was more difficult this year, and that … it
was because friends/colleagues had already depleted their philanthropic budget on campaigns.
• It [the campaign] has siphoned funding away, as we are an arts & culture org, and donors feel there are more pressing needs in the current political climate.
DONORS FELT PESSIMISTIC ABOUT FUTURE DURING CAMPAIGN
• Market volatility seemed to make donors more cautious
• The campaign depressed the staff and volunteers, as well as donors. After the campaign ended,
giving increased through the end of the year.
• Economic crunch. Election year hold-outs. State programs such as PFD cut in half. All contributed to a lesser income year.
CAMPAIGN POLITICS MATTER A GREAT DEAL TO SOME DONORS
• Four entities support our organization; operating, foundation and two political entities.
Fundraising results are … highly dependent upon state electoral races in our region.
• Because we primarily receive funds from corporations, we found that donors delayed some transfers until after the election.
• We slowed down in 4th qtr calendar year donations and end of year appeals were slower than last
year coming in- most came in after December (Jan/Feb). MESSAGING GOT TOUGHER DURING CAMPAIGNS
• Too many distractions, we lost revenue.
• Misleading advertisements sponsored by a national-level organization of a similar name caused
some confusion and challenges when raising funds locally from individuals.
Nonprofit Fundraising Survey 39 May 2017
Comments from organizations that saw an increase in charitable gifts received during the campaign season.
DONORS EXPRESSING THEIR VALUES THROUGH PHILANTHROPY
• Major donor(s) gave us more because they saw our mission threatened or challenged by a
political campaign or campaigns.
• Previous research has shown that our donor base is roughly evenly split between conservative and liberal supporters. But the nature of our mission/work is such that at this time it aligns more left than right, especially in light of the new administration's rhetoric and proposed policy recommendations. This may have driven both our left-leaning and our moderate conservative supporters to increase their giving.
• We have seen an increase in private donations with notes included in the contributions that have
made reference to the political climate, both for and against our current situation.
• We serve refugees and immigrants. The campaign rhetoric increased interest in and support of our work.
DONORS SEE BRIGHTER ECONOMY IN THE FUTURE AS A RESULT OF CAMPAIGN
• Had great impact on our annual fundraising event locally as the presidential candidate was
announced a week prior. People in our area are very Republican and we felt were feeling very confident about spending money at our event … We live in a very oil impacted area, therefore the people in our area [looked for a] positive light on bringing back jobs in our state.
• Very positive….The majority of major donors and endowments come from business and business
leaders, the better they do will transfer to the better we will do in our fundraising efforts. The general mood of business is very positive and will have a positive impact on development.
• Considered tax cuts will stimulate more giving as disposable income increases and businesses hire
more employees.
Nonprofit Fundraising Survey 40 May 2017
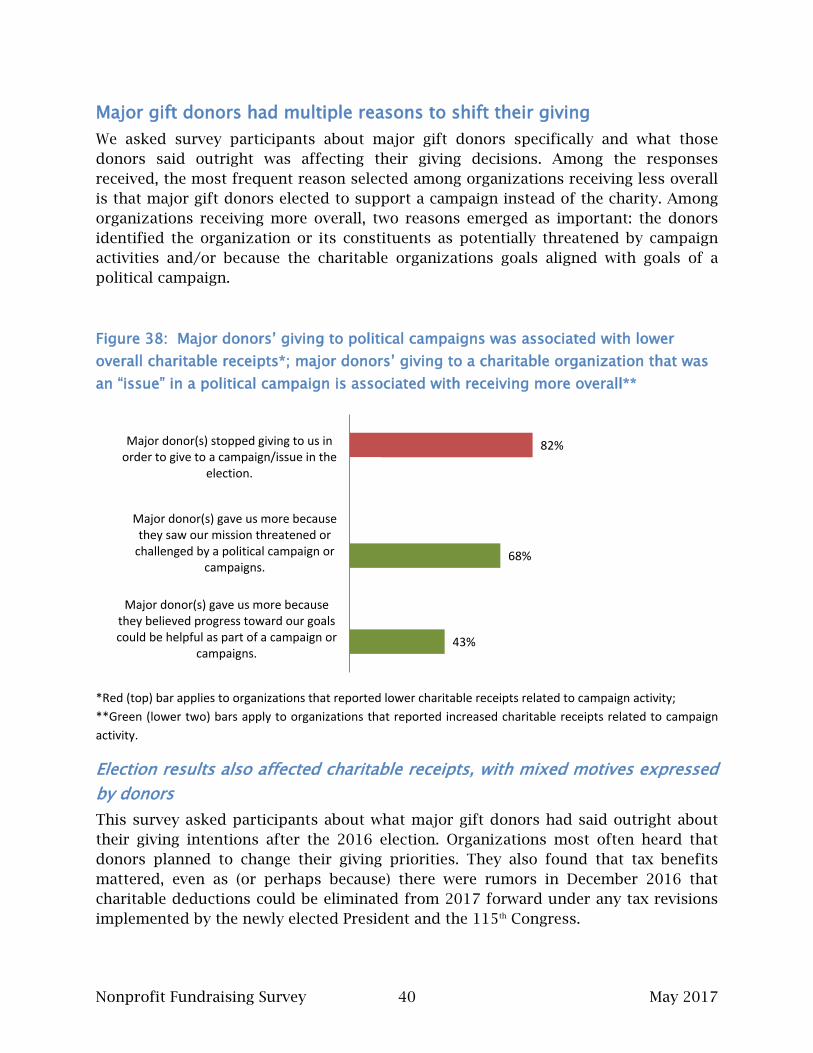
Major gift donors had multiple reasons to shift their giving We asked survey participants about major gift donors specifically and what those donors said outright was affecting their giving decisions. Among the responses received, the most frequent reason selected among organizations receiving less overall is that major gift donors elected to support a campaign instead of the charity. Among organizations receiving more overall, two reasons emerged as important: the donors identified the organization or its constituents as potentially threatened by campaign activities and/or because the charitable organizations goals aligned with goals of a political campaign.
Figure 38: Major donors’ giving to political campaigns was associated with lower overall charitable receipts*; major donors’ giving to a charitable organization that was an “issue” in a political campaign is associated with receiving more overall**
*Red (top) bar applies to organizations that reported lower charitable receipts related to campaign activity; **Green (lower two) bars apply to organizations that reported increased charitable receipts related to campaign activity.
Election results also affected charitable receipts, with mixed motives expressed by donors This survey asked participants about what major gift donors had said outright about their giving intentions after the 2016 election. Organizations most often heard that donors planned to change their giving priorities. They also found that tax benefits mattered, even as (or perhaps because) there were rumors in December 2016 that charitable deductions could be eliminated from 2017 forward under any tax revisions implemented by the newly elected President and the 115th Congress.
82%
12%
12%
14%
68%
43%
Major donor(s) stopped giving to us inorder to give to a campaign/issue in the
election.
Major donor(s) gave us more becausethey saw our mission threatened or
challenged by a political campaign orcampaigns.
Major donor(s) gave us more becausethey believed progress toward our goalscould be helpful as part of a campaign or
campaigns.
Nonprofit Fundraising Survey 41 May 2017
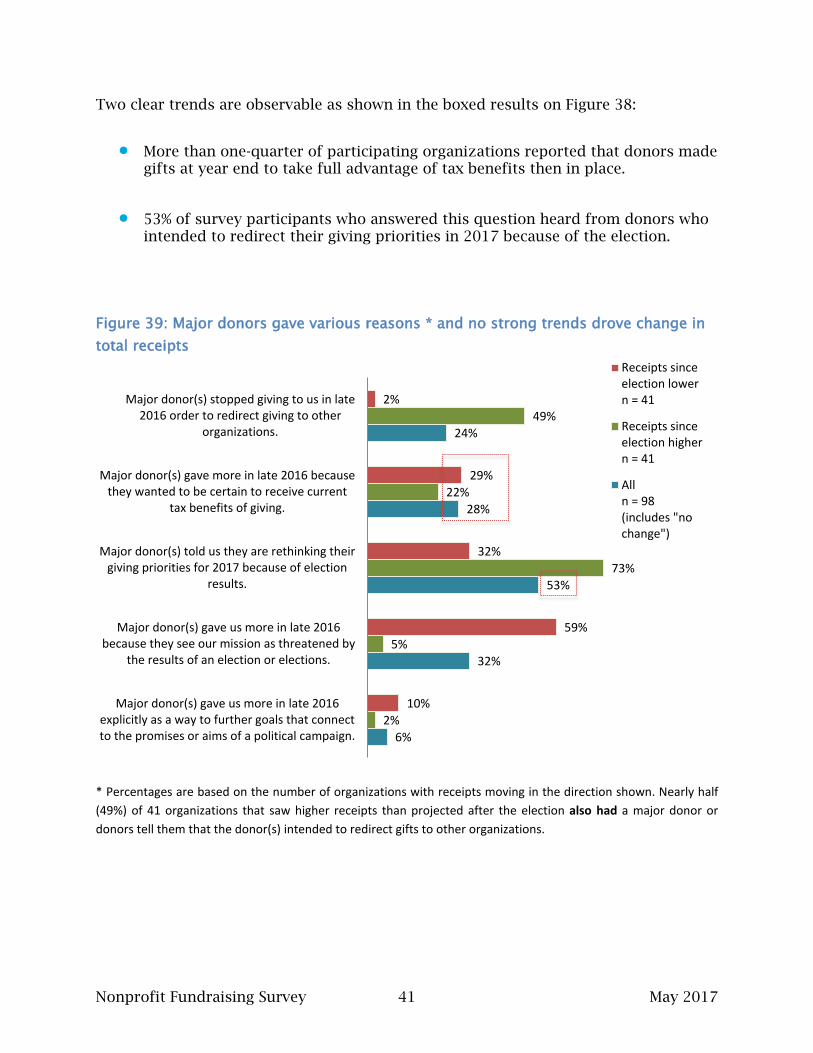
Two clear trends are observable as shown in the boxed results on Figure 38:
• More than one-quarter of participating organizations reported that donors made gifts at year end to take full advantage of tax benefits then in place.
• 53% of survey participants who answered this question heard from donors who intended to redirect their giving priorities in 2017 because of the election.
Figure 39: Major donors gave various reasons * and no strong trends drove change in total receipts
* Percentages are based on the number of organizations with receipts moving in the direction shown. Nearly half (49%) of 41 organizations that saw higher receipts than projected after the election also had a major donor or donors tell them that the donor(s) intended to redirect gifts to other organizations.
2%
29%
32%
59%
10%
49%
22%
73%
5%
2%
24%
28%
53%
32%
6%
Major donor(s) stopped giving to us in late2016 order to redirect giving to other
organizations.
Major donor(s) gave more in late 2016 becausethey wanted to be certain to receive current
tax benefits of giving.
Major donor(s) told us they are rethinking theirgiving priorities for 2017 because of election
results.
Major donor(s) gave us more in late 2016because they see our mission as threatened by
the results of an election or elections.
Major donor(s) gave us more in late 2016explicitly as a way to further goals that connectto the promises or aims of a political campaign.
Receipts sinceelection lowern = 41
Receipts sinceelection highern = 41
Alln = 98(includes "nochange")
Nonprofit Fundraising Survey 42 May 2017
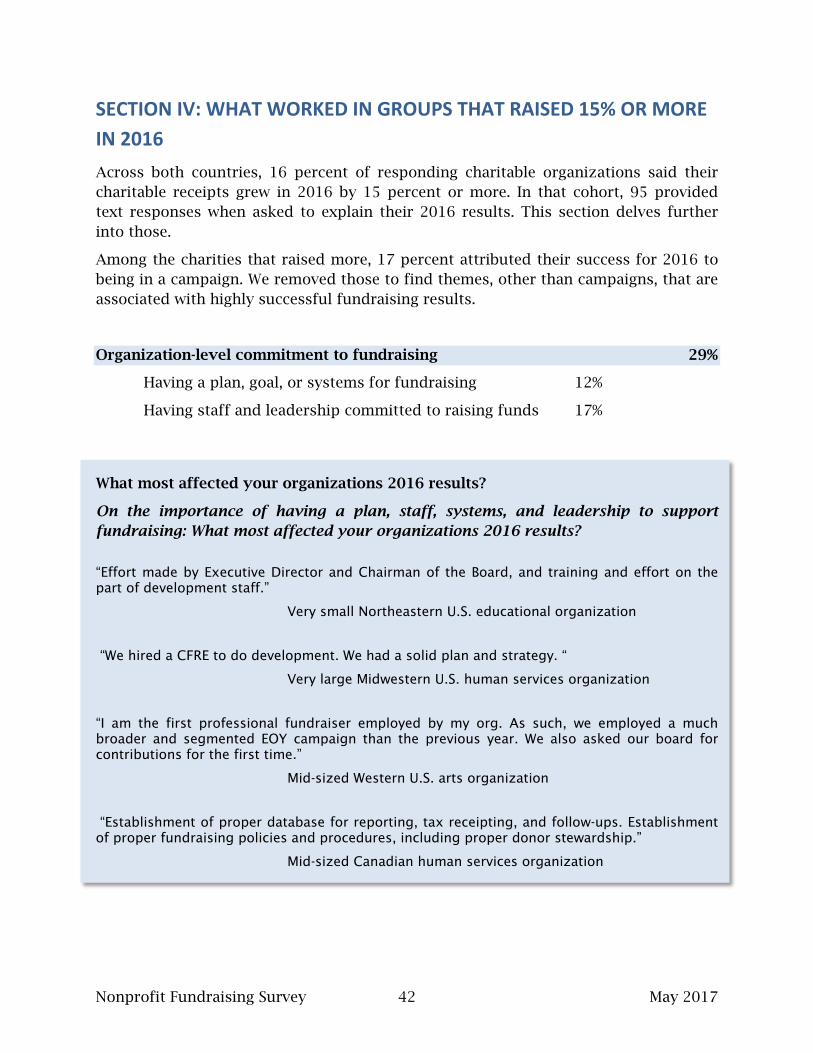
SECTION IV: WHAT WORKED IN GROUPS THAT RAISED 15% OR MORE IN 2016 Across both countries, 16 percent of responding charitable organizations said their charitable receipts grew in 2016 by 15 percent or more. In that cohort, 95 provided text responses when asked to explain their 2016 results. This section delves further into those.
Among the charities that raised more, 17 percent attributed their success for 2016 to being in a campaign. We removed those to find themes, other than campaigns, that are associated with highly successful fundraising results.
Organization-level commitment to fundraising 29%
Having a plan, goal, or systems for fundraising 12%
Having staff and leadership committed to raising funds 17%
What most affected your organizations 2016 results?
On the importance of having a plan, staff, systems, and leadership to support fundraising: What most affected your organizations 2016 results?
“Effort made by Executive Director and Chairman of the Board, and training and effort on the part of development staff.”
Very small Northeastern U.S. educational organization
“We hired a CFRE to do development. We had a solid plan and strategy. “
Very large Midwestern U.S. human services organization
“I am the first professional fundraiser employed by my org. As such, we employed a much broader and segmented EOY campaign than the previous year. We also asked our board for contributions for the first time.”
Mid-sized Western U.S. arts organization
“Establishment of proper database for reporting, tax receipting, and follow-ups. Establishment of proper fundraising policies and procedures, including proper donor stewardship.”
Mid-sized Canadian human services organization
Nonprofit Fundraising Survey 43 May 2017
What most affected your organizations 2016 results?
Individual donors, including bequests “We have an aging donor base which makes it challenging. I was able to increase our dollars raised over FY15 by 150+% because of increased visibility with social media marketing, and mostly increased number of direct mail solicitations.”
Medium-sized Western U.S. religious organization “We partnered with Thompson & Associates to strengthen our estate planning program. As often happens, those who benefited from estate planning were more engaged, enabling us to more than double our annual fund (from 2015 to 2016).”
Very small Midwestern U.S. health organization “We had a large bequest plus we raised major gifts. We have never concentrated as much time and attention on special gifts before.”
Small Canadian U.S. faith-based education organization “We started a major gift program in 2014 and saw the results really start to come in in 2016 with being able to make more direct and personal asks to donors. We also were able to make pre-asks to our event major donors which also increased our overall success. “
Medium-sized Western U.S. human services organization
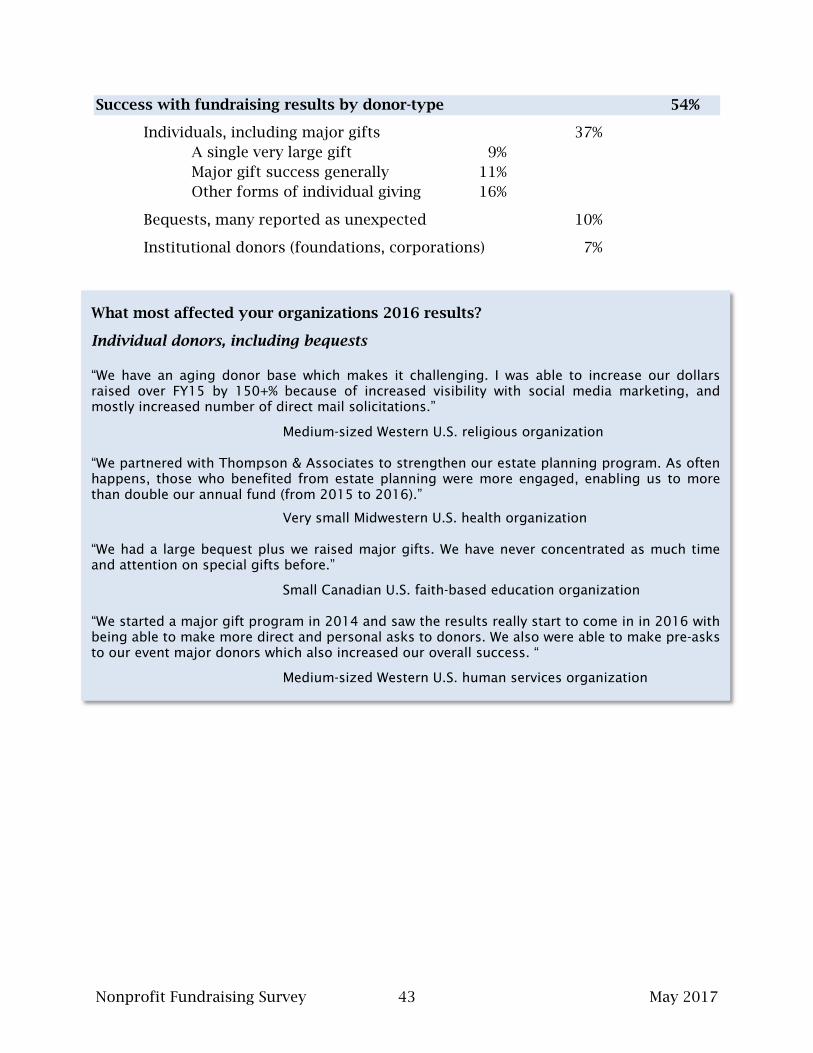
Success with fundraising results by donor-type 54%
Individuals, including major gifts 37% A single very large gift 9% Major gift success generally 11% Other forms of individual giving 16%
Bequests, many reported as unexpected 10%
Institutional donors (foundations, corporations) 7%
Nonprofit Fundraising Survey 44 May 2017
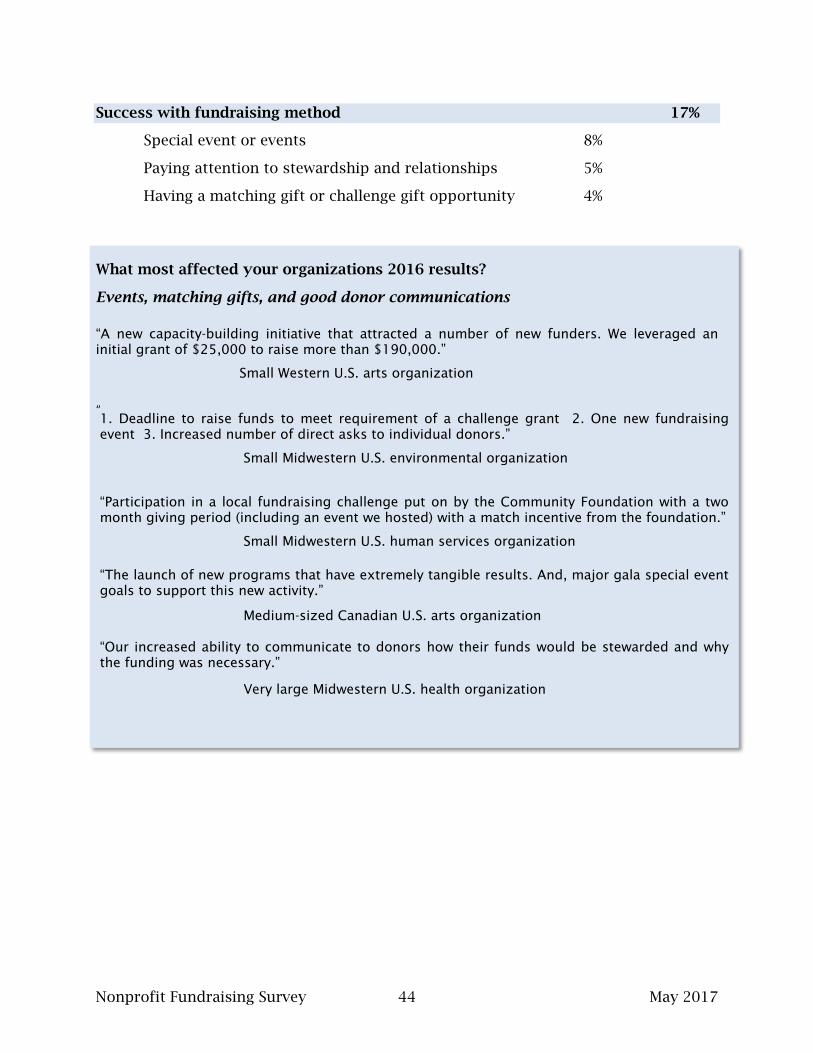
1. Deadline to raise funds to meet requirement of a challenge grant 2. One new fundraising event 3. Increased number of direct asks to individual donors.”
Small Midwestern U.S. environmental organization
“Participation in a local fundraising challenge put on by the Community Foundation with a two month giving period (including an event we hosted) with a match incentive from the foundation.”
Small Midwestern U.S. human services organization “The launch of new programs that have extremely tangible results. And, major gala special event goals to support this new activity.”
Medium-sized Canadian U.S. arts organization “Our increased ability to communicate to donors how their funds would be stewarded and why the funding was necessary.”
Very large Midwestern U.S. health organization
Success with fundraising method 17%
Special event or events 8%
Paying attention to stewardship and relationships 5%
Having a matching gift or challenge gift opportunity 4%
What most affected your organizations 2016 results?
Events, matching gifts, and good donor communications “A new capacity-building initiative that attracted a number of new funders. We leveraged an initial grant of $25,000 to raise more than $190,000.”
Small Western U.S. arts organization
“
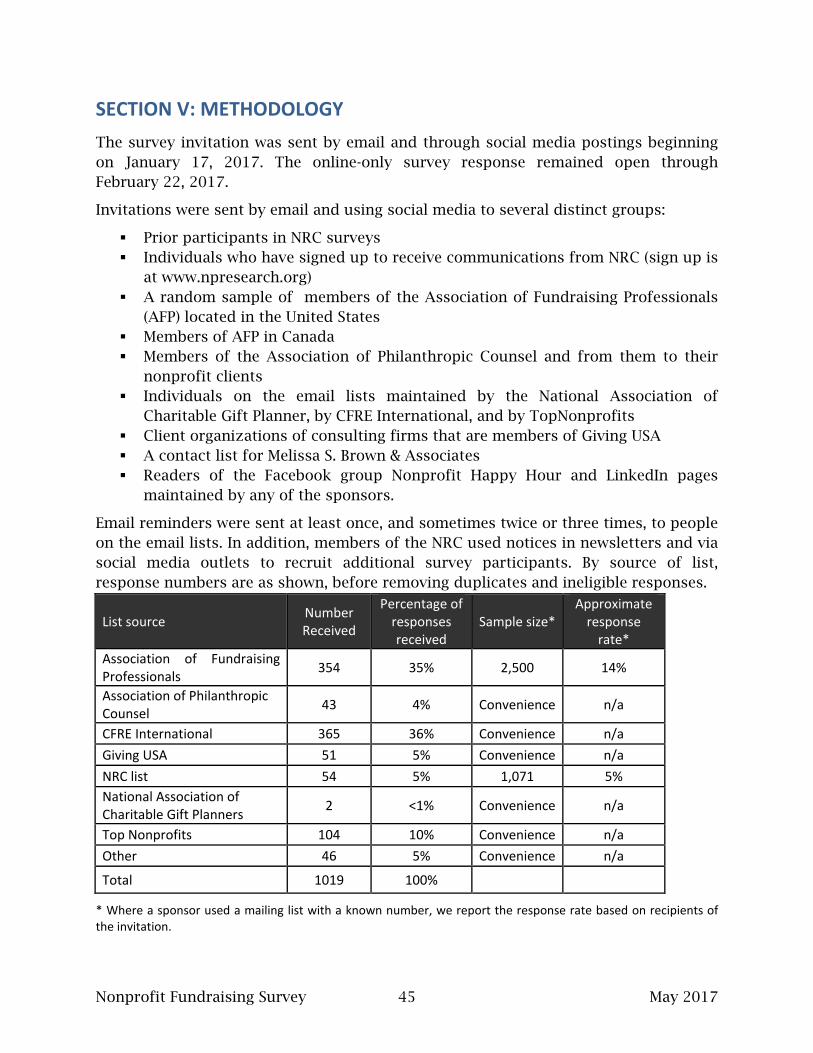
Nonprofit Fundraising Survey 45 May 2017
SECTION V: METHODOLOGY The survey invitation was sent by email and through social media postings beginning on January 17, 2017. The online-only survey response remained open through February 22, 2017.
Invitations were sent by email and using social media to several distinct groups:
Prior participants in NRC surveys Individuals who have signed up to receive communications from NRC (sign up is
at www.npresearch.org) A random sample of members of the Association of Fundraising Professionals
(AFP) located in the United States Members of AFP in Canada Members of the Association of Philanthropic Counsel and from them to their
nonprofit clients Individuals on the email lists maintained by the National Association of
Charitable Gift Planner, by CFRE International, and by TopNonprofits Client organizations of consulting firms that are members of Giving USA A contact list for Melissa S. Brown & Associates Readers of the Facebook group Nonprofit Happy Hour and LinkedIn pages
maintained by any of the sponsors.
Email reminders were sent at least once, and sometimes twice or three times, to people on the email lists. In addition, members of the NRC used notices in newsletters and via social media outlets to recruit additional survey participants. By source of list, response numbers are as shown, before removing duplicates and ineligible responses.
List source Number Received
Percentage of responses received
Sample size* Approximate
response rate*
Association of Fundraising Professionals 354 35% 2,500 14%
Association of Philanthropic Counsel 43 4% Convenience n/a
CFRE International 365 36% Convenience n/a Giving USA 51 5% Convenience n/a NRC list 54 5% 1,071 5% National Association of Charitable Gift Planners 2 <1% Convenience n/a
Top Nonprofits 104 10% Convenience n/a Other 46 5% Convenience n/a
Total 1019 100%
* Where a sponsor used a mailing list with a known number, we report the response rate based on recipients of the invitation.
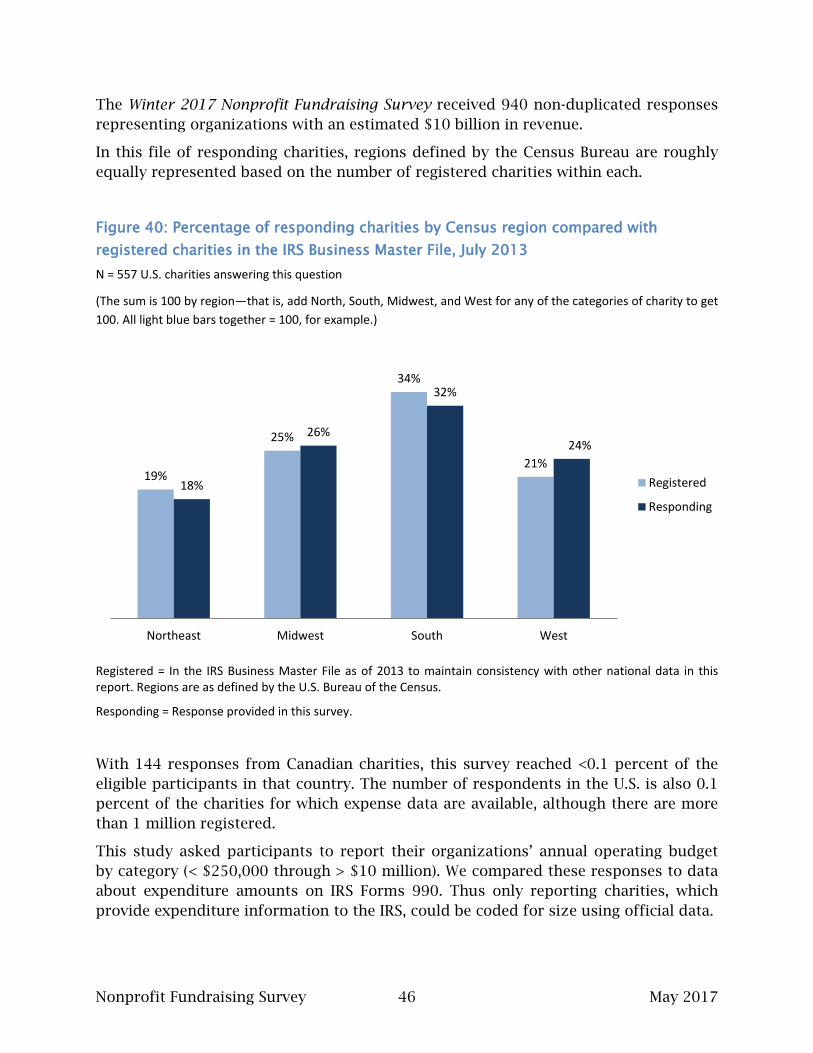
Nonprofit Fundraising Survey 46 May 2017
The Winter 2017 Nonprofit Fundraising Survey received 940 non-duplicated responses representing organizations with an estimated $10 billion in revenue.
In this file of responding charities, regions defined by the Census Bureau are roughly equally represented based on the number of registered charities within each.
Figure 40: Percentage of responding charities by Census region compared with registered charities in the IRS Business Master File, July 2013 N = 557 U.S. charities answering this question
(The sum is 100 by region—that is, add North, South, Midwest, and West for any of the categories of charity to get 100. All light blue bars together = 100, for example.)
Registered = In the IRS Business Master File as of 2013 to maintain consistency with other national data in this report. Regions are as defined by the U.S. Bureau of the Census.
Responding = Response provided in this survey.
With 144 responses from Canadian charities, this survey reached <0.1 percent of the eligible participants in that country. The number of respondents in the U.S. is also 0.1 percent of the charities for which expense data are available, although there are more than 1 million registered.
This study asked participants to report their organizations’ annual operating budget by category (< $250,000 through > $10 million). We compared these responses to data about expenditure amounts on IRS Forms 990. Thus only reporting charities, which provide expenditure information to the IRS, could be coded for size using official data.
19%
25%
34%
21%
18%
26%
32%
24%
Northeast Midwest South West
Registered
Responding
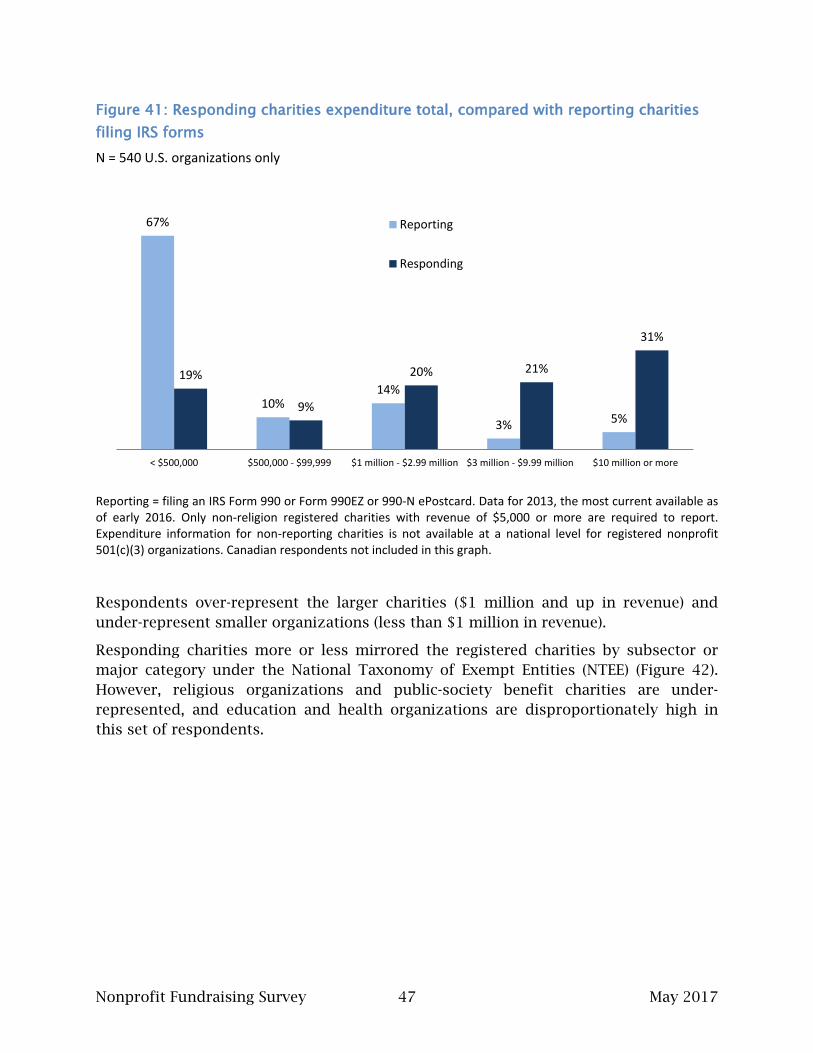
Nonprofit Fundraising Survey 47 May 2017
Figure 41: Responding charities expenditure total, compared with reporting charities filing IRS forms N = 540 U.S. organizations only
Reporting = filing an IRS Form 990 or Form 990EZ or 990-N ePostcard. Data for 2013, the most current available as of early 2016. Only non-religion registered charities with revenue of $5,000 or more are required to report. Expenditure information for non-reporting charities is not available at a national level for registered nonprofit 501(c)(3) organizations. Canadian respondents not included in this graph.
Respondents over-represent the larger charities ($1 million and up in revenue) and under-represent smaller organizations (less than $1 million in revenue).
Responding charities more or less mirrored the registered charities by subsector or major category under the National Taxonomy of Exempt Entities (NTEE) (Figure 42). However, religious organizations and public-society benefit charities are under-represented, and education and health organizations are disproportionately high in this set of respondents.
67%
10% 14%
3% 5%
19%
9%
20% 21%
31%
< $500,000 $500,000 - $99,999 $1 million - $2.99 million $3 million - $9.99 million $10 million or more
Reporting
Responding
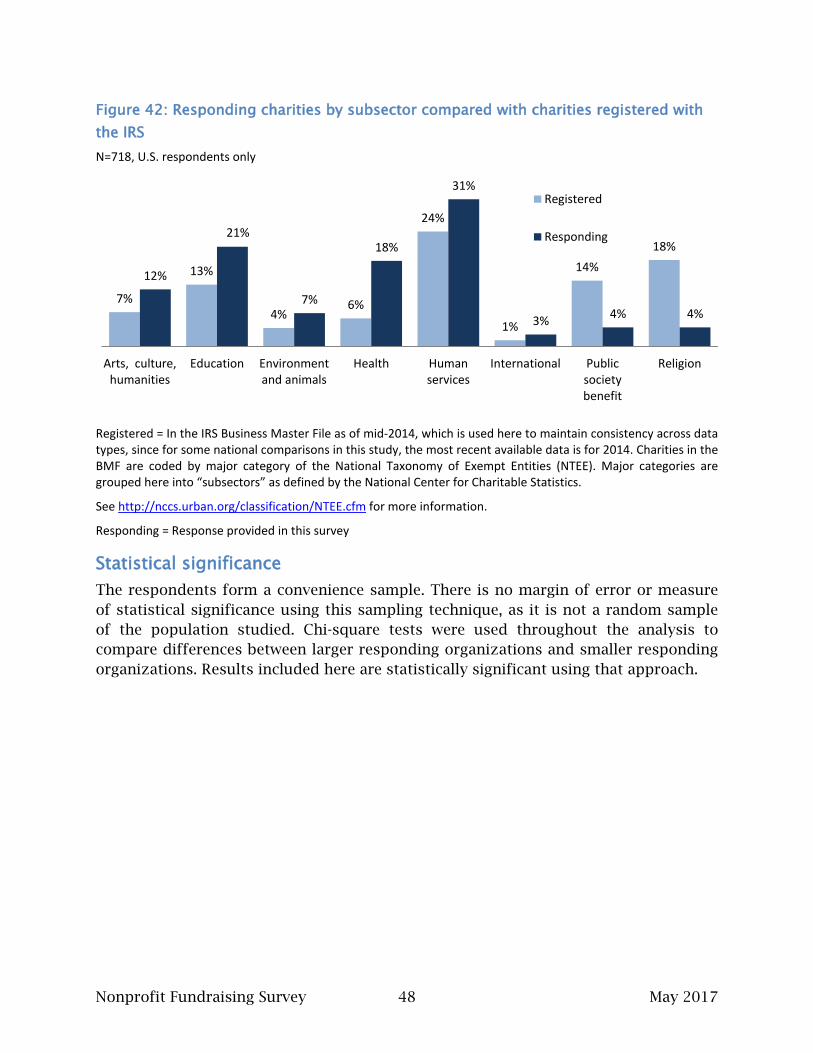
Nonprofit Fundraising Survey 48 May 2017
Figure 42: Responding charities by subsector compared with charities registered with the IRS N=718, U.S. respondents only
Registered = In the IRS Business Master File as of mid-2014, which is used here to maintain consistency across data types, since for some national comparisons in this study, the most recent available data is for 2014. Charities in the BMF are coded by major category of the National Taxonomy of Exempt Entities (NTEE). Major categories are grouped here into “subsectors” as defined by the National Center for Charitable Statistics.
See http://nccs.urban.org/classification/NTEE.cfm for more information.
Responding = Response provided in this survey
Statistical significance The respondents form a convenience sample. There is no margin of error or measure of statistical significance using this sampling technique, as it is not a random sample of the population studied. Chi-square tests were used throughout the analysis to compare differences between larger responding organizations and smaller responding organizations. Results included here are statistically significant using that approach.
7%
13%
4% 6%
24%
1%
14% 18%
12%
21%
7%
18%
31%
3% 4% 4%
Arts, culture,humanities
Education Environmentand animals
Health Humanservices
International Publicsocietybenefit
Religion
Registered
Responding
Nonprofit Fundraising Survey 49 May 2017
ABOUT THE NONPROFIT RESEARCH COLLABORATIVE Several organizations formed the NRC. These entities have a decade or more of direct experience collecting information from nonprofits concerning charitable receipts, fundraising practices, and/or grantmaking activities. Association of Fundraising Professionals surveyed members for an annual state
of fundraising study from 2002 through 2010.
Association of Philanthropic Counsel, an international professional association of consultants whose members survey nonprofit organizations as part of their services.
CFRE International encourages research that helps fundraising professional achieve the highest standards of professional competence and ethical practice.
Giving USA Foundation has published the Giving USA Annual Report on Philanthropy for more than 60 years.
The National Association of Charitable Gift Planners conducts research, education, advocacy, community dialogue and the setting of standards and best practices in philanthropic planning.
Top Nonprofits provides online, helpful and actionable nonprofit know-how, featuring examples, tips, lists, webcasts, posts, podcasts, and more.
The collaborative effort reduces the burden on charities, which receive fewer requests for survey participation. Survey respondents will form a panel over time, allowing for trend comparisons among the same organizations. This approach provides more useful benchmarking information than repeated cross-sectional studies. Reports and other information from the NRC appear at www.npresearch.org.
The Nonprofit Research Collaborative (NRC) conducts surveys twice a year. Melissa S. Brown & Associates manages the NRC. She can be reached at [email protected] or at 530-690-5746.