SUBMISSION TO THE GUYANA SUGAR CORPORATION...
39
SUBMISSION TO THE GUYANA SUGAR CORPORATION COMMISSION OF INQUIRY Commissioner: Prof. Clive Y. Thomas OCTOBER 2015
Transcript of SUBMISSION TO THE GUYANA SUGAR CORPORATION...

0 | P a g e
SUBMISSION TO THE
GUYANA SUGAR CORPORATION
COMMISSION OF INQUIRY
Commissioner: Prof. Clive Y. Thomas
OCTOBER 2015
i | P a g e
CONTENTS
Page
Introduction 1
Section 1: Global Environment and Macroeconomic Agricultural Context 1
A. Global Environment 1
B. Macroeconomic and Agricultural Environment 2
C. Conclusion 7
Section 2: Guysuco’s Financial Situation 9
A. Financial Ratios Analysis 9
B. Cash Flow 10
C. Guysuco’s Indebtedness 11
D. Guysuco’s Profitability (Losses) 1990s to date 13
E. Unit Cost of Production 13
F. Domestic Resource Cost (DRC) 16
Section 3: Guysuco’s Performance to date in 2015: What does it tells us? 18
A. First Crop 2015 18
B. Second Crop 2015 19
C. Business Plans and Capital Expenditure (Capex) 20
D. Conclusion 21
Section 4: Recommendations on the Way Forward 23
A. Timelines of Implementation 23
Timeline 2016 23
Timeline 2017-18 27
Timeline 2016-19 28
Timeline 2020 and After 28

ii | P a g e
List of Tables
Page
1. Agriculture and Sugar GDP (G$ bln) and Exports (US$ mln) 2011-2014 2
2. Estimated Productivity Potential by Estate 3
3. Distribution of Soil Classes (% of Cultivated area) 3
4. Sugar Output 1960s and 3-Year Averages 2000-2014 (‘000 tonnes) 4
5. Industry Location 5
6. Summary of Issues to be Addressed within the Framework of Guysuco’s 2013-2017
Strategic Plan 6-7
7. Guysuco’s Financial Ratios: 2014 9
8. Guysuco’s Expenditure/Revenue (August- December 2015) 10
9. Items to Note in the Cash Flow Estimates in Table 8 11
10. Guysuco ’s Short Term Liabilities 12
11. Guysuco’s Long Term Liabilities 12
12. Guysuco’s Profit (Loss) After Tax $G billion 13
13. Guysuco’s Losses (2012- 2014) $G billion 13
14. Sugar Production by Estate 2014 14
15. Breakdown of Estates Unit Cost of Production 2014 15
16. Unit Cost Increases (by 3-year period 1997- 2014) 16
17. Selected Actual and Projected Performance Indicators Used by the CDB in 2014 16
18. Key Factory Performance Indicators (First Crop 2015) 18
19. First Crop Production: Actuals V/S Budget 19
20. Performance Indicators: Targets V/S Second Crop 2015 to date 20
21. CAPEX 2009-2014 20
22. Guysuco’s Observations on its Business Plan 2015-2017 21
23. Guysuco’s Focus for Remainder of 2015 22
24. CDB’s Mechanisation Project Summary 26

1 | P a g e
Introduction
This Report is a First Draft of my written submission to the Guyana Sugar Corporation
Commission of Inquiry (CoI) based on its Terms of Reference given in Annex A. It specifically
addresses Item II sub-items 1, 2.E, 3 and 4. Sub-item 2.E refers to the operational area: Finance
(cash flow, profitability, indebtedness, investment screening and evaluation etc.). Item 2 refers
to: “Any Other Related Areas”, and Item 4 to the preparation of a Road Map for the Way Ahead,
for 2016 to 2030, structured into five-year intervals, which state goals and their modalities of
implementation.
Section 1: Global Environment and Macroeconomic Agricultural Context
A. Global Environment
The global sugar industry, as presently constructed, shows a complicated maze of producing,
exporting and importing countries operating through an enormous range of import restrictions
(quotas and tariffs); production and export subsidies (preferential loans and credit); subsidized
inputs, price support; and, even dumping schemes. The Uruguay Round of Trade Negotiations,
which was set in train in 1994 has stalled, but even before that stall, no substantial progress had
been made in the liberalization of the gross market-distorting protectionism that prevailed
everywhere in the global sugar industry.
Four countries, have more or less dominated global exports of sugar: Brazil (which indeed
controls over one-half of global exports); Thailand; India; and, Mexico together control about
two-thirds of global exports. All these countries heavily subsidize, or otherwise provide direct
supports for sugar production and its export. In some instances the government itself, as with our
Guysuco, is effectively producing bulk and other sugars for export. Thus recent estimates reveal
that Brazil spends about US$3billion on preferential debt programmes, input subsidies, usage
mandates and bailouts for its ethanol mills associated with cane production.
Some analysts aptly describe the current international situation as an “arms race” in sugar-
protectionism. As a consequence the International Sugar Organization (ISO) is presently
forecasting a global surplus of nearly 4 million tons of sugar, up from its previous forecast of 2.2
million tons. As is well known also, this has significantly weakened prices in the “so-called free

2 | P a g e
world market for sugar”. This “free” market constitutes, what is essentially residual trade in
sugars not covered in the highly protected carve-up of the global regulated output, consumption,
and trade in sugar.
B. Macroeconomic Environment
Between 2011 and 2014, agriculture as a whole (including sugar and rice processing),
contributed on average 18.7 percent of GDP at current basic prices. Sugar (including both
cultivation and processing) contributed on average 3.5 percent to GDP. The current estimate is
that sugar employs approximately 16,000 persons; significantly, 95 percent of these workers are
male! The high level of employment signify the manually-dependent basis of Guysuco’s
operations. The industry has approximately 300 service providers on which it depends for
providing important inputs. It is also the third largest earner of foreign exchange. It provides
significant value-added, social and environmental services, growth and linkages to rural
communities, and indeed wider Guyana. Selected details are shown in Table 1 below.
Table 1: Agriculture and Sugar GDP (G$ bln ) and Exports (US$ mln) 2011-2014
Category GDP* & Exports 2011 2012 2013 2014 Total Agriculture of, which 85.8 95.6 101.6 104.9 Sugar Cultivation 15.5 19.4 7.4 12.2 Sugar Processing 4.2 5.2 4.7 3.3 Total Sugar Industry 19.7 24.6 12.1 15.5 Total GDP 460.1 522.3 537.4 554.0 Total Exports (FOB) US$ mln, of which 1,129 1,415 1,375 1167 Sugar Exports (FOB) US$ mln 123 132 114 88
Note*= At Current Basic Prices Source: Bank of Guyana Annual Reports.
The industry cultivates about 50,000 hectares of the land being used for agriculture (estimated at
1.74 million hectares). Production takes place on eight estates and seven factories; four estates
are located within the Berbice Region, each with independent factories and in Demerara four
also but with three factories. The factories are designed to generate 100% of energy needs during
the crop. Skeldon has capacity, which it supplies to the national grid. It is reportedly serving
electricity to 90,000 Berbice residents. The production possibilities of these factories and the
cultivated areas of the estates are highlighted in the two Tables listed below. These show,

3 | P a g e
respectively, Guysuco’s “estimated productivity by estate”, and the distribution of soil classes as
a percent of the estates cultivated areas.
Table 2: Estimated Productivity Potential By Estate
Potential Productivity tch, tc:ts, ts/ha
Estate
Berbice Region Demerara Region
Skeldon Albion Rose Hall Blairmont Enmore LBI Wales Uitvlugt
tch
tc:ts
ts/ha
80
11.25
7.1
78
10.35
7.5
77
11.26
6.8
80
10.4
7.7
77
10.89
7.1
78
10.89
7.2
79
11.32
7.0
73
11.67
6.3
Table 3: Distribution of Soil Classes (% of Cultivated Area)
Soil Class
Estates
Skeldon Albion Rose
Hall
Blairmont Enmore LBI Wales Uitvlugt Total
Class A
(%)
Class B
(%)
Class C
(%)
Class D
(%)
Class E (%)
49.7
39.7
10.6
0
0
21.7
63.0
14.8
0
1.0
11.1
74.5
11.4
0
3.0
52.5
8.0
37.2
0
2.0
37.1
14.8
34.8
11.0
2.0
30.0
54.3
12.3
3.0
0
7.4
80.7
0
8.0
4.0
0
47.0
12.6
40.4
0
26.1
48.5
16.9
7.3
1.2
About 8,000 hectares of the cultivated sugar cane areas are undertaken by private cane farmers,
either individually or cooperatively. These supply cane mainly to: Skeldon, Albion, Rose Hall,
Uitvlugt and Wales, under the National Cane Farmers Act.
From all reports, the major reported constraints impeding improved production and productivity
at Guysuco are: 1) labour shortage 2) climate/weather variability given the industry’s cultivation
dependence on drainage and irrigation (D&I) 3) factory unreliability, and, 4) the price which
sugar can be expected to sell presently and well into the medium-term. A complex D&I system
underlies the cultivation of cane. The surface water lying between inland conservancies and the
sea walls has to be strictly regulated. About 60% of this D&I applies to non-sugar land (rice
occupies two-thirds of this area). Generally, Guysuco’s D&I is the main protection against
coastal flood risks.
4 | P a g e
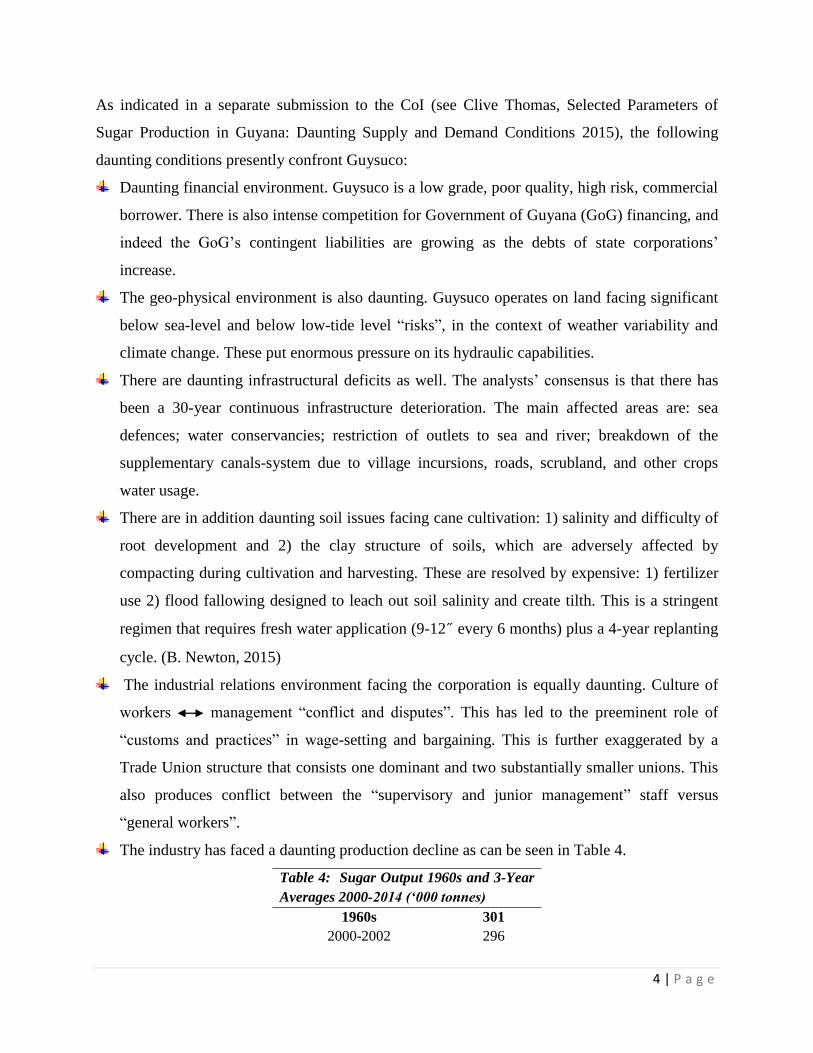
As indicated in a separate submission to the CoI (see Clive Thomas, Selected Parameters of
Sugar Production in Guyana: Daunting Supply and Demand Conditions 2015), the following
daunting conditions presently confront Guysuco:
Daunting financial environment. Guysuco is a low grade, poor quality, high risk, commercial
borrower. There is also intense competition for Government of Guyana (GoG) financing, and
indeed the GoG’s contingent liabilities are growing as the debts of state corporations’
increase.
The geo-physical environment is also daunting. Guysuco operates on land facing significant
below sea-level and below low-tide level “risks”, in the context of weather variability and
climate change. These put enormous pressure on its hydraulic capabilities.
There are daunting infrastructural deficits as well. The analysts’ consensus is that there has
been a 30-year continuous infrastructure deterioration. The main affected areas are: sea
defences; water conservancies; restriction of outlets to sea and river; breakdown of the
supplementary canals-system due to village incursions, roads, scrubland, and other crops
water usage.
There are in addition daunting soil issues facing cane cultivation: 1) salinity and difficulty of
root development and 2) the clay structure of soils, which are adversely affected by
compacting during cultivation and harvesting. These are resolved by expensive: 1) fertilizer
use 2) flood fallowing designed to leach out soil salinity and create tilth. This is a stringent
regimen that requires fresh water application (9-12˝ every 6 months) plus a 4-year replanting
cycle. (B. Newton, 2015)
The industrial relations environment facing the corporation is equally daunting. Culture of
workers management “conflict and disputes”. This has led to the preeminent role of
“customs and practices” in wage-setting and bargaining. This is further exaggerated by a
Trade Union structure that consists one dominant and two substantially smaller unions. This
also produces conflict between the “supervisory and junior management” staff versus
“general workers”.
The industry has faced a daunting production decline as can be seen in Table 4.
Table 4: Sugar Output 1960s and 3-Year
Averages 2000-2014 (‘000 tonnes)
1960s 301
2000-2002 296
5 | P a g e
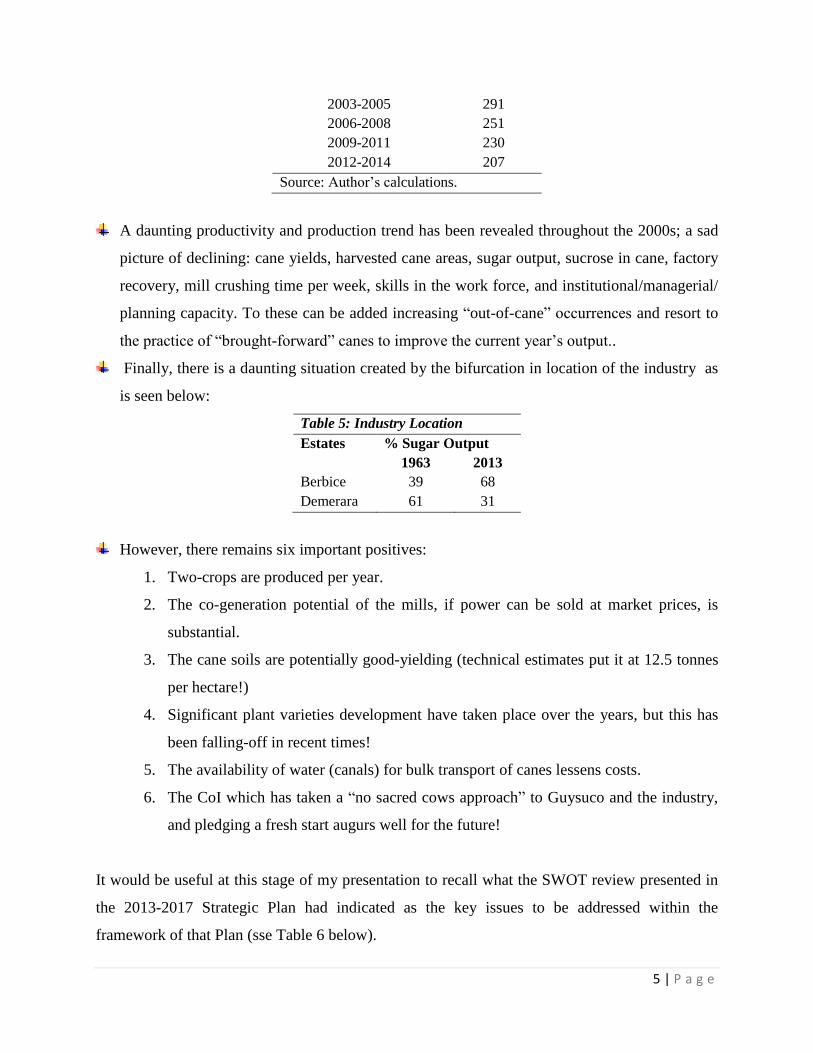
2003-2005 291
2006-2008 251
2009-2011 230
2012-2014 207
Source: Author’s calculations.
A daunting productivity and production trend has been revealed throughout the 2000s; a sad
picture of declining: cane yields, harvested cane areas, sugar output, sucrose in cane, factory
recovery, mill crushing time per week, skills in the work force, and institutional/managerial/
planning capacity. To these can be added increasing “out-of-cane” occurrences and resort to
the practice of “brought-forward” canes to improve the current year’s output..
Finally, there is a daunting situation created by the bifurcation in location of the industry as
is seen below:
Table 5: Industry Location
Estates % Sugar Output
1963 2013
Berbice 39 68
Demerara 61 31
However, there remains six important positives:
1. Two-crops are produced per year.
2. The co-generation potential of the mills, if power can be sold at market prices, is
substantial.
3. The cane soils are potentially good-yielding (technical estimates put it at 12.5 tonnes
per hectare!)
4. Significant plant varieties development have taken place over the years, but this has
been falling-off in recent times!
5. The availability of water (canals) for bulk transport of canes lessens costs.
6. The CoI which has taken a “no sacred cows approach” to Guysuco and the industry,
and pledging a fresh start augurs well for the future!
It would be useful at this stage of my presentation to recall what the SWOT review presented in
the 2013-2017 Strategic Plan had indicated as the key issues to be addressed within the
framework of that Plan (sse Table 6 below).

6 | P a g e
Table 6: Summary of Issues to be Addressed within the Framework of Guysuco’s 2013-2017 Strategic
Plan
Issue Plans to Address
Technical difficulties with the New
Skeldon Factory
The factory will be retrofitted in keeping with the recommendations
of independent consultants. Retrofitting is on schedule to be
completed by November 2014 at an estimated cost of $2.5mn.
Low sugar cane yield This will be addressed by improvements in: plant material selection
and preparation: land preparation: water, plant nutrition and week
management; and elimination of fifth ratoon.
Improved land preparation weed control and plant nutrition
Timely and proper land preparation is essential to ensuring proper
plant anchorage, nutrient uptake and ease of harvesting.
Meanwhile, weeds can reduce sugar cane yields by between 15%
and 70%. Thus ensuring that the crop is week free, particularly in
the first ninety days after planting/harvesting is essential to
obtaining optimum yields. Specialised machinery and equipment is
being introduced to facilitate more timely and effective
implementation of those measures.
Elimination of fifth ratoon
GuySuCo’s production data have revealed that it is uneconomical
to maintain canes beyond the fourth ratoon given declining yields
and relatively high maintenance cost. As at the end of 2013
approximately 30% of GuySuCo’s holdings were older than the
fourth ratoon, a major contributor to the relatively low tonnage of
sugar produced per ha. A decision has been taken by the
Corporation that canes will be harvested after the fourth ratoon and
the area replanted.
Given the pervasive labour supply challenges being experienced
throughout the industry key to improving performance in these
areas is the use of specialised machinery and equipment.
Factories operating below capacity
resulting in high operational cost.
Total grinding hours lost in the
industry due to insufficient cane
being supplied to factories, largely
due to shortage of labour, increased
from 1,729 hours in 2003 to 13,665
hours in 2011.
Increasing the pace of industry mechanization to enable semi and
full mechanical harvesting on all estates. This will increase the rate
of supplying canes to factories and thereby increase the efficiency
of factory operations.
Some factories not configured to
process mechanically harvested cane.
Financial constraints have limited investment in factories.
GuySuCo however recognizes the need for factory upgrading to
optimise sugar recoveries and energy efficiencies. Several factories

7 | P a g e
will be upgraded over the period 2014-2016 largely through
resources provided by GOGY.
Cont’d
Issue Plans to Address
A dwindling supply of labour, high
levels of absenteeism and the loss of
skilled workers negatively impacting
field and factory operations.
Introduction of an apprentice programme, on-going training and
retaining of workers at all levels and the gradual introduction of
mechanization to meet the gap in the supply of labour.
Increases in the cost of non-labour
inputs – fuel, fertilisers, machinery
and equipment spares.
All factories have the capacity to generate energy through the use
of bagasse – the goal is to ensure 100% of factory energy needs
during sugar cane processing is internally generated. GuySuCo will
make the necessary investments in factories to achieve/sustain
energy production goals. Management of pest and disease will be
through the use of biological control measures.
Weather variability reducing the
number of “opportunity days” –
particularly for land preparation,
planting and harvesting operations.
Introduction of machines and equipment for land preparation, semi-
mechanical planting, application of agro-chemicals and harvesting,
etc. Mechanisation also requires a change in land preparation
estimated at three times the cost per unit when compared to the
traditional system. As at December 31, 2013, 13,471 ha were
prepared for mechanical harvesting.
Market price variability and
uncertainty particularly for bulk
sugar.
Increase in the capacity to produce value-added sugar and
explorations of options to diversify the industry away from total
reliance on the production of sugar. On-going initiatives include a
pilot project on ethanol production.
C. Conclusion
In conclusion of this Section, it might be useful to report what Guyana’s Agricultural Sector
Strategy 2013-2030 has revealed as its four main targets for sugar:
1) Increased output to 450,000 tonnes by 2020
2) An average TC/TS of between 10 and 12
3) A TS/H of 7
4) 60 percent of the crop will be mechanically harvested
Despite the emphasis on the economic and agricultural macroeconomic environment of sugar in
this Section; the social-political environment should be recognized as carrying at least as much
weight in planning a Way Forward. While it is literally true that Guysuco and the sugar industry

8 | P a g e
should be treated separately for the purposes of the CoI; the separation of these two cannot be
put into watertight compartments. This is true, not only because the industry includes peasant
operators, service providers offering inputs, as well as the communities Guysuco is delivering its
services to, but because Guysuco, in truth and in fact, can only be reduced to a “state
corporation”, when considering it from its legal structure and operations standpoint.
Rightfully or wrongly, sugar workers, their families, and the communities in which Guysuco
operates sees this state corporation as the main provider of their livelihoods and a life-line
support for their communities. All recommendations for the Way Forward should therefore
embrace this reality. In such circumstances this means that what Guysuco “gives and takes”
from the communities will have to be synchronized with what the community “gives and expects
to get back” from Guysuco.
As we shall see in some detail in the next Section, Guysuco’s financial status is extraordinarily
dire, which gives extreme urgency to the dilemma referenced here.

9 | P a g e
Section 2: Guysuco’s Financial Situation
A. Financial Ratios Analysis
In the absence of audited accounts and Annual Reports for recent years there has been, to put it
mildly, a major problem in determining the latest accurate financial statements of Guysuco that
the CoI should use. In light of this conundrum, I have requested Guysuco to provide me with the
calculation of 21 common financial ratios based on their most confident (and recent) financial
statements for last year, 2014. These are presented in Table 7 below.
Table 7: Guysuco’s Financial Ratios: 2014
Financial Ratio Formula Results
1. Quick Ratio
a) (Current Assets - Inventory - Product stock -
Prepayments) / Current Liabilities
b) (Current Assets - Inventory – product – Stocks –
Prepayments- Standing Cane) / Current Liabilities
0.32
0.16
2. Current Ratio Current Assets / Current Liabilities 0.48
3. Total Debt / Equity Ratio Total Liabilities / Equity 6.79
4. Long Term Debt / Equity Ratio Long Term Debt / Equity 4.84
5. Short Term Debt/ Equity Ratio Short Term Debt / Equity 1.95
6. Receivables Turnover Net Sales / Receivables 10.20
7. Inventory Turnover Sales/ Product Stock
Cost of Good Sold / Product Stock
17.75
32.22
8. LT Debt as % of Invested
Capital
Long Term Debt / Invested capital 773%
9. ST Debt as % of Invested Capital Short Term Debt / Invested Capital 311%
10. LT Debt as % of Total Debt Long Term Debt / Total Liabilities 71%
11. ST Debt as % of Total Debt Short term Debt / Total Liabilities 29%
12. Total Liabilities % of Total
Assets
Total Liabilities % Total Assets 87%
13. Working Capital % of Sales (Current Assets - Current Liabilities ) / Sales -75%
14. Gross Profit / Loss Margin Gross profits or loss / Sales -82%
15. Net Profit/ Loss Margin Net profit or lost / Sales -90%
16. Operating Profit / Loss Margin Operating profit or loss / Sales -88%
17. Interest Cover Ratio Earnings before interest and tax / interest 40.18
18. Net Working Capital Turnover Sales / Working Capital = Current Assets - Current Liabilities (1.34)
19. Total Asset Turnovers Sales / Total Assets 0.17
20. Net Working Capital Current Assets - Current Liabilities (17,340)
21. Cash Flow Margin Cash Generated from Operating Activities / Sales (0.28)
All Guysuco’s financial ratios are extremely discouraging. They show a corporation that is
insolvent, and illiquid, making huge losses, and surviving only because of government bailouts.
Guysuco is highly leveraged. Its short-term debt is nearly twice its equity and its long-term debt
nearly five times its equity, also, for a ratio of 4.84. The total debt/equity ratio is 6.79. Both its

10 | P a g e
current and quick ratios are well below unity revealing that it is incapable of meeting its short-
term obligations. Its profitability ratios including its operating profit are in the negative (losses)
with gross and net profit margins of minus 82 percent and minus 90 percent respectively. Its
capital structure ratios show a heavy dependence on debt in its operations, with its working
capital ratio revealing the deep distress the company finds itself in. Its activity ratios (receivables
and inventories) tell a similar tale.
As we shall see the corporation faces a severe price-cost squeeze, which is at the heart of its
financial collapse. For several years, it has been costing more, both in total and unit terms, even
as it produces less sugar. And, more worryingly; with a reported ratio of fixed to variable cost of
70:30, its variable unit cost on several producing estates exceeds the unit sales price it receives.
Therefore, not only do losses increase with their increased sugar output, but since the produced
sugar is exported mainly to the European Union (EU) Guyana is in effect subsidizing the price
much more wealthy EU consumers are paying for our exported sugar!
There is undoubtedly, a marked inability for Guysuco to grow its operations through its
sales/revenue. Further, it is utterly incapable of financing its capital requirements, which are so
badly needed. Indeed, at present Guysuco cannot cover routine maintenance items of a lumpy
nature. And, it cannot obtain credit/loans without Government guaranteeing these.
B. Cash Flow
Guysuco’s dire projected cash flow situation as of August this year is shown in Table 6 below.
Table 8: Guysuco Expenditure/Revenue
(August-December 2015)
Item G$ Million
Total Expenditure 24,590
Total Revenue 14,322
(Funds Needed) 10,268
Source: Guysuco, 2015.
The projected estimated shortfall for the remainder of 2015 is G$ billion 10,268. It is important
to note, as Guysuco usually does in its reporting on its financial position, the cash flow estimates
do not include the items listed in Table 9 and also takes the “other considerations” mentioned in
that Table into account.

11 | P a g e
Table 9: Items to Note in the Cash Flow Estimates in Table 8
Not Included
i. Capital Expenditure
ii. Cash rolled over / required for the out of crop (January –February 2016)
iii. Income from any other source other than from its own operations
iv. Payment to NIS, GRA or GAWU for remittances owing currently. The cash flow
only caters for remittances going forward from June onwards. The amounts owing as
of April 2015 are as follows:
NIS G$1,564M
PAYE G$4,351M
GAWU Union Dues G$120M
GAWU Credit Union G$154M
v. Any reduction to the creditors’ level. The cash flow assumes a carryover of the same
level of creditors to 2016.
Other Considerations
i. No repayment of US$19m loan owed to National Commercial Bank group. It is
anticipated that the loan will be rolled over.
ii. No further receipt from Skeldon Energy Inc. is included for the sale of the co-
generation plant. The amount outstanding is G$1,895M.
The cash flow is based on a total targeted production of 227000 tonnes of sugar for this year.
This projection will be reviewed in Section 3 below.
C. Guysuco’s Indebtedness
Similarly, recent data cast a sharper image on Guysuco’s indebtedness. Guysuco’s short-term
and long-term liabilities are itemized in Tables 10 and 11 below. The total indebtedness of the
corporation as of last month (August) was G$82.4 billion of which just over three-quarters is
long-term debt and loans and the remainder (just under one-quarter) is short-term debt.

12 | P a g e
Table 10: Guysuco’s Short Term Liabilities
The corporation’s creditors and other short term liabilities as of August 17, 2015: Trade Creditors Total / G$ bln Local Suppliers 1.79 Contractors 0.20 Utilities, NDCs, etc. 0.21 Foreign Suppliers 1.55 GRA - PAYE 4.47 NIS 1.75 Hand in Hand Trust - Pension Contributions 0.82 Union Dues 0.28 SILWF - loan payments 0.05 Guyana Lands and Surveys Commission & MMA - Lands Leases
0.40
SILWF – sugar levy 1.63
I3.15
Short Term Loans & Overdraft Facilities Guyana National Co-operative Bank 0.26 National Commercial Bank Group 4.12 Local Consortium- DBL, BNS, HIH,BOB,CBGI 0.80 Overdraft Facilities- RBL, GBTI 1.40
6.58
Table 11: Guysuco’s Long Term Liabilities
The Corporation’s long term debts are as follow: Long Term Loans & Debts Total/G$ bln CH&MS Scheme 0.54 Employees Retirement Benefits- 2014 adjustment to be included after audit
29.26
Exim Bank - SSMP 8.26 CDB - D&I 0.83 GOG - SSMP 15.49 CDB - SSMP 5.85 GOG Debenture 0.14 GRA Property and Corporation Tax 2.62
62.70
13 | P a g e
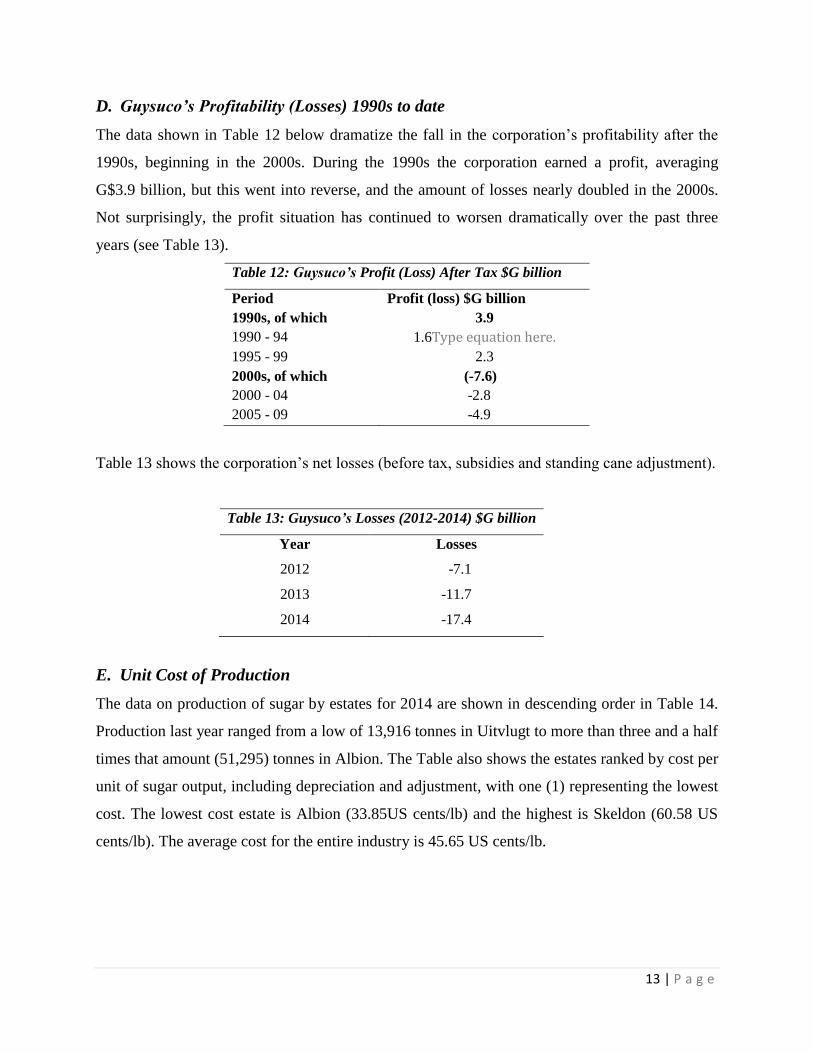
D. Guysuco’s Profitability (Losses) 1990s to date
The data shown in Table 12 below dramatize the fall in the corporation’s profitability after the
1990s, beginning in the 2000s. During the 1990s the corporation earned a profit, averaging
G$3.9 billion, but this went into reverse, and the amount of losses nearly doubled in the 2000s.
Not surprisingly, the profit situation has continued to worsen dramatically over the past three
years (see Table 13).
Table 12: Guysuco’s Profit (Loss) After Tax $G billion
Period Profit (loss) $G billion
1990s, of which 3.9
1990 - 94 1.6
1995 - 99 2.3
2000s, of which (-7.6)
2000 - 04 -2.8
2005 - 09 -4.9
Table 13 shows the corporation’s net losses (before tax, subsidies and standing cane adjustment).
Table 13: Guysuco’s Losses (2012-2014) $G billion
Year Losses
2012 -7.1
2013 -11.7
2014 -17.4
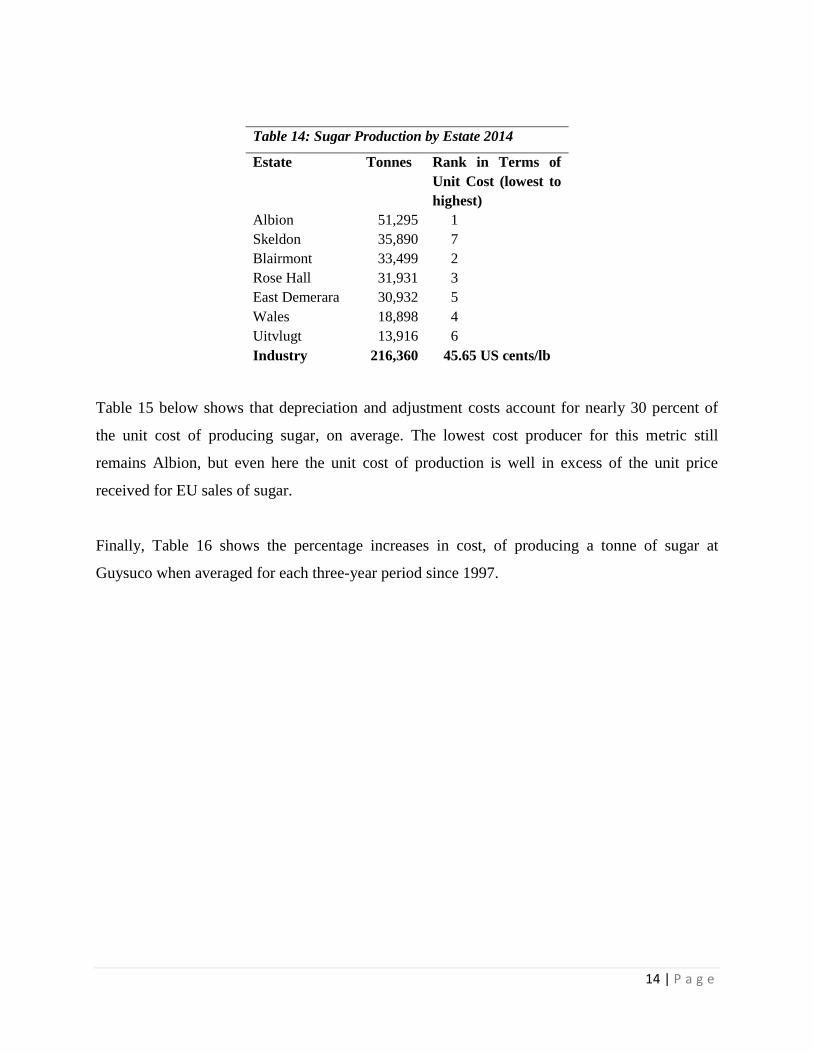
E. Unit Cost of Production
The data on production of sugar by estates for 2014 are shown in descending order in Table 14.
Production last year ranged from a low of 13,916 tonnes in Uitvlugt to more than three and a half
times that amount (51,295) tonnes in Albion. The Table also shows the estates ranked by cost per
unit of sugar output, including depreciation and adjustment, with one (1) representing the lowest
cost. The lowest cost estate is Albion (33.85US cents/lb) and the highest is Skeldon (60.58 US
cents/lb). The average cost for the entire industry is 45.65 US cents/lb.
14 | P a g e
Table 15 below shows that depreciation and adjustment costs account for nearly 30 percent of
the unit cost of producing sugar, on average. The lowest cost producer for this metric still
remains Albion, but even here the unit cost of production is well in excess of the unit price
received for EU sales of sugar.
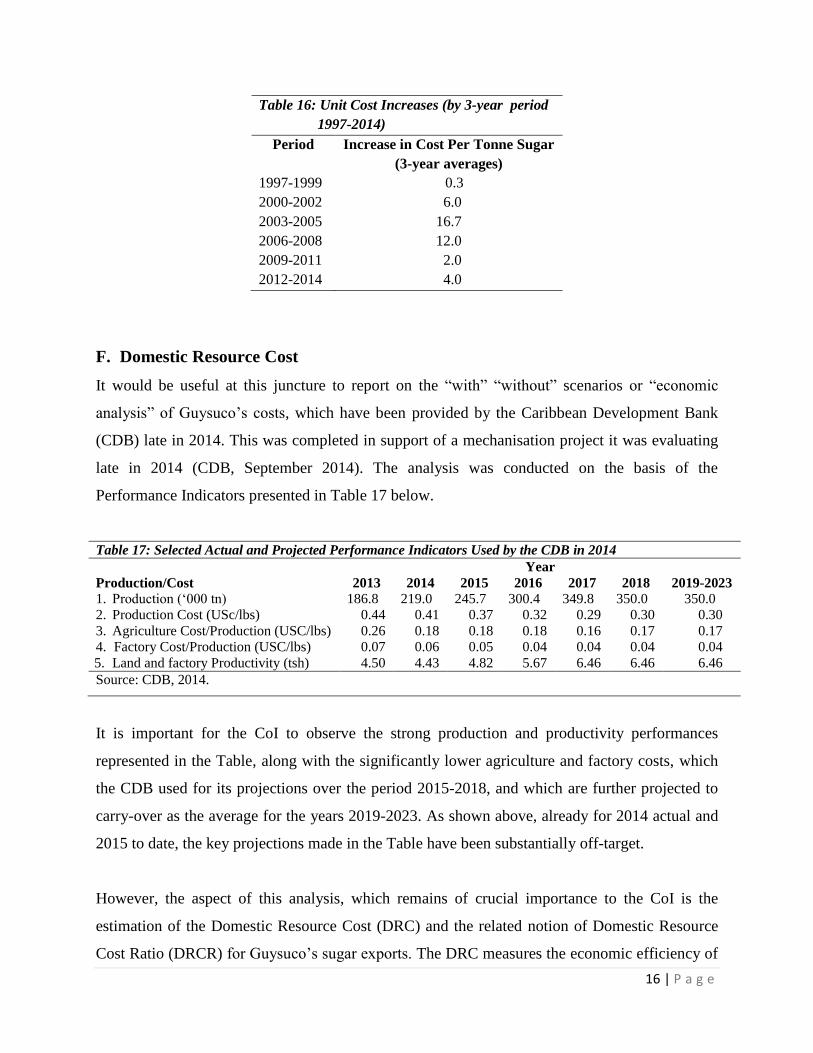
Finally, Table 16 shows the percentage increases in cost, of producing a tonne of sugar at
Guysuco when averaged for each three-year period since 1997.
Table 14: Sugar Production by Estate 2014
Estate Tonnes Rank in Terms of
Unit Cost (lowest to
highest)
Albion 51,295 1
Skeldon 35,890 7
Blairmont 33,499 2
Rose Hall 31,931 3
East Demerara 30,932 5
Wales 18,898 4
Uitvlugt 13,916 6
Industry 216,360 45.65 US cents/lb

15 | P a g e
Source: Guysuco’s submission to the COI, 2015.
Table 15: Breakdown of Estates Unit Cost of Production 2014
Skeldon Albion
Rose Hall Blairmont
East
Demerara Wales Uitvlugt Industry
Production/tonnes 35,890 51,295 31,931 33,499 30.932 18,898 13,916 216,360
- - - - - - - -
G$M
Agriculture 4,443 4,439 3,385 2,921 3,905 2,493 1,963 23,549
Factory 3,354 987 1,041 803 1,410 811 723 9,128
Administration 381 556 401 420 690 308 352 3,110
Less Deprecation 2,705 271 165 230 554 166 171 4,183
Packaging Plant Cost - - - - 242 - - 242
ADJUSTMENT
Stock Movement-movement between opening and closing stock 181 258 162 169 156 95 70 1,093
Standing Cane-movements between canes in field at beginning to
ending of 1 1,145 1,117 831 738 828 489 357 5,503
IAS Provision - appointed by tonnes sugar 249 354 223 232 214 131 96 1,500
Head Office Cost- appointed by tonnes sugar 481 687 428 449 414 253 186 2,897
Less Deprecation 26 37 23 24 22 14 10 157
Usc/lb
Cost per unit EXCLUDING depreciation, and EXCLUDING
adjustment 33.59 24.53 32.17 25.74 40.54 40.17 45.38 32.42
Cost per unit INCLUDING depreciation, and EXCLUDING
adjustment 50.19 25.69 33.30 27.25 44.49 42.10 48.08 36.68
Cost per unit EXCLUDING depreciation, and INCLUDING
adjustment 43.82 32.53 41.10 33.80 49.64 49.07 54.23 41.23
Cost per unit INCLUDING depreciation, and INCLUDING
adjustment 60.58 33.85 42.40 35.47 53.74 51.16 57.10 45.65
16 | P a g e
Table 16: Unit Cost Increases (by 3-year period
1997-2014)
Period Increase in Cost Per Tonne Sugar
(3-year averages)
1997-1999 0.3
2000-2002 6.0
2003-2005 16.7
2006-2008 12.0
2009-2011 2.0
2012-2014 4.0
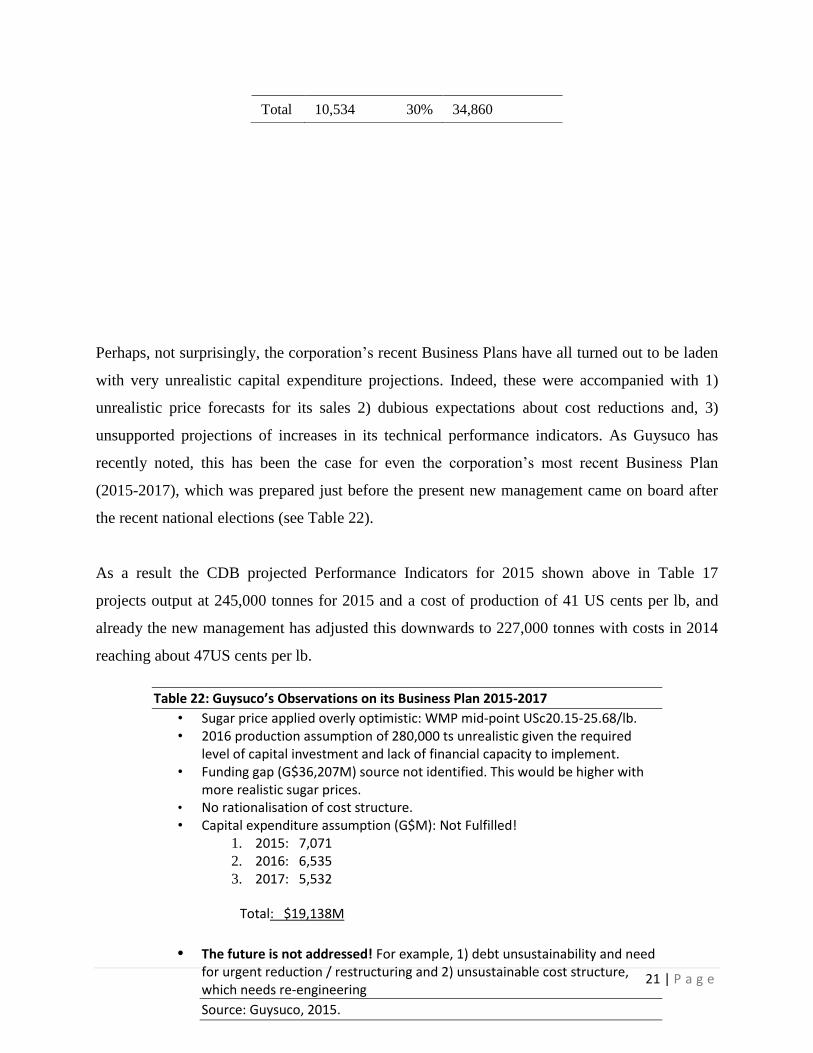
F. Domestic Resource Cost
It would be useful at this juncture to report on the “with” “without” scenarios or “economic
analysis” of Guysuco’s costs, which have been provided by the Caribbean Development Bank
(CDB) late in 2014. This was completed in support of a mechanisation project it was evaluating
late in 2014 (CDB, September 2014). The analysis was conducted on the basis of the
Performance Indicators presented in Table 17 below.
Table 17: Selected Actual and Projected Performance Indicators Used by the CDB in 2014
Production/Cost
Year
2013 2014 2015 2016 2017 2018 2019-2023
1. Production (‘000 tn)
2. Production Cost (USc/lbs)
3. Agriculture Cost/Production (USC/lbs)
4. Factory Cost/Production (USC/lbs)
5. Land and factory Productivity (tsh)
186.8
0.44
0.26
0.07
4.50
219.0
0.41
0.18
0.06
4.43
245.7
0.37
0.18
0.05
4.82
300.4
0.32
0.18
0.04
5.67
349.8
0.29
0.16
0.04
6.46
350.0
0.30
0.17
0.04
6.46
350.0
0.30
0.17
0.04
6.46
Source: CDB, 2014.
It is important for the CoI to observe the strong production and productivity performances
represented in the Table, along with the significantly lower agriculture and factory costs, which
the CDB used for its projections over the period 2015-2018, and which are further projected to
carry-over as the average for the years 2019-2023. As shown above, already for 2014 actual and
2015 to date, the key projections made in the Table have been substantially off-target.
However, the aspect of this analysis, which remains of crucial importance to the CoI is the
estimation of the Domestic Resource Cost (DRC) and the related notion of Domestic Resource
Cost Ratio (DRCR) for Guysuco’s sugar exports. The DRC measures the economic efficiency of

17 | P a g e
Guysuco (as a state-owned corporation) in earning foreign exchange from producing and
exporting sugar. This is shown in the relation
where is the domestic resource cost of sugar; represents the domestic cost of producing
sugar, and represents the average unit price of sugar, and represents the foreign input costs
for producing sugar (fertilizers, chemicals, equipment etc). This relation clearly shows the
amount of domestic resources that are required to earn a unit of foreign exchange. The CDB has
set this requirement at “a hurdle rate of 12 percent”, which is the opportunity cost of capital in
Guyana.
The CDB found this measure to be G$92 to US$1. At the time (third quarter-2014) the Official
Exchange Rate was G$206 to US$1 and the Shadow Exchange Rate which it used was G$210 to
US$ 1. The DRCR was therefore 0.44. When this ratio is less than unity it suggests Guyana has a
comparative advantage in exporting sugar, if it is unity it means Guyana’s sugar is neutral, and,
when it is above unity it means Guyana’s sugar has a comparative disadvantage.
The CDB had also found that, the incremental results of their project evaluation suggested the
marginal cost of producing sugar at Guysuco was below the average cost. This further suggests
that there is room for further expansion of sugar output. Indeed, based on the Performance
Indicators cited in Table 17 above, the Project is justified with an Economic Rate of Return
(ERR), of 19 percent. Further, CDB’s sensitivity tests reveal that the DRCR approaches the
value of 1.0, only when the discount rate falls below 3 percent!

18 | P a g e
Section 3: Guysuco’s Performance to date in 2015: What does it tells us?
A. First Crop 2015
What does Guysuco’s 2015 performance reveal about its current prospects? As the corporation
notes, it has produced 81,143 tonnes of sugar, or 94 percent of its budgeted target of 86,201
tonnes for the First Crop. Weather and the late start of the Skeldon crop have been indicated by
the corporation as the main reasons for the production shortfall. It has further indicated that the
crop was extended on estates for as long as three weeks (except Enmore). However, this
extension has added significantly to its costs of production, which as well is adversely affecting
its maintenance programme.
Table 18 below provides the key factory performance indicators by estate for the First Crop. The
weak performances on all estates are clearly indicated there. However, in preparation for the
Second Crop, 2015 Guysuco has reported that: “All Factories completed [their] maintenance
programmes on schedule [although] poor weather conditions delayed the start-up of grinding
operations for the 2nd
crop”.
Table 18: Key Factory Performance Indicators (First Crop 2015)
ESTATE Tonnes
Sugar
Factory
Time
Efficiency
Overall
Recovery
No. of
Grinding
Wks.
AGT per
Week
Tonnes
Cane per
Hour
Pol %
Sugar TC/TS
BGI -
0 - 48
Hrs.
Pol %
Cane
SKELDON 8,220 73.76 67.70 9.11 86.80 180.89 97.75 17.40 52.64 8.30
ALBION 21,578 97.52 81.90 12.06 112.99 167.61 97.86 10.58 47.91 11.29
ROSE HALL 9,415 92.89 75.67 10.51 112.52 108.12 97.73 13.58 58.59 9.50
BLAIRMONT 13,681 97.16 78.78 12.25 128.20 102.08 97.68 11.71 68.46 10.58
EMNORE 10,515 83.82 78.56 12.60 97.71 104.65 97.94 12.27 44.89 10.12
WALES 9,154 93.46 79.77 11.66 100.09 98.82 97.74 12.60 84.94 9.73
UITVLUGT 8,581 86.98 78.46 12.90 84.65 104.01 98.03 13.23 34.35 9.44
INDUSTRY 81,143 89.98 78.00 81.08 103.55 121.19 97.82 12.54 55.68 10.00
Source: Guysuco submission to the CoI.
Table 19 below provides key performance indicators for cane and sugar production by estate
during the First Crop. The actual outcomes, as well as the budgeted targets, are also presented in
that Table. The variance between actuals and budgeted amounts is noted in the Table. As can be
seen from that Table there were overall shortfalls in 1) hectares harvested, 2) cane production
and, 3) sugar output. However, tonnes cane per hectare (TC/H); tonnes cane per tonne sugar
(TC/TS); and therefore, tonnes sugar per hectare (TS/H) have all showed slight improvement on

19 | P a g e
the budgeted targets. It would be observed from closer examination that the data seem to indicate
it was reduced hectares being harvested, which is the main consideration behind the observed
shortfall.
B. Second Crop 2015
Harvesting and milling for the second crop in 2015 is only just underway. The targets set for
sugar production by estate, along with the related performance indicators are also shown in Table
20 below. Guysuco’s targeted output for the Second Crop 2015 is 146,301 tonnes of sugar. To
attain this target requires improvements on the first crop performance. In particular it is expected
that improvements at the Skeldon factory would take the estate close to the target of an average
of 200-250 tonnes cane through-put per hour. This outcome is anticipated and the main
remaining concern is about the supply of improved quality canes to the factory. The major worry
which Guysuco presently has about achieving this outcome is that, its major suppliers are
presently “withholding several critical spares, awaiting payment before release”.
Table 19: First Crop Production: Actuals V/S Budget
Source: Guysuco submission to CoI.
Source: Guysuco submission to the CoI.
ESTATE HA CANE SUGAR TCTS TCH TSH HA CANE SUGAR TCTS TCH TSH HA CANE SUGAR TCTS TCH TSH
SWR 4175.5 233685 17214 13.58 56.0 4.1 2531.1 143039 8220 17.40 56.5 3.2 -1644.4 -90646 -8994 3.83 0.5 -0.9
AN 3388.9 213475 19548 10.92 63.0 5.8 3411.3 228381 21578 10.58 66.9 6.3 22.4 14907 2030 -0.34 4.0 0.6
RH 2172.3 121129 9366 12.93 55.8 4.3 2252.7 127894 9415 13.58 56.8 4.2 80.4 6765 49 0.65 1.0 -0.1
BCF 1867.5 121812 10845 11.23 65.2 5.8 2164.3 160249 13681 11.71 74.0 6.3 296.8 38437 2836 0.48 8.8 0.5
EHP 2197.4 111126 9068 12.25 50.6 4.1 1637.3 89626 7285 12.30 54.7 4.4 -560.1 -21501 -1783 0.05 4.2 0.3
LBI 1381.6 64493 5020 12.85 46.7 3.6 996.6 39442 3230 12.21 39.6 3.2 -385 -25051 -1790 -0.63 -7.1 -0.4
GV 1868.4 87418 6892 12.68 46.8 3.7 2343.6 115318 9154 12.60 49.2 3.9 475.2 27900 2262 -0.09 2.4 0.2
ICBU 2362.9 103501 8248 12.55 43.8 3.5 2375.6 113564 8581 13.23 47.8 3.6 12.7 10063 333 0.69 4.0 0.1
TOTAL 19415 1056639 86201 12.26 54.4 4.4 17712.5 1017512 81143 12.54 57.4 4.6 -1702 -39126 -5058 0.28 3.0 0.1
ACTUAL 1ST CROP 2015 VARIANCE 1ST CROP 2015 ACT v/s BUDBUD 2015 1ST CROP 2015

20 | P a g e
C. Business Plans and Capital Expenditure (Capex)
As Table 21 reveals, up to the end of 2014, the industry’s capital expenditure shortfall has been
considerable. Indeed, Guysuco’s Business Plan had projected capital expenditure at G$34,860
million, but only G$10,534 million, or about 30 percent of the total had been expended. This
confirms that during 2015, given its financial position as revealed in Section 2, the corporation
remains heavily under-capitalised. Further, as the corporation has correctly noted there are 1) no
observed correlation between its production expectations and the state of its assets 2) as a
practical logistical matter, canes in the ground on the estates cannot be guaranteed delivery to the
factory in good shape and, 3) the corporation does not have the financial capacity to undertake
adequately its major capital expenditures (Capex).
Table 20: Performance Indicators: Targets V/S Second Crop 2015 to date
ESTATE Tonnes
Sugar
Factory
Time
Efficiency
Overall
Recovery
No. of
Grinding
Wks.
AGT per
Week
Tonnes
Cane per
Hour
Pol %
Sugar TC/TS
BGI -
0 - 48
Hrs.
Pol %
Cane
SKELDON 30,594 93.00 77.18 17.06 130.00 200.00 97.75 14.50 80.00 8.73
ALBION 33,377 93.00 80.91 16.89 130.00 168.00 97.75 11.05 80.00 10.93
ROSE HALL 22,538 93.00 78.80 19.39 130.00 110.00 98.00 12.30 80.00 10.11
BLAIRMONT 21,471 93.00 79.02 18.30 130.00 102.00 98.50 11.30 80.00 11.03
EMNORE 19,137 93.00 79.91 17.44 130.00 105.00 98.50 12.44 80.00 9.91
WALES 12,069 93.00 80.18 11.42 130.00 100.00 97.75 12.30 80.00 9.91
UITVLUGT 7,114 93.00 80.10 8.74 100.00 105.00 98.00 12.90 80.00 9.48
INDUSTRY 146,301 93.00 79.20 109.23 127.60 141.06 98.01 12.38 80.00 9.99
Source: Guysuco submission to CoI.
Table 21: CAPEX 2009-2014
Year Actual (G$M) Business Plan
2009 1,728 6,710
2010 2,209 5,992
2011 2,031 7,932
2012 1,927 4,919
2013 1,283 4,595
2014 1,356 4,712
21 | P a g e
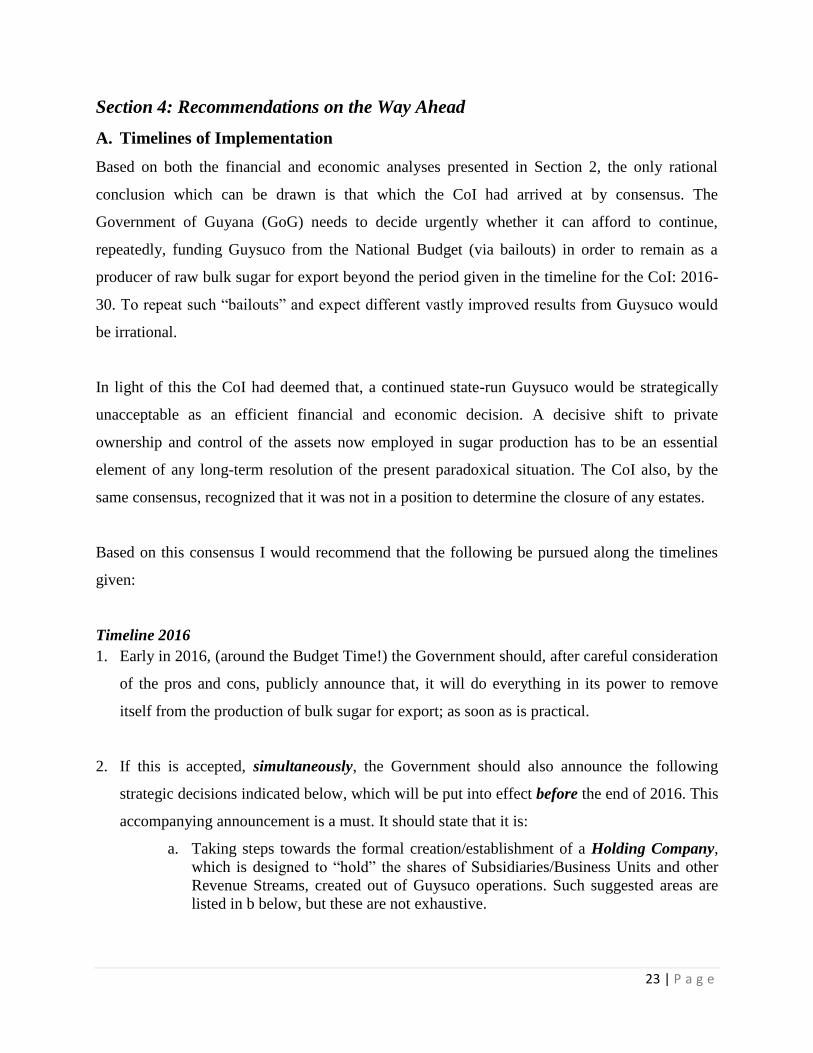
Perhaps, not surprisingly, the corporation’s recent Business Plans have all turned out to be laden
with very unrealistic capital expenditure projections. Indeed, these were accompanied with 1)
unrealistic price forecasts for its sales 2) dubious expectations about cost reductions and, 3)
unsupported projections of increases in its technical performance indicators. As Guysuco has
recently noted, this has been the case for even the corporation’s most recent Business Plan
(2015-2017), which was prepared just before the present new management came on board after
the recent national elections (see Table 22).
As a result the CDB projected Performance Indicators for 2015 shown above in Table 17
projects output at 245,000 tonnes for 2015 and a cost of production of 41 US cents per lb, and
already the new management has adjusted this downwards to 227,000 tonnes with costs in 2014
reaching about 47US cents per lb.
Total 10,534 30% 34,860
Table 22: Guysuco’s Observations on its Business Plan 2015-2017
• Sugar price applied overly optimistic: WMP mid-point USc20.15-25.68/lb. • 2016 production assumption of 280,000 ts unrealistic given the required
level of capital investment and lack of financial capacity to implement. • Funding gap (G$36,207M) source not identified. This would be higher with
more realistic sugar prices. • No rationalisation of cost structure. • Capital expenditure assumption (G$M): Not Fulfilled!
1. 2015: 7,071
2. 2016: 6,535
3. 2017: 5,532
Total: $19,138M
• The future is not addressed! For example, 1) debt unsustainability and need
for urgent reduction / restructuring and 2) unsustainable cost structure, which needs re-engineering
Source: Guysuco, 2015.
22 | P a g e
D. Conclusion
There is widespread agreement among industry analysts that, Guysuco’s Business Plans
projections, cannot stand up to close scrutiny, even for a period as restricted as the very first year
of its projections. Indeed, as Guysuco’s projections go further into the future they are revealed to
be extremely unrealistic. Most of the stakeholders who have worked at Guysuco previously, and
who have presented to the CoI, have bemoaned the all-round decline in the corporation’s
managerial, implementation, and operational capacity. There has been an unmistakably
substantial depletion of the technical/managerial/and other human resource capability of the
Corporation. Added to this, the Corporation has not sought to pursue “functional autonomy” as a
commercial market-driven entity, but instead has pursued a “politics-dependent” path.
Overall, this capacity decline, which is noted here is especially marked in the corporation’s
ability to make forecasts, engage in realistic target setting, and subsequently achieve its predicted
performance outcomes.
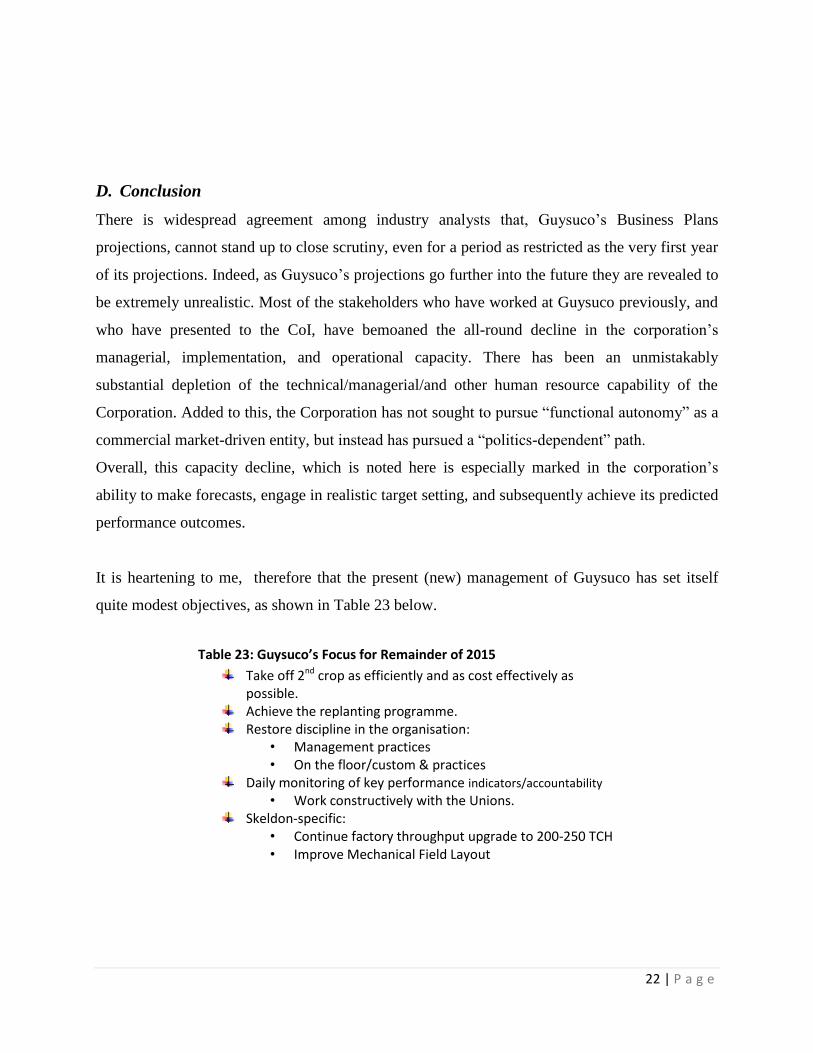
It is heartening to me, therefore that the present (new) management of Guysuco has set itself
quite modest objectives, as shown in Table 23 below.
Table 23: Guysuco’s Focus for Remainder of 2015
Take off 2nd crop as efficiently and as cost effectively as possible.
Achieve the replanting programme. Restore discipline in the organisation:
• Management practices • On the floor/custom & practices
Daily monitoring of key performance indicators/accountability
• Work constructively with the Unions. Skeldon-specific:
• Continue factory throughput upgrade to 200-250 TCH • Improve Mechanical Field Layout
23 | P a g e
Section 4: Recommendations on the Way Ahead
A. Timelines of Implementation
Based on both the financial and economic analyses presented in Section 2, the only rational
conclusion which can be drawn is that which the CoI had arrived at by consensus. The
Government of Guyana (GoG) needs to decide urgently whether it can afford to continue,
repeatedly, funding Guysuco from the National Budget (via bailouts) in order to remain as a
producer of raw bulk sugar for export beyond the period given in the timeline for the CoI: 2016-
30. To repeat such “bailouts” and expect different vastly improved results from Guysuco would
be irrational.
In light of this the CoI had deemed that, a continued state-run Guysuco would be strategically
unacceptable as an efficient financial and economic decision. A decisive shift to private
ownership and control of the assets now employed in sugar production has to be an essential
element of any long-term resolution of the present paradoxical situation. The CoI also, by the
same consensus, recognized that it was not in a position to determine the closure of any estates.
Based on this consensus I would recommend that the following be pursued along the timelines
given:
Timeline 2016
1. Early in 2016, (around the Budget Time!) the Government should, after careful consideration
of the pros and cons, publicly announce that, it will do everything in its power to remove
itself from the production of bulk sugar for export; as soon as is practical.
2. If this is accepted, simultaneously, the Government should also announce the following
strategic decisions indicated below, which will be put into effect before the end of 2016. This
accompanying announcement is a must. It should state that it is:
a. Taking steps towards the formal creation/establishment of a Holding Company,
which is designed to “hold” the shares of Subsidiaries/Business Units and other
Revenue Streams, created out of Guysuco operations. Such suggested areas are
listed in b below, but these are not exhaustive.

24 | P a g e
b. Guysuco will therefore be deconstructed into several subsidiary operations/
business units/revenue streams based on appraisals of their potential profitability:
Co-generation of Electricity;
Supply of Drainage and Irrigation to communities;
Supply of Business Services (IT, tourism and recreation, etc.);
Prime Real Estate and Property Holdings (selected Guysuco premium real
estate);
Agricultural Equipment Pools, including aircraft (for rental to farmers);
Sugar Refinery (Plantation “Whites” or Refined Sugar)
Molasses;
Alcohol;
Ethanol;
Special Sugars.
c. The Holding Company is where, (through stock ownership) Guysuco’s
deconstructed operations, business units and revenue streams will function as its
legal subsidiaries. The Holding Company would therefore, be entitled to enjoy all
the legal rights, benefits, and responsibilities to be derived from a parent company
– subsidiaries relationship. Such an arrangement would, almost by definition,
immediately transform the present over-centralized structure and operations of
Guysuco, into a decentralized and, hopefully, more flexible and adaptable
operational structure.
d. Each subsidiary/business unit/revenue stream that is established, would provide
its own management for its specific operations. Its efficiency, however, as a
subsidiary, would be measured principally, if not solely, by its ability to generate
profits (at set targets) established by the Holding Company. Of course, the
Holding Company itself, will not engage in the day-to-day operations of these
subsidiaries/ business units/revenue streams. Nevertheless, it would set broad
policies and guidelines for their operations. Certainly, guidelines for remuneration
and other benefits going to management would be set by the Holding Company.
Similar to other holding companies the newly-created Holding Company would
not engage itself in the direct production of any goods and services. Indeed we
can say, its sole purpose would be to control the subsidiaries along the lines
indicated above.

25 | P a g e
e. To facilitate this development, the GoG and Guysuco’s management should
engage in a process of negotiation designed to restructure those Guysuco’s debts
that are 1) owed to governmental agencies and 2) other holders of Guysuco’s
debts, for which the GoG has contingent liability.
f. The Holding Company’s capital structure should be partially facilitated by the
negotiated conversion or restructuring of most of Guysuco’s present
indebtedness to the government into equity. Other options for raising new equity
in the Holding Company should also be earnestly explored, with GoG support
(debentures, bonds, etc).
3. 2015 and 2016 Crops
For the 2nd
Crop 2015 and the two succeeding 2016 crops, Guysuco’s management should be
given the task of optimizing the corporation’s performance indicators for sugar. This
would be relentlessly pursued for two main purposes: 1) to raise/improve the saleability of
Guysuco’s major assets and 2) to attract new entrants into the industry (in particular investors
and cane farmers). Here I would strongly recommend the exploration of Mr. Errol
Hanoman’s “scalpel”, reforms, elegantly proposed to the CoI.
4. Two Interventions
a. 2016 should also be the year to commence two major interventions. The first
intervention recommended is the systematic pursuit of a Mechanisation Project,
along the lines designed by the CDB at the end of 2014 (see Table 24).
26 | P a g e
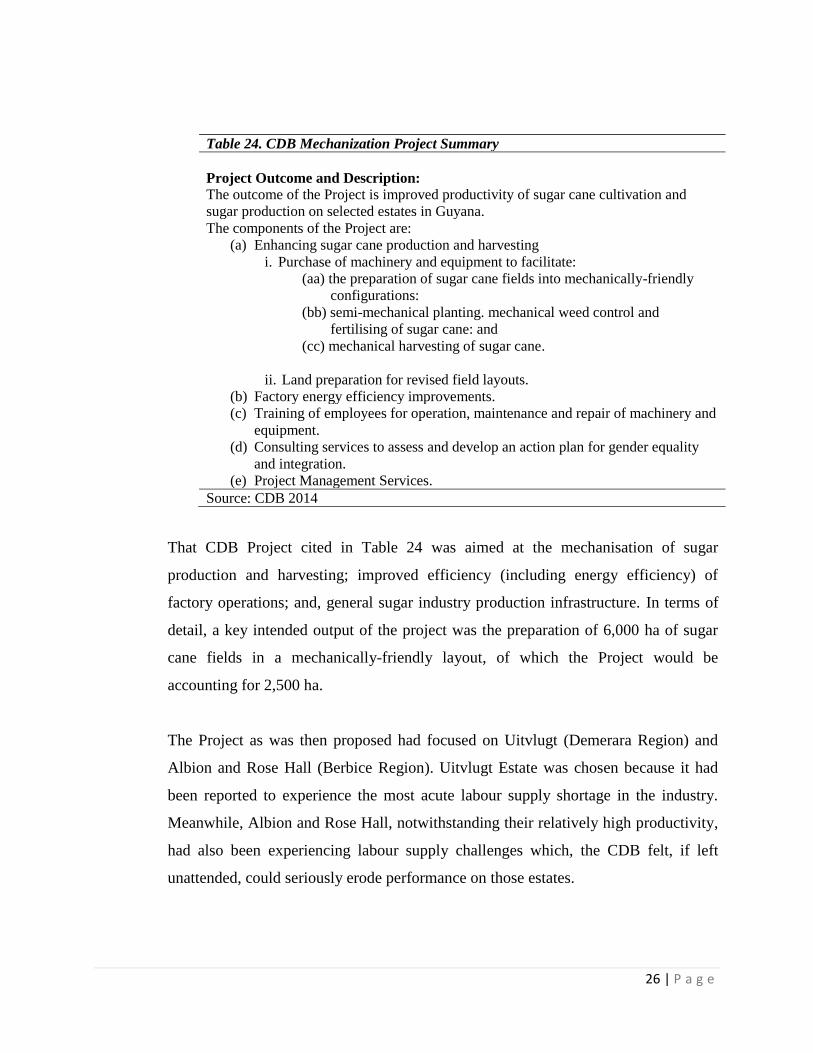
That CDB Project cited in Table 24 was aimed at the mechanisation of sugar
production and harvesting; improved efficiency (including energy efficiency) of
factory operations; and, general sugar industry production infrastructure. In terms of
detail, a key intended output of the project was the preparation of 6,000 ha of sugar
cane fields in a mechanically-friendly layout, of which the Project would be
accounting for 2,500 ha.
The Project as was then proposed had focused on Uitvlugt (Demerara Region) and
Albion and Rose Hall (Berbice Region). Uitvlugt Estate was chosen because it had
been reported to experience the most acute labour supply shortage in the industry.
Meanwhile, Albion and Rose Hall, notwithstanding their relatively high productivity,
had also been experiencing labour supply challenges which, the CDB felt, if left
unattended, could seriously erode performance on those estates.
Table 24. CDB Mechanization Project Summary
Project Outcome and Description:
The outcome of the Project is improved productivity of sugar cane cultivation and
sugar production on selected estates in Guyana.
The components of the Project are:
(a) Enhancing sugar cane production and harvesting
i. Purchase of machinery and equipment to facilitate:
(aa) the preparation of sugar cane fields into mechanically-friendly
configurations:
(bb) semi-mechanical planting. mechanical weed control and
fertilising of sugar cane: and
(cc) mechanical harvesting of sugar cane.
ii. Land preparation for revised field layouts.
(b) Factory energy efficiency improvements.
(c) Training of employees for operation, maintenance and repair of machinery and
equipment.
(d) Consulting services to assess and develop an action plan for gender equality
and integration.
(e) Project Management Services.
Source: CDB 2014

27 | P a g e
In terms of details: the provision of equipment for full-mechanical harvesting was
scheduled to be confined to Uitvlugt because the Uitvlugt factory is the only one (of
the three in the project intervention areas) with the facilities for handling
mechanically harvested canes.
Although I have indicated above my skepticism about the assumptions and data used
in the CDB 2014 project evaluation, See Section 2.F, I believe the present new
management at Guysuco would be more realistic with the data it supplies to the CDB
for its evaluation of the feasibility of any future mechanisation project.
b. The second intervention, which I would recommend strongly is for a serious
evaluation of all the diversification options (raised by several contributors to the CoI),
including specifically: 1) the production of ethanol 2) aquaculture 3) other agriculture
crops, and 4) dairying, and other animal stock. The main caveat I would stress, is for
“other crops” to be first pursued as potential projects outside Guysuco’s lands, and
further seek to utilize Guysuco’s lands only after successful field trials.
Timeline 2017-2018
Based on the above recommendations, if by the end of the residual preferential sale arrangement
in 2017 for Guysuco’s bulk sugar production to the EU, the corporation still remains in
Government’s hands, bulk sugar sales should therefore be exclusively focused on:
The Caribbean Market (see C.E. Housty, 2015)
The CARICOM Market
“Guyana benefits from protection within Caribbean Community and
Common Market (CARICOM) through a 40% Common External Tariff
(CET) imposed on raw sugar imported from non-CARICOM sources. In the
recent past GuySuCo has limited sales to CARICOM Member States because
of production shortfalls and its EU/US market given quota obligations. Other
Caribbean producers have adopted similar strategies. As a result, most
CARICOM countries have sourced sugar from non-regional producers
having obtained waivers on the CET in keeping with the protocol established
by the CARICOM Secretariat. The demand from CARICOM is estimated at
approximately 150,000 tn for raw brown sugar. The Region does not have the
capacity to refine sugar, therefore all white sugar consumed in the Region
(approximately 200,000 tn annually) is imported.” (CDB, 2014)
28 | P a g e
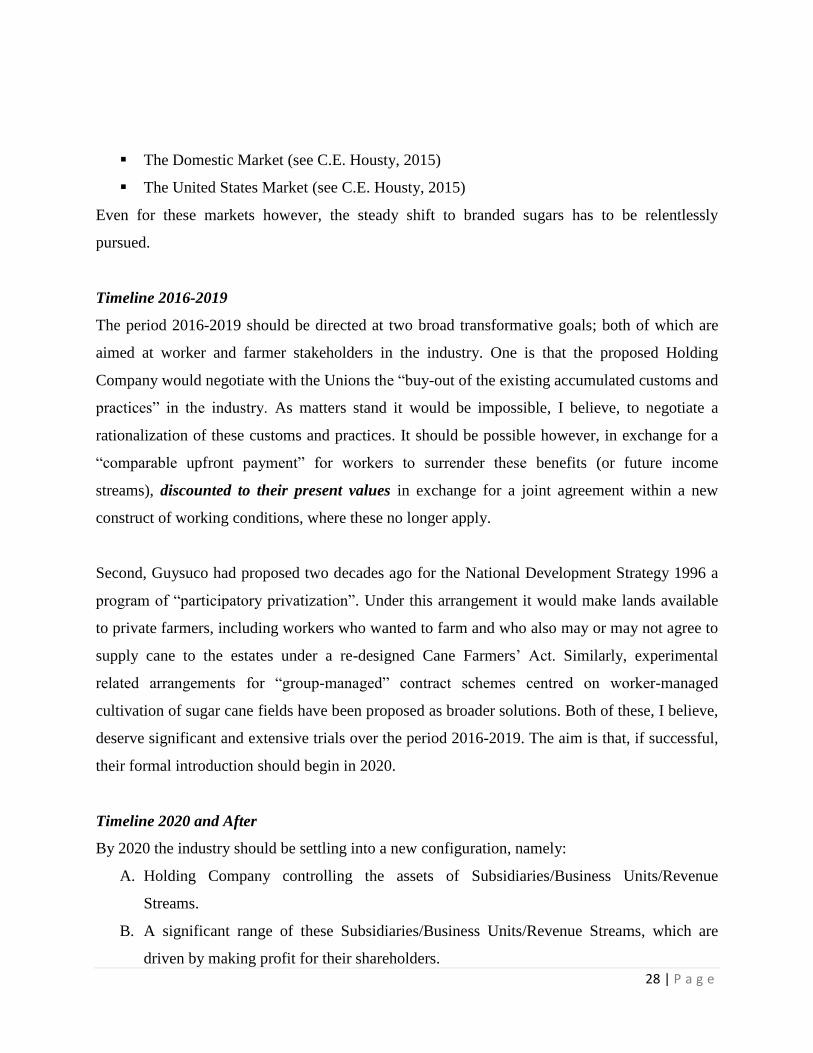
The Domestic Market (see C.E. Housty, 2015)
The United States Market (see C.E. Housty, 2015)
Even for these markets however, the steady shift to branded sugars has to be relentlessly
pursued.
Timeline 2016-2019
The period 2016-2019 should be directed at two broad transformative goals; both of which are
aimed at worker and farmer stakeholders in the industry. One is that the proposed Holding
Company would negotiate with the Unions the “buy-out of the existing accumulated customs and
practices” in the industry. As matters stand it would be impossible, I believe, to negotiate a
rationalization of these customs and practices. It should be possible however, in exchange for a
“comparable upfront payment” for workers to surrender these benefits (or future income
streams), discounted to their present values in exchange for a joint agreement within a new
construct of working conditions, where these no longer apply.
Second, Guysuco had proposed two decades ago for the National Development Strategy 1996 a
program of “participatory privatization”. Under this arrangement it would make lands available
to private farmers, including workers who wanted to farm and who also may or may not agree to
supply cane to the estates under a re-designed Cane Farmers’ Act. Similarly, experimental
related arrangements for “group-managed” contract schemes centred on worker-managed
cultivation of sugar cane fields have been proposed as broader solutions. Both of these, I believe,
deserve significant and extensive trials over the period 2016-2019. The aim is that, if successful,
their formal introduction should begin in 2020.
Timeline 2020 and After
By 2020 the industry should be settling into a new configuration, namely:
A. Holding Company controlling the assets of Subsidiaries/Business Units/Revenue
Streams.
B. A significant range of these Subsidiaries/Business Units/Revenue Streams, which are
driven by making profit for their shareholders.

29 | P a g e
C. Subsidiaries/Business Units/Revenue Streams and the Holding Company would have a
mix of public and private ownership.
D. The bulk sugar market, if it still exists, would be entirely focused on supplying the
restricted premium markets as given above.
E. In principle, sugar production for these markets would be largely dependent on a mix of
farmers and worker-managed cane cultivation, together with private investors (both local
and foreign)
F. Packaged and other value-added sugars would expand substantially relative to bulk sugar
production.
G. The technical and commercial evaluation of Special Sugars, which are planned to be
produced, including refining, would have been completed and financing secured with
everything else ready to come into full production no later than 2020.
H. Through debt reengineering (restructuring and recapitalization) the pressures of
Guysuco’s indebtedness on the National Budget should have been permanently relieved
during this time-frame.
I. A selection of commercially viable estates, supplying sugar at the most efficient domestic
resource cost for local, regional, and “premium” export markets in which value-added
sugars dominate their outputs.
5. Preliminary Calculation/Valuation of Privatization
• The data provided herein are supplied by Guysuco and are for reference only.
• It is presented in good-faith and to the best of knowledge, it is accurate.
• It does not purport to be the sole or otherwise basis for the strategic decisions and
choices, which are required for arriving at a Way Forward.
• In other words, these estimates cannot logically provide a warranty, (legal or otherwise),
for what needs to be made: i.e., strategic decisions, (save and except for their timelines
and the applicability of their contents to those decisions).
Valuation Assumptions
• Production and sales, as contained in the COI report: adjusted for minor computational
errors.
• Privatization after year 3 or 2018.
• Quick disposal (by 2020) of 2,284 acres or 925 ha at LBI.
• Quick disposal (by 2020) of 26 acres or 10.5 ha at Ogle.

30 | P a g e
• Valuation of quick-disposal land – conservatively at G$25million per acre.
• Annual inflation is forecasted at 3%.
• Land inflation is not separately forecasted: there is potential for both high + market
“bubbles”.
• Rate of Exchange used throughout:
• Proceeds from land sales to 2020 are used to reduce the following short term debts:
- Local Trade Creditors
- Taxes owed to GRA
- Local Bank Loans
- Local Overdraft Facilities
- Foreign Working Capital Loan with the National Commercial Bank
Group
Cash Balances
• The forecast cash balances are:
• The Corporation forecasted to have a positive cash balance (G$5Bn) at end 2018 and
before privatization.
Valuations
Net Book Value
• Total assets minus total liabilities
2016 2017 2018 2019 2020 2021 2022 2023 2024 2025
G$/US$ 1 207 208 209 210 211 212 213 214 215 216
2016 - COI 2017 2018
CASH - CLOSING BALANCE / G$M 5,892 12,235 5,000
Valuation Type Prescribed Method Total Assets Total Liabilities Net Book Value
1) Net Book Value
Total Assets - Total
Liabilities 143,163 126,642 16,521
G$M
Result
31 | P a g e
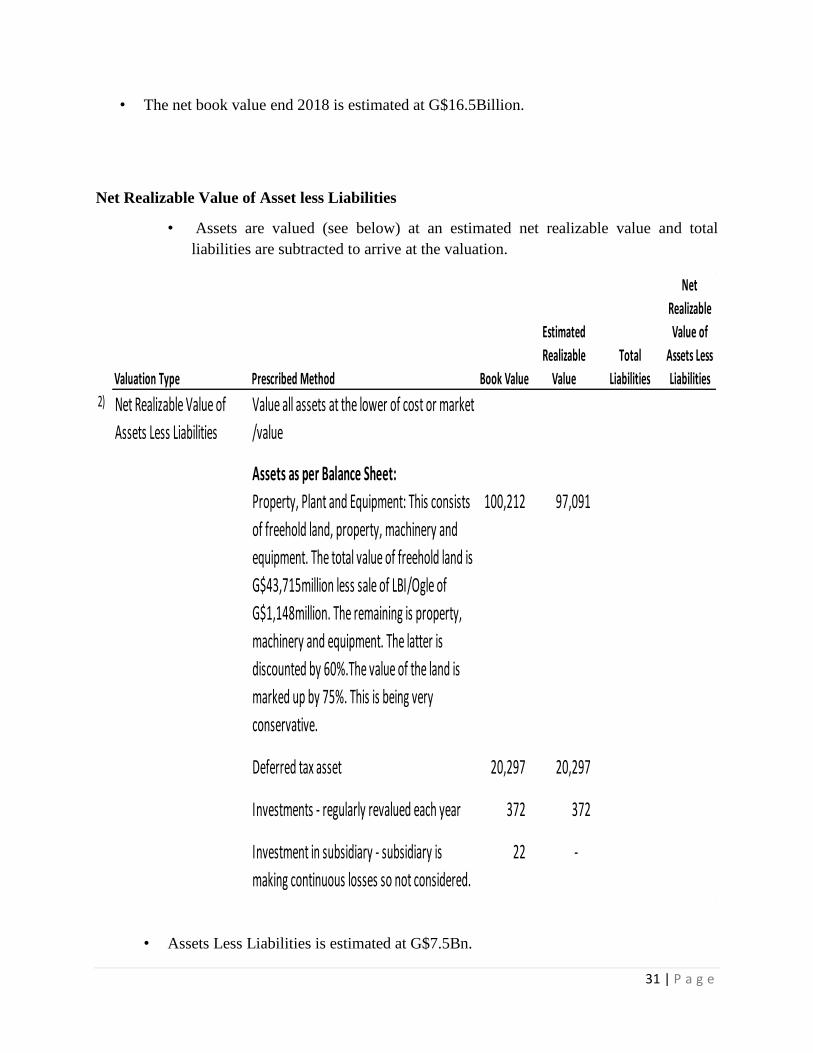
• The net book value end 2018 is estimated at G$16.5Billion.
Net Realizable Value of Asset less Liabilities
• Assets are valued (see below) at an estimated net realizable value and total
liabilities are subtracted to arrive at the valuation.
• Assets Less Liabilities is estimated at G$7.5Bn.
Valuation Type Prescribed Method Book Value
Estimated
Realizable
Value
Total
Liabilities
Net
Realizable
Value of
Assets Less
Liabilities2) Net Realizable Value of
Assets Less Liabilities
Value all assets at the lower of cost or market
/value
Assets as per Balance Sheet:
Property, Plant and Equipment: This consists
of freehold land, property, machinery and
equipment. The total value of freehold land is
G$43,715million less sale of LBI/Ogle of
G$1,148million. The remaining is property,
machinery and equipment. The latter is
discounted by 60%.The value of the land is
marked up by 75%. This is being very
conservative.
100,212 97,091
Deferred tax asset 20,297 20,297
Investments - regularly revalued each year 372 372
Investment in subsidiary - subsidiary is
making continuous losses so not considered.
22 -

32 | P a g e
Key Observations
• To these valuations, the GOG should add savings, as bailout funding 2018-2025 not
required, approximately G$100billion.
• There are other valuations but given no vibrant capital market, GuySuCo’s monopoly
status and operational losses not applicable.
• Other Valuations:
Valuation Type Prescribed Method Book Value
Estimated
Realizable
Value
Total
Liabilities
Net
Realizable
Value of
Assets Less
Liabilities
Inventories - the risk is that the items may
not be of use to other companies or are
obsolete - discount by 80%
3,127 625
Standing cane - is measured at sugar prices
which are lower than costs - discount by 20%
for risk of reduced yields
5,288 4,230
Product stock - already valued at market
price
3,059 3,059
Trade receivables - discount by 10% 2,686 2,417
Other receivables - discount by 50% 2,102 1,051
Prepayments - the risk is that the item is not
received or can be utilized otherwise so not
considered.
1,000 -
Cash on hand and at bank 5,000 5,000
143,163 134,142
Minus total liabilities 126,642 7,500

33 | P a g e
Concluding Remarks
• Window of opportunity for privatization 2018-2020.
• GuySuCo’ debt, if any, without an explicit or implicit GOG contingent liability, can
be added to the receipts from privatization. Not known.
• Pushing the window of opportunity further away for Guysuco’s improved valuation
depends on subsidiaries activities, considered next.
• Note: valuing a debt-laden, loss-making, state-owed Corporation is exceptionally
hazardous.
For this purpose any buyer is likely to bargain from the basis of valuations as given.
Improved valuation increases GoG options.
Note: Buyer’s expectations for generating wealth will be based on speculative use (including
sales and break up of any assets acquired at “bargain-basement” prices, for speculative
disposal).
6. Preliminary Evaluation of the Holding Company-Type Approach
List of Potential Subsidiaries
• Co-generation of Electricity;
• Supply of Drainage and Irrigation to communities;
• Supply of Business Services (IT, tourism and recreation, etc.);
Valuation Type Remarks
3) Replacement Value This requires further market research to determine
the market value of a similar Sugar Corporation of
this capacity.
4) Discounted Cash Flow Growth Model After 2018 and utilization of land sales funds, the
Corporation returns to operating on a cash deficit,
hence this is not a suitable valuation model for the
Corporation.
5) Risk Adjusted Net Present Value Refer to 4.

34 | P a g e
• Prime Real Estate and Property Holdings (selected GuySuCo premium real estate);
• Agricultural Equipment Pools, including aircraft (for rental to farmers);
• Sugar Refinery (Planation “Whites” or Refined Sugar);
• Molasses;
• Alcohol;
• Ethanol’
• Packaging of Special Sugars
• Other by-products
• Etc.
Co-Generation Subsidiary (Skeldon)
• The subsidiary is projected to make a profit of $578M in 2016 and peaks at $1,6M in
2021.
• GuySuCo has the capability of supplying 17MW of power. However, GPL can only
take 15MW.
• This is due to GPL’s lack of infrastructure.
• Diesel generated power will be charged at US$0.02 per kilowatt hour while turbine
generated power has increased to US$0.21 per kilowatt hour.
• Internally consumed power will be charged at US$0.04 per kilowatt hour.
Land Sales Subsidiary
• Quick sale of Ogle, LBI and other lands by 2020.
• Ogle has 26 acres and LBI has 2,284.503 acres for development/disposal.
• Ogle will be disposed of in 2016 while LBI will be on a piecemeal basis over a period
of 5 years.
• The price assumed for land sales is $25M per acre which can be considered very
conservative.
• The Unit will be staffed by a Manager, 2 surveyors and a clerk.
• Net Profit estimated at $11,621M in 2016 and $10,990M in 2017 until 2020.
Packaging Plant Subsidiary
• The Packaging Plant is projected to make a profit of $1,087M in 2016 and peaking at
$1,153M in 2020.
• Responsibility for the sale of direct consumption sugars: Demerara Gold, Demerara
Brown, Enmore Crystals, Private labelled (Regale and Cuisine brands) and Caricom
bagged sugar.
• The Plant will purchase sugar from Enmore factory at prevailing world market prices.
• A world market price of US cents per pound 14.34 has been used for these
projections.
35 | P a g e
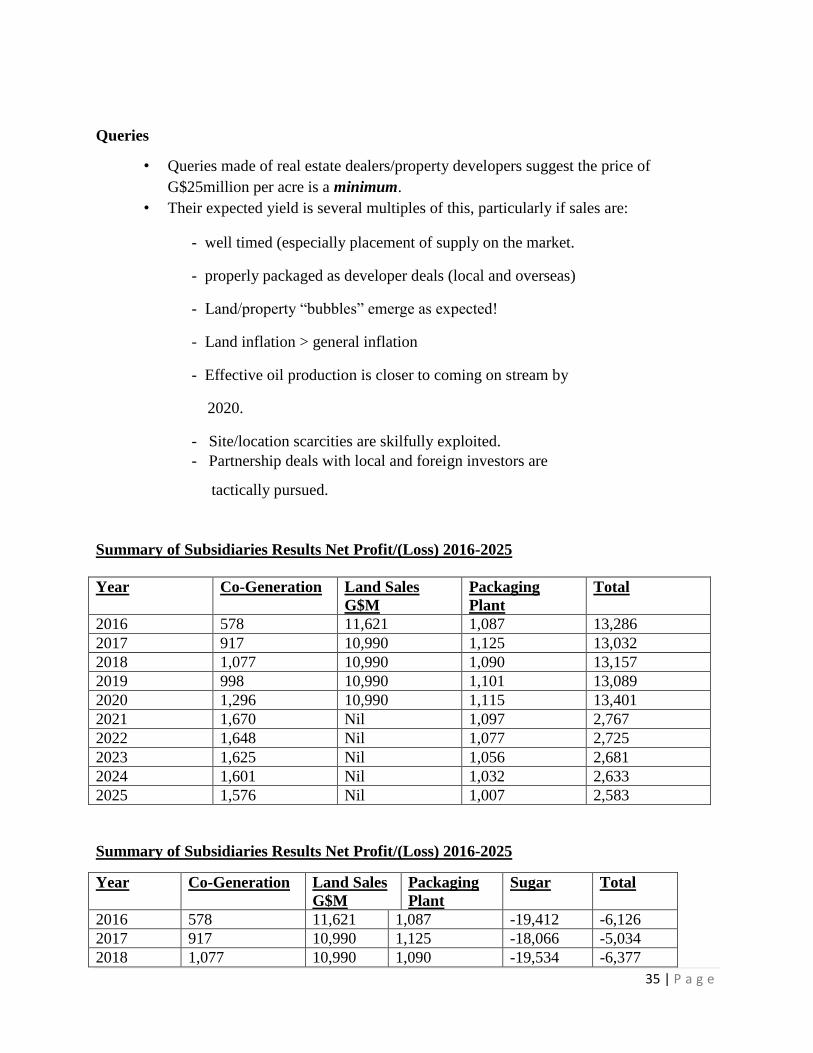
Queries
• Queries made of real estate dealers/property developers suggest the price of
G$25million per acre is a minimum.
• Their expected yield is several multiples of this, particularly if sales are:
- well timed (especially placement of supply on the market.
- properly packaged as developer deals (local and overseas)
- Land/property “bubbles” emerge as expected!
- Land inflation > general inflation
- Effective oil production is closer to coming on stream by
2020.
- Site/location scarcities are skilfully exploited.
- Partnership deals with local and foreign investors are
tactically pursued.
Summary of Subsidiaries Results Net Profit/(Loss) 2016-2025
Year Co-Generation Land Sales
G$M
Packaging
Plant
Total
2016 578 11,621 1,087 13,286
2017 917 10,990 1,125 13,032
2018 1,077 10,990 1,090 13,157
2019 998 10,990 1,101 13,089
2020 1,296 10,990 1,115 13,401
2021 1,670 Nil 1,097 2,767
2022 1,648 Nil 1,077 2,725
2023 1,625 Nil 1,056 2,681
2024 1,601 Nil 1,032 2,633
2025 1,576 Nil 1,007 2,583
Summary of Subsidiaries Results Net Profit/(Loss) 2016-2025
Year Co-Generation Land Sales
G$M
Packaging
Plant
Sugar Total
2016 578 11,621 1,087 -19,412 -6,126
2017 917 10,990 1,125 -18,066 -5,034
2018 1,077 10,990 1,090 -19,534 -6,377
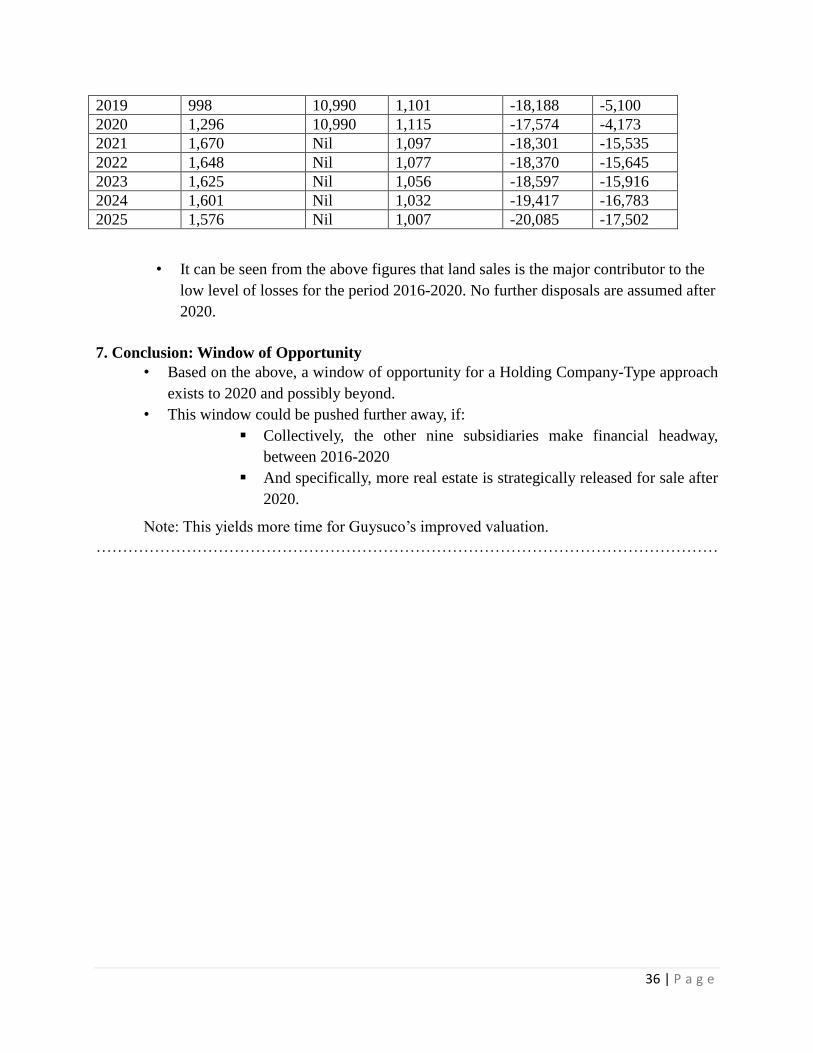
36 | P a g e
2019 998 10,990 1,101 -18,188 -5,100
2020 1,296 10,990 1,115 -17,574 -4,173
2021 1,670 Nil 1,097 -18,301 -15,535
2022 1,648 Nil 1,077 -18,370 -15,645
2023 1,625 Nil 1,056 -18,597 -15,916
2024 1,601 Nil 1,032 -19,417 -16,783
2025 1,576 Nil 1,007 -20,085 -17,502
• It can be seen from the above figures that land sales is the major contributor to the
low level of losses for the period 2016-2020. No further disposals are assumed after
2020.
7. Conclusion: Window of Opportunity
• Based on the above, a window of opportunity for a Holding Company-Type approach
exists to 2020 and possibly beyond.
• This window could be pushed further away, if:
Collectively, the other nine subsidiaries make financial headway,
between 2016-2020
And specifically, more real estate is strategically released for sale after
2020.
Note: This yields more time for Guysuco’s improved valuation.
………………………………………………………………………………………………………