Subependymal cell astrocytomas are characterized by mTORC1 ...
16
Subependymal giant cell astrocytomas are characterized by mTORC1 hyperactivation, a very low somatic mutation rate, and a unique gene expression profile Krinio Giannikou 1,2 ● Zachary Zhu 1 ● Jaegil Kim 2 ● Kellen D. Winden 3 ● Magdalena E. Tyburczy 1 ● David Marron 4 ● Joel S. Parker 4 ● Zachary Hebert 5 ● Anika Bongaarts 6 ● Len Taing 7 ● Henry W. Long 7 ● William V. Pisano 8 ● Sanda Alexandrescu 9 ● Brianna Godlewski 3 ● Mark Nellist 10 ● Katarzyna Kotulska 11 ● Sergiusz Jozwiak 11 ● Marcin Roszkowski 12 ● Marek Mandera 13 ● Elizabeth A. Thiele 14 ● Hart Lidov 9 ● Gad Getz 2 ● Orrin Devinsky 15 ● Michael S. Lawrence 16 ● Keith L. Ligon 8 ● David W. Ellison 17 ● Mustafa Sahin 3 ● Eleonora Aronica 6,18 ● David M. Meredith 19 ● David J. Kwiatkowski 1,2 Received: 19 June 2020 / Revised: 11 August 2020 / Accepted: 12 August 2020 / Published online: 13 October 2020 Abstract Subependymal giant-cell astrocytomas (SEGAs) are slow-growing brain tumors that are a hallmark feature seen in 5–10% of patients with Tuberous Sclerosis Complex (TSC). Though histologically benign, they can cause serious neurologic symptoms, leading to death if untreated. SEGAs consistently show biallelic loss of TSC1 or TSC2. Herein, we aimed to define other somatic events beyond TSC1/TSC2 loss and identify potential transcriptional drivers that contribute to SEGA formation. Paired tumor- normal whole-exome sequencing was performed on 21 resected SEGAs from 20 TSC patients. Pathogenic variants in TSC1/ TSC2 were identified in 19/21 (90%) SEGAs. Copy neutral loss of heterozygosity (size range: 2.2–46 Mb) was seen in 76% (16/ 21) of SEGAs (44% chr9q and 56% chr16p). An average of 1.4 other somatic variants (range 0–7) per tumor were identified, unlikely of pathogenic significance. Whole transcriptome RNA-sequencing analyses revealed 190 common differentially expressed genes in SEGA (n = 16, 13 from a prior study) in pairwise comparison to each of: low grade diffuse gliomas (n = 530) and glioblastoma (n = 171) from The Cancer Genome Atlas (TCGA) consortium, ganglioglioma (n = 10), TSC cortical tubers (n = 15), and multiple normal tissues. Among these, homeobox transcription factors (TFs) HMX3, HMX2, VAX1, SIX3; and TFs IRF6 and EOMES were all expressed >12-fold higher in SEGAs (FDR/q-value < 0.05). Immunohistochemistry supported the specificity of IRF6, VAX1, SIX3 for SEGAs in comparison to other tumor entities and normal brain. We conclude that SEGAs have an extremely low somatic mutation rate, suggesting that TSC1/TSC2 loss is sufficient to drive tumor growth. The unique and highly expressed SEGA-specific TFs likely reflect the neuroepithelial cell of origin, and may also contribute to the transcriptional and epigenetic state that enables SEGA growth following two-hit loss of TSC1 or TSC2 and mTORC1 activation. Introduction Subependymal giant cell astrocytomas (SEGAs) are slow growing, glioneuronal brain neoplasms that represent 2% of all pediatric brain tumors. SEGAs are seen almost exclusively in patients with tuberous sclerosis complex (TSC, MIM# 191100, 191092). Approximately, 5–10% of patients with TSC develop SEGAs, of which nearly all are diagnosed in childhood [1–4]. TSC is a multisystem neurocutaneous genetic syndrome that affects multiple organ systems, including the central nervous system (CNS) with cortical tubers, white matter heterotopias, subependymal nodules (SENs), and SEGAs [3, 4]. SEGAs have been shown to have either TSC1 or TSC2 biallelic inactivation in about 80% of * Krinio Giannikou [email protected] * David J. Kwiatkowski [email protected] Extended author information available on the last page of the article Supplementary information The online version of this article (https:// doi.org/10.1038/s41379-020-00659-9) contains supplementary material, which is available to authorized users.
Transcript of Subependymal cell astrocytomas are characterized by mTORC1 ...

Subependymal giant cell astrocytomas are characterized by mTORC1hyperactivation, a very low somatic mutation rate, and a uniquegene expression profile
Krinio Giannikou1,2 ● Zachary Zhu1
● Jaegil Kim2 ● Kellen D. Winden3
● Magdalena E. Tyburczy1 ● David Marron4
●
Joel S. Parker 4 ● Zachary Hebert 5
● Anika Bongaarts6 ● Len Taing7
● Henry W. Long7 ● William V. Pisano8
●
Sanda Alexandrescu9 ● Brianna Godlewski3
● Mark Nellist10 ● Katarzyna Kotulska11
● Sergiusz Jozwiak 11 ●
Marcin Roszkowski12 ● Marek Mandera 13
● Elizabeth A. Thiele14 ● Hart Lidov9
● Gad Getz2 ● Orrin Devinsky15
●
Michael S. Lawrence16 ● Keith L. Ligon8
● David W. Ellison17 ● Mustafa Sahin 3
● Eleonora Aronica6,18 ●
David M. Meredith 19 ● David J. Kwiatkowski1,2
Received: 19 June 2020 / Revised: 11 August 2020 / Accepted: 12 August 2020 / Published online: 13 October 2020
AbstractSubependymal giant-cell astrocytomas (SEGAs) are slow-growing brain tumors that are a hallmark feature seen in 5–10% of patients with Tuberous Sclerosis Complex (TSC). Though histologically benign, they can cause serious neurologic symptoms, leading to death if untreated. SEGAs consistently show biallelic loss of TSC1 or TSC2. Herein, we aimed to define other somatic events beyond TSC1/TSC2 loss and identify potential transcriptional drivers that contribute to SEGA formation. Paired tumor-normal whole-exome sequencing was performed on 21 resected SEGAs from 20 TSC patients. Pathogenic variants in TSC1/TSC2 were identified in 19/21 (90%) SEGAs. Copy neutral loss of heterozygosity (size range: 2.2–46 Mb) was seen in 76% (16/ 21) of SEGAs (44% chr9q and 56% chr16p). An average of 1.4 other somatic variants (range 0–7) per tumor were identified, unlikely of pathogenic significance. Whole transcriptome RNA-sequencing analyses revealed 190 common differentially expressed genes in SEGA (n = 16, 13 from a prior study) in pairwise comparison to each of: low grade diffuse gliomas (n = 530) and glioblastoma (n = 171) from The Cancer Genome Atlas (TCGA) consortium, ganglioglioma (n = 10), TSC cortical tubers (n = 15), and multiple normal tissues. Among these, homeobox transcription factors (TFs) HMX3, HMX2, VAX1, SIX3; and TFs IRF6 and EOMES were all expressed >12-fold higher in SEGAs (FDR/q-value < 0.05). Immunohistochemistry supported the specificity of IRF6, VAX1, SIX3 for SEGAs in comparison to other tumor entities and normal brain. We conclude that SEGAs have an extremely low somatic mutation rate, suggesting that TSC1/TSC2 loss is sufficient to drive tumor growth. The unique and highly expressed SEGA-specific TFs likely reflect the neuroepithelial cell of origin, and may also contribute to the transcriptional and epigenetic state that enables SEGA growth following two-hit loss of TSC1 or TSC2 and mTORC1 activation.
Introduction
Subependymal giant cell astrocytomas (SEGAs) are slowgrowing, glioneuronal brain neoplasms that represent 2% ofall pediatric brain tumors. SEGAs are seen almost exclusivelyin patients with tuberous sclerosis complex (TSC, MIM#191100, 191092). Approximately, 5–10% of patients withTSC develop SEGAs, of which nearly all are diagnosed inchildhood [1–4]. TSC is a multisystem neurocutaneousgenetic syndrome that affects multiple organ systems,including the central nervous system (CNS) with corticaltubers, white matter heterotopias, subependymal nodules(SENs), and SEGAs [3, 4]. SEGAs have been shown to haveeither TSC1 or TSC2 biallelic inactivation in about 80% of
* Krinio Giannikou [email protected]
* David J. [email protected]
Extended author information available on the last page of the article
Supplementary information The online version of this article (https://doi.org/10.1038/s41379-020-00659-9) contains supplementarymaterial, which is available to authorized users.
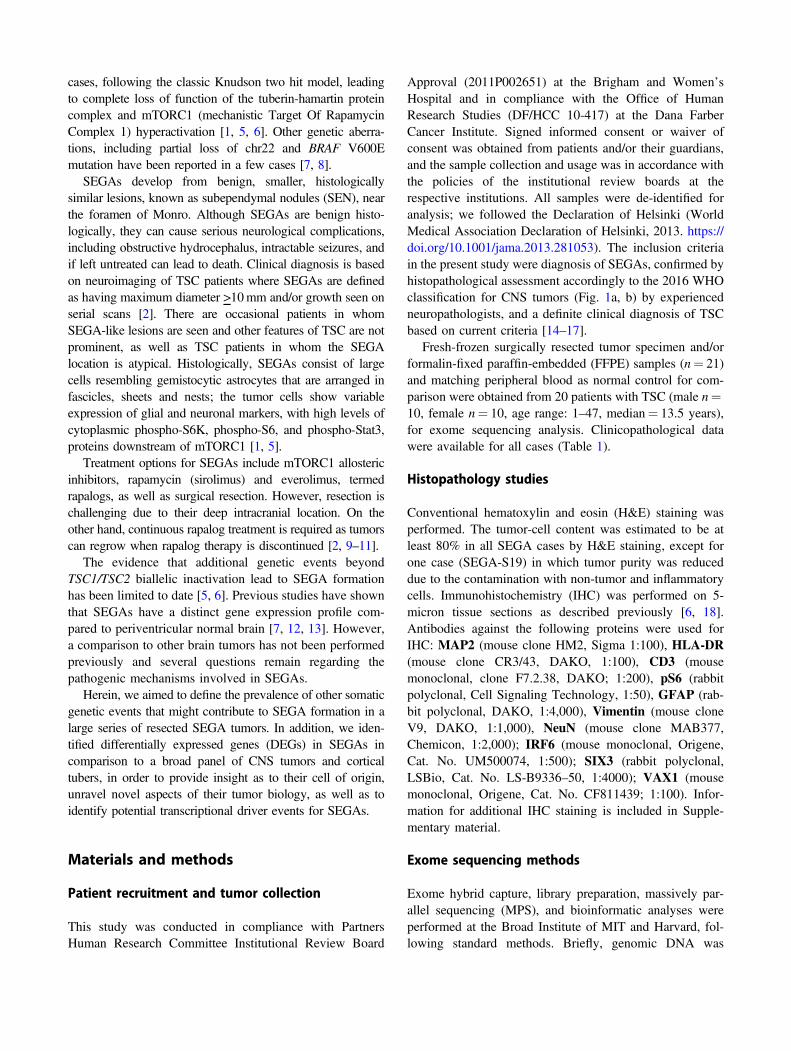
cases, following the classic Knudson two hit model, leadingto complete loss of function of the tuberin-hamartin proteincomplex and mTORC1 (mechanistic Target Of RapamycinComplex 1) hyperactivation [1, 5, 6]. Other genetic aberra-tions, including partial loss of chr22 and BRAF V600Emutation have been reported in a few cases [7, 8].
SEGAs develop from benign, smaller, histologicallysimilar lesions, known as subependymal nodules (SEN), nearthe foramen of Monro. Although SEGAs are benign histo-logically, they can cause serious neurological complications,including obstructive hydrocephalus, intractable seizures, andif left untreated can lead to death. Clinical diagnosis is basedon neuroimaging of TSC patients where SEGAs are definedas having maximum diameter >10mm and/or growth seen onserial scans [2]. There are occasional patients in whomSEGA-like lesions are seen and other features of TSC are notprominent, as well as TSC patients in whom the SEGAlocation is atypical. Histologically, SEGAs consist of largecells resembling gemistocytic astrocytes that are arranged infascicles, sheets and nests; the tumor cells show variableexpression of glial and neuronal markers, with high levels ofcytoplasmic phospho-S6K, phospho-S6, and phospho-Stat3,proteins downstream of mTORC1 [1, 5].
Treatment options for SEGAs include mTORC1 allostericinhibitors, rapamycin (sirolimus) and everolimus, termedrapalogs, as well as surgical resection. However, resection ischallenging due to their deep intracranial location. On theother hand, continuous rapalog treatment is required as tumorscan regrow when rapalog therapy is discontinued [2, 9–11].
The evidence that additional genetic events beyondTSC1/TSC2 biallelic inactivation lead to SEGA formationhas been limited to date [5, 6]. Previous studies have shownthat SEGAs have a distinct gene expression profile com-pared to periventricular normal brain [7, 12, 13]. However,a comparison to other brain tumors has not been performedpreviously and several questions remain regarding thepathogenic mechanisms involved in SEGAs.
Herein, we aimed to define the prevalence of other somaticgenetic events that might contribute to SEGA formation in alarge series of resected SEGA tumors. In addition, we iden-tified differentially expressed genes (DEGs) in SEGAs incomparison to a broad panel of CNS tumors and corticaltubers, in order to provide insight as to their cell of origin,unravel novel aspects of their tumor biology, as well as toidentify potential transcriptional driver events for SEGAs.
Materials and methods
Patient recruitment and tumor collection
This study was conducted in compliance with PartnersHuman Research Committee Institutional Review Board
Approval (2011P002651) at the Brigham and Women’sHospital and in compliance with the Office of HumanResearch Studies (DF/HCC 10-417) at the Dana FarberCancer Institute. Signed informed consent or waiver ofconsent was obtained from patients and/or their guardians,and the sample collection and usage was in accordance withthe policies of the institutional review boards at therespective institutions. All samples were de-identified foranalysis; we followed the Declaration of Helsinki (WorldMedical Association Declaration of Helsinki, 2013. https://doi.org/10.1001/jama.2013.281053). The inclusion criteriain the present study were diagnosis of SEGAs, confirmed byhistopathological assessment accordingly to the 2016 WHOclassification for CNS tumors (Fig. 1a, b) by experiencedneuropathologists, and a definite clinical diagnosis of TSCbased on current criteria [14–17].
Fresh-frozen surgically resected tumor specimen and/orformalin-fixed paraffin-embedded (FFPE) samples (n= 21)and matching peripheral blood as normal control for com-parison were obtained from 20 patients with TSC (male n=10, female n= 10, age range: 1–47, median= 13.5 years),for exome sequencing analysis. Clinicopathological datawere available for all cases (Table 1).
Histopathology studies
Conventional hematoxylin and eosin (H&E) staining wasperformed. The tumor-cell content was estimated to be atleast 80% in all SEGA cases by H&E staining, except forone case (SEGA-S19) in which tumor purity was reduceddue to the contamination with non-tumor and inflammatorycells. Immunohistochemistry (IHC) was performed on 5-micron tissue sections as described previously [6, 18].Antibodies against the following proteins were used forIHC: MAP2 (mouse clone HM2, Sigma 1:100), HLA-DR(mouse clone CR3/43, DAKO, 1:100), CD3 (mousemonoclonal, clone F7.2.38, DAKO; 1:200), pS6 (rabbitpolyclonal, Cell Signaling Technology, 1:50), GFAP (rab-bit polyclonal, DAKO, 1:4,000), Vimentin (mouse cloneV9, DAKO, 1:1,000), NeuN (mouse clone MAB377,Chemicon, 1:2,000); IRF6 (mouse monoclonal, Origene,Cat. No. UM500074, 1:500); SIX3 (rabbit polyclonal,LSBio, Cat. No. LS-B9336–50, 1:4000); VAX1 (mousemonoclonal, Origene, Cat. No. CF811439; 1:100). Infor-mation for additional IHC staining is included in Supple-mentary material.
Exome sequencing methods
Exome hybrid capture, library preparation, massively par-allel sequencing (MPS), and bioinformatic analyses wereperformed at the Broad Institute of MIT and Harvard, fol-lowing standard methods. Briefly, genomic DNA was

sheared in a Covaris sonicator (Covaris, Woburn, MA,USA) to fragments of 200–500 bp, and subject to captureusing the MPS Illumina Exome (37.7 Mb of mainly exonicterritory; Agilent SureSelect All Exon V2) [19, 20]. Pooledindexed libraries were sequenced on either the HiSeq 2000or HiSeq 2500 instrument (Illumina platform), using 76 bppaired-end sequencing. The mean coverage for the targetedregion was 105x (range: 49–267x) for all tumors and 113x(range: 47–192x) for normal samples. An average of 76% inthe targeted region (range: 46–93%) was covered at >50xfor tumor, whereas it was 92% at >50x (range: 80–95%) fornormal.
Pre-processing and bioinformatics analysis ofMPS data
Demultiplexing/sample deconvolution, base alignmentand sequence quality control were performed using Picardtools and the Firehose pipeline at the Broad Institute ofMIT and Harvard. Fastq files were generated and uniquereads were aligned to the human reference genome
GRCh37(hg19) using BWA (v0.7.3a) [http://arxiv.org/abs/1303.3997] and Bowtie 2 (http://bowtie-bio.sourceforge.net/bowtie2/index.shtml). Variant calling for singlenucleotide variants (SNVs) and insertion/deletions(indels) was performed using Haplotype Caller in GenomeAnalysis Toolkit (GATK, v3.0) Best Practices. Sequen-cing data were then analyzed using the Cancer GenomeAnalysis pipeline, as well as custom code in Python,Matlab and Unix to enable the detection of TSC1/TSC2deleterious sequence variants with low mutant allele fre-quency (MAF) [5]. Somatic point mutations were calledby MuTect (http://www.broadinstitute.org/cancer/cga/mutect/) and short insertions and deletions in sequencingdata were identified by SomaticIndelDetector. All variantswere annotated using Oncotator (http://www.broadinstitute.org/oncotator). We used ABSOLUTE to esti-mate tumor purity, tumor cell ploidy, and to determinechromosomal copy-numbers genome-wide [21]. Allsomatic variant calls were reviewed manually using IGV(https://software.broadinstitute.org/software/igv/), andthose reflecting sequencing or other artifacts were
Fig. 1 MRI images and histologic features of SEGAs. a T1-weighted coronal or sagittal gadolinium-enhanced MRI imagesshowing SEGAs in the right lateral ventricle near the foramen ofMonro (SEGA-S6, SEGA-S17), or in a similar location on the left(SEGA-S8) in 3 TSC subjects before surgical resection. b H&E andrepresentative IHC images of the three corresponding SEGA tumors(SEGA-S6, S8, S17). H&E staining shows classical histologicalSEGA features, with giant cells in a mixed glial background withblood vessels. Variable expression of the glial marker GFAP is seen,
with diffuse immunoreactivity in 2 of 3 samples shown here, with lessstaining for MAP2. HLA-DR staining highlights variable numbers ofmicroglial cells, and CD3 staining shows presence of scant intratumorT lymphocytes; Variable expression of the neuronal marker MAP2 isseen. IHC is negative for the neuronal nuclear marker NeuN, butpositive for intermediate filament vimentin (SEGA-S17). Activation ofmTORC1 in tumor giant cells is indicated by expression of pS6. Scalebars: 100 μm.

Table1Clin
icop
atho
logicaldata
for20
TSC
patientswith
21resected
SEGA
tumors.
Sub
ject
Age
(at
surgery)-
years
Gender
Tum
orlocatio
nTum
orsize
(cm)
Treatment
priorto
surgery
Treatment
Epilepsy
Age
aton
set
epilepsy
Seizure
frequencyprior
tosurgery
Other
clinical
manifestatio
ns
SEGA-S1
1M
Right
lateralventricle
3×3
Yes
Antiepileptic/
sirolim
us(non
-respon
der)
Yes
(drug-
resistance)
1mon
thDaily
Cortical
tubers
SEGA-S2
2M
Leftventricle
2.5×3.5×3
Yes
Antiepileptic
Yes
(severe)
1mon
thDaily
Cortical
tubers,PKD,cystic
tubers,autism,severe
ID,renal
insufficiency
SEGA-S3
6M
Right
ventricle
6×4.4×4.5
Yes
Antiepileptic
Yes
2mon
ths
2–3/week
Cortical
tubers,cardiac
rhabdo
myo
ma,
FA,ID
,autism,
hydrocephalus,vo
miting
,vision
loss
SEGA-S4
9M
Leftlateralventricle
2×1.5×0.4
Yes
Antiepileptic
Yes
(with
complex
partial
seizures)
15mon
ths
Weekly/bi-
weeklysubtle
seizures
Bicuspidaortic
valve,
righ
tFR
cortical
tuberandrigh
tTL
subcortical
tuber
SEGA-S5
9M
Right
ventricle
(foram
enMon
ro)
1.2×1.2×1.4
Yes
Top
ical
rapamycin
1%ointmentfor
facial
lesion
s
No
N/A
N/A
Cortical
tubers,HMM,FA,
periun
gual
fibrom
as,
SENS,renalAMLs,abov
eaverageintellect
SEGA-S6
14M
Intraventricular,
cerebrum
4Yes
Antiepileptic
Yes
4years
N/A
Cortical
tubers,kidn
eyAML,
visual
loss,no
rmal
intellect
SEGA-S7
14M
TwoSEGAs,on
ein
righ
tandon
ein
left
ventricle
RV:3.5×2×
2.5,
LV:2.5×
1.5×0.8
No
N/A
No
N/A
N/A
Cortical
tubers,mild
FA,
norm
alintellect,acute
hydrocephalus
SEGA-S8
15M
Leftventricle
1.5
Yes
Antiepileptic
Yes
10years
Daily
nond
isablin
g(5–6perday)
Cortical
tubers,kidn
eyAML,
norm
alintellect
SEGA-S9
17M
Right
ventricle
(foram
enMon
ro)
3.5×3×2.5
No
N/A
No
N/A
N/A
History
ofmorning
headache
andvo
miting
(raisedICP
symptom
srelatedto
hydrocephalus),mild
ID
SEGA-S10
23M
Ventricle
(foram
enMon
ro)
N/A
Yes
Antiepileptic
Yes
3years
2–3per
6mon
ths
Cortical
tubers,kidn
eyAML,
norm
alintellect
SEGA-S11
1F
Right
lateralventricle
3×3
Yes
Antiepileptic
Yes
1mon
thDaily
Cortical
tubers
SEGA-S12
6F
Leftlateralventricle
6×5×2
Yes
Antiepileptic
Yes
(drug-
resistance)
3days
Daily
seizures
Cortical
tubers,severe
TSC
presentatio
n:cortical
dysplasia
(surgery
atage1),FA,kidn
eyAML,cardiacrhabdo
myo
ma,
severe
ID,autism,acute
hydrocephalus

Table1(con
tinued)
Sub
ject
Age
(at
surgery)-
years
Gender
Tum
orlocatio
nTum
orsize
(cm)
Treatment
priorto
surgery
Treatment
Epilepsy
Age
aton
set
epilepsy
Seizure
frequencyprior
tosurgery
Other
clinical
manifestatio
ns
SEGA-S13
11F
Frontal
horn
ofrigh
tlateralventricle
2.4×1.7×2.3
No
N/A
No
N/A
N/A
Cortical
andsubcortical
tubers,
subepend
ymal
nodu
les,FA,
shagreen
patch,
hypo
melanotic
macules,renal
angiom
yolip
omas,retin
alhamartomas,no
rmal
developm
ent,complaintsof
blurry
vision
andsomenausea
SEGA-S14
13F
Leftlateralventricle
4×3
Yes
Antiepileptic
Yes
17mon
ths
N/A
Cortical
tubers
SEGA-S15
13F
Right
ventricle
1×2×3
Yes
Antiepileptic
Yes
9mon
ths
Noseizures
for
>2years
Cortical
tubers,FA,
kidn
eyAML
SEGA-S16
14F
Right
ventricle
3.5×2.5×0.8
Yes
Antiepileptic
Yes
12mon
ths
Noseizures
for
>2years
Cortical
tubers,kidn
eyAML,
FA,hy
drocephalus,vision
loss
SEGA-S17
14F
Intraventricular
N/A
No
N/A
No
N/A
N/A
Cortical
tubers,kidn
eyAML,
norm
alintellect
SEGA-S18
22F
Leftlateralventricle
3.5×1.5×0.6
Yes
Antiepileptic
Yes
(intractable)
N/A
N/A
Cortical
tuber,hy
drocephalus,
fibroadeno
maof
righ
tbreast,
hydrocephalus,malignant
neop
lasm
ofcerebrum
,except
lobesandventricles
SEGA-S19
47F
Right
fron
tal
1.5×0.8×0.2
No
No
No
nono
FA,SEN,kidn
eyAML,renal
cysts,3healthyoffspring
SEGA-S20
17F
Right
lateralventricle
1.0×0.8×0.7
No
N/A
Yes
0Uncertain
Cortical
tubers,ASD,cogn
itive
impairment,behavioral
issues,
renalAMLs,FA,oral
fibrom
as
Mmale,Ffemale,PKD
polycystickidn
eydisease,AMLangiom
yolip
oma,ID
intellectualdisability,
ASD
autism
spectrum
disorder,H
MM
hypo
melanoticmacules,F
Afacialangiofi
brom
a,SE
Nsubepend
ymal
nodu
le,RVrigh
tventricle,
LVleftventricle,
ICPIncreasedIntracranial
Pressure.

excluded. Variant nomenclature was confirmed by Muta-lyzer (https://mutalyzer.nl/). SIFT and PROVEAN insilico prediction tools (http://provean.jcvi.org/index.php)were used to assess the functional effects of missensevariants. Called variants were validated by either Sangersequencing (variants with MAF > 10%) or amplicon MPSmethod (variants with MAF < 10%) for 10 out 21 SEGAswith DNA material available [22, 23].
Whole transcriptome RNA sequencing
Paired end RNA-sequencing (RNA-seq) was performedon 3 SEGA tumors (SEGA-S3, S4, S19 with matchingexome data) at the Broad Institute of MIT and Harvard,following standard methods (Illumina platform). Addi-tional RNA-seq raw data were obtained from 13 SEGAsfrom a previous study [6] and were reanalyzed for uni-formity and downstream analyses. After quality assess-ment and filtering for all SEGA tumors, raw reads weremapped or aligned to the reference genome GRCh37(hg19) build using the STAR program [24]. VIPER(Visualization Pipeline for RNA-seq analysis) [25] QCanalysis for all combined 16 SEGAs revealed high qualitysequencing data with a median of ~25 million paired endreads generated for each tumor (range: 21–97 M reads).FPKM normalized values for all genes and their isoformswere generated using Cufflinks v2.2.1. Raw data werealso converted into RSEM format for comparison to otherbrain and adult solid tumors from The Cancer GenomeAtlas (TCGA) consortium and 10 gangliogliomas [26–29]. We also performed gene fusion analysis to identifyany gene rearrangements using FusionInspector (https://github.com/FusionInspector/FusionInspector/), as a pre-vious study reported a single SEGA case with PRRC2B-ALK fusion [30].
Statistical analysis
Statistical analyses were performed using the non-parametricMann–Whitney U-test in GraphPad Prism software (Graph-pad Software Inc., La Jolla, CA). All p-values were correctedapplying the Benjamini–Hochberg method. An adjusted p-value/FDR < 0.05 was considered statistically significant. Thefollowing convention was used in all figures: *p ≤ 0.05; **p ≤0.01; ***p ≤ 0.001; ****p ≤ 0.0001.
Results
Clinical and routine diagnostic studies
In this study, we evaluated 21 SEGAs from 20 patients withTSC. Pre-operative brain MRIs demonstrated that these
tumors were present on the medial or lateral ventricularwall, which is typical for these lesions (Fig. 1a and Table 1).H&E staining showed classic histologic features forSEGAs, featuring plump cells with abundant glassy eosi-nophilic cytoplasm and enlarged nuclei with distinctnucleoli (Fig. 1b). IHC showed variable expression ofGFAP, MAP2, and HLA-DR; with consistent labeling forpS6, a marker of mTORC1 activation; and variable numbersof CD3+ cells (Fig. 1b).
TSC1/TSC2 mutation analysis of SEGAs
Twenty-one paired SEGA-normal samples were analyzedby exome sequencing. TSC1 and TSC2 germline pathogenicvariants were identified in 18 of 20 (90%) patients (6 TSC1mutations and 12 TSC2 mutations) and were similar to theknown pathogenic variant spectrum for these genes (Fig. 2aand Table S1; SEGA-S15 had a large TSC1 deletion, asindicated by focal reduction in read depth for exons 18–23)[4]. Copy neutral loss of heterozygosity (CN-LOH) wasseen in the TSC2 region of chr16p in 9 of 12 (82%) tumorsfrom subjects with pathogenic TSC2 variants; size range:2.2–30.3 Mb (Fig. 2b, Fig. S1 and Table S1). CN-LOH wasalso seen in chr9q encompassing TSC1 in 6 SEGA tumorsfrom subjects with pathogenic TSC1 variants; size range:6.7–46Mb (Fig. 2b, Fig. S1 and Table S1). One tumor fromone subject (SEGA-S17), with no germline mutationidentified in either TSC1 or TSC2, had CN-LOH in chr16p,suggesting an occult germline mutation in TSC2 (Table S1and Fig. S1). CN-LOH regions had a variable size on bothchromosome 9 and 16, likely reflecting random mitoticrecombination events, as seen previously in TSC kidneyangiomyolipoma [31].
Exome sequence analysis
Exome sequencing revealed 30 somatic point variants/indels in 10 of 21 (45%) tumor-normal matched samples,with a range: 0–7 variants/tumor (overall median 0, average1.4, Fig. 2c and Table S2). None of these 30 somatic var-iants occurred in the same gene in different samples and 20of 30 (67%) were subclonal, determined by ABSOLUTE.Twenty-three of the 30 variants (77%) were missensechanges, of which 15 (65%) were classified as likely dele-terious/damaging by in silico prediction analysis. None ofthe genes with somatic alterations were known ‘cancergenes’ [32]. These results suggest that these variants werelikely passenger events that do not contribute to SEGAformation. We did not observe any mutations in BRAF inthis SEGA cohort (Table S2), similar to our findings in aprevious SEGA cohort [5].
We then compared the somatic mutation rate that weobserved in SEGAs from our internal cohort (n= 21)

including 16 tumors from a previous study [6], with ratesthat have been reported for a wide variety of other braintumors (Fig. 2d and Table S3), as well as other TCGAtumors (Fig. S2) [33]. SEGAs in our analysis showed asimilar, though slightly lower, mutation burden (SNVs perMb) to pediatric medulloblastoma and hindbrain epen-dymoma, and a substantially lower mutation burden thanboth pediatric and adult low-grade gliomas.
Copy number alteration (CNA) analysis revealed sub-clonal chromosomal gains and/or losses in 5/21 (24%)tumors at either the arm or whole chromosome level,including chr21 and chr22 loss; and chr5 and chr19p gain(Fig. 2e). These results are similar to those reportedpreviously, in which CNAs were seen in 3/14 (21%)SEGAs for several chromosomes (1, 5, 7, 11, 12, 17, and19) [6].
Gene expression RNA-seq analyses
We analyzed RNA-seq data for 16 SEGA tumors (see“Materials and methods”) in comparison to the TCGA braintumor cohort, including low grade gliomas (LGG; n= 530)and TCGA adult glioblastomas (GBM; n= 171), as well as
cortical tubers (n= 15), SEN (n= 2), and normal brainsamples (n= 11) [6, 29]. This set of 16 SEGA tumors wasrelatively pure, as reflected by the mutant allele frequencyof either TSC1 or TSC2 mutation for each (SEGA-S3, S4,S20 and Martin et al. 2017 [6]).
To discern the potential relationship between SEGA andthe large panel of brain tumors studied by TCGA, we per-formed a de novo clustering analysis for 3060 most variablegenes in the combined cohort (n= 745) by consensusBayesian non-negative matrix factorization, and identifiedfour distinct clusters (Cluster 1–4 in Fig. 3a and Table S4)[34]. Of note, 15 of 16 SEGAs were co-clustered with mostGBM samples (95%, 163 out of 171) and 20% of LGGsamples (103 out of 530) in Cluster 3. The set of 103 LGGin cluster 3 included 60 astrocytomas, 15 oligoas-trocytomas, 16 oligodendrogliomas, and 12 unclassifiedbrain tumors. Note that we recognize that the oligoas-trocytoma designation for a subset of gliomas is no longerused; we retain that term here to be consistent withnomenclature used in TCGA project. The single SEGA thatwas not in cluster 3 was from Martin et al. [6] and wasgrouped in Cluster 1 with normal brain, suggesting that itwas highly contaminated with normal brain.
Fig. 2 Germline and somatic alterations in SEGAs. a Position andtype of germline and somatic TSC1/TSC2 pathogenic variants in 19SEGAs. b Examples of Copy Neutral Loss of Heterozygosity (CN-LOH) in two representative SEGAs (SEGA-S9 and S13), encom-passing chr9:134,398,493–141,070,719 (6.7Mb, top) andchr16:304,514–4,942,099 (4.64Mb, bottom) (GRCh37/hg19). SNPallele frequency (AF) distribution is shown across the entire chromo-some with regions of AF skewed from the expected 0.5 (range:
0.4–0.6) in regions surrounding TSC1 (top) or TSC2 (bottom). Eachblue dot depicts a single SNV. c Number and type of small somaticvariants in 21 SEGA tumors. d Somatic mutation frequency per Mb inSEGAs in comparison to a broad range of pediatric and adult braintumors. Each dot in the plot represents a different tumor. Y axis is logscale. e Five of 21 (19%) SEGAs harbor subclonal chromosomal copynumber gain (green) or loss (brown).

To discern genes whose expression was specificallyaltered in SEGAs, and might contribute to SEGA devel-opment, we performed DESeq2 analyses using normalizedread counts (RSEM). Pair wise comparisons were madebetween the SEGAs and each of the histological subtypes ofLGG and GBM in Cluster 3 (www.qlucore.com) to identifygene expression differences (Fig. 3a, b) [29, 34, 35]. Weidentified several hundred genes that were differentiallyexpressed between SEGAs and other tumors at a falsediscovery rate (FDR)/q-value < 0.05 and p-value < 0.002(Fig. 3b, Fig. S3a-f and Tables S5–S9).
Analysis of multiple housekeeping genes (e.g., GAPDH,LDHA, SDHA, and ABCF1) across different tumor samplesanalyzed showed no significant differences in expression,confirming a lack of artifact or bias due to different samplesets, library preparation, and/or sequencing methods(Fig. S4). A set of 190 genes was found to be differentiallyexpressed in SEGAs, all consistently in the same direction(either up or downregulated), in comparison to each of theother sample types (Fig. 3b, Table S10). One hundred fiftyone of these 190 common DEGs were also differentially
expressed in SEGAs in comparison to normal brain (46upregulated, 105 downregulated; FDR < 0.05, |log2foldchange| > 1) (Table S10).
Since many TFs regulate cell lineage and act as driversof cancer growth in different cancer types, we chose tofocus our analysis on TFs with higher expression inSEGAs compared to these other entities. Fourteen of 190DEGs were TFs, of which 8 were upregulated (Table 2and Table S11), including HMX3, HMX2, IRF6, SIX3,EOMES, and VAX1, each with a median fold change > 12(Fig. 3c and Table 2). We also found that the expressionof HMX3, HMX2, SIX3, and VAX1 was much higher inSEGAs than any other TCGA cancer type (2463 tumors of27 different histological types) and normal tissues{~8500 samples from 30 normal tissue types; theGene and Tissue Expression (GTEx) project} (Figs. 4, 5)[36]. IRF6 and EOMES were also highly expressed inSEGAs but were also seen at relatively high levels insome other cancer types and normal tissues (Figs. 4, 5).In addition, SIX3 was relatively highly expressed inpituitary gland (Figs. 4, 5). ZBTB20, another TF, was
Fig. 3 Comparison of RNA-Seq expression of SEGAs to otherbrain tumors and cortical tubers. a A heatmap is shown reflecting ade novo clustering analysis using 3060 most variable genes in thecombined cohort of: SEGAs (n= 16), TCGA LGG (n= 530), TCGAGBM (n= 171), cortical tubers (n= 15), SEN samples (n= 2), andnormal brain samples (n= 11). Pairwise sample by sample Spearmanrank correlation was determined and used to generate the heatmap thatis shown. Fifteen of 16 (96%) SEGAs are in Cluster 3, form the redsquare in the upper left corner of Cluster 3, reflecting a high rankcorrelation among them. Cluster 3 also contains most GBM (n= 163)
and a subset of TCGA LGG (n= 103). b Venn diagram of all DEGs(FDR < 0.05) in SEGAs versus each of five other histological subtypesof brain tumors/cortical tubers. Notably, a set of 190 genes were dif-ferentially expressed in SEGAs compared to each of the other fivesample types. The TFs that are upregulated in SEGAs are shown atright. c Violin dot plots of the top 6 TFs that were differentially andhighly expressed in SEGAs compared to other brain tumors and cor-tical tubers. d GO pathways showing enrichment for the 190 DEGs:top, pathways enriched in genes downregulated in SEGA; bottom,pathways enriched in genes upregulated in SEGA.

highly expressed in SEGAs compared to all brain tumorsand cortical tubers, except for gangliogliomas where itwas also highly expressed. ZBTB20 was also much morehighly expressed in SEGAs than all normal tissues(Figs. S5, S6).
Considering other differentially expressed genes otherthan TFs, HCRTR2 was the most highly expressed gene inSEGAs compared to all tumors and normal tissues(Figs. S5, S6). HCRTR2 is a G-protein coupled receptorthat binds the hypothalamic neuropeptides orexin A and
Table 2 List of the top 44 upregulated DEGs, common to all pairwise comparisons between SEGAs and other brain tumors/cortical tubers, with amedian fold change >= 10 and FDR/q-value < 0.05.
SEGAs to TCGAastrocytomas
SEGAs to TCGAoligodendrogliomas
SEGAs to TCGAglioblastomas
SEGAs togangliogliomas
SEGAs tocortical tubers
Gene ID Fold change Fold change Fold change Fold change Fold change Medianfold change
HCRTR2 253.2 239.6 309.5 154.7 34.9 239.6
SFTA3 168.1 152.6 196.7 203.5 106.3 168.1
TSPAN8 141.8 148.4 324.7 240.7 77.1 148.4
KCNK12 130.3 164.3 195.4 36.0 11.7 130.3
LHCGR 111.7 85.1 102.5 14.7 60.7 85.1
SLN 81.0 125.1 46.2 1082.1 39.3 81.0
HMX3 79.8 70.2 76.5 88.9 17.5 76.5
HMX2 51.1 55.0 58.1 83.5 14.9 55.0
SLC14A2 39.3 35.1 55.2 53.8 86.2 53.8
FRZB 69.6 48.1 41.1 47.0 11.7 47.0
IRF6 37.2 44.8 71.1 50.9 28.2 44.8
SIX3 30.3 18.1 43.0 71.1 75.5 43.0
TMPRSS2 29.3 25.2 41.9 116.8 57.3 41.9
TRIM63 35.4 52.2 32.2 35.8 7.1 35.4
TRDN 35.3 44.5 63.8 11.0 6.9 35.3
GPNMB 35.3 31.2 31.5 77.0 19.9 31.5
LOC148145 14.9 29.7 38.0 66.4 6.0 29.7
HGD 30.3 25.9 11.1 25.2 4.3 25.2
SLC39A2 24.1 30.5 16.7 30.3 11.0 24.1
FOLR1 18.5 13.5 18.1 162.6 56.1 18.5
SFRP1 18.3 18.6 33.9 18.0 8.1 18.3
ITIH1 18.1 18.3 9.0 26.6 10.0 18.1
TDGF1 17.9 30.8 43.6 15.1 7.7 17.9
LRRN4CL 8.9 22.9 7.2 39.5 16.2 16.2
LGR5 16.0 18.3 30.7 9.8 10.3 16.0
EOMES 15.7 13.5 16.1 6.2 46.4 15.7
GSTA1 16.1 18.6 13.9 15.4 8.5 15.4
SFRP4 8.9 11.4 16.6 15.0 31.0 15.0
WISP2 14.8 14.9 19.4 28.8 7.7 14.9
GPRC5A 16.8 11.6 11.7 47.4 14.7 14.7
HKDC1 17.6 11.0 21.5 14.7 10.6 14.7
GALNT5 11.4 14.6 12.6 16.7 61.9 14.6
SYPL2 10.6 15.8 13.7 16.7 8.5 13.7
TNNC1 13.4 14.6 9.3 16.6 8.2 13.4
KCP 13.2 11.7 10.9 15.5 12.9 12.9
ELSPBP1 12.8 10.9 7.6 14.2 13.2 12.8
VAX1 14.3 11.9 33.6 12.7 5.7 12.7
FGFBP2 9.7 12.6 8.4 81.9 31.4 12.6
IP6K3 8.7 12.5 9.6 13.8 16.4 12.5
TMEM200A 13.9 8.8 25.6 12.5 5.1 12.5
TTC39A 11.9 25.7 12.4 10.6 8.2 11.9
GPR1 20.7 11.1 6.3 18.5 8.6 11.1
F10 10.8 15.1 12.8 6.5 10.4 10.8
HORMAD2 10.2 10.9 10.0 5.5 4.3 10.0
Genes highlighted in bold are TFs.

Fig. 4 Box plots for the top six DE (upregulated) TFs in SEGAcompared to TCGA tumors (2463 tumors of 27 different histologictypes), gangliogliomas and cortical tubers. Abbreviations for all
TCGA tumor types at: https://gdc.cancer.gov/resources-tcga-users/tcga-code-tables/tcga-study-abbreviations. Gene expression is shownin RSEM values.
Fig. 5 Box plots for the top six DE (upregulated) TFs in SEGA compared to GTEx human normal tissues (~8500 samples from 30 normaltissue types, v6p release). Gene expression is shown in FPKM values.

orexin B and regulates sleep-wakefulness. Of note, a recentstudy reports that hypothalamic orexin and mTOR activa-tion mediate sleep dysfunction in a mouse model of TSC[37]. GPNMB (Glycoprotein Nmb) was also a top DEGbetween SEGAs and other pathological entities (Table 2and Figs. S5, S6). We had previously demonstrated thatGPNMB was upregulated in Tsc2 null neuroepithelial cells[38]. No gene fusion events in any of 16 SEGAs analyzedby RNA-Seq were identified.
GSEA pathway enrichment analyses
To examine the biological pathways enriched in SEGAs, weperformed Gene Set Enrichment Analysis (GSEA;https://www.gsea-msigdb.org) using all 190 common DEGsfrom above. Ten GO gene sets were enriched for DEGs thatwere downregulated in SEGAs (Fig. 3d; top; Table S12);while 8 were enriched for DEGs that were upregulated inSEGAs (Fig. 3d; bottom). The downregulated gene setswere associated with normal brain development, includingGO_synapse and GO_synaptic signaling, indicating thateven by comparison to these other brain tumors, SEGAhave less neuronal differentiation. In contrast, the upregu-lated gene sets were associated with morphogenesis, cellsurface and WNT protein binding.
Immunohistochemistry confirmation
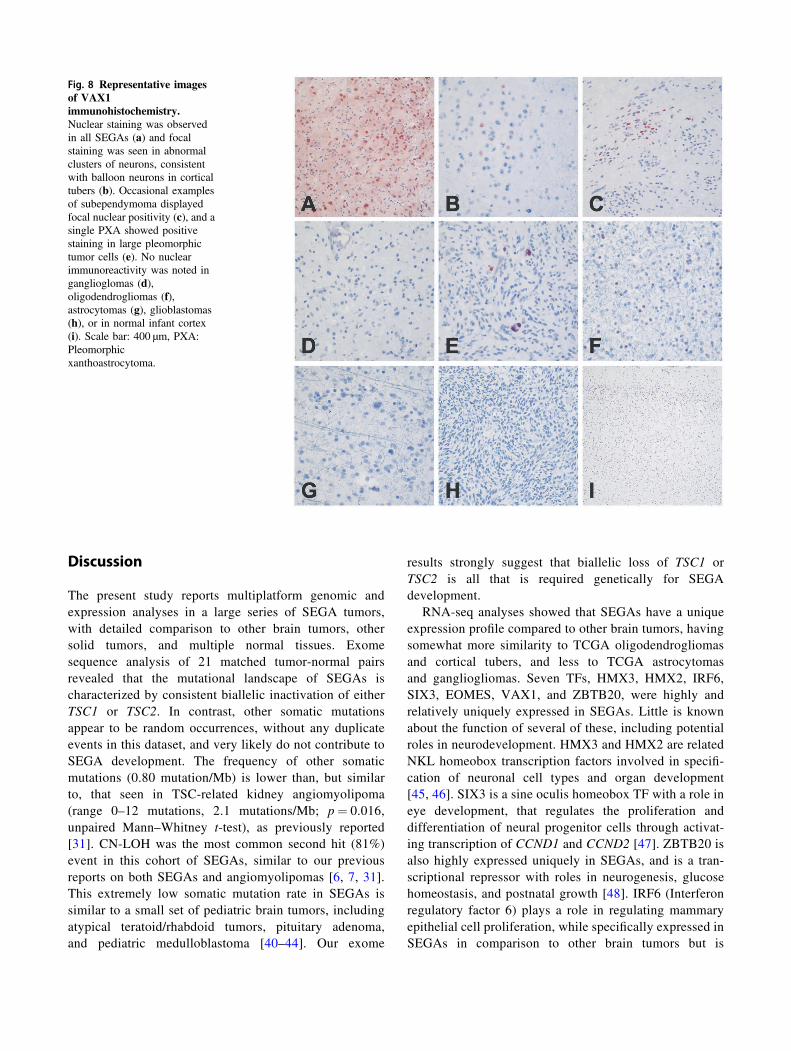
To confirm that the top highly expressed TF in SEGAs,identified by RNA-seq, were also highly expressed at proteinlevel, we performed IHC on SEGAs and multiple otherpediatric and adult gliomas (Figs. 6–8) using commerciallyavailable antibodies. We stained at least 2–5 sections avail-able per tumor type, including SEGA, cortical tuber, adultglioblastoma, pleomorphic xanthoastrocytoma (PXA), diffuseastrocytoma, oligodendroglioma, subependymoma, as well asnormal brain (cortex) (detailed neuropathology evaluation foreach stained marker in Table S13). Positivity was defined asmoderate-to-strong nuclear or cytoplasmic immunoreactivityin at least 5–25% of cells.
IHC was attempted for each of the top six DE TFs,including HMX3, HMX2, IRF6, SIX3, EOMES, and VAX1,as well as ZBTB20. Antibodies for HMX3 and HMX2 failedto give a reliable signal in SEGA or any other tissueexamined. Both IRF6 and SIX3 showed strong cytoplasmicimmunoreactivity in nearly all SEGAs examined (3 of 3, 4of 5, respectively), and no appreciable staining in othertumors types (Figs. 6, 7). IRF6 and SIX3 expression wasalso seen in the balloon cells of cortical tubers (2 of3 samples examined). Both VAX1 and ZBTB20 showedstrong nuclear immunoreactivity in all SEGAs (3 of 3 and 2
Fig. 6 Representative imagesof IRF6immunohistochemistry.Cytoplasmic staining wasobserved only in SEGAs (a) andin the balloon neurons of corticaltubers (b). No cytoplasmicimmunoreactivity was noted insubependymomas (c),ganglioglomas (d), PXAs (e),oligodendrogliomas (f),astrocytomas (g), glioblastomas(h), or in normal infant cortex(i). Scale bar: 400 μm, PXA:Pleomorphicxanthoastrocytoma.
274 K. Giannikou et al.

of 2, respectively). VAX1 was highly specific for SEGAs,with little to no staining in other tumor types/lesions (Fig. 8), while ZBTB20 showed moderate to highnuclear staining in all tumors and normal neurons Fig. S7.IHC for EOMES did not show specificity for SEGAs (datanot shown).
IHC analysis also showed that HCRTR2, the gene withhighest differential expression, showed cytoplasmic immu-noreactivity in SEGAs and was not seen in other braintumors/tubers apart from gangliogliomas (Fig. S7). CTSK(cathepsin K), a known marker for kidney angiomyolipoma,another benign tumor seen in the majority of TSC patients,showed very strong cytoplasmic staining in SEGAs (5 of 5,100%). It was also seen in the balloon cells of corticaltubers (1 of 3, 33%) and in some glioblastoma (1 of 3, 33%)(Fig. S7). GPNMB showed very high expression in SEGAand the balloon cells of cortical tubers but was not seen innormal cortex (Fig. S7).
Unsupervised weighted gene co-expression networkanalysis (WGCNA)
We also performed unsupervised weighted gene co-expression network analysis (WGCNA), based on
pairwise correlations for SEGAs versus TCGA low gradegliomas, glioblastomas, gangliogliomas, and cortical tubersin order to define modules (clusters of co-expressed genes)and intramodular hub genes enriched in SEGAs [39].WGCNA identified 65 modules of correlating co-expressedgenes, that contained 46–1701 genes (median: 102, average:231). We then determined a correlation score for eachmodule to SEGA tumors, and assigned kME scores to eachgene (Tables S14, S15, and Fig. S8). Genes with higher kME
scores are considered “hub” genes that may regulateexpression within that module. Module ME65, with 47genes, had the highest correlation score, 0.84, and showedthe most consistent difference between SEGAs and theother tumors/cortical tubers. Module ME65 contained 21 ofthe 190 (11%) common DEGs, including 4 of the 6 TFsshowing the largest median expression fold-change; HMX3,HMX2, IRF6, and SIX3. These results suggest thatexpression of HMX3, HMX2, IRF6, and SIX3 TFs may beco-regulated in a synergistic manner, and that those genesmay be master TFs for SEGA, and function as transcrip-tional drivers of SEGA development. Overall, the 190DEGs were found in 25 different modules, with moduleM65, M66, and M85 containing the highest number of co-expressed DEGs (21, 31, 39 genes, respectively).
Fig. 7 Representative imagesof SIX3immunohistochemistry. Strongand diffuse cytoplasmic stainingwas predominantly limited toSEGAs (a) and in the balloonneurons of cortical tubers (b);however, occasional examplesof PXA showed positivestaining in large pleomorphictumor cells (e). Glioblastomasexhibited staining in scatteredcells (h). No cytoplasmicimmunoreactivity was noted insubependymomas (c),ganglioglomas (d),oligodendrogliomas (f),astrocytomas (g), or in normalinfant cortex (i). Scale bar: 400μm, PXA: Pleomorphicxanthoastrocytoma.
Discussion
The present study reports multiplatform genomic andexpression analyses in a large series of SEGA tumors,with detailed comparison to other brain tumors, othersolid tumors, and multiple normal tissues. Exomesequence analysis of 21 matched tumor-normal pairsrevealed that the mutational landscape of SEGAs ischaracterized by consistent biallelic inactivation of eitherTSC1 or TSC2. In contrast, other somatic mutationsappear to be random occurrences, without any duplicateevents in this dataset, and very likely do not contribute toSEGA development. The frequency of other somaticmutations (0.80 mutation/Mb) is lower than, but similarto, that seen in TSC-related kidney angiomyolipoma(range 0–12 mutations, 2.1 mutations/Mb; p= 0.016,unpaired Mann–Whitney t-test), as previously reported[31]. CN-LOH was the most common second hit (81%)event in this cohort of SEGAs, similar to our previousreports on both SEGAs and angiomyolipomas [6, 7, 31].This extremely low somatic mutation rate in SEGAs issimilar to a small set of pediatric brain tumors, includingatypical teratoid/rhabdoid tumors, pituitary adenoma,and pediatric medulloblastoma [40–44]. Our exome
results strongly suggest that biallelic loss of TSC1 orTSC2 is all that is required genetically for SEGAdevelopment.
RNA-seq analyses showed that SEGAs have a uniqueexpression profile compared to other brain tumors, havingsomewhat more similarity to TCGA oligodendrogliomasand cortical tubers, and less to TCGA astrocytomasand gangliogliomas. Seven TFs, HMX3, HMX2, IRF6,SIX3, EOMES, VAX1, and ZBTB20, were highly andrelatively uniquely expressed in SEGAs. Little is knownabout the function of several of these, including potentialroles in neurodevelopment. ΗΜΧ3 and HMX2 are relatedNKL homeobox transcription factors involved in specifi-cation of neuronal cell types and organ development[45, 46]. SIX3 is a sine oculis homeobox TF with a role ineye development, that regulates the proliferation anddifferentiation of neural progenitor cells through activat-ing transcription of CCND1 and CCND2 [47]. ZBTB20 isalso highly expressed uniquely in SEGAs, and is a tran-scriptional repressor with roles in neurogenesis, glucosehomeostasis, and postnatal growth [48]. IRF6 (Interferonregulatory factor 6) plays a role in regulating mammaryepithelial cell proliferation, while specifically expressed inSEGAs in comparison to other brain tumors but is
Fig. 8 Representative imagesof VAX1immunohistochemistry.Nuclear staining was observedin all SEGAs (a) and focalstaining was seen in abnormalclusters of neurons, consistentwith balloon neurons in corticaltubers (b). Occasional examplesof subependymoma displayedfocal nuclear positivity (c), and asingle PXA showed positivestaining in large pleomorphictumor cells (e). No nuclearimmunoreactivity was noted inganglioglomas (d),oligodendrogliomas (f),astrocytomas (g), glioblastomas(h), or in normal infant cortex(i). Scale bar: 400 μm, PXA:Pleomorphicxanthoastrocytoma.

expressed in other cancers and normal tissues [49]. Thesetop genes have been reported to be epigenetically regu-lated bearing histone modifications: H3K27 tri-methylation (H3K27me3) mark in brain for HMX2,HMX3, IRF6; H3K4me2 and H3K27me3 in neural pre-cursor cells (NPC) for HMX2, HMX3, and VAX1 [50].
VAX1, SIX3, and IRF6 were all shown to be relativelyhighly and specifically expressed in SEGAs, suggesting thatthey may be useful to distinguish SEGAs from histologicmimics, including other brain tumors. However, our effortsto confirm the high and specific expression of these TFs inSEGAs were hampered by the failure of commerciallyavailable antibodies against HMX2 and HMX3 in IHC, andfailure of attempts at RNA in-situ hybridization for HMX3.
Further studies are warranted to assess the functionalimportance of each of these TFs in SEGA development.Nonetheless, the key TFs HMX2, HMX3, VAX1, SIX3,and IRF6 may be considered as potential targets for thetreatment of SEGAs, independent of, or in combinationwith mTORC1 inhibitors.
In conclusion, SEGAs have an extremely low somaticmutation burden, apart from TSC1/TSC2, similar to otherpediatric brain tumors. Biallelic loss of either TSC1 or TSC2occurs most commonly due to co-occurrence of a germlinesmall mutation and CN-LOH as a second event, fitting theclassic Knudson two hit mechanism. Several TFs, identifiedby RNA-seq analyses, are highly and relatively uniquelyexpressed in SEGAs. We consider that these TFs likelyreflect the unique developmental state of the neuroepithelialcell in which biallelic loss of TSC1/TSC2 gives rise toSEGAs. They may also be transcriptional drivers of SEGAgrowth whose expression is required.
Data availability
Access to data which are not available within the article andSupplementary material, can be provided by the authorsupon request (direct contact to KG or DJK).
Acknowledgements The authors thank all subjects who participated inthis study; the clinicians who referred and evaluated the patients andthe neurosurgeons who performed the surgical resections; as well asKarthik V. Karnik and Edward R. Kwiatkowski for their work oncustomized code for MPS analysis, as well as Yana Stackpole forassistance with Qlucore analysis; Stichting Kinderen Kankervrij;Stichting AMC Foundation; Stichting TSC Fonds (EA, AB).
Funding This work was supported by the Engles Family Fund forResearch in TSC and LAM.
Author contributions KG: conceptualized the study, performedexperiments, analyzed and interpreted high throughput data, wrote andsubmitted the paper for publication. ZZ, JK, KDW, MET, DM, JSP,ZH, LT, HL, GG, and MSL: executed experiments or/and performedhigh throughput analyses: AB, WP, BG, MN, MM, and EA: con-tributed material; SA: selected a subset of the pediatric cases,
evaluated their histology, and provided biospecimens. KK, SJ, MR,EAT, MM, HL, OD, KLL, DWE, MS, and EA: evaluated the patients/biospecimens or/and provided clinical data. DMM: provided biospe-cimens, performed pathology analysis of the tumors and contributed toexperimental design; DJK: conceptualized and supervised the study,reviewed and interpreted data and contribute to paper preparation. Allauthors read and commented on the paper.
Compliance with ethical standards
Conflict of interest The authors declare that they have no conflict ofinterest.
Publisher’s note Springer Nature remains neutral with regard tojurisdictional claims in published maps and institutional affiliations.
References
1. Chan JA, Zhang H, Roberts PS, Jozwiak S, Wieslawa G, Lewin-Kowalik J, et al. Pathogenesis of tuberous sclerosis subependymalgiant cell astrocytomas: biallelic inactivation of TSC1 or TSC2 leadsto mTOR activation. J Neuropathol Exp Neurol. 2004;63:1236–42.
2. Kotulska K, Borkowska J, Roszkowski M, Mandera M, Dasz-kiewicz P, Drabik K, et al. Surgical treatment of subependymalgiant cell astrocytoma in tuberous sclerosis complex patients.Pediatr Neurol. 2014;50:307–12.
3. Henske EP, Jóźwiak S, Kingswood JC, Sampson JR, Thiele EA.Tuberous sclerosis complex. Nat Rev Dis Prim. 2016;2:16035.
4. Salussolia CL, Klonowska K, Kwiatkowski DJ, Sahin M. Geneticetiologies, diagnosis, and treatment of tuberous sclerosis complex.Annu Rev Genomics Hum Genet. 2019;20:217–40.
5. Bongaarts A, Giannikou K, Reinten RJ, Anink JJ, Mills JD, JansenFE, et al. Subependymal giant cell astrocytomas in Tuberoussclerosis complex have consistent TSC1/TSC2 biallelic inactivation,and no BRAF mutations. Oncotarget. 2017;8:95516–29.
6. Martin KR, Zhou W, Bowman MJ, Shih J, Au KS, Dittenhafer-Reed KE, et al. The genomic landscape of tuberous sclerosiscomplex. Nat Commun 2017;8:15816. https://doi.org/10.1038/ncomms15816.
7. Lee D, Cho YH, Kang SY, Yoon N, Sung CO, Suh YL. BRAFV600E mutations are frequent in dysembryoplastic neuroepithelialtumors and subependymal giant cell astrocytomas. J Surg Oncol.2015;111:359–64.
8. Debiec-Rychter M, Jesionek-Kupnicka D, Zakrzewski K, LiberskiPP. Cytogenetic changes in two cases of subependymal giant-cellastrocytoma. Cancer Genet Cytogenet. 1999;109:29–33.
9. Franz DN, Belousova E, Sparagana S, Bebin EM, Frost M,Kuperman R, et al. Everolimus for subependymal giant cellastrocytoma in patients with tuberous sclerosis complex: 2-yearopen-label extension of the randomised EXIST-1 study. LancetOncol. 2014;15:1513–2150.
10. Franz DN, Agricola K, Mays M, Tudor C, Care MM, Holland-Bouley K, et al. Everolimus for subependymal giant cell astro-cytoma: 5-year final analysis. Ann Neurol. 2015;78:929–38.
11. Fogarasi A, De Waele L, Bartalini G, Jozwiak S, Laforgia N,Verhelst H, et al. EFFECTS: an expanded access program ofeverolimus for patients with subependymal giant cell astrocytomaassociated with tuberous sclerosis complex. BMC Neurol.2016;16:126.
12. Tyburczy ME, Kotulska K, Pokarowski P, Mieczkowski J,Kucharska J, Grajkowska W, et al. Novel proteins regulated bymTOR in subependymal giant cell astrocytomas of patients withtuberous sclerosis complex and new therapeutic implications. AmJ Pathol. 2010;176:1878–90.

13. Bongaarts A, van Scheppingen J, Korotkov A, Mijnsbergen C,Anink JJ, Jansen FE, et al. The coding and non-coding tran-scriptional landscape of subependymal giant cell astrocytomas.Brain. 2020;143:131–49.
14. Louis DN, Perry A, Reifenberger G, von Deimling A, Figarella-Branger D, Cavenee WK, et al. The 2016 World Health Organi-zation classification of tumors of the central nervous system: asummary. Acta Neuropathol. 2016;131:803–20.
15. Wen PY, Huse JT. 2016 World Health Organization classificationof central nervous system tumors. Contin (Minneap Minn).2017;23:1531–47.
16. Diamandis P, Aldape K. World Health Organization 2016 clas-sification of central nervous system tumors. Neurol Clin.2018;36:439–47.
17. Northrup H, Krueger DA, International Tuberous SclerosisComplex Consensus Group. Tuberous sclerosis complex diag-nostic criteria update: recommendations of the 2012 InternationalTuberous Sclerosis Complex Consensus Conference. PediatrNeurol. 2013;49:243–54.
18. Kim W, Giannikou K, Dreier JR, Lee S, Tyburczy ME, SilvermanEK, et al. A genome-wide association study implicates NR2F2 inlymphangioleiomyomatosis pathogenesis. Eur Respir J. 2019;53(6):1900329. https://doi.org/10.1183/13993003.00329-2019. pii
19. Gnirke A, Melnikov A, Maguire J, Rogov P, LeProust EM,Brockman W, et al. Solution hybrid selection with ultra-longoligonucleotides for massively parallel targeted sequencing. NatBiotechnol. 2009;27:182–9.
20. Fisher S, Barry A, Abreu J, Minie B, Nolan J, Delorey TM, et al. Ascalable, fully automated process for construction of sequence-readyhuman exome targeted capture libraries. Genome Biol. 2011;12:R1.
21. Carter SL, Cibulskis K, Helman E, McKenna A, Shen H, Zack T,et al. Absolute quantification of somatic DNA alterations inhuman cancer. Nat Biotechnol. 2012;30:413–21.
22. Tyburczy ME, Dies KA, Glass J, Camposano S, Chekaluk Y,Thorner AR, et al. Mosaic and intronic mutations in TSC1/TSC2explain the majority of TSC patients with no mutation identifiedby conventional testing. PLoS Genet. 2015;11:e1005637.
23. Giannikou K, Lasseter KD, Grevelink JM, Tyburczy ME, DiesKA, Zhu Z, et al. Low-level mosaicism in tuberous sclerosiscomplex: prevalence, clinical features, and risk of disease trans-mission. Genet Med. 2019;21:2639–43.
24. Dobin A, Davis CA, Schlesinger F, Drenkow J, Zaleski C, Jha S,et al. STAR: ultrafast universal RNA-seq aligner. Bioinformatics.2013;29:15–21.
25. Cornwell M, Vangala M, Taing L, Hebert Z, Köster J, Li B, et al.VIPER: visualization pipeline for RNA-seq, a snakemake work-flow for efficient and complete RNA-seq analysis. BMC Bioin-forma. 2018;19:135.
26. Trapnell C, Roberts A, Goff L, Pertea G, Kim D, Kelley DR, et al.Differential gene and transcript expression analysis of RNA-seqexperiments with TopHat and Cufflinks. Nat Protoc,2012;7:562–78.
27. Li B, Dewey CN. RSEM: accurate transcript quantification fromRNA-Seq data with or without a reference genome. BMC Bioin-formatics. 2011;12:323. https://doi.org/10.1186/1471-2105-12-323.
28. Qaddoumi I, Orisme W, Wen J, Santiago T, Gupta K, Dalton JD,et al. Genetic alterations in uncommon low-grade neuroepithelialtumors: BRAF, FGFR1, and MYB mutations occur at high fre-quency and align with morphology. Acta Neuropathol.2016;131:833–45.
29. Ceccarelli M, Barthel FP, Malta TM, Sabetot TS, Salama SR,Murray BA, et al. Molecular profiling reveals biologically discretesubsets and pathways of progression in diffuse glioma. Cell2016;164:550–63.
30. Tsurubuchi T, Nakano Y, Hirato J, Yoshida A, Muroi A, Saka-moto N, et al. Subependymal giant cell astrocytoma harboring a
PRRC2B-ALK fusion: a case report. Pediatr Blood Cancer.2019;66:e27995. https://doi.org/10.1002/pbc.27995.
31. Giannikou K, Malinowska IA, Pugh TJ, Yan R, Tseng YY, Oh C,et al. Whole exome sequencing identifies TSC1/TSC2 biallelicloss as the primary and sufficient driver event for renal angio-myolipoma development. PLoS Genet. 2016;12:e1006242. 5.
32. Bailey MH, Tokheim C, Porta-Pardo E, Sengupta S, Bertrand D,Weerasinghe A, et al. Comprehensive characterization of cancerdriver genes and mutations. Cell 2018;174:1034–5.
33. Lawrence MS, Stojanov P, Polak P, Kryukov GV, Cibulskis K,Sivachenko A, et al. Mutational heterogeneity in cancer and thesearch for new cancer-associated genes. Nature 2013;499:214–8.
34. Robertson AG, Kim J, Al-Ahmadie H, Bellmunt J, Guo G,Cherniack AD, et al. Comprehensive molecular characterization ofmuscle-invasive bladder. Cancer Cell. 2017;171:540–56.
35. Love MI, Huber W, Anders S. Moderated estimation of foldchange and dispersion for RNA-seq data with DESeq2. GenomeBiol. 2014;15:550.
36. Lonsdale J, Thomas J, Salvatore M, Phillips R, Lo E, Shad S, et al.The Genotype-Tissue Expression (GTEx) project. Nat Genet.2013;45:580–5.
37. Zhang B, Guo D, Han L, Rensing N, Satoh A, Wong M. Hypo-thalamic orexin and mechanistic target of rapamycin activationmediate sleep dysfunction in a mouse model of Tuberous sclerosiscomplex. Neurobiol Dis 2020;134:104615.
38. Onda H, Crino PB, Zhang H, Murphey RD, Rastelli L, Gould BE,et al. Tsc2 null murine neuroepithelial cells are a model for humantuber giant cells, and show activation of an mTOR pathway. MolCell Neurosci. 2002;21:561–74.
39. Langfelder P, Horvath S. WGCNA: an R package for weightedcorrelation network analysis. BMC Bioinformatics. 2008;9:559.https://doi.org/10.1186/1471-2105-9-559.
40. Bettegowda C, Agrawal N, Jiao Y, Wang Y, Wood LD, Rodri-guez FJ, et al. Exomic sequencing of four rare central nervoussystem tumor types. Oncotarget. 2013;4:572–83.
41. Cancer Genome Atlas Research Network. Comprehensive geno-mic characterization defines human glioblastoma genes and corepathways. Nature. 2008;455:1061–8.
42. Kline CN, Joseph NM, Grenert JP, van Ziffle J, Talevich E,Onodera C, et al. Targeted next-generation sequencing of pediatricneuro-oncology patients improves diagnosis, identifies pathogenicgermline mutations, and directs targeted therapy. Neuro Oncol.2017;19:699–709.
43. Correa DD, Satagopan J, Martin A, Braun E, Kryza-Lacombe M,Cheung K, et al. Genetic variants and cognitive functions inpatients with brain tumors. Neuro Oncol. 2019;21:1297–309.
44. Muskens IS, Zhang C, de Smith AJ, Biegel JA, Walsh KM,Wiemels JL. Germline genetic landscape of pediatric centralnervous system tumors. Neuro Oncol. 2019;21:1376–88.
45. Feng Y, Xu Q. Pivotal role of hmx2 and hmx3 in zebrafish innerear and lateral line development. Dev Biol. 2010;339:507–18.
46. Wang W, Grimmer JF, Van De Water TR, Lufkin T. Hmx2 andHmx3 homeobox genes direct development of the murine innerear and hypothalamus and can be functionally replaced by Dro-sophila Hmx. Dev Cell. 2004;7:439–53.
47. Yu Z, Sun Y, She X, Wang Z, Chen S, Deng Z, et al. SIX3, atumor suppressor, inhibits astrocytoma tumorigenesis by tran-scriptional repression of AURKA/B. J Hematol Oncol.2017;10:115. https://doi.org/10.1186/s13045-017-0483-2.
48. Xie Z, Ma X, Ji W, Zhou G, Lu Y, Xiang Z, et al. Zbtb20 isessential for the specification of CA1 field identity in the devel-oping hippocampus. Proc Natl Acad Sci USA. 2010;10:6510–5.
49. Guo XM, Chen B, Lv JM, Lei Q, Pan YJ, Yang Q. Knockdown ofIRF6 attenuates hydrogen dioxide-induced oxidative stress via inhi-biting mitochondrial dysfunction in HT22 cells. Cell Mol Neurobiol.2016;36:1077–86. https://doi.org/10.1007/s10571-015-0301-8.

50. Kozlenkov A, Li J, Apontes P, Hurd Y, Byne WM, Koonin EV,et al. A unique role for DNA (hydroxy)methylation in epigenetic
regulation of human inhibitory neurons. Sci Adv. 2018;4:eaau6190. https://doi.org/10.1126/sciadv.aau6190. 26.
Affiliations
Krinio Giannikou1,2● Zachary Zhu1
● Jaegil Kim2● Kellen D. Winden3
● Magdalena E. Tyburczy1 ● David Marron4●
Joel S. Parker 4● Zachary Hebert 5
● Anika Bongaarts6 ● Len Taing7● Henry W. Long7
● William V. Pisano8●
Sanda Alexandrescu9● Brianna Godlewski3 ● Mark Nellist10 ● Katarzyna Kotulska11 ● Sergiusz Jozwiak 11
●
Marcin Roszkowski12 ● Marek Mandera 13● Elizabeth A. Thiele14 ● Hart Lidov9 ● Gad Getz2 ● Orrin Devinsky15 ●
Michael S. Lawrence16 ● Keith L. Ligon8● David W. Ellison17
● Mustafa Sahin 3● Eleonora Aronica6,18 ●
David M. Meredith 19● David J. Kwiatkowski1,2
1 Cancer Genetics Laboratory, Division of Pulmonary and CriticalCare Medicine, Brigham and Women’s Hospital and HarvardMedical School, Boston, MA, USA
2 Broad Institute of MIT and Harvard, Cancer Genome Program,Cambridge, MA, USA
3 Department of Neurology, Boston Children’s Hospital, HarvardMedical School, Boston, MA, USA
4 Lineberger Comprehensive Cancer Center, The University ofNorth Carolina at Chapel Hill, Chapel Hill, NC, USA
5 Molecular Biology Core Facility, Dana Farber Cancer Institute,Boston, MA, USA
6 Amsterdam UMC, University of Amsterdam, Department of(Neuro)Pathology, Amsterdam Neuroscience, Amsterdam, theNetherlands
7 Center for Functional Cancer Epigenetics, Department of MedicalOncology, Dana-Farber Cancer Institute and Harvard MedicalSchool, Boston, MA, USA
8 Department of Oncologic Pathology, Dana-Farber CancerInstitute, Boston, MA, USA
9 Department of Pathology, Boston Children’s Hospital, HarvardMedical School, Boston, MA, USA
10 Department of Clinical Genetics, Erasmus Medical Centre,Rotterdam, The Netherlands
11 Department of Child Neurology, Medical University of Warsaw,Warsaw, Poland
12 Department of Neurosurgery, The Children’s Memorial HealthInstitute, Warsaw, Poland
13 Department of Pediatric Neurosurgery, Medical University ofSilesia, Katowice, Poland
14 Department of Neurology, Massachusetts General Hospital,Boston, MA, USA
15 Department of Neurology, New York University School ofMedicine, 223 E 34 Street, New York, NY, USA
16 Broad Institute of MIT and Harvard, Massachusetts GeneralHospital Cancer Center, Department of Pathology, HarvardMedical School, Charlestown, MA, USA
17 Department of Pathology, St. Jude Children’s Research Hospital,Memphis, TN, USA
18 Stichting Epilepsie Instellingen Nederland (SEIN), Zwolle, TheNetherlands
19 Department of Pathology, Brigham and Women’s Hospital,Harvard Medical School, Boston, MA, USA