Subacute Ruminal Acidosis in Dairy Herds: … Ruminal Acidosis in Dairy Herds: ... Dairy Herd...
31
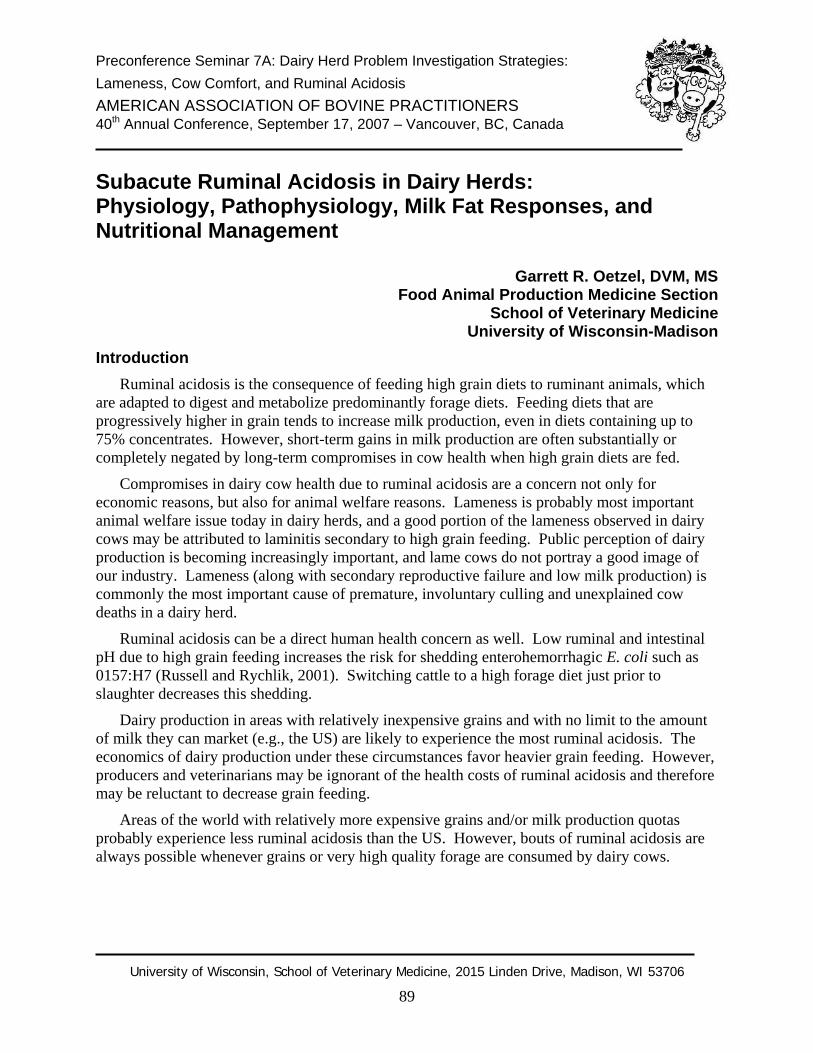
Preconference Seminar 7A: Dairy Herd Problem Investigation Strategies: Lameness, Cow Comfort, and Ruminal Acidosis AMERICAN ASSOCIATION OF BOVINE PRACTITIONERS 40 th Annual Conference, September 17, 2007 – Vancouver, BC, Canada Subacute Ruminal Acidosis in Dairy Herds: Physiology, Pathophysiology, Milk Fat Responses, and Nutritional Management Garrett R. Oetzel, DVM, MS Food Animal Production Medicine Section School of Veterinary Medicine University of Wisconsin-Madison Introduction Ruminal acidosis is the consequence of feeding high grain diets to ruminant animals, which are adapted to digest and metabolize predominantly forage diets. Feeding diets that are progressively higher in grain tends to increase milk production, even in diets containing up to 75% concentrates. However, short-term gains in milk production are often substantially or completely negated by long-term compromises in cow health when high grain diets are fed. Compromises in dairy cow health due to ruminal acidosis are a concern not only for economic reasons, but also for animal welfare reasons. Lameness is probably most important animal welfare issue today in dairy herds, and a good portion of the lameness observed in dairy cows may be attributed to laminitis secondary to high grain feeding. Public perception of dairy production is becoming increasingly important, and lame cows do not portray a good image of our industry. Lameness (along with secondary reproductive failure and low milk production) is commonly the most important cause of premature, involuntary culling and unexplained cow deaths in a dairy herd. Ruminal acidosis can be a direct human health concern as well. Low ruminal and intestinal pH due to high grain feeding increases the risk for shedding enterohemorrhagic E. coli such as 0157:H7 (Russell and Rychlik, 2001). Switching cattle to a high forage diet just prior to slaughter decreases this shedding. Dairy production in areas with relatively inexpensive grains and with no limit to the amount of milk they can market (e.g., the US) are likely to experience the most ruminal acidosis. The economics of dairy production under these circumstances favor heavier grain feeding. However, producers and veterinarians may be ignorant of the health costs of ruminal acidosis and therefore may be reluctant to decrease grain feeding. Areas of the world with relatively more expensive grains and/or milk production quotas probably experience less ruminal acidosis than the US. However, bouts of ruminal acidosis are always possible whenever grains or very high quality forage are consumed by dairy cows. University of Wisconsin, School of Veterinary Medicine, 2015 Linden Drive, Madison, WI 53706 89
Transcript of Subacute Ruminal Acidosis in Dairy Herds: … Ruminal Acidosis in Dairy Herds: ... Dairy Herd...
Preconference Seminar 7A: Dairy Herd Problem Investigation Strategies: Lameness, Cow Comfort, and Ruminal Acidosis AMERICAN ASSOCIATION OF BOVINE PRACTITIONERS 40th Annual Conference, September 17, 2007 – Vancouver, BC, Canada
Subacute Ruminal Acidosis in Dairy Herds: Physiology, Pathophysiology, Milk Fat Responses, and Nutritional Management
Garrett R. Oetzel, DVM, MS Food Animal Production Medicine Section
School of Veterinary Medicine University of Wisconsin-Madison
Introduction Ruminal acidosis is the consequence of feeding high grain diets to ruminant animals, which
are adapted to digest and metabolize predominantly forage diets. Feeding diets that are progressively higher in grain tends to increase milk production, even in diets containing up to 75% concentrates. However, short-term gains in milk production are often substantially or completely negated by long-term compromises in cow health when high grain diets are fed.
Compromises in dairy cow health due to ruminal acidosis are a concern not only for economic reasons, but also for animal welfare reasons. Lameness is probably most important animal welfare issue today in dairy herds, and a good portion of the lameness observed in dairy cows may be attributed to laminitis secondary to high grain feeding. Public perception of dairy production is becoming increasingly important, and lame cows do not portray a good image of our industry. Lameness (along with secondary reproductive failure and low milk production) is commonly the most important cause of premature, involuntary culling and unexplained cow deaths in a dairy herd.
Ruminal acidosis can be a direct human health concern as well. Low ruminal and intestinal pH due to high grain feeding increases the risk for shedding enterohemorrhagic E. coli such as 0157:H7 (Russell and Rychlik, 2001). Switching cattle to a high forage diet just prior to slaughter decreases this shedding.
Dairy production in areas with relatively inexpensive grains and with no limit to the amount of milk they can market (e.g., the US) are likely to experience the most ruminal acidosis. The economics of dairy production under these circumstances favor heavier grain feeding. However, producers and veterinarians may be ignorant of the health costs of ruminal acidosis and therefore may be reluctant to decrease grain feeding.
Areas of the world with relatively more expensive grains and/or milk production quotas probably experience less ruminal acidosis than the US. However, bouts of ruminal acidosis are always possible whenever grains or very high quality forage are consumed by dairy cows.
University of Wisconsin, School of Veterinary Medicine, 2015 Linden Drive, Madison, WI 53706
89
Preconvention Seminar 7A: Dairy Herd Problem Investigation Strategies: Lameness, Cow Comfort, and Ruminal Acidosis
Physiology of Ruminal pH Fermentable carbohydrate intake. Ruminal pH drops below physiological levels when
ruminants consume excessive amounts of rapidly fermentable (non-fiber) carbohydrates. Each cow’s inherent capacity to buffer and absorb acid determines how much her ruminal pH will fall after a meal containing large amounts of fermentable carbohydrates.
Dairy cattle and beef feedlot cattle are at similar risk to develop ruminal acidosis. Although dairy cattle are typically fed diets that are higher in forage and fiber compared to beef feedlot cattle, this is offset by their much higher dry matter intakes. Total consumption of non-fiber carbohydrates is similar between these two classes of livestock (Table 1). Not surprisingly, ruminal pH values measured by continuous data acquisition in feedlot steers and lactating dairy cattle were similar when the cattle consumed similar total amounts of non-fiber carbohydrates. The prevalence of ruminal acidosis in dairy herds is probably about the same as it is in beef feedlots. Table 1. A comparison of diet and ruminal pH in beef feedlot and lactating dairy cow studies.
Item Steer studya Lactating cow studyb
Experimental animals, weights 8 Holstein steers, ~1000 lbs. 8 Holstein cows, ~1400 lbs.
Stage of feeding or lactation Compensatory gain Early lactation
Study design 2 x 2 crossover design 4 x 4 Latin square design
Average daily ruminal pHc 5.99 5.90
Forage in diet, % 26.3 52.9
Daily dry matter intake, lbs 29.1 47.1
Neutral detergent fiber, % 20.0 28.9
Non-fiber carbohydrates,d % 58.3 36.9
Non-fiber carbohydrates, lbs/day 17.0 17.4
a Data adapted from (Prentice et al., 2000). b Data adapted from (Oetzel and Nordlund, 1998). c Ruminal pH was measured once per minute by indwelling ruminal electrode and averaged daily. d Non-fiber carbohydrates (NFC), calculated as 100 – % crude protein - % neutral detergent fiber - %
ether extract - % ash.
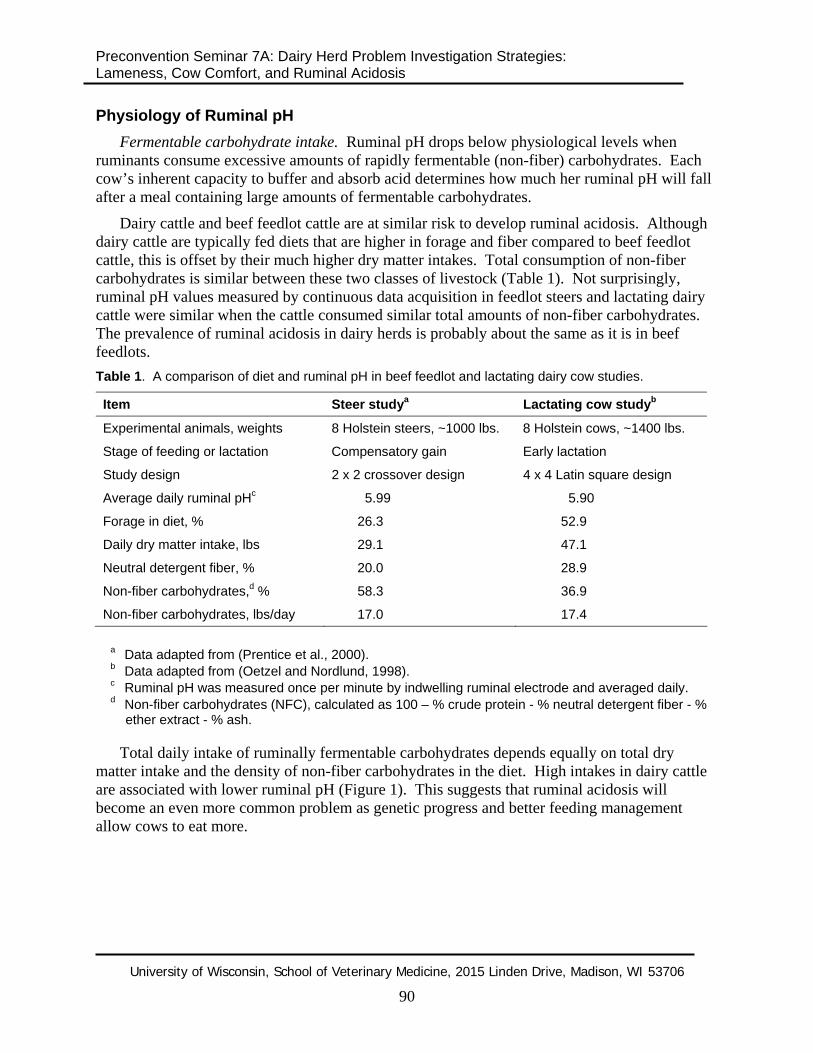
Total daily intake of ruminally fermentable carbohydrates depends equally on total dry matter intake and the density of non-fiber carbohydrates in the diet. High intakes in dairy cattle are associated with lower ruminal pH (Figure 1). This suggests that ruminal acidosis will become an even more common problem as genetic progress and better feeding management allow cows to eat more.
University of Wisconsin, School of Veterinary Medicine, 2015 Linden Drive, Madison, WI 53706
90
Preconvention Seminar 7A: Dairy Herd Problem Investigation Strategies: Lameness, Cow Comfort, and Ruminal Acidosis
5.0
5.5
6.0
6.5
7.0
25 30 35 40 45 50 55 60DM Intake, lb/day
Dai
ly M
ean
Rum
inal
pH
R2 = .29
Figure 1. Effect of dry matter intake on ruminal pH in early lactation Holstein cows. Oetzel, unpublished data, 1997.
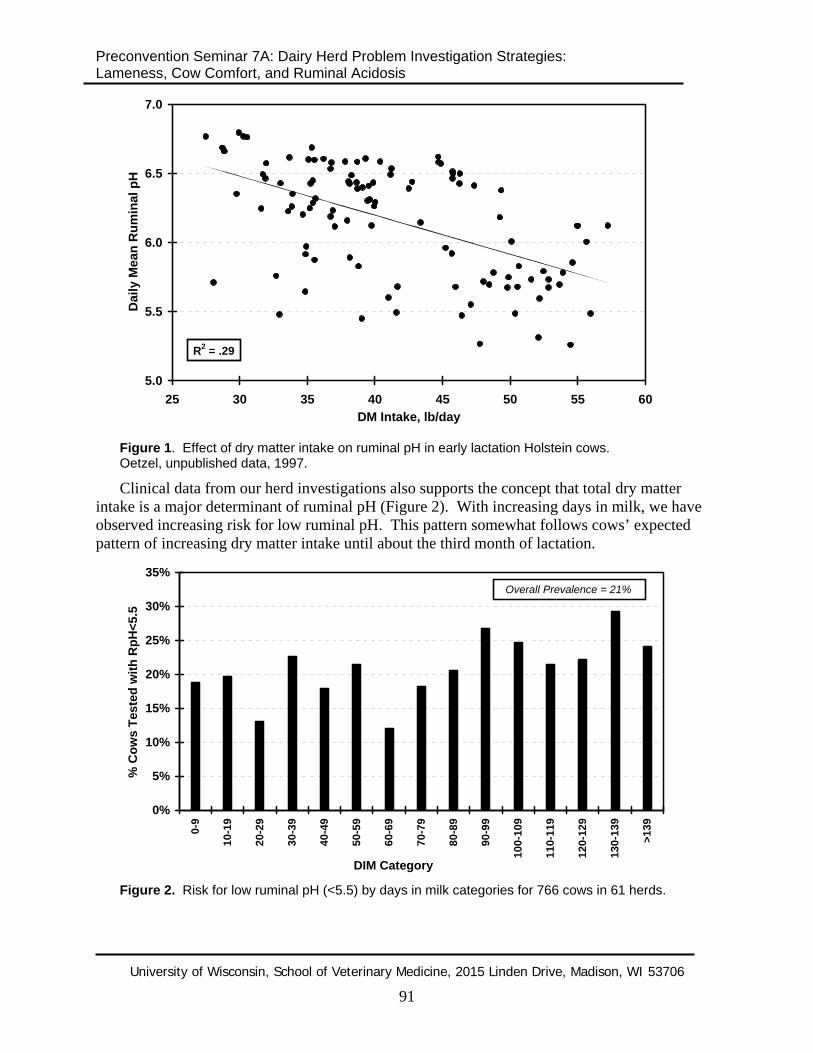
Clinical data from our herd investigations also supports the concept that total dry matter intake is a major determinant of ruminal pH (Figure 2). With increasing days in milk, we have observed increasing risk for low ruminal pH. This pattern somewhat follows cows’ expected pattern of increasing dry matter intake until about the third month of lactation.
0%
5%
10%
15%
20%
25%
30%
35%
0-9
10-1
9
20-2
9
30-3
9
40-4
9
50-5
9
60-6
9
70-7
9
80-8
9
90-9
9
100-
109
110-
119
120-
129
130-
139
>139
DIM Category
% C
ows
Test
ed w
ith R
pH<5
.5
Overall Prevalence = 21%
Figure 2. Risk for low ruminal pH (<5.5) by days in milk categories for 766 cows in 61 herds.
University of Wisconsin, School of Veterinary Medicine, 2015 Linden Drive, Madison, WI 53706
91
Preconvention Seminar 7A: Dairy Herd Problem Investigation Strategies: Lameness, Cow Comfort, and Ruminal Acidosis
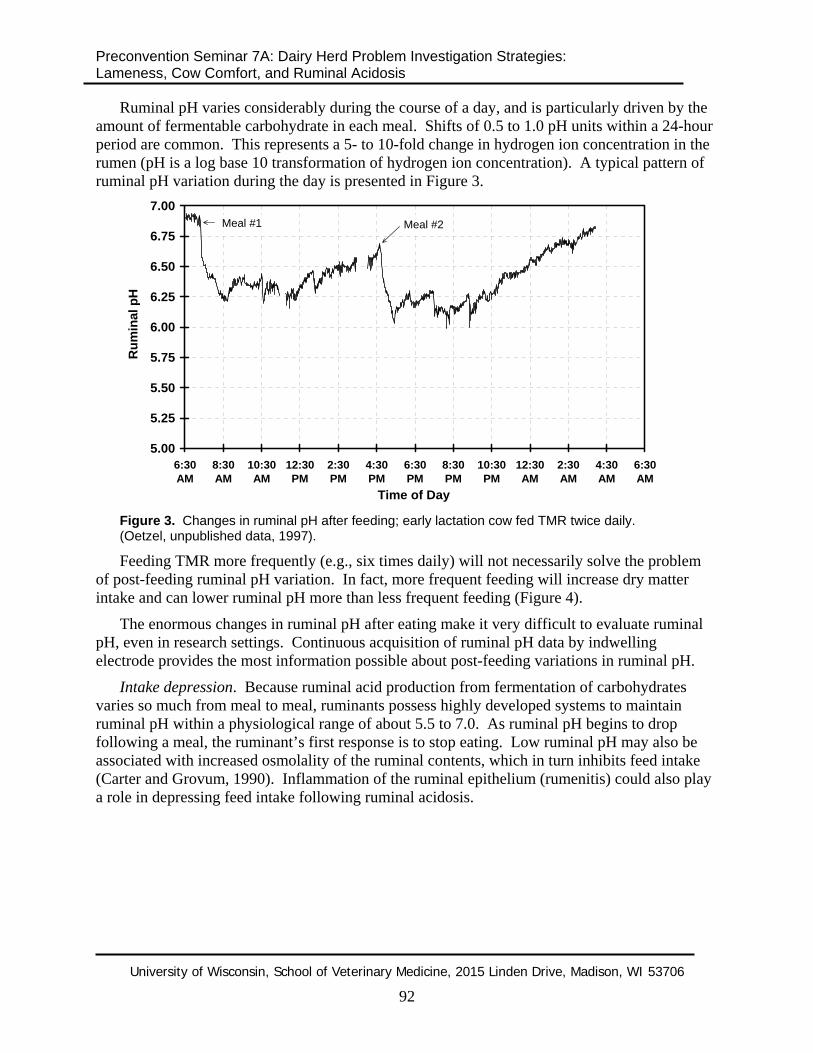
Ruminal pH varies considerably during the course of a day, and is particularly driven by the amount of fermentable carbohydrate in each meal. Shifts of 0.5 to 1.0 pH units within a 24-hour period are common. This represents a 5- to 10-fold change in hydrogen ion concentration in the rumen (pH is a log base 10 transformation of hydrogen ion concentration). A typical pattern of ruminal pH variation during the day is presented in Figure 3.
5.00
5.25
5.50
5.75
6.00
6.25
6.50
6.75
7.00
6:30AM
8:30AM
10:30AM
12:30PM
2:30PM
4:30PM
6:30PM
8:30PM
10:30PM
12:30AM
2:30AM
4:30AM
6:30AM
Time of Day
Rum
inal
pH
Meal #1 Meal #2
Figure 3. Changes in ruminal pH after feeding; early lactation cow fed TMR twice daily. (Oetzel, unpublished data, 1997).
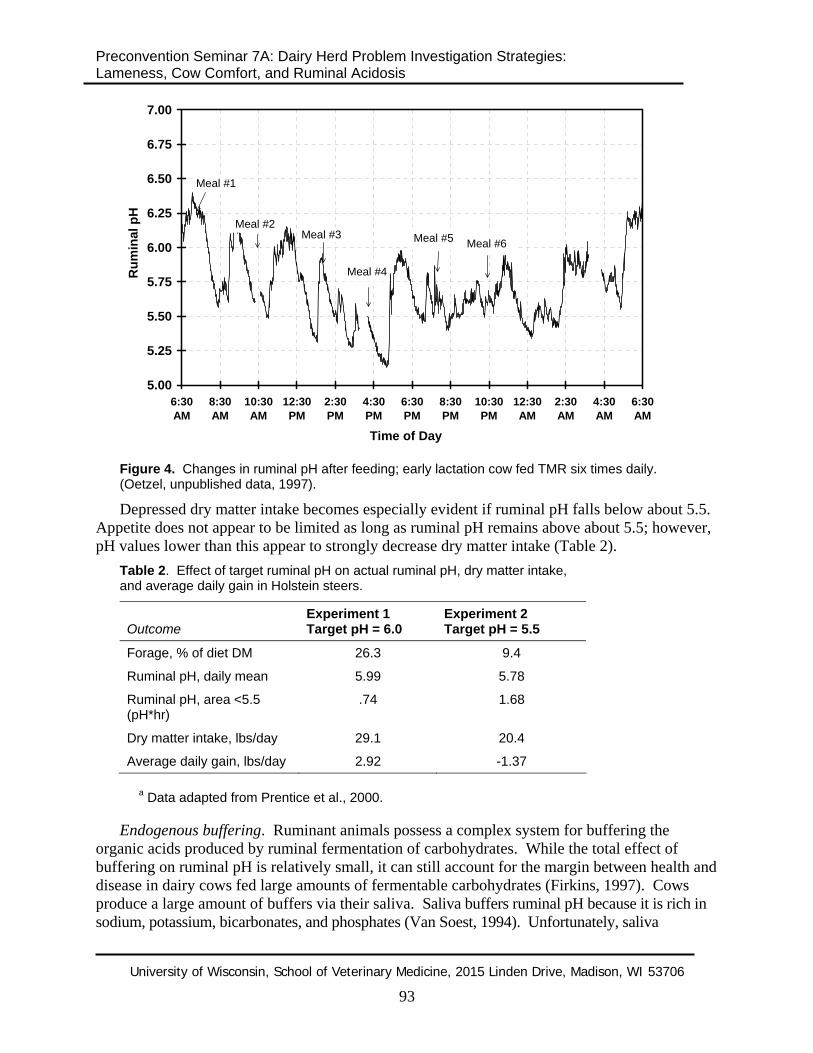
Feeding TMR more frequently (e.g., six times daily) will not necessarily solve the problem of post-feeding ruminal pH variation. In fact, more frequent feeding will increase dry matter intake and can lower ruminal pH more than less frequent feeding (Figure 4).
The enormous changes in ruminal pH after eating make it very difficult to evaluate ruminal pH, even in research settings. Continuous acquisition of ruminal pH data by indwelling electrode provides the most information possible about post-feeding variations in ruminal pH.
Intake depression. Because ruminal acid production from fermentation of carbohydrates varies so much from meal to meal, ruminants possess highly developed systems to maintain ruminal pH within a physiological range of about 5.5 to 7.0. As ruminal pH begins to drop following a meal, the ruminant’s first response is to stop eating. Low ruminal pH may also be associated with increased osmolality of the ruminal contents, which in turn inhibits feed intake (Carter and Grovum, 1990). Inflammation of the ruminal epithelium (rumenitis) could also play a role in depressing feed intake following ruminal acidosis.
University of Wisconsin, School of Veterinary Medicine, 2015 Linden Drive, Madison, WI 53706
92
Preconvention Seminar 7A: Dairy Herd Problem Investigation Strategies: Lameness, Cow Comfort, and Ruminal Acidosis
5.00
5.25
5.50
5.75
6.00
6.25
6.50
6.75
7.00
6:30AM
8:30AM
10:30AM
12:30PM
2:30PM
4:30PM
6:30PM
8:30PM
10:30PM
12:30AM
2:30AM
4:30AM
6:30AM
Time of Day
Rum
inal
pH
Meal #1
Meal #2Meal #3
Meal #4
Meal #5 Meal #6
Figure 4. Changes in ruminal pH after feeding; early lactation cow fed TMR six times daily. (Oetzel, unpublished data, 1997).
Depressed dry matter intake becomes especially evident if ruminal pH falls below about 5.5. Appetite does not appear to be limited as long as ruminal pH remains above about 5.5; however, pH values lower than this appear to strongly decrease dry matter intake (Table 2).
Table 2. Effect of target ruminal pH on actual ruminal pH, dry matter intake, and average daily gain in Holstein steers.
Outcome Experiment 1 Target pH = 6.0
Experiment 2 Target pH = 5.5
Forage, % of diet DM 26.3 9.4
Ruminal pH, daily mean 5.99 5.78
Ruminal pH, area <5.5 (pH*hr)
.74 1.68
Dry matter intake, lbs/day 29.1 20.4
Average daily gain, lbs/day 2.92 -1.37
a Data adapted from Prentice et al., 2000.
Endogenous buffering. Ruminant animals possess a complex system for buffering the organic acids produced by ruminal fermentation of carbohydrates. While the total effect of buffering on ruminal pH is relatively small, it can still account for the margin between health and disease in dairy cows fed large amounts of fermentable carbohydrates (Firkins, 1997). Cows produce a large amount of buffers via their saliva. Saliva buffers ruminal pH because it is rich in sodium, potassium, bicarbonates, and phosphates (Van Soest, 1994). Unfortunately, saliva
University of Wisconsin, School of Veterinary Medicine, 2015 Linden Drive, Madison, WI 53706
93
Preconvention Seminar 7A: Dairy Herd Problem Investigation Strategies: Lameness, Cow Comfort, and Ruminal Acidosis
production is not triggered by declining ruminal pH, but rather is determined almost entirely by the amount of physical fiber present in the diet. Saliva is secreted during chewing activity (eating and rumination) in response to the amount of physical fiber present in the diet.
Acid absorption. The ability of the rumen to rapidly absorb organic acids from the rumen contributes greatly to the stability of ruminal pH. It is rarely difficult for peripheral tissues to utilize VFA already absorbed from the rumen; however, absorption of these VFA from the rumen can be an important bottleneck.
Absorption of VFA from the rumen occurs passively across the ruminal wall. This passive absorption is enhanced by finger-like papillae that project away from the rumen wall. These papillae provide a huge surface area for VFA absorption. Ruminal papillae increase in length when cattle fed higher grain diets; this presumably increases the surface area and absorptive capacity, which protects the animal from acid accumulation in the rumen. If the absorptive capacity of these cells is impaired (e.g., chronic rumenitis with fibrosis), then it becomes much more difficult for the animal to maintain a stable ruminal pH following a meal.
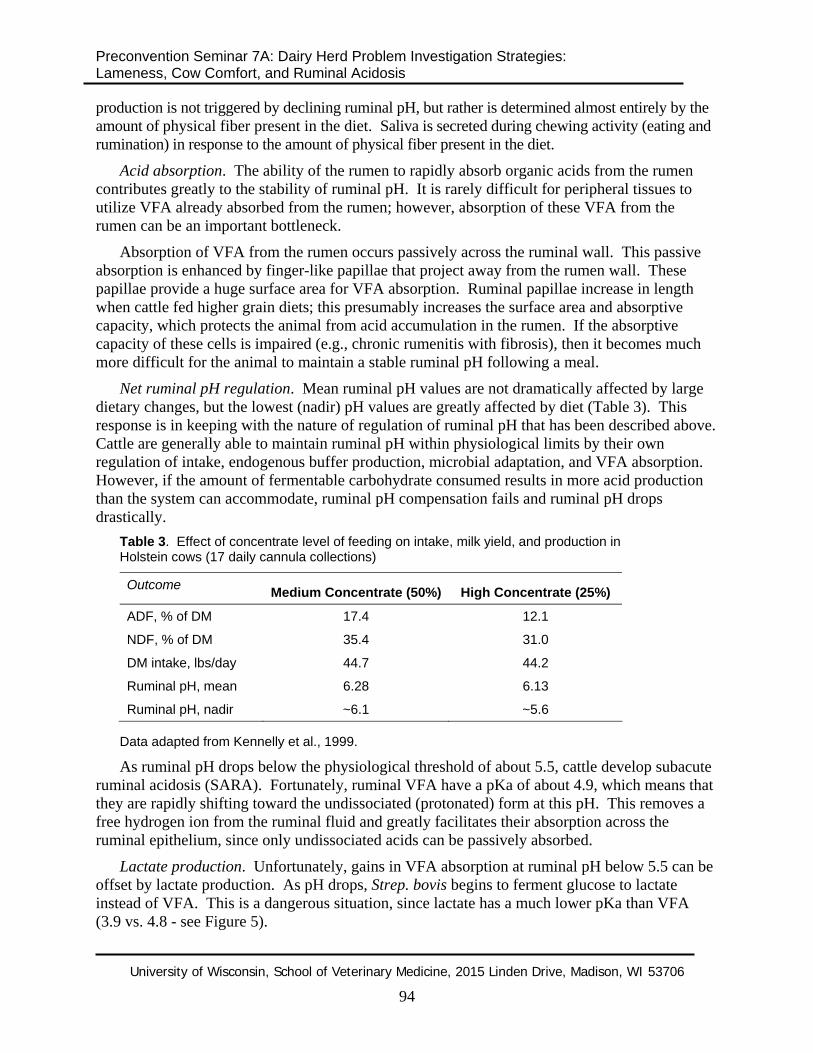
Net ruminal pH regulation. Mean ruminal pH values are not dramatically affected by large dietary changes, but the lowest (nadir) pH values are greatly affected by diet (Table 3). This response is in keeping with the nature of regulation of ruminal pH that has been described above. Cattle are generally able to maintain ruminal pH within physiological limits by their own regulation of intake, endogenous buffer production, microbial adaptation, and VFA absorption. However, if the amount of fermentable carbohydrate consumed results in more acid production than the system can accommodate, ruminal pH compensation fails and ruminal pH drops drastically.
Table 3. Effect of concentrate level of feeding on intake, milk yield, and production in Holstein cows (17 daily cannula collections)
Outcome Medium Concentrate (50%) High Concentrate (25%)
ADF, % of DM 17.4 12.1
NDF, % of DM 35.4 31.0
DM intake, lbs/day 44.7 44.2
Ruminal pH, mean 6.28 6.13
Ruminal pH, nadir ~6.1 ~5.6 Data adapted from Kennelly et al., 1999.
As ruminal pH drops below the physiological threshold of about 5.5, cattle develop subacute ruminal acidosis (SARA). Fortunately, ruminal VFA have a pKa of about 4.9, which means that they are rapidly shifting toward the undissociated (protonated) form at this pH. This removes a free hydrogen ion from the ruminal fluid and greatly facilitates their absorption across the ruminal epithelium, since only undissociated acids can be passively absorbed.
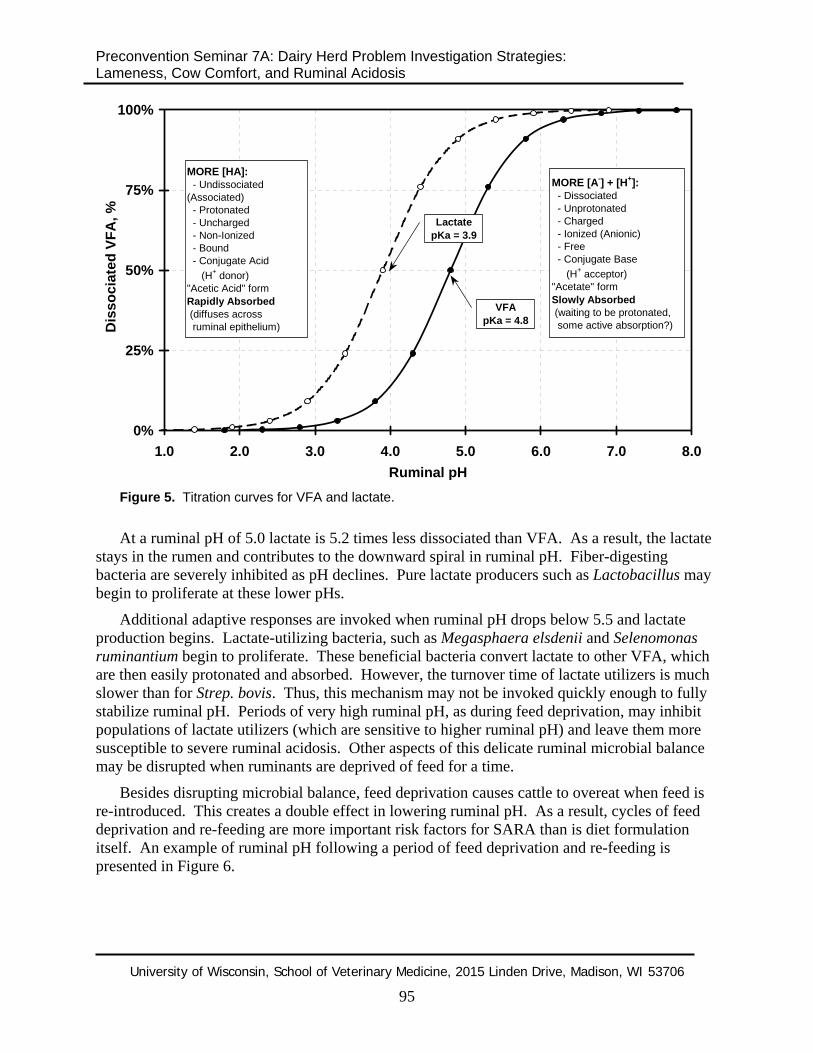
Lactate production. Unfortunately, gains in VFA absorption at ruminal pH below 5.5 can be offset by lactate production. As pH drops, Strep. bovis begins to ferment glucose to lactate instead of VFA. This is a dangerous situation, since lactate has a much lower pKa than VFA (3.9 vs. 4.8 - see Figure 5).
University of Wisconsin, School of Veterinary Medicine, 2015 Linden Drive, Madison, WI 53706
94
Preconvention Seminar 7A: Dairy Herd Problem Investigation Strategies: Lameness, Cow Comfort, and Ruminal Acidosis
g
0%
25%
50%
75%
100%
1.0 2.0 3.0 4.0 5.0 6.0 7.0 8.0Ruminal pH
Dis
soci
ated
VFA
, %
MORE [A-] + [H+]: - Dissociated - Unprotonated - Charged - Ionized (Anionic) - Free - Conjugate Base (H+ acceptor)"Acetate" formSlowly Absorbed (waiting to be protonated, some active absorption?)
MORE [HA]: - Undissociated (Associated) - Protonated - Uncharged - Non-Ionized - Bound - Conjugate Acid (H+ donor)"Acetic Acid" formRapidly Absorbed (diffuses across ruminal epithelium)
LactatepKa = 3.9
VFApKa = 4.8
Figure 5. Titration curves for VFA and lactate.
At a ruminal pH of 5.0 lactate is 5.2 times less dissociated than VFA. As a result, the lactate stays in the rumen and contributes to the downward spiral in ruminal pH. Fiber-digesting bacteria are severely inhibited as pH declines. Pure lactate producers such as Lactobacillus may begin to proliferate at these lower pHs.
Additional adaptive responses are invoked when ruminal pH drops below 5.5 and lactate production begins. Lactate-utilizing bacteria, such as Megasphaera elsdenii and Selenomonas ruminantium begin to proliferate. These beneficial bacteria convert lactate to other VFA, which are then easily protonated and absorbed. However, the turnover time of lactate utilizers is much slower than for Strep. bovis. Thus, this mechanism may not be invoked quickly enough to fully stabilize ruminal pH. Periods of very high ruminal pH, as during feed deprivation, may inhibit populations of lactate utilizers (which are sensitive to higher ruminal pH) and leave them more susceptible to severe ruminal acidosis. Other aspects of this delicate ruminal microbial balance may be disrupted when ruminants are deprived of feed for a time.
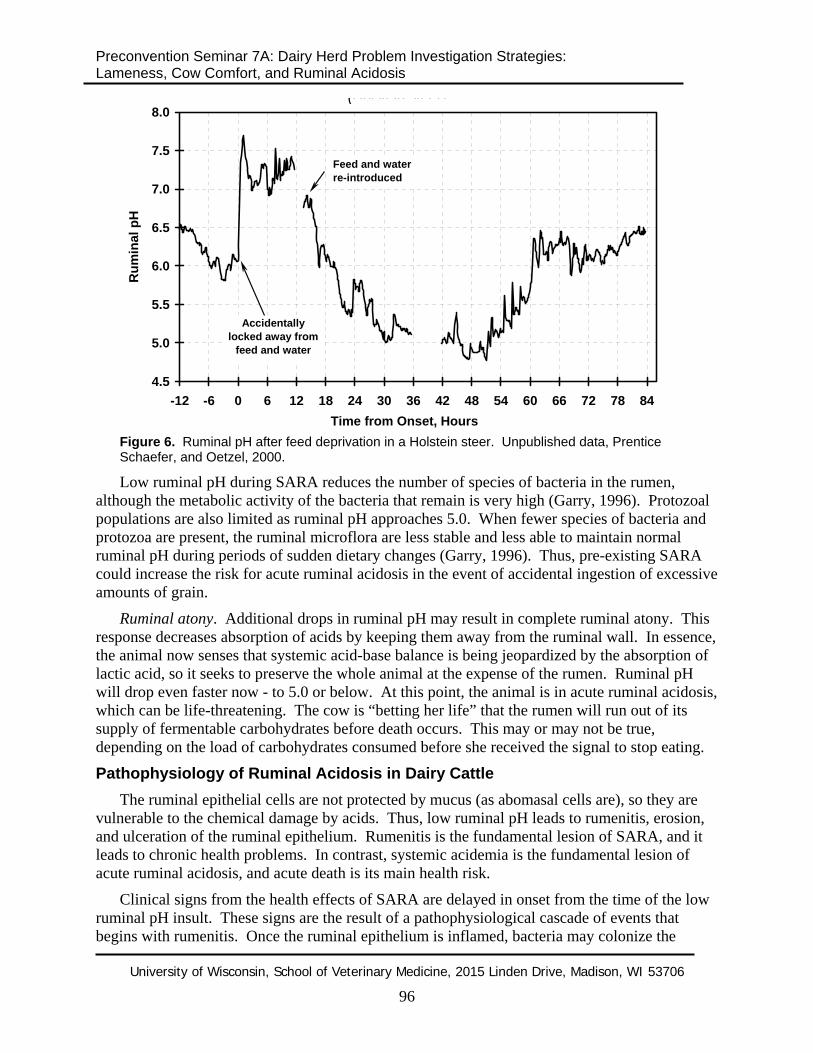
Besides disrupting microbial balance, feed deprivation causes cattle to overeat when feed is re-introduced. This creates a double effect in lowering ruminal pH. As a result, cycles of feed deprivation and re-feeding are more important risk factors for SARA than is diet formulation itself. An example of ruminal pH following a period of feed deprivation and re-feeding is presented in Figure 6.
University of Wisconsin, School of Veterinary Medicine, 2015 Linden Drive, Madison, WI 53706
95
Preconvention Seminar 7A: Dairy Herd Problem Investigation Strategies: Lameness, Cow Comfort, and Ruminal Acidosis
(Holstein steer)
4.5
5.0
5.5
6.0
6.5
7.0
7.5
8.0
-12 -6 0 6 12 18 24 30 36 42 48 54 60 66 72 78 84Time from Onset, Hours
Rum
inal
pH
Accidentally locked away from
feed and water
Feed and water re-introduced
Figure 6. Ruminal pH after feed deprivation in a Holstein steer. Unpublished data, Prentice Schaefer, and Oetzel, 2000.
Low ruminal pH during SARA reduces the number of species of bacteria in the rumen, although the metabolic activity of the bacteria that remain is very high (Garry, 1996). Protozoal populations are also limited as ruminal pH approaches 5.0. When fewer species of bacteria and protozoa are present, the ruminal microflora are less stable and less able to maintain normal ruminal pH during periods of sudden dietary changes (Garry, 1996). Thus, pre-existing SARA could increase the risk for acute ruminal acidosis in the event of accidental ingestion of excessive amounts of grain.
Ruminal atony. Additional drops in ruminal pH may result in complete ruminal atony. This response decreases absorption of acids by keeping them away from the ruminal wall. In essence, the animal now senses that systemic acid-base balance is being jeopardized by the absorption of lactic acid, so it seeks to preserve the whole animal at the expense of the rumen. Ruminal pH will drop even faster now - to 5.0 or below. At this point, the animal is in acute ruminal acidosis, which can be life-threatening. The cow is “betting her life” that the rumen will run out of its supply of fermentable carbohydrates before death occurs. This may or may not be true, depending on the load of carbohydrates consumed before she received the signal to stop eating.
Pathophysiology of Ruminal Acidosis in Dairy Cattle The ruminal epithelial cells are not protected by mucus (as abomasal cells are), so they are
vulnerable to the chemical damage by acids. Thus, low ruminal pH leads to rumenitis, erosion, and ulceration of the ruminal epithelium. Rumenitis is the fundamental lesion of SARA, and it leads to chronic health problems. In contrast, systemic acidemia is the fundamental lesion of acute ruminal acidosis, and acute death is its main health risk.
Clinical signs from the health effects of SARA are delayed in onset from the time of the low ruminal pH insult. These signs are the result of a pathophysiological cascade of events that begins with rumenitis. Once the ruminal epithelium is inflamed, bacteria may colonize the
University of Wisconsin, School of Veterinary Medicine, 2015 Linden Drive, Madison, WI 53706
96

Preconvention Seminar 7A: Dairy Herd Problem Investigation Strategies: Lameness, Cow Comfort, and Ruminal Acidosis
papillae and leak into portal circulation. These bacteria may cause liver abscesses, which sometimes cause peritonitis around the site of the abscess. If the ruminal bacteria clear the liver (or if bacteria from liver infections are released into circulation), they may colonize the lungs, heart valves, kidneys, or joints. The resulting pneumonia, endocarditis, pyelonephritis, and arthritis are all chronic inflammatory diseases that are difficult to diagnose ante-mortem. Post-mortem monitoring of these conditions in cull cows or cows that die on the dairy could be very beneficial, but has not been described.
There are few research reports that directly attribute specific health problems with low ruminal pH. In one study, we were able to document a rise in serum haptoglobins (acute-phase inflammatory proteins) and an increase in the prevalence of ruminal biopsy samples with histological evidence of rumenitis when Holstein steers were fed to a low target ruminal pH (Table 4).
Table 4. Effect of target ruminal pH on serum haptoglobin concentrations and ruminal biopsy results in Holstein steers.
Outcome Experiment 1
Target pH = 6.0 Experiment 2
Target pH = 5.5
Haptoglobin, mg/dl, mean
16.7 25.8
Haptoglobin, % > 20 mg/dl
11.5 22.5
Biopsies, % with rumenitis
37.5 87.5
Data adapted from Prentice et al., 2000.
Caudal vena cava syndrome can cause hemoptysis and peracute deaths due to massive pulmonary hemorrhage in cows that are affected with SARA (Nordlund et al., 1995). In these cases, septic emboli from liver abscesses lead to lung infections which ultimately invade pulmonary vessels and cause their rupture (Radostits et al., 1994; Rebhun, 1995).
SARA may also be associated with laminitis and subsequent hoof overgrowth, sole abscesses, and sole ulcers. These foot problems generally do not appear until weeks or months after the bout of ruminal acidosis that caused them. The mechanism by which SARA increases the risk for laminitis has not been characterized. New information from equine studies suggests that metalloproteinase enzymes produced by Strep. bovis in the hindgut may be the inciting cause for laminitis (Pollitt, 1999). If these enzymes are indeed the culprits in dairy cattle laminitis, then they may be of hindgut origin as well. This hypothesis has not been tested in cattle, but some research data support the general concept that laminitis is the result of abnormal hindgut fermentation of carbohydrates instead of ruminal acidosis per se.
Effect of SARA on Milk Fat Percentage The relationship between SARA and milk fat depression is inconsistent and complex.
Sometimes veterinary practitioners pursue milk fat test depression problems that are in fact not problems at all. It is surprisingly difficult, at times, to determine if a herd really has a low milk fat test or not. Normal milk fat percentage depends greatly on breed, season, and days in milk.
University of Wisconsin, School of Veterinary Medicine, 2015 Linden Drive, Madison, WI 53706
97
Preconvention Seminar 7A: Dairy Herd Problem Investigation Strategies: Lameness, Cow Comfort, and Ruminal Acidosis
Nutritional causes of milk fat depression (which may include SARA) only become a concern when these three major factors have already been taken into account.
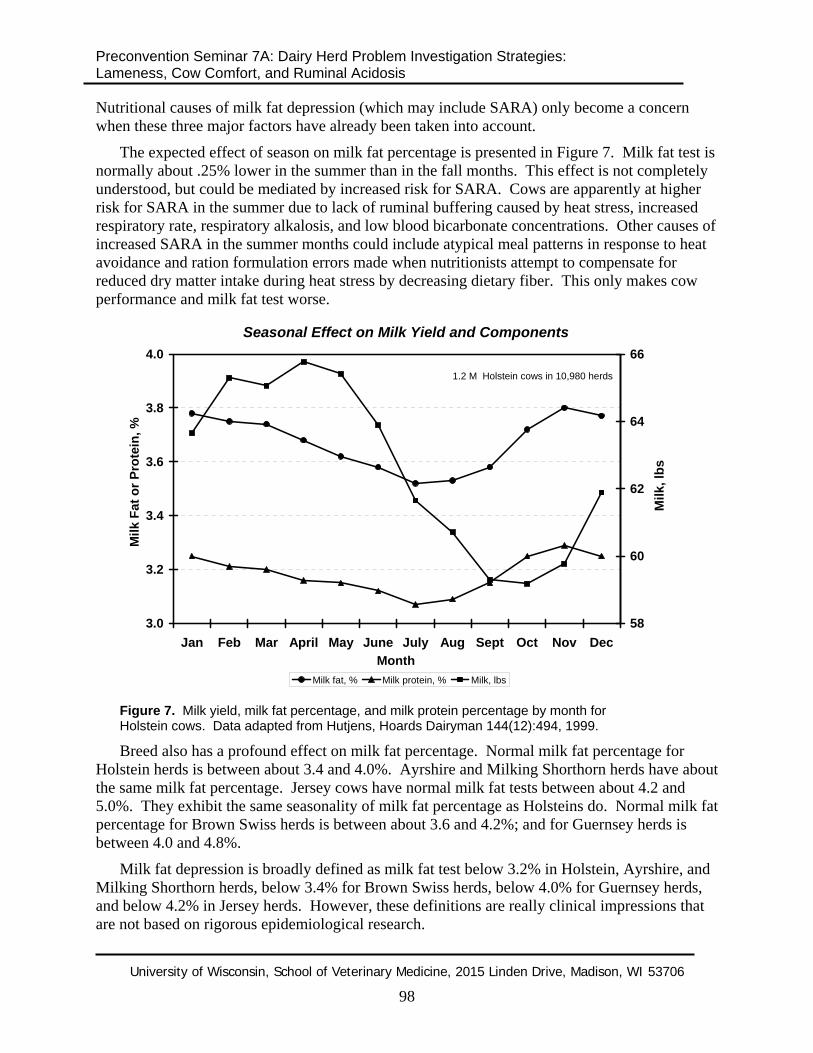
The expected effect of season on milk fat percentage is presented in Figure 7. Milk fat test is normally about .25% lower in the summer than in the fall months. This effect is not completely understood, but could be mediated by increased risk for SARA. Cows are apparently at higher risk for SARA in the summer due to lack of ruminal buffering caused by heat stress, increased respiratory rate, respiratory alkalosis, and low blood bicarbonate concentrations. Other causes of increased SARA in the summer months could include atypical meal patterns in response to heat avoidance and ration formulation errors made when nutritionists attempt to compensate for reduced dry matter intake during heat stress by decreasing dietary fiber. This only makes cow performance and milk fat test worse.
Seasonal Effect on Milk Yield and Components
3.0
3.2
3.4
3.6
3.8
4.0
Jan Feb Mar April May June July Aug Sept Oct Nov DecMonth
Milk
Fat
or P
rote
in, %
58
60
62
64
66
Milk
, lbs
Milk fat, % Milk protein, % Milk, lbs
1.2 M Holstein cows in 10,980 herds
Figure 7. Milk yield, milk fat percentage, and milk protein percentage by month for Holstein cows. Data adapted from Hutjens, Hoards Dairyman 144(12):494, 1999.
Breed also has a profound effect on milk fat percentage. Normal milk fat percentage for Holstein herds is between about 3.4 and 4.0%. Ayrshire and Milking Shorthorn herds have about the same milk fat percentage. Jersey cows have normal milk fat tests between about 4.2 and 5.0%. They exhibit the same seasonality of milk fat percentage as Holsteins do. Normal milk fat percentage for Brown Swiss herds is between about 3.6 and 4.2%; and for Guernsey herds is between 4.0 and 4.8%.
Milk fat depression is broadly defined as milk fat test below 3.2% in Holstein, Ayrshire, and Milking Shorthorn herds, below 3.4% for Brown Swiss herds, below 4.0% for Guernsey herds, and below 4.2% in Jersey herds. However, these definitions are really clinical impressions that are not based on rigorous epidemiological research.
University of Wisconsin, School of Veterinary Medicine, 2015 Linden Drive, Madison, WI 53706
98
Preconvention Seminar 7A: Dairy Herd Problem Investigation Strategies: Lameness, Cow Comfort, and Ruminal Acidosis
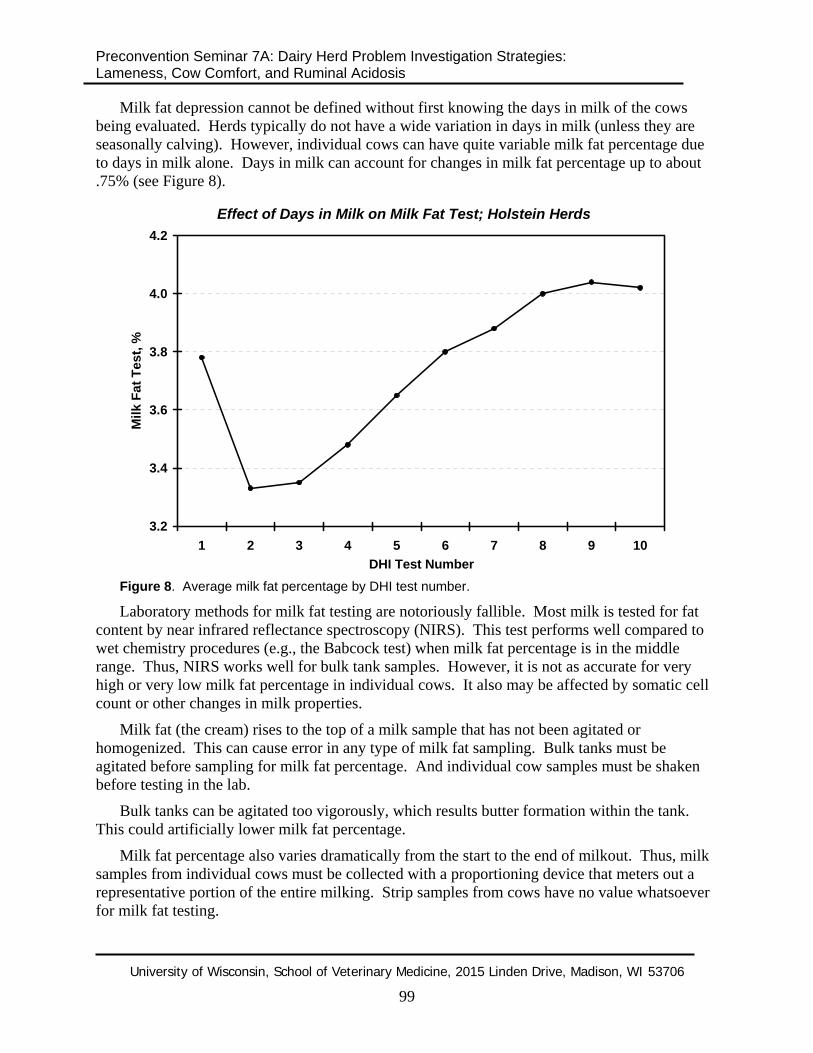
Milk fat depression cannot be defined without first knowing the days in milk of the cows being evaluated. Herds typically do not have a wide variation in days in milk (unless they are seasonally calving). However, individual cows can have quite variable milk fat percentage due to days in milk alone. Days in milk can account for changes in milk fat percentage up to about .75% (see Figure 8).
Effect of Days in Milk on Milk Fat Test; Holstein Herds
3.2
3.4
3.6
3.8
4.0
4.2
1 2 3 4 5 6 7 8 9 10DHI Test Number
Milk
Fat
Tes
t, %
Figure 8. Average milk fat percentage by DHI test number.
Laboratory methods for milk fat testing are notoriously fallible. Most milk is tested for fat content by near infrared reflectance spectroscopy (NIRS). This test performs well compared to wet chemistry procedures (e.g., the Babcock test) when milk fat percentage is in the middle range. Thus, NIRS works well for bulk tank samples. However, it is not as accurate for very high or very low milk fat percentage in individual cows. It also may be affected by somatic cell count or other changes in milk properties.
Milk fat (the cream) rises to the top of a milk sample that has not been agitated or homogenized. This can cause error in any type of milk fat sampling. Bulk tanks must be agitated before sampling for milk fat percentage. And individual cow samples must be shaken before testing in the lab.
Bulk tanks can be agitated too vigorously, which results butter formation within the tank. This could artificially lower milk fat percentage.
Milk fat percentage also varies dramatically from the start to the end of milkout. Thus, milk samples from individual cows must be collected with a proportioning device that meters out a representative portion of the entire milking. Strip samples from cows have no value whatsoever for milk fat testing.
University of Wisconsin, School of Veterinary Medicine, 2015 Linden Drive, Madison, WI 53706
99
Preconvention Seminar 7A: Dairy Herd Problem Investigation Strategies: Lameness, Cow Comfort, and Ruminal Acidosis
DHI milk fat tests for the entire herd are determined by testing the milk fat percentage and milk volume from each cow. This is usually done for just one daily milking, and only once a month. The milk fat test for the herd is then calculated by a weighted average of the milk fat and milk volume contribution from each cow. Milk fat percentages are adjusted for AM or PM milkings, since the AM milking typically has higher volume and lower milk fat percentage. However, these corrections are estimates only, and become even less accurate when cows are milked more than twice daily. DHI milk fat test results are useful for looking at trends by days in milk and for variation in milk fat test. But they are not a particularly accurate measure of whole herd milk fat percentage. The milk fat test from the bulk tank is a much more accurate indication of whole herd milk fat percentage. Bulk tank milk fat percentages are also available on a daily or every other day basis. In contrast, DHI milk fat percentages usually represent only one milking per month.
Milk fat tests are typically interpreted as group or herd means. This is generally appropriate and is certainly convenient. However, group means may obscure outlier cows with very high or very low fat tests. And cyclic milk fat depression could be completely missed if individual cows within a group have milk fat depression at different and offsetting times. Thus, it can be helpful to interpret milk fat percentages as a proportion of cows with very high or very low test results. Very low milk fat tests (<2.5% for Holsteins) should not be present in more than about 10% of the cows tested on any single DHI test. The cows below 2.5% should typically only be cows between about 30 and 70 days in milk.
Milk fat : milk protein ratios are commonly used to evaluate milk fat depression. The often-accepted belief is that inversions of the milk fat: protein ratio (i.e., milk protein percentage > milk fat percentage) is a better reflection of milk fat depression than the milk fat percentage alone. This concept is not supported by science. Milk fat synthesis and milk protein synthesis are separate physiologic processes. Interpreting one only in light of the other most likely introduces even more error into the diagnosis of milk fat depression. It is interesting to note that the interpretation of milk fat: protein ratios did not appear to change after the basis for milk protein reporting was changed from crude protein to true protein in early 2000 in the US. I do not recommend attempting to interpret milk fat: protein ratios when investigating milk fat depression problems.
Milk fat to milk protein ratios may have value in supporting a diagnosis of subclinical ketosis in early lactation cows (as previously discussed in the ketosis proceedings paper). This is true because subclinical ketosis causes both an increase in milk fat percentage and a decrease in milk protein percentage. However, keep in mind that this is a completely different clinical issue than diagnosing milk fat depression.
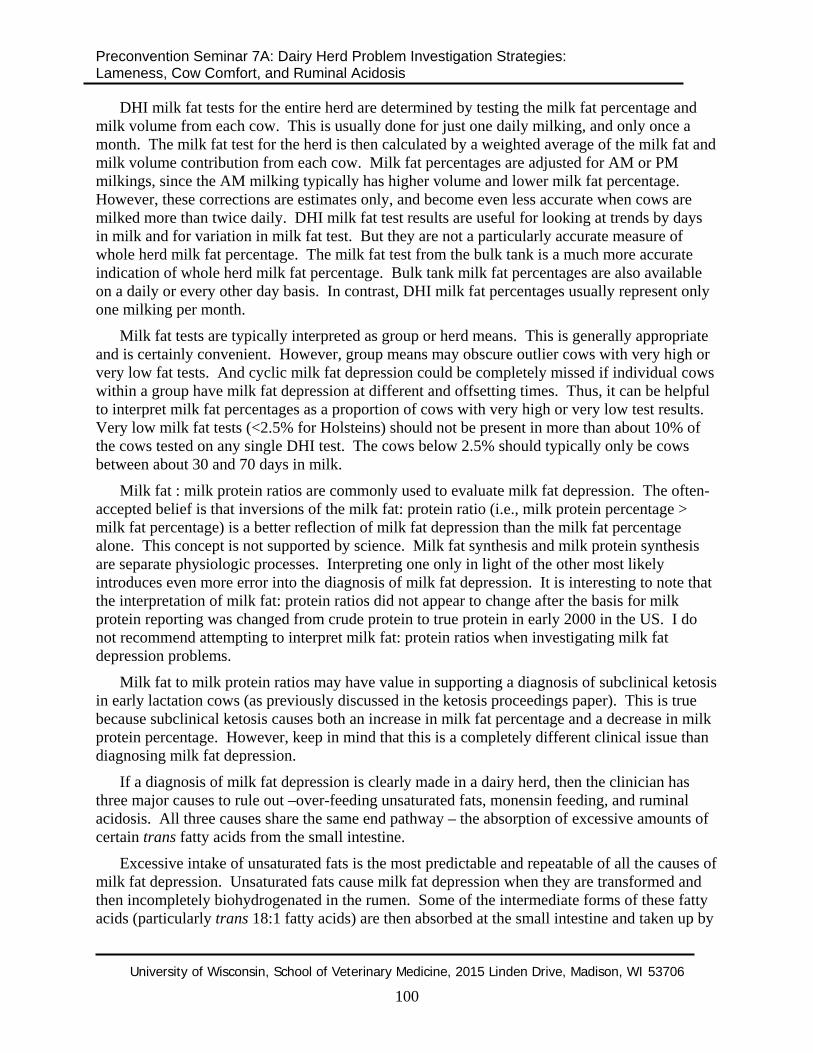
If a diagnosis of milk fat depression is clearly made in a dairy herd, then the clinician has three major causes to rule out –over-feeding unsaturated fats, monensin feeding, and ruminal acidosis. All three causes share the same end pathway – the absorption of excessive amounts of certain trans fatty acids from the small intestine.
Excessive intake of unsaturated fats is the most predictable and repeatable of all the causes of milk fat depression. Unsaturated fats cause milk fat depression when they are transformed and then incompletely biohydrogenated in the rumen. Some of the intermediate forms of these fatty acids (particularly trans 18:1 fatty acids) are then absorbed at the small intestine and taken up by
University of Wisconsin, School of Veterinary Medicine, 2015 Linden Drive, Madison, WI 53706
100
Preconvention Seminar 7A: Dairy Herd Problem Investigation Strategies: Lameness, Cow Comfort, and Ruminal Acidosis
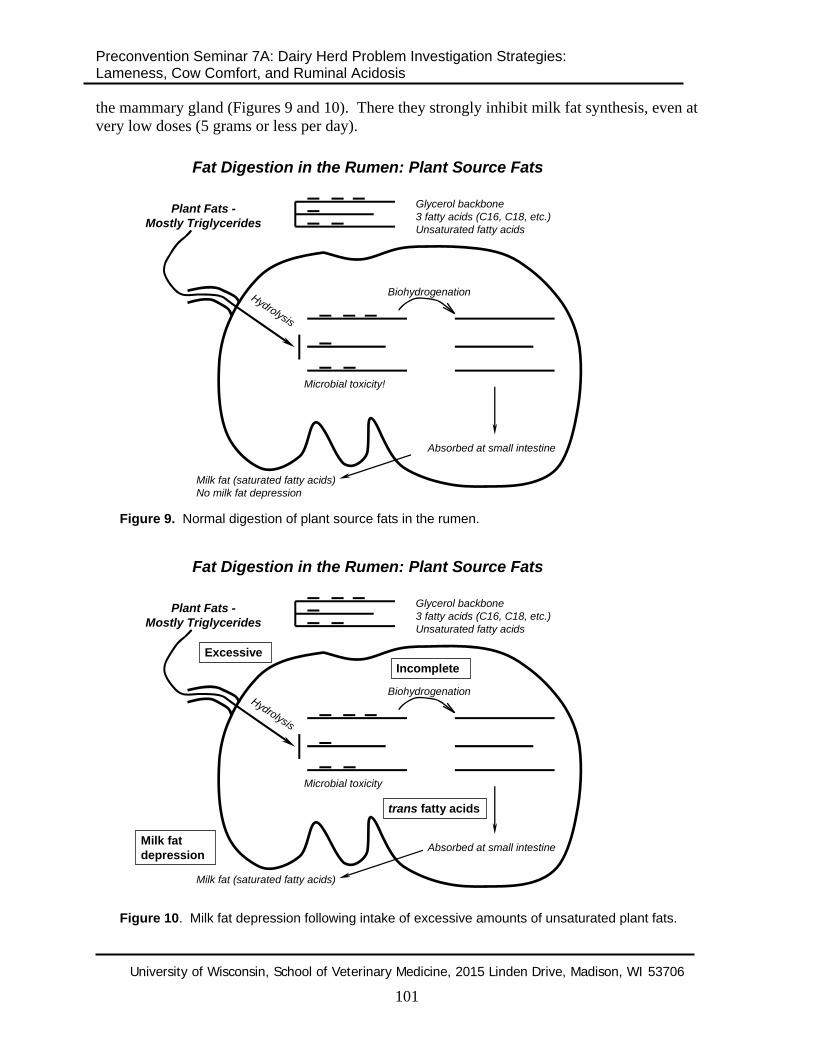
the mammary gland (Figures 9 and 10). There they strongly inhibit milk fat synthesis, even at very low doses (5 grams or less per day).
Fat Digestion in the Rumen: Plant Source Fats
Plant Fats -Mostly Triglycerides
Glycerol backbone3 fatty acids (C16, C18, etc.)Unsaturated fatty acids
Hydrolysis
Biohydrogenation
Absorbed at small intestine
Milk fat (saturated fatty acids)No milk fat depression
Microbial toxicity!
Figure 9. Normal digestion of plant source fats in the rumen.
Fat Digestion in the Rumen: Plant Source Fats
Plant Fats -Mostly Triglycerides
Glycerol backbone3 fatty acids (C16, C18, etc.)Unsaturated fatty acids
Hydrolysis
Biohydrogenation
Absorbed at small intestine
Milk fat (saturated fatty acids)
Microbial toxicity
ExcessiveIncomplete
trans fatty acids
Milk fat depression
Figure 10. Milk fat depression following intake of excessive amounts of unsaturated plant fats.
University of Wisconsin, School of Veterinary Medicine, 2015 Linden Drive, Madison, WI 53706
101
Preconvention Seminar 7A: Dairy Herd Problem Investigation Strategies: Lameness, Cow Comfort, and Ruminal Acidosis
The degree of escape of trans fatty acids from the rumen depends largely on the amounts of their unsaturated fat precursors (18:2 and 18:3 fatty acids) are present in the diet. High rates of passage also contribute to more escape of these fatty acids to the rumen. These fatty acids do not have detrimental health effects themselves; thus, it is possible for a herd to have milk fat depression without cow health problems.
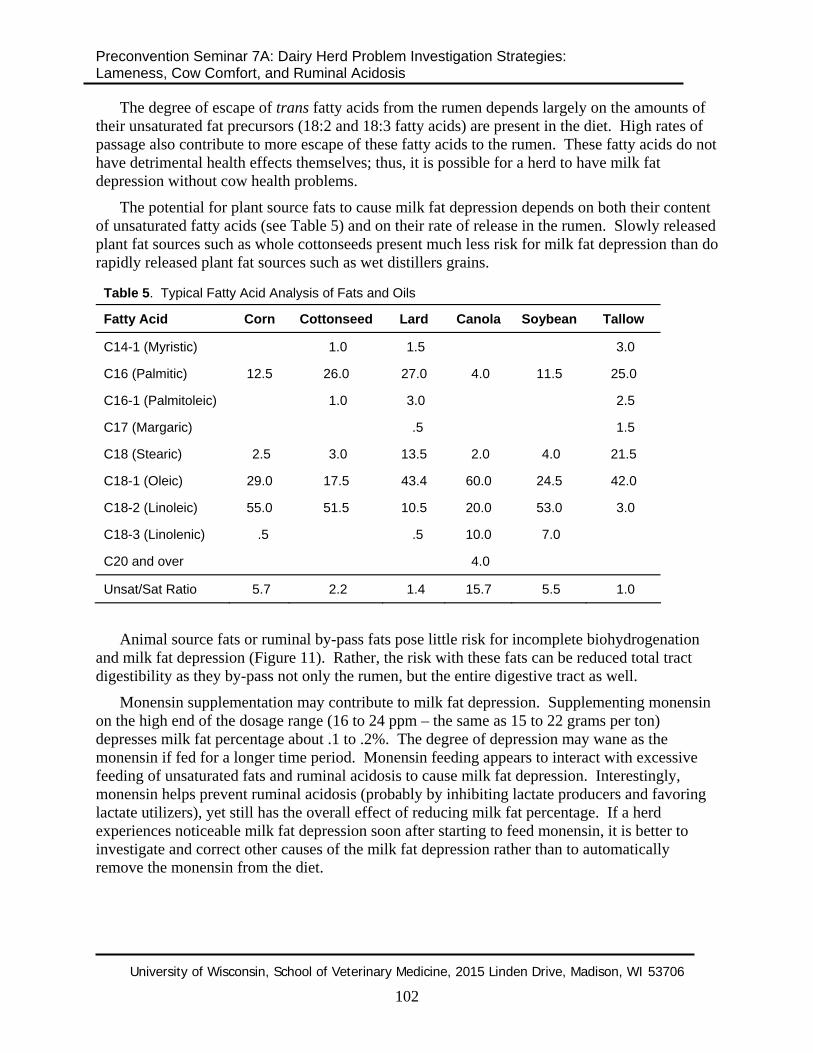
The potential for plant source fats to cause milk fat depression depends on both their content of unsaturated fatty acids (see Table 5) and on their rate of release in the rumen. Slowly released plant fat sources such as whole cottonseeds present much less risk for milk fat depression than do rapidly released plant fat sources such as wet distillers grains.
Table 5. Typical Fatty Acid Analysis of Fats and Oils
Fatty Acid Corn Cottonseed Lard Canola Soybean Tallow
C14-1 (Myristic) 1.0 1.5 3.0
C16 (Palmitic) 12.5 26.0 27.0 4.0 11.5 25.0
C16-1 (Palmitoleic) 1.0 3.0 2.5
C17 (Margaric) .5 1.5
C18 (Stearic) 2.5 3.0 13.5 2.0 4.0 21.5
C18-1 (Oleic) 29.0 17.5 43.4 60.0 24.5 42.0
C18-2 (Linoleic) 55.0 51.5 10.5 20.0 53.0 3.0
C18-3 (Linolenic) .5 .5 10.0 7.0
C20 and over 4.0
Unsat/Sat Ratio 5.7 2.2 1.4 15.7 5.5 1.0
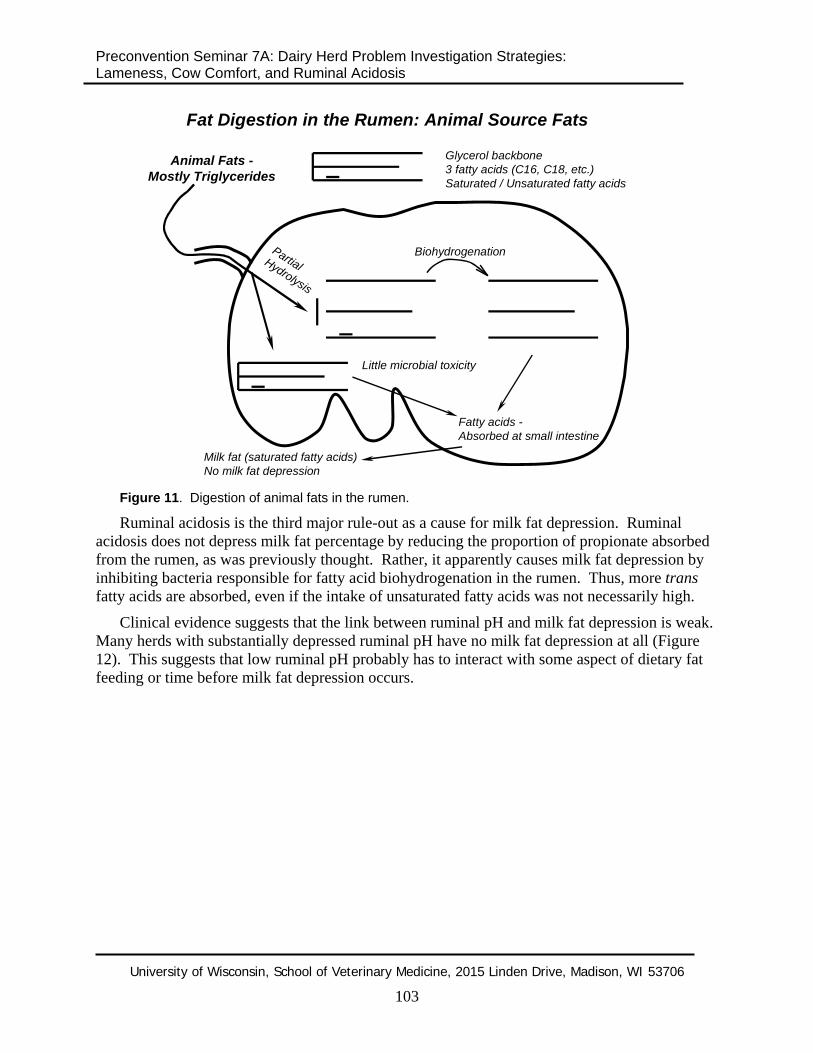
Animal source fats or ruminal by-pass fats pose little risk for incomplete biohydrogenation and milk fat depression (Figure 11). Rather, the risk with these fats can be reduced total tract digestibility as they by-pass not only the rumen, but the entire digestive tract as well.
Monensin supplementation may contribute to milk fat depression. Supplementing monensin on the high end of the dosage range (16 to 24 ppm – the same as 15 to 22 grams per ton) depresses milk fat percentage about .1 to .2%. The degree of depression may wane as the monensin if fed for a longer time period. Monensin feeding appears to interact with excessive feeding of unsaturated fats and ruminal acidosis to cause milk fat depression. Interestingly, monensin helps prevent ruminal acidosis (probably by inhibiting lactate producers and favoring lactate utilizers), yet still has the overall effect of reducing milk fat percentage. If a herd experiences noticeable milk fat depression soon after starting to feed monensin, it is better to investigate and correct other causes of the milk fat depression rather than to automatically remove the monensin from the diet.
University of Wisconsin, School of Veterinary Medicine, 2015 Linden Drive, Madison, WI 53706
102
Preconvention Seminar 7A: Dairy Herd Problem Investigation Strategies: Lameness, Cow Comfort, and Ruminal Acidosis
Fat Digestion in the Rumen: Animal Source Fats
Animal Fats -Mostly Triglycerides
Glycerol backbone3 fatty acids (C16, C18, etc.)Saturated / Unsaturated fatty acids
Little microbial toxicity
BiohydrogenationPartialHydrolysis
Milk fat (saturated fatty acids)No milk fat depression
Fatty acids -Absorbed at small intestine
Figure 11. Digestion of animal fats in the rumen.
Ruminal acidosis is the third major rule-out as a cause for milk fat depression. Ruminal acidosis does not depress milk fat percentage by reducing the proportion of propionate absorbed from the rumen, as was previously thought. Rather, it apparently causes milk fat depression by inhibiting bacteria responsible for fatty acid biohydrogenation in the rumen. Thus, more trans fatty acids are absorbed, even if the intake of unsaturated fatty acids was not necessarily high.
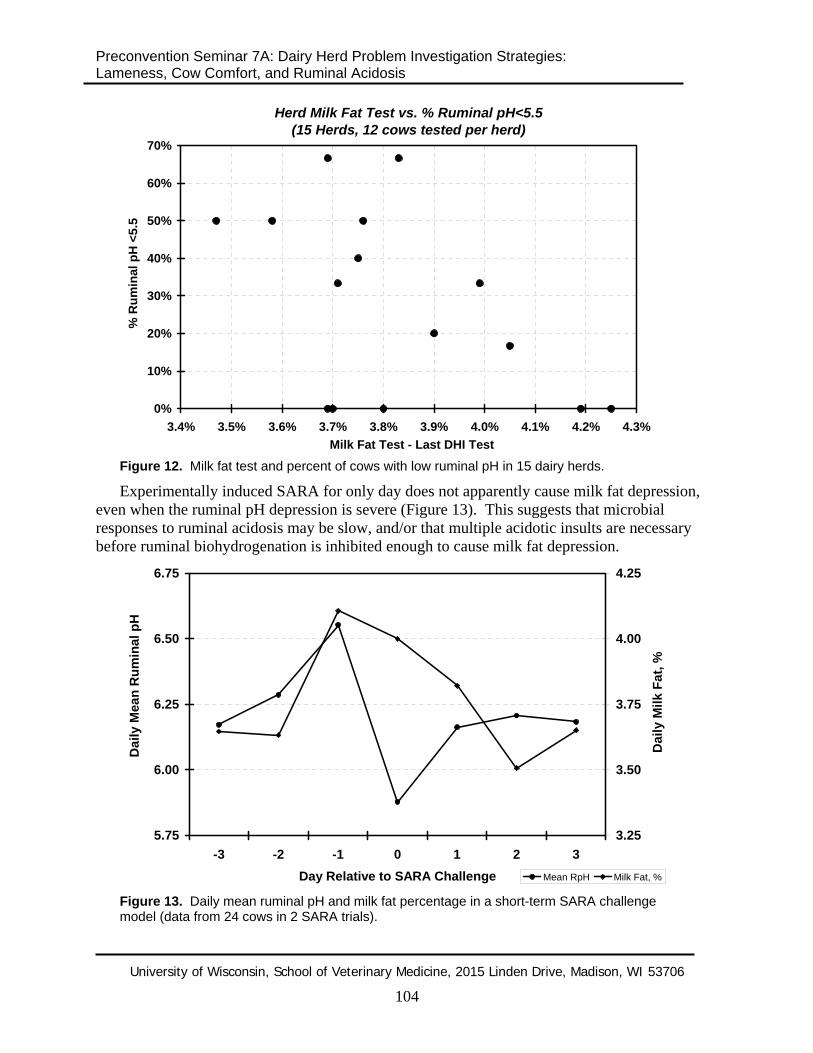
Clinical evidence suggests that the link between ruminal pH and milk fat depression is weak. Many herds with substantially depressed ruminal pH have no milk fat depression at all (Figure 12). This suggests that low ruminal pH probably has to interact with some aspect of dietary fat feeding or time before milk fat depression occurs.
University of Wisconsin, School of Veterinary Medicine, 2015 Linden Drive, Madison, WI 53706
103
Preconvention Seminar 7A: Dairy Herd Problem Investigation Strategies: Lameness, Cow Comfort, and Ruminal Acidosis
Herd Milk Fat Test vs. % Ruminal pH<5.5(15 Herds, 12 cows tested per herd)
0%
10%
20%
30%
40%
50%
60%
70%
3.4% 3.5% 3.6% 3.7% 3.8% 3.9% 4.0% 4.1% 4.2% 4.3%Milk Fat Test - Last DHI Test
% R
umin
al p
H <
5.5
Figure 12. Milk fat test and percent of cows with low ruminal pH in 15 dairy herds.
Experimentally induced SARA for only day does not apparently cause milk fat depression, even when the ruminal pH depression is severe (Figure 13). This suggests that microbial responses to ruminal acidosis may be slow, and/or that multiple acidotic insults are necessary before ruminal biohydrogenation is inhibited enough to cause milk fat depression.
5.75
6.00
6.25
6.50
6.75
-3 -2 -1 0 1 2 3Day Relative to SARA Challenge
Dai
ly M
ean
Rum
inal
pH
3.25
3.50
3.75
4.00
4.25
Dai
ly M
ilk F
at, %
Mean RpH Milk Fat, %
Figure 13. Daily mean ruminal pH and milk fat percentage in a short-term SARA challenge model (data from 24 cows in 2 SARA trials).
University of Wisconsin, School of Veterinary Medicine, 2015 Linden Drive, Madison, WI 53706
104
Preconvention Seminar 7A: Dairy Herd Problem Investigation Strategies: Lameness, Cow Comfort, and Ruminal Acidosis
Milk fat test data has the potential to give us some information about whether we are over-feeding grain (and causing ruminal acidosis with subsequent health problems) or are under-feeding grain and losing profit. Unfortunately, the inference on ruminal pH provided by milk fat test is too often inaccurate and influenced more by other factors. A direct measurement of ruminal pH is vastly more useful.
Nutritional Management and SARA Once a diagnosis of SARA has been established in a herd, then the cause of the acidosis must
be determined before appropriate preventive measures can be instituted. Causes of ruminal acidosis can be grouped into three categories: excessive intake of rapidly fermentable carbohydrates, inadequate ruminal buffering, and inadequate ruminal adaptation to a highly fermentable diet.
Excessive intake of rapidly fermentable carbohydrates. This is the most obvious cause of ruminal acidosis in dairy cattle. Because of their relatively high dry matter intakes, dairy cattle cannot tolerate diets as proportionately high in concentrates as beef feedlot diets. An important goal of effective dairy cow nutrition is to feed as much concentrate as possible, in order to maximize production, without causing ruminal acidosis. This is a difficult and challenging task because the indications of feeding excessive amounts of fermentable carbohydrates (decreased dry matter intake and milk production) are very similar to the results from feeding excessive fiber (again, decreased dry matter intake and milk production). An important distinction is that even slightly over-feeding fermentable carbohydrates causes chronic health problems, while slightly under-feeding fermentable carbohydrates does not compromise cow health.
Dairy nutritionists have carefully defined fiber requirements for dairy cattle in terms of acid detergent fiber (ADF) and neutral detergent fiber (NDF) (National Research Council, 2001). Nutritionists often go beyond the measures of carbohydrate nutrition defined by the National Research Council to include nutrients such as non-fiber carbohydrates (NFC), starch, effective NEF (eNDF), physically effective NDF (peNDF), (Mertens, 1997) and long fiber particles (Oetzel, 2000). Each of these nutrients looks at a slightly different aspect of carbohydrate nutrition.
Evaluating the dietary content for each of these nutrients is an important first step in determining the cause of SARA in a dairy herd. This requires a careful evaluation of the ration actually being consumed by the cows. A cursory evaluation of the “paper” ration formulated by the herd nutritionist is usually of little value. Ascertaining the ration actually consumed by the cows requires a careful investigation of how feed is delivered to the cows, accurate weights of the feed delivered, and updated nutrient analyses of the feeds delivered (particularly the dry matter content of the fermented feed ingredients). Careful bunk sampling and wet chemistry analyses of total mixed rations (TMR) may uncover unknown errors in feed composition or feed delivery. The total intake of rapidly fermentable carbohydrates is probably more important than the percentage of the carbohydrates in the diet (Oetzel and Nordlund, 1998). Herds or groups within herds with higher dry matter intakes will be at inherently higher risk for SARA and may need to be more conservative in carbohydrate nutrition than other herds or groups.
University of Wisconsin, School of Veterinary Medicine, 2015 Linden Drive, Madison, WI 53706
105
Dairy herds that use component feeding in early lactation often bring cows up on grain faster than their actual rise in dry matter intake. This puts cows at great risk for SARA, since they cannot eat enough forage to compensate for the extra grain consumed (Nordlund et al., 1995).
Preconvention Seminar 7A: Dairy Herd Problem Investigation Strategies: Lameness, Cow Comfort, and Ruminal Acidosis
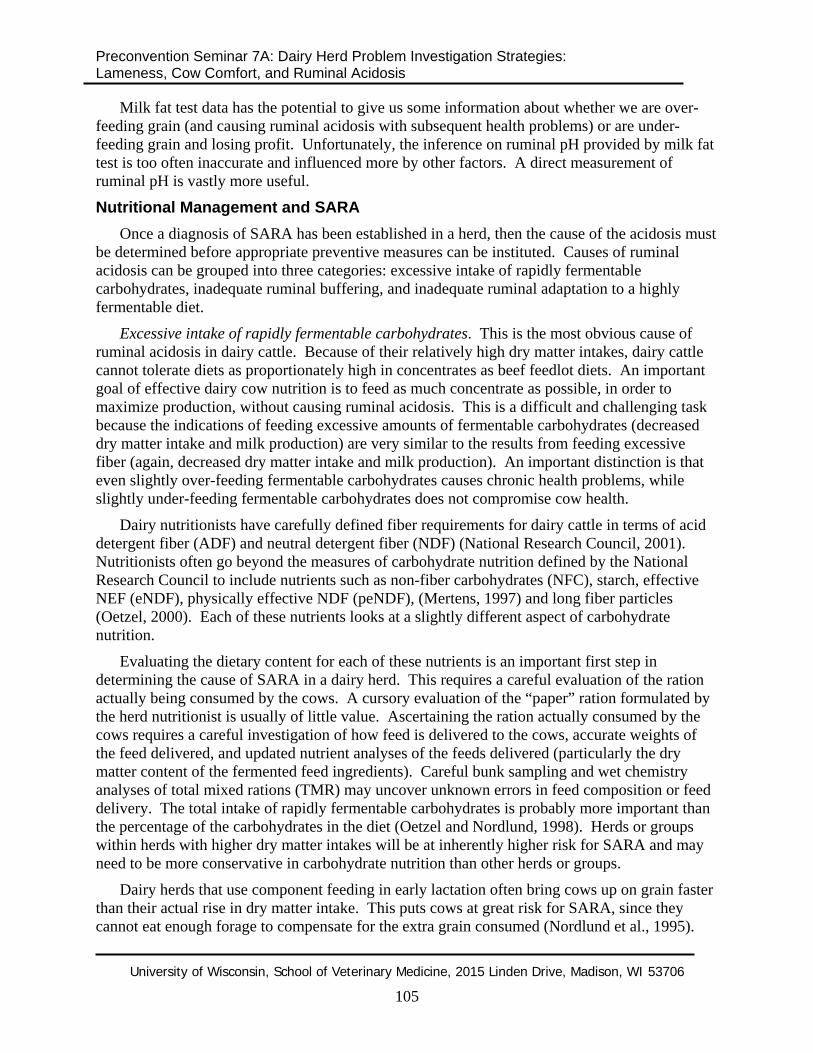
Careful modeling of early lactation diets in such herds often reveals drastic fiber deficiencies around one to three weeks post-calving (Figure 14). As a general rule of thumb, cows should receive no more than 8 to 12 lbs of dry matter from grain in the first week after calving. Grain feeding should then increase by about .25 to .50 lbs/cow/day until peak grain feeding is reached at six to eight weeks post-calving. Maximal protein feeding can be reached in three weeks.
The physical form of feed ingredients can be just as important as their chemical composition in determining how rapidly and completely they are fermented in the rumen. Grains that are finely ground, steam-flaked, extruded, and/or very wet will ferment more rapidly and completely in the rumen than unprocessed or dry grains, even if their chemical composition is identical. Similarly, starch from wheat or barley is more rapidly and completely fermented in the rumen that starch from corn. Corn silage that is very wet, finely chopped, or kernel-processed also poses a greater risk for SARA than drier, coarsely chopped, or unprocessed corn silage.
Early Lactation Forage:Conc Ratios(rapid introduction of concentrates)
0
10
20
30
40
50
60
-1 0 1 2 3 4 5 6 7 8 9 10
Weeks Relative to Calving
Dry
Mat
ter I
ntak
e, lb
s
Forage DM
Conc. DM
Figure 14. Forage:concentrate ratios resulting from rapid introduction of concentrates in early lactation.
Particle size analysis of grains is a useful adjunct test when assessing the risk for SARA in a dairy herd. Very finely ground grains, especially if they are moist, will increase their rate of fermentation in the rumen and increase the risk for SARA. A detailed equipment list, protocol, and interpretation guide for grain particle size evaluation is presented in Appendix I.
Feeding a large proportion of a lactation diet as corn silage puts cows at higher risk for SARA compared to diets containing more dry hay or hay crop silages. Corn silages vary considerably in their NDF digestibility, due to genetic design (e.g., brown midrib varieties) or due to growing / harvest conditions. Tests that estimate NDF digestibility can be very useful in identifying corn silages with unusually high rates and extents of ruminal fermentation.
University of Wisconsin, School of Veterinary Medicine, 2015 Linden Drive, Madison, WI 53706
106

Preconvention Seminar 7A: Dairy Herd Problem Investigation Strategies: Lameness, Cow Comfort, and Ruminal Acidosis
Unfortunately, most of these tests interfere with precise evaluation because they first require grinding the corn silage sample.
Corn silages also vary considerably in the extent of processing of the corn grain (e.g., kernel processing). Tests are being developed to help measure the extent of grain processing within corn silage. Combining these test results with digestibility data and particle length data furthers our ability to feed corn silages heavily without unnecessary risk for SARA.
Corn silage is also difficult to feed because it typically does not contribute enough long particles to a TMR. Very long chopping of corn silage is not recommended, because it impairs fermentation and increases the risk for sorting at the feedbunk. It is a common (and necessary) practice to add chopped long-stem dry hay or chopped dry straw to TMR containing a high proportion of the forage as corn silage. However, can be difficult to process the dry forage so that it distributes evenly throughout the TMR and so that the cows cannot sort it. Vertical mixers or prior tub grinding of the dry forage usually works the best.
Feed delivery and access are often overlooked as important contributors to SARA. Dairy cattle groups are commonly fed for ad libitum intake (typically a 5% daily feed refusal) in order to maximize potential dry matter intake and milk yield. However, slightly limiting intake in dairy cattle at high risk for SARA would in theory reduce their risk of periodic over-consumption and SARA. Feed efficiency might also be improved. This approach has been successfully used in beef feedlots. However, dairy cow groups are much more dynamic than feedlot groups. This makes it considerably more challenging for dairy cattle feeders to slightly limit intakes without letting the feed bunks be without palatable feed more than about four hours a day. It can be done, but only with adequate bunk space and excellent feed bunk management. Perhaps ad libitum feeding with a 5% daily feed refusal is the best option for most dairy herds. This would especially apply to the pre- and post-fresh cow groups because they have rapid cow turnover and because individual cows have rapidly changing dry matter intakes during these time periods.
Research studies with SARA suggest that meal size is an extremely important aspect of nutritional management of SARA. Cows are able to self-regulate their ruminal pH very effectively if they have continuous and predictable access to the same TMR every day. However, even modest bouts of feed restriction can cause cows to subsequently consume meals that are too large. Therefore, good feedbunk management practices are critical SARA prevention - even when chemical fiber, particle length, and grain processing are optimal.
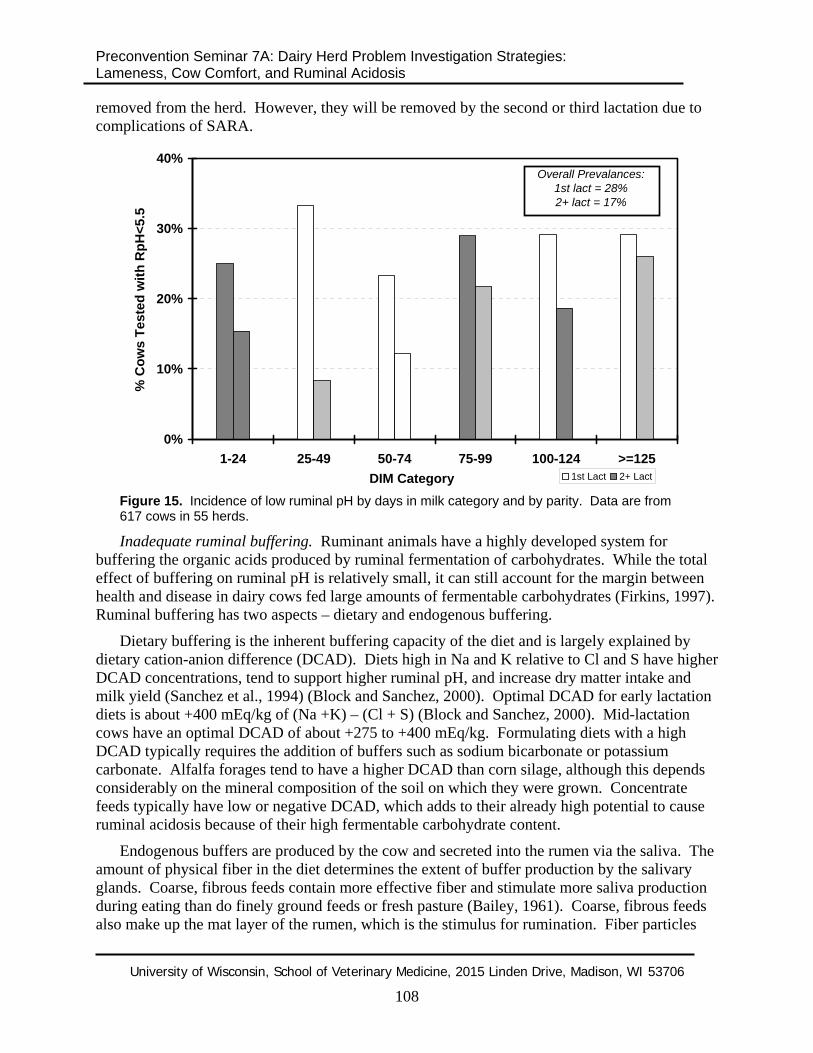
Because first lactation heifers have lower dry matter intakes than older cows, it would seem that they should be a lower risk for SARA. However, clinical data from our herd investigations shows that first lactation heifers may actually be a higher risk (see Figure 15). First lactation heifers sampled had a higher prevalence of SARA (28% vs. 17% in second or greater lactation cows) and also appeared to be at risk for SARA earlier in lactation than the older cows. These are observational data only, and should be interpreted with caution until they are validated (or refuted) by results of controlled studies. It is possible that first lactation heifers have difficulty getting access to feedbunk when older cows are present, so they could be prone to eating large meals. It is also possible that first lactation heifers need time to learn to self-regulate their own ruminal pH after they begin consuming large amounts of fermentable carbohydrates after calving. Since first lactation heifers represent a largely unculled population, it is possible that the heifers that are unable to learn to self-regulate their own ruminal pH have not yet been
University of Wisconsin, School of Veterinary Medicine, 2015 Linden Drive, Madison, WI 53706
107
Preconvention Seminar 7A: Dairy Herd Problem Investigation Strategies: Lameness, Cow Comfort, and Ruminal Acidosis
removed from the herd. However, they will be removed by the second or third lactation due to complications of SARA.
(617 cows in 55 herds)
0%
10%
20%
30%
40%
1-24 25-49 50-74 75-99 100-124 >=125DIM Category
% C
ows
Test
ed w
ith R
pH<5
.5
Overall Prevalances:1st lact = 28%2+ lact = 17%
1st Lact 2+ Lact
Figure 15. Incidence of low ruminal pH by days in milk category and by parity. Data are from 617 cows in 55 herds.
Inadequate ruminal buffering. Ruminant animals have a highly developed system for buffering the organic acids produced by ruminal fermentation of carbohydrates. While the total effect of buffering on ruminal pH is relatively small, it can still account for the margin between health and disease in dairy cows fed large amounts of fermentable carbohydrates (Firkins, 1997). Ruminal buffering has two aspects – dietary and endogenous buffering.
Dietary buffering is the inherent buffering capacity of the diet and is largely explained by dietary cation-anion difference (DCAD). Diets high in Na and K relative to Cl and S have higher DCAD concentrations, tend to support higher ruminal pH, and increase dry matter intake and milk yield (Sanchez et al., 1994) (Block and Sanchez, 2000). Optimal DCAD for early lactation diets is about +400 mEq/kg of (Na +K) – (Cl + S) (Block and Sanchez, 2000). Mid-lactation cows have an optimal DCAD of about +275 to +400 mEq/kg. Formulating diets with a high DCAD typically requires the addition of buffers such as sodium bicarbonate or potassium carbonate. Alfalfa forages tend to have a higher DCAD than corn silage, although this depends considerably on the mineral composition of the soil on which they were grown. Concentrate feeds typically have low or negative DCAD, which adds to their already high potential to cause ruminal acidosis because of their high fermentable carbohydrate content.
Endogenous buffers are produced by the cow and secreted into the rumen via the saliva. The amount of physical fiber in the diet determines the extent of buffer production by the salivary glands. Coarse, fibrous feeds contain more effective fiber and stimulate more saliva production during eating than do finely ground feeds or fresh pasture (Bailey, 1961). Coarse, fibrous feeds also make up the mat layer of the rumen, which is the stimulus for rumination. Fiber particles
University of Wisconsin, School of Veterinary Medicine, 2015 Linden Drive, Madison, WI 53706
108
Preconvention Seminar 7A: Dairy Herd Problem Investigation Strategies: Lameness, Cow Comfort, and Ruminal Acidosis
need to be longer than about 1.5 inches in order to contribute to mat layer formation. Rumination promotes much chewing activity and therefore the secretion of large amounts of saliva into the rumen. As expected, ruminal pH increases noticeably during bouts of rumination (Allen, 1997).
The ability of a diet and feeding system to promote maximal amounts of ruminal buffering should be evaluated as part of the work-up of a herd diagnosed with SARA. Wet chemistry analysis of a carefully collected TMR bunk sample can be particularly effective in determining the actual DCAD of the diet delivered to the lactation cows. Diets with measured DCAD values below about +275 to +400 mEq/kg of (Na + K) – (Cl + S) should be supplemented with additional buffers to provide more Na or K relative to Cl and S.
Endogenous buffering can be estimated by observing the number of cows ruminating (a goal is at least 40% of cows ruminating at any given time) and by measuring the particle length of the TMR actually consumed by the cows using the Penn State Forage Particle Separator (Lammers et al., 1996; Oetzel, 2000). A detailed equipment list, protocol, and interpretation guidelines for forage particle length are presented in Appendix II.
Diets with less than 7% long particles put cows at increased risk for SARA, particularly if these diets are also borderline or low in chemical fiber content (Grant et al., 1990) (Woodford and Murphy, 1988). Increasing chemical fiber content of the diet may compensate for short particle length (Beauchemin et al., 1994).
Diets with excessive (over about 15%) long forage particles can paradoxically increase the risk for SARA. This happens when the long particles are unpalatable and sortable. Sorting of the long particles occurs soon after feed delivery, causing the cows to consume a diet that is low in physically effective fiber after feeding. The diet consumed later in the feeding period is then excessively high in physically effective fiber and low in energy. Socially dominant cows are particularly susceptible to SARA in this scenario, since they are likely to consume more of the fine TMR particles soon after feed delivery. Cows lower on the peck order then consume a very low energy diet. Thus, cows on both ends of the social spectrum become thin and produce poorly. Limiting bunk space to less than 30 inches per cow exacerbates the effect of TMR sorting in a group of cows. Sorting of long particles during the feed-out period can be evaluated by conducting sequential analysis of the TMR bunk samples at differing times after feeding.
It is very difficult to quantitatively evaluate the extent that a TMR is sorted. The most rigorous approach is to gather representative samples of the TMR at approximately 2 hours after feeding and then do particle length analysis at each time point. Gathering representative TMR bunk samples is tedious (gather 12 or more representative along the length of the bunk, mix, and, and then shake down two six-cup subsamples), and repeating this procedure six to ten times over the course of a day is not very practical. A more reasonable approach is to first evaluate the particle length, coarseness of the long forage particles, and dry matter of the TMR. If the proportion of long particles is <15%, if the long particles are not coarse stemmy hay, and the TMR dry matter is below 50%, then it is probably unnecessary to do any further evaluation of TMR sorting. If there are problems in one or more of these areas, then it is practical to start by comparing particle lengths of TMR refusals to the particle lengths of the TMR offered. If the refusals contain no more than about 5 to 10% more total long particles than the TMR offered, then sorting is unlikely to be a major issue. For example, if the TMR offered contains 18% long
University of Wisconsin, School of Veterinary Medicine, 2015 Linden Drive, Madison, WI 53706
109
Preconvention Seminar 7A: Dairy Herd Problem Investigation Strategies: Lameness, Cow Comfort, and Ruminal Acidosis
particles and the TMR refusal is 24% long particles, then sorting is probably not a major issue. But if the TMR refusal contains >28% long particles, then this is cause for concern.
The most common cause of excessive TMR sorting is the inclusion of unprocessed, coarse, dry baled hay in a TMR. Despite the claims of manufacturers, most TMR mixers (except for some vertical mixers) are unable to adequately reduce the particle size of coarse dry hay. Processing this hay before adding it to the mixer is often necessary. In many cases, the dry hay can be eliminated from the TMR, provided there are adequate long particles from haylage and corn silage. It seems paradoxical, but the risk for SARA in a herd can sometimes be lowered by removing the baled hay from the TMR.
Inadequate adaptation to highly fermentable, high carbohydrate diets. In theory, cows in early lactation should be particularly susceptible to SARA if they are poorly prepared for the lactation diet they will receive. Ruminal adaptation to diets high in fermentable carbohydrates apparently has two key aspects – microbial adaptation (particularly the lactate-utilizing bacteria, which grow more slowly than the lactate-producing bacteria) and ruminal papillae length (longer papillae promote greater VFA absorption and thus lower ruminal pH) (Dirksen et al., 1985). Beef feedlots recognize the importance of gradually introducing steers to higher grain diets (Radostits et al., 1994).
The known principles of ruminal adaptation suggest that increasing grain feeding toward the end of the dry period should decrease the risk for SARA in early lactation cows. However, a recent field study in TMR-fed herds found no effect of dry period feeding on early lactation ruminal pH. And ruminal pH in this study was unexpectedly lower in cows at 106 average days in milk compared to cows at 15 average days in milk (Garrett et al., 1997). These results suggest that high dry matter intake is a more important risk factor for SARA than ruminal adaptation problems in dairy herds. Also, a controlled study in component-fed cows found no positive effect of increased grain feeding during the dry period on early lactation ruminal pH or dry matter intake (Andersen et al., 1999). These results suggest that the practical impacts of ruminal adaptation may be small or even inconsequential in dairy herds - particularly when cows are fed a TMR after calving.
Prevention of Subacute Ruminal Acidosis in Dairy Herds The basic principles of preventing SARA in dairy herds have been discussed above and
include limiting the intake of rapidly fermentable carbohydrates, providing adequate ruminal buffering, and allowing for ruminal adaptation to high grain diets. However, I expect SARA to remain an important dairy cow problem even when these principles are understood and applied, because the line between optimal milk production and over-feeding grain is exceedingly fine. In many dairy herd situations, milk production can appear to be temporarily increased by over-feeding grain and causing SARA; however, the long-term health and economic consequences of this approach are devastating. Any additional nutritional interventions that might prevent SARA without limiting grain feeding are highly desirable. Several of these approaches are summarized below.
Enhancing ruminal lactate utilizers. An important aspect of maintaining a stable rumen environment is maintaining a balance between lactate production and lactate utilization by bacteria that convert lactate to less dangerous VFA. Enhancing ruminal lactate utilizers reduces the risk for ruminal acidosis (particularly the acute form of ruminal acidosis). Supplementation
University of Wisconsin, School of Veterinary Medicine, 2015 Linden Drive, Madison, WI 53706
110
Preconvention Seminar 7A: Dairy Herd Problem Investigation Strategies: Lameness, Cow Comfort, and Ruminal Acidosis
with specific yeast strains may enhance lactate utilization within the rumen under certain dietary conditions (Dawson, 1995).
Preconditioning microbes to handle lactate. Adding lactate to the diet or using feed ingredients high in lactate may improve the ability of the rumen to adapt to sudden increases in lactate production (Owens et al., 1998). Direct-fed microbials might also be used to provide a steady source of lactate in the rumen. A mixture of direct-fed microbials added to the rumen of dairy cows at the 1 x 10⁵ dose increased corn digestibility and increased ruminal pH compared to higher doses of microbials (Nocek et al., 1999).
Selenomonas ruminantium is one of the bacteria that convert ruminal lactate to VFA. S. ruminantium is apparently stimulated to utilize lactate by malate (Martin and Streeter, 1995). Supplementing diets with malate as a feed additive may be cost-prohibitive; however, incorporation of forage varieties high in malate may allow for economical inclusion of malate in dairy diets (Callaway et al., 2000). Stage of maturity and variety affects malate concentrations in alfalfa (Callaway et al., 2000).
Supplementation with ionophores. Feeding ionophores reduces ruminal lactate production; this effect appears to be caused by inhibition of lactate-producing bacteria, competitive enhancement of lactate utilizers, and possibly by reducing meal size (Owens et al., 1998). Monensin is now approved for use in lactating dairy cattle in the US. It appears that the benefits of monensin in preventing SARA are minor. It is probably more effective in preventing acute ruminal acidosis, which is consistently characterized by very high ruminal lactate concentrations.
References Allen, M. S. 1997. Relationship between fermentation acid production in the rumen and the requirement
for physically effective fiber. J. Dairy Sci. 80:1447-1462. Andersen, J. B., J. Sehested, and L. Ingvartsen. 1999. Effect of dry cow feeding strategy on rumen pH,
concentration of volatile fatty acids and rumen epithelium development. Acta Agric. Scand., Sect. A, Animal Sci. 49:149-155.
Bailey, C. B. 1961. Saliva secretion and its relation to feeding in cattle. 3. The rate of secretion of mixed saliva in the cow during eating with an estimate of the magnitude of the total daily secretion of mixed saliva. Br. J. Nutr. 15:443-451.
Beauchemin, K. A., B. I. Farr, L. M. Rode, and G. B. Schaalje. 1994. Effects of alfalfa silage chop length and supplementary long hay on chewing and milk production of dairy cows. J. Dairy Sci. 77:1326-1339.
Block, E., and W. K. Sanchez. 2000. Is it important to adjust the dietary cation-anion difference for lactating dairy cows? Pages 27-39 in Proc. Tri-State Dairy Nutr Conf, Columbus, OH.
Callaway, T. R., S. A. Martin, J. L. Wampler, N. S. Hill, and G. M. Hill. 2000. Malate content of forage varieties commonly fed to cattle. J. Dairy Sci. 80:1651-1655.
Carter, R. R., and W. L. Grovum. 1990. A review of the physiological significance of hypertonic body fluids on feed intake and ruminal function: Salivation, motility and microbes. J. Anim. Sci. 68:2811-2832.
Dawson, K. A. 1995. The use of yeast strain 8417 in manipulating ruminant high concentrate diets. Pages 25-36 in Proc. 56th Minnesota Nutrition Conference & Alltech, Inc. Technical Symposium, St. Paul, MN.
University of Wisconsin, School of Veterinary Medicine, 2015 Linden Drive, Madison, WI 53706
111

Preconvention Seminar 7A: Dairy Herd Problem Investigation Strategies: Lameness, Cow Comfort, and Ruminal Acidosis
Dirksen, G. U., H. G. Liebich, and E. Mayer. 1985. Adaptive changes of the ruminal mucosa and their functional and clinical significance. Bovine Practitioner 20:116-120.
Firkins, J. 1997. Effect of physical processing of corn silage and grain. Pages 205-218 in Proc. Tri-State Dairy Nutr Conf, Columbus, OH.
Garrett, E. F., K. V. Nordlund, W. J. Goodger, and G. R. Oetzel. 1997. A cross-sectional field study investigating the effect of periparturient dietary management on ruminal pH in early lactation dairy cows. J. Dairy Sci. 80(Suppl. 1):169-169. (Abstr.)
Garry, F. B. 1996. Indigestion in ruminants. Pages 824-858 in Large Animal Internal Medicine. B. P. Smith, ed. Mosby-Year Book, Inc., St. Louis.
Grant, R. J., V. F. Colenbrander, and D. R. Mertens. 1990. Milk fat depression in dairy cows: Role of silage particle size. J. Dairy Sci. 73:1834-1842.
Kennelly, J. J., B. Robinson, and G. R. Khorasani. 1999. Influence of carbohydrate source and buffer on rumen fermentation characteristics, milk yield, and milk composition in early-lactation Holstein cows. J. Dairy Sci. 82:2486-2496.
Lammers, B. P., D. R. Buckmaster, and A. J. Heinrichs. 1996. A simple method for the analysis of particle sizes of forage and total mixed rations. J. Dairy Sci. 79:922-928.
Martin, S. A., and M. N. Streeter. 1995. Effect of malate on in vitro mixed ruminal microorganism fermentation. J. Anim. Sci. 73:2141-2145.
Mertens, D. R. 1997. Creating a system for meeting the fiber requirements of dairy cows. J. Dairy Sci. 80:1463-1481.
National Research Council. 2001. Nutrient Requirements of Dairy Cattle. 7th rev. ed. Natl. Acad. Press, Washington, DC.
Nocek, J. E., W. P. Kautz, J. A. Z. Leedle, and J. G. Allman. 1999. The effect of ruminal supplementation of direct-fed microbials on diurnal pH variation and in situ digestion in dairy cattle. J. Dairy Sci. 82(Suppl. 1):69-70. (Abstr.)
Nordlund, K. V., E. F. Garrett, and G. R. Oetzel. 1995. Herd-based rumenocentesis: A clinical approach to the diagnosis of subacute rumen acidosis. Compend. Contin. Educ. Pract. Vet. 17:S48-S56.
Oetzel, G. R. 2001. Application of forage particle length determination in dairy practice. Compend. Contin. Educ. Pract. Vet. 23:S30-38.
Oetzel, G. R., and K. V. Nordlund. 1998. Effect of dry matter intake and feeding frequency on ruminal pH in lactating dairy cows. J. Dairy Sci. 81(Suppl. 1):297-
Owens, F. N., D. S. Secrist, W. J. Hill, and D. R. Gill. 1998. Acidosis in cattle: A review. J. Anim. Sci. 76:275-286.
Pollitt, C. C. 1999. Equine laminitis: A revised pathophysiology. AAEP Proceedings 45:188-192. Prentice, D. L., D. M. Schaefer, and G. R. Oetzel. 2000. Effect of lasalocid on the forage to concentrate
ratio fed to steers maintained at a pre-determined daily average ruminal pH. J. Dairy Sci. 83:246-247. (Abstr.)
Radostits, O. M., D. C. Blood, and C. C. Gay. 1994. Acute carbohydrate engorgement of ruminants (rumen overload). Pages 262-269 in Veterinary Medicine. O. W. Radostits, D. C. Blood, and C. C. Gay, ed. W. B. Saunders, Philadelphia, PA.
Rebhun, W. C. 1995. Abdominal diseases. Pages 106-154 in Diseases of Dairy Cattle. W. C. Rebhun, ed. Williams and Wilkins, Media, PA.
Russell, J. B., and J. L. Rychlik. 2001. Factors that alter rumen microbial ecology. Science 292:1119-1122.
University of Wisconsin, School of Veterinary Medicine, 2015 Linden Drive, Madison, WI 53706
112
Preconvention Seminar 7A: Dairy Herd Problem Investigation Strategies: Lameness, Cow Comfort, and Ruminal Acidosis
Sanchez, W. K., D. K. Beede, and M. A. Delorenzo. 1994. Macromineral element interrelationships and lactational performance: Empirical models from a large data set. J. Dairy Sci. 77:3096-3110.
Van Soest, P. J. 1994. Nutritional ecology of the ruminant. 2nd ed. Cornell University Press, Ithaca, NY. Woodford, S. T., and M. R. Murphy. 1988. Effect of forage physical form on chewing activity, dry matter
intake, and rumen function of dairy cows in early lactation. J. Dairy Sci. 71:674-686.
University of Wisconsin, School of Veterinary Medicine, 2015 Linden Drive, Madison, WI 53706
113
Preconvention Seminar 7A: Dairy Herd Problem Investigation Strategies: Lameness, Cow Comfort, and Ruminal Acidosis
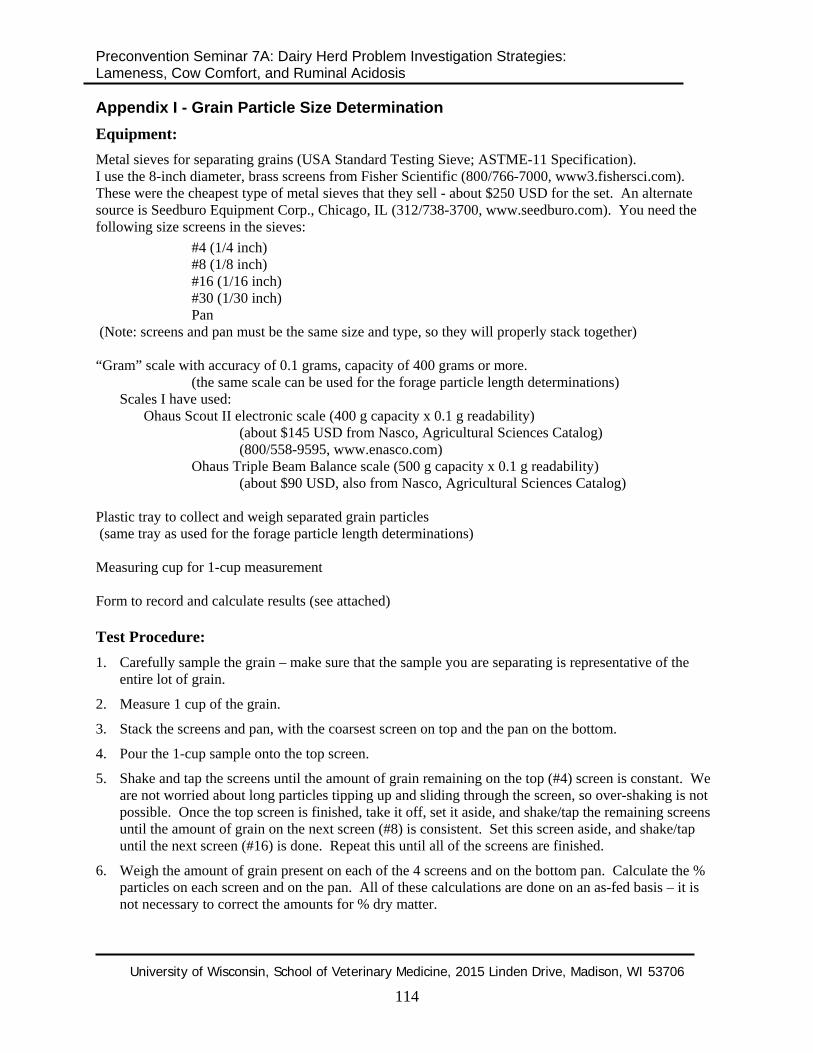
Appendix I - Grain Particle Size Determination Equipment: Metal sieves for separating grains (USA Standard Testing Sieve; ASTME-11 Specification). I use the 8-inch diameter, brass screens from Fisher Scientific (800/766-7000, www3.fishersci.com). These were the cheapest type of metal sieves that they sell - about $250 USD for the set. An alternate source is Seedburo Equipment Corp., Chicago, IL (312/738-3700, www.seedburo.com). You need the following size screens in the sieves: #4 (1/4 inch) #8 (1/8 inch) #16 (1/16 inch) #30 (1/30 inch) Pan (Note: screens and pan must be the same size and type, so they will properly stack together) “Gram” scale with accuracy of 0.1 grams, capacity of 400 grams or more. (the same scale can be used for the forage particle length determinations)
Scales I have used: Ohaus Scout II electronic scale (400 g capacity x 0.1 g readability)
(about $145 USD from Nasco, Agricultural Sciences Catalog) (800/558-9595, www.enasco.com) Ohaus Triple Beam Balance scale (500 g capacity x 0.1 g readability) (about $90 USD, also from Nasco, Agricultural Sciences Catalog) Plastic tray to collect and weigh separated grain particles (same tray as used for the forage particle length determinations) Measuring cup for 1-cup measurement Form to record and calculate results (see attached) Test Procedure: 1. Carefully sample the grain – make sure that the sample you are separating is representative of the
entire lot of grain.
2. Measure 1 cup of the grain.
3. Stack the screens and pan, with the coarsest screen on top and the pan on the bottom.
4. Pour the 1-cup sample onto the top screen.
5. Shake and tap the screens until the amount of grain remaining on the top (#4) screen is constant. We are not worried about long particles tipping up and sliding through the screen, so over-shaking is not possible. Once the top screen is finished, take it off, set it aside, and shake/tap the remaining screens until the amount of grain on the next screen (#8) is consistent. Set this screen aside, and shake/tap until the next screen (#16) is done. Repeat this until all of the screens are finished.
6. Weigh the amount of grain present on each of the 4 screens and on the bottom pan. Calculate the % particles on each screen and on the pan. All of these calculations are done on an as-fed basis – it is not necessary to correct the amounts for % dry matter.
University of Wisconsin, School of Veterinary Medicine, 2015 Linden Drive, Madison, WI 53706
114
Preconvention Seminar 7A: Dairy Herd Problem Investigation Strategies: Lameness, Cow Comfort, and Ruminal Acidosis
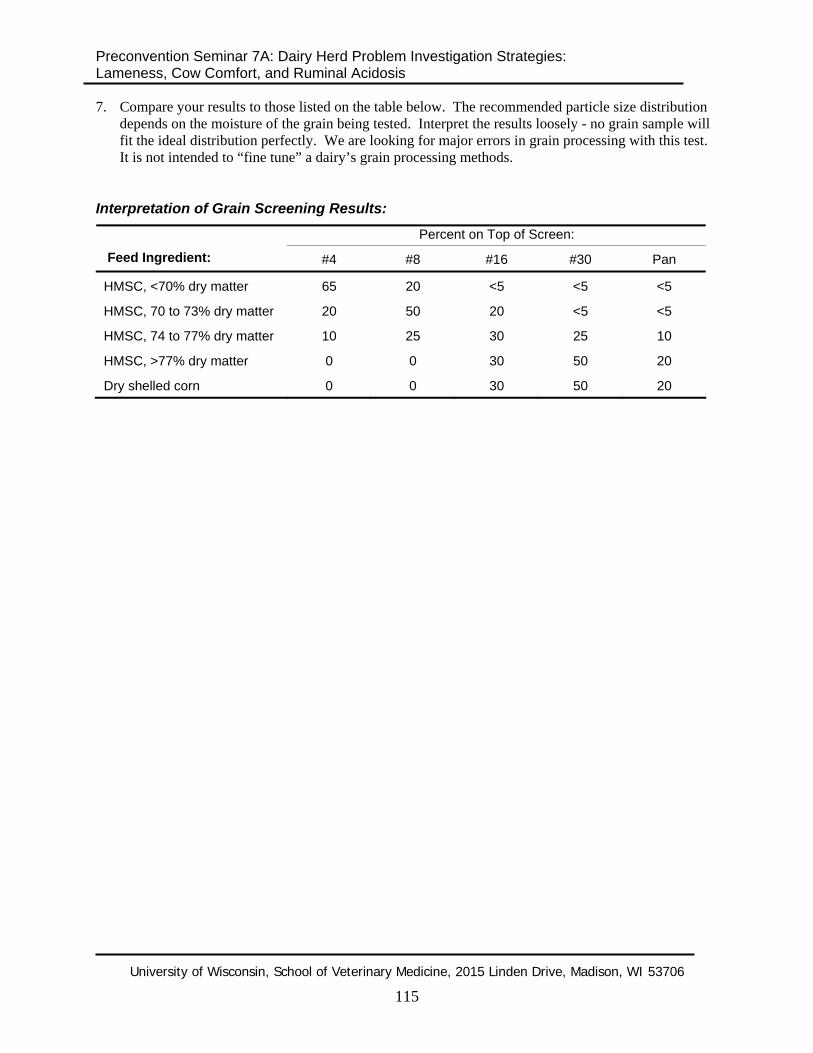
7. Compare your results to those listed on the table below. The recommended particle size distribution depends on the moisture of the grain being tested. Interpret the results loosely - no grain sample will fit the ideal distribution perfectly. We are looking for major errors in grain processing with this test. It is not intended to “fine tune” a dairy’s grain processing methods.
Interpretation of Grain Screening Results:
Percent on Top of Screen: Feed Ingredient: #4 #8 #16 #30 Pan
HMSC, <70% dry matter 65 20 <5 <5 <5
HMSC, 70 to 73% dry matter 20 50 20 <5 <5
HMSC, 74 to 77% dry matter 10 25 30 25 10
HMSC, >77% dry matter 0 0 30 50 20
Dry shelled corn 0 0 30 50 20
University of Wisconsin, School of Veterinary Medicine, 2015 Linden Drive, Madison, WI 53706
115
Preconvention Seminar 7A: Dairy Herd Problem Investigation Strategies: Lameness, Cow Comfort, and Ruminal Acidosis
Sample Sample SampleAmt. % Amt. % Amt. %
#4 #4 #4#8 #8 #8
#16 #16 #16#30 #30 #30Pan Pan Pan
Total Total Total
Sample Sample SampleAmt. % Amt. % Amt. %
#4 #4 #4#8 #8 #8
#16 #16 #16#30 #30 #30Pan Pan Pan
Total Total Total
Sample Sample SampleAmt. % Amt. % Amt. %
#4 #4 #4#8 #8 #8
#16 #16 #16#30 #30 #30Pan Pan Pan
Total Total Total
Sample Sample SampleAmt. % Amt. % Amt. %
#4 #4 #4#8 #8 #8
#16 #16 #16#30 #30 #30Pan Pan Pan
Total Total Total
USA Standard Testing Sieve; ASTME-11 SpecificationGrain Screening Results
Farm Name:_________________________________________ Date:__________
University of Wisconsin, School of Veterinary Medicine, 2015 Linden Drive, Madison, WI 53706
116
Preconvention Seminar 7A: Dairy Herd Problem Investigation Strategies: Lameness, Cow Comfort, and Ruminal Acidosis
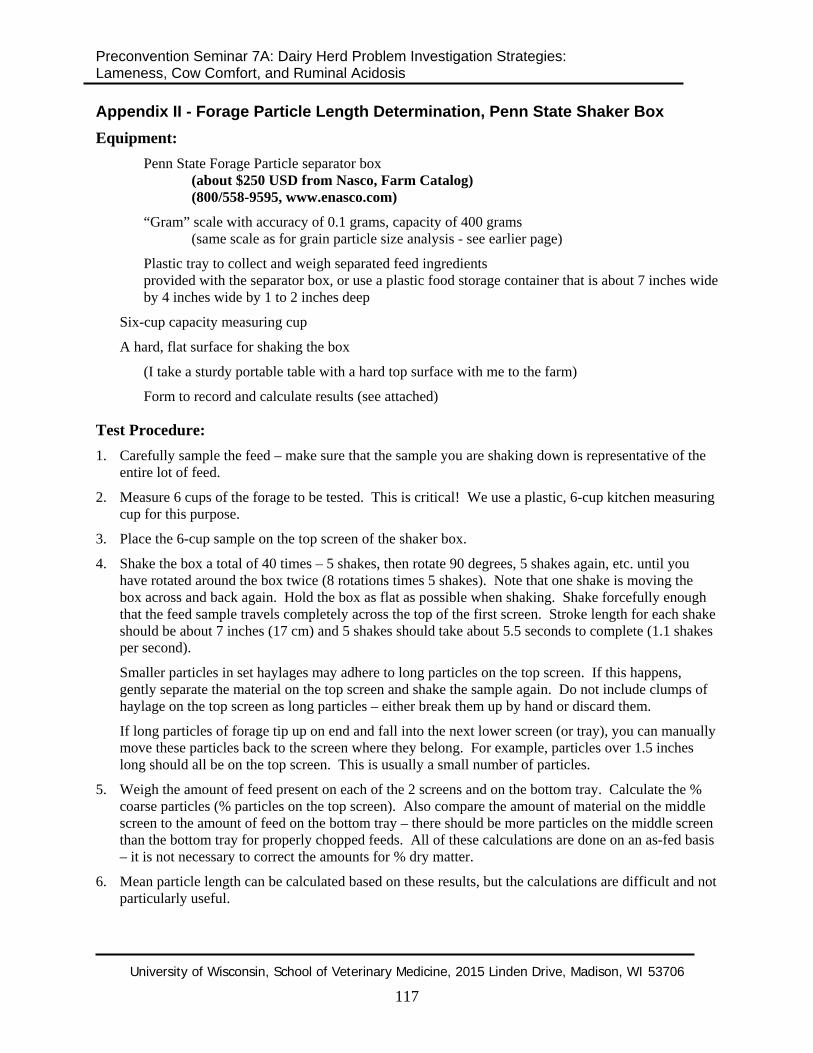
Appendix II - Forage Particle Length Determination, Penn State Shaker Box Equipment: Penn State Forage Particle separator box (about $250 USD from Nasco, Farm Catalog) (800/558-9595, www.enasco.com)
“Gram” scale with accuracy of 0.1 grams, capacity of 400 grams (same scale as for grain particle size analysis - see earlier page)
Plastic tray to collect and weigh separated feed ingredients provided with the separator box, or use a plastic food storage container that is about 7 inches wide
by 4 inches wide by 1 to 2 inches deep
Six-cup capacity measuring cup
A hard, flat surface for shaking the box
(I take a sturdy portable table with a hard top surface with me to the farm)
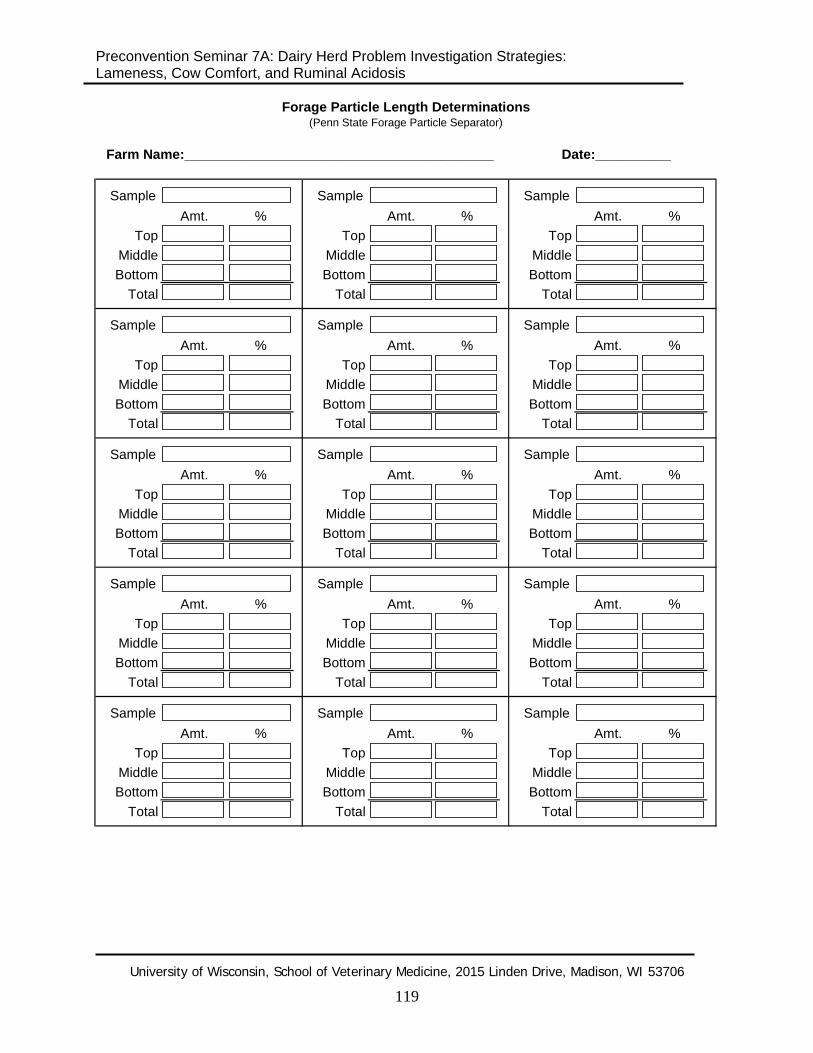
Form to record and calculate results (see attached)
Test Procedure: 1. Carefully sample the feed – make sure that the sample you are shaking down is representative of the
entire lot of feed.
2. Measure 6 cups of the forage to be tested. This is critical! We use a plastic, 6-cup kitchen measuring cup for this purpose.
3. Place the 6-cup sample on the top screen of the shaker box.
4. Shake the box a total of 40 times – 5 shakes, then rotate 90 degrees, 5 shakes again, etc. until you have rotated around the box twice (8 rotations times 5 shakes). Note that one shake is moving the box across and back again. Hold the box as flat as possible when shaking. Shake forcefully enough that the feed sample travels completely across the top of the first screen. Stroke length for each shake should be about 7 inches (17 cm) and 5 shakes should take about 5.5 seconds to complete (1.1 shakes per second).
Smaller particles in set haylages may adhere to long particles on the top screen. If this happens, gently separate the material on the top screen and shake the sample again. Do not include clumps of haylage on the top screen as long particles – either break them up by hand or discard them.
If long particles of forage tip up on end and fall into the next lower screen (or tray), you can manually move these particles back to the screen where they belong. For example, particles over 1.5 inches long should all be on the top screen. This is usually a small number of particles.
5. Weigh the amount of feed present on each of the 2 screens and on the bottom tray. Calculate the % coarse particles (% particles on the top screen). Also compare the amount of material on the middle screen to the amount of feed on the bottom tray – there should be more particles on the middle screen than the bottom tray for properly chopped feeds. All of these calculations are done on an as-fed basis – it is not necessary to correct the amounts for % dry matter.
6. Mean particle length can be calculated based on these results, but the calculations are difficult and not particularly useful.
University of Wisconsin, School of Veterinary Medicine, 2015 Linden Drive, Madison, WI 53706
117
Preconvention Seminar 7A: Dairy Herd Problem Investigation Strategies: Lameness, Cow Comfort, and Ruminal Acidosis
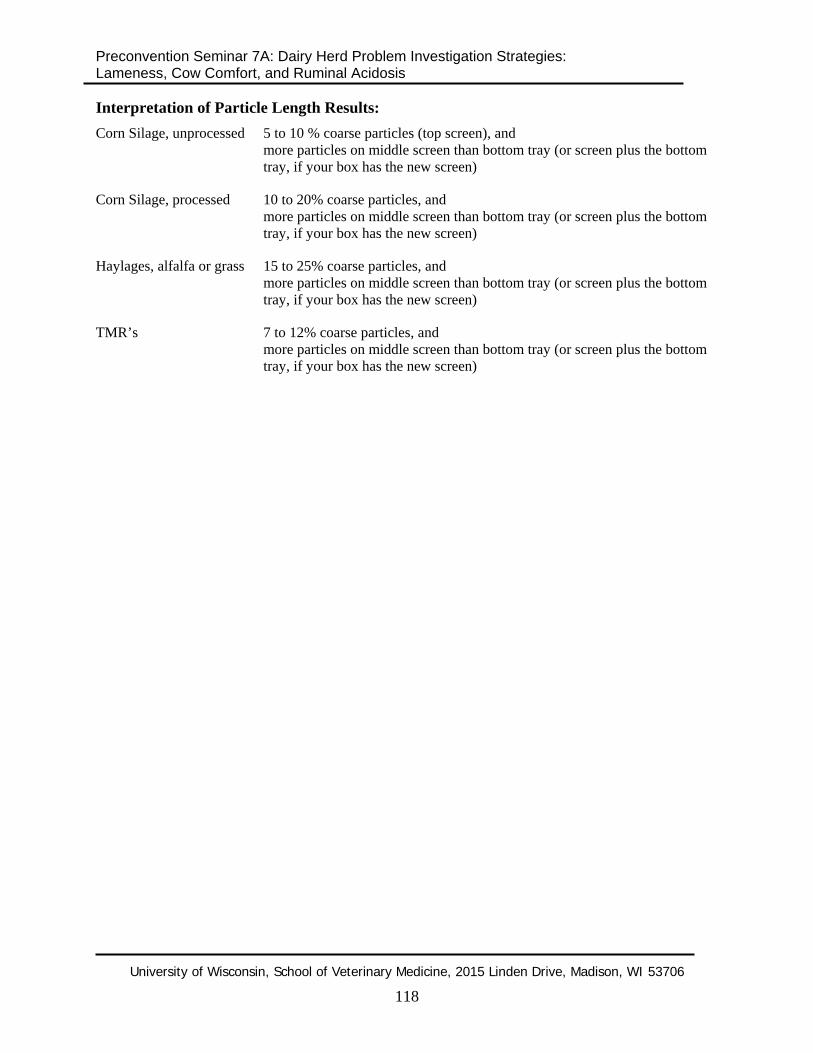
Interpretation of Particle Length Results: Corn Silage, unprocessed 5 to 10 % coarse particles (top screen), and more particles on middle screen than bottom tray (or screen plus the bottom
tray, if your box has the new screen)
Corn Silage, processed 10 to 20% coarse particles, and more particles on middle screen than bottom tray (or screen plus the bottom
tray, if your box has the new screen)
Haylages, alfalfa or grass 15 to 25% coarse particles, and more particles on middle screen than bottom tray (or screen plus the bottom
tray, if your box has the new screen)
TMR’s 7 to 12% coarse particles, and more particles on middle screen than bottom tray (or screen plus the bottom
tray, if your box has the new screen)
University of Wisconsin, School of Veterinary Medicine, 2015 Linden Drive, Madison, WI 53706
118
Preconvention Seminar 7A: Dairy Herd Problem Investigation Strategies: Lameness, Cow Comfort, and Ruminal Acidosis
Sample Sample SampleAmt. % Amt. % Amt. %
Top Top TopMiddle Middle MiddleBottom Bottom Bottom
Total Total Total
Sample Sample SampleAmt. % Amt. % Amt. %
Top Top TopMiddle Middle MiddleBottom Bottom Bottom
Total Total Total
Sample Sample SampleAmt. % Amt. % Amt. %
Top Top TopMiddle Middle MiddleBottom Bottom Bottom
Total Total Total
Sample Sample SampleAmt. % Amt. % Amt. %
Top Top TopMiddle Middle MiddleBottom Bottom Bottom
Total Total Total
Sample Sample SampleAmt. % Amt. % Amt. %
Top Top TopMiddle Middle MiddleBottom Bottom Bottom
Total Total Total
Forage Particle Length Determinations(Penn State Forage Particle Separator)
Farm Name:_________________________________________ Date:__________
University of Wisconsin, School of Veterinary Medicine, 2015 Linden Drive, Madison, WI 53706
119