Nutritional strategies to control ruminal acidosis in feedlot...
129
Universidad Politécnica de Madrid Escuela Técnica Superior de Ingeniería Agronómica, Alimentaria y de Biosistemas Nutritional strategies to control ruminal acidosis in feedlot cattle DOCTORAL THESIS Coral Carrasco Barco Ingeniero Agrónomo 2017
Transcript of Nutritional strategies to control ruminal acidosis in feedlot...

Universidad Politécnica de Madrid Escuela Técnica Superior de Ingeniería
Agronómica, Alimentaria y de Biosistemas
Nutritional strategies to control ruminal acidosis in feedlot cattle DOCTORAL THESIS
Coral Carrasco Barco
Ingeniero Agrónomo
2017


Departamento de Producción Agraria Escuela Técnica Superior de Ingeniería
Agronómica, Alimentaria y de Biosistemas
Nutritional strategies to control ruminal acidosis in feedlot cattle DOCTORAL THESIS
Coral Carrasco Barco
Ingeniero Agrónomo
Directores de la Tesis:
Mª Dolores Carro Travieso
Doctora en Veterinaria
Pedro Medel de la Torre
Doctor Ingeniero Agrónomo
2017
I

II


IV

Agradecimientos
Llegar hasta este momento de finalización de la Tesis Doctoral ha sido una carrera de fondo que me ha acompañado a lo largo de mi maduración tanto a nivel profesional como personal, acompañándome en la mochila en numerosos momentos clave de mi vida.
Todo empezó nada más presentar mi proyecto fin de carrera, cuando Carlos de Blas, (que de manera sutil, o quizá involuntaria, ha tenido la capacidad de llevarme a lo que soy ahora) comentó “dos artículos más y ya tienes la Tesis”. Si bien en aquel momento me pareció una idea imposible, en el fondo se quedó plantada una semilla que comenzó a germinar el día en el que Pedro Medel me encargó realizar el estado del arte del proyecto de investigación que, con el soporte de COPESE, ha dado lugar a este trabajo.
Recuerdo perfectamente aquel primer momento en el que visitamos la granja de terneras por primera vez y Javier Peinado dejó en mis manos el control de los ensayos. Llegar hasta el final de este proyecto hubiera sido imposible sin el apoyo tanto de mis compañeros de Imasde en aquellos momentos (Álvaro, Silvia, Jaime, Nacho y Fran), como de David del Pico, Marcos Nieto y Alfonso Fuentetaja de COPESE y, por supuesto, los profesores, investigadores y doctorandas del Departamento de Producción Animal I de la Universidad de León (Loli, Mariajo, Marisa, Eugenia, Silvia, Alfonso..) por su apoyo tanto en granja como en matadero, y especialmente en laboratorio.
Quedan atrás muchos días de frío, me atrevería a decir casi siberiano, donde antes de empezar los ensayos algún día nos encontramos a Javier Rincón descongelando tuberías a soplete; aquellos momentos en los que una ternera despistada nos hacía correr los San Fermines por los pasillos, o los madrugones para poder realizar los controles en matadero. Son muchas las anécdotas que quedan atrás, y guardo con buen sabor de boca, un poco de nostalgia, pero especialmente satisfacción por todo lo vivido y aprendido, junto con el sincero agradecimiento a todos los que me han acompañado en este camino. En este proceso de aprendizaje, cabe sin duda la mención especial a mis directores, Pedro y Loli que, sin prisa pero sin pausa, me han impulsado a finalizar este trabajo.
Los trabajos realizados en el marco de esta Tesis Doctoral han sido promovidos por Comercial Pecuaria Segoviana, SL (Coca, Segovia, Spain), y llevados a cabo en su granja experimental de terneros de cebo. Este proyecto ha sido financiado por el Ministerio de Industria Turismo y Comercio mediante el programa PROFIT (FIT060000200511) y el Centro para el Desarrollo Tecnológico Industrial (CDTI; IDI-20050617).
V

VI

A mi familia, por su apoyo incondicional e insistencia ocasional
VII

VIII
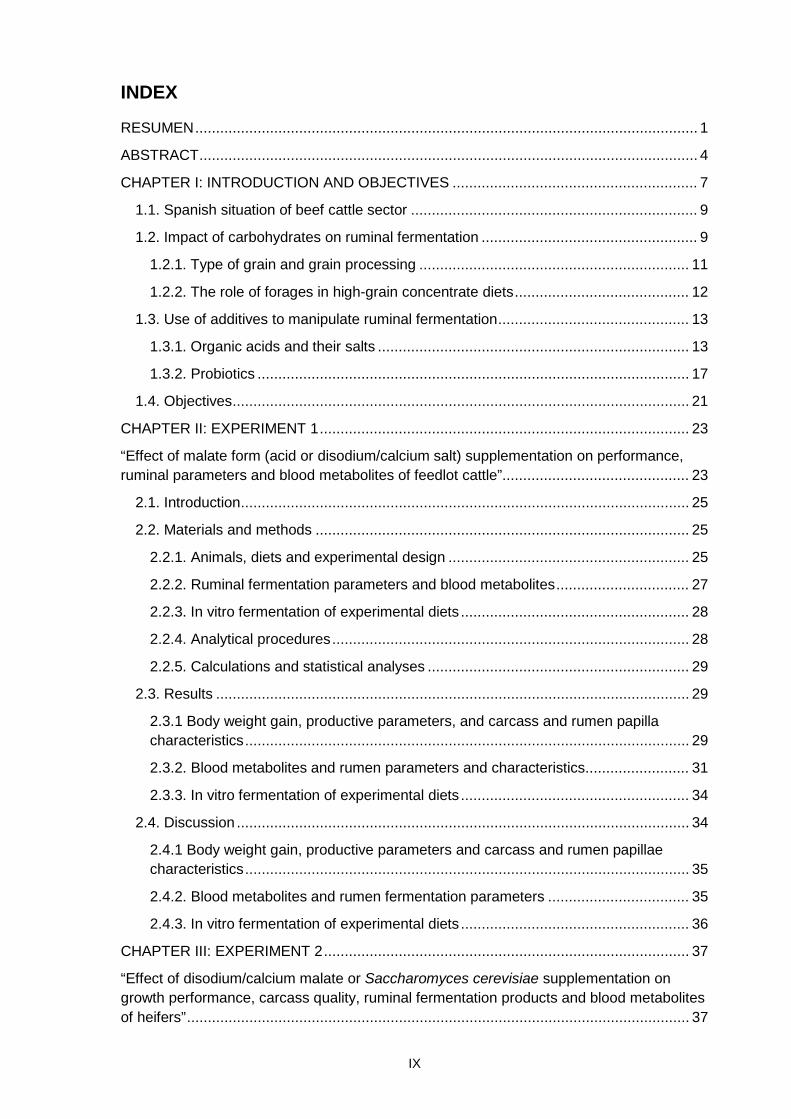
INDEX
RESUMEN ......................................................................................................................... 1
ABSTRACT ........................................................................................................................ 4
CHAPTER I: INTRODUCTION AND OBJECTIVES ........................................................... 7
1.1. Spanish situation of beef cattle sector ..................................................................... 9
1.2. Impact of carbohydrates on ruminal fermentation .................................................... 9
1.2.1. Type of grain and grain processing ................................................................. 11
1.2.2. The role of forages in high-grain concentrate diets .......................................... 12
1.3. Use of additives to manipulate ruminal fermentation .............................................. 13
1.3.1. Organic acids and their salts ........................................................................... 13
1.3.2. Probiotics ........................................................................................................ 17
1.4. Objectives .............................................................................................................. 21
CHAPTER II: EXPERIMENT 1 ......................................................................................... 23
“Effect of malate form (acid or disodium/calcium salt) supplementation on performance, ruminal parameters and blood metabolites of feedlot cattle”............................................. 23
2.1. Introduction ............................................................................................................ 25
2.2. Materials and methods .......................................................................................... 25
2.2.1. Animals, diets and experimental design .......................................................... 25
2.2.2. Ruminal fermentation parameters and blood metabolites ................................ 27
2.2.3. In vitro fermentation of experimental diets ....................................................... 28
2.2.4. Analytical procedures ...................................................................................... 28
2.2.5. Calculations and statistical analyses ............................................................... 29
2.3. Results .................................................................................................................. 29
2.3.1 Body weight gain, productive parameters, and carcass and rumen papilla characteristics ........................................................................................................... 29
2.3.2. Blood metabolites and rumen parameters and characteristics ......................... 31
2.3.3. In vitro fermentation of experimental diets ....................................................... 34
2.4. Discussion ............................................................................................................. 34
2.4.1 Body weight gain, productive parameters and carcass and rumen papillae characteristics ........................................................................................................... 35
2.4.2. Blood metabolites and rumen fermentation parameters .................................. 35
2.4.3. In vitro fermentation of experimental diets ....................................................... 36
CHAPTER III: EXPERIMENT 2 ........................................................................................ 37
“Effect of disodium/calcium malate or Saccharomyces cerevisiae supplementation on growth performance, carcass quality, ruminal fermentation products and blood metabolites of heifers” ......................................................................................................................... 37
IX

3.1. Introduction ............................................................................................................ 39
3.2. Materials and methods .......................................................................................... 39
3.2.1. Animals, diets and experimental design .......................................................... 39
3.2.2. Productive parameters and carcass characteristics ......................................... 40
3.2.3. Ruminal fermentation products and blood metabolites .................................... 42
3.2.4. Analytical procedures ...................................................................................... 42
3.2.5. Statistical analysis ........................................................................................... 42
3.3. Results .................................................................................................................. 43
3.4. Discussion ............................................................................................................. 46
CHAPTER IV: EXPERIMENT 3........................................................................................ 51
“Performance, carcass and ruminal fermentation characteristics of heifers fed concentrates differing in energy level and cereal type (corn vs. wheat)” ................................................ 51
4.1. Introduction ............................................................................................................ 53
4.2. Materials and methods .......................................................................................... 53
4.2.1. Animals, diets and experimental design .......................................................... 54
4.2.2. Data collection and carcass measurements .................................................... 56
4.2.3. Ruminal fermentation characteristics ............................................................... 56
4.2.4. In vitro fermentation of concentrates ............................................................... 57
4.2.5. Analytical procedures ...................................................................................... 57
4.2.6. Statistical analysis ........................................................................................... 58
4.3. Results .................................................................................................................. 58
4.3.1. Intake and growth performance ....................................................................... 58
4.3.2. Carcass characteristics ................................................................................... 59
4.3.3. Ruminal fermentation characteristics ............................................................... 60
4.3.4. In vitro fermentation characteristics ................................................................. 63
4.4. Discussion ............................................................................................................. 64
4.4.1. In vivo trial ....................................................................................................... 64
4.4.2. In vitro incubations .......................................................................................... 67
CHAPTER V: GENERAL DISCUSSION ........................................................................... 69
5.1. Introduction ............................................................................................................ 71
5.2. Composition of experimental diets ......................................................................... 71
5.2. Influence of experimental diets on ruminal fermentation variables and rumen wall characteristics .............................................................................................................. 72
5.3. Influence of the nutritional strategies evaluated on growth performance, concentrate intake, carcass characteristics and blood metabolites .................................................. 83
5.4. Comparison of in vivo and in vitro ruminal fermentation ......................................... 86
X

CHAPTER VI. CONCLUSIONS /CONCLUSIONES ......................................................... 91
6.1. Conclusions ........................................................................................................... 93
6.2. Conclusiones ......................................................................................................... 94
CHAPTER VII. REFERENCES ........................................................................................ 97
XI

TABLES AND FIGURES
Figure 1.1. Main factors involved in the development of lactic acidosis (Adapted from Nocek, 1997). ................................................................................................................... 10
Table 1.1. Degradation rate and theoretical degradability of different cereal grains (Bacha, 1991)................................................................................................................................ 11
Table 1.2. Influence of cereal grain processing on performance and feed intake of fattening calves (adapted from Owens et al., 1997). ......................................................... 12
Table 1.3. Effects of malate supplementation on feed intake, ruminal fermentation and performance of fattening cattle (adapted from Carro and Ungerfeld, 20151). .................... 16
Figure 1.2. Proposed mechanisms of action of yeasts cultures in ruminants (adapted from Carro et al., 2014). ........................................................................................................... 17
Table 1.4. Effects of S. cerevisiae yeast supplementation on feed intake, ruminal fermentation and performance of growing cattle1. ............................................................ 20
Table 2.1. Ingredients and chemical composition (g/kg DM) of the concentrate fed. ........ 26
Table 2.2. Effect of treatments on body weight (kg), average daily gain (ADG, kg/d), concentrate dry matter intake (DM, kg/d) and feed to gain ratio (F:G, kg/kg) of heifers during the experiment. ..................................................................................................... 30
Table 2.3. Effect of treatments on carcass parameters and rumen papilla characteristics in heifers at slaughter. .......................................................................................................... 31
Table 2.4. Effect of treatments on blood metabolites in heifers during the experiment. .... 32
Table 2.5. Effect of experimental treatments on ruminal fermentation parameters in heifers during the experiment. ..................................................................................................... 32
Table 2.6. Influence of malic acid or disodium/calcium malate on in vitro fermentation (17 h) of 120:880 straw:concentrate (DM) diets by mixed rumen microorganisms in batch cultures (400 mg of dry matter diet incubated/culture). ..................................................... 34
Table 3.1. Ingredients and chemical composition of the concentrates fed over the adaptation and experimental periods................................................................................ 41
Table 3.2. Concentrate intake, BW, ADG, and G:F in heifers fed 1 of the following high-grain diets: control (not supplemented; CON), control plus 4 g of disodium/calcium malate mixture (MAL), or control plus 0.15 g of Saccharomyces cerevisiae CBS 493.94 (YC). ... 43
Table 3.3. Carcass characteristics of heifers fed 1 of the following high-grain diets: control (not supplemented; CON), control plus 4 g of disodium/calcium malate mixture (MAL), or control plus 0.15 g of Saccharomyces cerevisiae CBS 493.94 (YC). ................................ 44
Table 3.4. Rumen fermentation characteristics in heifers fed 1 of the following high-grain diets: control (not supplemented; CON), control plus 4 g of disodium/calcium malate mixture (MAL), or control plus 0.15 g of Saccharomyces cerevisiae CBS 493.94 (YC). ... 45
Table 3.5. Blood metabolites in heifers fed 1 of the following high-grain diets: control (not supplemented; CON), control plus 4 g of disodium/calcium malate mixture (MAL), or control plus 0.15 g of Saccharomyces cerevisiae CBS 493.94 (YC). ................................ 46
Table 4.1. Ingredients and chemical composition of the experimental concentrates1 ....... 55
XII

Table 4.2. Effect of cereal type (CT) and energy level (EL) in the concentrate on body weight (BW), average daily gain (ADG), concentrate average daily intake (ADFI) and feed:gain ratio (F:G) of heifers during the experimental period1........................................ 59
Table 4.3. Effect of cereal type (CT) and energy level (EL) in the concentrate on carcass characteristics of heifers1. ................................................................................................ 60
Table 4.4. Effect of cereal type (CT) and energy level (EL) on ruminal fermentation characteristics of heifers over the experimental period1.................................................... 61
Table 4.4. Effect of cereal type (CT) and energy level (EL) on ruminal fermentation characteristics of heifers over the experimental period1 (continued) ................................. 62
Table 4.5. Effect of cereal type (CT) and energy level (EL) in the concentrate on rumen wall characteristics1. ......................................................................................................... 63
Table 4.6. Effect of cereal type (CT) and energy level (EL) on in vitro ruminal fermentation characteristics of the experimental concentrates after 17 h incubation1 ............................ 64
Figure 5.1. Level of inclusion of different cereal grains (corn, wheat, barley and wheat middlings) in the experimental concentrates used in this Thesis1. .................................... 72
Table 5.1. Chemical composition of experimental concentrates used in the three trials1. . 72
Figure 5.2. Ruminal pH values of heifers sampled by ruminocentesis between 2 and 2.5 h after the morning feeding at the beginning (Initial), middle (Mid) and the end (Final) of the trials1. ............................................................................................................................... 73
Figure 5.3. Evolution of ruminal pH of heifers sampled by ruminocentesis between 2 and 2.5 h after the morning feeding throughout of the trials1. .................................................. 74
Figure 5.4. Ruminal total volatile fatty acids (VFA) concentrations (mM) in heifers sampled by ruminocentesis between 2 and 2.5 h after the morning feeding at the beginning (Initial), middle (Mid) and the end (Final) of the trials1. .................................................................. 75
Figure 5.5. Evolution of ruminal VFA concentrations (mM) of heifers sampled by ruminocentesis between 2 and 2.5 h after the morning feeding throughout of the trials1. . 76
Figure 5.6. Relationship between ruminal pH and volatile fatty acid (VFA, mM) values measured in each control day per trial1. ........................................................................... 76
Figure 5.7. Ruminal lactate concentrations (mM) in heifers sampled by ruminocentesis between 2 and 2.5 h after morning feeding at the beginning (Initial), middle (Mid) and the end (Final) of the trials1. ................................................................................................... 77
Figure 5.8. Relationship between ruminal pH values and lactate concentration (mM) measured in each control day per trial1. ........................................................................... 78
Figure 5.9. Ruminal ammonia-N concentrations (mg/L) in heifers sampled by ruminocentesis between 2 and 2.5 h after morning feeding at the beginning (Initial), middle (Mid) and the end (Final) of the trials1. ............................................................................. 79
Figure 5.10. Relationship between total VFA (mM) and ammonia-N concentration (mg/L) measured in each control day per trial1. ........................................................................... 80
Figure 5.11. Relationship between pH and ammonia-N concentration (mg/L) measured in each control day per trial1. ................................................................................................ 80
Figure 5.12. Effect of experimental treatments on ruminal papilla color1. ......................... 81
XIII

Figure 5.13. Effect of experimental treatments on ruminal papilla length1. ....................... 82
Figure 5.14. Detail of damage in ruminal papilla. ............................................................. 82
Figure 5.15. Example of color and length differences in ruminal papilla. .......................... 83
Figure 5.16. Evolution of heifers body weight (BW, kg) throughout the experimental trials1.......................................................................................................................................... 84
Figure 5.18. Effect of experimental treatment on concentrate average daily intake (cADI, kg) along the trials1. ......................................................................................................... 85
Figure 5.19. Effect of experimental treatments on dressing proportion (%) and hot carcass weight (HCW, kg)1. ........................................................................................................... 86
Table 5.2. Effects of experimental treatments (P values of main effects) on ruminal fermentation parameters measured in vivo and in vitro. ................................................... 87
Figure 5.19. Relationship between ruminal pH values measured in the rumen of beef heifers (averaged values of three sampling times per treatment in each trial) and in 17 h in vitro fermentations1. ......................................................................................................... 88
Figure 5.20. Relationship between total volatile fatty acids concentrations measured in the rumen of beef heifers (averaged values of three sampling times per treatment in each trial) and in 17 h fermentations in batch cultures1. .................................................................... 89
Figure 5.21. Relationship between acetate/propionate ratio measured in the rumen of beef heifers (averaged values of three sampling times per treatment in each trial) and in 17 h fermentations in batch cultures1. ...................................................................................... 89
XIV

ABBREVIATIONS
ADF, acid detergent fiber
ADFI, average daily feed intake
ADG, average daily gain
aNDF, neutral detergent fiber with heat-stable amylase and expressed inclusive of residual ash
BR, breed
BW, body weight
cfu, colony forming units
CH4, methane
CON, control concentrate
CP, crude protein
DMI, dry matter intake
Expt., Experiment
F:G, feed to gain ratio
FM, fresh matter
G:F, gain to feed
HCW, hot carcass weight
MA, malic acid
MAL, disodium/calcium malate salt
N/A, not applicable
NDF, neutral detergent fiber
NE, net energy
NH3-N, ammonia nitrogen
OM, organic mater
P, probability
SARA, subacute ruminal acidosis
SEM, standard error of the mean
SPSS, IBM SPSS Statistics v. 19 software
XV

TM, time
TR, treatment
v/v volume per volume
VFA, volatile fatty acids
YC, Saccharomyces cerevisiae CBS 493.94
XVI

RESUMEN
El objetivo de esta Tesis ha sido estudiar la influencia de diferentes estrategias nutricionales sobre el control de la acidosis en terneros de cebo en un contexto experimental diseñado para representar el manejo nutricional predominante en España. Para ello, se llevaron a cabo tres ensayos experimentales que se describen a continuación.
El primer experimento se diseñó para evaluar el efecto de la inclusión de malato, administrado bien en forma de ácido libre o bien en forma de sal disódica/cálcica, en dietas de cebo de terneros sobre la productividad, la calidad de la canal, los parámetros ruminales y los metabolitos sanguíneos. Se emplearon 108 terneras (216 ± 30,3 kg de peso vivo), alojadas en 18 corrales de seis animales cada uno, durante un periodo experimental de cebo de 141 días. Se asignaron al azar seis corrales a cada tratamiento experimental. Los tratamientos experimentales fueron los siguientes: CON: concentrado control (sin aditivo); MA: concentrado CON más 1,08 kg/t de ácido málico (0,98 g de malato/g producto); y MAL: concentrado CON más 2 kg/t de una mezcla de malato disódico y cálcico (0,53 g de malato/g producto). Ambos aditivos se incluyeron para suministrar 1,1 g de malato por kg de concentrado. Los animales dispusieron de paja ad libitum durante toda la prueba. Se determinó el consumo de concentrado en materia seca (kg/corral) y el peso vivo individual cada 28 días. En los días 0, 84 y 141 de la prueba, se tomó una muestra de líquido ruminal mediante ruminocentesis y una muestra de sangre en la base del rabo de dos terneras por corral (12 por tratamiento). Al sacrificio, se registró el peso de la canal individual para determinar el rendimiento de la canal. También se llevó a cabo un estudio in vitro para analizar la fermentación ruminal de las tres dietas experimentales. Para ello, se inocularon los cultivos con líquido ruminal procedente de terneras alimentadas con la dieta CON y se incubaron durante 17 horas a 39ºC, determinándose posteriormente los principales parámetros de la fermentación ruminal (pH, producción de ácidos grasos volátiles y CH4, concentración de nitrógeno amoniacal y lactato, y la degradabilidad de la dieta). No hubo diferencias (P>0,05) entre tratamientos para el peso vivo, el consumo medio diario de de concentrado o la ganancia de peso vivo en ningún momento a lo largo del ensayo. Al sacrificio, tampoco hubo diferencias (P>0,05) en el peso de la canal caliente, su rendimiento o la clasificación de la canal. No hubo diferencias entre tratamientos en los valores de pH y las concentraciones de ácidos grasos volátiles y lactato, pero la concentración de nitrógeno amoniacal a los 84 días de prueba fue mayor para el tratamiento MAL (P>0,05) que para CON y MA. No hubo efecto de los tratamientos sobre los metabolitos sanguíneos (concentraciones de glucosa, lactato y nitrógeno ureico). En el estudio in vitro, no hubo diferencias entre tratamientos (P>0,05) para ninguno de los parámetros estudiados. Por lo tanto, bajo las condiciones de este experimento, la suplementación de MA o MAL no tuvo efecto en la productividad, los parámetros ruminales o los metabolitos sanguíneos de las terneras. Los resultados no se vieron influenciados por la forma de presentación del malato, bien como ácido libre o como sal disódica y cálcica.
El segundo ensayo se diseñó para estudiar los efectos de las sales de malato y de un cultivo de Saccharomyces cerevisiae en la productividad, la calidad de la canal, la fermentación ruminal y los metabolitos sanguíneos de terneras en cebo. Se emplearon 108 terneras cruzadas con Charolés (214 ± 27,3 kg de peso vivo), que se alojaron en 18 corrales de seis animales cada uno durante un periodo de cebo experimental de 114 días. Se asignaron al azar seis corrales a cada uno de los siguientes tratamientos: CON (sin
1

suplementación), MAL: CON más 4 g de una mezcla de malato disódico-cálcico por kg de concentrado (2,12 g de malato por kg), y YC: CON más 0,15 g de un cultivo de levadura (S. cerevisiae CBS 493.94; 1,5 x 10⁸ ufc/kg) por kg de concentrado. La dieta CON consistió en un concentrado basado en trigo y cebada (32% de almidón en materia seca) y paja de cebada, ambos administrados ad libitum. Los días 0, 56 y 114 se tomaron muestras de líquido ruminal y sangre de cada ternera a las 2 horas tras la administración del concentrado mediante ruminocentesis y extracción en la base de la cola, respectivamente. El peso vivo, el consumo medio diario y el índice de transformación (ganancia/consumo) se registraron a los 28, 56, 84 y 114 días del ensayo. Los animales se sacrificaron en un matadero comercial y se determinó el peso de la canal caliente, el rendimiento de la canal y su clasificación en dos terneras por corral (12 animales por tratamiento). También se llevó a cabo un estudio in vitro para analizar la fermentación ruminal de las tres dietas experimentales. Para ello, se inocularon los cultivos con líquido ruminal procedente de terneras alimentadas con la dieta CON y se incubaron durante 17 horas a 39ºC, determinándose posteriormente los principales parámetros de la fermentación ruminal. La suplementación con malato o YC no afectó (P>0,05) al consumo medio diario de concentrado, la ganancia media diaria o el índice de transformación a lo largo del ensayo. Tampoco hubo diferencias (P>0,05) entre tratamientos en el peso de la canal, su rendimiento y clasificación. No se detectaron diferencias entre tratamientos en el pH ruminal, las concentraciones ruminales de ácidos grasos volátiles, nitrógeno amoniacal y lactato, ni en las concentraciones plasmáticas de glucosa, nitrógeno ureico y lactato. En el estudio in vitro, no hubo diferencias entre tratamientos (P>0,05) para ninguno de los parámetros estudiados. En conclusión, bajo las condiciones de manejo y alimentación de este estudio, la suplementación con MAL o YC no tuvo ningún efecto significativo sobre los parámetros ruminales y sanguíneos, el rendimiento productivo ni la calidad de la canal.
Finalmente, el objetivo del tercer experimento fue evaluar la interacción entre el tipo de cereal (maíz vs. trigo) y el nivel de energía de la dieta sobre la productividad, la calidad de la canal y la fermentación ruminal en terneras en cebo. Para ello se emplearon 144 terneras (218 ± 26 kg de peso vivo) que fueron alojadas en 24 corrales (seis animales cada uno) durante un periodo experimental de cebo de 168 días. La prueba tuvo un diseño factorial con cuatro tratamientos en función de la composición de los concentrados, que fueron formulados con dos niveles energéticos (1.452 vs. 1.700 kcal EN/kg) y dos cereales principales (maíz vs. trigo). Las terneras recibieron los concentrados experimentales y paja de cereal administrados ad libitum. El consumo de concentrado y el PV se registraron a los 42, 84, 126 y 168 días del ensayo. Los días 1, 84 y 168 del ensayo se obtuvo líquido ruminal de tres terneras por corral mediante ruminocentesis, así como una muestra de sangre. Tras el sacrificio, se registró en las mismas terneras el peso de la canal y su clasificación, y se calculó el rendimiento de la canal. También se llevó a cabo un estudio in vitro para analizar la fermentación ruminal de las cuatro dietas experimentales. Para ello, se inocularon los cultivos con líquido ruminal procedente de terneras alimentadas con la dieta CON y se incubaron durante 17 horas a 39ºC, determinándose posteriormente los principales parámetros de la fermentación ruminal. Las terneras que recibieron las dietas de mayor nivel energético tuvieron un menor consumo (6,97 vs. 7,29 kg/d; P=0,011), un índice de conversión inferior (5,15 vs. 5,66 kg/kg; P=0,002) que aquellas que recibieron los concentrados de baja energía, y tendieron a ser más pesadas (P=0,069) a lo largo del ensayo. No se observaron diferencias (P>0,05) debidas al nivel energético en el rendimiento y clasificación de la canal, en el pH ruminal, ni en las concentraciones de ácidos grasos volátiles y de nitrógeno amoniacal en el rumen. Por otro lado, la concentración total de ácidos grasos volátiles tendió (P=0,070)
2

a ser mayor en las terneras alimentadas con las dietas basadas en maíz, que en las que recibían las dietas basadas en cebada. En el estudio in vitro, no hubo diferencias debido al tipo de cereal (P>0,05) para ninguno de los parámetros estudiados, mientras que las dietas de alta energía tuvieron una menor producción de gas y ácidos grasos volátiles, y un mayor pH que las dietas de baja energía. Por lo tanto, según los resultados de este ensayo, la administración de concentrados con niveles energéticos elevados redujo el consumo y el índice de conversión, pero tuvo efectos minoritarios sobre el rendimiento de la canal. Por otro lado, el tipo de cereal mayoritario en el concentrado no tuvo ningún efecto en la productividad o la fermentación ruminal, sin que se detectaran interacciones entre el tipo de cereal y el nivel energético.
3

ABSTRACT
The aim of this Thesis was to study the influence of nutritional strategies to control ruminal acidosis in feedlot cattle in an experimental context designed to resemble the predominant feeding practice in Spanish commercial feedlots. Therefore, three experiments were conducted, as summarized below.
The first experiment was designed to evaluate the effects of malate inclusion in feedlot cattle diets provided either as free acid or disodium/calcium salt form on performance, carcass quality, ruminal parameters and blood metabolites. A total of 108 heifers (216 ± 30.3 kg of body weight), housed in 18 pens of six animals per pen were used in a 141 d feedlot study. Six pens were randomly assigned to each of the following experimental diets: CON: control (no additive); MA: CON plus 1.08 kg/t of malic acid (0.98 g of malate/g product); and MAL: CON plus 2 kg/t of disodium/calcium malate (0.53 g of malate/g product). Both additives provided 1.1 g of malate/kg of concentrate (as mixed). Concentrate dry matter intake (kg/pen) and individual animal body weights were determined every 28 d. At 0, 84 and 141 d, ruminal fluid was obtained by ruminocentesis and blood samples were collected via tail venipuncture from two heifers per pen (12 per treatment). At slaughter, individual carcass weights were measured and carcass yield was determined. An in vitro study was also conducted to analyze ruminal fermentation of the three experimental diets. Batch cultures were inoculated with ruminal fluid from CON heifers incubated for 17 h at 39ºC, and main fermentation parameters were determined (i.e., pH, volatile fatty acids and CH4 production, ammonia-N and lactate concentrations, and diet degradability). There were no differences among groups in body weight, concentrate dry matter intake or body weight gain at any time during the experiment. At slaughter, there were no differences in hot carcass weight and yield or carcass classification among groups. There were no effects of treatments on ruminal parameters (i.e., pH and concentrations of volatile fatty acids and lactate), with the exception of NH3-N concentrations, which were higher (P<0.05) for MAL compared with CON and MA groups at 84 d of sampling. Blood metabolites (i.e., glucose, urea-N, lactate) were unaffected by treatments. In the in vitro study, there were no differences among diets in any parameter measured. Under the conditions of this experiment, supplementation with MA or MAL had no effect on animal performance, ruminal parameters or blood metabolites, and results did not depend on whether malate was administered as the free acid or as the disodium-calcium salt.
The second experiment was designed to study the effects of malate salts and Saccharomyces cerevisiae culture on growth performance, carcass quality, ruminal fermentation products, and blood metabolites in heifers. A total of 108 Charolaise cross heifers (214 ± 27.3 kg of body weight) were housed in 18 pens of six animals each and used in a 114-day feedlot study. Six pens were randomly assigned to each of the following experimental diets: control (not supplemented; CON); the control plus 4 g of disodium/calcium malate mixture (MAL) per kg of concentrate, providing 2.12 g of malate per kg of concentrate; and the control plus 0.15 g of Saccharomyces cerevisiae CBS 493.94 (YC) per kg of concentrate, providing 1.5 x 10⁸ cfu per kg of concentrate. The control diet consisted on wheat-barley based concentrate (32% starch, dry matter basis) and barley straw fed ad libitum. On days 0, 56 and 114, ruminal fluid and blood samples were obtained from each heifer 2 h after feeding by ruminocentesis and tail venipuncture, respectively. Body weight, average daily feed intake and gain to feed ratio were recorded at 28, 56, 84 and 114 days. At slaughter, hot carcass weight and yield and carcass
4

classification were determined in two heifers per pen (12 animals per dietary treatment). An in vitro study was also conducted to analyze ruminal fermentation of the three experimental diets. Batch cultures were inoculated with ruminal fluid from CON heifers incubated for 17 h at 39ºC, and main fermentation parameters were determined. Supplementation with malate salts or YC did not affect concentrate average daily feed intake, average daily gain or gain to feed ration at any time during the experiment. At slaughter, there were no differences in carcass weight, classification and yield among experimental groups. There were no differences among experimental groups on ruminal pH, concentrations of volatile fatty acids, urea-N and lactate, and plasma concentrations of glucose, urea-N and lactate. In the in vitro study, there were no differences among diets in any parameter measured. In conclusion, under the feeding and management conditions of this study, diet supplementation with malate salts or YC did not have any significant effects on ruminal parameters, blood metabolites, animal performance or carcass quality.
Finally, the objective of the third experiment was to assess the interaction of cereal type (corn vs. wheat) and energy level of the diet on growth performance, carcass quality and ruminal fermentation characteristics of beef cattle. A total of 144 beef heifers (218 ± 26.4 kg body weight) were housed in 24 pens (six animals each) and were used in a 168-day feedlot study. Four concentrates were formulated according to a 2x2 factorial arrangement of treatments with two energy levels (1,452 vs. 1,700 kcal of net energy/kg) and two main cereals (corn vs. wheat). Concentrate and straw were offered ad libitum. Concentrate intake and body weight were recorded on days 42, 84, 126 and 168. Ruminal fluid was obtained by ruminocentesis from three heifers per pen on days 1, 84 and 168; and carcass weight, classification and yield, were determined in the same animals after slaughter. An in vitro study was also conducted to analyze ruminal fermentation of the four experimental diets. Batch cultures were inoculated with ruminal fluid from CON heifers incubated for 17 h at 39ºC, and main fermentation parameters were determined. Heifers fed high-energy diets had lower intake (6.97 vs. 7.29 kg fresh matter/d; P=0.011), and lower feed to gain ratio (5.15 vs. 5.66 kg/kg; P=0.002) than those fed the low energy concentrates, and tended (P=0.069) to be heavier along the time. Neither carcass yield and classification, nor ruminal pH, volatile fatty acids nor NH3-N concentrations were affected (P>0.05) by energy level. Total volatile fatty acids concentration tended (P=0.070) to be greater in heifers fed corn-based than wheat-based concentrates. No energy level x cereal type interactions were observed. There were no differences due to cereal type in any of the variables determined in vitro incubations, while the fermentation of high-energy concentrates resulted in lower gas and total volatile fatty acid production, and in greater pH, than the low-energy concentrates. These results indicate that high energy concentrates decreased feed intake and feed conversion but had minor effects on carcass performance. Cereal type had no effects on performance and ruminal fermentation and no interactions between cereal type and energy were detected.
5

6

CHAPTER I: INTRODUCTION AND OBJECTIVES
7

Chapter I: Introduction and objectives
8

Chapter I: Introduction and objectives
1.1. Spanish situation of beef cattle sector
Spain produced 626,104 tons of beef in 2015, which accounted for the 6% of final agricultural production (MAGRAMA, 2015), being the fifth European beef producer after France (1,450,000 t), Germany (1,120,000 t), United Kingdom (883,230 t) and Italy (788,280 t). About 80% of Spanish beef production comes from animals with carcass weights ranging from 240 to 350 kg and from 8 to 24 month of age.
Spanish beef cattle production differs from other European countries in the rearing management, and in the feeding management. A large part of Spanish beef production is based on feeding cereal concentrates and straw ad libitum in separate feed-bunks, with the concentrate accounting for more than 85% of total dry matter intake (DMI; Gimeno et al., 2014; Verdú et al., 2015). This feeding system is usual in Spain and other Mediterranean countries due to climate conditions, as climate do not allow enough forage areas were animals could graze. In general, the production system is based on fattening calves from dairy breeds (mainly Holstein-Friesian), pure autochthonous breeds (Avileña-Negra Ibérica, Rubia Gallega, Asturiana, Pirenaica, Morucha) or cross-breeds with Limousine and Charolaise, with cross-breeding calves being about 54% of the total (MAGRAMA, 2015).
Feeding high-concentrate diets favors beef growth, but an excessive amount of rapidly fermented starch could result in subacute ruminal acidosis (SARA), which is commonly stated as a reduction in ruminal pH below 5.8, mainly due to volatile fatty acids (VFA) and lactate accumulation in the rumen (Calsamiglia et al., 2012). Therefore, this intensive feeding system requires a good control of ruminal fermentation, with special attention to the prevention of SARA. This metabolic disease can reduce the absorption of VFA over an extended period of time (Krehbiel et al., 1995) due to abnormal keratinization of ruminal epithelium, reducing the contribution of VFA to energy and precursors supply. Moreover, animals experiencing SARA usually reduce feed intake, impairing growth rate. These changes not only cause economic losses due to decreased production, but also health and animal welfare problems (Calsamiglia et al., 2012). The challenge for beef cattle farmers is to implement feeding practices to reduce the incidence of SARA while maintaining high levels of productivity. The purpose of this chapter is to review some factors that influence the incidence of SARA and to analyze nutritional strategies to prevent or reduce its incidence.
1.2. Impact of carbohydrates on ruminal fermentation
Most of the organic components of high-concentrate diets are degraded and fermented in the rumen, producing VFA which are absorbed through rumen wall. The amount and variety of VFA produced depends on the type of carbohydrates in the diet and its degradation rate. Thus, structural carbohydrates are degraded more slowly than non-structural carbohydrates and acetate is the main final product, whereas non-structural carbohydrates (mainly starch) are fermented faster by amylolytic bacteria and produce high amounts of propionate. Acetate is used by the host ruminant as an energy source and as a precursor for the synthesis of fatty acids, and propionate is mainly used to synthetize glucose in the liver (Van Soest, 1994). Therefore, the source of carbohydrates in the diet has a great influence on ruminal fermentation. Moreover, the structure and composition of cereal starch and the physical interactions between starch and protein can influence the digestibility and feeding value of cereal grains for ruminants (Rooney and Pflugfelder,
9

Chapter I: Introduction and objectives
1986). For example, ruminal degradation of starch from corn grain is limited by its vitreousness, which reflects the association between starch and protein in the endosperm. In the vitreous endosperm, starch granules are surrounded by proteins and embedded in a dense matrix that limits the accessibility of microbial enzymes to starch (Corona et al., 2006). In contrast, the protein matrix of wheat is more diffuse and does not hamper the access of ruminal microbes to starch granules (McAllister et al., 2006). Although the endosperm in different wheat types may differ in hardness, in general all wheat types are digested more rapidly than corn in the rumen (Yang et al., 2014).
The massive supply of readily fermentable carbohydrates in the diet stimulates the growth of amylolytic bacteria, mainly Streptococcus bovis. S. bovis is not the only responsible for the breakdown of carbohydrates, but has great importance because lactate is its main fermentation product, and also competes with amylolytic bacteria (Asanuma and Hino, 2002). At low concentrations, lactate can be metabolized by Gram negative bacteria, mainly Megasphaera elsdenii and Selenomonas ruminantium lactilytica, avoiding lactate accumulation. However, M. elsdenii and S. ruminantium growth rate is lower than that of S. bovis, so the supply of diets rich in rapidly fermentable carbohydrates can result in lactate accumulation in the rumen and a sudden decrease in pH (Russell and Hino, 1985; Russell and Strover, 1989). If the pH drops below 5.6 Gram negative bacteria cannot growth, whereas S. bovis and Lactobacillus spp. continue growing and producing lactate which is accumulated in the rumen (Goad et al., 1998). This change in rumen microbiota can take place in only 24 h (Dawson and Allison, 1988). If the supply of high fermentable carbohydrates is maintained, ruminal pH continues falling and S. bovis growth becomes inhibited, being Lactobacillus spp. the predominant species. Ruminal fermentation is then reduced, with a concomitant decrease in rumen motility and saliva production (Lana et al., 1998), and absorption of D-lactate through the rumen wall is increased (Figure 1.1).
Figure 1.1. Main factors involved in the development of lactic acidosis (Adapted from Nocek, 1997).
10

Chapter I: Introduction and objectives
Subclinical acidosis problems have been very effectively controlled in the past by the addition of monensin (especially in the countries that use concentrated-based diets), which had additional advantages such as increasing fermentation efficiency, and reducing the production of methane, a potent greenhouse gas. However, the use of monensin is banned in the European Union since January 2006, making necessary to develop strategies to overcome the effect of removing this product from ruminant diets. Moreover, diets designed for fattening cattle not only should meet the nutritional requirements of the animals, but also should promote propionate production maintaining the optimal ruminal function. The type and processing of cereals and forage are key factors to reduce the risk of subclinical acidosis, and therefore their influence on ruminal fermentation is briefly described below.
1.2.1. Type of grain and grain processing
One of the main factors to take into account when formulating diets for beef cattle is the total amount of starch, but also ruminal degradability of cereal grains is equally important. Bacha (1991) evaluated the in situ rate of disappearance of dry matter of different cereals and observed that triticale showed the highest rate, followed by wheat, barley, oats, rye and rice. The slowest degradation rate was showed by maize and sorghum. High degradation rates were associated with high theoretical degradability (84.4% on average) for the first 5 cereals; while corn and sorghum showed a theoretical degradability lower than 59% (Table 1.1.).
Table 1.1. Degradation rate and theoretical degradability of different cereal grains (Bacha, 1991).
Cereal Degradation rate (%·h-1) Theoretical degradability (%) Triticale 0.350 88.70 Wheat 0.302 90.08 Barley 0.205 82.72 Oats 0.190 70.70 Rye 0.115 89.21 Rice 0.110 85.79 Corn 0.058 58.35 Sorghum 0.040 47.47
In general, most cereal grains bypass the rumen undigested when they are administered unprocessed (whole grains), but physical and/or chemical treatments of grains can increase starch fermentation in the rumen (Hutcheson, 2007). The most frequently treatments are grinding, pelleting, dry or steam rolling, reconstituted or high-moisture. Nonetheless, each grain has its own structural characteristics and types of starch, and therefore not all of them respond similarly to the different treatments. Table 1.2. shows the influence of cereal grain processing on performance and feed intake in fattening calves (Owens et al., 1997). The physical-chemical treatment of barley and oat grains did not affect either the average daily gain (ADG) or feed intake of calves. In contrast, feeding steam rolled wheat improved feed utilization compared to dry rolled wheat. Steam rolled maize and milo (sorghum) also improved feed utilization compared to the other treatments studied (dry rolled, high- moisture, whole or reconstituted), whereas administration of dry rolled corn and milo grains did not affect the ADG but reduced the
11

Chapter I: Introduction and objectives
feed efficiency compared with whole grains (-12% and -17% for corn and milo, respectively). Grinding cereal grains reduces particle size and increases degradation rate, but the magnitude of these effects on starch utilization is generally greater for corn than for wheat, due to disruption of the protein matrix which encapsulates the corn starch granules (McAllister et al., 1993). In this sense, Liu et al. (2016) reported that corn starch in particles smaller than 1 mm was extensively fermented in the rumen, whereas wheat starch was highly fermented in particles smaller than 2 mm.
Table 1.2. Influence of cereal grain processing on performance and feed intake of fattening calves (adapted from Owens et al., 1997). Item and grain form Barley Corn Milo Oats Wheat Average daily gain (kg/d)
Dry rolled 1.45 1.45ª 1.43ª 1.53 1.38 High-moisture - 1.37b 1.29b - - Steam rolled 1.33 1.43ª 1.40ab 1.48 1.38 Whole 1.38 1.45ª - - - Reconstituted - - 1.31ab - - SEM1 2.43 1.29 1.45 0.52 1.74
Dry matter intakes (kg/d) Dry rolled 8.96 9.45ª 10.47ª 9.20 8.97ª High-moisture - 8.72b 9.15b - - Steam rolled 8.25 8.35c 8.56c 9.12 8.10b Whole 9.30 8.56bc - - - Reconstituted - - 8.79bc - - SEM1 23.55 37.34 22.82 1.08 48.37
Feed efficiency (feed/gain) Dry rolled 6.25 6.57ª 7.43ª 6.01 6.59ª High-moisture - 6.43b 7.12b - - Steam rolled 6.19 5.87c 6.33c 6.18 5.92b Whole 6.66 5.95bc - - - Reconstituted - - 6.75bc - - SEM1 48.06 21.91 34.37 5.07 14.87
a, b, c Means within a column with different superscripts differ (P<0.05). 1 Standard error of the mean.
1.2.2. The role of forages in high-grain concentrate diets
As commented before, in the traditional Spanish beef fattening system the intake of high-grain concentrates usually reaches over 85% of total DMI. Cereal straw is fed ad libitum in order to maintain the rumen function and to reduce the impact of the high availability of starch (Gimeno et al., 2014), as straw promotes chewing and salivation and contributes to maintain the buffering capacity of the rumen. However, straw intake is generally low (below 12% of total DMI; Devant et al., 2000; Gimeno et al., 2014; Iraira et al., 2015), and related to the necessary quantity to maintain rumen functionality.
Straw is usually fed ad libitum separately from the concentrate, but the form of straw supply (either separately from the concentrate or mixed together as a total mixed diet) can affect ruminal fermentation. Gimeno et al. (2014) studied the effect of feeding concentrate and straw either separately or mixed in form of briquettes on the pattern of intake, growth and rumen pH of beef cattle fed high concentrate diets, and observed that animals fed the briquettes had lower ruminal pH compared with those receiving straw and concentrate separately (daily average of 5.98 vs. 6.33, respectively; P=0.034) and tended
12

Chapter I: Introduction and objectives
to have lower total feed intake (7.08 vs. 9.77 kg of dry matter; DM), and ADG (1.43 vs. 1.76 kg/d, respectively).
Although cereal straw could help to maintain ruminal pH and reduce the risk of acidosis, it is not as effective as feeding low starch concentrates or high-forage diets, such as the typical diets frequently used in Northern Europe countries. Jorgensen et al. (2007) observed that feeding bull calves high-starch concentrates and straw tended (P<0.10) to decrease ruminal pH by 0.18 and increase (P<0.05) the period of time in which pH was below 5.8 in 4 h, compared with feeding low-starch concentrates and grass hay ad libitum (P<0.05). However, some authors have questioned the need of forage supply in high-grain concentrate diets, as it increases production costs (Faleiro et al., 2011) and complicates feeding management (Brown et al., 2006). Faleiro et al. (2011) reported that the supply of concentrate (31% barley and 32% corn) without barley straw reduced (P=0.001) the average ruminal pH from 6.09 to 5.46, affected VFA concentration and profile, and increased stereotypic behaviors, but did not affect DMI, ADG and carcass characteristics of growing heifers. On the contrary, Devant et al. (2015) observed a decrease in ADG of calves when straw was suppressed in high concentrated diets containing 35% corn, 19% barley and 8% wheat; being the decrease higher when the concentrate was supplied in the form of pellets compared to mash. For both concentrate forms, the suppression of straw increased stereotypic behaviors, decreased rumination and increased the fusion of ruminal papillae. Therefore, it seems that forage is needed in high-grain concentrate diets to maintain performance, good animal welfare, and ruminal health. Suppressing forage in this type of diets would result in a higher risk of ruminal pathologies that could have a negative impact in growth performance.
1.3. Use of additives to manipulate ruminal fermentation
In the last two decades, many research efforts in the field of ruminant nutrition within the European framework have focused on identifying alternatives to ionophore antibiotics to prevent the incidence of ruminal acidosis in intensive rearing systems. The main lines of research are related to organic acids and their salts, probiotics and plant extracts, with special emphasis on essential oils. The mode of action and influence on animal performance of the two types of feed additives investigated in this Thesis (organic acids and probiotics) will be reviewed in the next sections.
1.3.1. Organic acids and their salts
Organic acids are found naturally in biological tissues, as they are intermediates in metabolic cycles and some of them are also produced in the digestive tract of animals during the fermentation processes (Caja et al., 2003). Organic acids are frequently used as antimicrobial additives in non-ruminant animals feeding to change the composition of gut microbiota. In ruminants, most research has focused on malate and fumarate, both of which are intermediates in the tricarboxylic acid cycle and in the randomizing pathway of propionate production in the rumen (Carro and Ungerfeld, 2015).
Both malate and fumarate stimulate the growth of ruminal bacteria, especially Selenomonas ruminantium, which represents up to 51% of the viable bacteria in the rumen of animals fed high-concentrate diets (Caldwell and Bryant, 1966). The subspecie S. ruminantium lactilytica is able to ferment lactate and to use it as an energy source (Scheifinger et al., 1975; Stewart and Bryant, 1988) through the succinic pathway, in which malate and fumarate are intermediate metabolites (Gottschelk, 1986). Malate also may act
13

Chapter I: Introduction and objectives
as an electron sink for hydrogen, which increases lactate utilization by S. ruminantium (Nisbet and Martin, 1991; Martin and Park, 1996). The addition of fumarate and malate to pure cultures of S. ruminantium (up to a concentration of 10 mM) doubled the growth of this bacteria and stimulated lactate uptake, but these organic acids did not promote the growth of S. ruminantium in the absence of lactate (Nisbet and Martin, 1990; 1993). Supplying malate and fumarate, or their sodium salts, to semi-continuous flow (Rusitec) fermenters resulted in decreased lactate concentrations and increased ruminal pH (Carro et al., 1999; Lopez et al., 1999; Carro and Ranilla, 2003). Some studies (reviewed by Carro and Ungerfeld, 2015) have also reported a decrease in methane production as a consequence of malate and fumarate supplementation, which can result in higher fermentation efficiency and reduced environmental impact due to the greenhouse effect of methane.
Management of free acids is problematic as they are corrosive substances and can lower ruminal pH (Asanuma et al., 1999; Liu et al,. 2009), and salts have the advantages of being non-abrasive and safer to manipulate, although they are usually more expensive (Carro and Ungerfeld, 2015). An in vitro study performed by Martin and Streeter (1995) showed that the effect of free malic acid in the rumen was similar to that of disodium malate, although differences in chemical structure might imply different effects on ruminal fermentation. Free acids provide protons to the medium, which could decrease ruminal pH, whereas the contribution of the sodium cation in the salts can help to increase the pH (Castillo et al., 2004). Nisbet and Martin (1994) reported a synergistic action of both forms of malate, and observed that sodium concentrations between 25 and 100 mM stimulated consumption of L-lactate in the presence of S. ruminantium and 10 mM of malate ion. Castillo et al. (2007) performed an in vivo study comparing the effects of malate forms (malic acid or disodium salt) on performance of feedlot bull calves. Although these authors did not find differences in productive parameters, observed that only malate salts were able to counteract the natural decrease in blood pH. However, to our knowledge no other studies have investigated the possible differences between malic acid and its salts when used as feed additives.
The effects of malate supplementation on feed intake and performance of beef cattle reported in the literature have been inconsistent. The Table 1.3. summarizes the results of some in vivo studies. The results indicate that malic acid or malate salts at inclusion rates up to 25 g per kg of diet DM had no negative effects on feed intake in beef cattle (Kung et al., 1982; Martin et al., 1999; Montaño et al., 1999; Castillo et al., 2007; Liu et al., 2009; Vyas et al., 2015). However, it seems that higher doses of malic acid can depress feed intake; thus, Foley et al. (2009) reported that malic acid supplied at 50 and 75 g per kg of diet DM reduced DMI in steers fed grass silage and concentrate.
The effects of malate on beef cattle performance have also been variable. Martin et al. (1999) reported that supplementing malic acid at rates of 5.2 and 10.4 g/kg DM to feedlot steers fed a corn-based diet significantly improved ADG and feed to gain (F:G) ratio the first 10 days of the fattening period. In contrast, no effects of either malic acid or malate salts on ADG and F:G ratio were observed by Castillo et al. (2007) using lower doses of malic acid or malate salts (2 g/kg DM). No effects of malic acid or malate salts on hot carcass weight and dressing proportion have been observed in steers (Martin et al., 1999). The effects of malate on ruminal fermentation have been inconsistent. Some authors have reported increases in ruminal VFA concentrations when supplementing malate to steers (Kung et al., 1982; Martin et al., 1999; Khampa et al., 2006; Liu et al.,
14

Chapter I: Introduction and objectives
2009), but others (Montaño et al., 1999; Vyas et al., 2015) reported no effects or even a decrease in total VFA concentrations (Foley et al., 2009). Malate supplementation has generally resulted in increased proportions of propionate (Kung et al., 1982; Khampa et al., 2006; Liu et al., 2009) and sometimes butyrate (Liu et al., 2009). Moreover, it has been suggested that malic acid and malate salts could selectively stimulate or inhibit the activity of specific ruminal microbes at some concentrations (Liu et al., 2009). Martin et al. (1999) showed that malate supplementation prevented a marked drop of ruminal pH after feed ingestion, but concentrations of propionate, butyrate and L-lactate were not affected. Vyas et al. (2015) also reported that malic acid supplementation reduced the amount of time that the ruminal pH was under 6.2 in comparison to unsupplemented animals and those receiving the same doses of fumaric acid.
Few studies have assessed the effects of malate supplementation on plasma metabolites. Martin et al. (1999) and Montaño et al. (1999) reported no effects of malic acid on plasma concentrations of glucose, L-lactate and urea-N in steers. In contrast, Castillo et al. (2007) found that supplementing malic acid or a mixture of disodium and calcium malate at 4 g per kg of concentrate to feedlot bulls in the finishing period lowered plasma L-lactate concentrations compared to unsupplemented bulls. In a study from the same group, Hernández et al. (2011) observed that supplementing finishing bull calves with free malic acid or disodium/calcium malate salts at 4 g/kg DM diet lowered plasma concentrations of L-lactate, urea–N and creatinine.
The number of studies conducted with fumarate as feed additive is lower than that involving malate, and many studies were focused on the potential of fumarate to reduce methane production. Some studies in different animal species have reported that fumarate can reduce feed intake (McGinn et al. 2004; Beauchemin and McGinn, 2006; Molano et al., 2008), but others have observed no effect (Vyas et al., 2015). McCourt et al. (2008) and Wood et al. (2009) administered to fattening lambs 113 and 100 g of encapsulated fumaric acid per kg DM, respectively, and observed no change in feed intake. However, Molano et al. (2008) observed a decrease in DM intake when supplementing lambs with free fumaric acid at 80 and 100 g/kg DM. These results suggest that encapsulation may be a useful procedure for administering high doses of organic acids to ruminants avoiding negative effects on feed intake (Carro and Ungerfeld, 2015).
Supplementation of fumarate to steers at doses ranging from 12 to 50 g/kg DM did not affect diet digestibility (Bayaru et al., 2001; McGinn et al., 2004; Beauchemin and McGinn 2006). In contrast, Yu et al. (2010) observed that sodium fumarate supplementation (10 g/kg DM) increased diet digestibility in goats, and Isobe and Shibata (1993) reported that including fumaric acid (5 g/kg DM) in the diet of goats increased the in situ dissapearance of diet at short incubation times. To our best knowledge, no studies have analyzed the influence of fumarate supplementation on beef cattle performance. Beauchemin and McGinn (2006) administered daily 175 g of fumaric acid to growing beef cattle and observed no effects on methane production, but fumaric acid decreased DMI and increased total VFA concentrations and molar proportions of acetate and propionate in the rumen. Recently, Vyas et al. (2015) administered fumaric acid to finishing crossbred heifers at low (61 g/d) or high (125 g/d) dosage and observed no effects on DM intake, ruminal pH, or total VFA concentrations and individual VFA profile. Inconsistences in the response to malate and fumarate supplementation may be explained by variations in the dose and form (free acid vs. salts), growth rate and age of the animal, diet composition, and farming conditions, among other factors (Carro and Ungerfeld, 2015).
15

Chapter I: Introduction and objectives
Table 1.3. Effects of malate supplementation on feed intake, ruminal fermentation and performance of fattening cattle (adapted from Carro and Ungerfeld, 20151).
Reference Additive
and dose2 Animal and
duration Diet Results3 Kung et al. (1982)
MA, 13.2 or 26.0 g/kg DM
Steers (Holstein), 47 days
49:49:3 whole-shelled corn: corn silage: supplements
No effects on DMI, diet digestibility, plasma concentrations of urea–N. MA increased ruminal concentrations of total VFA and propionate
Martin et al. (1999)
MA, 5.2 or 10.4 g/kg DM
Beef steers (Angus and crossbred), 10 d step-up period, 52-day finishing study, 113-day study
Rolled corn-based diet, included ionophores
MA linearly increased ADG and F:G ratio in a 10-day period, but had no effects in the 52-d and 113-day studies. No effects on carcass characteristics and plasma metabolites (glucose, urea–N, cholesterol, triglyceride, and lactate)
Montaño et al. (1999)
MA, 26.4 g/kg DM
Holstein steers, 14 d
Steam-flaked barley-based diet
No effects on diet digestibility, rumen concentrations of total and individual VFA, plasma lactate concentrations and microbial N flow to the duodenum. MA increased ruminal pH at 2 h post-feeding
Castillo et al. (2007)
MA, 2 g/kg DM; DCM, 2 g/kg DM
Beef calves (Belgian Blue), 148 days
Barley-based concentrate ad libitum and straw
No effects on ADG and F:G ratio. Both MA and DCM decreased plasma lactate concentrations in the first week
Khampa et al. (2006)
SM, 1.7, 3.4, or 5.1 g/kg DM
Dairy steers (Holstein– Friesian crossbred), 21 days
Urea-treated rice straw ad libitum and concentrate (1.5 % of BW)
No effects on DMI and diet digestibility. SM linearly increased N retention, ruminal pH and concentrations of NH3 -N, total VFA and propionate. SM linearly decreased acetate and acetate to propionate ratio
Foley et al. (2009)
MA, 25, 37.5, 50 or 75 g/kg DM
Beef heifers (Charolaise cross), 28 d Beef steers (Friesian), 28 d
Grass silage and pelleted concentrate (40:60).
MA linearly decreased DMI and methane production in beef heifers. Increasing MA supply decreased linearly concentrations of total VFA
Liu et al. (2009)
MA, 7.8, 15.6, or 23.4 g/kg DM
Beef steers (Chinese Simmental), 21 days
Corn stover and concentrate (60:40)
No effects on DMI. MA linearly increased diet digestibility and total VFA concentrations in the rumen. MA linearly decreased ruminal pH, and concentrations of NH3 -N and lactate
16

Chapter I: Introduction and objectives
Reference Additive
and dose2 Animal and
duration Diet Results3 Vyas et al. (2015)
MA 5.9 or 13.4 g/kg DM
Hereford crossbred heifers, 28 d adaptation, and 14 d experiment
Rolled barley plus barley grain and complement. No ionophore was included
No effect was observed on DMI. MA lowered the amount of time that ruminal pH was <6.2, with no differences on average pH and total VFA concentrations
1Only studies describing diet composition and malic acid or malate dose were included. 2 DCM: disodium / calcium malate; MA: malic acid; SM: sodium malate. 3 ADG: average daily gain; BW: body weight; DMI: dry matter intake, F:G: feed-to-gain ratio; VFA: volatile fatty acids.
1.3.2. Probiotics
Probiotics can be defined as living bacteria that, when administered in adequate amounts, confer a health benefit on the host (FAO/WHO, 2001). The aim of using probiotics as feed additives in cattle is to modify the gut microbial populations, in order to improve feed digestibility, yields or animal health status (Álvarez and Carro, 2005). There are three main types of probiotics that can be used as feed additives for ruminants: live bacteria; live yeasts; and fungi extracts containing the culture medium and its fermentation products. The microbes used as probiotics are not natural inhabitants of the rumen, but they are able to stimulate the growth and viability of ruminal microbes, especially bacteria, by increasing their numbers and intensifying their metabolic activity, which can lead to an increase in animal performance (Figure 1.2.).
Figure 1.2. Proposed mechanisms of action of yeasts cultures in ruminants (adapted from Carro et al., 2014).
Use of starch and sugars
↓ lactate concentrations
↓ O2 levels
Stabilization of ruminal pH
↑ growth and activity of cellulolytic bacteria
↓ acidosis risk
Increased feed intake and nutrient supply
Supply of growth factors for ruminal
microbes
↓ NH3-N levels ↑ duodenal flow of microbial protein
↑ fiber degradation ↓ H2 levels
↓ CH4 production
RUMEN
17

Chapter I: Introduction and objectives
Most research on probiotics as feed additives for ruminants has been focused on Saccharomyces cerevisiae. S. cerevisiae has been reported to stimulate lactate utilization by S. ruminantium and M. elsdenii (Callaway and Martin, 1997) and to produce malate which stimulates the growth of these two lactate-utilizing bacteria (Nisbet and Martín, 1991; Rossi et al., 1995; Chaucheyras-Durand et al., 2012). As a consequence, S. cerevisiae supplementation can contribute to prevent a drop in rumen pH and reduce the risk of acidosis.
When feeding live yeast, it should be taken into account that about 30-40% of live yeasts which enter into the rumen rapidly show signs of autolysis (Lyons, 1987), and therefore the effective population will be about 60-70% of the dosage. Moreover, yeasts have no replication capacity in the rumen and remain active for a maximum period of 48 h (Kung et al., 1997). Therefore, a continuous yeast administration is required to achieve their beneficial effects on ruminal fermentation. However, it is not still known whether the viability of the active yeast is critical for its beneficial effects (Vyas et al., 2014a), as other compounds present in yeast cultures, such as amino acids and B-group vitamins, have also been reported to exert a probiotic effect (Chaucheryas et al., 1995, 1996), stimulating the growth rate of bacteria such as M. elsdenii and fungi such as Neocallimastix frontalis. This mechanism of action increases the cellulolytic activity that allows digesting some of the most resistant fibrous feed components. On the other hand, live yeasts can utilize oxygen in the rumen, thus favoring the anaerobiosis conditions needed by the cellulolytic bacteria (Newbold et al., 1996). The increased growth of bacterial populations results in a higher NH3-N uptake rate, which contributes to avoiding high NH3–N concentrations in the rumen and to increase the flow of microbial protein to the duodenum (Carro et al., 2014).
S. cerevisiae has been shown to influence positively dairy cattle production, as reviewed by De Ondarza et al. (2010). These authors reviewed 14 experiments with dairy cattle and reported that fat-corrected milk production was increased on average by 3.5% (P<0.01) in dairy cows supplemented with S. cerevisiae, with significant improvements in feed efficiency (1.75 vs. 1.70 kg/kg for live yeast and control, respectively; P<0.01), milk fat yield (1.28 vs. 1.25 kg/d; P<0.01) and milk true protein yield (1.02 vs. 1.00 kg/d; P<0.001); without any effect on DMI. Desnoyers et al. (2009) also performed a meta-analysis (involving 110 scientific papers and 157 experiments) on the effects of live S. cerevisiae cultures on ruminal parameters in dairy and growing cattle, sheep, goats and buffaloes. These authors concluded that yeast supplementation increased rumen pH (+0.03 on average) and ruminal VFA concentrations (+2.17 mM on average), tended to decrease lactic acid concentrations (-0.9 mM on average), increased DMI (+0.44 g/kg of BW) and milk yield (+1.2 g/kg of BW), and tended to increase milk fat content (+0.05%).
The effects of S. cerevisiae on beef cattle performance are inconsistent. Table 1.4. summarizes the results of some in vivo studies performed in growing cattle (calves, heifers and bulls) fed a wide range of diets supplemented with live yeasts, killed yeasts or yeast cultures at different dosages. The results obtained by Bauman et al. (2004); Lascano and Heinrichs (2009); and Lascano et al. (2009, 2012) showed a lack of interaction between diet characteristics and S. cerevisiae effects. In contrast, Mir and Mir (1994) reported an increase in DMI and F:G when S. cerevisiae was supplemented to steers fed corn silage-based diet that was not detected when steers were fed either alfalfa silage or high grain diets. The effects of S. cerevisiae on DMI reported in the literature are also controversial. Mutsvangwa et al. (1992) reported that S. cerevisiae supplementation increased DMI in bulls fed concentrate and barley straw, whereas Lascano et al. (2009) observed a
18

Chapter I: Introduction and objectives
decrease in DMI when Holstein heifers fed diets composed of corn silage and concentrate were supplemented with S. cerevisiae. However, most authors did not observe any effect of S. cerevisiae on DMI (Mir and Mir, 1994; Bauman et al., 2004; Lascano et al., 2012; Moya et al., 2014; Vyas et al., 2014ab). The increase in DMI observed by Mutsvanga et al. (1992) in bulls supplemented with S. cerevisiae caused an increase in ADG, with no effect on F:G, whereas Mir and Mir (1994) did not report an increase of ADG in steers fed diets based on corn silage, thus resulting in higher F:G. Bauman et al. (2004); Lascano et al. (2009); and Vyas et al. (2014ab) did not observe any effect of S. cerevisiae supplementation on either final BW or animal growth, but an improvement in carcass weight was reported by Mir and Mir (1994) and Bauman et al. (2004) in trials with steers.
S. cerevisiae supplementation has modified ruminal parameters in some, but not all, studies. Mutsvangwa et al. (1992) reported that S. cerevisiae supplementation increased acetate and total VFA concentrations (P<0.05) and tended to increase propionate concentration in the rumen of bulls, but acetate:propionate ratio remained unaffected. Vyas et al. (2014a) observed an increase on average pH by supplying either live or killed yeast to beef heifers. Lascano and Heinrichs (2009) reported no effect of yeasts on ruminal pH in Holstein heifers, but VFA concentrations were increased and NH3-N values were reduced. In contrast, Mir and Mir (1994); Lascano et al. (2009), Moya et al. (2014) and Vyas et al. (2014b) did not observe any influence of yeasts on ruminal fermentation parameters.
The reported experiments used S. cerevisiae doses ranging from 5 x 10⁹ to 5 x 10¹⁰ cfu per day. Although the results described above were not dose-related, Lascano et al. (2012) reported a quadratic effect of S. cerevisiae dose, as diet digestibility in Holstein heifers was increased and plasma glucose concentrations tended to increase at a dose of 3 x 10¹⁰ cfu/d and no effects of S. cerevisiae was observed at 5 x 10¹⁰ cfu/d. Vyas et al. (2014a) also reported that either 4 x 10¹⁰ cfu/d of live or 4 g/d of autoclaved yeast tended to increase starch digestibility (P=0.07). Other fungi extracts, mainly from Aspergillus oryzae, can be used as feed additives combined with S. cerevisiae, and they have also been reported to stimulate the growth and to increase the viability of ruminal microbes, especially those of cellulolytic bacteria. Miranda et al. (1996) observed that both S. cerevisiae and A. oryzae cultures increased both the in situ degradability of alfalfa neutral detergent fiber (NDF) at 48 h incubation and propionate concentrations in the rumen of Holstein heifers. Chiquette (1995) concluded that the addition of A. oryzae, alone or in combination with S. cerevisiae, stimulated ruminal fermentation in steers, as indicated by the increased concentrations of acetate, propionate and total VFA, and the lower pH values measured in the supplemented animals.
In conclusion, although there is some evidence of the beneficial effects of S. cerevisiae in ruminants, mainly in dairy cows, the results obtained in growing cattle are inconsistent; and its impact on performance and ruminal fermentation still remains unclear. Animal response to S. cerevisiae supplementation may be quite variable, and factors such as the nature of the diet, level of productivity, animal physiological and genetic factors and dose and strain of yeast used, among others, may influence the efficacy of this additive (Fonty and Chaucheyras-Durand, 2006).
19

Chapter I: Introduction and objectives
Table 1.4. Effects of S. cerevisiae yeast supplementation on feed intake, ruminal fermentation and performance of growing cattle1.
Reference Type and
dose Animal and
duration Diet Results2 Mutsvangwa et al. (1992)
Live 9 x 10⁹
cfu/d Limousin × British Friesian bulls, 196 d
Concentrate and barley straw
Yeast increased DMI and ADG, with no effect of F:G. Yeast increased acetate and total VFA concentrations
Mir and Mir (1994)
Live 5 x 10¹⁰ cfu/d
Weaned Hereford steers, from 24 to 84 d
AS (75: 25 alfalfa silage: barley) vs. CS (96: 4 corn silage: soybean meal) vs. HG (75: 25 dry-rolled barley: alfalfa hay)
No effect of yeast on final BW, DMI, ADG and F:G, except in CS diets, were yeast increased DMI and F:G. Carcass weight was increased, with no impact on carcass quality. No effect on ammonia, lactic acid and VFA content was observed
Bauman et al. (2004)
Live 9 x 10⁹ cfu/d plus 1,500 xylanase units/d
Crossbred beef steers, 42 d
dry-rolled corn 48% vs. dry-rolled barley 55% vs. tempered-rolled barley 55%
No effect of treatment on BW, DMI, ADG and F:G, but it increased carcass weight with no impact on carcass characteristics
Lascano et al. (2009)
Live 5 x 10⁹ cfu/d
Holstein heifers, 133 d
40:60 corn silage: concentrate vs. 80:20 corn silage: concentrate
No effect of yeast on final BW, ADG and F:G. Yeast tended to decrease DMI in both diets
Lascano and Heinrichs (2009)
Live 1010 cfu/d
Holstein heifers, 35 d
80:20 vs. 60:40 vs. 40:60 corn silage: concentrate ratios
No effect of yeast on ruminal pH, but increased VFA concentration and reduced ammonia
Lascano et al. (2012)
Live 1010 vs. 3 x 10¹⁰ cfu/d vs. 5 x 10¹⁰ cfu/d
Holstein heifers, 21 d
50: 50 forage: concentrate with high and low starch contents (28 vs. 17% respectively)
No effect of yeast on DMI, but increased diet digestibility at 3 x 10¹⁰ cfu/d
Moya et al. (2014)
Yeast culture, 14 g/d
Holstein heifers, 35 d
10:90 forage: concentrate
No effect of yeast culture on DMI, pH, total VFA, lactate or ammonia
Vyas et al. (2014a)
Live 4 x 10¹⁰
cfu/d vs. Autoclaved yeast 4 g/d
Beef heifers, 21 d
50:50 forage to concentrate
No effects on DMI or BW. Live and autoclaved yeast increased minimum and average pH, tended to increase starch digestibility with no effect on VFA or lactate
Vyas et al. (2014b)
Live 4 x 10¹⁰
cfu/d vs. Autoclaved yeast 4 g/d
Beef heifers, 28 d
40:10:50, barley silage: chopped grass hay:barley grain
No effects on DMI, minimum and average pH, VFA and lactate
1Only studies describing diet composition and malic acid or malate dose were included. 2 ADG: average daily gain; BW: body weight; DMI: dry matter intake, F:G: feed-to-gain ratio; VFA: volatile fatty acids.
20

Chapter I: Introduction and objectives
1.4. Objectives
The general aim of this Thesis was to investigate the efficacy of nutritional strategies to control acidosis in feedlot cattle. In order to reach this objective, the experiments were designed to resemble the predominant feeding practice in commercial feedlots in Spain. The need of this research work was supported by the fact that most of the studies on this topic were conducted with diets including forage and dry-rolled or steamed cereals, which are typical raw materials used in Northern Europe or USA. Moreover, most of the studies involving high-concentrate diets in USA included antibiotics that are banned in Europe, such as monensin and lasalocid. Therefore, these results could not be extrapolated to Spanish conditions.
To accomplish the general objective, three experimental trials were performed to achieve the following particular objectives:
i. To evaluate the effect of malate inclusion in feedlot cattle diets provided as either free acid or disodium/calcium salt form on performance, ruminal parameters and blood metabolites of beef cattle.
ii. To assess the effects of malate salts and a Saccharomyces cerevisiae culture on growth performance, carcass quality, ruminal fermentation products and blood metabolites in heifers.
iii. To investigate the interaction of cereal type (corn vs. wheat) and energy level of the diet on growth performance, carcass quality and ruminal fermentation characteristics of beef cattle.
21

Chapter I: Introduction and objectives
22

CHAPTER II: EXPERIMENT 1
“Effect of malate form (acid or disodium/calcium salt) supplementation on performance, ruminal parameters and blood
metabolites of feedlot cattle”
23

Chapter II: Experiment 1
24

Chapter II: Experiment 1
2.1. Introduction
Malic acid is an organic acid naturally found in many fruits and plants, including forages used in ruminant feeding (Callaway et al., 1997), which has been proposed as a substitute for monensin in beef cattle diets because its effects on ruminal fermentation are similar to those of ionophores (Castillo et al., 2004). Although malic acid and malate salts have been repeatedly shown to have positive effects on in vitro ruminal fermentation by increasing ruminal pH and propionate production (Carro and Ranilla, 2003; Gómez et al., 2005; Newbold et al., 2005; Tejido et al., 2006), available information on effects of malate on in vivo ruminal fermentation and ruminant performance is limited and conflicting. Martin et al. (1999) reported that supplementing DL-malate at rates of 3.7 and 7.1 g/kg DM to feedlot steers fed a corn based diet improved ADG and F:G, and Flores et al. (2003) found that supplementing malate salts at 1.1 g/kg diet DM improved growth and digestibility of intensively fattened lambs. In contrast, no effects of malic acid supplementation at 26 g/kg diet DM on ruminal digestion and rumen microbial efficiency were found by Montaño et al. (1999) in steers, by Kung et al. (1982) on diet digestibility and N retention in steers fed 5.5 and 11 g of malic acid/kg diet DM, and by Carro et al. (2006) on diet digestibility and animal performance in growing lambs supplemented with malate salts at 4 and 8 g/kg of concentrate DM.
The contrasting results could be due to differences in animals, dietary factors (e,g., forage:concentrate ratio, forage type), dose of malate and chemical form in which malate was fed (i.e., free acid versus malate salt). Castillo et al. (2007) and Hernandez et al. (2011) compared effects of malic acid and malate salts supplemented with 4 g/kg DM diet to feedlot bull calves and found that both forms lowered plasma L-lactate concentrations. However, there are no studies in which effects of malic acid/malate salts on animal performance, carcass characteristics, ruminal fermentation and plasma parameters have been investigated in the same animals. Therefore, our objective was to evaluate effects of malate inclusion in feedlot cattle diets provided as either free acid or disodium/calcium salt form on performance, ruminal parameters (i.e., pH, VFA concentration, NH3-N and lactate) and blood metabolites (i.e., glucose, urea-N and lactate) of beef cattle maintained in a commercial feedlot.
2.2. Materials and methods
2.2.1. Animals, diets and experimental design
Charolais purebred (36) or Charolais and Limousin crossbreed (72) heifers with a BW of 216 ± 30.3 kg and 5.5 ± 2.51 months of age were managed according to protocols approved by the León University Institutional Animal Care and Use Committee. Heifers were transported to the experimental farm (Comercial Pecuaria Segoviana SL, Coca, Spain) and, upon arrival, each was weighed, treated for endo- and ectoparasites with ivermectin (1 mL/50 kg BW, Ivomec®, Merial Laboratorios, SA, Barcelona, Spain) and vaccinated against infectious bovine rhinotracheitis, parainflueza-3 and bovine viral diarrhoea (2 mL/head, Cattlemaster-4®, Pfizer, Madrid, Spain) and enterotoxemia and carbuncle (2 mL/head, Miloxan®, Merial Laboratorios SA, Barcelona, Spain). The booster dose was administered 3 weeks later.
After arrival and before starting the experiment, heifers were fed an adaptation diet of sunflower seed, olive pulp, alfalfa hay, corn gluten feed, soybean hulls, corn distillers
25

Chapter II: Experiment 1
dried grains with solubles, beet pulp, rice bran, palm kernel meal, beet molasses, beet vinasses, calcium carbonate, sepiolite, wheat middlings, sodium chloride and animal fat in the proportions of 189, 100, 100, 100, 100, 100, 70, 60, 50, 30, 26, 22, 20, 15, 7 and 2 g/kg DM. Crude protein (CP), neutral detergent fiber with heat-stable amylase and expressed inclusive of residual ash (aNDF) and acid detergent fiber (ADF) content of the adaptation diet was 169, 386 and 247 g/kg DM, respectively.
Diets were formulated to meet or exceed National Research Council (NRC, 2000) nutritional requirements of growing/finishing heifers of 350 kg BW with 1.4 kg/d ADG. Ingredient and chemical composition of the concentrate is in Table 2.1. Diet composition was representative of those used for commercial feedlots in Spain, with barley grain as the main component. Concentrate and barley straw were provided ad libitum twice daily (i.e., 7:00 and 18:00 h) and fresh water was freely accessible at all times.
Table 2.1. Ingredients and chemical composition (g/kg DM) of the concentrate fed. Ingredients g/kg DM Barley, grain 500 Gluten feed, corn 80 Wheat, grain 125 Wheat, middlings 75 Soybean, meal 440 g/kg CP 72 Molasses, beet 10 Oil, palm 82 Oleine1 15 Calcium soap2 15 Fat, rumen inert3 7 Calcium carbonate 11 Sodium chloride 2.5 Mineral/vitamin premix4 2.5 Chemical composition
CP 145 aNDF 192 ADF 68 Starch
358 1 A product based on olive soapstock (Refinación Industrial Oleícola SA, Ibros, Spain): Contained 1,000
g of ether extract/kg DM. Fatty acid profile (g/kg ether extract): 741 of C18:1, 95 of C16:0, 61.8 of C18:2, 33.3 of C18:0, 2.9 of C18:3 and 1.9 of C16:1. 2 Mixed fat calcium soap (Comercial Pecuaria Segoviana, SL, Coca, Spain): Contained/kg of DM: 160 of ash and 840 g of ether extract. Fatty acid profile (g/kg ether extract): 303.2 of C16:0, 159.6 of C18:0, 159.6 of C18:1, 95.8 of C>20, 23.9 of C18:2, 20.7 of C14:0, 9.6 of C16:1 and 3.8 of C18:3. Ca content: 90 g/kg of DM. 3 Hydrogenated fat (Mateos, SL, Cabezón de Pisuerga, Spain) containing 980 of ether extract/kg of DM. Fatty acid profile (g/kg of ether extract): 427.6 of C16:0, 380.0 of C18:0, 49.4 of C18:1, 19.0 of C14:0 and 19.0 of C18:2. 4 Mineral and vitamin premix contained according to the manufacturer (Comercial Pecuaria Segoviana, SL, Coca, Spain): 8,000 IU of vitamin A, 1,600 IU of vitamin D3, 6,000 IU of vitamin E, 7.9 mg of Cu, 0.7 mg of Co, 0.2 mg of Se, 50 mg of Zn, 35 mg of Mn, 438 mg of Mg, 100 mg of S, 20 mg of Fe and 0.8 mg of I.
26

Chapter II: Experiment 1
At the beginning of the experiment, heifers were weighed and assigned to 18 pens of 6 heifers according to BW and breed. Within breed, pens were randomly allotted to the three experimental groups being: CON: control (no additive); MA: CON plus 1.08 g of malic acid (0.98 g of malate/g product; Andres Pintaluba SA, Reus, Spain)/kg concentrate (DM basis); and MAL: CON plus 2 g of a mixture of disodium/calcium malate (0.53 g of malate/g product; Rumalato®, Norel SA, Madrid, Spain)/kg concentrate (DM basis). The experimental treatments were designed to provide 1.1 g of malate/kg of concentrate. There were 6 pens/ treatment (i.e., 2 pens of purebred Charolaise and 4 pens of crossbreds).
Feed and straw supply was recorded daily. On days 0, 28, 56, 84, 114 and 141 the heifers were individually weighed and concentrate refusals in each pen were determined. Productive parameters determined were ADG (kg/d), DMI (kg/d) and F:G (kg DM intake/kg BW gain). At 141 d, heifers were slaughtered at Laguna de Duero slaughter house (Valladolid, Spain). Two representative heifers (i.e., heifers having maximum and minimum BW were excluded)/pen were randomly selected to determine hot carcass weight, dressing proportion, carcass characteristics and rumen papilla characteristics. Dressing proportion was calculated as the relationship between hot carcass weight and animal BW at 141 d of feeding. In addition, measurements made on the hot left mid-carcass included carcass length, as the length from the cranial border of the first rib to the point of the pubic symphysis, chest depth measured from the ventral surface of the spinal canal (at 5th rib level) to the lowest point of the sternum, and carcass compactness index determined as the relationship between carcass length and chest depth. Leg length was measured from the inner side of the tarsus-metatarsus joint to the point of the pubis symphysis, leg perimeter was measured at the level of the crest of the ileum, and leg compactness index was determined as the relationship between leg length and perimeter. Quality grade was determined according to European carcass grading system for conformation (S - Superior, E - Excellent; U - Very good; R - Good; O - Fair; P - Poor) and fat cover (1 - Poor; 2 - Slight; 3 - Average; 4 - High; 5 - Very high).
To evaluate rumen papilla characteristics, after evisceration, rumens were identified with a tag. After rumen content evacuation, a 30 cm x 30 cm sample of rumen was collected from its ventral area. Samples were kept in bags and stored refrigerated at 5oC. At the laboratory, rumen samples were washed using a saline solution (85 g NaCl/L) and displayed over a white surface with intense and homogeneous light to evaluate colour (1-Pale; 2-Pale-Pink; 3-Pink-Green; 4-Green; 5-Dark green) and papilla length (1-Very short; 2-Short; 3-Medium; 4-Long). Evaluation was by four trained judges.
2.2.2. Ruminal fermentation parameters and blood metabolites
On days 0, 84 and 141, ruminal fluid (~20 mL) was obtained by ruminocentesis (i.e., puncture in the centre of the triangle between last rib, wing of ileum and transverse process of spine) and blood samples (9 mL) were collected by puncture of the median coccygeal vein from 2 heifers/pen (12/treatment). Sampling started 2 h after morning feeding. The pH of ruminal fluid was measured immediately with a pH meter, and fermentation was stopped by swirling the samples in an ice bath. Five millilitre of fluid were then added to 5 mL of deproteinizing solution (20 g of metaphosphoric acid and 4 g of crotonic acid/L) for VFA analysis, and 2 mL were added to 2 mL 0.5 M HCl for NH3-N and lactate determination. Samples were immediately frozen at -20ºC until analyses. Blood samples were collected into heparinized tubes, centrifuged at 1000 x g for 15 min at 4ºC,
27

Chapter II: Experiment 1
and plasma was immediately frozen (-20ºC) until determination of glucose, urea-N and total lactate.
2.2.3. In vitro fermentation of experimental diets
Samples of the experimental diets were used as substrates for the in vitro fermentations. Straw and concentrates collected throughout the experiment were ground through a 1 mm screen and mixed in the proportion 120:880 as fed to resemble the diet fed to the heifers. Samples of diets (400 mg DM) were weighed into 120 mL serum bottles. Ruminal contents were collected from 8 heifers from control group at slaughter and immediately transported to the laboratory. The contents of randomly selected pairs of heifers were mixed, and strained through 4 layers of cheesecloth into an Erlenmeyer flask with an O2-free headspace to obtain 4 samples of ruminal fluid representing the CON fed heifers. Particle-free fluid was mixed with the buffer solution of Goering and Van Soest (1970; no trypticase added) in a proportion 1:4 (vol/vol) at 39ºC under continuous flushing with CO2. Four bottles with each diet and 8 bottles without substrate (blanks; 2 blanks per inoculum) were incubated. Forty millilitres of buffered rumen fluid were added into each bottle under CO2 flushing. Bottles were sealed with rubber stoppers and aluminium caps, incubated at 39ºC, and withdrawn 17 h after inoculation (based upon an estimated rumen passage rate of 0.06/h).
Total gas production was measured using a pressure transducer and a calibrated syringe, and a gas sample (10 mL) was removed from each bottle and stored in a Haemoguard Vacutainer (Terumo Europe N.V., Leuven, Belgium) before analysis of CH4. Bottles were uncapped and the pH was measured immediately with a pH meter. Fermentation was stopped by swirling the bottles in ice, and the content of the bottles were sampled for VFA, NH3-N and lactate analysis following the procedure described above. Finally, contents of the bottles were transferred to previously weighed filter crucibles and the residue of incubation was washed with 50 mL of hot (50ºC) distilled water. Crucibles were dried at 50ºC to constant weight and weighed to calculate apparent DM degradability. Residue was analyzed for aNDF to calculate true DM degradability (Van Soest et al., 1966) and aNDF degradability. There were 4 bottles per experimental treatment.
2.2.4. Analytical procedures
Dry matter (#934.01), ash (#942.05) and N (#984.13) content of diets were determined according to the Association of Official Analytical Chemists (1999). aNDF and ADF analyses were according to Van Soest et al. (1991) using an ANKOM220 Fibre Analyzer unit (ANKOM Technology Corporation, Macedon, NY, USA). Sodium sulphite and heat-stable amylase were used in analysis of aNDF and ADF, and they are both expressed inclusive of residual ash.
Concentrations of VFA, ammonia-N and lactate in ruminal fluid and batch cultures were determined as described by García-Martínez et al. (2005), and CH4 was analysed by gas chromatography according to Martínez et al. (2010). Plasma concentrations of glucose, urea-N and lactate were determined by automated enzymatic methods adapted to a Cobas Integra 400 plus Analyzer (F. Hoffmann-La Roche Ltd, Basel, Switzerland).
28

Chapter II: Experiment 1
2.2.5. Calculations and statistical analyses
In the in vitro experiment, amounts of VFA produced/bottle were calculated by subtracting the amount present initially in the incubation medium from that determined at the end of the incubation period. The volume of gas produced was corrected for temperature (273 K) and pressure (1.013 x 10⁵ Pa). The amount of CH4 was calculated by multiplying gas produced by the concentration of CH4 in the analyzed sample. Recovery of H2 in each bottle was estimated from net productions of acetate, propionate, butyrate, valerate and CH4 (Demeyer, 1991).
The experimental unit for BW, ADG, DM intake and F:G measurements was the pen, representing mean data for 6 heifers housed together. The experimental unit for carcass and ruminal papillae characteristics, ruminal fermentation parameters and blood metabolites was the heifer, as these data were obtained individually. Data on BW, ADG, DM intake and F:G, ruminal parameters and blood metabolites were analysed as repeated measures using the MIXED procedure of SAS (2005). The statistical model included diet (CON, MA, MAL), breed, time (sampling day), diet x breed, diet x time and breed x time. Because breed effect and its interactions with diet and time were not significant for any ruminal parameter or blood metabolite they were excluded from the model.
Hot carcass weight, dressing proportion and carcass characteristics (i.e., carcass compactness index and leg compactness index) were analyzed using the MIXED procedure of SAS (2005). The model included diet (CON, MA, MAL), breed and diet x breed interaction as main effects and final BW as a covariate. Quality grade and rumen papilla characteristics were analysed using the CATMOD procedure of SAS (2005).
In vitro data were also analysed using the MIXED procedure, with diet as a fixed effect, and inoculum as a random effect. Within each experimental diet, there were four values for each of the measured variables in the in vitro fermentations which represented the four pairs of CON heifers from which rumen fluid was collected at slaughter.
When a significant effect of diet occurred, differences among means were assessed by Tukey’s test. In all statistical analysis, significance was declared if P<0.05, and P<0.10 values were considered to be a trend to a difference.
2.3. Results
2.3.1 Body weight gain, productive parameters, and carcass and rumen papilla characteristics
Neither BW gain nor feed intake or productive parameters (Table 2.2.) were influenced by treatments. However, as was expected, there were differences (P<0.001) in measures in time, due to animal growth. No treatment x time interactions occurred, with the exception of a trend (P=0.08) to concentrate DM intake. Although intake of barley straw was not determined, the amount of straw provided was recorded daily, and straw losses to the ground were visually observed. The amount of straw loss was similar in all pens, and average straw intake over the experiment was estimated as about 120 g/kg DM intake.
Hot carcass weight, dressing proportion and carcass characteristics (Table 2.3) were not affected by treatments. As expected, SEUROP quality grade was similar among heifers, either U or R classification. Fat cover grade was 3 (average) for all heifers.
29

Chapter II: Experiment 1
Ruminal papilla colour was darker in MA fed heifers (P=0.02), which had 3 of 12 rumens classified as dark green, whereas 1 of 12 rumens from CON fed heifers were classified as pale, and none of the rumens from MA and MAL fed heifers were classified as pale or pale pink. There were no differences among treatments on rumen papilla length.
Table 2.2. Effect of treatments on body weight (kg), average daily gain (ADG, kg/d), concentrate dry matter intake (DM, kg/d) and feed to gain ratio (F:G, kg/kg) of heifers during the experiment.
Item and period (days of feed)
Treatment1 P =2 CON MA MAL SEM BR TR TM TR x TM
BW 0 229 230 230 3.9 0.02 0.33 <0.001 0.35 28 274 279 276 56 321 330 324 84 362 375 363 114 399 405 399 141 427 432 425
ADG 0-28 1.61 1.79 1.62 0.078 0.08 0.38 <0.001 0.19 29-56 1.67 1.83 1.71 57-84 1.46 1.58 1.40 85-114 1.24 1.01 1.19 115-141 0.98 0.97 0.91
Concentrate DMI 0-28 6.28 6.53 6.32 0.188 0.24 0.46 <0.001 0.08 29-56 7.99 8.49 7.94 57-84 7.89 8.40 7.90 85-114 7.71 7.83 7.69 115-141 7.19 6.80 7.17
F:G 0-28 3.94 3.73 3.09 0.423 0.98 0.67 <0.001 0.16 29-56 4.87 4.68 4.63 57-84 5.47 5.38 5.79 85-114 6.29 8.08 6.64 115-141 7.48 7.21 8.12
1 CON: control, unsupplemented; MA: CON supplemented with malic acid (0.98 g malate/g of product; 1.08 g of product/kg of concentrate); MAL: CON supplemented with disodium/calcium malate (0.53 g malate/g of product; 2 g of product/kg of concentrate). 2 BR: breed; TR: treatment; TM: time. BR x TR, BR x TM, and BR x TR x TM interactions were not significant (i.e., P>0.05) and P values are not shown.
30

Chapter II: Experiment 1
Table 2.3. Effect of treatments on carcass parameters and rumen papilla characteristics in heifers at slaughter. Treatment1 P =2 CON MA MAL SEM BR TR Hot carcass weight, kg 24700 244 249 2.7 0.71 0.37 Dressing proportion, kg carcass/100 kg BW 55.10 54.60 55.70 0.61 0.76 0.39 Carcass characteristics
Carcass compactness index 1.97 1.96 1.98 0.028 0.75 0.81 Leg compactness index 1.55 1.58 1.60 0.017 0.06 0.17
Quality grade (samples within category): European SEUROP – U 9 10 8 N/A N/A 0.63 European SEUROP – R 3 2 4 N/A N/A N/A
Ruminal papilla characteristics Colour (samples within category):
Pale 1 0 0 N/A N/A 0.02 Pale – Pink 0 0 0 N/A N/A N/A Pink – Green 4 1 4 N/A N/A N/A Green 7 7 8 N/A N/A N/A Dark Green 0 4 0 N/A N/A N/A
Length (samples within category): Very Short 2 0 0 N/A N/A 0.92 Short 3 6 6 N/A N/A N/A Medium 4 3 3 N/A N/A N/A Long 3 3 3 N/A N/A N/A
1 CON: control, unsupplemented; MA: CON supplemented with malic acid (0.98 g malate/g product; 1.08 g product/kg concentrate); MAL: CON supplemented with disodium/calcium malate (0.53 g malate/g product; 2 g product/kg concentrate). 2 BR: breed; TR: treatment. N/A: not applicable.
2.3.2. Blood metabolites and rumen parameters and characteristics
Sampling time affected glucose (P=0.02) and urea-N (P=0.05) concentrations, but had no effect on lactate concentrations (Table 2.4.). Compared with initial values (i.e., day 0), glucose and urea-N declined during the experiment. There were no effects of MA and MAL on glucose, lactate or urea-N concentrations.
There were no effects of experimental treatments on ruminal pH, lactate or total VFA concentrations. The VFA profile was similar in all groups, with the exception of caproate molar proportions, which were higher (P<0.01) for MAL fed heifers on 0 d sampling compared with those in CON and MA fed heifers. However, no differences among groups in caproate proportion occurred on day 84 and 141. At 84 d of sampling, MAL fed heifers had higher rumen NH3-N concentrations compared with heifers fed CON and MA diets. Minor treatment x time interactions occurred for proportions of acetate, isovalerate, valerate and caproate (P=0.05, 0.04, 0.01 and 0.01, respectively) (Table 2.5.).
31

Chapter II: Experiment 1
Table 2.4. Effect of treatments on blood metabolites in heifers during the experiment. Item and Sampling day
Treatment1 P =2 CON MA MAL SEM TR TM TR x TM
Glucose, mg/100 mL 0 75.6 71.4 73.7 4.30 0.97 0.02 0.97 84 63.0 61.5 63.3 141 66.1 67.4 64.9
Lactate, mg/100 mL 0 84.4 84.3 83.4 0.81 0.60 0.43 0.08 84 70.5 59.6 70.3 141 75.3 70.3 72.0
Urea-N, mg/100 mL 0 9.43 9.13 9.19 0.741 0.54 0.05 0.87 84 8.13 6.58 8.06 141 9.20 8.18 8.38
1 CON: control, unsupplemented; MA: CON supplemented with malic acid (0.98 g malate/g product; 1.08 g product/kg concentrate); MAL: CON supplemented with disodium/calcium malate (0.53 g malate/g product; 2 g product/kg concentrate). 2 TR: treatment; TM: time. Table 2.5. Effect of experimental treatments on ruminal fermentation parameters in heifers during the experiment. Item and Sampling day
Treatment1 SEM
P =2 CON MA MAL TR TM TR x TM
pH 0 6.64 5.67 5.12 0.152 0.81 <0.001 0.10 84 6.00 5.96 6.14 141 6.58 6.33 6.70
NH3-N, mg/l 0 65.5 66.2 75.9 6.63 0.03 <0.001 0.81 84 22.8 25.6 49.1 141 47.9 46.4 65.1
Lactate, mmol/l 0 0.90 0.90 0.90 0.07 0.53 0.05 0.69 84 0.80 0.70 0.80 141 0.80 0.70 0.90
Total volatile fatty acids (VFA), mmol/l 0 123 138 154 8.2 0.74 <0.001 0.54 84 120 128 121 141 100 97 95
32

Chapter II: Experiment 1
Item and sampling day
Treatment1 P = 2 CON MA MAL SEM TR TM TR x TM
VFA, mmol/mol Acetate
0 503 496 481 9.9 0.08 <0.001 0.05 84 489 493 485 141 540 591 536
Propionate 0 322 213 313 9.6 0.70 <0.001 0.72 84 376 389 380 141 339 335 324
Butyrate 0 116 74 63 5.0 0.32 <0.001 0.24 84 132 71 56 141 132 78 65
Isobutyrate 0 4.90 6.20 4.80 1.01 0.41 <0.001 0.22 84 7.00 6.70 7.70 141 10.700 10.900 13.000
Isovalerate 0 7.10 7.00 5.10 2.80 0.57 <0.001 0.04 84 17.100 17.400 15.60v 141 26.100 28.100 39.200
Valerate 0 38.700 41.200 46.500 2.45 0.14 <0.001 0.01 84 21.100 18.400 26.200 141 18.200 20.800 19.700
Caproate 0 7.9a0 9.6a0 17.8b0 1.29 0.002 <0.001 0.01 84 3.90 5.20 7.00 141 3.10 3.60 3.80
Acetate/propionate, mol/mol 0 1.57 1.60 1.55 0.056 0.62 <0.001 0.71 84 1.31 1.29 1.31 141 1.50 1.64 1.61
a,b For isovalerate, valerate and caproate within each time, means with different superscripts differ (P<0.05). A lack of superscripts indicates that they do not differ within time. 1 CON: control, unsupplemented; MA: CON supplemented with malic acid (0.98 g malate/g product; 1.08 g product/kg concentrate); MAL: CON supplemented with disodium/calcium malate (0.53 g malate/g product; 2 g product/kg concentrate). 2 TR: treatment; TM: time.
33

Chapter II: Experiment 1
2.3.3. In vitro fermentation of experimental diets
There were no differences among treatments in any of the parameters determined. Values were in the range of those previously reported for in vitro fermentation of high concentrate diets (Carro and Ranilla, 2003; Tejido et al., 2005) (Table 2.6.).
Table 2.6. Influence of malic acid or disodium/calcium malate on in vitro fermentation (17 h) of 120:880 straw:concentrate (DM) diets by mixed rumen microorganisms in batch cultures (400 mg of dry matter diet incubated/culture). Treatment1
SEM P= CON MA MAL pH 6.82 6.81 6.84 0.006 0.16 Gas, mmol 3.67 3.54 3.54 0.065 0.35 Methane, mmol 0.55 0.55 0.55 0.009 0.91 Volatile fatty acids (VFA), mmol
Acetate 1.07 1.07 1.05 0.018 0.72 Propionate 0.48 0.53 0.48 0.013 0.10 Butyrate 0.34 0.36 0.35 0.005 0.13 Other VFAb 0.11 0.11 0.11 0.007 0.87 Total VFA 1.99 2.06 1.99 0.031 0.27
Acetate/Propionate ratio,mol/mol 2.23 2.04 2.18 0.083 0.10 Methane/VFA, mol/mol 0.27 0.27 0.28 0.010 0.46 Hydrogen recovey, mol/mol 0.98 0.98 0.99 0.012 0.85 NH3 N, mg/l 167 173 177 3.70 0.27 Lactate, mg/l 17.00 16.70 16.90 3.52 0.96 DM degradability, mg/g 464 463 465 9.1 0.99 Neutral detergent fiber degradability, mg/g 388 370 367 10.8 0.72 1 CON: control, unsupplemented; MA: CON supplemented with malic acid (0.98 g malate/g product; 1.08 g product/kg concentrate); MAL: CON supplemented with disodium/calcium malate (0.53 g malate/g product; 2 g product/kg concentrate). 2 Calculated as the sum of isobutyrate, isovalerate, valerate and caproate.
2.4. Discussion
This study was designed to assess effects of two forms of malate on performance and ruminal fermentation in beef cattle maintained in a commercial feedlot. Because the study was conducted under practical conditions, the level of the product (Rumalate®) was as recommended by the manufacturer (i.e., 2 g/kg concentrate), which provided 1.1 g of malate/kg concentrate. Malic acid was included in the MA treatment at the rate required to provide the same amount of malate (1.08 g of malic acid product/kg concentrate). Both malic acid and malate salts have been shown to have beneficial effects on rumen fermentation, but no studies have been conducted to compare their effectiveness as feed additives. Malate salts are more expensive than malic acid, but they have the advantages of being non-abrasive, safer to manipulate, and produce no negative effects on rumen pH, whereas malic acid has the potential to decrease ruminal pH (Liu et al., 2009).
34

Chapter II: Experiment 1
2.4.1 Body weight gain, productive parameters and carcass and rumen papillae characteristics
Results of BW gain agree with those obtained by Martin et al. (1999; Experiment (Expt.) 4) and Castillo et al. (2007), showing no effect of malic acid or malate salts inclusion, although the dosage was higher than the one in our experiment (i.e., 4 g of DL-malic acid or disodium/calcium malate/kg of diet DM in Castillo et al. (2007) and 11 g of malic acid/kg of diet DM in Martin et al. (1999, Expt. 4). The lack of differences among our treatments on DM intake is consistent with Martin et al. (1999), Montaño et al. (1999) and Castillo et al. (2007), but contrasts with a reduction in Foley et al. (2009) when steers were supplemented with malic acid at 25, 50 and 75 g of malic acid/kg diet DM.
Consistent with our results, Martin et al. (1999, Expt. 4) and Castillo et al. (2007) reported no effect of malic acid or malate salts supplementation on ADG, but Martin et al. (1999, Expt.’s 2 and 3) reported an increase in ADG associated with higher doses of DL-malic acid which resulted in an improved F:G ratio, improvements which occurred with rolled corn grain based diets which also contained the ionophore lasalocid, whereas our diet was based on barley grain and contained no ionophores.
A lack of effects of malic acid supplementation on hot carcass weight and dressing proportion has also been reported by Martin et al. (1999; Expt. 4). However, to our knowledge, there are no previous studies on effects of malic acid or malate salts on carcass (i.e., carcass compactness index, leg compactness index, quality grade proportion) or on rumen papilla characteristics (i.e., colour, length). Lack of effects of MA and MAL on carcass and rumen papilla characteristics is consistent with results for the rest of the parameters.
2.4.2. Blood metabolites and rumen fermentation parameters
Lack of differences among groups of heifers in plasma metabolite concentrations is consistent with Sanson and Stallcup (1984), Martin et al. (1999) and Montaño et al. (1999) in steers, Kung et al. (1982) in cows, and Carro et al. (2006) in lambs, indicating that under the conditions of these studies (i.e., concentrations of malic acid or malate salts of 3.7 - 26 g/kg DM diet), malic acid or malate salts had no effects on plasma metabolite levels. In contrast, Castillo et al. (2007) found that supplementing malic acid or a mixture of disodium and calcium malate at 4 g/kg concentrate DM fed to feedlot bulls lowered plasma L-lactate concentrations compared with unsupplemented bulls during the finishing period. Similarly, Hernandez et al. (2011) found that supplementing the diet of finishing stage bull calves with free malic acid or disodium/calcium malate salts at 4 g/kg DM diet lowered plasma concentrations of L-lactate, urea-N and creatinine. Reasons for the discrepancies among studies are unknown, but dose of malic acid or malate salt used cannot be regarded as the only possible factor.
Consistent with our results, Montaño et al., (1999) and Carro et al., (2006) reported no effects of malic acid or malate salts supplementation on rumen fermentation parameters. In contrast, linear increases in rumen pH with increased malate supplementation have been shown in steers by Martin et al. (1999; 2.8, 5.6 and 8.2 g malic acid/kg diet DM) and Liu et al. (2009; 7.8, 15.6 and 23.4 g of malic acid/kg diet DM). Effects of malic acid supplementation on VFA profiles have been variable, as Martin et al. (1999; Expt. 1) found an increase in the molar proportion of acetate without changes in propionate and butyrate, and Liu et al. (2009) reported an increase in propionate and
35

Chapter II: Experiment 1
butyrate proportions. As a consequence, the acetate/propionate ratio increased with malic acid supplementation in Martin et al. (1999; Expt. 1) and decreased in Liu et al. (2009). These results indicate that malic acid’s effects on rumen fermentation could be dose dependant, and may be affected by the microbial population in the rumen. It has been suggested that malic acid and malate salts could selectively stimulate or inhibit activity of ruminal microbes at some concentrations (Liu et al., 2009). Moreover, it has to be considered that, when determining VFA concentrations in the rumen, VFA proportions may be unrepresentative of net production (Udén et al., 2011).
2.4.3. In vitro fermentation of experimental diets
The lack of effect of MA and MAL in our study contrasts with previous in vitro studies in which malic acid or malate salts supplementation to different substrates (i.e., corn grain, barley grain, wheat grain, sorghum grain and different mixtures of forages and concentrates) consistently increased total VFA and propionate production in batch cultures (Carro and Ranilla, 2003; Newbold et al., 2005; Tejido et al., 2005) and Rusitec fermenters (Carro et al., 1999; Gómez et al., 2005). Although the magnitude of the effects of malic acid/malate on in vitro ruminal fermentation have been shown to be influenced by the incubated substrate (Carro and Ranilla, 2003; Newbold et al., 2005; Gómez et al., 2005; Tejido et al., 2005), there are other factors which could explain the lack of effects in our in vitro fermentation. For example, doses of malic acid/malate used in the previously cited in vitro studies ranged from 4 to 10 mM, and corresponded to levels from 37 to 92 g of malic acid/malate/kg of incubated substrate (DM basis). The dose of malic acid and malate used in our experiment was 1.1 g/kg of concentrate and corresponded to 0.06 mM for 40 mL batch cultures, which is much lower than the lowest dose (4 mM) reported to have increased total VFA and propionate production. We are not aware of other in vitro studies which used doses of malic acid or malate salts as low as those in our experiment, but it seems probable that the amount of malic acid and malate in the concentrates was too low to allow beneficial effects on in vitro ruminal fermentation. Regardless, the lack of malic acid/malate effects in our in vitro fermentation of the experimental diets agrees with the absence of effects in the rumens of the heifers.
In conclusion, under the feeding and management conditions of this study, the supplementation of 1.1 malate/kg concentrate DM had no effects on performance, ruminal parameters or blood metabolites of feedlot heifers. Results did not depend on whether malate was administered as the free acid or as disodium-calcium salt.
36

CHAPTER III: EXPERIMENT 2
“Effect of disodium/calcium malate or Saccharomyces cerevisiae supplementation on growth performance, carcass quality, ruminal
fermentation products and blood metabolites of heifers”
37

Chapter III: Experiment 2
38

Chapter III: Experiment 2
3.1. Introduction
High-grain diets favor growth but could result on SARA, a reduction in ruminal pH below 5.8 due to VFA accumulation and insufficient buffering (Calsamiglia et al., 2012). Manipulating rumen ecology to promote lactate uptaking microorganisms, such as Selenomonas ruminantium and Megasphaera elsdenii, has been proposed to reduce SARA (Owens et al., 1998). Malate has been reported to stimulate in vitro lactate uptake by S. ruminantium (Martin and Park, 1996; Martin, 1998), and to increase ruminal pH and propionate production (reviewed by Carro and Ungerfeld, 2015). In contrast, information on the effects of malate on in vivo ruminal fermentation and performance of beef cattle is more limited and conflicting (Castillo et al., 2004). Yeast cultures of Saccharomyces cerevisiae have also been reported to stimulate lactate utilization by S. ruminantium and M. elsdenii (Callaway and Martin, 1997), and could contribute to increase rumen pH (Chaucheyras-Durand et al., 2012). As previously reviewed (Desnoyers et al., 2009; De Ondarza et al., 2010), S. ruminantium supplementation to dairy cattle increases in milk production, but studies on beef cattle are scarce and controversial. Inconsistences in the response to malate and S. ruminantium supplementation may be explained by variations in the dose, growth rate and age of the animal, diet composition and farming conditions, among other factors (Yoon and Stern, 1995; Carro and Ungerfeld, 2015). Our hypothesis was that dietary supplementation with malate or S. ruminantium may be effective at increasing ruminal pH and improving performance in beef cattle fed high-grain diets, as animals fed these diets usually have ruminal abundance of S. ruminantium and M. elsdenii (Petri et al., 2013). This study was designed to assess the effects of malate salts and S. cerevisiae culture on growth performance, carcass quality, ruminal fermentation products and blood metabolites in heifers raised under commercial farming conditions in southern Europe.
3.2. Materials and methods
The study was approved by the institutional animal care committee of the Universidad de León (León, Spain), and was conducted in accordance with the Spanish guidelines for experimental animal protection (Boletín Oficial del Estado, 2013).
3.2.1. Animals, diets and experimental design
A total of 108 Charolaise cross heifers with an average BW of 214 ± 27.3 kg and 6.4 ± 1.10 month of age were used. Upon arrival to the experimental farm (Comercial Pecuaria Segoviana SL, Coca, Spain) each animal was weighed, treated for endo- and ectoparasites with ivermectin (1 mL/50 kg BW, Ivomec, Merial Laboratorios SA, Barcelona, Spain), and vaccinated against infectious bovine rhinotracheitis, parainflueza-3 and bovine viral diarrhoea (2 mL per animal, Cattlemaster-4, Zoetis Spain SLU, Madrid, Spain) and enterotoxemia and carbuncle (2 mL per animal, Miloxan, Merial Laboratorios SA, Barcelona, Spain). A booster dose was given 3 weeks later. Before starting the trial, all animals were fed an adaptation diet consisting of concentrate and straw for 7 days. Feeds were provided ad libitum (5% orts) twice a day, and fresh water was freely accessible at all times. In this period, the amount of straw and concentrate provided was recorded. Although feed refusals were not measured, a rough ratio of 70:30 concentrate-to-straw intake was estimated based on feed supply.
39

Chapter III: Experiment 2
At the beginning of the trial, heifers were weighted and assigned to 18 pens (6 heifers per pen) according to their weight and age. The pens were 5.0 x 7.0 m and had continuous concrete floor. Barley straw was used as bedding material. There was a totally randomized experimental design, and pens were randomly allotted to 1 of the 3 experimental treatments (6 pens per treatment). The dietary treatments were a control (not supplemented; CON); the control plus 4 g of disodium/calcium malate mixture (MAL; Rumalato; NOREL SA, Madrid, Spain) per kg of concentrate, providing 2.12 g of malate per kg of concentrate; and the control plus 0.15 g of Saccharomyces cerevisiae CBS 493.94 (YC; Yea-Sacc; Alltech Inc. Nicholasville, KY, USA) per kg of concentrate, providing 1.5 x 10⁸ cfu per kg of concentrate. Both additives were used at the dose recommended by the manufacturers. Experimental diets were formulated to meet or exceed the nutritional requirements of National Research Council (2000) for growing/finishing heifers of 350 kg BW and 1.4 kg ADG. Ingredient and chemical composition of the concentrates fed during the adaptation and experimental periods is shown in Table 3.1. The composition of the concentrate was representative of those used for commercial feedlots in southern Europe, with wheat and barley grains as the main components. Concentrate and full-length barley straw were provided separately ad libitum twice daily (0700 and 1800 h), and their supply was recorded daily throughout the trial. Concentrates were pelleted to reduced feed selection and refusals. Straw refusals dropped on the floor formed part of bedding material, and could not be quantified.
3.2.2. Productive parameters and carcass characteristics
On d 28, 56, 84, and 114, animals were individually weighed and concentrate refusals in each pen were determined to calculate the following productive parameters: ADG (kg), concentrate average daily feed intake (ADFI, kg/d), and gain to feed ratio (G:F, ADG/ADFI). In addition, feed refusals were observed daily at feeding time to adjust the amount supplied, and orts were removed and weighted when any spoilage was detected. The amount of straw provided daily was recorded, but actual intake of straw could not be determined as part of the straw was thrown to the ground by the heifers.
On d 114, animals were slaughtered at a commercial slaughterhouse (Laguna de Duero, Valladolid, Spain), and two representative heifers (i.e. heifers having the maximum and minimum BW were excluded) per pen were randomly selected to determine individual hot carcass weight (HCW) and carcass characteristics. Individual dressing percentage was calculated as the relationship between HCW and BW at d 114 of the trial. Carcass compactness index was determined as the relationship between carcass length and chest depth. Carcass length was determined on the hanged hot left midcarcass as the length from the cranial border of the first rib to the point of the pubic symphysis, and chest depth was measured from the ventral surface of the spinal canal (at fifth rib level) to the lowest point of the sternum. Leg compactness index was determined as the relationship between leg length and perimeter. Leg length was measured from the inner side of the tarsus-metatarsus joint to the point of the pubis symphysis, and leg perimeter was measured at the level of the crest of the ileum. Quality grade was determined following the European carcass grading system (Council Regulation (EC) number 1183/2006; Official Journal of the European Union, 2006) according to conformation classes: superior (S), excellent (E), very good (U), good (R), fair (O) and poor (P), and to degrees of fat cover: 1 (poor), 2 (slight), 3 (average), 4 (high) and 5 (very high).
40

Chapter III: Experiment 2
Table 3.1. Ingredients and chemical composition of the concentrates fed over the adaptation and experimental periods.
Item Adaptation
period Experimental concentrates1
CON MAL YC Ingredient, g/kg (as-fed basis)
Sunflower seed 189 - - - Olive pulp 100 - - - Soybean hulls 100 - - - Corn distiller’s dried grains with solubles 100 - - - Beet pulp 70.0 - - - Rice bran 60.0 - - - Animal fat 2.1 - - - Wheat grain - 282 278 282 Barley grain - 210 210 210 Corn gluten feed 100 100 100 100 Wheat middlings 14.9 100 100 100 Sunflower meal - 100 100 100 Palm kernel meal 50.0 55.0 55.0 55.0 Beet molasses 30.0 40.0 40.0 40.0 Alfalfa meal 100 40.0 40.0 40.0 Beet vinasses 27.9 20.0 20.0 20.0 Sepiolite 24.1 20.0 20.0 20.0 Calcium carbonate 25.4 18.0 18.0 18.0 Oleine2 - 10.0 10.0 10.0 Sodium chloride 7.0 2.5 2.5 2.5 Mineral/vitamin premix3 - 2.5 2.5 2.5 Disodium/calcium malate salts - - 4.00 - Saccharomyces cerevisiae - - - 0.15
Chemical composition4 DM, % ND5 89.3 (1.10) 89.4 (0.85) 88.6 (1.48) OM, % of DM - 93.8 (0.67) 93.9 (0.30) 94.0 (0.65) CP, % of DM - 15.2 (0.66) 15.6 (0.97) 15.9 (0.94) NDF, % of DM - 23.0 (2.18) 24.4 (0.47) 23.6 (2.45) Starch, % of DM - 31.0 (2.76) 30.9 (0.71) 31.9 (1.26) Malate, % of DM - 0.230 0.445 0.240
1 CON = control (not supplemented); MAL = control plus 4 g of disodium/calcium malate mixture (Rumalato; NOREL SA, Madrid, Spain) per kg of concentrate, providing 2.12 g of malate per kg of concentrate; YC = control plus 0.15 g of Saccharomyces cerevisiae CBS 493.94 (Yea-Sacc 1026, Alltech Inc., Nicholasville, KY) per kg of concentrate, providing 1.5 x 10⁸ cfu/ kg of concentrate. 2 A product based on refined olive soap stock (Refinación Industrial Oleícola SA, Ibros, Spain) that contained 10 g of ashes per kg DM and 990 g of ether extract per kilogram DM. Fatty acid profile (g/ kg ether extract): 640 of C18:1, 160 of C18:2, 110 of C16:0, and 38 of C18:0. 3 Mineral and vitamin premix contained according to the manufacturer (Comercial Pecuaria Segoviana SL, Segovia, Spain): 8,000 IU of vitamin A (retinil acetate), 1,600 IU of vitamin D3 (cholecalciferol), 6,000 IU of vitamin E (α-tocopheryl acetate), 7.9 mg of Cu (cupper sulfate), 0.7 mg of Co (cobalt (II) sulfate), 0.2 mg of Se (sodium selenite), 50 mg of Zn (zinc oxide), 35 mg of Mn (manganese oxide), 438 mg of Mg (magnesium oxide), 100 mg of S (potassium sulfate), 20 mg of Fe (iron sulfate) and 0.8 mg of I (potassium iodide). 4 Mean (SD) values of 3 composite period samples. Calculated chemical composition of control concentrate based on Fundación Española para el Desarrollo de la Nutrición Animal reference tables of feedstuffs composition (de Blas et al., 2010) was 93.5, 14.7, 22.8 and 32.0% of OM, CP, NDF and starch, respectively (DM basis). 5 ND = not determined. Chemical composition of adaptation concentrate was not determined. Calculated chemical composition based on Fundación Española para el Desarrollo de la Nutrición Animal (de Blas et al., 2010) was 88.0, 16.9, 38.6 and 4.9% of OM, CP, NDF and starch, respectively (DM basis).
41

Chapter III: Experiment 2
3.2.3. Ruminal fermentation products and blood metabolites
On days 0, 56, and 114, rumen fluid samples of each heifer were obtained between 2 and 2.5 hours after morning feeding by rumenocentesis. A needle of 12.5 cm long and 1.6 mm gauge was inserted into the ventral sac of the rumen in the center of the triangle between last rib, wing of ileum and transverse process of spine, and an aliquot (about 20 mL) of rumen fluid was obtained. The time of feed supply was adjusted to the expected time of blood and ruminal fluid sampling, and the pens of each treatment were consistently distributed across the collection period. Rumen samples were homogenized, the pH was immediately measured (Crison Basic 20 pH-meter; Crisson Instruments, Barcelona, Spain), and fermentation was stopped by swirling the samples in iced water. Five milliliters of fluid were added to 5 mL of deproteinizing solution (20 g of metaphosphoric acid and 0.6 g of crotonic acid/L) for VFA analysis, and 2 mL were added to 2 mL 0.5 M HCl for NH3-N and lactate determinations. Samples were immediately frozen (-20ºC) until analyses. In addition, blood samples (9 mL) were collected from each heifer by puncture of the median coccygeal vein into vacutainer tubes containing 143 United States Pharmacopeia units of sodium heparin. Samples were centrifuged (1,000 x g for 15 min at 4ºC), and the plasma was immediately frozen (-20ºC) until determination of glucose, urea-N and total lactate.
3.2.4. Analytical procedures
Dry matter (method 934.01), ash (method 942.05) and N (method 984.13) content of concentrates were determined according to the Association of Official Analytical Chemists (1999) and neutral detergent fiber (NDF) analyses were carried out according to Van Soest et al. (1991) using an ANKOM220 Fibre Analyzer unit (ANKOM Technology Corporation, Fairport, NY, USA). Sodium sulphite and heat-stable amylase were used in analysis of NDF and they were expressed inclusive of residual ash. Malate content of experimental concentrates was analyzed by HPLC-UV (Callaway et al., 1997).
Concentrations of VFA, ammonia-N, and total lactate in ruminal fluid were determined as described by García-Martínez et al. (2005). Plasma concentrations of glucose, urea-N and total lactate were determined by automated enzymatic methods adapted to a Cobas Integra 400 plus Analyzer (F. Hoffmann-La Roche Ltd., Basel, Switzerland).
3.2.5. Statistical analysis
The experimental unit for BW, ADG, concentrate ADFI, G:F, carcass-adjusted values, HCW, and carcass yield measurements was the pen (mean data for 6 heifers). The individual animal was the experimental unit for ruminal fermentation products, blood metabolites and carcass characteristics. Data on feed intake, growth performance, ruminal fermentation products and blood metabolites were analyzed as repeated measures using the PROC MIXED of SAS (SAS Inst. Inc., Cary, NC). A compound symmetry was used to model the covariance structure for the repeated measures. The statistical model included diet, time (sampling day) and diet x time interaction as fixed effects, and either pen or heifer as random effect, respectively. Carcass-adjusted final BW was calculated as HCW/average dressing percent for heifers in each treatment. Carcass-adjusted ADG and G:F were calculated from carcass-adjusted final BW. Those data were analyzed using the PROC GLM of SAS, and the model included diet as main effect. Data on HCW, dressing percentage, and carcass characteristics (carcass compactness index and leg compactness index) were analyzed using the PROC GLM of SAS, and the model included
42

Chapter III: Experiment 2
diet as main effect and final BW as a covariate. Data on carcass conformation were analyzed using the PROC GLIMMIX procedure of SAS. Data are presented as least square means. Significance was declared at P<0.05, and 0.05<P<0.10 values were considered to be a trend.
3.3. Results Malate content in CON concentrate was 2.30 g, and MAL diet had 4.45 g of malate
per kilogram of concentrate (Table 3.1). Daily average consumption of malate was 13.7 g, 26.3 g, and 14.2 g for heifers fed the CON, MAL, and YC diets, respectively.
As shown in Table 3.2, there were no differences among treatments on concentrate ADFI (P=0.98), BW (P=0.95), ADG (P=0.74) or G:F (P=0.50), and no treatment x time interactions were observed (P>0.10). Carcass-adjusted BW, ADG, and G:F values were similar among treatments (P=0.94, P=0.95 and P=0.92, respectively). Actual barley straw intake was not determined, but no differences among groups were detected in the amount of straw provided daily. Average straw intake over the trial was estimated to be about 120 g/kg of total DMI. As expected, concentrate ADFI and BW increased with time (P<0.001).
Table 3.2. Concentrate intake, BW, ADG, and G:F in heifers fed 1 of the following high-grain diets: control (not supplemented; CON), control plus 4 g of disodium/calcium malate mixture (MAL), or control plus 0.15 g of Saccharomyces cerevisiae CBS 493.94 (YC). Item and period (days of feed)
Treatment (TR) P = CON MAL1 YC2 SEM TR Time TR x Time
Concentrate ADFI, kg 0-28 5.680 5.710 5.650 0.139 0.98 <0.001 0.87 29-56 6.530 6.570 6.670 57-84 6.350 6.310 6.370 85-114 7.180 7.050 7.040
BW, kg 0 214 215 214 7.79 0.95 <0.001 0.85 28 241 242 242 56 272 275 274 84 298 303 300 114 335 338 335 ADG, kg 0-28 0.990 0.970 1.000 0.047 0.74 <0.001 0.67 29-56 1.100 1.190 1.140 57-84 0.930 1.010 0.950 85-114 1.210 1.160 1.140 G:F, kg/kg 0-28 0.173 0.170 0.174 0.2436 0.50 <0.001 0.53 29-56 0.167 0.180 0.170 57-84 0.143 0.159 0.149 85-114 0.168 0.162 0.161 Carcass-adjusted3 BW (114 d) 367 371 369 8.5 0.94 - - ADG (0 – 114 d) 1.100 1.120 1.110 0.05 0.95 - - G:F (0 – 114 d) 0.170 0.175 0.173 0.009 0.92 - -
1 Control plus 4 g of disodium/calcium malate mixture (Rumalato; NOREL SA, Madrid, Spain) per kilogram of concentrate, providing 2.12 g of malate per kg of concentrate. 2 Control plus 0.15 g of Saccharomyces cerevisiae CBS 493.94 (Yea-Sacc 1026; Alltech Inc., Nicholasville, KY) per kilogram of concentrate, providing 1.5 x 10⁸ cfu per kg of concentrate. 3 Carcass-adjusted final BW was calculated as HCW/average dressing percent.
43

Chapter III: Experiment 2
Hot carcass weight (P=0.86), dressing percentage (P=0.84), carcass compactness index (P=0.82) and leg compactness index (P=0.62) were not affected by experimental treatments (Table 3.3.). Carcass quality grade was also similar among experimental groups (P=0.18), and fat cover grade was 3 (average) for all heifers.
Table 3.3. Carcass characteristics of heifers fed 1 of the following high-grain diets: control (not supplemented; CON), control plus 4 g of disodium/calcium malate mixture (MAL), or control plus 0.15 g of Saccharomyces cerevisiae CBS 493.94 (YC).
Item Treatment
SEM P = CON MAL1 YC2
HCW, kg 202 201 200 2.5 0.86 Dressing proportion, kg carcass/100 kg BW 54.90 54.50 54.30 0.69 0.84 Carcass characteristics
Carcass compactness index3 1.83 1.80 1.81 0.034 0.82 Leg compactness index3 1.48 1.47 1.46 0.014 0.62 Quality grade (% within category)3 3.83 4.08 3.92 0.066 0.18
1 Control plus 4 g of disodium/calcium malate mixture (Rumalato; NOREL SA, Madrid, Spain) per kilogram of concentrate, providing 2.12 g of malate per kg of concentrate. 2 Control plus 0.15 g of Saccharomyces cerevisiae CBS 493.94 (Yea-Sacc 1026; Alltech Inc., Nicholasville, KY) per kilogram of concentrate, providing 1.5 x 10⁸ cfu per kg of concentrate. 3 Relationship between carcass length (from the cranial border of the first rib to the point of the pubic symphysis) and chest depth (from the ventral surface of the spinal canal, at fifth rib level, to the lowest point of the sternum). 4 Relationship between leg length (from the inner side of the tarsus –metatarsus joint to the point of the pubis symphisis) and perimeter (measured at the level of the crest of the ileum). 5 Determined according to European carcass grading system for conformation (1= superior; 2 = excellent; 3 = very good; 4 = good; 5 = fair; and 6 = poor).
Data on rumen fermentation products and blood metabolites are shown in Tables 3.4. and 3.5., respectively. No treatment x time interaction was detected for any rumen fermentation product measured (P>0.10). There were no effects of dietary treatment on ruminal pH (P=0.24), concentrations of NH3-N (P=0.82), lactate (P=0.93), and total VFA (P=0.69); and molar proportions of individual VFA (P>0.10). Sampling time influenced (P<0.01) all rumen fermentation products except the molar proportion of butyrate, which remained unaffected over the trial (P=0.49). The lowest ruminal pH was observed at d 56 (the average value across treatments was 5.44), and the highest value was observed at the end of the trial (6.09). Evolution of lactate and total VFA concentrations over the trial was the inverse of pH, and the highest concentrations were observed on d 56. Rumen NH3-N concentrations increased over the experimental period (P<0.001). Dietary treatments did not affect plasma concentrations of glucose (P=0.96), lactate (P=0.82) and urea-N (P=0.15), and no treatment x time interactions (P>0.10) were detected. Urea-N concentrations increased with time (P<0.001), but glucose and lactate concentrations remained unchanged during the trial (P=0.19 and P=0.27, respectively).
44

Chapter III: Experiment 2
Table 3.4. Rumen fermentation characteristics in heifers fed 1 of the following high-grain diets: control (not supplemented; CON), control plus 4 g of disodium/calcium malate mixture (MAL), or control plus 0.15 g of Saccharomyces cerevisiae CBS 493.94 (YC).
Sampling day
Treatment (TR) SEM
P = Item CON MAL1 YC2 TR Time TR x
time pH 0 5.77 5.65 5.91 0.112 0.24 <0.001 0.57 6 5.58 5.32 5.43 114 6.05 6.07 6.14 NH3-N, mg/L 0 44.40 42.50 43.60 4.83 0.82 <0.001 0.88
6 83.90 79.80 78.60 114 86.40 91.40 85.50
Lactate, mM 0 0.65 0.83 0.72 0.077 0.93 <0.001 0.38 6 1.05 0.93 1.07 114 0.83 0.81 0.81
Total VFA, mM 0 132 139 130 7.5 0.69 <0.001 0.89 6 168 173 171 114 143 139 134
Individual VFA, mmol/mmol Acetate 0 50.10 48.60 48.10 0.96 0.65 <0.001 0.57 6 50.20 49.40 51.10 114 53.80 53.80 53.70 Propionate 0 37.60 37.40 37.20 1.03 0.86 <0.001 0.61 6 37.60 38.70 36.70 114 31.40 31.70 32.80 Butyrate 0 8.04 9.20 9.68 0.674 0.84 0.49 0.36 6 8.37 8.32 8.43 114 9.32 9.19 8.21 Isobutyrate 0 0.46 0.42 0.54 0.052 0.93 <0.001 0.46 6 0.48 0.44 0.40 114 0.74 0.76 0.72 Isovalerate 0 0.50 0.46 0.54 0.145 0.55 <0.001 0.88 6 0.81 0.69 0.69 114 1.83 1.65 1.56 Valerate 0 3.07 3.56 3.63 0.178 0.27 <0.001 0.46 6 1.92 1.95 1.99 114 2.34 2.33 2.53 Caproate 0 0.37 0.46 0.35 1.104 0.97 0.01 0.53 6 0.63 0.53 0.75 114 0.65 0.63 0.58 Acetate/ Propionate, mol/mol
0 1.40 1.34 1.38 0.079 0.67 <0.001 0.90 6 1.37 1.29 1.42 114 1.75 1.74 1.71
1 Control plus 4 g of disodium/calcium malate mixture (Rumalato; NOREL SA, Madrid, Spain) per kilogram of concentrate, providing 2.12 g of malate per kg of concentrate. 2 Control plus 0.15 g of Saccharomyces cerevisiae CBS 493.94 (Yea-Sacc 1026; Alltech Inc., Nicholasville, KY) per kilogram of concentrate, providing 1.5 x 10⁸ cfu per kg of concentrate.
45

Chapter III: Experiment 2
Table 3.5. Blood metabolites in heifers fed 1 of the following high-grain diets: control (not supplemented; CON), control plus 4 g of disodium/calcium malate mixture (MAL), or control plus 0.15 g of Saccharomyces cerevisiae CBS 493.94 (YC).
Item and sampling day
Treatment (TR) P= CON MAL1 YC2 SEM TR Time TR x Time
Glucose, mg/dL d 0 70.92 69.49 71.01 3.642 0.96 0.19 0.99 d 56 73.17 73.56 74.35 d 114 74.41 75.27 75.90
Lactate, mg/dL d 0 7.11 6.92 6.64 0.669 0.82 0.27 0.98 d 56 8.05 7.36 7.47 d 114 7.50 7.28 7.38
Urea-N, mg/dL d 0 19.75 18.82 18.44 1.213 0.15 <0.001 0.59 d 56 25.73 22.53 22.71 d 114 33.70 31.95 30.23
1 Control plus 4 g of disodium/calcium malate mixture (Rumalato; NOREL SA, Madrid, Spain) per kilogram of concentrate, providing 2.12 g of malate per kg of concentrate. 2 Control plus 0.15 g of Saccharomyces cerevisiae CBS 493.94 (Yea-Sacc 1026; Alltech Inc., Nicholasville, KY) per kilogram of concentrate, providing 1.5 x 10⁸ cfu per kg of concentrate.
3.4. Discussion
This study was designed to assess the effects of malate and S. cerevisiae culture on growth performance, carcass quality, rumen fermentation products and blood metabolites in heifers raised under practical farm conditions in southern Europe. The diet was typical of those fed in the practice to growing/finishing beef cattle, and both additives were supplemented at the level recommended by the manufacturer. Dietary starch supply was close to 31% DM, with wheat and barley grains being the main starch sources, which agrees with the nutritional profile of high-grain diets that induces SARA (Owens et al., 1998; Dohme et al., 2008). The relatively high basal level of malate in CON was probably due to the presence of alfalfa meal, which is a natural source of malate (Callaway et al., 1997).
In agreement with previous studies in beef cattle supplemented daily up to 120 g of malate salts or malic acid (Martin et al., 1999; Montaño et al., 1999; Castillo et al., 2007; Carrasco et al., 2012; Vyas et al., 2015), malate supplementation did not affect either ADFI or cattle growth performance. In contrast, Martin et al. (1999) observed that ADG and G:F ratio significantly increased in steers receiving daily 60 or 120 g of malic acid during the 10-d step-up period. Because malate effects were not observed after 52 d of feed, Martin et al. (1999) suggested that, due to the high cost of malate, supplementation would be more practical when beef cattle first arrive at the feedlot rather than throughout the finishing period. Unfortunately, the concentrate fed to heifers during the adaptation period in the present study was not supplemented with malate. Moreover, it should be noted that in the study of Martin et al. (1999), steers were fed rolled corn-based concentrates that also contained lasalocid, whereas in the current study, the concentrate was based on wheat and barley grains and did not contain ionophores. In fact, Carro and Ranilla (2003)
46

Chapter III: Experiment 2
evaluated the effects of different doses of malate on in vitro rumen fermentation of different cereal grains and observed that corn showed a greater response than wheat and barley. To our knowledge only Martin et al. (1999) and Carrasco et al. (2012) have investigated the effects of malate supplementation on carcass characteristics of beef cattle, and the lack of effects observed in the current study agrees with their results, as well as with the absence of effects on BW and ADG.
The influence of malate supplementation on rumen fermentation seems to be dose-dependent (Martin et al., 1999; Carro and Ranilla, 2003), but is also affected by the type of diet and rumen microbial populations (Gómez et al., 2005; Tejido et al., 2005). The lack of effects of malate on rumen concentrations of NH3-N, lactate, and VFA observed in the current study is consistent with other studies in which beef cattle was fed high-grain diets and supplemented daily up to 134 g of malic acid or malate salts (Montaño et al., 1999; Carrasco et al., 2012; Vyas et al., 2015). However, Liu et al. (2009) reported that total VFA concentrations in the rumen of steers increased linearly by supplementing increasing doses of malic acid (up to 210 g/d), whereas NH3-N and lactate concentrations were reduced, and Martin et al. (1999) observed that total VFA in steers tended to decrease by increasing DL-malate inclusion up to 80 g/d and L-lactate concentrations remained unchanged. These results suggest that the effective dose of malate could depend on either S. ruminantium population in the rumen or on its capacity of metabolizing as well as on the concentration of other metabolites of the propionate production pathway.
The reported effects of malate supplementation on ruminal pH in vivo are also inconsistent. In agreement with current results, Carrasco et al. (2012) and Vyas et al. (2015) reported no efficacy of malate supplementation in elevating ruminal pH in heifers fed barley grain-based diets. In contrast, Martin et al. (1999) and Montaño et al. (1999) observed significant increases in rumen pH in cattle fed diets based on corn and barley grains, respectively, by supplementing 80 g of malic acid daily. In the current experiment, the basal diet contained 0.23% of malate and supplementation of malate salts increased it up to 0.45% which may have not been enough to cause a positive effect on pH (supply of 26.3 g/d). Moreover, the diet in the study of Martin et al. (1999) also included lasalocid. Because ionophores can stimulate the rate of utilization of organic acids (Callaway and Martin, 1997), this could have contributed to maintain rumen pH values. The diet fed to the animals seems to be an important factor influencing the effects of malate on ruminal pH. In fact, Foley et al. (2009) reported only a tendency towards an overall greater pH with increasing malate supplementation in steers fed a 40:60 forage-to-concentrate diet, even though daily supply of malate ranged from 325 to 983 g/d.
Consistent with that observed in the rumen, plasma concentrations of lactate, glucose, and urea-N were not affected by the inclusion of malate, which is in agreement with the results of other studies (Martin et al., 1999; Montaño et al., 1999; Carrasco et al., 2012) in which beef cattle were supplemented with malic acid or malate salts up to 120 g/d. In contrast, Castillo et al. (2007) reported that supplementing malic acid or a mixture of disodium and calcium malate at 4 g per kg of concentrate (DM basis) significantly lowered plasma L-lactate concentrations compared with unsupplemented bulls. Similarly, Hernández et al. (2011) reported that supplementing the diet of finishing bull calves with disodium/calcium malate salts (4 g/kg DM diet) lowered plasma concentrations of L-lactate, urea-N, and creatinine compared with unsupplemented animals. As previously discussed, the inconsistent results reported in the literature for the effects of malate supplementation on ruminal fermentation, plasma metabolites, or ruminant performance
47

Chapter III: Experiment 2
can be attributed to differences in the diet (i.e., forage: concentrate ratio, forage type, cereal grains, etc.), malate dose, chemical form in which malate was fed (i.e., free acid vs. salts), and characteristics of experimental animals such as physiological state, level of production, ruminal populations, etc. (Carro and Ungerfeld, 2015). Results indicate that greater levels of malate than those used in the current study are necessary to detect significant effects on in vivo rumen fermentation products and growth performance.
Yeast cultures can be supplied live and dried or dead with its culture media being a source of nutrients with prebiotic effect. In this study, a dried live S. cerevisae culture was supplied, and its daily supply in ad libitum feeding system provided a continued flow of yeast, as S. cerevisiae is viable only for only 24 to 30 h in the rumen (Kung et al., 1997; Durand-Chaucheyras et al., 1998). In agreement with previous studies (Vyas et al. 2014a, b), ADFI of heifers was unaffected by S. cerevisae. On the contrary, Mutsvangwa et al. (1992) reported an increase in ADFI with S. cerevisae supplementation, and Lascano et al. (2009) suggested that S. cerevisae inclusion in the diet tended to require less DMI to maintain growth, as compared to non-supplemented heifers on a restricted feed supply management. Despite these effects on ADFI, Mutsvangwa et al. (1992), Lascano et al. (2009), and Vyas et al. (2014a) did not observe a positive effect of S. cerevisae supplementation on growth or feed efficiency, which is in agreement with the current results. Accordingly to growth performance results, we did not find any effect on carcass characteristics, which is consistent with previous results in steers (Mir and Mir, 1994) and lambs (Issakowicz et al., 2013).
Saccharomyces. cerevisiae has been reported to stimulate lactate utilization by M. elsdenii and S. ruminantium (Callaway and Martin, 1997), and to reduce the incidence of SARA by increasing daily average ruminal pH and decreasing rumen lactic acid concentration (Desnoyers et al., 2009; Vyas et al. 2014a). In contrast, and in agreement with the current results, others (Mir and Mir, 1994; Lascano and Heinrichs, 2009; Moya et al., 2009, Vyas et al., 2014b) reported no influence of S. cerevisae supplementation on ruminal pH with different diets and levels of inclusion. Reported effects of S. cerevisae on rumen fermentation pattern are inconsistent and seem to be influenced by diet characteristics and the yeast strain, among other factors (Carro et al., 1992; Chaucheyras-Durand et al., 2012). In accordance with the results of other studies in beef cattle (Mir and Mir, 1994; Moya et al., 2009), supplementation did not influence VFA profile in current study.
The lack of effect of S. cerevisae on plasma levels of glucose, lactate, and urea-N is in agreement with the results of Stella et al. (2007) and Yalçm et al. (2011) in dairy goats and cows, respectively. Lascano et al. (2012) observed that glucose concentrations tended to increase quadratically with increasing doses of S. cerevisae (S. cerevisiae CBS 493.94; 1 x 10¹⁰ to 5 x 10¹⁰ cfu/d) in dairy heifers fed low starch diets (16.7% of DM). The greatest response on glucose concentration was obtained at 3 x 10¹⁰ cfu per day, which is 30-fold the daily dosage used in the current study.
The decrease in rumen pH is usually due to increased production of VFA and lactate. In the current study, rumen pH was negatively correlated with VFA concentrations (R2=0.78; all data included), but showed a poor correlation with lactate (R2=0.08). In addition, lactate concentrations were low (≤ 1 mM), which is indicative of SARA (Beauchemin and Penner, 2009). It has to be noted that ruminal fluid was obtained by rumenocentesis and metabolites and pH in the obtained fluid could not be representative
48

Chapter III: Experiment 2
of the rumen conditions as a whole. However, Duffield et al. (2004) concluded that rumenocentesis was the most accurate field technique for ruminal sampling compared to oral stomach tube, as rumenocentesis values were highly correlated to direct sampling through a cannula.
In conclusion, under the feeding and management conditions of this study, supplementation of either malate salts (2.12 g malate/kg of concentrate) or a live S. cerevisiae culture (1.5 x 10⁸ cfu/kg of concentrate) had no effect on growth performance, carcass quality, ruminal fermentation products and blood metabolites in feedlot heifers.
49

Chapter III: Experiment 2
50

CHAPTER IV: EXPERIMENT 3
“Performance, carcass and ruminal fermentation characteristics of heifers fed concentrates differing in energy level and cereal
type (corn vs. wheat)”
51

Chapter IV: Experiment 3
52

Chapter IV: Experiment 3
4.1. Introduction
A large part of Spanish beef production is based on feeding ad libitum cereal concentrates and straw, with the concentrate reaching over 85% of total dry matter intake (Gimeno et al., 2014; Verdú et al., 2015). High-concentrate diets favour beef growth, but an excessive amount of rapidly fermented starch in the rumen could result on SARA, which is commonly stated as a reduction in ruminal pH below 5.8, mainly due to VFA and lactate accumulation in the rumen (Calsamiglia et al., 2012).
The structure and composition of cereal starches and the physical interactions between starch and protein can influence the digestibility and feeding value of cereal grains for ruminants (Rooney and Pflugfelder, 1986). Ruminal degradation of starch from corn grain is limited by its vitreousness, which reflects the association between starch and protein in the endosperm. In the vitreous endosperm, starch granules are surrounded by proteins and embedded in a dense matrix that limits the accessibility of microbial enzymes to starch (Corona et al., 2006). In contrast, the protein matrix of wheat is more diffuse and does not hamper the access of ruminal microbes to starch granules (McAllister et al., 2006). Although the endosperm in different wheat types differs in hardness, all wheat types are digested more rapidly than corn in the rumen (Yang et al., 2014), and greater in situ disappearance rates and theoretical degradability values for wheat compared to corn have been reported (0.302 vs. 0.058%/h and 90.1 vs. 58.4%, respectively; Bacha, 1991).
Therefore, a high proportion of wheat in the concentrate could favour SARA incidence compared with corn, especially in diets with low effective NDF content (Owens et al., 1997). However, most of scientific research to evaluate the dietary effects of corn and wheat has been carried out in dairy cows (reviewed by Ferraretto et al., 2013). Some comparative studies have also been conducted with beef cattle, but in most of them the concentrates also included monensin, which is currently banned in Europe and can mask the effects of different cereals on ruminal fermentation (Yang et al., 2014). In addition, the response of beef cattle to corn and wheat-based concentrates, as measured by feedlot performance, may be influenced by the rest of the ingredients in the diet, which, in turn, determine its energy level. Our hypothesis is that the use of wheat instead of corn in high energy diets, with low NDF content and without monensin, may increase the risk of SARA and have an impact on growth performance and ruminal fermentation, whereas the effect of cereal type could be insignificant in low energy diets.
Therefore, the objective of the current study was to assess the interaction of cereal type (corn vs. wheat) and energy level of the diet on growth performance, carcass quality and ruminal fermentation characteristics of beef cattle.
4.2. Materials and methods
The experimental protocols were approved by the institutional Animal Care Committee of the Technical University of Madrid (Madrid, Spain), and the study was conducted in accordance with the Spanish guidelines for experimental animal protection (Royal Decree 53/2013 of February 1st on the protection of animals used for experimentation or other scientific purposes; Boletín Oficial del Estado, 2013).
53

Chapter IV: Experiment 3
4.2.1. Animals, diets and experimental design
A total of 144 Charolaise cross heifers were used. Upon arrival to the experimental farm (Comercial Pecuaria Segoviana SL, Coca, Spain) each animal was weighed, treated for endo- and ecto-parasites with ivermectin (1 mL per 50 kg BW, Ivomec, Merial Laboratorios SA, Barcelona, Spain) and vaccinated against infectious bovine rhinotracheitis, parainflueza-3 and bovine viral diarrhoea (2 mL per animal, Cattlemaster-4, Zoetis Spain SLU, Madrid, Spain), enterotoxemia and carbuncle (2 mL per animal, Miloxan, Merial Laboratorios SA, Barcelona, Spain). A booster dose was given 3 weeks later.
Before starting the trial, all heifers were fed an adaptation diet consisting of concentrate and barley straw for 7 days. Concentrate was provided twice a day, and the amount provided was recorded. Fresh water and straw was freely accessible at all times. The main ingredients in the concentrate were sunflower seed, olive pulp, soybean hulls, corn grain, corn DDGS, barley straw pelleted, sugar beet pulp, rice bran, soybean meal, palm kernel meal, peas meal, calcium carbonate, sepiolite, wheat middling, sodium chloride and animal fat (189, 100, 100, 100, 100, 100, 70, 60, 50, 30, 28, 25, 24, 15, 7 and 2 g/kg fresh matter (FM), respectively). Calculated chemical composition based on FEDNA (de Blas et al., 2010) was 88.0, 16.9, 38.6 and 4.9% of organic matter, crude protein, neutral detergent fibre and starch, respectively (DM basis).
At the beginning of the experimental period, heifers were weighted and assigned to 24 pens (6 heifers each) according to their BW (average 218 ± 26.4 kg). The pens were 5.0 m x 7.0 m, had continuous concrete floor, and barley straw was used as bedding material. Pens were randomly allotted to one of the four experimental treatments (6 pens per treatment) following a totally randomized experimental design. Four concentrates were formulated following National Research Council (2000) requirements for growing/finishing heifers of 350 kg BW and 1.5 kg ADG according to a 2 × 2 factorial arrangement of treatments. The concentrates had energy levels of 1,452 kcal of net energy (NE)/kg (low energy; 713 and 739 kcal of NE for maintenance and growth per kg, respectively) or 1,700 kcal NE/kg (high energy; 835 and 865 kcal of NE for maintenance and growth per kg, respectively), and the main cereal type was either corn or wheat. Ingredient and chemical composition of the concentrates are shown in Table 4.1. Feed ingredients were ground (3 mm diameter pore sieve) and particle size was determined by dry sieving of a 400 g representative sample of each concentrate before pelleting. Samples were passed through sieves of 4.76, 2.36, 1.40, 0.80, 0.50 and 0.30 mm, and the amount of particles retained on each screen size was calculated.
Concentrate and full-length barley straw were provided separately ad libitum twice a day (0700 and 1800 h), and their supply was recorded daily throughout the trial. Concentrates were pelleted (3.5 mm diameter) to reduce feed selection and refusals, and supplied into a 1.5 m x 0.2 m line feed bunk. Concentrate supply was controlled by registering the number of packs provided to each pen per day. In addition, feed refusals were observed daily at feeding time to adjust the amount supplied to allow for 5% refusals, and orts were removed and weighed when any spoilage was detected. Straw was offered in a separate feed bunk. Straw was provided equally to each pen, adjusted daily at feeding time to allow for 5% average refusals in the feeder. However, some straw refusals dropped on the floor and formed part of bedding material. Therefore, the actual straw intake per pen could not be quantified.
54

Chapter IV: Experiment 3
Table 4.1. Ingredients and chemical composition of the experimental concentrates1 Ingredient, g/kg as fed basis
Corn Wheat Low energy High energy Low energy High energy
Wheat grain - - 405 405 Barley grain 100 100 105 105 Corn grain 400 400 - - Wheat middlings 156 65.0 160 65.0 Sunflower seed 96.0 76.1 96.0 80.0 Soybean meal (47% CP) 74.9 59.2 50.7 32.6 Palm kernel meal 63.5 80.0 65.0 80.0 Barley straw2 62.7 35.6 64.8 35.6 Peas meal - 120 - 125 Sepiolite 20.0 - 20.0 - Calcium carbonate 19.3 11.0 19.4 11.3 Oleine3 - 14.8 08.8 15.0 Calcium soap4 - 30.0 - 30.0 Fat, rumen inert5 - - - 09.4 Monocalcium phosphate 02.6 02.2 - - Sodium chloride 02.9 03.6 02.8 03.6 Mineral/vitamin premix6 02.5 02.5 02.5 02.5 Chemical composition7
Dry matter (g/kg) 878 (5.3) 895 (3.2) 888 (9.2) 900 (1.5) Organic matter (g/kg DM) 930 (5.2) 934 (5.2) 931 (6.6) 943 (7.8) Crude protein (g/kg DM) 170 (9.1) 167 (7.9) 171 (4.5) 177 (4.9) Ether extract (g/kg DM) 35.8 (4.6) 74.1 (4.9) 36.3 (13.9) 75.1 (15.4) Neutral detergent fibre (g/kg
DM) 241 (12.9) 216 (9.5) 250 (8.7) 222 (7.9)
Starch (g/kg DM) 395 (18.8) 403 (29.3) 383 (5.9) 390 (17.5) Particle size (%)8
> 4.76 mm 00.87 00.37 01.62 00.87 2.36 – 4.76 mm 01.50 01.24 01.24 01.25 1.40 – 2.36 mm 08.50 11.41 12.22 13.00 1.00 – 1.40 mm 17.75 15.90 18.42 18.50 0.80 – 1.00 mm 08.25 11.06 08.97 11.00 0.50 – 0.80 mm 18.88 20.25 16.70 19.13 0.30 – 0.50 mm 22.87 22.38 18.68 21.12 0 – 0.30 mm 21.38 17.39 22.15 15.13
Total > 1 mm 28.62 28.92 33.50 33.62 Total < 1 mm 71.38 71.08 66.50 66.38
1 Low energy: 1,453 kcal NE/kg; High energy: 1,700 kcal NE/kg (fresh matter basis, according to FEDNA (de Blas et al., 2010)). 2 A product based on barley straw treated with NaOH and pelleted. 3 A product based on olive soapstock (Refinación Industrial Oleícola SA, Ibros, Spain): Contained 980 g of ether extract/kg DM. Fatty acid profile (g/kg ether extract): 640 of C18:1, 160 of C18:2, 110 of C16:0, and 38 of C18:0. 4 Mixed fat calcium soap (Comercial Pecuaria Segoviana SL, Coca, Spain): Contained 850 g of ether extract/kg DM. Fatty acid profile (g/kg ether extract): 475 of C16:0, 370 of C18:1, 85 of C18:2 and 45 of C18:0. Ca content: 90 g/kg of DM. 5 Hydrogenated fat (Mateos SL, Cabezón de Pisuerga, Spain) containing 985 g of ether extract/kg of DM. Fatty acid profile (g/kg of ether extract): 470 of C16:0, 430 of C18:0 and 80 of C18:1. 6 Mineral and vitamin premix (Comercial Pecuaria Segoviana SL, Segovia, Spain) contained: 8,000 IU of vitamin A (retinyl acetate), 1,600 IU of vitamin D3 (cholecalciferol), 6,000 IU of vitamin E (α-tocopheryl acetate), 7.9 mg of Cu (copper sulfate), 0.7 mg of Co (cobalt (II) sulfate), 0.2 mg of Se (sodium selenite), 50 mg of Zn (zinc oxide), 35 mg of Mn (manganese oxide), 438 mg of Mg (magnesium oxide), 100 mg of S (potassium sulfate), 20 mg of Fe (iron sulfate) and 0.8 mg of I (potassium iodide). 7 Mean values (± standard deviation) of five samples. 8 Particle size of ground feed ingredients before pelleting.
55

Chapter IV: Experiment 3
4.2.2. Data collection and carcass measurements
On days 42, 84, 126 and 168, all animals were individually weighed and concentrate refusals in each pen were determined to calculate the following productive variables: ADG (kg/d), concentrate average daily intake (cADI, kg FM/d) and concentrate to gain ratio (F:G). In addition, feed refusals were observed daily at feeding time to adjust the amount supplied, and orts were removed and weighed when any spoilage was detected.
On day 168 of trial, animals were slaughtered at a commercial slaughterhouse (MACRISA Matadero de Castilla Rioseco SA; Medina de Rioseco, Valladolid, Spain). Three heifers per pen, which had been ruminally sampled as described below, were selected to determine individual hot carcass weight and carcass characteristics. The dressing percentage was calculated as the relationship between hot carcass weight and BW at 168 days of trial. Carcass compactness index was calculated as the relationship between carcass length and chest depth. Carcass length was determined on the hanged hot left mid-carcass as the length from the cranial border of the first rib to the point of the pubic symphysis, and chest depth was measured from the ventral surface of the spinal canal (at fifth rib level) to the lowest point of the sternum. Leg compactness index was calculated as the relationship between leg length and perimeter. Leg length was measured from the inner side of the tarsus-metatarsus joint to the point of the pubis symphysis, and leg perimeter was measured at the level of the crest of the ileum. Carcass conformation was determined following the European carcass grading system (Council Regulation (EC) No 1183/2006 of 24 July 2006 concerning the Community scale for the classification of carcasses of adult bovine animals; Official Journal of the European Union, 2006) according to the following conformation classes: S (superior), E (excellent), U (very good), R (good), O (fair) and P (poor), and to five degrees of fat cover: 1 (poor), 2 (slight), 3 (average), 4 (high) and 5 (very high).
The procedure used to evaluate rumen papillae characteristics has been described by Carrasco et al. (2012). Briefly, a 30 x 30 cm rumen wall sample was collected from the ventral area after evisceration and rumen content evacuation. Ventral area of the rumen was identified using the esophagus and spleen as physical references. Samples were stored at 5ºC until visual evaluation within 4 h after slaughtering. Rumen samples were washed with saline solution (85 g NaCl/L) and displayed on a white surface under an intense and homogeneous light to evaluate their colour (1 – pale; 2 – pale-pink; 3 – pink-green; 4 – green; 5 – dark green) and papilla length (1 – very short; 2 – short; 3 – medium; 4 – long). The evaluation was performed by four trained judges, and the average score was used for the statistical analysis.
4.2.3. Ruminal fermentation characteristics
On days 1, 84 and 168, individual ruminal fluid samples (about 20 mL) of three representative heifers per pen (heifers having maximum and minimum initial BW were excluded) were obtained between 2 and 3 hours after morning feeding by rumenocentesis. A needle of 12.5 cm long and 1.6 mm diameter was inserted into the ventral sac of the rumen in the centre of the triangle between last rib, wing of ileum and transverse process of spine, and an aliquot (about 20 mL) of rumen fluid was obtained. The time of feed supply was adjusted to the expected time of ruminal fluid sampling, and the pens of each treatment were consistently distributed across the collection period. Ruminal samples were
56

Chapter IV: Experiment 3
homogenized, the pH was immediately measured (Crison Basic 20, Crisson Instruments, Barcelona, Spain), and fermentation was stopped by swirling the samples in iced water. Five millilitres of fluid were then added to 5 mL of deproteinizing solution (20 g of metaphosphoric acid and 0.6 g of crotonic acid per L) for VFA analysis and 2 mL were added to 2 mL of 0.5 M HCl for NH3-N and lactate determination. Samples were immediately frozen (-20ºC) until analyses. Unfortunately, lactate analyses could not be performed due to a problem during the handling of samples.
4.2.4. In vitro fermentation of concentrates
Five samples of each experimental concentrates were collected throughout the experiment. They were mixed within each experimental treatment, ground through a 1 mm pore sieve and weighed (400 mg DM) into 120 mL serum bottles. Ruminal fluids from other eight heifers fed high-grain concentrates (60% cereals, being a mixture of barley, wheat and corn) and straw were taken in pre-warmed thermal flasks and immediately transported to the laboratory. The contents of randomly selected pairs of heifers were mixed, and strained through four layers of cheesecloth into an Erlenmeyer flask with an O2-free headspace to obtain four ruminal fluids. Particle-free fluid was mixed with the buffer solution (no trypticase added) of Goering and Van Soest (1970) in a proportion 1:4 (v/v) at 39ºC under continuous flushing with CO2. Four bottles with each concentrate and eight bottles without substrate (blanks; two per inoculum) were incubated. Forty millilitres of buffered rumen fluid were added into each bottle under CO2 flushing. Bottles were sealed with rubber stoppers and aluminium caps and incubated at 39ºC. After 17 h of inoculation (corresponding to a rumen passage rate of 0.06/h), total gas production was measured using a pressure transducer (HD2304.0 pressure gauge, DELTA OHM, Italy) and a plastic syringe. Bottles were then uncapped and the pH was measured immediately with a pH meter (Crison Basic 20, Crisson Instruments, Barcelona. Spain). Fermentation was stopped by swirling the bottles in ice, and the content of the bottles were sampled for VFA, NH3–N and lactate analysis as described above.
4.2.5. Analytical procedures
Dry matter (ID 934.01), ash (ID 942.05), nitrogen (ID 984.13), starch (ID 920.40) and ether extract (ID 920.39) content of concentrates were determined (n = 5) according to the Association of Official Analytical Chemists (1999). Neutral detergent fibre analyses were carried out according to Van Soest et al. (1991) using an ANKOM220 Fibre Analyzer unit (ANKOM Technology Corporation, Fairport, NY, USA). Sodium sulphite and heat-stable amylase were used in the analysis of NDF and results were expressed inclusive of residual ash.
Durability was measured using a durabilimeter (Mabrik, Barcelona, Spain). A sample of 500 g of pellets was inserted. After tumbled for 10 min, the pellets were passed through a 1.4 mm pore sieve, and the amount of particles retained measured. Durability was expressed as the ratio of retained particles to the sample weight before tumbling, multiplied by 100.
Samples of ruminal fluid were defrosted at 4ºC, centrifuged (13,000 x g, 20 min, 4ºC) and the supernatant used for analyses. Analysis of VFA were performed as described by Carro et al. (1999) using a Shimadzu GC 2010 gas chromatography (Shimadzu Europa GmbH, Duisburg, Germany) heated at 150ºC and equipped with a flame ionization detector and a TR-FFAP column (30 m x 0.53 mm x 1 μm; Supelco, Madrid, Spain).
57

Chapter IV: Experiment 3
Helium and crotonic acid were used as carrier gas and internal standard, respectively; and peaks were identified by comparison with standards of known individual VFA concentrations. Total lactate and NH3-N concentrations were determined by the colorimetric methods described by Taylor (1996) and Weatherburn (1967), respectively.
4.2.6. Statistical analysis
The experimental unit for BW, ADG, concentrate ADFI and F:G measurements was the pen (averaged data for 6 heifers). Data were analysed as Repeated Measures procedure within General Lineal Model of IBM SPSS Statistics v. 19 (SPSS). A compound symmetry was used to model the covariance structure for the repeated measures. The statistical model included cereal type (corn vs. wheat), energy level (low vs. high), time (sampling day) and their interactions as main effects, and initial BW was used as a covariate. Data on ruminal characteristics were analysed with the same model, using the pen as the experimental unit (averaged data for 3 heifers) and excluding the BW as a covariate.
The experimental unit for carcass weight, dressing percentage and carcass characteristics (carcass compactness index and leg compactness index) was also the pen (averaged data of 3 heifers). Data were analysed through an ANOVA. The statistical model included cereal type, energy level, and the cereal type x energy level interaction as main effects, and final body weight as a covariate. Regardless the experimental unit was the pen, in carcass quality data (quality and fat cover grade) and rumen colour and papillae length scores the experimental unit was the individual heifer as they were discrete variables, and were analysed using the Chi-square independence test for categorical variables of SPSS.
In vitro data were analysed as a mixed model (n=4), with cereal type, energy level, and the cereal type x energy level interaction as fixed effects, and inoculum as a random effect. Within each experimental diet, there were four values for each of the measured variables in the in vitro fermentations. For all statistical analyses, significance was declared at P<0.050, and 0.050<P<0.10 values were considered to be a trend.
4.3. Results
4.3.1. Intake and growth performance
Chemical analysed composition, durability and particle size of experimental concentrates are shown in Table 4.1. The effect of treatments on performance is shown in Table 4.2. Cereal type did not affect (P>0.100) BW, ADG or concentrate ADFI, but heifers fed corn tended to have greater F:G ratio than those fed wheat (5.52 vs. 5.28 kg/kg, respectively; P=0.089). The energy level did not affect BW or ADG, but heifers fed the high-energy concentrates had lower concentrate ADFI (P=0.011) and F:G ratio (P=0.002) than those fed the low-energy ones (6.97 vs. 7.29 kg/d, and 5.14 vs. 5.66 kg/kg, respectively). No cereal type x energy level interactions (P>0.100) were detected for any of these variables. Although the actual intake of straw could not be quantified, the amount of straw supplied per pen was registered and there were no differences among experimental treatments.
58

Chapter IV: Experiment 3
Table 4.2. Effect of cereal type (CT) and energy level (EL) in the concentrate on body weight (BW), average daily gain (ADG), concentrate average daily intake (ADFI) and feed:gain ratio (F:G) of heifers during the experimental period1
Item and period (days of feed)
Corn Wheat P =2
Low energy
High energy
Low energy
High energy SEM CT EL CT x
EL Time CT x time
EL x time
BW (kg) 42 273 270 269 271 7.1 0.978 0.364 0.971 0.010 0.691 0.069 84 336 338 335 335 126 387 395 390 394 168 440 449 442 452
ADG (kg/d) 0 – 42 1.39 1.33 1.31 1.36 0.065 0.731 0.199 0.979 0.286 0.722 0.629 43 – 84 1.49 1.62 1.56 1.52 85 – 126 1.23 1.36 1.32 1.39 127 – 168 1.15 1.18 1.13 1.28
ADFI (kg/d) 0 – 42 5.88 5.60 5.57 5.48 0.173 0.130 0.011 0.728 0.107 0.299 0.022 43 - 84 7.47 7.32 7.24 6.94 85 - 126 7.82 7.72 7.96 7.46 127 - 168 8.26 7.64 8.12 7.56
F:G (kg/kg) 0 - 42 4.26 4.27 4.27 4.06 0.207 0.089 0.002 0.830 0.281 0.859 0.097 43 - 84 5.02 4.55 4.66 4.56 85 - 126 6.50 5.71 6.05 5.39 127 - 168 7.26 6.58 7.23 6.04
1 Low energy: 1,452 kcal NE/kg; High energy: 1,700 kcal NE/kg (fresh matter basis). 2 No CT x El x time interactions were detected (P values between 0.176 and 0.662).
As expected, time significantly affected BW (P=0.010), but ADG, concentrate ADFI and F:G ratio were not affected by time (P>0.100). There were no cereal type x time or cereal type x energy level x time interactions (P>0.100). However, there was an energy level x time interaction for concentrate ADFI (P=0.022): low energy concentrate ADFI increased along the time while concentrate ADFI of high energy concentrate was depressed at the end of the trial (8.19 vs. 7.60 kg in period 127 – 168 d). In addition, heifers fed high energy diets tended to show a greater BW from d 96 of trial than low energy ones (P=0.069); and heifers fed high energy diets tended to have a lower F:G ratio (P=0.097) than heifers fed low energy diets from d 85 of trial.
4.3.2. Carcass characteristics
Hot carcass weight, dressing percentage and carcass characteristics (carcass compactness index, leg compactness index, carcass conformation and fat cover grade) were not affected either by cereal type or energy level, and no cereal type x energy level interactions were detected for any of these variables (P>0.100; Table 4.3).
59

Chapter IV: Experiment 3
Table 4.3. Effect of cereal type (CT) and energy level (EL) in the concentrate on carcass characteristics of heifers1. Corn Wheat
SEM
P =
Item Low
Energy High
Energy Low
Energy High
Energy CT EL CT x EL
Hot carcass weight (kg) 247 249 248 250 4.3 0.639 0.373 0.998
Dressing proportion (%) 53.80 54.40 54.10 54.70 0.93 0.622 0.327 0.970
Carcass characteristics Carcass compactness index2 1.96 1.95 1.94 1.96 0.04
0 0.74
5 0.744 0.601
Leg compactness index3 1.45 1.45 1.47 1.44 0.031
0.697 0.489 0.562
Quality grade (%)4
U - Very good 50.00 38.89 33.33 33.33 N/A 0.281 0.655 0.658
R - Good 50.00 61.11 66.67 66.67 Fat cover grade (%)5
2 - Slight 62.50 55.56 56.25 62.50 N/A 0.964 0.964 0.960
3 - Average 37.50 44.44 43.75 37.50
1 Low energy: 1,452 kcal NE/kg; High energy: 1,700 kcal NE/kg (fresh matter basis). 2 Relationship between carcass length (from the cranial border of the first rib to the point of the pubic symphysis) and chest depth (from the ventral surface of the spinal canal, at fifth rib level, to the lowest point of the sternum). 3 Relationship between leg length (from the inner side of the tarsus –metatarsus joint to the point of the pubis symphysis) and perimeter (measured at the level of the crest of the ileum). 4 Determined according to European carcass grading system for conformation: 1 (S – Superior), 2 (E –Excellent), 3 (U – Very good), 4 (R – Good), 5 (O – Fair), and 6 (P - Poor). 5 Determined according to European carcass grading system for fat cover: 1 (poor), 2 (slight), 3 (average), 4 (high) and 5 (very high).
4.3.3. Ruminal fermentation characteristics
Rumen fermentation characteristics are shown in Table 4.4. The cereal type did not affect ruminal pH, NH3-N concentrations or molar proportions of individual VFA, with the exception of valerate proportion, which tended to be lower for corn compared with wheat (2.33 vs. 2.73 mol/100 mol, respectively; P=0.052). Heifers fed corn concentrates tended to show greater total VFA concentrations than those fed wheat (140 vs. 132 mM, respectively; P=0.070). There were not differences (P>0.050) due to energy level in either ruminal pH or concentrations of total VFA and NH3-N, but heifers fed the high-energy concentrates had greater isovalerate proportions and lower caproate proportions than those fed low-energy concentrates (1.39 vs. 1.02 mol/100 mol, P=0.019; and 0.55 vs. 0.76 mol/100 mol, P=0.040; respectively). Cereal type x energy level interactions were detected for molar proportions of acetate (P=0.048), propionate (P=0.020) and acetate/propionate ratio (P=0.020). Whereas the low energy wheat-based concentrate promoted greater acetate and lower propionate proportions compared with the high energy one, the opposite was observed for the corn-based concentrates. As a consequence, high energy wheat-based diets and low energy corn-based diets had the highest acetate/propionate values.
60

Table 4.4. Effect of cereal type (CT) and energy level (EL) on ruminal fermentation characteristics of heifers over the experimental period1
Item and period (days of feed)
Corn Wheat P = Low
energy High
energy Low energy
High energy SEM CT EL CT x EL Time CT x time EL x time
pH d 1 5.97 5.86 5.95 6.01 0.134 0.154 0.112 0.323 0.003 0.914 0.244 d 84 5.84 5.96 5.79 6.32 d 168 6.16 6.31 6.34 6.37
NH3-N (mg/L) d 1 94.90 80.20 64.50 64.10 13.30 0.836 0.362 0.908 0.001 0.013 0.985 d 84 40.80 36.40 61.70 54.40
d 168 64.10 59.00 66.10 54.90 Total volatile fatty
acids (VFA; mM)
d 1 165 174 150 163 7.6 0.070 0.614 0.816 <0.001 0.743 0.241 d 84 140 135 137 117 d 168 117 109 113 109
Individual VFA (mol/100 mol) Acetate
d 1 54.20 51.30 52.50 54.20 1.35 0.307 0.944 0.048 0.004 0.087 0.279 d 84 51.00 48.00 51.30 52.60 d 168 53.70 54.70 52.50 54.60
Propionate d 1 25.90 29.80 30.10 27.70 1.82 0.728 0.756 0.020 <0.001 0.097 0.718 d 84 37.00 39.50 36.80 32.70 d 168 32.00 32.50 34.80 32.30 1 Low energy: 1,452 kcal NE/kg; High energy: 1,700 kcal NE/kg (fresh matter basis). No CT x EL x time interactions (P values between 0.412 and 0.921) were detected
for any measured parameter.
61
Chapter IV: Experim
ent 3

Table 4.4. Effect of cereal type (CT) and energy level (EL) on ruminal fermentation characteristics of heifers over the experimental period1 (continued)
Item and period (days of feed)
Corn Wheat P = Low
energy High
energy Low energy
High energy SEM CT EL CT x EL Time CT x time EL x time
Butyrate
d 1 13.70 12.90 10.90 12.90 0.125 0.839 0.706 0.196 <0.001 0.689 0.491 d 84 8.00 8.78 7.22 9.48 d 168 10.20 8.51 8.00 8.71
Isobutyrate d 1 0.57 0.57 0.61 0.67 1.072 0.197 0.395 0.087 <0.001 0.508 0.155 d 84 0.57 0.20 0.24 0.33 d 168 0.67 0.83 0.71 0.94
Valerate d 1 3.53 3.66 3.66 3.67 0.331 0.052 0.327 0.652 <0.001 0.244 0.396 d 84 2.00 1.81 2.74 2.62 d 168 1.63 1.37 2.21 1.47
Isovalerate d 1 1.17 1.02 0.78 0.90 0.246 0.597 0.019 0.204 0.002 0.585 0.057 d 84 0.88 1.30 0.61 1.67 d 168 1.42 1.68 1.28 1.76
Caproate d 1 0.95 0.71 0.93 0.85 0.170 0.289 0.040 0.611 <0.001 0.568 0.721 d 84 0.66 0.51 1.05 0.58 d 168 0.44 0.33 0.54 0.30
Acetate/propionate (mol/mol) d 1 2.23 1.79 1.86 2.08 0.150 0.782 0.963 0.020 <0.001 0.258 0.628 d 84 1.43 1.23 1.41 1.67 d 168 1.74 1.71 1.54 1.72
1 Low energy: 1,452 kcal NE/kg; High energy: 1,700 kcal NE/kg (fresh matter basis). No CT x EL x time interactions (p values between 0.412 and 0.921) were detected for any measured parameter.
62
Chapter IV: Experim
ent 3

Chapter IV: Experiment 3
All ruminal variables measured were significantly affected by sampling time (sampling day throughout the trial). Ruminal pH increased (P=0.003) with time, whereas NH3-N and total VFA concentrations decreased (P=0.001 and P<0.001, respectively). No energy level x time interactions were detected, with the exception of a trend observed for isovalerate proportion (P=0.057), which was continuously increased along time in high energy diet, whereas isovalerate concentration of low energy diets increased only at d 168. In contrast, cereal type x time interactions were detected for NH3-N concentrations (P=0.013), that decreased on d 84 more in corn diets than in wheat ones. Also, molar proportions of acetate and propionate tended to increase or decrease, respectively, more in corn than wheat diets on d 84 of trial (P=0.087 and 0.097, respectively). No cereal type x energy level x time interactions were observed for any ruminal parameter (P>0.100).
Rumen papillae characteristics are shown in Table 4.5. Heifers fed corn had shorter papilla (P=0.013) and tended to show lighter rumen colour (P=0.064) than those fed wheat, whereas heifers fed the high-energy concentrates had shorter (P=0.048) and tended to have darker papilla (P=0.057) than those fed the low-energy ones.
Table 4.5. Effect of cereal type (CT) and energy level (EL) in the concentrate on rumen wall characteristics1. Corn Wheat
SEM4
P=
Item Low
Energy High
Energy Low
Energy High
Energy CT EL CT x EL
Papilla length2 (%) Very short 6.25 11.11 6.25 25.00 N/A 0.013 0.048 0.010
Short 12.50 44.44 6.25 12.50 Medium 43.75 16.67 62.50 62.50 Long 37.50 27.78 25.00 0.00
Colour3 (%) Pale 18.75 0.00 6.25 0.00 N/A 0.064 0.057 0.001
Pale-pink 6.25 0.00 18.75 0.00 Pink 31.25 5.56 0.00 18.75 Pink-Green 12.50 5.56 25.00 50.00 Green 25.00 50.00 31.25 25.00 Dark green 6.25 38.89 18.75 6.25 1 Low energy: 1,452 kcal NE/kg; High energy: 1,700 kcal NE/kg (fresh matter basis). 2 Papilla length
was determined according to a subjective scale: 1 (very short), 2 (short), 3 (medium) and 4 (long). 3 Colour was scored as: 1 (pale), 2 (pale-pink), 3 (pink-green), 4 (green) and 5 (dark green). 4 SEM: standard error of the mean of CT x EL interaction (n=6).
4.3.4. In vitro fermentation characteristics
Data on in vitro fermentation are shown in Table 4.6. There were no differences (P>0.067) due to cereal type in any of the variables determined in the in vitro incubations, but pH tended to be greater for wheat compared with corn (6.56 vs. 6.53 respectively; P=0.067) and acetate proportion tended to be greater for corn compared with wheat (55.85 vs. 55.35 mol/100 mol, respectively; P=0.068). The fermentation of high-energy concentrates resulted in lower (P<0.001) gas production, total VFA production and acetate molar proportions, but in greater (P<0.050) pH, NH3-N concentration, and molar proportions of butyrate, isovalerate, valerate and caproate, than the low-energy
63

Chapter IV: Experiment 3
concentrates. Cereal type x energy level interactions were observed for pH (P=0.030), gas production (P=0.003) and acetate proportions (P=0.025), as those values were similar in corn and wheat low-energy diets, but high-energy wheat based diets obtained the highest pH and lowest gas and acetate production rates, whereas high energy corn-based diets showed intermediated values.
Table 4.6. Effect of cereal type (CT) and energy level (EL) on in vitro ruminal fermentation characteristics of the experimental concentrates after 17 h incubation1 Corn Wheat P=
Item Low energy
High energy
Low energy
High energy SEM CT EL CT x
EL
pH 6.51 6.55 6.51 6.60 0.015 0.067 <0.001 0.030 Gas (µmol) 306000 282300 318500 254500 50.2 0.163 <0.001 0.003 NH3-N (mg/L) 16300 18000 16300 17500 3.2 0.472 0.002 0.467 Lactate (mg/L) 10.40 10.00 10.30 11.80 1.86 0.670 0.753 0.635 Total VFA(µmol) 265600 242800 270800 233100 42.8 0.611 <0.001 0.115 Individual VFA (mol/100 mol)
Acetate 56.70 55.00 56.90 53.80 0.26 0.068 <0.001 0.025 Propionate 23.10 21.70 22.90 21.40 0.99 0.814 0.164 0.937 Butyrate 15.00 16.80 14.90 17.80 0.77 0.565 0.015 0.445 Isobutyrate 1.53 1.60 1.37 1.73 0.113 0.905 0.099 0.241 Isovalerate 1.62 1.83 1.54 1.88 0.055 0.814 <0.001 0.270 Valerate 1.75 2.58 2.06 2.83 0.170 0.127 0.001 0.840 Caproate 0.25 0.54 0.32 0.59 0.047 0.255 <0.001 0.829
Acetate/propionate (mol/mol) 2.47 2.56 2.49 2.56 0.117 0.904 0.525 0.963 1 Low energy: 1,452 kcal NE/kg; High energy: 1,700 kcal NE/kg (fresh matter basis). Samples of 400 mg DM of concentrates were incubated with ruminal fluid from heifers fed a high-grain diet.
4.4. Discussion
This study was designed to compare diets based on the most typical cereals in beef diets in the range of energy used, in order to determine the effect of both cereals and energy, and the possible interactions between them on performance, carcass and ruminal fermentation characteristics.
4.4.1. In vivo trial
In agreement with the results of Bock et al. (1991) and Philippeau et al. (1999) in beef cattle and Gozho and Mutsvangwa (2008) in dairy cows, the type of cereal (corn vs. wheat) did not affect concentrate ADFI in our experiment. In contrast, greater intakes for corn-based concentrates than for wheat-concentrates have been reported in other studies with beef cattle (Fulton et al., 1979; Kreikemeier et al., 1987). Studies comparing the ruminal fermentation of cattle fed different cereals have also produced contrasting results. In agreement with our results, Fulton et al. (1979) observed that steers fed corn tended to have greater VFA concentrations than those fed wheat, without differences in the molar proportions of the main VFA. In contrast, Oltjen et al. (1966), Philippeau et al. (1999) and Liu et al. (2016) in beef cattle and Kreikemeier et al. (1987) in lambs observed significantly
64

Chapter IV: Experiment 3
greater VFA concentrations in the rumen of animals fed wheat than in those fed corn, and Gozho and Mutsvangwa (2008) reported no differences in dairy cows fed either corn or wheat.
It was expected that the greater fermentability of wheat compared with corn should decreased significantly the rumen pH, as it has been previously reported by others (Fulton et al., 1979; Philippeau et al., 1999). However, the type of cereal did not affect significantly rumen pH in our study, supporting the lack of differences reported by Liu et al. (2016) in beef steers and by Gozho and Mutsvangwa (2008) in dairy cows. The lack of differences could partly be explained by the high individual variability of pH values, as some authors have reported a high variability inter- and intra-individuals along the day when using indwelling pH meter probes that continuously measure pH (Beauchemin and Penner, 2009; Danscher et al., 2015). As pH meter probes were not available, rumenocentesis was selected as the best method for ruminal sampling in the conditions of our trials. In fact, Duffield et al. (2004) concluded that ruminocentesis was the most accurate field technique for ruminal sampling after comparing this technique and the use of an oral stomach tube with direct sampling through a rumen cannula and continuous electronic pH measurement. All sampling days, time of feed supply in each pen was adjusted to the expected time of ruminal sampling and experimental treatments were consistently distributed across the day (i.e., one pen per treatment was successively sampled). Although these precautions were taken, it was impossible to know the actual time of feed intake in each heifer, and individual variations may have affected the results.
Rumen wall characteristics related to papillae length are in agreement to those reported by Khan et al. (2008), who reported that corn diets increased papillae length and width compared to wheat, although animals had similar papillae concentration and rumen mucosa colour, which was described as dark brown. Those authors performed their study on post-weaning calves at the early stages of rumen development. The early exposure to high-starch concentrates could promote the dark brown colour of papillae, as it is associated to keratinized tissue, resulted from rapid growth and acid pH (Nockels et al., 1966; Gelberg, 2016). On the contrary, in this study, the high-starch concentrates were provided in older animals which had a post-weaning transition into pasture prior to the experimental period. This management could palliate the effect of the high-concentrate diets and prevent parakeratosis incidence, resulting on lighter rumen papilla colour, especially in low energy diets.
Responses of cattle to different cereal grains depends, among other factors, on the level of dietary inclusion, the basal ration, physical processing of the cereal grains, the composition of a given batch of cereal grain, and the level of dietary intake, and therefore direct comparisons among studies are often not possible (Philippeau et al., 1999). For example, Bock et al. (1991) conducted two experiments to compare wheat and corn as the grain source for beef steers and reported that feeding wheat decreased ADG compared with corn in the first trial, but improved ADG in the second trial. This was attributed to differences in the cereal processing; as wheat was dry-rolled in the first trial and steam-rolled in the second one, and steam-rolled wheat usually results in improved performance compared with dry-rolled wheat (Bock et al., 1991). These results indicate that processing can markedly affect the comparison of cereals, and the effects of cereal processing can be even more evident than those derived from cereal type as reported by Gimeno et al. (2014). Pellet durability can influence feed efficiency and growth (Devant et al., 2015) because low durability pellets promotes feed selection and higher spoilage, as cattle
65

Chapter IV: Experiment 3
rejects low particle size, whereas high durability increases chewing and rumen buffering activity. In the current study, concentrates were pelleted and durability was similar among treatments (98%) so no differences were expected due to this factor. Grinding cereal grains reduces particle size and increases degradation rate, but the magnitude of this effect on starch utilization is greater with corn than with wheat, due to disrupting the protein matrix which encapsulates the starch granules (McAllister et al., 1993). Liu et al. (2016) reported that corn starch in particles smaller than 1 mm was extensively fermented in the rumen, whereas in wheat was highly fermented in particles smaller than 2 mm. In our study both cereals were ground and more than 70% of the particles were lower than 1.00 mm in the corn-concentrate (71.38 and 71.08% for low- and high-energy corn concentrates, respectively) and more than 66% in the wheat-concentrate (66.50 and 66.38% for low- and high-energy wheat concentrates, respectively). This may have resulted in an extensive fermentation of corn grains, which could help to explain the trend to greater total VFA concentration observed for corn-fed heifers.
The lack of impact of cereal type in the current study could also be explained by the feeding management, as heifers were fed twice daily and had enough feeding space (25 cm per animal), and these conditions could have resulted in low social competition and a more uniform eating pattern (especially in wheat diets). Previous studies in beef cattle fed high-grain diets have shown that feeding space per animal has an impact in eating behaviour. González et al. (2008ab) conducted several trials to investigate the effects of increased social pressure caused by a reduced number of concentrate feeding places on performance and behaviour of beef cattle, and reported that reducing the feeding space (25 vs. 12.5 cm per animal) reduced animal performance, increased concentrate eating rate and reduced straw eating time during peak feeding times, which may result in lower ruminal pH. Different studies have reported straw intakes in beef cattle fed high-grain concentrates and straw on a feed-choice system ranging from 3.9 to 10.2% (Devant et al., 2000; Gimeno et al., 2014; Iraira et al., 2015). The high straw intake estimated in our study should have increased the NDF intake, which may have increased rumination and chewing and contributing to mask the possible differences in corn and wheat fermentation.
As expected, the increase in energy supply of the concentrate reduced beef concentrate ADFI and F:G ratio, as ruminants fed on high-grain diets usually eat trying to maintain constant energy intake (Krehbiel et al, 2006). Despite the cADI decrease, in our study the average daily NE intake of heifers fed the high-energy concentrates was 11.5% greater than that of heifers fed the low-energy ones. That increase in NE intake had no impact on ADG or carcass traits in the present study. This lack of effect could be associated to the high fat content of the high-energy concentrates (74.1 and 75.1 g/kg DM for corn and wheat diets, respectively), as Krehbiel et al. (2006) reviewed the relationships between dietary energy density and animal performance in finishing diets for beef cattle, and reported that supplementing fat above 60 to 70 g/kg of DM resulted in decreased intake to a level at which F:G is maintained or decreased. Those authors also reported that maximum ADG was achieved at the equivalent of 39.9 g/kg of supplemental fat, that is close to fat content of low energy diets (38.8 and 36.3 g/kg DM for corn and wheat diets, respectively).
Carcass characteristics results agree with the results in BW and ADG, with no differences regarding to cereal type or energy level. Even though when cereal type had an effect on productivity of mixed crossbred yearling cattle, as reported by Kreikenmier et al. (1987), there was not an impact in carcass conformation. Those authors only reported an
66

Chapter IV: Experiment 3
increase in back fat depth in diets with high corn content compared to wheat-diets, ranging from 117 mm in 100% corn-diets to 93 mm in 100% wheat-diets, but those differences were smaller in 67:33 and 33:67 corn:wheat diets (114 mm vs 108 mm, respectively). As in our study the experimental diets contained other cereals, as barley, we assumed that the expected effect should be similar to mixed corn:wheat diets. Therefore, the difference in 6 mm of back fat reported by Kreikenmier et al. (1987) could have not been high enough to affect fat cover carcass grading in our study. Regarding to the effect of energy level on carcass characteristics, Li et al. (2014) reported no effect of energy level of corn-based concentrates on carcass weight and dressing, carcass length, chest depth and leg depth. However, those authors reported a high medium and top grade cuts yield and increased intramuscular fat of high energy diets compared to low energy ones. Unfortunately those variables were not measured in our study, so we could not evaluate the effect of energy level on them.
4.4.2. In vitro incubations
The in vitro trial was conducted to analyse the fermentation potential of the experimental concentrates under identical conditions (pH, concentrate to ruminal fluid ratio, retention time, etc.). Straw was not included as part of the incubated substrate because actual straw intake by heifers could not be determined. In vitro values were in the range of those previously reported for in vitro fermentation of high-concentrate diets (Tejido et al., 2005; Mateos et al., 2013). The lack of differences in fermentation due to the cereal type agrees quite well with the results observed in vivo. In contrast, more differences due to concentrate energy levels were detected in vitro than in vivo. Gas and total VFA production were 14.0 and 11.3% lower, respectively, for high-energy concentrates compared with the low-energy ones, which is consistent with the lower pH values observed for low-energy concentrates. These results indicate that high-energy concentrates were less fermented. Although low and high-energy concentrates had similar starch content, the high ether extract content of high-energy concentrate (74.5 vs. 35.5 g/kg DM for high- and low-energy concentrates, respectively) could affect its fermentation. High levels of fat (>50-60 g/kg DM) can negatively affect ruminal fermentation, as the free fatty acids resulting from the triglyceride hydrolysis are toxic for the cellulolytic bacteria (Maia et al., 2007). This is in agreement with the lower acetate proportions observed for the high-energy concentrates (54.4 vs. 56.8 mol/100 mol for high and low-energy concentrates, respectively), as acetate is the main VFA resulting from fibre degradation. The greater isobutyrate, isovalerate and valerate proportions observed for the high-energy concentrates may also indicate a lower abundance and/or activity of the cellulolytic bacteria, as these minor VFA are specific nutrients for these bacteria and are required for cellulose digestion (Muller, 1987). Differences between in vivo and in vitro fermentation characteristics have been attributed to the high buffering in the batch cultures, lack of absorption and differences in solids retention time, among other factors (Mateos et al., 2015). Moreover, absolute amounts of feed input (no straw was included in the in vitro fermentations) and solid/liquid ratios were different in vivo and in the in vitro cultures, and that may have also contributed to the differences in the variables measured.
Altogether, the results indicate that, under the conditions of this trial, substitution of wheat by corn had a minimal impact on animal performance and ruminal fermentation regardless of the energy level of the concentrate. Increasing the energy level of concentrates from 1,452 to 1,700 kcal NE/kg reduced significantly the concentrate to gain ratio, but had no significant impact on daily gain or carcass traits.
67

Chapter IV: Experiment 3
68

CHAPTER V: GENERAL DISCUSSION
69

Chapter V: General discussion
70

Chapter V: General discussion
5.1. Introduction
The aim of this Thesis was to study the influence of nutritional strategies to reduce the risk of ruminal acidosis in feedlot cattle in the predominant feeding practice in commercial feedlots in Spain. Three trials were performed to investigate the influence of feed additives (malic acid, disodium/calcium malate and a probiotic based on Saccharomyces cerevisiae) and the type of cereal and energy level in the concentrate on growth performance, carcass quality, ruminal fermentation characteristics, and blood metabolites of heifers. The general results of this research will be discussed in this section.
5.2. Composition of experimental diets
The experimental diets were designed to be representative of the practice in Spanish commercial feedlots, and they were based on high-cereal concentrates and straw. The main cereal grain in the concentrate varied along the trials, but corn, barley and wheat were included in all concentrates (Figure 5.1.). Barley was the main cereal in Expt.1 (50% of the concentrate), but in Expt. 2, barley was partially replaced by wheat (21.0 and 28.2%, respectively) in order to increase ruminal degradation of starch and try to promote SARA status. Thus, energy level of concentrate in Expt. 2 was increased by 17% compared to Expt. 1. These two energy levels were compared in Expt. 3, in which differences in starch degradation were also maximized by using either corn (slow degradation rate) or wheat (rapid degradation rate). Despite the well-known differences between the two selected cereals, no clear effect of cereal type was observed in Expt. 3, that could be explained, at least in part, due to cereal grinding and concentrate pelleting (3.5 mm), as both processes destroy the grain structure and increase its degradation rate (Devant et al., 2015), thus resulting in an extensive fermentation of cereals grains independently of the type of cereal.
The concentrates evaluated in the three trials were designed to supply starch above 30% DM (Table 5.1.), which agrees with the nutritional profile of high-grain diets that induce SARA according to Dohme et al. (2008) and Vyas et al. (2014b). Concentrates were also formulated to provide a maximum of 25% NDF (DM basis), as this has been reported as the minimum NDF content required to maintain a ruminal pH adequate for microbial growth (Owens et al., 1997), in order to contribute to SARA induction. However, full-length barley straw (75.4% NDF; DM basis) was provided ad libitum in the three trials, which also contributed to total NDF intake. Unfortunately, straw intake could not be quantified in any trial, because straw refusals dropped on the floor and formed part of the bedding material.
71

Chapter V: General discussion
Figure 5.1. Level of inclusion of different cereal grains (corn, wheat, barley and wheat middlings) in the experimental concentrates used in this Thesis1.
1 CON = control; unsupplemented concentrate. CON supplied 1,453 and 1,700 kcal NE/kg (fresh matter basis) according to FEDNA (de Blas et al., 2010) in Expt. 1 and 2, respectively. In Expt. 3, the 4 tested concentrates were: C = corn-based; W = wheat-based; LE= low energy (1,453 kcal NE/kg), and HE= high energy (1,700 kcal NE/kg).
Table 5.1. Chemical composition of experimental concentrates used in the three trials1.
Chemical composition Expt. 1 (CON)
Expt. 2 (CON)
Expt. 3 C-LE C-HE W-LE W-HE
CP (g/kg DM) 145 152 170 167 171 177
NDF (g/kg DM) 192 230 241 216 250 222
Starch (g/kg DM) 358 310 395 403 383 390 1 CON = control; unsupplemented concentrate. CON supplied 1,453 and 1,700 kcal NE/kg (fresh matter basis) according to FEDNA (de Blas et al., 2010) in Expt. 1 and 2, respectively. In Expt. 3, the 4 tested concentrates were: C = corn-based; W = wheat-based; LE= low energy (1,453 kcal NE/kg), and HE= high energy (1,700 kcal NE/kg).
5.2. Influence of experimental diets on ruminal fermentation variables and rumen wall characteristics
Figure 5.2. shows in vivo ruminal pH values at each sampling time in all the trials. Although diets were designed to promote SARA status, no significant differences were observed in ruminal pH among treatments within each trial. However, ruminal pH values significantly varied along the time, following a cubic relationship (Figure 5.3.). In general, average pH values at the end of the experimental period (141, 114 and 168 days in Expt. 1, 2 and 3, respectively) were greater than those measured at the middle of the trial (day 84 in Expt. 1 and 3, and day 56 in Expt. 2). At the middle of the experimental period, average pH values in Expt. 2 were close to or under 5.5, that is detrimental to the rumen epithelium and VFA absorption (Gäbel et al., 2002). However, in Expt. 1 and 3 (in which pH was measured at 84 d of trial), pH values were close to or over 5.8, considered as the limit below which is harmful to ruminal cellulolytic bacteria (Russell and Wilson, 1996).
72

Chapter V: General discussion
Despite some authors have suggested that a period of 10 - 21 days is enough for adaptation of ruminal microbiota to high-concentrate diets (Warner, 1962; Mackie and Gilchrist, 1979), our results suggest than an adaptation period over 56 d may be necessary to reach ruminal pH values over 5.8 in heifers fed high-grain concentrates. Unfortunately, due to welfare issues related to the method used for ruminal fluid sampling, pH was not measured frequently at the beginning of the trial (i.e. weekly in the first 56 days of trial or daily using indwelling pH meter probes), which could have provided useful information on the adaption pattern of heifers to high-concentrate diets. In all experiments, pH was over 5.8 at the end of the trial (average values ranging from 6.05 to 6.70), which suggest a complete adaptation of heifers to high-concentrate diets at the end of fattening period.
Figure 5.2. Ruminal pH values of heifers sampled by ruminocentesis between 2 and 2.5 h after the morning feeding at the beginning (Initial), middle (Mid) and the end (Final) of the trials1.
1 CON = control; unsupplemented concentrate. CON supplied 1,453 and 1,700 kcal NE/kg (fresh matter basis) according to FEDNA (de Blas et al., 2010) in Expt. 1 and 2, respectively. MA = CON plus malic acid (1.06 g malate/kg concentrate); MAL: CON plus disodium/calcium malate (1.06 and 2.12 g malate/kg concentrate in Expt. 1 and 2, respectively); YC = CON plus 1.5 x 10⁸ cfu/kg Saccharomyces cerevisiae CBS 493.94. In Expt. 3, C = corn based; W = wheat based; LE= low energy, 1,453 kcal NE/kg; HE= high energy, 1,700 kcal NE/kg.
73

Chapter V: General discussion
Figure 5.3. Evolution of ruminal pH of heifers sampled by ruminocentesis between 2 and 2.5 h after the morning feeding throughout of the trials1.
1 CON = control; unsupplemented concentrate. CON supplied 1,453 and 1,700 kcal NE/kg (fresh matter basis) according to FEDNA (de Blas et al., 2010) in Expt. 1 and 2, respectively. MA = CON plus malic acid (1.06 g malate/kg concentrate); MAL: CON plus disodium/calcium malate (1.06 and 2.12 g malate/kg concentrate in Expt. 1 and 2, respectively); YC = CON plus 1.5 x 10⁸ cfu/kg Saccharomyces cerevisiae CBS 493.94. In Expt. 3, C = corn based; W = wheat based; LE= low energy, 1,453 kcal NE/kg; HE= high energy, 1,700 kcal NE/kg.
The lack of differences due to malic acid, disodium/calcium malate and Saccharomyces cerevisiae supplementation in ruminal pH might partly be explained by: i) the incidence of SARA was relatively low; ii) the dose of the products; iii) the sampling method, and iv) the high individual variability of pH values, which might have masked the hypothetic positive effect of these feed additives in animals with SARA. Some authors have reported a high variability inter- and intra-individuals along the day when using indwelling pH meter probes that continuously measure pH (Beauchemin and Penner, 2009; Danscher et al., 2015). Unfortunately, we did not have access to pH meter probes, and rumenocentesis was selected as the best method for ruminal sampling in our conditions. In fact, Duffield et al. (2004) concluded that ruminocentesis was the most accurate field technique for ruminal sampling, after comparing this technique and the use of an oral stomach tube with direct sampling through a rumen cannula and continuous electronic pH measurement. In all sampling days of our trials, time of feed supply in each pen was adjusted to the expected time of ruminal sampling, and experimental treatments were consistently distributed across the day (i.e., one pen per treatment was successively sampled). Although these precautions were taken, it was impossible to know the actual time of feed intake, and the quantity of concentrate and straw consumed by each heifer, and therefore individual variations may have affected the results.
74

Chapter V: General discussion
Total and individual VFA concentrations are shown in Figure 5.4. There were not differences in acetate, propionate or butyrate proportions among treatments within each trial, and acetate:propionate ratios were representative of those reported in beef cattle fed high-concentrate diets (Devant et al., 2000; Martin et al., 2010), with an average value of 1.57. However, VFA concentration significantly varied along the time following a cubic relationship (Figure 5.5.), and was negatively correlated with pH values (r=-0.766, P<0.001; n=30), as it is shown in Figure 5.6. Under the experimental conditions of the trials performed, it seems that pH varied mainly due to total VFA concentration, rather than particular variations of individual VFAs.
Figure 5.4. Ruminal total volatile fatty acids (VFA) concentrations (mM) in heifers sampled by ruminocentesis between 2 and 2.5 h after the morning feeding at the beginning (Initial), middle (Mid) and the end (Final) of the trials1.
1 CON = control; unsupplemented concentrate. CON supplied 1,453 and 1,700 kcal NE/kg (fresh matter basis) according to FEDNA (de Blas et al., 2010) in Expt. 1 and 2, respectively. MA = CON plus malic acid (1.06 g malate/kg concentrate); MAL: CON plus disodium/calcium malate (1.06 and 2.12 g malate/kg concentrate in Expt. 1 and 2, respectively); YC = CON plus 1.5 x 10⁸ cfu/kg Saccharomyces cerevisiae CBS 493.94. In Expt. 3, C = corn based; W = wheat based; LE= low energy (1,453 kcal NE/kg); HE= high energy (1,700 kcal NE/kg).
75

Chapter V: General discussion
Figure 5.5. Evolution of ruminal VFA concentrations (mM) of heifers sampled by ruminocentesis between 2 and 2.5 h after the morning feeding throughout of the trials1.
1 CON = control; unsupplemented concentrate. CON supplied 1,453 and 1,700 kcal NE/kg (fresh matter basis) according to FEDNA (de Blas et al., 2010) in Expt. 1 and 2, respectively. MA = CON plus malic acid (1.06 g malate/kg concentrate); MAL: CON plus disodium/calcium malate (1.06 and 2.12 g malate/kg concentrate in Expt. 1 and 2, respectively); YC = CON plus 1.5 x 10⁸ cfu/kg Saccharomyces cerevisiae CBS 493.94. In Expt. 3, C = corn based; W = wheat based; LE= low energy (1,453 kcal NE/kg); HE= high energy (1,700 kcal NE/kg).
Figure 5.6. Relationship between ruminal pH and volatile fatty acid (VFA, mM) values measured in each control day per trial1.
1 CON = control; unsupplemented concentrate. CON supplied 1,453 and 1,700 kcal NE/kg (fresh matter basis) according to FEDNA (de Blas et al., 2010) in Expt. 1 and 2, respectively. MA = CON plus malic acid (1.06 g malate/kg concentrate); MAL: CON plus disodium/calcium malate (1.06 and 2.12 g malate/kg concentrate in Expt. 1 and 2, respectively); YC = CON plus 1.5 x 10⁸ cfu/kg Saccharomyces cerevisiae CBS 493.94. In Expt. 3, C = corn based; W = wheat based; LE= low energy (1,453 kcal NE/kg); HE= high energy (1,700 kcal NE/kg).
76

Chapter V: General discussion
Ruminal lactate concentrations were low (usually ≤1 mM; Figure 5.7) and no heifers showed concentrations over 5 mM, which is considered the upper level for normal ruminal conditions (Owens et al., 1998; Chiquette et al., 2015). Low lactate concentrations have also been reported by others (Beauchemin and Penner, 2009; Danscher et al., 2015; Vyas et al., 2015) in beef cattle experiencing SARA (diagnostic based on ruminal pH), and it seems that excessive VFA production may be a more important contributor to SARA than lactate (Constable et al., 2017). As mentioned before, in our trials rumen pH was negatively correlated with VFA concentrations, but showed a poor correlation with lactate concentrations (r=0.163, P=0.097; n=18; Figure 5.8.). Although VFA accumulation could have contributed to decrease ruminal pH in our studies, lactate is assumed to depress pH more drastically than similar amounts of VFA (Owens et al., 1998), and it also increases rumen osmolality, thus reducing the rate of VFA absorption. Probably, the role of lactate is essential once VFA concentrations caused pH values to decrease below 5.8.
Figure 5.7. Ruminal lactate concentrations (mM) in heifers sampled by ruminocentesis between 2 and 2.5 h after morning feeding at the beginning (Initial), middle (Mid) and the end (Final) of the trials1.
1 CON = control; unsupplemented concentrate. CON supplied 1,453 and 1,700 kcal NE/kg (fresh matter basis) according to FEDNA (de Blas et al., 2010) in Expt. 1 and 2, respectively. MA = CON plus malic acid (1.06 g malate/kg concentrate); MAL: CON plus disodium/calcium malate (1.06 and 2.12 g malate/kg concentrate in Expt. 1 and 2, respectively); YC = CON plus 1.5 x 10⁸ cfu/kg Saccharomyces cerevisiae CBS 493.94.
77

Chapter V: General discussion
Figure 5.8. Relationship between ruminal pH values and lactate concentration (mM) measured in each control day per trial1.
1 CON = control; unsupplemented concentrate. CON supplied 1,453 and 1,700 kcal NE/kg (fresh matter basis) according to FEDNA (de Blas et al., 2010) in Expt. 1 and 2, respectively. MA = CON plus malic acid (1.06 g malate/kg concentrate); MAL: CON plus disodium/calcium malate (1.06 and 2.12 g malate/kg concentrate in Expt. 1 and 2, respectively); YC = CON plus 1.5 x 10⁸ cfu/kg Saccharomyces cerevisiae CBS 493.94.
Ammonia-N concentrations were highly variable among trials (Figure 5.9.). In Expt. 1 ammnonia-N concentration of heifers fed disodium/calcium malate was greater than that in heifers fed malic acid or unsupplemented concentrate, whereas no differences were observed in Expt. 2 and 3. Ammonia-N concentration was always above the minimum of 20 mg/L recommended by Satter and Slyter (1974) to prevent a limitation of microbial growth in vitro. In agreement with the results of these authors, ammonia-N concentration was positively correlated to total VFA (r=0.526, P=0.003; n=30), as total VFA concentrations increased linearly with augmented ammonia-N concentrations (Figure 5.10). Both, total VFA and ammonia-N concentrations were in the range of values indicating normal microbial activity, and there were no signs of ruminal dysfunction which could confirm a clear SARA status. Ammonia-N concentration was poorly correlated to pH (r=-0.186, P=0.326; n=30), which is in agreement with the results of Lana et al. (1998), who concluded that cattle fed 90% concentrate had similar rates of ammonia production at pH values ranging from 6.5 to 5.7 (Figure 5.11.).
78

Chapter V: General discussion
Figure 5.9. Ruminal ammonia-N concentrations (mg/L) in heifers sampled by ruminocentesis between 2 and 2.5 h after morning feeding at the beginning (Initial), middle (Mid) and the end (Final) of the trials1.
1 CON = control; unsupplemented concentrate. CON supplied 1,453 and 1,700 kcal NE/kg (fresh matter basis) according to FEDNA (de Blas et al., 2010) in Expt. 1 and 2, respectively. MA = CON plus malic acid (1.06 g malate/kg concentrate); MAL: CON plus disodium/calcium malate (1.06 and 2.12 g malate/kg concentrate in Expt. 1 and 2, respectively); YC = CON plus 1.5 x 10⁸ cfu/kg Saccharomyces cerevisiae CBS 493.94. In Expt. 3, C = corn based; W = wheat based; LE= low energy, 1,453 kcal NE/kg; HE= high energy, 1,700 kcal NE/kg.
79

Chapter V: General discussion
Figure 5.10. Relationship between total VFA (mM) and ammonia-N concentration (mg/L) measured in each control day per trial1.
1 CON = control; unsupplemented concentrate. CON supplied 1,453 and 1,700 kcal NE/kg (fresh matter basis) according to FEDNA (de Blas et al., 2010) in Expt. 1 and 2, respectively. MA = CON plus malic acid (1.06 g malate/kg concentrate); MAL: CON plus disodium/calcium malate (1.06 and 2.12 g malate/kg concentrate in Expt. 1 and 2, respectively); YC = CON plus 1.5 x 10⁸ cfu/kg Saccharomyces cerevisiae CBS 493.94. In Expt. 3, C = corn based; W = wheat based; LE= low energy, 1,453 kcal NE/kg; HE= high energy, 1,700 kcal NE/kg. Figure 5.11. Relationship between pH and ammonia-N concentration (mg/L) measured in each control day per trial1.
1 CON = control; unsupplemented concentrate. CON supplied 1,453 and 1,700 kcal NE/kg (fresh matter basis) according to FEDNA (de Blas et al., 2010) in Expt. 1 and 2, respectively. MA = CON plus malic acid (1.06 g malate/kg concentrate); MAL: CON plus disodium/calcium malate (1.06 and 2.12 g malate/kg concentrate in Expt. 1 and 2, respectively); YC = CON plus 1.5 x 10⁸ cfu/kg Saccharomyces cerevisiae CBS 493.94. In Expt. 3, C = corn based; W = wheat based; LE= low energy, 1,453 kcal NE/kg; HE= high energy, 1,700 kcal NE/kg.
80

Chapter V: General discussion
Ruminal papilla characteristics were evaluated at slaughter in all trials, and significant effects of treatments were detected on rumen color and length, as shown in Figures 5.12. and 5.13. The incidence of short and pale-pink rumen papillae might be associated to acidosis episodes (Figure 5.14.), as when ruminal osmolarity is markedly greater than blood osmolarity, water from blood is drawn rapidly through the rumen wall, producing ruminal damage and abscesses (Owens et al., 1998). Subsequently, repaired tissues are thickened (parakeratosis), which may inhibit the rate of VFA absorption for months after the damage has occurred (Krehbiel et al., 1995). Thus, brown colored rumens are associated to keratinized tissue (Nockels et al., 1966), whereas the dark green pigment has been reported to be present in the external layer of the rumen epithelium (Nockels et al., 1966), associated to products of microbial activity (Sinclair and Kunkel, 1959). In Expt. 1, only heifers fed the control diets showed pale rumens, which suggest that only these heifers suffered ruminal damage, but no differences among treatments were found in papillae length. The highest incidence of pale rumens was observed in Expt. 2, in which the group fed malate showed the highest percentage of pale and pale-pink rumens, although there were no differences between treatments in papilla length. Finally, in Expt. 3 only the heifers fed low-energy diets showed pale or pale-pink rumens and had medium and long papillae, whereas heifers receiving the high energy diets showed darker rumens with shorter papillae (Figure 5.15.). However, no differences were observed due to cereal type within each energy level.
Figure 5.12. Effect of experimental treatments on ruminal papilla color1.
1 CON = control; unsupplemented concentrate. CON supplied 1,453 and 1,700 kcal NE/kg (fresh matter basis) according to FEDNA (de Blas et al., 2010) in Expt. 1 and 2, respectively. MA = CON plus malic acid (1.06 g malate/kg concentrate); MAL: CON plus disodium/calcium malate (1.06 and 2.12 g malate/kg concentrate in Expt. 1 and 2, respectively); YC = CON plus 1.5 x 10⁸ cfu/kg Saccharomyces cerevisiae CBS 493.94. In Expt. 3, C = corn based; W = wheat based; LE= low energy, 1,453 kcal NE/kg; HE= high energy, 1,700 kcal NE/kg.
81

Chapter V: General discussion
Figure 5.13. Effect of experimental treatments on ruminal papilla length1.
1 CON = control; unsupplemented concentrate. CON supplied 1,453 and 1,700 kcal NE/kg (fresh matter basis) according to FEDNA (de Blas et al., 2010) in Expt. 1 and 2, respectively. MA = CON plus malic acid (1.06 g malate/kg concentrate); MAL: CON plus disodium/calcium malate (1.06 and 2.12 g malate/kg concentrate in Expt. 1 and 2, respectively); YC = CON plus 1.5 x 10⁸ cfu/kg Saccharomyces cerevisiae CBS 493.94. In Expt. 3, C = corn based; W = wheat based; LE= low energy, 1,453 kcal NE/kg; HE= high energy, 1,700 kcal NE/kg.
Figure 5.14. Detail of damage in ruminal papilla.
82

Chapter V: General discussion
Figure 5.15. Example of color and length differences in ruminal papilla.
Pink color and long length
Dark-green color and short length
5.3. Influence of the nutritional strategies evaluated on growth performance, concentrate intake, carcass characteristics and blood metabolites
The evolution of heifers BW over the experimental periods is shown in Figure 5.16. Differences in growth rate observed among trials can be partially explained by the breed of the heifers. In fact, in Expt. 1, Charolaise purebred or Charolaise x Limousin crossbreed were used, whereas in Expt. 2 and 3, only Charolaise crossbreed heifers were used, resulting in decreased growth rates, especially in Expt. 2. However, there were no significant effects of treatments on BW. The lack of differences in BW observed in Exp. 1 and 2 is consistent with the absence of effects of the additives on concentrate intake and ruminal fermentation variables. Some authors (Gómez et al., 2005; Newbold et al., 2005; Tejido et al., 2005) suggested, based on in vitro results, that the effects of sodium malate may be more pronounced with diets containing a high proportion of forage (60-80%) than with high-concentrate diets such as those used in our studies.
83

Chapter V: General discussion
Figure 5.16. Evolution of heifers body weight (BW, kg) throughout the experimental trials1.
1 CON = control; unsupplemented concentrate. CON supplied 1,453 and 1,700 kcal NE/kg (fresh matter basis) according to FEDNA (de Blas et al., 2010) in Expt. 1 and 2, respectively. MA = CON plus malic acid (1.06 g malate/kg concentrate); MAL: CON plus disodium/calcium malate (1.06 and 2.12 g malate/kg concentrate in Expt. 1 and 2, respectively); YC = CON plus 1.5 x 10⁸ cfu/kg Saccharomyces cerevisiae CBS 493.94. In Expt. 3, C = corn based; W = wheat based; LE= low energy, 1,453 kcal NE/kg; HE= high energy, 1,700 kcal NE/kg.
Feeding management could have played a determinant role in reducing the incidence of ruminal upsets, thus decreasing the expected effects of the nutritional strategies tested in the current studies. It should be noticed that concentrate and full-length barley straw were provided separately ad libitum twice a day, and that concentrates were pelleted to reduce feed selection and refusals, and supplied into a 1.5 m line feed bunk. These conditions could have resulted in low social competition and a regular eating pattern along the day. As daily concentrate intake was recorded per pen (6 animals housed together), individual daily fluctuations of intake and possible intake reductions associated to acidosis could not be detected, unless all animals had experienced acidosis at the same time (Owens et al., 1998).
However, concentrate intake pattern along the experimental period was different in each trial, as shown in Figure 5.18. In Expt. 1 concentrate intake increased from the beginning of the experimental period to day 56, and then slightly decreased. This intake pattern could be partly explained because this trial was performed from April to September, reaching a high-temperature period (average daily temperature above 25ºC) at day 56 of the trial, which suggests a depression of intake associated to heat stress. In
84
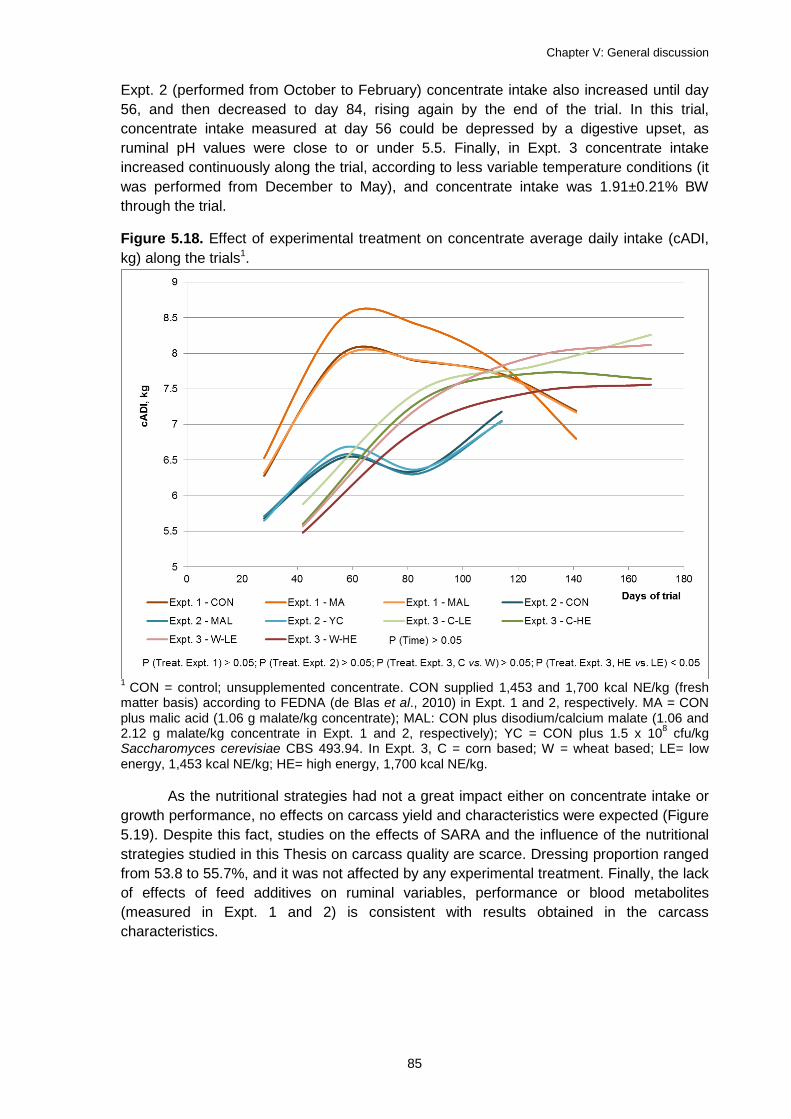
Chapter V: General discussion
Expt. 2 (performed from October to February) concentrate intake also increased until day 56, and then decreased to day 84, rising again by the end of the trial. In this trial, concentrate intake measured at day 56 could be depressed by a digestive upset, as ruminal pH values were close to or under 5.5. Finally, in Expt. 3 concentrate intake increased continuously along the trial, according to less variable temperature conditions (it was performed from December to May), and concentrate intake was 1.91±0.21% BW through the trial.
Figure 5.18. Effect of experimental treatment on concentrate average daily intake (cADI, kg) along the trials1.
1 CON = control; unsupplemented concentrate. CON supplied 1,453 and 1,700 kcal NE/kg (fresh matter basis) according to FEDNA (de Blas et al., 2010) in Expt. 1 and 2, respectively. MA = CON plus malic acid (1.06 g malate/kg concentrate); MAL: CON plus disodium/calcium malate (1.06 and 2.12 g malate/kg concentrate in Expt. 1 and 2, respectively); YC = CON plus 1.5 x 10⁸ cfu/kg Saccharomyces cerevisiae CBS 493.94. In Expt. 3, C = corn based; W = wheat based; LE= low energy, 1,453 kcal NE/kg; HE= high energy, 1,700 kcal NE/kg.
As the nutritional strategies had not a great impact either on concentrate intake or growth performance, no effects on carcass yield and characteristics were expected (Figure 5.19). Despite this fact, studies on the effects of SARA and the influence of the nutritional strategies studied in this Thesis on carcass quality are scarce. Dressing proportion ranged from 53.8 to 55.7%, and it was not affected by any experimental treatment. Finally, the lack of effects of feed additives on ruminal variables, performance or blood metabolites (measured in Expt. 1 and 2) is consistent with results obtained in the carcass characteristics.
85

Chapter V: General discussion
Figure 5.19. Effect of experimental treatments on dressing proportion (%) and hot carcass weight (HCW, kg)1.
1 CON = control; unsupplemented concentrate. CON supplied 1,453 and 1,700 kcal NE/kg (fresh matter basis) according to FEDNA (de Blas et al., 2010) in Expt. 1 and 2, respectively. MA = CON plus malic acid (1.06 g malate/kg concentrate); MAL: CON plus disodium/calcium malate (1.06 and 2.12 g malate/kg concentrate in Expt. 1 and 2, respectively); YC = CON plus 1.5 x 10⁸ cfu/kg Saccharomyces cerevisiae CBS 493.94. In Expt. 3, C = corn based; W = wheat based; LE= low energy, 1,453 kcal NE/kg; HE= high energy, 1,700 kcal NE/kg.
5.4. Comparison of in vivo and in vitro ruminal fermentation
Samples of the experimental concentrates and barley straw were collected in each trial in order to perform in vitro ruminal fermentations. In vitro incubations lasted 17 h, which corresponds to a rumen passage rate of 0.06/h. The effects of the experimental treatments (P values of main effects) on ruminal fermentation parameters observed in vivo and in vitro are summarized in Table 5.2. No differences between treatments in any of the measured parameters were detected either in vivo or in vitro in Expt. 1 and 2. The lack of effects of malic acid or disodium/calcium malate on in vitro fermentation in these experiments contrasts with previous in vitro studies reporting that malic acid or malate salts supplementation resulted in increased total VFA and propionate production in batch cultures of ruminal microorganisms (Carro and Ranilla, 2003; Newbold et al., 2005; Tejido et al., 2005). However, the doses of malic acid/malate used in these in vitro studies ranged from 4 to 10 mM, whereas the dose used in our experiments were much lower (0.06 and 0.12 mM in Expt. 1 and 2, respectively). As discussed in Chapter II, it seems probable that
86

Chapter V: General discussion
the amount of malate supplied was too low to produce beneficial effects on in vitro and in vivo ruminal fermentation.
On the contrary, in vitro fermentation in Expt. 3 detected significant effects of concentrate energy level on final pH, ammonia-N and total VFA concentrations, and molar proportions of acetate and butyrate, but no differences in these variables were detected in vivo (P>0.10). Moreover, total VFA concentrations in the rumen of heifers tended (P=0.07) to be greater for corn than for wheat, but no effect (P=0.61) of cereal type were detected in the batch cultures. In contrast, a trend (P=0.07) to greater acetate proportions and lower pH values for corn compared to wheat was detected in the batch cultures and no differences (P=0.31 and P=0.15, respectively) were observed in vivo. These differences in vivo vs. in vitro might be related to the absolute amounts of feed input, as no straw was included in the in vitro fermentation in Expt. 3 (as actual straw intake could not be determined in this trial), whereas in Expt. 1 and 2 a mixture of 88:12 concentrate:straw was used as substrate to resemble the diet ingested by the heifers. Differences between in vivo and in vitro fermentations can be also attributed to the lack of absorption in the batch cultures, and to differences in solid retention time (17 h in vitro and variable in vivo), and in solid/liquid ratio, among other factors, as in vivo measures depends on individual eating and drinking times and rates.
Table 5.2. Effects of experimental treatments (P values of main effects) on ruminal fermentation parameters measured in vivo and in vitro.
Item
Expt. 1 (Treatment)
Expt. 2 (Treatment)
Expt. 3 (Cereal type)
Expt. 3 (Energy level)
In vivo In vitro In vivo In vitro In vivo In vitro In vivo In vitro
pH 0.81 0.16 0.24 0.31 0.15 0.07 0.11 <0.01 ammonia-N (mg/L) 0.03 0.27 0.82 0.87 0.84 0.47 0.36 <0.01 Lactate (mg/L) 0.53 0.96 0.93 0.74 n.a. 0.67 n.a. 0.75 Total volatile fatty acids (mM) 0.74 027 0.69 0.92 0.07 0.61 0.61 <0.01
Individual VFA (mol/100mol) Acetate 0.08 0.72 0.65 0.97 0.31 0.07 0.94 <0.01 Propionate 0.70 0.10 0.86 0.98 0.73 0.81 0.76 0.16 Butyrate 0.32 0.13 0.84 0.47 0.84 0.57 0.71 0.02
Acetate/propionate (mol/mol) 0.62 0.10 0.67 0.99 0.78 0.90 0.96 0.53
n.a. not analized.
There were differences between in vivo and in vitro in the magnitude of most determined parameters. In vitro pH values were higher than in vivo ones in all experiments, probably due to the high buffering capacity of the medium used in the batch cultures which prevented a pH drop (Mateos et al., 2015). Despite these differences, in vitro pH values were linearly correlated (r = 0.643; P = 0.045; n = 10) to in vivo values (Figure 5.19.). There were also significant relationships between in vivo values and those determined in the batch cultures for total VFA concentrations (r= 0.909; P < 0.001; n = 10) and acetate:propionate ratio (r = 0.759; P = 0.011; n = 10), as shown in Figures 5.20. and 5.21., respectively. However, the relationships between in vivo and in vitro values for
87

Chapter V: General discussion
lactate (r=-0.630, P=0.180; n=6) and ammonia-N (r=0.367, P=0.295; n=10) concentrations were poorer. Lactate concentrations were lower in vitro (up to 0.20 mM) than in vivo (≤ 1 mM), which confirms previous studies (Tejido et al., 2005; Mateos et al., 2013), and suggest either lower lactate production or greater lactate utilization in the batch cultures than in the rumen. In contrast, ammonia-N concentrations were greater in vitro (≥ 150 mg/L) than in vivo (< 100 mg/L), but it should be taken into account that the modified buffer–mineral solution of Goering and Van Soest (1970) used in the present study supplied 84.11 mg N per liter in the form NH4HCO3, which can be rapidly degraded to ammonia by ruminal microorganisms.
Figure 5.19. Relationship between ruminal pH values measured in the rumen of beef heifers (averaged values of three sampling times per treatment in each trial) and in 17 h in vitro fermentations1.
1 CON = control; unsupplemented concentrate. CON supplied 1,453 and 1,700 kcal NE/kg (fresh matter basis) according to FEDNA (de Blas et al., 2010) in Expt. 1 and 2, respectively. MA = CON plus malic acid (1.06 g malate/kg concentrate); MAL: CON plus disodium/calcium malate (1.06 and 2.12 g malate/kg concentrate in Expt. 1 and 2, respectively); YC = CON plus 1.5 x 10⁸ cfu/kg Saccharomyces cerevisiae CBS 493.94. In Expt. 3, C = corn based; W = wheat based; LE= low energy, 1,453 kcal NE/kg; HE= high energy, 1,700 kcal NE/kg.
88

Chapter V: General discussion
Figure 5.20. Relationship between total volatile fatty acids concentrations measured in the rumen of beef heifers (averaged values of three sampling times per treatment in each trial) and in 17 h fermentations in batch cultures1.
1 CON = control; unsupplemented concentrate. CON supplied 1,453 and 1,700 kcal NE/kg (fresh matter basis) according to FEDNA (de Blas et al., 2010) in Expt. 1 and 2, respectively. MA = CON plus malic acid (1.06 g malate/kg concentrate); MAL: CON plus disodium/calcium malate (1.06 and 2.12 g malate/kg concentrate in Expt. 1 and 2, respectively); YC = CON plus 1.5 x 10⁸ cfu/kg Saccharomyces cerevisiae CBS 493.94. In Expt. 3, C = corn based; W = wheat based; LE= low energy, 1,453 kcal NE/kg; HE= high energy, 1,700 kcal NE/kg.
Figure 5.21. Relationship between acetate/propionate ratio measured in the rumen of beef heifers (averaged values of three sampling times per treatment in each trial) and in 17 h fermentations in batch cultures1.
1 CON = control; unsupplemented concentrate. CON supplied 1,453 and 1,700 kcal NE/kg (fresh matter basis) according to FEDNA (de Blas et al., 2010) in Expt. 1 and 2, respectively. MA = CON plus malic acid (1.06 g malate/kg concentrate); MAL: CON plus disodium/calcium malate (1.06 and 2.12 g malate/kg concentrate in Expt. 1 and 2, respectively); YC = CON plus 1.5 x 10⁸ cfu/kg Saccharomyces cerevisiae CBS 493.94. In Expt. 3, C = corn based; W = wheat based; LE= low energy, 1,453 kcal NE/kg; HE= high energy, 1,700 kcal NE/kg.
89

Chapter V: General discussion
90

CHAPTER VI. CONCLUSIONS /CONCLUSIONES
91

Chapter VI: Conclusions / Conclusiones
92

Chapter VI: Conclusions / Conclusiones
6.1. Conclusions
1. Supplying 1.06 g of malate per kg of concentrate, either as free acid or disodium/calcium salts, to beef heifers fed a barley-based pelleted concentrate (50% barley grains; 35.8% starch; 1,453 kcal NE/kg) and straw ad libitum, had no effect on concentrate intake, growth performance, ruminal parameters (pH, lactate and total volatile fatty acids), carcass quality and blood metabolites (glucose, lactate and urea-N). Heifers supplemented with disodium/calcium malate had greater ruminal ammonia-N concentrations after 84 days of supply compared to control and malic acid supplemented animals, but differences disappeared by the end of the trial (141 days).
2. Ruminal papillae were darker in beef heifers supplemented with malic acid at 1.06 g per kg of concentrate compared to those in heifers fed either an unsupplemented concentrate or a concentrate including the same amount of malate in the form of disodium/calcium salts. No effect of any malate presentation was detected on ruminal papilla length.
3. The supplementation of either 2.12 g of disodium/calcium malate or 1.5 x 10⁸ cfu of Saccharomyces cerevisiae per kg of concentrate had no effect on growth performance, ruminal fermentation characteristics, carcass quality or blood metabolites of beef heifers fed a wheat-barley based pelleted concentrate (32% starch; 1,700 kcal NE/kg) and straw ad libitum compared to a control concentrate.
4. Heifers fed concentrates which included 40% corn tended to reduce feed to gain ratio by 4% compared to the inclusion of 40.5% wheat, but there were no significant differences between cereal grains in concentrate intake, growth performance, or carcass characteristics. Heifers fed corn had shorter papilla and tended to show lighter-colored rumen compared to heifers fed wheat.
5. Ruminal pH, ammonia-N concentrations and molar proportions of individual volatile fatty acids were not different between heifers given a corn-based concentrate (40%) and those fed a wheat-based concentrate (40.5%), but total volatile fatty acids concentration tended to be 6% higher in heifers fed corn compared to those given wheat.
6. An increase in the energy of the concentrate from 1,453 to 1,700 kcal NE per kg reduced concentrate intake by 4% and feed to gain ratio by 9% in beef heifers, with no effect on body weight, ruminal parameters (pH and total volatile fatty acids and ammonia-N concentrations), average daily gain or carcass characteristics. Heifers fed the high-energy concentrate had shorter ruminal papilla and tended to have darker-colored rumen compared to heifers fed the low-energy concentrate.
7. The in vitro incubation of the concentrates used in the experimental trials with buffered ruminal fluid from heifers revealed marked differences between in vivo and in vitro fermentation in most of the determined parameters, but there were significant relationships between in vivo and in vitro values for pH, total volatile fatty acids concentrations and acetate:propionate ratio. In contrast, no in vivo - in vitro relationships were detected for lactate and ammonia-N concentrations.
93

Chapter VI: Conclusions / Conclusiones
6.2. Conclusiones
1. La administración de 1.06 g de malato por kg de concentrado, en forma de ácido libre o como sal disódica y cálcica, a terneras de carne que recibían un concentrado granulado rico en cebada (50% cebada; 35,8% de almidón; 1.453 kcal EN/kg) y paja ad libitum no tuvo ningún efecto sobre el consumo de concentrado, el rendimiento productivo, los parámetros ruminales (pH, lactato y ácidos grasos volátiles totales), la calidad de la canal y los metabolitos sanguíneos (glucosa, lactado y N ureico). Las terneras suplementadas con malato disódico y cálcico tuvieron una mayor concentración de ammonia-N en el rumen tras 84 días de administración comparadas con las terneras control y las suplementadas con ácido málico, pero las diferencias desaparecieron al final del ensayo (141 días).
2. Las papilas ruminales de las terneras suplementadas con 1,06 g de ácido málico por kg de concentrado fueron más oscuras que las de las terneras que recibieron el concentrado control o un concentrado que incluyó la misma cantidad de malato en forma de sal disódica/cálcica. No se observó ningún efecto de la forma de malato sobre la longitud de las papilas ruminales.
3. La inclusión de 2,12 g de malato disódico/cálcico o de 1,5 x 10⁸ ufc de S. cerevisiae por kg de concentrado no tuvo ningún efecto sobre el rendimiento productivo, las características de la fermentación ruminal, la calidad de la canal o los metabolitos plasmáticos, de terneras alimentadas con un concentrado granulado basado en trigo y cebada (32% almidón; 1.700 kcal EN/kg) con paja ad libitum, en comparación con las terneras que recibían el concentrado sin suplementar.
4. La administración a las terneras de un concentrado con un 40% de maíz tendió a reducir un 4% el índice de conversión en comparación con la inclusión de un 40,5% de trigo, sin que se observaran diferencias significativas entre cereales en el consumo de concentrado, el rendimiento productivo o las características de la canal. Las terneras alimentadas con maíz tuvieron papilas más cortas y tendieron a mostrar rúmenes más claros en comparación con aquellas que recibieron trigo.
5. El pH ruminal, las concentraciones de ammonia-N y la proporción molar de los ácidos grasos volátiles individuales no difirieron entre terneras alimentadas con un concentrado a base de maíz (40%) frente a aquellas alimentadas con un concentrado a base de trigo (40.5%), pero la concentración total de ácidos grasos volátiles tendió a ser un 6% mayor en las terneras que recibieron maíz en comparación con las que recibieron trigo.
6. El incremento de la energía del concentrado de 1.453 a 1.700 kcal EN por kg redujo el consumo de concentrado en un 4% y el índice de conversión en un 9% en terneras de carne, sin que se observase ningún efecto en el peso vivo, los parámetros ruminales (el pH y las concentraciones de ácidos grasos volátiles totales y ammonia-N), la ganancia media diaria o las características de la canal. Las terneras alimentadas con dietas altas en energía tuvieron papilas ruminales más cortas y tendieron a presentar rúmenes más oscuros en comparación con las terneras alimentadas con dietas bajas en energía.
94

Chapter VI: Conclusions / Conclusiones
7. La incubación in vitro de los concentrados empleados en los ensayos experimentales con líquido ruminal tamponado de las terneras mostró marcadas diferencias en la magnitud de la mayoría de los parámetros determinados in vivo e in vitro, pero existieron relaciones significativas entre los valores obtenidos in vivo e in vitro para el pH, la concentración total de ácidos grasos volátiles y la relación acético:propiónico. Por el contrario, no se detectaron correlaciones in vivo - in vitro para las concentraciones de lactato y ammonia-N.
95

Chapter VI: Conclusions / Conclusiones
96

CHAPTER VII. REFERENCES
97

Chapter VII. References
98

Chapter VII. References
Álvarez, P.J.; Carro, M.D. 2005. Los prebióticos en la alimentación del ganado vacuno. Bovis 125: 7-31.
Asanuma, N.; Hino, T. 2002. Regulation of fermentation in a ruminal bacterium, Streptococcus bovis, with special reference to rumen acidosis. J. Anim. Sci. 73: 313-325. DOI: http://dx.doi.org/10.1046/j.1344-3941.2002.00044.x
Asanuma, N.; Iwamoto, M.; Hino, T. 1999. Effect of the addition of fumarate on methane production by ruminal microorganisms in vitro. J. Dairy Sci. 82: 780-787. DOI: https://doi.org/10.3168/jds.S0022-0302(99)75296-3
Association of Official Analytical Chemists. 1999. Official Methods of Analysis, 16th Edition, 5th revision. Association of Official Analytical Chemists International, Gaithersburg, MD, USA.
Bacha, F. 1991. Efecto de las características fisicoquímicas de los cereales y subproductos de molinería sobre la degradabilidad de las materias nitrogenadas. Tesis Doctoral. Universidad Politécnica de Madrid.
Baumann, T.A.; Radunz, A.E.; Lardy, G.P.; Anderson, V.L.; Caton, J.S.; Bauer, M.L. 2004. Effects of tempering and yeast-enzyme mixture on intake ruminal fermentation, in situ disappearance, performance, and carcass traits in steers fed barley-based diets. The Prof. Anim. Sci. 20: 178-184. DOI: http://dx.doi.org/10.15232/S1080-7446(15)31293-6
Bayaru, E.; Kanda, S.; Kamada, T.; Itabashi, H.; Andoh, S.; Nishida, T.; Ishida, M.; Itoh, T.; Nagara, K.; Isobe, Y. 2001. Effect of fumaric acid on methane production, rumen fermentation and digestibility of cattle fed roughage alone. Anim. Sci. J. 72: 139-146.
Beauchemin, K.A.; McGinn, S.M. 2006. Methane emissions from beef cattle: effects of fumaric acid, essential oil, and canola oil. J. Anim. Sci. 84:1489–1496. DOI: http://dx.doi.org/10.2527/2006.8461489x
Beauchemin, K.; Penner, G. 2009. New developments in understanding ruminal acidosis in dairy cows. Proceedings of the 18th Tri-State Dairy Nutrition Conference, pp. 6–17. Columbus, Ohio, USA.
Bock, B.J.; Brandt, RT.; Harmon, D.L.; Andersons, S.J.; Elliott, J.K.; Avery, T.B. 1991. Mixtures of wheat and high-moisture corn in finishing diets: feedlot performance and in situ rate of starch digestion in steers. J. Anim. Sci. 69: 2703-2710. DOI: http://dx.doi.org/10.2527/1991.6972703x
Boletín Oficial del Estado, 2013. Royal Decree 53/2013, of 1 February, establishing basic standards for the protection of animals used in experiments and for other scientific purposes, including education. Boletín Oficial del Estado, no. 34, 08/02/2013.
Brown, M.S.; Ponce, C.H.; Pulikanti, R. 2006. Adaptation of beef cattle to high-concentrate diets: performance and ruminal methabolism. J. Anim. Sci. 84: E25-E33. DOI: http://dx.doi.org/10.2527/2006.8413_supplE25x
Caja, G.; González, E.; Flores, C.; Carro, M.D.; Albanell, E. 2003. Alternativas a antibióticos de uso alimentario en rumiantes. XIX Curso de especialización
99

Chapter VII. References
FEDNA. Avances en nutrición y alimentación animal, pp. 181-214. Ed. Fundación Española para el Desarrollo de la Nutrición Animal. Madrid, Spain.
Caldwell, D.R.; Bryant, M.P. 1966. Medium without rumen fluid nonselective enumeration and isolation of rumen bacteria. Appl. Microbiol. 14: 794-801.
Callaway, T.R.; Martin, S.A. 1997. Effects of cellobiose and monensin on in vitro fermentation of organic acids by mixed ruminal bacteria. J. Dairy Sci. 80: 1126-1135. DOI: http://dx.doi.org/10.3168/jds.S0022-0302(97)76039-9
Callaway, T.R.; Martin, S.A.; Wampler, J.L.; Hill, N.S.; Hill, G.M. 1997. Malate content of forage varieties commonly fed to cattle. J. Dairy Sci. 80: 1651-1655. DOI: http://dx.doi.org/10.3168/jds.S0022-0302(97)76096-X
Calsamiglia, S.; Blanch, M.; Ferret, A.; Moya, D.; 2012. Is subacute ruminal acidosis a pH related problem? Causes and tools for its control. Anim. Feed Sci. Technol. 172: 42-50. DOI: https://doi.org/10.1016/j.anifeedsci.2011.12.007
Carrasco, C.; Medel, P.; Fuentetaja, A.; Carro, M.D. 2012. Effect of malate form (acid or disodium/calcium salt) supplementation on performance, ruminal parameters and blood metabolites of feedlot cattle. Anim. Feed Sci. Technol. 176: 140-149. DOI: http://dx.doi.org/10.1016/j.anifeedsci.2012.07.017
Carro, M.D.; Ranilla, M.J. 2003. Effect of the addition of malate on in vitro rumen fermentation of cereal grains. Br. J. Nutr. 89: 279-288. DOI: http://dx.doi.org/10.1079/BJN2002759
Carro, M.D.; Ungerfeld, E.M. 2015. Utilization of organic acids to manipulate ruminal fermentation and improve ruminant productivity. In: A. K. Puniya and D. N. Kamra, editors, Rumen microbiology: from evolution to revolution, pp. 177–98. Springer, New Delhi, India. DOI: http://dx.doi.org/10.1007/978-81-322-2401-3
Carro, M.D.; Lebzien, P.; Rohr, K. 1992. Influence of yeast culture on the "in vitro" fermentation (Rusitec) of diets containing variable portions of concentrates. Anim. Feed Sci. Technol. 37: 209-220. DOI: http://dx.doi.org/10.1016/0377-8401(92)90005-Q
Carro, M.D.; López, S.; Valdés, C.; Ovejero, F.J. 1999. Effect of DL-malate on mixed ruminal microorganism fermentation usign the rumen simulation technique (Rusitec). Anim. Feed Sci. Technol. 79: 279-288. DOI: http://dx.doi.org/10.1016/S0377-8401(99)00034-6
Carro, M.D.; Ranilla, M.J.; Giráldez, F.J.; Mantecón, A.R. 2006. Effects of malate on diet digestibility, microbial protein synthesis, plasma metabolites, and performance of growing lambs fed a high-concentrate diet. J. Anim. Sci. 84, 405-410. DOI: http://dx.doi.org/10.2527/2006.842405x
Carro, M.D.; Saro, C.; Mateos, I.; Díaz, A.; Ranilla, M.J. 2014. Empleo de probióticos en la alimentación de rumiantes. Ganadería Septiembre-Octubre 14: 42-49.
Castillo, C.; Benedito, J.L.; Méndez, J.; Pereira, V.; López-Alonso, M.; Miranda, M.; Hernández, J. 2004. Organics acids as a substitute for monensin in diets for beef
100

Chapter VII. References
cattle. Anim. Feed Sci. Technol. 115: 101-116. DOI: http://dx.doi.org/10.1016/j.anifeedsci.2004.02.001.
Castillo, C.; Benedito, J.L.; Pereira, V.; Vázquez, P.; López Alonso, M.; Méndez, J.; Hernández, J. 2007. Malic acid supplementation in growing/finishing feedlot bull calves: Influence of chemicals form on blood acid-base balance and productive performance. Anim. Feed Sci. Technol. 135: 222-235. DOI: http://dx.doi.org/10.1016/j.anifeedsci.2006.07.010
Chaucheryas, F.; Fonti, G.; Bertin, G.; Gouet, P. 1995. In vitro H2 utilization by a ruminal acetogenic bacterium cultivated alone or with Archaea methanogen is stimulated by a probiotic strain of Saccharomyces cerevisae. Appl. Environ. Microb. 61: 3466-3470.
Chaucheryas, F.; Fonty, G.; Bertin, G.; Salmon, J.M.; Gouet, P. 1996. Effects of a strain of Saccharomyces cerevisae (Levucell SC), a microbial additive for ruminants, on lactate metabolism in vitro. Can. J. Microb. 42: 927-933. DOI: http://dx.doi.org/10.1139/m96-119
Chaucheyras-Durand, F.; Chevaux, E.; Martin, C.; Forano, E. 2012. Use of yeast probiotics in ruminants: effects and mechanisms of action on rumen pH, fibre degradation, and microbiota according to the diet. In: E. Rigobelo, editor, Probiotic in animals, In Tech. DOI: http://dx.doi.org/10.5772/50192
Chiquette, J. 1995. Saccharomyces cerevisiae and Aspergillus oryzae, used alone or in combination, as a feed supplement for beef and dairy cattle. Can. J. Anim. Sci. 75: 405-415. DOI: http://dx.doi.org/10.4141/cjas95-060
Constable, P.D.; Hinchcliff, K.W.; Done, S.H.; Gruenberg, W. 2017. Chapter 8 – Diseases of the Alimentary Tract–Ruminant. In: Veterinary Medicine: A textbook of the diseases of cattle, horses, sheep, pigs and goats, pp. 2278. Elsevier Health Sciences, Sant Louis, Missouri, USA. DOI: http://dx.doi.org/10.1016/B978-0-7020-5246-0.00008-5
Corona, L.; Owens, F.N.; Zinn, R.A. 2006. Impact of corn vitreousness and processing on site and extent of digestion by feedlot cattle. J. Anim. Sci. 84: 3020-3031. DOI: http://dx.doi.org/10.2527/jas.2005-603
Danscher, A.M.; Li, S.; Andersen, P.H.; Khafipour, E.; Kristensen, N.B.; Plaizier, J.C. 2015. Indicators of induced subacute ruminal acidosis (SARA) in Danish Holstein cows. Acta Veterinaria Scandinavica 57(1): 39. DOI: http://dx.doi.org/10.1186/s13028-015-0128-9
Dawson, K.A.; Allison, M.J. 1988. Digestive disorders and nutritional toxicity. In: the rumen microbial ecosystems. Ed. P.N. Hobson, pp. 129-150. P.N. Hobson Elsevier Science Publisher, London, UK. DOI: http://dx.doi.org/10.1007/978-94-009-1453-7_14
de Blas C, Mateos GG, García-Rebollar P, 2010. Tablas FEDNA de composición y valor nutritivo de alimentos para la fabricación de piensos compuestos. 3th rev. Ed. Fundación Española para el Desarrollo de la Nutrición Animal, Madrid, Spain.
101
Chapter VII. References
De Ondarza, M.B.; Sniffen, C.J.; Dussert, L.; Chevaux, E.; Sullivan, J.; Walker, N.D. 2010. Case study: Multiple-Study analysis of the effect of live yeast on milk yield, milk component content and yield, and feed efficiency. The Professional Animal Scientist 26: 661-666. DOI: http://dx.doi.org/10.15232/S1080-7446(15)30664-1
Demeyer, D.I. 1991. Quantitative aspects of microbial metabolism in the rumen and hindgut. In: Rumen Microbial Metabolism and Ruminant Digestion, pp. 217–237. Ed. Jouany, J.P. INRA Editions, Paris, France.
Desnoyers, M.; Giger-Reverdin, S.; Bertin, G.; Duvaux-Ponter, C.; Sauvant, D. 2009. Meta-analysis of the influence of Saccharomyces cerevisiae supplementation on ruminal parameters and milk production of ruminants. J. Dairy Sci. 92: 1620-1632. DOI: http://dx.doi.org/10.3168/jds.2008-1414
Devant, M.; Ferret, A.; Gasa, J.; Calsamiglia, S.; Casals, R. 2000. Effects of protein concentration and degradability on performance, ruminal fermentation, and nitrogen metabolism in rapidly growing heifers fed high-concentrate diets from 100 to 230 kg body weight. J. Anim. Sci. 78: 1667-1676. DOI: http://dx.doi.org/10.2527/2000.7861667x
Devant, M.; Bach, A.; Solé, A.; Quintana, B.; Verdú, M. 2015. La importancia del manejo alimentario del ternero. I Jornada Fedna-Anembe 25 Aniversario Nutrición de Rumiantes, pp. 71-84. Ed. Fundación Española para el Desarrollo de la Nutrición Animal. Madrid, Spain.
Dohme, F.; DeVries, T.J.; Beauchemin, K.A. 2008. Repeated ruminal acidosis challenges in lactating dairy cows at high and low risk for developing acidosis: ruminal pH. J. Dairy Sci. 91: 3554-3567. DOI: http://dx.doi.org/10.3168/jds.2008-1264
Duffield, T.; Plaizier, J.C.; Fairfield, A.; Bagg, R.; Vessie, G.; Dick, P.; Wilson, J.; Aramini, J.; McBride, B. 2004. Comparison of Techniques for Measurement of Rumen pH in Lactating Dairy Cows. J. Dairy. Sci. 87: 59-66. DOI: http://dx.doi.org/10.3168/jds.S0022-0302(04)73142-2
Durand-Chaucheyras, F.; Fonty, G.; Bertin, G.; Theveniot, M.; Gouet, P. 1998. Fate of Levucell SC I-1077 yeast additive during digestive transit in lambs. Reprod. Nutr. Dev. 38: 275-280. DOI: http://dx.doi.org/10.1051/rnd:19980307
Faleiro, A.G.; González, L.A.; Blanch, M.; Cavini, S.; Castells, L.; Ruíz de la Torre, J. L.; Manteca, X.; Calsamiglia, S.; Ferret, A. 2011. Performance, ruminal changes, behaviour and welfare of growing heifers fed a concentrate diet with or without barley straw. Animal 5: 294–303. DOI: http://dx.doi.org/10.1017/S1751731110001904
FAO/WHO. 2001. Health and nutritional properties of probiotics in food including powder milk with live lactic acid bacteria. Report of a Joint FAO WHO Expert Consultation, pp. 34. Cordoba, Argentina.
Ferraretto, L.F.; Crump, P.M.; Shaver, R.D. 2013. Effect of cereal grain type and corn grain harvesting and processing methods on intake, digestion, and milk production by dairy cows through a meta-analysis. J. Dairy Sci. 96: 533-550. DOI: http://dx.doi.org/10.3168/jds.2012-5932
102

Chapter VII. References
Flores, C.; Caja, G.; Romero, R.; Mesia, J. 2003. Malate in concentrate improves growth performance and digestibility of intensively fattened lambs. J. Dairy Sci. 86 (Suppl. 1): 149.
Foley, P.A.; Kenny, D.A.; Callan, J.J.; Boland, T.M.; O’Mara, F.P. 2009. Effect of DL-malic acid supplementation on feed intake, methane emission, and rumen fermentation in beef cattle. J. Anim. Sci. 87: 1048-1057. DOI: http://dx.doi.org/10.2527/jas.2008-1026
Fonty, G.; Chaucheyras-Durand, F. 2006. Effects and modes of action of live yeasts in the rumen. Biologia, Bratislava, 61: 741—750. DOI: http://dx.doi.org/10.2478/s11756-006-0151-4
Fulton, W.R.; Klopfenstein, T.J.; Britton, R.A. 1979. Adaptation to high concentrate diets by beef cattle. I. Adaptation to corn and wheat diets. J. Anim. Sci. 49: 775 - 784. DOI: http://dx.doi.org/10.2527/jas1979.493775x
Gäbel, G.; Aschenbach, J.R.; Müll, F. 2002. Transfer of energy substrates across the ruminal epithelium: Implications and limitations. Anim. Health Res. Rev. 3: 15-30. DOI: https://dx.doi.org/10.1079/AHRR200237
García-Martínez, R.; Ranilla, M.J.; Tejido, M.L.; Carro, M.D. 2005. Effects of disodium fumarate on in vitro rumen microbial growth, methane production and fermentation of diets differing in their forage: concentrate ratio. Br. J. Nutr. 94: 71-77. DOI: http://dx.doi.org/10.1079/BJN20051455
Gelberg, H.B. 2016. Chapter 7. Alimentary System and the Peritoneum, Omentun, Mesentery, and Peritoneal Cavity. In: Pathologic Basis of Veterinary Disease Expert Consult, pp: 324–411. Eds. Zachary, J.F.; McGavin, M.D. Elsevier Health Sciences. St. Louis, USA.
Gimeno, A.; Dieste, A.; Al-Alami, A.; de-Vega, A.; Castrillo, C.; Fondevilla, M. 2014. Effect of feed presentation form on the intake pattern, productive traits and rumen pH of beef cattle fed high concentrate diets. Span. J. Agri. Res. 12: 1105-1109. DOI: http://dx.doi.org/10.5424/2015134-8003
Goad, D.W.; Goad, C.L.; Nagaraja, T.G. 1998. Ruminal microbial and fermentative changes associated with experimentally induced subacute acidosis in steers. J. Anim. Sci. 76: 234-241. DOI: http://dx.doi.org/10.2527/1998.761234x
Goering, M.K.; Van-Soest, P.J. 1970. Forage Fiber Analysis (apparatus, reagents, procedures and some applications). In: Agricultural Handbook 379. Agricultural Research Services USDA, Washington DC, USA.
Gómez, J. A.; Tejido, M.L.; Carro, M.D. 2005. Mixed rumen micro-organisms growth and rumen fermentation of two diets in RUSITEC fermenters: influence of disodium malate supplementation. Br. J. Nutr. 93: 479-484. DOI: http://dx.doi.org/10.1079/BJN20041367
González, L.A.; Ferret, A.; Manteca, X.; Ruiz-de-la-Torre, J.L.; Calsamiglia, S.; Devant, M.; Bach, A. 2008a. Performance, behavior, and welfare of Friesian eifers housed in
103

Chapter VII. References
pens with two, four, and eight individuals per concentrate feeding place. J. Anim. Sci. 86: 1446-1458. DOI: http://dx.doi.org/10.2527/jas.2007-0675
González, L.A.; Ferret, A.; Manteca, X.; Ruiz-de-la-Torre, J.L.; Calsamiglia, S.; Devant, M.; Bach, A. 2008b. Effect of the number of concentrate feeding places per pen on performance, behavior, and welfare indicators of Friesian calves during the first month after arrival at the feedlot. J. Anim. Sci. 86: 419–431. DOI: http://dx.doi.org/10.2527/jas.2007-0362
Gottschelk, G. 1986. Bacterial Metabolism. 2ª Ed. Springer-Verlag, New York, USA.
Gozho, G.N.; Mutsvangwa, T. 2008. Influence of carbohydrate source on ruminal fermentation characteristics, performance, and microbial protein synthesis in dairy cows. J. Dairy Sci. 91: 2726–2735. DOI: http://dx.doi.org/10.3168/jds.2007-0809
Hernández, J.; Castillo, C.; Méndez, J.; Pereira, V.; Vázquez, P.; López Alonso, M; Vilariño, O., Benedito, J.L. 2011. The influence of chemical form on the effects of supplementary malate on serum metabolites and enzymes in finishing bull calves. Livest. Sci. 137: 260-263. DOI: http://dx.doi.org/10.1016/j.livsci.2010.10.001
Hutcheson, D. 2007. Influence of grain processing in beef production. I Congreso Argentino de Nutrición Animal, pp. 27-30. CAENA. Buenos Aires, Argentina.
Iraira, S.P.; Madruga, A.; Pérez-Juan, M.; Ruiz-de-la-Torre, J.L.; Rodríguez-Prado, M.; Calsamiglia, S.; Ferret, A. 2015. Performance, behaviour and meat quality of beef heifers fed concentrate and straw offered as total mixed ration or free-choice. Span. J. Agri. Res. 13: e0610. DOI: http://dx.doi.org/10.5424/sjar/2015134-8003
Isobe, Y.; Shibata, F. 1993. Rumen fermentation in goats administered fumaric acid. Anim. Sci. Technol. 64: 1024–1030. DOI: http://dx.doi.org/10.2508/chikusan.64.1024
Issakowicz, J.; Bueno, M.S.; Sampaio, A.C.K.; Duarte, K.M.R. 2013. Effect of concentrate level and live yeast (Saccharomyces cerevisiae) supplementation on Texel lamb performance and carcass characteristics. Livest. Sci. 155: 44-52. DOI: http://dx.doi.org/10.1016/j.livsci.2013.04.001
Jorgensen, K.F.; Kristensen, N.B.; Weisbjerg, M.R.; Hojberg, O.; Norgaard, P.; Vestergaard, M. 2007. Ruminal fermentation and in sacco NDF degradability in growing bull calves fed different starch levels and two types of roughage. 58th Annual Meeting of the European Association of Animal Production (Dublin, Irlanda).
Khampa, S.; Wanapat, M.; Wachirapakorn, C.; Nontaso, N.; Wattiaux, M.A.; Rowlison, P. 2006. Effect of levels of sodium DL-malate supplementation on ruminal fermentation efficiency of concentrates containing high levels of cassava chip in dairy steers. Asian-Aust. J. Anim. Sci. 19: 837–844. DOI: http://dx.doi.org/10.5713/ajas.2006.368
Khan, M.A.; Lee, H.J.; Lee, W.S.; Kim, H.S.; Kim, H.B.; Park, S.B.; Baek, K.S.; Ha, J.K.; Choi, Y.J. 2008. Starch Source Evaluation in Calf Starter: II. Ruminal parameters, Rumen Development, Nutrient Digestibilities, and Nitrogen Utilization in Holstein Calves. J. Dairy. Sci. 91: 1140-1149. DOI: http://dx.doi.org/10.3168/jds.2007-0337
104

Chapter VII. References
Krehbiel, C.R.; Britton, R.A.; Harmon, D.L.; Wester, T.J.; Stock, R.A. 1995. The effects of ruminal acidosis on volatile fatty acid absortion and plasma activities of pancreatic enzymes in lambs. J. Anim. Sci. 73: 3111-3121. DOI: http://dx.doi.org/10.2527/1995.73103111x
Krehbiel, C.R.; Cranston, J.J.; McCurdy, M.P. 2006. An upper limit for caloric density of finishing diets. J. Anim. Sci. 84: E34-E49. DOI: http://dx.doi.org/10.2527/2006.8413_supplE34x
Kreikemeier; K.K, Stock R A, Briok D R, Brim R A, 1987. Feeding combinations of dry corn and wheat to finishing lambs and cattle. J Anim Sci 65: 1647 -1654. http://dx.doi.org/10.2527/jas1987.6561647x.
Kung Jr., Huber, J.T.; Krummrey, J.D; Allison, L.; Cook, R.M. 1982. Influence of adding malic acid to dairy cattle rations on milk production, rumen volatile acids, digestibility, and nitrogen utilization. J. Dairy Sci. 65: 1170–1174. DOI: http://dx.doi.org/10.3168/jds.S0022-0302(82)82328-X
Kung Jr., L.; Kreck, E.M.; Tung, R.S.; Hession, A.O.; Sheperd, A.C.; Cohen, M.A.; Swain, H.E.; Leedle, J.A.Z. 1997. Effects of a live yeast culture and enzymes on in vitro ruminal fermentation and milk production of dairy cows. J. Dairy Sci. 80: 2045-2051. DOI: http://dx.doi.org/10.3168/jds.S0022-0302(97)76149-6
Lana, R.P.; Russell, J.B.; Van Amburgh, M.E. 1998. The role of pH in regulating ruminal methane and ammonia production. J. Anim. Sci. 76: 2190-2196. DOI: http://dx.doi.org/10.2527/1998.7682190x
Lascano, G.J.; Heinrichs, A.J. 2009. Rumen fermentation pattern of dairy heifers fed restricted amounts of low, medium and high concentrate diets without and with yeast culture. Livest. Sci. 124: 48-57. DOI: http://dx.doi.org/10.1016/j.livsci.2008.12.007
Lascano, G.J.; Zanton, G.I.; Suarez-Mena, F.X.; Heinrichs, A.J. 2009. Effect of limit feeding high- and low-concentrate diets with Saccharomyces cerevisiae on digestibility and on dairy heifer growth and first-lactation performance. J. Dairy Sci. 92: 5100-5110. DOI: http://dx.doi.org/10.3168/jds.2009-2177
Lascano, G.J.; Heinrichs, A.J.; Tricarico, J.M. 2012. Substitution of starch by soluble fiber and Saccharomyces cerevisiae dose response on nutrient digestion and blood metabolites for precision-fed dairy heifers. J. Dairy Sci. 95: 3298–3309. DOI: 10.3168/jds.2011-5047.
Li, L.; Zhu, Y.; Wang, X.; He, Y.; Cao, B. 2014. Effects of different dietary energy and protein levels and sex on growth performance, carcass characteristics and meat quality of F1 Angus x Chinese Xiangxi yellow cattle. J. Anim. Sci. and Biotechnol. 5: 21. DOI: http://dx.doi.org/10.1186/2049-1891-5-21
Liu, Q.; Wang, C.; Yang, W.Z.; Dong, Q.; Dong, K.H.; Huang, Y.X.; Yang, X.M.; He, D.C. 2009. Effects of malic acid on rumen fermentation, urinary excretion of purine derivatives and feed digestibility in steers. Animal 2: 32-39. DOI: http://dx.doi.org/10.1017/S1751731108003364
105

Chapter VII. References
Liu, Y.; Zhao, H.; Liu, X.; You, W.; Cheng, H.; Wan, F.; Zhang, X. 2016. Substitution of wheat for corn in beef cattle diets: digestibility, digestive enzyme activities, serum metabolite contents and ruminal fermentation. Asian Australas. J. Anim. Sci. 29: 1424–1431. DOI: http://dx.doi.org/10.5713/ajas.15.0866
López, S.; Valdés, C.; Newbold, C.J.; Wallace, R.J. 1999. Decreased methane production and altered fermentation in response to the addition of fumaric acid to the rumen simulation technique (Rusitec). British J. Nutr. 81: 59-64. DOI: https://dx.doi.org/10.1017/S000711459900015X
Lyons, T.P. 1987. The role of biological tools in the feed industry. In: Biotechnology in the Feed Industry, pp. 1 - 50. Alltech Technical Publications. Nicholasville, Kentucky, USA.
Mackie, R.I.; Gilchrist, F.M.C. 1979. Changes in lactate-utilizing bacteria in relation to pH in the rumen of sheep during stepwise adaptation to a high-concentrate diet. Appl. Environm. Microb. 38: 422-430.
MAGRAMA. 2015. Caracterización del sector vacuno de carne 2015. http://www.magrama.gob.es/es/ganaderia/temas/produccion-y-mercados-ganaderos/sectores-ganaderos/vacunode-carne/informacion-del-sector/
Maia, M.R.; Chaudhary, L.C.; Figueres, L.; Wallace, R.J. 2007. Metabolism of polyunsaturated fatty acids and their toxicity to the microflora of the rumen. A van Leeuw J. Microb. 91: 303 – 314. DOI: http://dx.doi.org/10.1007/s10482-006-9118-2
Martin, S.A. 1998. Manipulation of ruminal fermentation with organic acids: a review. J. Anim. Sci. 76: 3123-3132. DOI: http://dx.doi.org/10.2527/1998.76123123x
Martin, S.A.; Streeter, M.N. 1995. Effect of malate on in vitro mixed ruminal microorganism fermentation. J. Anim. Sci. 73: 2141-2145. DOI: http://dx.doi.org/10.2527/1995.7372141x
Martin, S.A.; Park, C.M. 1996. Effect of extracellular hydrogen on organic acid utilization by the ruminal bacterium Selenomonas rumiantium. Curr. Microbiol. 32: 327-331. DOI: http://dx.doi.org/10.1007/s002849900058
Martin, S.A.; Streeter, M.N.; Nisbet, D.J.; Hill, G.M.; Williams, S.E. 1999. Effects of DL-malate on ruminal metabolism and performance of cattle fed a high-concentrate diet. J. Anim. Sci. 77: 1008–1015. DOI: http://dx.doi.org/10.2527/1999.7741008x
Martin, C.; Morgavi, D.P.; Doreau, M. 2010. Methane mitigation in ruminants: from microbe to the farm scale. Animal 4: 351-365. DOI: http://dx.doi.org/10.1017/S1751731109990620
Martínez, M.E.; Ranilla, M.J.; Tejido, M.L.; Ramos, S.; Carro, M.D. 2010. The effect of the diet fed to donor sheep on in vitro methane production and ruminal fermentation of diets of variable composition. Anim. Feed Sci. Technol. 158: 126–135. DOI: https://dx.doi.org/10.1016/j.anifeedsci.2010.04.005
Mateos, I.; Ranilla, M.J.; Tejido, M.L.; Saro, C.; Kamel, C.; Carro, M.D. 2013. The influence of diet on the effectiveness of garlic oil and cinnamaldehyde to manipulate in vitro
106

Chapter VII. References
ruminal fermentation and methane production. Anim. Prod. Sci. 53: 299–307. DOI: http://dx.doi.org/10.1071/AN12167
Mateos, I.; Ranilla, M.J.; Saro, C.; Carro, M.D. 2015. Comparison of fermentation characteristics and bacterial diversity in the rumen of sheep and batch cultures of rumen microorganisms. J Agric Sci 153: 1097-1106. DOI: https://dx.doi.org/10.1017/S0021859615000167
McAllister, T.A.; Phillippe, R.C.; Rode, L.M.; Cheng, K.J. 1993. Effect of the protein matrix on the digestion of cereal grains by ruminal microorganisms. J. Anim. Sci. 71: 205-212. DOI: http://dx.doi.org/10.2527/1993.711205x
McAllister, T.A.; Gibb, D.J.; Beauchemin, K.A.; Wang, Y. 2006. Starch type and ruminal digestion. In: Cattle grain processing symposium, pp. 30-41. Tulsa, Oklahoma State Universitiy, USA.
McCourt, A.R.; Yan, T.; Mayne, S.; Wallace, J. 2008. Effect of dietary inclusion of encapsulated fumaric acid on methane production from grazing dairy cows. In: Proc. Br. Soc. Anim. Sci. Annu. Conf., pp. 64. Ed. Br. Soc. Anim. Sci., Midlothian, Scotland, UK.
McGinn, S.M.; Beauchemin, K.A.; Coates, T.; Colombatto, D. 2004. Methane emissions from beef cattle: effects of monensin, sunflower oil, enzymes, yeast, and fumaric acid. J. Anim. Sci. 82:3346–3356. DOI: http://dx.doi.org/10.2527/2004.82113346x
Mir, Z.; Mir, P.S. 1994. Effect of the addition of live yeast (Saccharomyces cerevisiae) on growth and carcass quality of steers fed high forage or high grain diets and on feed digestibility and in situ degradability. J. Anim. Sci. 72: 537-545. DOI: http://dx.doi.org/10.2527/1994.723537x
Miranda, R.L.A.; Mendoza, M.G.D.; Bárcena-Gama, J.R.; González, M.S.S.; Ferrara, R.; Ortega, C.M.E.; Cobos, P.M.A. 1996. Effect of Saccharomyces cerevisiae or Aspergillus oryzae cultures and NDF level on parameters of ruminal fermentation. Anim. Feed Sci. Tech. 63: 289-296. DOI: http://dx.doi.org/10.1016/S0377-8401(96)01008-5
Molano, G.; Knight, T.W.; Clark, H. 2008 Fumaric acid supplements have no effect on methane emissions per unit of feed intake in wether lambs. Aust. J. Exp. Agric. 48: 165–168. DOI: http://dx.doi.org/10.1071/EA07280
Montaño, M.F.; Chai, W.; Zinn-Ware, T.E.; Zinn, R.A. 1999. Influence of malic acid supplementation on ruminal pH, lactic acid utilization, and digestive function in steers fed high concentrate finishing diets. J. Anim. Sci. 77: 780-784. DOI: http://dx.doi.org/10.2527/1999.773780x
Moya, D.; Calsamiglia, S.; Ferret, A.; Blanch, M.; Fandino, J.I.; Castillejos, L.; Yoon, I. 2009. Effects of dietary changes and yeast culture (Saccharomyces cerevisiae) on rumen microbial fermentation of Holstein heifers. J. Anim. Sci. 87: 2874–2881. DOI: http://dx.doi.org/10.2527/jas.2008-1446
Muller, L.D. 1987. Branched chain fatty acids (isoacids) and valeric acid for ruminants. Prof. Anim. Sci. 3: 9 – 12. DOI: http://dx.doi.org/10.15232/S1080-7446(15)32370-6
107

Chapter VII. References
Mutsvangwa, T.; Edwards, I.E.; Topps, J.H.; Paterson, G.F.M. 1992. The effect of dietary inclusion of yeast culture (Yea-Sacc) on patterns of rumen fermentation, food intake and growth of intensively fed bulls. Anim. Sci. 55: 35-40. DOI: https://doi.org/10.1017/S0003356100037247
National Research Council, 2000. Nutrient Requirements of Beef Cattle. 7th Rev. Ed. Natl. Acad. Press. Washington, DC, USA. DOI: http://dx.doi.org/10.17226/9791
Newbold, C.J.; Wallace, R.J.; McIntosh, F.M. 1996. Mode of action of the yeast Saccharomyces cerevisae as feed additive for ruminants. British J. Nutr. 76: 249-256. DOI: http://dx.doi.org/10.1079/BJN19960029
Newbold, C.J.; López, S.; Nelson, N.; Ouda, J.O.; Wallace, R.J.; Moss, A.R. 2005. Propionate precursors and other metabolic intermediates as possible alternative electron acceptors to methanogenesis in ruminal fermentation in vitro. Brit. J. Nutr. 94: 27–35. DOI: http://dx.doi.org/10.1079/BJN20051445
Nisbet, D.J.; Martin, S.A. 1990. Effect of dicarboxylic acids and Aspergillus oryzae fermentation extract on lactate uptake by the ruminal bacterium Selenomonas ruminantium. Appl. Environ. Microbiol. 56: 3515-3518.
Nisbet, D.J.; Martin, S.A. 1991. Effect of a Saccharomyces cerevisae culture on lactate utilization by the ruminal bacterium Selenomonas ruminantium. J. Anim. Sci. 69: 4628-4633. DOI: http://dx.doi.org/10.2527/1991.69114628x
Nisbet, D.J.; Martin, S.A. 1993. Effects of fumarate, L-malate, and an Aspergilluys oryzae fermentation extract on D-lactate utilization by the ruminal bacterium Selenomonas ruminantium. Current Microbiol. 26: 133-136. DOI: http://dx.doi.org/10.1007/BF01577366
Nisbet, D.J.; Martin, S.A. 1994. Factors affecting L-lactate utilization by Selenomonas ruminantium. J. Anim. Sci. 72: 1355-1361. DOI: http://dx.doi.org/10.2527/1994.7251355x
Nocek, J.E. 1997. Bovine Acidosis: Implications on laminitis. J. Dairy Sci. 80: 1005-1028. DOI: http://dx.doi.org/10.3168/jds.S0022-0302(97)76026-0
Nockels, C.F.; Kintner, L.D.; Pfander, W.H. 1966. Influence of Ration on Morphology, Histology, and Trace Mineral Content of Sheep Rumen Papillae. J. Dairy. Sci. 49: 1068-1074. DOI: http://dx.doi.org/10.3168/jds.S0022-0302(66)88019-0
Official Journal of the European Union, 2006. Council Regulation (EC) No 1183/2006 of 24 July 2006 concerning the Community scale for the classification of carcasses of adult bovine animals. O.J. L 214, 4.8.2006: 1 – 6.
Oltjen, R.R.; Putnam, P.A.; Williams, E.E.; Davis, R.E. 1966. Wheat versus corn in all-concentrate cattle rations. J. Anim. Sc. 25: 1000–1004. DOI: http://dx.doi.org/10.2527/jas1966.2541000x
Owens, F.N.; Secrist, D.S.; Hill, W.H.; Gill, D.R. 1997. The effect of grain source and grain processing on performance of feedlot cattle: a review. J. Anim. Sci. 75: 868–879. DOI: http://dx.doi.org/10.2527/1997.753868x
108

Chapter VII. References
Owens, F.N.; Secrist, D.S.; Hill, W.J.; Gill, D.R. 1998. Acidosis in cattle: A review. J. Anim. Sci. 76: 275-286. DOI: http://dx.doi.org/10.2527/1998.761275x
Petri, R. M.; Schwaiger, T.; Penner, G.B.; Beauchemin, K.A.; Forster, R.J.; McKinnon, J.J.; McAllister, T.A. 2013. Characterization of the Core Rumen Microbiome in Cattle during Transition from Forage to Concentrate as Well as during and after an Acidotic Challenge. PLoS One 8 (12): e83424. DOI: http://dx.doi.org/10.1371/journal.pone.0083424
Philippeau, C.; Martin, C.; Michalet-Doreau, B. 1999. Influence of grain source on ruminal characteristics and rate, site, and extent of digestion in beef steers. J. Anim. Sci. 77: 1587-1596. DOI: http://dx.doi.org/10.2527/1999.7761587x
Rooney, L.W.; Pflugfelder, R.L. 1986. Factors affecting starch digestibility with special emphasis on sorghum and corn. J. Anim. Sci. 63: 1607-1623. DOI: http://dx.doi.org/10.257/jas1986.6351607x
Rossi, F.; Cocconcelli, P.S.; Masoero, F. 1995. Effect of a Saccharomyces cerevisae culture on growth and lactate utilization by the ruminal bacterium Megasphaera elsdenii. Ann. Zootech. 44: 403-409.
Russell, J.B.; Hino, T. 1985. Regulation of lactate production in Streptococcus bovis: A spiraling effect that contributes to rumen acidosis. J. Dairy Sci. 68: 1712-1721. DOI: http://dx.doi.org/10.3168/jds.S0022-0302(85)81017-1
Russell, J.B.; Wilson, D.B. 1996. Why are ruminal cellulolytic bacteria unable to digest cellulose at low pH? J. Dairy Sci. 79: 1503-1509. DOI: http://dx.doi.org/10.3168/jds.S0022-0302(96)76510-4
Russell, J.B.; Strobel, H.J. 1989. Effect of ionophores on ruminal fermentation. Appl. Environm. Microbiol. 55: 1-6.
Sanson, D. W., Stallcup, O.T. 1984. Growth response and serum constituents of Holstein bulls fed malic acid. Nutr. Rep. Int. 30: 1261–1267.
SAS Inc. 2005. SAS User’s Guide: Statistics, Version 9.1.3. SAS Inc., Cary, NC, USA.
Satter, L.D.; Slyter, L.L. 1974. Effect of ammonia concentration on rumen microbial protein production in vitro. Br. J. Nutri. 32: 199-208. DOI: https://dx.doi.org/10.1079/BJN19740073
Schelfinger, C.C.; Latman, M.J.; Wolin, M.J. 1975. Relationship of lactate dehydrogenase specificity and growth rate to lactate metabolism by Selenomonas ruminantium. Appl. Microbiol. 30: 916-921.
Sinclair, J.H.; Kunkel, H.O. 1959. Variations in post-weaning development of ruminal mucosa in lambs. Proc. Soc. Exptl. Biol. Med. 102: 57-61. DOI: http://dx.doi.org/10.3181/00379727-102-25142
Stella, A.V.; Paratte, R.; Valnegri, L.; Cigalino, G.; Soncini, G.; Chevaux, E.; Dell’Orto, V.; Savoini, G. 2007. Effect of administration of live Saccharomyces cerevisiae on milk production, milk composition, blood metabolites, and faecal flora in early lactating
109
Chapter VII. References
dairy goats. Small Ruminant Res. 67: 7-13. DOI: http://dx.doi.org/10.1016/j.smallrumres.2005.08.024
Stewart, C.S.; Bryant, M.P. 1988. The rumen bacteria. In: The Rumen Microbial Ecosystem, pp. 21-75. Hobson, P.N. Elsevier Science Publishing, New York, USA. DOI: http://dx.doi.org/10.1007/978-94-009-1453-7
Taylor, K.A.C.C. 1996. A simple colorimetric assay for muramic acid and lactic acid. Appl Biochem. Biotechnol. 56: 49–58. DOI: http://dx.doi.org/10.1007/BF02787869
Tejido, M. L.; Ranilla, M.J.; García-Martínez, R.; Carro, M.D. 2005. In vitro microbial growth and rumen fermentation of different diets as affected by the addition of disodium malate. Anim. Sci. 81: 31-38. DOI: http://dx.doi.org/10.1079/ASC42060031
Udén, P. 2011. Using a novel macro in vitro technique to estimate differences in absorption rates of volatile fatty acids in the rumen. J. Anim. Physiol. Anim. Nutr. 95: 27–33. DOI: http://dx.doi.org/10.1111/j.1439-0396.2009.00976.x
Van Soest, P.J. 1994. Nutritional ecology of the ruminant. 2nd edition. Ed. Cornell University Press, Ithaca, NY, USA.
Van Soest, P.J.; Wine, R.H.; Moore, L.A. 1966. Estimation of the true digestibility of forages by the in vitro digestion of cell walls. In: Proc. 10th Int. Grasslands Congress, pp. 438-441. Helsinki, Finland.
Van Soest, P.J.; Robertson, J.B.; Lewis, B.A. 1991. Methods for dietary fiber, neutral detergent fiber, and nonstarch polysaccharides in relation to animal nutrition. J. Dairy Sci. 74: 3583-3597. DOI: http://dx.doi.org/10.3168/jds.S0022-0302(91)78551-2
Verdú, M.; Bach, A.; Devant, M. 2015. Effect of concentrate feeder design on performance, eating and animal behavior, welfare, ruminal health, and carcass quality in Holstein bulls fed high-concentrate diets. J. Anim. Sci. 93: 3018-3033. DOI: http://dx.doi.org/10.2527/jas.2014-8540
Vyas, D.; Uwizeye, A.; Mohammed, R.; Zang, W.Z.; Walker, N.D.; Beauchemin, K.A. 2014a. The effects of active dried and killed dried yeast on subacute ruminal acidosis, ruminal fermentation, and nutrient digestibility in beef heifers. J. Anim. Sci. 92: 724-732. DOI: http://dx.doi.org/10.2527/jas.2013-7072
Vyas, D.; Uwizeye, A.; Yang, W.Z.; Beauchemin, K.A. 2014b. Importance of yeast viability for reducing the effects of ruminal acidosis in beef heifers during and following an imposed acidosis challenge. Anim. Feed Sci. Technol. 197: 103-113. DOI: http://dx.doi.org/10.1016/j.anifeedsci.2014.09.004
Vyas, D.; Beauchemin, K.A.; Koenig, K.M. 2015. Using organic acids to control subacute ruminal acidosis and fermentation in feedlot cattle fed a high-grain diet. J. Anim. Sci. 93: 3950-3958. DOI: http://dx.doi.org/10.2527/jas.2015-9009
Warner, A.C.I. 1962. Some factors influencing the rumen microbial population. J. Gen. Microb. 28: 129-146. DOI: http://dx.doi.org/10.1099/00221287-28-1-129
110

Chapter VII. References
Weatherburn, M.W. 1967. Phenol hypoclorite reaction for determination of ammonia. Anal. Chem. Am. Chem. Soc. 89: 971-974. DOI: http://dx.doi.org/10.1021/ac60252a045
Wood, T.A.; Wallace, R.J.; Rowe, A.; Price, J.; Yáñez-Ruiz, D.R.; Murray, P.; Newbold, C.J. 2009. Encapsulated fumaric acid as a feed ingredient to decrease ruminal methane emissions. Anim. Feed Sci. Technol. 152: 62–71. DOI: http://dx.doi.org/10.1016/j.anifeedsci.2009.03.006
Yalçm, S.; Yalçm, S.; Can, P.; Gürdal, A.O.; Bager, C.; Eltal, Ö. 2011. The nutritive value of live yeast culture (Saccharomyces cerevisiae) and its effect on milk yield, milk composition and some blood parameters of dairy cows. Asian Australa. J. Anim. Sci. 24: 1377-1385. DOI: http://dx.doi.org/10.5713/ajas.2011.11060
Yang, W.Z.; Xu, L.; Zhao, Y.L.; Chen, L.Y.; McAllister, T.A. 2014. Impact of hard vs. soft wheat and monensin level on rumen acidosis in feedlot heifers. J. Anim. Sci. 92: 5088–5098. DOI: http://dx.doi.org/10.2527/jas2014-8092
Yoon, I.K.; Stern, M.D. 1995. Influence of direct-fed microbials on ruminal microbial fermentation and performance of ruminants: A review. Asian Australa. J. Anim. Sci. 8: 533-555. DOI: http://dx.doi.org/10.5713/ajas.1995.553
Yu, C.W.; Chen, Y.S.; Cheng, Y-H.; Cheng, Y-S; Yang, C-M.J.; Chang, C-T. 2010. Effects of fumarate on ruminal ammonia accumulation and fiber digestion in vitro and nutrient utilization in dairy does. J. Dairy Sci. 93: 701–710. DOI: http://dx.doi.org/10.3168/jds.2009-2494
111