STRATEGIC PLANN ING PRACTICES NESS PERFORMANCE …
109
STRATEGIC PLANNING PERFORMANCE OUTCO THESIS SUBMITTED IN PA THE MASTER OF B U GRADU SUPERV G PRACTICES: THE ANTECEDENTS AND OMES IN ZIMBABWEAN SMALL TO MEDI ENTERPRISES (SMES). BY RAYNOLD T. CHIKWAMA (R075208K) ARTIAL FULFILMENT OF THE REQUIRE BUSINESS ADMINISTRATION (MBA) DEG UNIVERSITY OF ZIMBABWE UATE SCHOOL OF MANAGEMENT VISOR: DR. MAXWELL SANDADA FEBRUARY 2016 D BUSINESS IUM SCALE EMENTS FOR GREE
Transcript of STRATEGIC PLANN ING PRACTICES NESS PERFORMANCE …

STRATEGIC PLANNING PRACTICES
PERFORMANCE OUTCOMES
THESIS SUBMITTED IN PARTIAL FULFILMENT OF THE REQUIREMENTS FOR
THE MASTER OF BUSINESS ADMINISTRATION (MBA)
UNIVERSITY OF ZIMBABWE
GRADUATE SCHOOL OF MANAGEMENT
SUPERVISOR:
ING PRACTICES: THE ANTECEDENTS AND BUSI
PERFORMANCE OUTCOMES IN ZIMBABWEAN SMALL TO MEDIUM
ENTERPRISES (SMES).
BY
RAYNOLD T. CHIKWAMA
(R075208K)
SUBMITTED IN PARTIAL FULFILMENT OF THE REQUIREMENTS FOR
BUSINESS ADMINISTRATION (MBA) DEGREE
UNIVERSITY OF ZIMBABWE
GRADUATE SCHOOL OF MANAGEMENT
SUPERVISOR: DR. MAXWELL SANDADA
FEBRUARY 2016
ANTECEDENTS AND BUSINESS
MEDIUM SCALE
SUBMITTED IN PARTIAL FULFILMENT OF THE REQUIREMENTS FOR
DEGREE

i
DEDICATION
This thesis is dedicated to the Almighty God for bestowing me with strength, guidance and
mercy. This piece of work is also dedicated to all Zimbabwean Entrepreneurs operating in the
SME sector and I hope that this study will enable them to embrace the given recommendations to
spur growth, sustainability and lengthy survival of their enterprises.

ii
DECLARATION
I, the undersigned Raynold Tinomudaishe Chikwama do hereby declare that this thesis is my
own original work with the exception of Acknowledgements, Quotations and References that are
attributed to their sources, and this thesis has not been previously submitted in part or full, and
will not be presented to any University for similar or any other degree award.
........................................................... ................................................ Signature Date

iii
ACKNOWLEDGEMENTS
First and foremost, I would like to extend my profound acknowledgement to my supervisor
(Doctor Maxwell Sandada) for his consistent expert scrutiny, meticulous guidance and
unwavering support during the compilation of this thesis. Without your careful supervision, the
production of this thesis would have still remained a mirage. May the Almighty God continue to
bless you abundantly.
My deepest gratitude is also extended to my wife (Mildred) and my son (Rayn Anotidaishe) for
the moral support that you rendered me during the compilation of this document. I am grateful
for the space you gave me to complete my studies without a lot of disturbances.
Special singled out thanks goes to my parents, father (Aaron Chikwama) and mother (Moline
Chikwama) for being a source of academic inspiration. Your words of wisdom and
encouragement in pursuit of academic excellence resonate deeply in my heart and mind.
My academic colleagues, I am greatly indebted to you for your assistance and encouragement.
Mr Tongai Chokuda, I thank you for the fruitful discussions we shared during the arduous
journey of our studies. Your moral support will always be cherished.
Last but not least, I want to salute all the respondents who took time off their hectic schedules to
participate in this study.

iv
ABSTRACT
Despite Zimbabwe sharing with the rest of the world, the notion that SMEs are the impeccable
engines to economic revival, growth and development, many of the nation`s SMEs are plagued
with high failure rates, a phenomenon which motivated the need to carry out this study. Previous
studies carried out in most foreign countries suggested that the high failure rate of SMEs was
attributable to lack of strategic planning among a host of other factors.
Notwithstanding the globally acknowledged efficacy of strategic planning towards business
performance of SMEs, there is little evidence indicating whether Zimbabwean SMEs practice
strategic planning and how their engagement in strategic planning impact the firms` business
performance. The focus of this study was, therefore, on ascertaining the driving factors of
strategic planning practices in Zimbabwean SMEs and also to establish the impact of strategic
planning on business performance of these enterprises.
This study hinged on the positivist research philosophy and a quantitative approach was adopted
where proportional stratified random sampling was used to sample 150 SMEs operating within
the Harare Metropolitan Province. The unit of analysis was the owners and managers of the
sampled SMEs, who were purposively chosen for their superior knowledge of strategic planning
practices of SMEs. Data was collected using self-administered structured questionnaires. The
collected data was then coded and analyzed using Statistical Package for Social Sciences (SPSS)
version 23.
This study confirmed that the four perceived driving factors (globalisation, business ownership
motivations, environmental dynamism and innovation & technological advancement) had a
positive and statistically significant influence on the adoption or practice of strategic planning
among SMEs. In addition, the study partially confirmed the claim that adoption or practice of
strategic planning has a positive impact on business performance of SMEs. Only two strategic
planning factors (environmental scanning and strategy implementation) showed that they had
positive and statistically significant impact on business performance of SMEs. It was on this
basis that the study recommended SME owners/managers to prioritize the scanning of
environment and strategy implementation in order to enhance business performance of their
enterprises.

v
TABLE OF CONTENTS
DEDICATION ............................................................................................................................................................ i
DECLARATION ....................................................................................................................................................... ii
ACKNOWLEDGEMENTS .................................................................................................................................... iii
ABSTRACT .............................................................................................................................................................. iv
TABLE OF CONTENTS.............................................................................................................................................v
LIST OF TABLES.................................................................................................................................................. ixx
LIST OF FIGURES ................................................................................................................................................... x
LIST OF ABBREVIATIONS/ ACRONYMS ...................................................................................................... xi
CHAPTER ONE ........................................................................................................................................................ 1
INTRODUCTION TO THE STUDY ................................................................................................................ 1
1.0 INTRODUCTION........................................................................................................................................ 1
1.1 BACKGROUND TO THE STUDY ...................................................................................................... 2
1.2 PROBLEM STATEMENT .......................................................................................................................... 3
1.3 RESEARCH OBJECTIVES ......................................................................................................................... 5
1.4 RESEARCH QUESTIONS .......................................................................................................................... 5
1.5 RESEARCH HYPOTHESES ...................................................................................................................... 6
1.6 SIGNIFICANCE OF THE STUDY ............................................................................................................ 6
1.7 SCOPE OF THE STUDY ........................................................................................................................ 7
1.8 DISSERTATION OUTLINE ................................................................................................................. 7
1.9 CHAPTER SUMMARY .......................................................................................................................... 8
CHAPTER TWO ...................................................................................................................................................... 9
REVIEW OF RELATED LITERATURE ........................................................................................................ 9
2.0 INTRODUCTION........................................................................................................................................ 9
2.1 DEFINITION OF SMES .............................................................................................................................. 9
2.2 STRATEGIC PLANNING ........................................................................................................................ 10
2.2.1 ENVIRONMENTAL SCANNING ................................................................................................. 11
2.2.2 FORMALITY OF STRATEGIC PLANNING .............................................................................. 13
2.2.3 BUSINESS MISSION AND VISION ............................................................................................. 14
2.2.4 TIME HORIZON ............................................................................................................................... 15
2.2.5 EMPLOYEE PARTICIPATION ..................................................................................................... 15
2.2.6 STRATEGY IMPLEMENTATION ............................................................................................... 16
2.2.7 EVALUATION AND CONTROL ................................................................................................... 17
2.3 DRIVERS FOR THE ADOPTION OF STRATEGIC PLANNING .................................................. 18

vi
2.3.1 ENVIRONMENTAL DYNAMISM ................................................................................................ 19
2.3.2 BUSINESS OWNERSHIP MOTIVATIONS ............................................................................... 20
2.3.3 GLOBALISATION ............................................................................................................................ 21
2.3.4 INNOVATION AND TECHNOLOGICAL ADVANCEMENT ................................................. 22
2.4 BUSINESS PERFORMANCE OUTCOMES OF STRATEGIC PLANNING ........................... 23
2.4.1 ENHANCED BUSINESS OPERATIONS .................................................................................... 24
2.4.2 ORGANISATIONAL PROACTIVENESS & OPPORTUNITY IDENTIFICATION ........... 25
2.4.3 EFFICIENT AND EFFECTIVE DECISION MAKING ............................................................. 27
2.4.4 COMMON VISION & EMPLOYEE SYNERGY .................................................................... 27
2.4.5 OPTIMAL RESOURCE ALLOCATION ................................................................................. 28
2.4.6 ADAPTABILITY AND FLEXIBILITY ................................................................................... 29
2.5 LITERATURE SYNTHESIS AND CONCEPTUAL FRAMEWORK .............................................. 29
2.6 CHAPTER SUMMARY ............................................................................................................................ 31
CHAPTER THREE ............................................................................................................................................... 32
RESEARCH METHODOLODY ..................................................................................................................... 32
3.0 INTRODUCTION..................................................................................................................................... 32
3.1 RESEARCH DESIGN .......................................................................................................................... 32
3.1.1 RESEARCH PURPOSE ................................................................................................................... 33
3.1.2 PHILOSOPHICAL PARADIGM ......................................................................................................... 33
3.2 RESEARCH APPROACH ........................................................................................................................ 35
3.3 RESEARCH STRATEGY ......................................................................................................................... 35
3.4 POPULATION AND SAMPLING PROCEDURES ............................................................................ 36
3.4.1 SAMPLING ........................................................................................................................................ 37
3.5 DATA COLLECTION ............................................................................................................................... 40
3.5.1 RESEARCH INSTRUMENT .......................................................................................................... 40
3.5.1.1 MEASUREMENT SCALES FOR THE RESEARCH VARIABLES ..................................... 42
3.5.2 PILOTING OF THE RESEARCH INSTRUMENT .................................................................... 44
3.6 DATA ANALYSIS TECHNIQUES ................................................................................................... 45
3.6.1 TEST FOR VALIDITY AND RELIABILITY ......................................................................... 45
3.6.2 NORMALITY TEST ................................................................................................................... 45
3.6.3 CORRELATION ANALYSIS .................................................................................................... 46
3.6.4 REGRESSION ANALYSIS ........................................................................................................ 46
3.6.5 DESCRIPTIVE STATISTICAL ANALYSIS .......................................................................... 46
3.7 ETHICAL CONSIDERATIONS ........................................................................................................ 47

vii
3.8 CHAPTER SUMMARY ...................................................................................................................... 47
CHAPTER FOUR .................................................................................................................................................. 48
RESEARCH FINDINGS ............................................................................................................................. 48
4.0 INTRODUCTION ......................................................................................................................................... 48
4.1 RESPONSE RATE ............................................................................................................................... 48
4.2 DEMOGRAPHIC ANALYSIS .................................................................................................................. 49
4.2.1 SEX OF RESPONDENTS................................................................................................................ 49
4.2.2 AGE OF RESPONDENTS ............................................................................................................... 50
4.2.3 POSITION IN ORGANISATION .................................................................................................. 50
4.2.4 HIGHEST LEVEL OF EDUCATION ATTAINED ..................................................................... 51
4.2.5 DISPERSION OF RESPONDENTS BY SECTOR ..................................................................... 52
4.2.6 PERIOD OF OPERATION ............................................................................................................. 53
4.2.7 NUMBER OF PERMANENT EMPLOYEES .............................................................................. 54
4.3 RELIABILITY TEST ........................................................................................................................... 55
4.4 NORMALITY TEST............................................................................................................................. 56
4.5 T-TESTS ................................................................................................................................................. 58
4.5.1 INDEPENDENT SAMPLES T-TEST FOR STRATEGIC PLANNING AND SEX ............. 58
4.6 ANALYSIS OF VARIANCE ................................................................................................................ 59
4.6.1 ONE WAY ANOVA FOR STRATEGIC PLANNING AND LEVEL OF EDUCATION ...... 60
4.6.2 ONE WAY ANOVA FOR STRATEGIC PLANNING AND INDUSTRY ............................... 61
4.7 RELATIONSHIP BETWEEN PERCEIVED DRIVERS AND STRATEGIC PLANNING .... 61
4.7.1 CORRELATION ANALYSIS .......................................................................................................... 62
4.7.2 REGRESSION ANALYSIS .............................................................................................................. 63
4.8 IMPACT OF STRATEGIC PLANNING PRACTICES ON BUSINESS PERFORMANCE ... 67
4.8.1 CORRELATION ANALYSIS .......................................................................................................... 67
4.8.2 REGRESSION ANALYSIS .............................................................................................................. 70
4.9 DISCUSSION OF FINDINGS ............................................................................................................ 73
4.10 CHAPTER SUMMARY .................................................................................................................... 75
CHAPTER FIVE: CONCLUSIONS AND RECOMMENDATIONS ............................................................ 76
5.0 INTRODUCTION .......................................................................................................................................... 76
5.1 SUMMARY OF FINDINGS AND CONCLUSIONS ...................................................................... 76
5.2 EMPIRICAL AND THEORETICAL CONTRIBUTION ............................................................... 79
5.3 MANAGERIAL AND POLICY RECOMMENDATIONS ............................................................. 82
5.4 RESEARCH LIMITATIONS .............................................................................................................. 83

viii
5.5 AREAS OF FURTHER STUDY ......................................................................................................... 84
5.6 CHAPTER SUMMARY ....................................................................................................................... 85
REFERENCES ................................................................................................................................................... 86
APPENDICES ................................................................................................................................................... 92
APPENDIX A: COVER LETTER .................................................................................................................. 92
APPENDIX B: RESEARCH QUESTIONNAIRE ....................................................................................... 93

ix
LIST OF TABLES
Table 3.1: Sampling Grid......................................................................................................................................................40
Table 3.2: Strategic Planning Factors……………………………………………………....................................................42
Table 3.3: Drivers of Strategic
Planning………………………………………………………………………………...……434
Table 3.4: Business Performance Outcomes of Strategic Planning………………………………………………..43
Table 4.1: Classification by Age………………………………………………………………………………………………..…50
Table 4.2: Classification by Number of Permanent Employees…………………………………………………..…55
Table 4.3: Reliability Test Table………………………………………………………………………………………………....56
Table 4.4: Reliability Statistics……………………………………………………………………………………………….…..56
Table 4.5: Tests of Normality..............................................................................................................................................57
Table 4.6 Group Statistics…………………………………………………………………………………………………………..58
Table 4.7 Independent Samples Test……………………………………………………………………………………….….59
Table 4.8: ANOVA –Strategic Planning and Level of Education…………………………………………………….60
Table 4.9: ANOVA Strategic Planning and Industry……………………………………………………………..………61
Table 4.10 Correlation Analysis – Perceived Drivers and Strategic Planning………………………….……..62
Table 4.11: Regression Analysis Model Summary…………………………………..……………………………………64
Table 4.12: Regression Model Validity…………………………………………………………………………….………….64
Table 4.13: Model Coefficients and Statistical Significance of Independent Variables……………….…...65
Table 4.14: Correlation Analysis – Strategic Planning Factors & Business
Performance……………..…689
Table 4.15: Regression Analysis Model Summary……………………………………………………………..…………70
Table 4.16: Regression Model
Validity…………………………………………………………………………………….….701
Table 4.17: Model Coefficients and Statistical Significance of Independent Variables……………….…...71
Table 4.18: Hypothesis Testing and Outcomes………………………………………………………………………...….75

x
LIST OF FIGURES
Figure 2.1: Conceptual Framework ........................................................................................................ 30
Figure 4.1: Sex of Respondents .................................................................................................................. 49
Figure 4.2: Position of Respondents ....................................................................................................... 51
Figure 4.3: Highest Educational Qualification ..................................................................................... 52
Figure 4.4: Classification by Sector………………………………………………………………………………...54
Figure 4.5: Period of Operation ............................................................................................................... 545
Figure 5.1: Initial Conceptual Framework ............................................................................................ 801
Figure 5.2: Revised Conceptual Framework ........................................................................................ 812

xi
LIST OF ABBREVIATIONS/ ACRONYMS
CZI Confederation of Zimbabwe Industries
GDP Gross Domestic Product
GOZ Government of Zimbabwe
FDI Foreign Direct Investment
RBZ Reserve Bank of Zimbabwe
SME Small to Medium Scale Enterprises
SWOT Strengths, Weaknesses, Opportunities and Threats

1
CHAPTER ONE
INTRODUCTION TO THE STUDY
1.0 INTRODUCTION
Small to Medium Scale Enterprises (SMEs) are considered to be the backbone or engine for
economic growth and thus play a significant economic role in many countries. The fact that sub-
sector provides reasonably priced goods, services and income as well as providing job
opportunities has been the reason for growing interest and concern for both developed and
developing governments to ensure improved performance and growth for SMEs (Kauffman,
2006). However, SMEs in the 21st century are confronted with unprecedented challenges in a
changing business, political and economic environment. The survival and growth of SMEs in the
21st century is dependent upon the firms` ability to develop flexible competitive advantages that
enable them to adapt to change (Morris, Kuratko and Covin, 2008).
The above argument by Morris et al (2008) implies that the survival and growth of SMEs has to
be through internal initiatives or organic means involving strategic planning and creativity in
order for them to subsist the turbulent business environment. Given that the business
environment is constantly changing, a condition that has resulted in an intense competitive
business world means improved business performance has become a crucial issue for SMEs let
alone large firms. Therefore, in order to remain competitive and sustainable, SME owners and
managers need to ensure that their firms are performing well.
Interestingly to note, strategic planning has been increasingly recognised in the extant literature
of SMEs as a major predictor for business performance (Sandada, 2014; Kantabutra, 2010).
Several previous empirical studies that examined business performance of SMEs have regarded
practice of strategic planning as a success factor that is critical for the small firms in their
endeavour to achieve competitive advantage. Although several researches around the globe
particularly those conducted in developed countries have acknowledged the efficacy of strategic
planning towards business performance of SMEs, few studies have been done to ascertain the

2
extent to which strategic planning impacts on business performance of Zimbabwean SMEs. This
research is, therefore, motivated by the need to investigate perceived antecedents of strategic
planning practices among Zimbabwean SMEs and also to examine whether the practice of
strategic planning by these SMEs has an impact on enhancing their business performance.
1.1 BACKGROUND TO THE STUDY
For the last decade, Zimbabwe has been experiencing structural regression with accelerated
deindustrialisation and informalisation of the economy (CZI, 2012). Since 2008, Zimbabwean
economy has been in a free fall with an economic decline of up to 50% which saw the country`s
formal sector progressively declining with many enterprises wholly ceasing operations, while
others markedly downsized their production levels (Bloch, 2014). The economic turmoil that
befell Zimbabwe led to the nation`s failure in attracting significant foreign direct investment
(FDI) and long term lines of credit to sustain and replace the domestic debt. According to United
Nations statistics in 2013, Zimbabwe remains one of the least recipients of FDI in Africa, getting
amounts less than $1.5 billion annually (World Economic Forum, 2014). To date, the country’s
economy remains delicate as shown by trends in its real Gross Domestic Product (GDP) growth
rate of 5.4% in 2009, 11.4% in 2010, 11.9% in 2011, 10.6% in 2012 and 3.4% in 2013
(Government of Zimbabwe, 2013). Zimbabwe is in a situation of economic insecurity with the
country’s global competitiveness rating remaining low. In 2014 the country was rated 124th out
of 144 countries on the global competitiveness index (World Economic Forum, 2014).
Despite the immense economic devastation that faced Zimbabwe over the years, the SME sector
is being regarded to be the impeccable engine of economic growth to ensure the revival of the
once vibrant nation that gained its reputation as the breadbasket of Africa (Mavengere, 2011).
SMEs are expected to bring about the desired change to the adverse trend being experienced in
Zimbabwe`s economy through complementing the efforts of both the private and public sector in
enhancing the national development process (RBZ, 2012). The quality of SMEs is very critical in
the economic development of any nation as they operate within the economic environment
3
characterised by volatility, dynamism and competitive markets that may seriously threaten their
survival (O’Regan and Ghobadian, 2007).
Notwithstanding the seamless expectation that the SME sector will resuscitate the growth of the
economy, many Zimbabwean SMEs have witnessed poor performance levels accompanied by a
high attrition rate. Findings have shown that most Zimbabwean SMEs die within their first five
years of existence, a smaller percentage encounter extinction between the sixth and tenth year
while only five to ten percent survive, thrive and grow to maturity (Tsikirayi, 2014). According
to Tsikirayi (2014), many factors have been identified as likely contributing to the premature
death of Zimbabwean SMEs, and key among them include cut-throat competition and lack of
strategic planning. The answer for the underachievement of Zimbabwean SMEs to drive
economic growth has been deemed not to lie with policy but with the strategic behaviours of
these enterprises. Therefore, understanding the strategic behaviours of Zimbabwean SMEs has
been regarded to be the key to unlocking the enterprises` inherent potential to foster the nation`s
economic recovery (Nyamwanza, 2013).
In the light of the above, it is evident that there is an alerting argument from scholars such as
Nyamwanza (2013) and Tsikirayi (2014) that Zimbabwean SMEs need to engage in strategic
planning if they are to maintain their position as key economic players. It is against this
background that the research aims to explore the perceived factors that drive Zimbabwean SMEs
to practice strategic planning and to ascertain if the adoption of strategic planning practices has a
bearing on enhancing the business performance for these entities.
1.2 PROBLEM STATEMENT
The quest for factors that facilitate the success, growth and sustainability of SMEs continue to be
on the rise considering that these small business entities are increasingly threatened by low profit
margins and also plagued with high failure rates. Findings have shown that most Zimbabwean
SMEs die within their first five years of existence, a smaller percentage encounter extinction
between the sixth and tenth year while only five to ten percent survive, thrive and grow to
maturity (Tsikirayi, 2014). Previous studies have attributed the high failure rate of SMEs to a

4
host of factors amongst them failure to strategically plan. Existing literature has established that
lack of strategic planning may thwart SMEs from achieving their potential of sustained growth
and survival. Therefore, this study sought to establish whether strategic planning enhances
business performance of SMEs.
Strategic planning is conceived to be an essential management tool that buffer SMEs from the
highly unstable business environment which is characterised by the heightened pace of
technological change, volatile business cycles and stiff competition. Considering the growing
importance and significance of SMEs in the socio-economic structure of Zimbabwe,
entrepreneurs within this sector need to understand the value of strategic planning to their
business operations. The players in the SME sector also need to appreciate the efficacy of
strategic planning practices as these could be key pillars to their success, growth and
sustainability. However, there is little evidence indicating whether Zimbabwean SMEs practice
strategic planning and how their engagement in strategic planning impact the firms` business
performance yet the subject underscores the success of these small business entities. Therefore,
the catch for this research is on the need to gain an understanding of the factors that drive the
adoption of strategic planning in Zimbabwean SMEs and also to ascertain the impact that the
strategic planning practices have on the firms` business performance.
Furthermore, it appears that there is paucity of research on small firms particularly for
developing countries in respect of strategic planning practices and their impact on business
performance (Dubihlela and Sandada, 2014). In addition, there is lack of evidence of extensive
studies that were conducted to determine the strategic planning practices of Zimbabwean SMEs.
Conspicuously, one can hardly find studies on strategic planning of SMEs in the Zimbabwean
context and it may be insensible to assume that findings from previous studies which were done
in different nations of the world can apply in the Zimbabwean context.
The assertion of this study is that if strategic planning practices of Zimbabwean SMEs remain
unknown and unchecked, this will continue to undermine the overall business performance of
these enterprises which will consequently cripple the performance of the nation`s economy.

5
1.3 RESEARCH OBJECTIVES
The overall objective of this study was to determine the driving factors of strategic planning and
to ascertain the impact of strategic planning practices on business performance of SMEs
operating within the Harare Metropolitan Province.
The sub-objectives of the study were formulated as follows:
(i) To determine if there are any significant differences in strategic planning practices in
respect of sex, level of education and industry among SMEs.
(ii) To establish the relationship between perceived driving factors and strategic planning
among SMEs.
(iii) To ascertain the impact of strategic planning factors on business performance of
SMEs.
1.4 RESEARCH QUESTIONS
This study sought to answer the general question: What are the perceived drivers of strategic
planning and which strategic planning practices have an impact on business performance of
SMEs?
The general question was further divided into sub-questions as follows:
a) Which factors influence SMEs to adopt or practice strategic planning?
b) What effect will the adoption or practice of strategic planning have on business
performance of SMEs?
c) What are the recommended strategic planning practices that enhance business
performance of SMEs?

6
1.5 RESEARCH HYPOTHESES
In order to approve or disapprove the findings from previous studies, this research study was
premised on the following hypotheses:
H1: Perceived drivers have a positive influence in the adoption or practice of strategic
planning among SMEs.
H2: The adoption or practice of strategic planning has a positive impact on business
performance of SMEs.
1.6 SIGNIFICANCE OF THE STUDY
Given the dearth of previous empirical work on the subject of strategic planning practices among
Zimbabwean SMEs, this study seeks to explore the driving factors and to ascertain the impact of
strategic planning practices on the business performance of SMEs within Harare Metropolitan
Province. This study therefore assist both practitioners and scholars alike to understand strategic
planning practices and their impact on business performance as there are no known studies in
this area that have been done specifically for the Zimbabwean SME sector.
The study is valuable to SMEs in that it extends the knowledge of strategic planning practices,
techniques and processes, which may result in enterprise growth, sustainability and
competitiveness. The results of the research study should be able assist SME owners and
managers in understanding the strategic path through which a business can achieve the desired
performance. In particular, the current research provides important and invaluable insights for
SME owners and managers about how strategic planning activities can provide an enabling
mechanism to improve business performance. In essence, this research, combined with the
results of the previous studies, serves as a tool for SMEs in improving the effectiveness of
strategic planning as well as their sustainability.
This research study also provides an insight to academicians on the extent to which strategic
planning impacts business performance of SMEs specifically in the Zimbabwean context. The

7
research study also provides academicians with knowledge on the factors that influence strategic
planning of SMEs. The result of the study provides room for academicians to further focus on
other strategic planning factors of SMEs which could have been omitted by this research.
1.7 SCOPE OF THE STUDY
The study focused on active SMEs operating within Harare Metropolitan Province which is the
capital city and the country`s current largest industrial hub (Ministry of Industry and Commerce,
2012). The study also confined itself to SMEs registered with the Ministry of Small and Medium
Enterprises and Cooperative Development in Zimbabwe. The study ensured that the selected
SMEs employed between 6 and 75 full time paid employees with a maximum annual turnover of
$1 million and that they operated in any sectors of the Zimbabwean economy except in
construction as well as mining and quarrying where total annual turnover should be $2 million
and $3 million respectively (Government of Zimbabwe, 2013).
1.8 DISSERTATION OUTLINE
This dissertation comprises of five chapters and they are discussed as follows:
Chapter 1: This chapter gives a general overview of the study and also explains the significance
of this particular research. This section also focuses on the problem statement by outlining the
research gap that motivated the researcher to undertake this study. This chapter also discusses the
research objectives, research questions, research hypotheses as well as the scope of the study.
Chapter 2: The focal point of this chapter is on reviewing the relevant literature that is related to
the study. The researcher will do an analysis on a number of diverse articles and journals which
focus on strategic planning practices and business performance of SMEs. The researcher will
further delineate the different theoretical viewpoints of other scholars and also assimilate
relevant constructs in this particular study. This chapter on literature review will be the backbone
for the current study as the different theoretical constructs will assist the researcher to model a
conceptual framework. It is also from this review of literature that the researcher will generate

8
hypotheses for clarifying the relationship between strategic planning practices and business
performance of SMEs.
Chapter 3: This chapter presents the research philosophy, research design, research strategy, the
target population for the study and the sampling techniques to be adopted by the researcher. The
chapter also outlines how data for this study will be collected and analyzed.
Chapter 4: The main focus for this chapter is on data analyses, interpretation and discussion of
the findings. The researcher will use both descriptive and inferential statistical tools for data
analyses as this research study adopted the quantitative approach.
Chapter 5: This is the last chapter of the dissertation and it concludes the study by summarizing
on the findings. The chapter will also identify limitations to the research study and a set of
recommendations to relevant stakeholders will be outlined.
1.9 CHAPTER SUMMARY
This chapter presented a synopsis of the research problem and its background, research
objectives, research questions, study hypotheses, significance of the study and the scope of the
study. The chapter also outlined the structure of this thesis. The next chapter presents an in depth
review of relevant literature on strategic planning practices of SMEs. It chronicles the underlying
driving factors for the adoption of strategic planning by SMEs and the impact that the strategic
planning factors have on the business performance of these entities.

9
CHAPTER TWO
REVIEW OF RELATED LITERATURE
2.0 INTRODUCTION
This chapter presents a selective analysis on the existing literature which galvanises the subject
of inquiry for this study. Perceived drivers and business performance outcomes of strategic
planning among SMEs are at the epicentre of this thesis. A review of literature was undertaken in
order to establish the different perspectives of scholars, academicians and researchers regarding
the field of strategic planning among SMEs. This chapter offers definitional and conceptual
clarity surrounding strategic planning among SMEs. A perfunctory note of what the next chapter
contains puts the lid on this chapter.
2.1 DEFINITION OF SMES
Literature on SMEs is abounding and despite the existence of extensive scholarly researches on
SMEs, there appears to be no unanimous congruence on the definition of an SME. Hassan and
Mohamed (2015) argue that the idea of unanimity around a single definition of an SME is
utopian. According to Ayyagari et al (2011), the definitions of an SME include various measures
that differ across industries, sectors, regional economic groupings and countries. The
heterogeneity of the activities within the SME sector compounds the problem of having an
exhaustive and wholesome definition of this sector. Previous studies have shown that qualitative
and quantitative measures such as separation of ownership, market share, number of employees,
turn over (sales volume), total amount of assets, size or amount of capital invested and the nature
of the business can be the basis upon which SMEs can be defined.
Terziovski et al, as cited by Rahman (2001) note that, SMEs generally are defined or classified
on quantifiable characteristics such as number of employees, sales volume or worth of assets. In
contrast to the quantitative approach, O’Regan and Ghobadian (2006) observe that SMEs can be
defined from their distinct qualitative characteristics which include limited resources, lack of

10
specialist expertise, reliance on a few key customers and unable to influence, to any significant
degree the threats of the external environment. In general, qualitative definitions of an SME refer
directly, for their great majority, to the entrepreneur`s position in the creation and management
process (Hassan and Mohamed, 2015).
It is widely acknowledged that the definition of an SME varies according to sector, geographical
location and the researcher (Nicholas, Ledwith and Perks, 2011). For the purpose of this research
study, number of employees and annual turnover were used as the quantitative measures upon
which an SME was defined. Therefore, this research study adopted the definition proffered by
the Government of Zimbabwe that an SME is a business which employs between 6 and 75 full
time paid employees with a maximum total annual turnover of $1 million for all sectors except
construction as well as mining and quarrying where maximum total annual turnover should be $2
million and $3 million respectively (Government of Zimbabwe, 2011).
2.2 STRATEGIC PLANNING
Similar to the definition of an SME, strategic planning is also a relative concept among scholars,
academicians and researchers such that there is no one size fit all definition. Huang (2005)
defines strategic planning as a complex and a participative management technique by an
organisation that involves scanning of the environment and formulation of vision, mission and
strategies in an endeavour to enhance business performance. Desai (2000) opines that strategic
planning creates a viable link between a business’ mission, vision, goals, objectives, strategic
choices, and resources. Fraser and Stupak (2002) suggested that strategic planning support the
clarification of business objectives, systematic gathering of information, prioritization of
projects, teamwork, environmental alertness, communication of strategic intent to all
stakeholders and enhanced performance. O’Regan and Ghobadian (2006) further postulated that
strategic planning involves the aligning of long-term business objectives, and the formulating
and implementing of formal plans to achieve these goals. Consequently, strategic planning being
the essential instrument for strategic management enables practitioners to identify the essential
conditions as well as the scope for future business activities (Kraus, Reiche and Reschke, 2008).
There is evidence from the existing literature to suggest that strategic planning can be viewed as

11
a controlled attempt by organisations to produce essential decisions and actions that profile the
firm`s operations and its future intended activities (Walker et al, 2008). Therefore, it is apt to
view strategic planning as an attempt to prepare for all future eventualities by abstraction and
thus to account for the complexity and the dynamics of the environment.
Evidence from previous studies suggest that different scholars concur that environmental
analysis, business mission and vision statements, formulation of long-term goals, formulation
and implementation of strategies together with controlling of performance are among the key
components of strategic planning. Dincer, Tatoglu, and Glaister (2006), reiterates that the key
aspects of strategic planning include the formulation of a mission statement of the enterprise,
establishing the objectives, crafting and implementing the strategies, and monitoring and
controlling the progress in strategy implementation. In a South African study carried out by
Sandada, Pooe and Dhurup in 2014, eight strategic planning aspects that were identified included
sources of information, environmental scanning, business mission and vision, employee
participation, time horizon of strategic planning, formality of strategic planning, strategy
implementation incentives, and evaluation, and control. The review of the available literature
has shown that strategic planning is a unifying theme that gives coherence and direction to the
actions and decisions of an organization as it guides managerial decisions toward superior
performance.
2.2.1 ENVIRONMENTAL SCANNING
Today’s business environment is engulfed with high levels of competition, uncertainty and
turbulence such that businesses are required to scan and analyze their environment to enable
them detect the market volatilities in an effective manner that enhances competitiveness
(Karami, 2008). This depicts that scanning of the business environment is essential for
organisations if they want to successfully adapt to the dictates of the continuously changing
markets. It is necessary to scan the environment so that businesses may better deal with the
changes in the environment in which they operate.
12
Strategic planning, among other things, involves the analysis of the internal and external
business environment with the intention of discovering organizational strengths, weaknesses,
opportunities and threats. Firms rely on analyzing the business environment in establishing their
goals and in determining the strategies to employ in order to achieve the set objectives. Strategic
planning is a process that requires an organization to stay alert of its capacity and of the
operating environment in order to realise competitiveness. Strategic planning nurtures in
management the habit of periodically appraising the competitive position of their organizations.
The environmental scan includes internal analysis of the firm, analysis of the firm's industry
(task environment) and external macro-environment (political, environmental, social and
technological factors). According to Smit et al (2007), the business environment consists of three
different environments, namely the micro-environment, market environment and the macro-
environment. The micro-environment consists of the business itself and other aspects in which it
has complete control, such as the mission and goals, departments in organisation, the culture of
the organisation and organisational resources that include human, expertise and financial
resources. The market or task environment includes the environment surrounding the business,
which consists of consumers, suppliers, intermediaries, competitors, substitute products, possible
new entrants and labour unions. The macro-environment consists of variables, which the
business does not control, but instead these forces influence the way the business operates. These
variables include the political, economic, social, technological, ecological and international
factors (Smit et al, 2007).
In conducting an environmental assessment, a business needs to review, evaluate and
disseminate information from both the external and internal environments. Hunger and Wheelen
(2007) suggest that to gather all the information about factors that affect the business, there is a
need to assess both the internal and external environments. The internal and external
environment can be profiled as Strengths, Weaknesses, Opportunities, and Threats (SWOT)
(Chris & Pierre, 2009). Strategic planning will enable an organization to identify the prevailing
opportunities and threats, and also to bring out or quantify the organisation`s resource
capabilities taking into account the strengths and weaknesses of its resources so as to align itself
accordingly to cope with the environmental challenges (Karami, 2008). Given the information

13
gathered from scanning the environment, the firm should match its identified strengths to the
opportunities, while addressing its weaknesses and external threats. Mori, Kazungu & Mchopa
(2014), opine that effective strategic planning can yield a good strategy that neutralizes threats,
exploits opportunities, capitalizes on strengths and/or fixes weaknesses. An industry analysis can
also be performed using a framework of Porter's five forces: Entry barriers, bargaining power of
suppliers, bargaining power of customers, threat of substitute products and industry rivalry
(Howard, 2007).
Previous studies have confirmed the importance of environmental scanning as a key component
of strategic planning. In 2008 Jorosi undertook a study of the environmental scanning practices
of Botswana’s small and medium sized manufacturing enterprises and the research corroborated
other studies in specifying that organizations rely on scanning the business environment in order
to make informed decisions. In another study conducted in South Africa, Neneh and Van Zyl
(2012) found that about 53% of SMEs scan their business environment in order for them to
achieve long-term survival and sustainability.
2.2.2 FORMALITY OF STRATEGIC PLANNING
According to Kraus et al (2007), a formalised strategic plan implies a deliberate means to
systematically include factors and techniques in order to achieve specified goals. In simple
terms, formality of strategic planning describes the extent to which the strategic plan is presented
in a written form. Formal strategic planning can lead to a better understanding of the business
and to the discovery of a broader range of strategic alternatives. Kraus et al (2007) further posit
that firms with a formalised strategic planning approach are more likely to give more active
consideration to potential barriers from the outside. Informal planning, on the other hand, has
only limited value, since only a few planning areas can be dealt with at the same time, whereas a
formalised plan allows for a synopsis of multiple planning areas (Kraus et al, 2007) It is often
argued that SME owners and managers have their primary focus on the short-term operational
concerns rather than long-term strategic issues, and their decision-making is generally reactive
and intuitive rather than being deliberate and proactive (Mazzarol, 2004; Stonehouse &
Pemberton, 2002). It is also further argued that operators of small businesses often engage in ad

14
hoc rather than formal planning. Informal planning provides little basis upon which business
performance can be measured or analysed (Waihenya, 2014).
Previous studies have proven that the formality of strategic planning helps a business to improve
business performance. Pellissier and Kruger (2011) in their study on the practice of strategic
management within the South African long-term insurance industry reported that firms in the
insurance industry confirmed that formalised strategic plans enhanced business performance.
Delmar and Shane (2003) in their longitudinal analysis found that new ventures conducting
formal strategic planning have higher survival rates. The presence of this factor in a study carried
out by Sandada, Pooe and Dhurup (2014), indicate that SMEs acknowledge the necessity of
formalizing their strategic plans. From the existing literature it can be concluded that firms that
apply formalised strategic planning attach great importance to the quality of the strategic
decision-making processes and that decision makers develop larger knowledge of the strategic
issues through the process of planning.
2.2.3 BUSINESS MISSION AND VISION
According to Forbes and Seena (2006) as cited by Sandada, Pooe and Dhurup (2014), mission
statement is crucial in a business as it establishes a common purpose, guides decision making,
and inspires employees. Ungerer et al. (2007), state that the business mission ensures employee
commitment through creating an understanding of the business domain in which the business
would want to operate. David (2003) opines that while a mission statement states the business of
the organisation, a vision statement clarifies what it wants to become. Finkelstein et al (2008),
mention that vision encapsulates the ideology or guiding philosophy of a business and it
expresses the values, purpose and direction through the mission and business objectives.
Kantabutra and Avery (2010) point out that vision is needed by a business to guide, remind of
history of the company, inspire, and to control the business.
Previous studies have confirmed the importance of business mission and vision as they impact
positively on business performance (Mazzarol et al, 2009; Kantabutra, 2010). French et al (2004)
conducted a study which analyzed the role of strategic planning in the performance of small

15
service businesses and their study confirmed that business mission and vision statement is an
important factor of strategic planning. A vision and mission statement is crucial in enhancing
business performance because it reminds employees of the key organizational values which are
also key guidelines for diagnosing and finding solutions to problems. The business mission and
vision statement will further ensure that an organisation maintains its vision and, that customers
and other stakeholders are regarded as the primary concern when conducting its business
operations (Bart & Hupfer 2004). Some empirical evidence suggests that vision-driven
businesses improve on their performance (Kantabutra 2010). A study of the power of vision in
apparel stores by Kantabutra (2010), found that vision characteristics and content have positive
and direct effects on both customer and staff satisfaction, and hence business performance.
2.2.4 TIME HORIZON
Dincer et al (2006) in their study confirmed the importance of time horizon as a factor of the
strategic planning process. SMEs are frequently said to be more flexible than larger
organisations, and SMEs often do not possess the necessary experience and knowledge to plan
ahead for such a long time (Dincer et al, 2006). The question is how long the optimal time
horizon of strategic planning should be in small firms. Empirical evidence shows that the
average time frame for strategic planning in young SMEs is about eighteen months (Kraus et al,
2007), and thus only half as long as most strategy textbooks propose. In the study by Sandada,
Pooe and Dhurup (2014), most of the SMEs indicated that they make use of three to four year
strategic plans thereby inferring that generally SME owners and managers have a medium term
focus for their businesses.
2.2.5 EMPLOYEE PARTICIPATION
It is commonly referred to in management literature, as employee involvement (Lussier and
Achua, 2007). Strategic planning allows several members of the enterprise to participate in the
planning process and hence plays an important role in determining the direction of an
organization. Different authors and scholars assert that employee involvement allows

16
organisation members to actively question, experiment and create dialogue that enables
managers to be in control of organisational outcomes. Most researchers generally agree that
employee participation in the strategic planning process is critical in the successful
implementation of a strategy. According to Speculand (2009), a participative strategic planning
process is encouraged because it leads to a unity of purpose, cooperation, and employee
motivation.
From the available literature, it is suggested that if organisations apply strategic planning more
purposefully the organisational goals will be clearer and better pursued by individual employees.
The employees or members of the enterprise must be involved to make sound tactical and
operational decisions that are aligned with the desired strategic direction. Raps (2005) reiterate
that employee participation is crucial because it increases the general awareness of the strategy,
it builds a consensus in the business about the implementation of the strategy and it boosts
employees` morale and, hence, provides them with a strong drive to implement the strategies.
Organisations that engage in a participative strategic planning process should set up temporary
committees that encompass employees of diverse ranks for consultation purposes and for the
smooth running of the strategic planning process (Elbana, 2008). In a qualitative study of
implementing strategies successfully, Aaltonen and Ikavalko (2002) confirm the view that
middle managers and supervisors play a key role in implementing strategies.
2.2.6 STRATEGY IMPLEMENTATION
According to Thompson and Strickland as cited in Nyamwanza (2014), strategy implementation
is an integral component of the strategic management process and is viewed as the process that
turns the formulated strategy into a series of actions that ensure that the vision, mission, strategy
and strategic objectives of the organisation are successfully achieved as planned. Strategy
implementation is viewed as a dynamic, iterative and complex process, which comprises a series
of decisions and activities by managers and employees affected by a number of interrelated
internal and external factors to turn strategic plans into reality in order to achieve strategic
objectives (Li et al, 2008). Shah (2005) opines that the implementation task involves the
coordination of a range of efforts aimed at transforming strategic intentions into actions. Strategy

17
implementation shapes the manner in which an organisation should build, exploit and merge
organizational structures in following the formulated strategies that lead to competitive
advantage and improved performance (Sorroshian et al, 2010). According to Voola and O’Cass
(2010), strategy implementation is a valid route to organisational performance such that in their
quest for competitive advantage, managers must not only develop competitive strategies, but
simultaneously develop capabilities that act as key mediators.
According to Li et al (2008), it is evident that strategy implementation has remained a key
challenge for most of today`s organisations. It is how well the strategies are implemented that
governs business success and not how good the strategy is formulated (Speculand, 2009). The
manner in which organisations go about strategy implementation becomes the major contributor
to performance, hence it is important to come up with methods for successful strategy
implementation. Literature indicates that management issues are at the core of effective strategy
implementation and should be given prominent attention by SMEs owners and managers if they
are to prosper. Business performance is not only a function of how well strategies are
formulated, it also depends on how well implementation is done (Shah, 2005). According to
Chen et al (2008), strategy implementation is core to the competiveness of an organisation and
determines its development. There is a strong need for organisations to consciously think through
how they will implement strategies for improved performance rather than remaining victims of
circumstances when it comes to strategy implementation. Therefore, having a plan does not
necessary translate in organisational success. Speculand (2009) notes that, one can have the
greatest strategy in the world but if one cannot implement the strategy then it is not worth the
paper the strategy is written on. The success of strategy implementation is influenced by an array
of factors (soft, hard and mixed), ranging from people who communicate or implement the
strategy, to systems or mechanisms for coordination and control (Li et al, 2008).
2.2.7 EVALUATION AND CONTROL
Strategy evaluation and control are important as they help a business to keep track of progress in
attaining milestones and targets. Pearce and Robinson (2005) posit that a business that constantly
monitors and controls its projects is able to check on its progress and correct deviations in a

18
timely and cost-effective way. Nah et al (2001) opine that evaluation and control ensures that a
business enterprise measures progress against completion dates, costs and quality or standards. A
business entity needs to review its strategic choices and continuously make adjustments in order
to maintain a fit with the environment. David (2003) recommends a systematic review,
evaluation and controlling of the implementation of strategies because the best formulated and
well implemented strategies become valueless as the business environment changes.
According to Ehlers and Lazenby (2007) through continuous monitoring and control, SMEs are
able to sustain a competitive edge. Strydom (2011) expresses similar sentiments by mentioning
that strategy evaluation and control inform the managers about the reasons leading to the failure
of meeting a certain objective, performance standard or any other performance indicator. A
continuous evaluation of strategies offers benefits such as allowing benchmarking of progress to
be established and monitored effectively, creating manager and employee commitment to
achieve objectives, and enabling the monitoring of changes in the external opportunities and
threats as well as the internal strengths and weaknesses of the business (Dubihlela and Sandada,
2014). The basic thought is that evaluation and control, keeps the implementation of strategies in
check in order for organisations to identify the fit between strategies and objectives (David
2003). Pearce and Robinson (2005) suggest that to be effective, operational control systems need
to follow four steps, namely setting standards of performance, measuring actual performance,
identifying deviations from set standards and initiating corrective action. The evaluation and
control construct suggests that SMEs are likely to monitor their progress in strategy
implementation and take corrective action to correct deviations from the standards set.
2.3 DRIVERS FOR THE ADOPTION OF STRATEGIC PLANNING
The adoption of strategic planning by SMEs in their operation is driven by different factors. A
review of the evidence from the literature suggests the salient key motivating factors or drivers
for SMEs to engage in strategic planning include environmental dynamics and uncertainty,
business ownership motivations, globalisation, and advent of new technology are among the key
factors that drive the adoption of strategic planning in business enterprises. Meers and Robertson
(2007) affirm that globalisation, new technology, emerging new markets and deregulation are

19
among a host of factors that are constantly causing challenges for today`s firms. They further
suggest that firms need to be proactive in formulating sound strategies in order for them to
overcome these challenges. Similarly, Al Ghamdi (2005) opines that globalisation, technological
advancement, deregulation, emerging of new markets and industries, and economic restructuring
are some of the factors that increasingly driving organisations to engage in strategic planning.
2.3.1 ENVIRONMENTAL DYNAMISM
The fact that the current business environment is volatile, complex and uncertain is driving firms
of all sizes to search for innovative ways of conducting business and improving their profit
margins (Stopford, 2001). However, SME owners and managers perceive the importance of the
business operating environment differently (Mezias and Starbuck, 2003). Bertrand and Schoar
(2003) further support the fact that SME owners and managers address their business
opportunities and threats in a different manner. According to Miliken as cited in Geissler & Krys
(2013), environmental dynamism causes uncertainty which in turn lead managers to make
inaccurate predictions. Geissler & Krys (2013) further posit that three core dimensions of
uncertainty are volatility, complexity and ambiguity. The success of a company is dependent
upon its environmental and market conditions such that it is important for an organisation to
make a comprehensive assessment of market complexity and market turbulence when
developing strategies.
Market complexity can be defined as the amount of effort or difficulty which organisations
encounter when operating in markets. The increase in the number of competitors is the reason for
an increase in market complexity especially when firms are producing multiple products or
services for the market, or if the number of markets in which a firm is operating also increases
(Picard, 2004). Firms need to increasingly change their strategy processes and also to engage in
significant planning efforts that are supported by control and incremental changes, if they intend
to overcome market complexity (Smith, 2002). Instability and lack of clear direction in a market
is evidence for market turbulence. Market turbulence results in uncertainty as it impedes on the
intended outcomes of business activities and, also denies information and direction needed for
risk management. Calatone et al (2003) opine that market turbulence increases the need for rapid

20
innovation but it concurrently forces owners and managers to make risky investment decisions.
Market turbulence often leads to rapid entry of firms and products in markets, whilst
simultaneously leading the exit of some companies and products.
Companies around the globe are facing challenges in their quest to understand and adjust to the
wide ranging as well as devastating external and internal market changes. The market changes
are altering modes of production, rapidly increasing competition, eroding traditional customer
bases, altering established market dominance patterns and changing the potential of firms. There
is dire need for firms to hastily find solutions and adapt to the newly changing market conditions
because these changes have perilous outcomes as they can lead to the failure of both existing and
new products and, ultimately, lead to the loss of value or collapse of firms. This compels
management to be more proactive and conscious of the environment in which their organisations
are operating. According to Al Ghamdi (2005), business management define the concept of
environmental assessment as a process under which businesses gather relevant information from
the environment in their endeavour to achieve a sustainable competitive advantage. Given
today`s high levels of market volatility, uncertainty and turbulence, firms are encouraged to
make environmental scanning as a prerequisite in order for them to effectively detect market
changes in an efficient manner that improves their competitiveness (Karami, 2008).
Environmental scanning is an essential tool for firms as it will enable these business entities to
adjust to the dictates of the increasingly changing market environment.
2.3.2 BUSINESS OWNERSHIP MOTIVATIONS
Despite ownership motivations and strategic planning being generally treated as independent
areas of study in small business literature, the two concepts are intricately linked (Wang, Walker
and Redmond, 2006). Individuals are motivated to be in business by different factors and more
often than not, small business ownership is inextricably attached with the personal lives of
business operators and their families (Culkin & Smith, 2000). The existing literature on small
business ownership suggests that individuals are either pushed or pulled to get into business
(Hughes, 2003; Singh & DeNoble, 2003). Small business ownership occurs from the
combination of both pull and push forces. With respect to small business ownership, operators

21
are largely motivated by the expectations of a positive change that owning a business will bring
to their personal circumstances.
Business ownership is regarded to be a driving factor of strategic planning because most small
businesses operate as “extensions” of their operators and the strategic visions of the business are
closely aligned with the private motivations and ambitions of operators (Mochrie, 2005). Put
simply, in small businesses the operator is usually the business. Although business entities are
mainly focused on profit margins and growth opportunities that ensure viability and continuation
of operations, small business operators might not necessarily prioritise the business financials as
their motivation to get in business could have been primarily affective or based on a non-
financial will (Beaver & Jennings, 2000; Shepherd & Wiklund, 2005). As such, Wang et al
(2006) opine that operators who were motivated to get into business as a result of achieving
financial gains are more likely to engage in strategic planning compared to operators who were
motivated by pursuing non-financial objectives.
2.3.3 GLOBALISATION
One of the challenges of the 21st century for SMEs is global competitiveness due to the fact that
the world is becoming “smaller” and more of a global marketplace (Geissler & Krys, 2013). This
means that customers need to be provided with constant and reliable products and services of a
recognized quality, while the market environment is characterized by global competition
(Kesidou & Demirel, 2012). As a result of increasing competition, companies everywhere are
more or less producing the same products or are offering a similar offering (substitute).
However, the inescapable reality is that organisations need to clearly understand and strategically
manage the forces, complexities and interdependences associated with global economy
integration. As an aftermath of globalisation buyers today are used to a wide range of choices
and the complexity of product portfolios contribute to the many challenges facing strategic
planning as companies are constantly launching new products and line extensions. Therefore,
organisations regardless of their sizes have to take into account many different factors in their
strategic planning.

22
As business institutions continue to move in to the 21st century the realities associated with
globalisation can be expected to become more prevalent and consequently the dialogue between
the organisation and the environment will become more strategically complex. Koutsouks et al
(2000), opine that such strategic complexity has led to more recent investigations of strategic
planning models that are able to hedge against uncertainty and respond to events as they unfold
in time. A business entity might be able to cope with the global challenge if it realizes reliable,
balanced and high standard operation in its business. Govindarajan & Gupta (2000), postulated
that globalisation would further increase in the coming decades as exports and foreign direct
investments will grow significantly faster than GDP as companies are supplying goods and
services to an ever wider range of international markets. The accent of organisations for
increasingly engaging in cross-border flows is on capturing economies of global scale, exploiting
cost reduction or quality enhancing potential of optimal locations, tapping technological
advancements, realising advantages from special skills, labour advantages or the availability of
natural resources within specific geographic locations (Govindarajan & Gupta, 2000).
Wheelan & Hunger (2006), attest to the role of strategic planning by placing emphasis on the
need for business institutions to develop business intelligence in order to remain competitive
within a global context. The intricacies and complexities associated with doing business on a
global basis can be expected to increase, as more business institutions both large and small enter
the arena resulting in stiffer competition. According to Geissler & Krys (2013), organisations
need to regularly re-examine their strategic options on an informed basis especially that they are
existing within a constantly changing context with so many strategic variables that need to be
considered.
2.3.4 INNOVATION AND TECHNOLOGICAL ADVANCEMENT
The advent of new technology in the world has affected the manner in which people now
communicate and the way firms do business (Geissler & Krys, 2013). Self-scanners and video
displays at stores, ATMs, the Internet, and mobile phones are a few examples of how technology
is affecting businesses and consumers. Sterling & Kittross (2001) opine that firms in many
industries had to embrace a wide range of changes in communication capabilities as a result of

23
the development on improved telecommunications systems. The integration of information and
communication technology together with the new applications of technology has led to
fundamental changes in structures, purposes, and capabilities of 21st century firms (Picard,
2004).
According to Kammerer (2009), firms have strong incentives to engage in innovation and
technologies that are congruent with customer benefits. In support of the same view Kesidou and
Demirel (2012) argue that business entities initiate innovation and utilise up to date technology
in order to satisfy minimum customer and societal requirements. Horbach (2008) opines that
environmental consciousness is a relevant parameter for innovative organisations especially in
environmentally sensitive industries. The evidence suggests that small firms seeking to grow will
need to focus on innovation in the form of new product development, and this will be contingent
on the firm`s ability to understand the importance of strategic planning especially in marketing in
order to achieve success (Huang, Soutar & Brown, 2002). As a result, organisations have to
revise their strategic planning in tandem with the prevailing innovation and technologies, for
instance, the organisation can allocate more of their promotion budgets to online advertisements
and mobile marketing and not just rely on traditional print media such as newspapers and
magazines (Geissler & Krys, 2013).
The fast spread of new technology causes market volatility and it is for this reason why
innovation together with technological advancement is regarded as one of the key drivers that
influence an organisation to engage in strategic planning. The convergence of the underlying
technologies of telephone, computers, and media production are thus creating enormous
opportunities for firms, challenging existing products and services, and creating a wide variety of
potential strategic responses by companies. Therefore, where firms are engaged in innovation
and market growth, there is also need for more strategic level planning (Mazzarol, 2008).
2.4 BUSINESS PERFORMANCE OUTCOMES OF STRATEGIC PLANNING
Strategic planning has gained a lot of attention in recent years because of the various benefits it
brings to SMEs in this constantly changing environment. A number of studies have been

24
conducted to ascertain the contribution of strategic planning to business performance. Delmar
and Shane (2003) opine that strategic planning provides three major contributions to operators of
small businesses: (a) it facilitates faster decision making by identifying missing information
without first requiring the commitment of resources; (b) it provides tools for managing the
supply and demand of resources in a manner that avoids time-consuming bottlenecks; and (c) it
identifies action steps to achieve broader goals in a timely manner. According to Lawlor (2006)
the result of using good strategic plan will be an organization with focus, accountability, more
time for the important activities, better decisions, proper allocation of resources, good returns,
market recognition and enhanced chance of success.
This research study focused on six major non-financial contributions of strategic planning to
business performance namely, enhanced business operations, organisation`s proactiveness and
opportunity identification, effective and efficient decision making, common vision and employee
synergy, optimal resource allocation and, adaptability and flexibility.
2.4.1 ENHANCED BUSINESS OPERATIONS
Numerous studies have been conducted to establish whether there is a relationship between
strategic planning activities and business performance. Many empirical studies on the role of
strategic planning have proved that strategic planning is essential in creating better long term
competitive positions and better organizational performance (Suklev & Debarliev, 2012). The
findings from the different studies that were conducted emphasized the importance of strategic
planning for small business success and profitability. According to Hormozi et al (2002),
comprehensive reviews of the small business literature suggest that, ceteris paribus, strategic
planning is generally more common in better performing enterprises. Review of literature has
shown that effective strategic planning help organizations to establish and maintain a competitive
advantage that competitors cannot imitate easily. However, it is worthy to also note that there is
no overall consensus in literature concerning a positive correlation between strategic planning
and performance among organisations.

25
The nature and benefit of strategic planning was shown by Baker (2003) who found that a firm`s
strategic planning could be used to enhance the entity`s financial performance. Naghi, Negrusa
and Gica (2009), argue that small businesses that engage in contemporary strategic management
practices tend to outperform those that do not. Strategic planning is widely considered to be one
of the factors that contribute to small firm growth (Kraus et al, 2008). According to French,
Kelly and Harrison (2004), only about one-third of start-up entrepreneurs create comprehensive
marketing and financial plans and those who do so increase their probability for sustainability
and success. Strategic planning creates a better understanding of the business environment and
reduces uncertainty through generating relevant information (Hodgetts and Kuratko, 2001). It is
evident from the existing literature on small businesses that firms who engage in strategic
planning are more likely to attain high sales growth, high profit margins, high return on assets
and employee growth when compared to those that do not strategically plan. Small businesses
that strategically plan are less likely to fail and are more likely to be innovative as well as
achieving international growth (Beaver & Prince, 2002; Gibbons & O'Connor, 2005). Strategic
planning enhances better organizational performance, which in the long run has impact on its
survival (Taiwo and Idunnu, 2007). Delmar and Shane (2003) found in a longitudinal analysis
that new ventures conducting formal strategic planning have higher survival rates.
2.4.2 ORGANISATIONAL PROACTIVENESS & OPPORTUNITY IDENTIFICATION
Desai (2000) asserts that businesses should undertake strategic planning because their
environments are becoming increasingly complex and unstable. Literature reveals that
organisational proactiveness is achieved through scanning the environment in order to seek
opportunities and taking pre-emptive action against identified threats. Mori, Kazungu & Mchopa
(2014), opine that effective strategic planning can yield a good strategy that neutralizes threats,
exploits opportunities, capitalizes on strengths and/or fixes weaknesses. Strategic planning
enables entrepreneurs to understand their operating environment, to define the purpose of
business, to identify the causes and solutions to problems, and to clarify the ambitions, values,
and resources of a business. According to AL-Shammari et al (2007), strategic planners are
better placed to adapt to their business environment unlike non-strategic planners and through
strategic planning operators are more able to attract and retain their quality labour force through
achieving high levels of employee satisfaction and motivation. Strategic planning process strikes

26
a balance between how a business operates and the requirements of the environment thereby
facilitating a firm to gain competitive advantage (Sandada, Pooe and Dhurup, 2014).
Proponents of the strategic planning process sustain the view that strategic planning might not be
regarded as panacea to business success, but if well managed, businesses are able to clarify
future direction, establish priorities, effectively respond to the dynamic business environment
and, hence, improve their performance. A strategic plan provide an organization with the
roadmap it needs to pursue a specific strategic direction and set of performance goals, deliver
customer value, and be successful. This shows that strategic planning practices would therefore
help SMEs managers or owners to know where they are, where they are going and how to
manage uncertainties in the business environment. Therefore, strategic planning can be observed
as a useful tool for plotting organization survival in the future so that an organization’s current
and future operations will be compatible with that which is required in tomorrow’s world. This
implies that without strategic planning the SMEs might not have the sense of direction in
performing their businesses.
Strategic planning can contribute to organisational proactiveness and opportunity identification
through generating relevant information, creating a better understanding of the important
environment, and by reducing uncertainty (Hodgetts and Kuratko, 2001 in Kraus, 2008). A
business enterprise can count on timely and accurate information about market conditions. It is
essential to build and employ effective mechanisms for observing and listening to what is going
on in the competitive environment. Real-time information in turn must feed on-going strategic
and operational shifts and deployments. This is supported by Hunger and Wheelen (2007) who
found out that strategic planning has evolved to the point that its primary value is to help the
organization operate successfully in dynamic and complex environment. Moreover, Ole Gabriel
(2012) remarked that the excellent execution of an excellent strategy is the best test of
managerial excellence and the most reliable recipe for winning in the market place.

27
2.4.3 EFFICIENT AND EFFECTIVE DECISION MAKING
Strategic planning is believed by some scholars and researchers, to provide SME owners and
managers with a platform for effective decision making and also assisting them with a long-term
view of their businesses. Strategic planning improves firm performance through promoting long-
range thinking, reducing the focus on operational details and providing a structured process for
identifying as well as evaluating strategic alternatives. Through strategic planning, an
organization is able to have a sense of direction or road map that enables it to clearly see where it
is going and where the future will lead it. Without a sense of direction, an organization will
spend its time reacting to problems thus, taking hasty and uninformed decisions that may be very
costly.
According to Balasundaram (2009), formal strategic planning provides a structure for decision
making, helping small business to take a long term view. Gica, Pop & Bota (2009) opine that the
lack of a strategic business plan in small businesses leads to outdated management practices,
including an autocratic style of management practiced by the managing director or the proprietor.
Business decision making is affected because no one other than the managing director or
proprietor can make a decision because other people in the firm do not know where the business
is going or how it is going to get there. Hence, strategic planning is regarded as a factor for
success through its contribution in better decisions and solutions, satisfaction to the customers,
competitive advantage and market recognition which they all facilitate the chances of success
and improve performance. The review of the available literature has shown that strategic
planning is a unifying theme that gives coherence and direction to the actions and decisions of an
organization as it guides managerial decisions toward superior performance.
2.4.4 COMMON VISION & EMPLOYEE SYNERGY
The benefits of employee participation from literature are that it makes opportunity identification
easier as those people closest to the customer are involved in the planning process. Involvement
of middle and lower level managers ensures that good ideas are not overlooked and that it
maximises diversity of viewpoints thus stimulating creativity, a crucial ingredient of innovation

28
(Gumbe, 2014). Other scholars, such as Gadiesh and Gilbert (2001), maintain that involving
employees in strategy execution offers benefits that include motivating employees to capitalise
on opportunities swiftly, and to innovate and take risks.
According to Nah et al. (2001), employee participation enhances skills development through
information sharing and knowledge transfer. Through a participative strategic planning process,
employees are satisfied that their ideas are considered for problem solving, employees develop
an interest in the process of planning and become committed and motivated to work hard for goal
achievement. When the members of the organization especially the employees who are the main
implementers of strategic plan feel the sense of involvement they shall take that they are part of
the strategic plan and its achievement so if the goals are achieved they shall be impressed as they
are as well focusing on the goals achievement by an organization. Similarly, Barker and Frolick
(2003) state that in order to ensure strategy success, employees should be involved
unconditionally. Strategic planning ensures that all the different units of the organization work
together towards achieving the same objectives. Without a strategic plan, the organic units of the
organization will slew off track. Strategic planning, therefore, provides an integrative mechanism
for all organizational units to work together.
2.4.5 OPTIMAL RESOURCE ALLOCATION
Strategic planning process delivers a set of defined initiatives (projects) that achieve a desired set
of business goals (McDonald, 2007). Strategic planning process encompasses an assessment of
the available resources required for achieving the organisation`s defined goals and it permits a
clear description of the specific plans (initiatives) designed to accomplish the set business
targets. Strategic planning assists an organisation to effectively and efficiently allocate its
available resources in a manner that also encourages capitalisation of existing opportunities in
the marketplace. Strategic planning develops a sense of ownership of the plan and therefore
ensures the most effective use is made of the organization`s resources by focusing the resources
on the key priorities.

29
2.4.6 ADAPTABILITY AND FLEXIBILITY
Hitt et al (2001) argue that change is the only constant in this new economy which is driven by
the digital revolution and only firms that are capable of adapting themselves to change will
survive. In a similar vein, Ahuja and Lampert (2001) also argued that firms that survive and
succeed are those that are capable of developing internal processes and systems that enable them
to satisfy market demands through providing outputs that meet customer needs and developing
competitive advantage over other competitors in the market. Formalised strategic plans have
often often been criticised in the circles of SMEs for being rigid and not allowing for constantly
changing demands. However, for an organisation not to have a plan can result in the lack of
direction and ultimately leading to business failure. Strategic planning has evolved to encompass
alternative decisions can be generated and considered by companies in dealing with differing
scenarios thereby allowing for positive organisational change and adaptation to environmental
turbulence. Strategic planning enable organisational leaders to align the internal organisation`s
environment with the changes occurring in the increasingly volatile operating business
environment (Robinson and Pearce, 2005).
2.5 LITERATURE SYNTHESIS AND CONCEPTUAL FRAMEWORK
A discussion from the previous section indicates that much of the literature concerning strategic
planning practices has been centred on developed countries and partly South Africa such that
there is little information on Zimbabwean SMEs in respect of drivers and business performance
outcomes of strategic planning. Despite the fact that most of these studies on strategic planning
among SMEs scrutinised the direct relationship between strategic planning practices and
business performance, very few scholars considered to study the drivers of strategic planning
practices for these small business entities.
In an endeavour to bridge this gap in literature, this study examines the relationship amongst
perceived drivers, strategic planning practices and business performance of Zimbabwean SMEs.
This section therefore, presents the conceptual model under which the factors influencing the
adoption of strategic planning practices among SMEs in the Harare Metropolitan Province are
analysed. Judicious consideration has also been given to strategic planning factors that impact on
business performance of these SMEs.
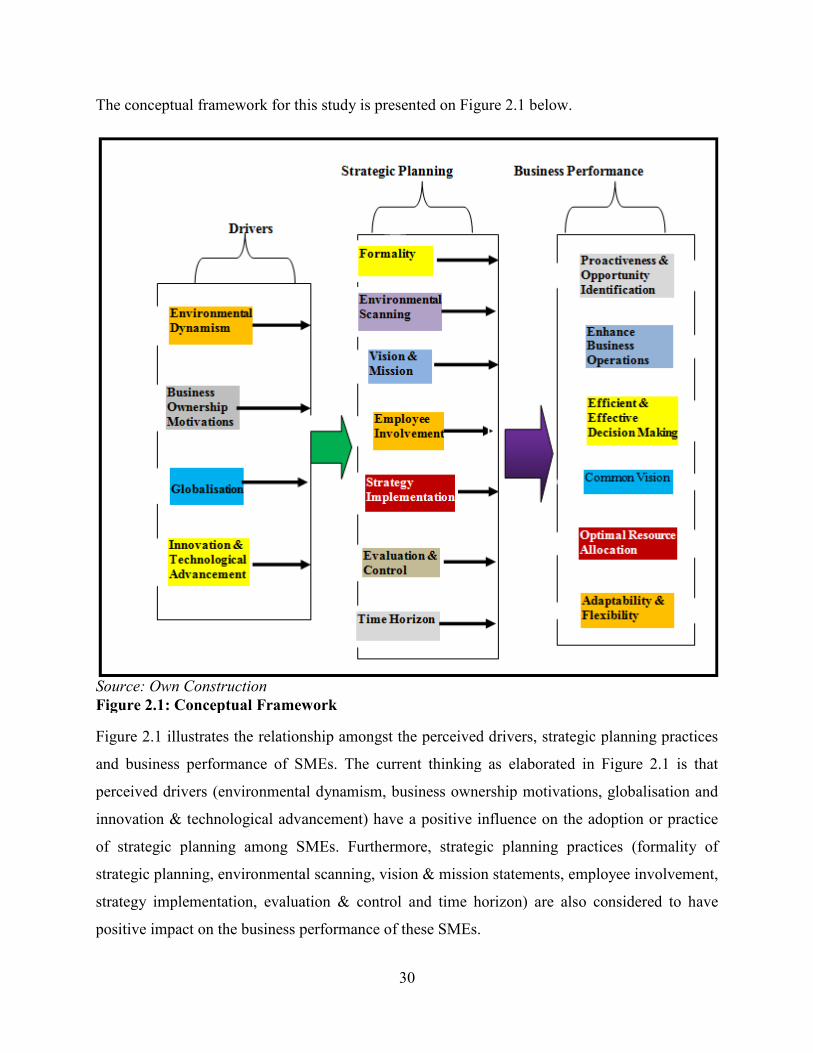
The conceptual framework for this study is presented on Figure 2.1 below.
Source: Own Construction
Figure 2.1: Conceptual Framework
Figure 2.1 illustrates the relationship amongst the perceived drivers, strategic planning practices
and business performance of SMEs. The current thinking as elaborated in Figure 2.1 is that
perceived drivers (environmental dynamism, business ownership motivations, globalisation and
innovation & technological advancement) have a positive influence on the adoption or practic
of strategic planning among SMEs. Furthermore, strategic planning practices (formality of
strategic planning, environmental scanning, vision & mission statements, employee involvement,
strategy implementation, evaluation & control and time horizon) are a
positive impact on the business performance of these SMEs.
30
e conceptual framework for this study is presented on Figure 2.1 below.
Figure 2.1: Conceptual Framework
illustrates the relationship amongst the perceived drivers, strategic planning practices
ance of SMEs. The current thinking as elaborated in Figure 2.1 is that
perceived drivers (environmental dynamism, business ownership motivations, globalisation and
innovation & technological advancement) have a positive influence on the adoption or practic
of strategic planning among SMEs. Furthermore, strategic planning practices (formality of
strategic planning, environmental scanning, vision & mission statements, employee involvement,
strategy implementation, evaluation & control and time horizon) are also considered to have
positive impact on the business performance of these SMEs.
illustrates the relationship amongst the perceived drivers, strategic planning practices
ance of SMEs. The current thinking as elaborated in Figure 2.1 is that
perceived drivers (environmental dynamism, business ownership motivations, globalisation and
innovation & technological advancement) have a positive influence on the adoption or practice
of strategic planning among SMEs. Furthermore, strategic planning practices (formality of
strategic planning, environmental scanning, vision & mission statements, employee involvement,
lso considered to have

31
.
2.6 CHAPTER SUMMARY
The chapter highlighted the salient attributes which are used to characterise SMEs. The above
sections presented the operational definition of strategic planning and elaborated on the
perceived drivers and business performance outcomes of strategic planning among SMEs. This
chapter also indicated that there is little empirical evidence on the research that sought to
evaluate strategic planning practices within the domain of small business enterprises in
Zimbabwe. This study, therefore sought to narrow and delve deeper into the assessment of the
perceived drivers and business performance outcomes of strategic planning among SMEs within
Harare Metropolitan Province. The chapter concluded by presenting the theorised conceptual
framework to be used in the assessment of the perceived drivers and business performance
outcomes of strategic planning among the SMEs.
The next chapter outlines the research methodology which was used for this study in terms of the
research design, sampling procedure, instrumentation, data analysis and ethical considerations.

32
CHAPTER THREE
RESEARCH METHODOLODY
3.0 INTRODUCTION
The previous chapter reviewed the existing literature on strategic planning and illuminated on the
perceived antecedents and business performance outcomes of strategic planning in SMEs. This
chapter discusses the research methodology, which Fisher (2010) defined as a procedural
framework within which a research is conducted, and explains how the data was obtained and
analyzed. This chapter presents research design and the predominant approaches used in
research, population and sampling procedures, method for data collection and analysis. This
chapter concludes with the highlighting of ethical guidelines which were observed by the
researcher.
3.1 RESEARCH DESIGN
Different researchers and scholars, both in natural sciences and humanities have proffered an
array of definitions of a research design. According to Kumar (2005), a research design is a plan,
structure and strategy of investigating a research question or problem. Tustin (2006) defines a
research design as master plan specifying the methods and procedures for collecting and
analyzing the required information. There are two purposes of a research design, namely
assisting the researcher to conceptualise an operational plan on how to carry out a study; and to
ensure that the study is carried out in such a way that the data collected are valid, reliable and
objective, hence accurately answer the research questions (Leedy, 2005). Morse (2001) posits
that a research design enables the researcher to effectively address the research problem as
unambiguously as possible.
This study adopted a quantitative, cross-sectional research design and this was in line with
Bryman & Bell (2007) who postulated that a cross-sectional design is used for research that
collects data on relevant variables on only one case at a single point in time from a variety of
people, subjects or phenomena. In this study, data was collected on relevant variables from a

33
variety of SME owners and managers, within a short period of time. According to Babbie &
Mouton (2002), a quantitative study is an inquiry into a social or human problem based on
testing a theory composed of variables, measured with numbers and analyzed with statistical
procedures in order to determine whether the predictive generalizations of the theory hold true.
Therefore, this quantitative study sought to ascertain the influence that the perceived driving
factors have in the adoption or practice of strategic planning among SMEs as well as to establish
the impact of strategic planning practice on business performance of SMEs.
3.1.1 RESEARCH PURPOSE
According to Saunders et al (2009), there are three main purposes for undertaking a research
study namely, exploratory, descriptive and explanatory. Neuman (2000) described the three
purposes of research as follows:
• Exploratory research aims to explore a new topic.
• Descriptive research aims to describe a social phenomenon.
• Explanatory research aims to test the predictions or principles involved in a theory.
The main purpose of this research study was explanatory as the thrust was on explaining the
influence that perceived driving factors have in the adoption or practice of strategic planning
among SMEs within the Harare Metropolitan Province. The research study also sought to
establish the impact of strategic planning practices on business performance of these SMEs.
3.1.2 PHILOSOPHICAL PARADIGM
Saunders et al (2009), opine that positivism, realism, interpretivism and pragmatism are the four
main research philosophical paradigms.
This study adopted the positivist approach as the researcher sought to ascertain the influence
posed by the perceived drivers in the adoption or practice of strategic planning among SMEs as
well as to establish the impact of strategic planning practices on business performance of these
enterprises. The positivist philosophy was also deemed appropriate due to the fact that the

34
research study encompassed the setting of hypotheses which had to be tested. The variables that
were under scrutiny in this research are realities that exist outside the researcher`s mind and they
had to be studied using quantitative methods. The positivist approach is much more objective in
comparison with qualitative methods as data can be controlled and measured, to address the
accumulation of facts in determining the causes of behavior. Moreover, the study adopted the
positivist approach through considering that quantitative data is replicable thereby making it
possible for other researchers to conduct the same study in different places as noted by Robson
(2002). Furthermore, the sample size of the research study was deemed large and the objectives
were to describe, explain and identify statistical relationships between variables. The researcher
ensured independence between himself and the respondents whereupon the two parties neither
affected each other during the research.
According to Bryman & Bell (2009), positivism advocates for the application of the methods
borrowed from the natural sciences to the study of social reality and beyond. Collis and Hussey
(2003) posit that, the key characteristic of the positivist approach is that it encompasses the use
of reductionist techniques when exploring the relationships between the variables being studied.
It is then a necessary condition for the researcher to control the study and, therefore, understand
how the concerned variables are behaving. Saunders et al (2009) note that positivism entails at
least the following five features:
• It uses deductive reasoning.
• Seeks to explain the causal relationships between a set of variables.
• Uses a highly structured methodology to facilitate interpretation.
• Makes use of controls to allow for hypothesis testing.
• It makes use of quantitative approach which makes it easier to compare and generalize
data.

35
3.2 RESEARCH APPROACH
Deductive approach and Inductive approach are the two main approaches that involve the
relationship between theory and data in research where, the former is concerned with quantitative
research whilst the latter is concerned with qualitative research (Bryman & Bell, 2007).
Creswell (2008) defines quantitative research as a type of research that seeks to explain
phenomena by collecting numerical data that are analysed using mathematically based methods
particularly statistics. In contrast, Saunders et al (2009) posit that qualitative research is a process
of enquiry which involves exploring and understanding social or human phenomena by relying
on the collection of non-standardised meanings expressed in words.
The central focus of this research study was on the influence of perceived drivers on strategic
planning and impact of strategic planning practices on business performance of SMEs operating
within Harare Metropolitan Province. The researcher adopted the deductive approach where
hypotheses were deduced basing on the knowledge that was gathered from existing literature on
the strategic planning of SMEs. According to Harwell (2011), the thrust for quantitative research
is to maximise objectivity, replicability and generalisability of findings, and it is typically
interested in prediction. The research objectives sought to establish the relationships and
causations between variables such that the use of a deductive approach was most appropriate for
this study. Consistent with the positivist philosophical paradigm, the deductive approach was
deemed to be the most suitable as the study involved the collection of large amount of data and
conducting of statistical procedures in disapproving or approving the hypotheses.
3.3 RESEARCH STRATEGY
Saunders et al (2009) defines a research strategy as a general plan of how a researcher goes about
in answering research questions. According to Yin (2009), the common forms of research
strategy include case study, survey, experiment, grounded theory, ethnography and action
research.
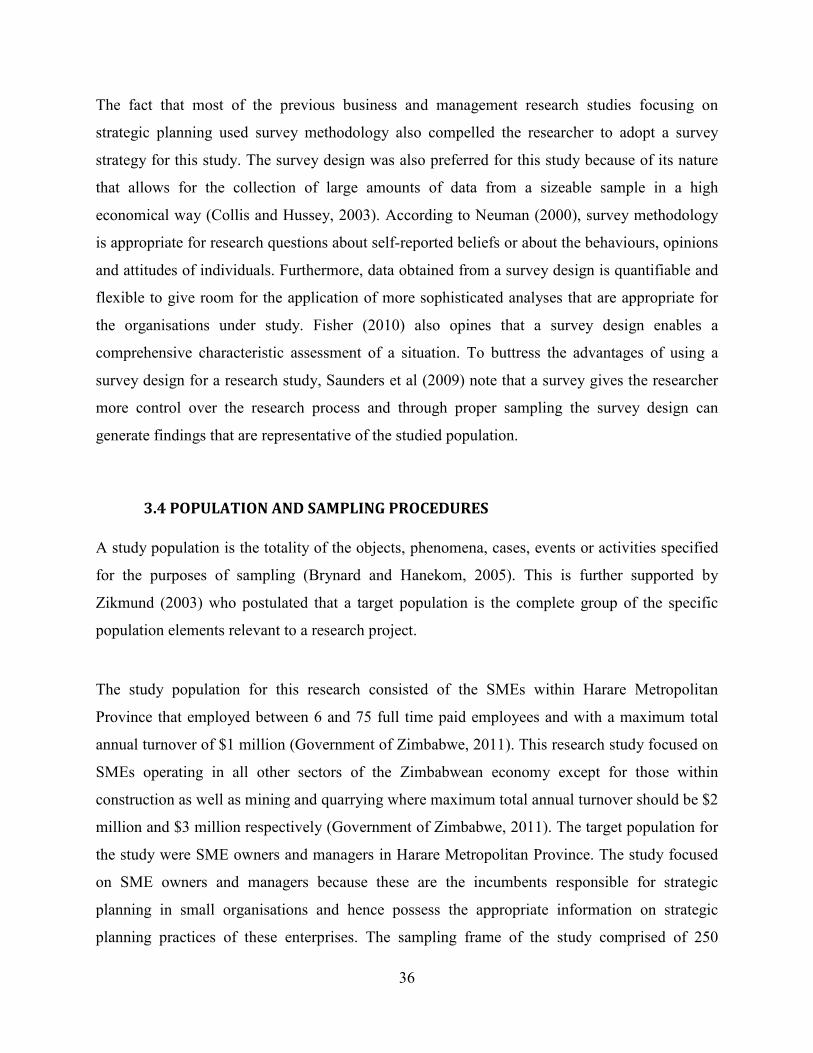
36
The fact that most of the previous business and management research studies focusing on
strategic planning used survey methodology also compelled the researcher to adopt a survey
strategy for this study. The survey design was also preferred for this study because of its nature
that allows for the collection of large amounts of data from a sizeable sample in a high
economical way (Collis and Hussey, 2003). According to Neuman (2000), survey methodology
is appropriate for research questions about self-reported beliefs or about the behaviours, opinions
and attitudes of individuals. Furthermore, data obtained from a survey design is quantifiable and
flexible to give room for the application of more sophisticated analyses that are appropriate for
the organisations under study. Fisher (2010) also opines that a survey design enables a
comprehensive characteristic assessment of a situation. To buttress the advantages of using a
survey design for a research study, Saunders et al (2009) note that a survey gives the researcher
more control over the research process and through proper sampling the survey design can
generate findings that are representative of the studied population.
3.4 POPULATION AND SAMPLING PROCEDURES
A study population is the totality of the objects, phenomena, cases, events or activities specified
for the purposes of sampling (Brynard and Hanekom, 2005). This is further supported by
Zikmund (2003) who postulated that a target population is the complete group of the specific
population elements relevant to a research project.
The study population for this research consisted of the SMEs within Harare Metropolitan
Province that employed between 6 and 75 full time paid employees and with a maximum total
annual turnover of $1 million (Government of Zimbabwe, 2011). This research study focused on
SMEs operating in all other sectors of the Zimbabwean economy except for those within
construction as well as mining and quarrying where maximum total annual turnover should be $2
million and $3 million respectively (Government of Zimbabwe, 2011). The target population for
the study were SME owners and managers in Harare Metropolitan Province. The study focused
on SME owners and managers because these are the incumbents responsible for strategic
planning in small organisations and hence possess the appropriate information on strategic
planning practices of these enterprises. The sampling frame of the study comprised of 250

37
registered and operational SMEs within Harare Metropolitan Province as provided by the
database which was obtained from the Ministry of Small and Medium Enterprises and
Cooperative Development in Zimbabwe.
3.4.1 SAMPLING
According to Posit and Hungler (2013), sampling is defined as the procedure of selecting a
proportion of the population to represent the whole population under study.
3.4.1.1 SAMPLE SIZE
The issue of the appropriate sample size to be used for a research study is still a contentious
subject that has not been entirely resolved among scholars. According to Fisher (2010), the
sample size of a research project is determined by the size of the target population and the size of
the margin of error that the researcher is prepared to accept. The existing literature on sampling
procedures has also revealed that in calculating the sample size for a research project, the
researcher should at least consider population parameters that the study intend to estimate, the
cost associated with the selected research instruments and the variability or spread of the target
population.
This study adopted the simplified formula which was developed by Yamane in 1967 to
determine the appropriate sample size for the research project. In line with Yamane`s formula, a
95 percent confidence level and a ±5 percent level of precision were assumed for the study.
Yamane`s formula is presented as follows:
n = N
1 + N (e) ²
Where: n = sample size
N = Population size
e = Level of precision

38
Considering that the study population for the research project comprised of 250 SMEs and that a
5 percent level of precision was assumed, it meant that the calculated sample size for the
research project was 153 SMEs.
3.4.1.2 SAMPLING TECHNIQUES
Zikmund (2003) posits that probability sampling and non-probability sampling are the two major
techniques of sampling.
According to Cooper and Schindler (2014), probability sampling is a controlled procedure that
assures that each population element is given a known non-zero chance of selection. This means
that in probability sampling, the elements in the population have some known chance of being
selected as sample subjects. Probability sampling can be sub-divided into simple random,
systematic, cluster or stratified sampling techniques. In contrast, Cooper and Schindler (2014)
further postulate that with non-probability sampling a subjective approach is used and the
probability or chance of the elements in the population being selected as sample subjects is
unknown. Non-probability sampling techniques include quota sampling, convenience sampling
and purposive sampling.
The main advantage of probability sampling techniques over non-probability techniques is on
their representative nature of the sample to the target population thereby enhancing the chance of
yielding unbiased results (Cooper and Schindler, 2014).
3.4.1.3 SAMPLING PROCEDURE
For the purposes of this research study, probability sampling techniques in the form of stratified
random sampling and simple random sampling were used together with a non-probability
sampling technique in the form of purposive sampling as outlined overleaf.
A list obtained from the Ministry of Small and Medium Enterprises and Cooperative
Development in Zimbabwe indicated that SMEs are divided into seven (7) different categories

39
depending on their main economic activities as shown in Table 3.1 below. These categories
formed the seven (7) strata. Stratified sampling technique was used to sample the SMEs from
these seven strata and a representative sample from each stratum was then chosen. Stratified
random sampling was chosen because the technique ensured inclusion in the sample, of sub-
groups (stratum) which otherwise would have been omitted by other sampling methods due to
their small number in the population
After conducting stratified random sampling, proportional sampling was further used to
determine the appropriate representation of the study population. According to Dempsey and
Dempsey (2000), proportional sampling requires the researcher to be able to identify the
percentage of the population which each stratum contains.
The researcher sampled the population proportionally, basing on the following formula:
No. of SMEs in each Stratum = No. Of SMEs in stratum x sample size (153)
Total No. of SMEs
Table 3.1: Sampling Grid
No. Stratum/ Category No. of SMEs Sample
1 Manufacturing 20 12
2 Health Care and Education Facilities 27 17
3 Financial and Business Service Institutions 10 6
4 Tourism and Hospitality 65 39
5 Agriculture 34 21
6 Transport and Telecommunication 36 22
7 Retail 58 36
Total 250 153
Once the number from each stratum was determined, simple random sampling technique was
used to sample the individual SMEs. All the SMEs in each stratum were assigned numbers on
equal sized cards and were put in a hat. The equal sized cards were then randomly picked from
the hat without replacement until the required number from each stratum was obtained. Simple
random sampling technique was preferred since it gave each SME an equal chance of being
selected. Furthermore, simple random sampling technique allows generalisability of the obtained
results to a larger population through the use of inferential statistics.

40
Purposive sampling technique was then used to sample the respondents. Purposive sampling
allowed the researcher to use cases that had the required knowledge and information with respect
to the objectives of the study. To this end, SME owners and managers were selected to complete
the questionnaire because these are the incumbents responsible for strategic planning in these
organisations and hence possessed the appropriate information which was required for the study.
3.5 DATA COLLECTION
The researcher adopted the survey method to which self-administered structured questionnaires
were used to gain insight into strategic planning practices of SMEs.
3.5.1 RESEARCH INSTRUMENT
This study utilized the self-administered structured questionnaire in collecting the data from the
targeted respondents. Hofstee (2006) described self-administered questionnaires as a form of
structured interviewing, where all the respondents are asked the same set of questions and are
offered the same options in answering these questions.
The use of self-administered questionnaires was opted for because of its cost effectiveness and
ease to administer. The method also ensured a greater possibility of anonymity and greater
convenience for respondents since they could complete the questionnaire at their own pace and
time (Bryman and Bell, 2007). Self-administered questionnaires also provide respondents with
some degree of autonomy which in turn limit bias to the information supplied. In an endeavour
to enhance the response rate, the questionnaires were either hand delivered or send via e-mail to
the targeted respondents of the selected SMEs (owners/ managers).
The questionnaire design was based on prior studies investigating strategic planning practices
among SMEs. The measurement dimensions for the questionnaire were appropriately modified
to suit the current study as shown in Table 3.2, Table 3.3 and Table 3.4 overleaf. The structured
questionnaire which was used for this study composed of multiple choice and close-ended

41
questions. A demographic section solicited information about the owners or managers, such as
sex, age, position occupied in the business, educational qualifications, as well as the business’
characteristics such as, number of years in business and number of employees. The remaining
sections solicited information related to the perceived antecedents and business performance
outcomes of strategic planning among SMEs. The survey items were uniformly structured on a 5
point Likert scale (from [1] representing “Strongly Disagree” to [5] representing “Strongly
Agree”), where respondents chose the most appropriate number that corresponded to their level
of agreement or disagreement with a given statement. The fact that the questions were close-
ended meant that the questionnaires were completed faster and the results were also easy to
analyze.
The questionnaire was designed in English considering that it was being administered to
professionals (owners and managers) within SMEs who were expected to have the basic
understanding of the English language. The questionnaire was also designed with the researcher
conscious of the remarks made by Saunders et al (2009) that, “the best way of obtaining valid
responses to questions is to keep both the visual appearance of the questionnaire and the wording
of each question simple”. As result, concise questions were kept with due care taken to their
actual phrasing. To ensure clarity, the questionnaire was designed to start with explanations of
key terms and the purpose of the study.

42
3.5.1.1 MEASUREMENT SCALES FOR THE RESEARCH VARIABLES
Table 3.2: Measurement Scales of Strategic Planning Factors
Construct Items Source Formality of Strategic Plans 1. The organisation has developed formal
strategic plans. 2. Formal methods (facts, figures) are used to
present the strategic plan. 3. Formal meetings are used to convey
information about strategic planning.
Sandada (2015)
Environmental Scanning 1. The strategic plan includes scanning of the environment (assessment of the organisation`s Strengths, Weaknesses, Opportunities & Threats).
2. The business conducts environmental scanning in order to be informed about technological advances.
3. The business conducts environmental scanning in order to be informed about customers and their needs.
Sandada (2015)
Business Mission and Vision 3 The organisation does have the vision and mission statements.
4 There is a clear vision & mission statement about the future of the business.
5 Everyone is aware of the vision &mission of the business.
Sandada (2015)
Employee Participation 1. Employees at all levels of the organisation are involved in the strategic planning process.
2. Employees are consulted in the strategic planning process.
3. There is open dialogue of the strategic planning procedures.
Sandada (2015)
Strategy Implementation 1. Effective strategy implementation is at the core of the organisation`s competitiveness.
2. Non-monetary rewards are used to motivate employees to be committed to carry out the plan and accomplish goals.
3. The business rewards employees with bonuses to enforce commitment towards carrying out the strategic plan.
Sandada (2015)
Evaluation and Control 1. The organisation monitors and evaluates the execution of the planned strategies.
2. Feedback about progress in goal achievement is done during regular scheduled meetings.
Sandada (2015)
Time Horizon
1. The optimal time frame of the organisation`s strategic plan spans beyond two years before the strategic plan is reviewed and updated.
2. There are ad-hoc adjustments to the strategic plan whenever the need arises.
Sandada (2015)

43
Table 3.3: Measurement Scales of Perceived Drivers of Strategic Planning
Construct Items Source Environmental Dynamics and Uncertainty
1. Organisations engage in strategic planning to counter market changes
2. The degree and complexity of the changing business environment is compelling organisations to plan more strategically.
Glanz (2005); Fourie (2007); Zhang, Majid & Foo (2012)
Business Ownership Motivations 1. The owner has the primary responsibility for setting strategic direction in the organisation.
2. The formulation of strategic plans is dependent upon the motivations and desires of the owner.
3. It is the owner who fosters the culture of strategic planning in the organisation.
Wang, Walker & Redmond (2011); Zahir (2012)
Globalisation and Growing Competition
1. Globalisation is strongly influencing organisations to adopt strategic planning in a bid to gain competitiveness.
2. Growing competition requires an organisation to strategically plan.
O`Regan, Ghobadin & Gallear (2006); Fourie (2007); Waihenya (2014)
Innovation and Technological Advancement
1. Creativity and new product development are among the outcomes of strategic planning.
2. Technology and new business models evolve from strategic planning.
O`Regan, Ghobadin & Gallear (2006); Fourie (2007); Waihenya (2014)
Table 3.4: Measurement Scales of Business Performance Outcomes of Strategic Planning
Construct Items Source Proactiveness and Opportunity Identification
1. External orientation and environmental scanning maximise opportunity identification for the organisation.
2. Through strategic planning, the organisation is proactive in preparing for future contingencies and account for environmental dynamics & complexity.
Fourie (2007); Earle (2009); Shahin (2011); Waihenya (2014)
Enhanced Business Operations 1. Strategic planning assists the organisation to exploit core competencies and attain better business performance.
2. Strategic planning ensures that the organisation operates successfully in a dynamic and complex business environment.
Fourie (2007); Earle (2009); Shahin (2011); Waihenya (2014)
Efficient and Effective Decision Making
1. Strategic planning avails the organisation with pertinent information to make the right decisions.
2. Adoption of strategic planning smoothens and makes the decision making process fast as well as easier.
Fourie (2007); Earle (2009); Shahin (2011); Waihenya (2014)

44
Employee Involvement Around Common Vision
1. A strategic plan is a comprehensive master plan that gives employees` a common sense of direction as well as allowing them to work towards a common goal.
2. Strategic planning unifies employees` and allows them to share a common vision.
3. Strategic planning help to keep the workforce informed about corporate goals and their attainment on a regular
basis.
Fourie (2007); Earle (2009); Shahin (2011); Waihenya (2014)
Optimal Resource Allocation 1. Strategic planning creates a rational basis for optimal resource allocation among stakeholders of the organisation.
2. Strategic planning ensures the most effective use of organisational resources by focusing the resources on key priorities
Fourie (2007); Earle (2009); Shahin (2011); Waihenya (2014)
Adaptability and Flexibility 1. Strategic planning enhances the organisation`s flexibility and its ability for improvisation.
2. Strategic planning ensures that the organisation is stable and able to adapt to changes in the marketplace.
Fourie (2007); Earle (2009); Shahin (2011); Waihenya (2014)
3.5.2 PILOTING OF THE RESEARCH INSTRUMENT
The developed questionnaire was piloted in 14 SMEs, two from each of the 7 strata identified in
the study as depicted by Table 3.1. The SMEs used in piloting were exempted from the main
study. The pilot study provided the researcher with better information on the feasibility of the
study and also assisted in determining whether the study was effective in fulfilling the purpose of
the research project. According to Cohen et al (2011), a piloting exercise has several functions,
principally to increase the reliability, validity and practicability of the questionnaire. The pilot
study was done in order to refine the research instrument and establish the logistics for the main
study. The pilot study also explored the appropriateness of questions to the target population and
it also tested the correctness of the instructions given in the questionnaire.

45
3.6 DATA ANALYSIS TECHNIQUES
Quantitative data was collected in this study and Statistical Package for Social Sciences (SPSS)
version 23 was used for data capturing and analysis. SPSS enabled the researcher to perform
various data analysis procedures including validity and reliability test, normality test and
hypothesis testing.
3.6.1 TEST FOR VALIDITY AND RELIABILITY
According to Saunders et al (2009), validity is the degree to which results obtained from the
analysis of the data actually represent the phenomenon under study. Validity is concerned with
how accurately the data obtained represent the variables of the study. In order to enhance the
validity of the study, the questionnaire was derived from validated items derived from available
literature and was given to three experts in the area of business management at the University of
Zimbabwe to obtain expert opinion. In addition, a pilot study was also conducted to ensure that
the respondents fully comprehended the questionnaire in line with the study objectives.
Saunders et al (2009) posit that reliability is a measure of the degree to which a research
instrument yields consistent results or data after repeated trials. For this study, the data was
tested for reliability using the Cronbach`s Alpha functionality in SPSS. The study was guided by
Malhotra (2007) who postulated that the Cronbach`s Alpha coefficient should be equal or greater
than 0.7 for an item to be acceptable. Therefore, the reliability of the items in this study was
tested to ensure that they were consistently measuring the same constructs.
3.6.2 NORMALITY TEST
The collected data was subjected to rigorous statistical tests, firstly to test for normality before
the analysis. The Shapiro-Wilk test is usually appropriate for small sample sizes (<50 samples),
but can also handle sample sizes as large as 2000 samples. It is for this reason that this study
used the Shapiro-Wilk test in assessing the normality of data. The normality test establishes how
data is distributed. On a Shapiro-Wilk test, a p value greater than0.05 (p>0.05) indicates that the
data is normally distributed signifying that the sample selected does not differ significantly from

46
the population of the study and parametric tests can be performed using the data. On the other
hand, if the p value is less than 0.05 (p<0.05), then the data is not normally distributed as a result
sample differs significantly from the population and this calls for the performance of non-
parametric tests.
3.6.3 CORRELATION ANALYSIS
Before conducting a regression analysis, Pearson`s product-moment coefficient was computed in
order to ascertain the bivariate relationship between independent variables and the dependent
variable. The Pearson`s product-moment coefficient is a parametric statistical test for evenly
distributed data (Zikmund, Babin, Car, & Griffin, 2009). The Pearson`s product-moment
coefficient was therefore used because the data was normally distributed. The correlations range
from -1.0 for a perfect negative relationship to +1.0 for a perfect positive relationship (Welman,
Kruger, & Mitchell, 2005).
3.6.4 REGRESSION ANALYSIS
Having established the strength of correlations between the variables, the study proceeded to
conduct a regression analysis as correlation analysis only measure the strength of a relationship
but fail to determine predictive relationship between variables. Regression analysis was
performed to test the predictive relationship between sets of constructs.
3.6.5 DESCRIPTIVE STATISTICAL ANALYSIS
Descriptive statistics such as the mean, standard deviations and frequency distributions were
used to analyze the composition of the sample. Independent Samples T test and One-Way
Analysis of Variance (ANOVA) were used to ascertain whether there is a statistically significant
difference in strategic planning behaviour among SME owners and managers in respect of sex,
level of education and industry.

47
3.7 ETHICAL CONSIDERATIONS
The issue of ethics is a vital consideration in research that involves human subjects (Cooper &
Schindler, 2010). Research ethics is defined as the appropriate behaviour by a researcher relative
to the norms of society (Zikmund, 2010). A researcher, research subjects, and clients or
consumers of a research have to be protected from any adverse consequences of the research
(Cooper & Schindler, 2010).
This research considered ethical factors in a number of ways. The researcher ensured that the
respondents participated in the research on a voluntary basis, and the respondents had the right to
withdraw from the research at any time of their choice. To this end, those who participated in the
research were asked to complete consent forms to confirm that they were not coerced to
participate in the study. Respondents were, in the clearest terms, made aware that there was not
going to be any direct material benefits or rewards which were going to accrue to them as a result
of their participation in the study.
The researcher also respected another ethical requirement to protect the identity of respondents
through exercising anonymity and confidentiality. The researcher was not interested in the names
or identities of the respondents but only the valuable information they were going to provide.
The researcher also tried by any means possible not to pose questions that embarrassed and make
the respondents uncomfortable. Finally, the researcher maintained objectivity, presented the true
research findings and used the research results for academic purposes only. The researcher, to the
best of his ability, truthfully analysed and reported the findings as obtained from the field.
3.8 CHAPTER SUMMARY
The chapter presented the research design and research approach that were deemed appropriate
for this research study and proffered justification to their selection. The study population was
also delineated and the sampling frame was defined. The chapter also outlined how the data was
collected and analysed. The chapter concludes by discussing the ethical considerations to the
study. The next chapter concentrates on data analysis, findings and discussion.

48
CHAPTER FOUR
RESEARCH FINDINGS
4.0 INTRODUCTION
The previous chapter focused on the methodology used for data collection and analysis. The
focal point of this chapter is to establish how the collected data addressed the research objectives
and this was facilitated by the analysis, presentation and interpretation of the collected data using
the statistical package SPSS version 23. To this end, this chapter will present response rate,
descriptive analysis, reliability analysis, normality tests, correlation analysis, regression analysis
and hypothesis testing. In an endeavour to ensure clarity and simplicity, tables and graphs were
used in presenting the analysis and interpretation of the collected data.
4.1 RESPONSE RATE
According to the database obtained from the Ministry of Small and Medium Enterprises and
Cooperative Development in Zimbabwe, the study had a target population of 250 registered and
active SMEs operating within the Harare Metropolitan Province from which a sample of 153
SMEs was selected. The sampled SMEs were categorised in 7 strata in accordance with their
economic activities. One questionnaire was either hand-delivered or send electronically via
email to each sample element with the specific request that it be completed by the owner or a
senior manager as the study sought to establish the perceived drivers and benefits of strategic
planning among SMEs. Owner/ senior managers were targeted because they are conversant with
the strategic planning practices in these firms.
A total of 117 questionnaires were received from the 153 questionnaires that were administered
to the targeted respondents.
∴ Response Rate = 117
153= 76.47%

According to Neuman (2000), the standard acceptable response rate of self administered
questionnaires is 60% and basing on this criterion, the established response rate
therefore deemed appropriate for the study.
4.2 DEMOGRAPHIC ANALYSIS
According to Cooper and Schindler (2014), it is pertinent for the researcher to understand the
background statistics of the respondents as demographic data can unearth salient relationships
that may be present in the data. Being cognisant of this fact, it
study to explore the respondents on a personal level focusing on their
the Organisation and Highest Level of Education.
data, the Industrial Sector, the Pe
the organisation were analysed.
4.2.1 SEX OF RESPONDENTS
The sex profile of the participants in the study
(67.5%) were males and 38 (32.5
the sex profile of the respondents.
Figure 4.1: Sex of Respondents
79
38
0
20
40
60
80
100
120
140
160
Male Female
49
According to Neuman (2000), the standard acceptable response rate of self administered
questionnaires is 60% and basing on this criterion, the established response rate
therefore deemed appropriate for the study.
DEMOGRAPHIC ANALYSIS
According to Cooper and Schindler (2014), it is pertinent for the researcher to understand the
background statistics of the respondents as demographic data can unearth salient relationships
that may be present in the data. Being cognisant of this fact, it was found imperative for this
study to explore the respondents on a personal level focusing on their Sex, Age, Position held in
the Organisation and Highest Level of Education. In respect of the organisation’s background
Period of Operation and the Number of permanent employees in
OF RESPONDENTS
of the participants in the study indicates that the majority of the respondents 79
(67.5%) were males and 38 (32.5%) of the respondents were females. Figure 4.1 below, presents
profile of the respondents.
of Respondents
38
153
117
Female Overall
Survey Target
Actual Respondents
According to Neuman (2000), the standard acceptable response rate of self administered
questionnaires is 60% and basing on this criterion, the established response rate of 76.47% was
According to Cooper and Schindler (2014), it is pertinent for the researcher to understand the
background statistics of the respondents as demographic data can unearth salient relationships
was found imperative for this
, Age, Position held in
In respect of the organisation’s background
Number of permanent employees in
indicates that the majority of the respondents 79
e 4.1 below, presents

50
The dominancy of male respondents is a reflection of the higher proportion of males in the
ownership and managerial positions of SMEs. It seems that mainly male managers or owners
lead most SMEs in Zimbabwe and this is also an indication that the society under which the
study was conducted is patriarchal.
4.2.2 AGE OF RESPONDENTS
Table 4.1 below is a depiction of the distribution of respondents by their age. It is clear that the
majority of respondents 49 (41.9%) were in the age category of 30-39 years, followed by two
other age categories, 40-49 and 20-29, which accounted for 35 (29.9%) and 23 (19.7%) of the
sample, respectively. In addition, only 10 respondents (8.5%) indicated that they were in the age
category of 50-59 and there were no respondents that fell in the age category of greater than 60
years.
The data shows that SMEs are mainly driven by the “economically active group”. In Zimbabwe,
government policies such as the Indigenisation and Economic Empowerment Policy together
with the Zimbabwe Agenda for Sustainable Socio-Economic Transformation (ZIMASSET) have
been championing the “economically active group” to be involved in the SME Sector as SMEs
are deemed to be the engine for the nation`s economic growth.
4.2.3 POSITION IN ORGANISATION
The respondents that were mainly targeted by this research study comprised of the Owners,
Chief Executive Officers and Senior Managers considering that they are the ones conversant
with the strategic planning practices in SMEs. In this research study, majority of SMEs’
Table 4.1: Classification by Age
Frequency Percent Valid Percent Cumulative Percent
Valid 20 - 29 23 19.7 19.7 19.7
30 - 39 49 41.9 41.9 61.5
40 - 49 35 29.9 29.9 91.5
50 - 59 10 8.5 8.5 100.0
Total 117 100.0 100.0

positions were occupied by Owners, 47 (40.2
respectively. In contrast, 27 respondents (23.1%) were Chief Executive Officers.
The distribution of the positions held by the respondents
Figure 4.2: Position of Respondents
4.2.4 HIGHEST LEVEL OF EDUCATION
The respondents were asked to identify their highest level of education
showed that university graduates have a considerable presence in the SME Sector.
justified by the fact that 43 (36.
highest qualification, closely followed by 34
The classification of the respondents by virtue of their highest level of education is depict
Figure 4.3 on the next page.
40.2%
23.1%
0%
5%
10%
15%
20%
25%
30%
35%
40%
45%
Owner CEO
Position in Organisation
51
positions were occupied by Owners, 47 (40.2%) followed by Senior Managers 43 (36.8
respectively. In contrast, 27 respondents (23.1%) were Chief Executive Officers.
distribution of the positions held by the respondents is shown in Figure 4.2 on the next page
Figure 4.2: Position of Respondents
4.2.4 HIGHEST LEVEL OF EDUCATION ATTAINED
The respondents were asked to identify their highest level of education and the outcome clearly
showed that university graduates have a considerable presence in the SME Sector.
.8%) of the respondents have an Undergraduate degree
y followed by 34 respondents (29.1%) with Post-Graduate
The classification of the respondents by virtue of their highest level of education is depict
23.1%
36.8%
CEO Senior
Manager
Position in Organisation
Owner
CEO
Senior Manager
Senior Managers 43 (36.8%),
respectively. In contrast, 27 respondents (23.1%) were Chief Executive Officers.
s shown in Figure 4.2 on the next page.
and the outcome clearly
showed that university graduates have a considerable presence in the SME Sector. This is
n Undergraduate degree as their
Graduate degrees.
The classification of the respondents by virtue of their highest level of education is depicted by
Senior Manager

Figure 4.3: Highest Educational
The third significant category constituted of 30 respondents (25.6%)
and merely 10 respondents (8.5%) had a Certificate as their highest level of education. This
statistic points to the fact that graduates from tertiary institutions of higher learning contribute
significantly to the SME Sector.
4.2.5 DISPERSION OF RESPOND
Guided by the database that was obtained from
and Cooperative Development in Zimbabwe
majority of SMEs that participated
followed by those within Tourism and Hospitality Sector (n=24; 20.5
represented sectors were Health and Education, which constituted 17 respondents (14.5%);
Agriculture which consisted of 15 re
which consisted of 12 respondents (12%)
respondents (10.3%). The least represented
comprising of 6 respondents (5.1%).
of Zimbabwe`s SMEs are concentrated in Retail and Tourism and Hospitality sectors
further be inferred that most Zimbabwean SMEs fall within the Retail and Tourism and
Hospitality sectors because of the affordable start up capital required to venture into these
businesses.
36.8%
25.6%
8.5%
52
Educational Qualification
gnificant category constituted of 30 respondents (25.6%) who were
and merely 10 respondents (8.5%) had a Certificate as their highest level of education. This
statistic points to the fact that graduates from tertiary institutions of higher learning contribute
4.2.5 DISPERSION OF RESPONDENTS BY SECTOR
database that was obtained from the Ministry of Small and Medium Enterprises
ment in Zimbabwe, 7 sectors were represented in the sample.
that participated in the study operated in the Retail Sector
followed by those within Tourism and Hospitality Sector (n=24; 20.5%). The moderately
Health and Education, which constituted 17 respondents (14.5%);
h consisted of 15 respondents (12.8%); Transport and Telecommunication,
which consisted of 12 respondents (12%) and Manufacturing, which also constituted 12
The least represented was the Financial and Business S
5.1%). From the results of the study, it can be depicted that most
ncentrated in Retail and Tourism and Hospitality sectors
further be inferred that most Zimbabwean SMEs fall within the Retail and Tourism and
ectors because of the affordable start up capital required to venture into these
29.1%
36.8%
Highest Level of Education
Post-Graduate Degree
Undergraduate Degree
Diploma
Certificate
who were Diploma holders
and merely 10 respondents (8.5%) had a Certificate as their highest level of education. This
statistic points to the fact that graduates from tertiary institutions of higher learning contribute
the Ministry of Small and Medium Enterprises
sectors were represented in the sample. The
Sector (n=29; 24.8%)
%). The moderately
Health and Education, which constituted 17 respondents (14.5%);
; Transport and Telecommunication,
which also constituted 12
was the Financial and Business Services sector
From the results of the study, it can be depicted that most
ncentrated in Retail and Tourism and Hospitality sectors. It can
further be inferred that most Zimbabwean SMEs fall within the Retail and Tourism and
ectors because of the affordable start up capital required to venture into these
Graduate Degree
Undergraduate Degree

Figure 4.4 below illustrates the distribution of the respondents by sector.
Figure 4.4: Classification by Economic Sector
4.2.6 PERIOD OF OPERATION
It was also the essence of this research
that were sampled. The results show that 49 respondents (41.9%) indicated that their
organisation had been in operation
their organisation in operation for a period less than 5 years. In contrast, 24 respondents (20.5%)
indicated that their organisation had operated for 11
highlighted that their organisation operated f
The results are presented in Figure 4.5 overleaf
10.3%
14.5%
5.1%
0.0%
5.0%
10.0%
15.0%
20.0%
25.0%
30.0%
53
Figure 4.4 below illustrates the distribution of the respondents by sector.
Figure 4.4: Classification by Economic Sector
4.2.6 PERIOD OF OPERATION
also the essence of this research study to understand the period of operation for
The results show that 49 respondents (41.9%) indicated that their
in operation for 6-10 years, followed by 38 respondents (3
their organisation in operation for a period less than 5 years. In contrast, 24 respondents (20.5%)
indicated that their organisation had operated for 11-20 years whilst only 6 respondents (5.1%)
highlighted that their organisation operated for a period greater than 21 years.
ults are presented in Figure 4.5 overleaf.
5.1%
20.5%
12.8%
24.8%
12.0%
understand the period of operation for the SMEs
The results show that 49 respondents (41.9%) indicated that their
(32.5%) who had
their organisation in operation for a period less than 5 years. In contrast, 24 respondents (20.5%)
20 years whilst only 6 respondents (5.1%)

Figure 4.5: Period of Operation
The majority of Zimbabwean SMEs have operated for 6
been in operation for a period less than 5
were instituted in the post-dollarisation era, which began in 2009, when the economic turmoil
that had crippled the country of Zimbabwe subsided, and saw the proliferation of the informal
sector. These results are also commensurate with the high failure rate of SMEs
in literature as only few SMEs are able to maintain and sustain consistent growth after start up
(Tsikirayi, 2014; Mazzarol, Reboud & Souter, 2009
4.2.7 NUMBER OF PERMANENT EMPLOYEES
The study also sought to account for the number of permanent employees for the respective
SMEs that participated in the research. The results show that the majority of the SMEs (n=50,
42.7%) employ less than 10 permanent empl
11 and 20 permanent employees (n=36, 30.8%) and those who employ
permanent employees (n=20, 17.1%). In contrast, SMEs that employ between 31 and 40
permanent employees were only 5 (4.3%) wh
permanent employees were 4 (3.4%). Finally, SMEs that employ more than 51 employees (n=2,
1.7%) constituted the small part of the sample.
21%
54
Figure 4.5: Period of Operation
The majority of Zimbabwean SMEs have operated for 6-10 years followed by those who have
been in operation for a period less than 5 years. This is mainly because many existing SMEs
dollarisation era, which began in 2009, when the economic turmoil
that had crippled the country of Zimbabwe subsided, and saw the proliferation of the informal
lts are also commensurate with the high failure rate of SMEs which is indicated
terature as only few SMEs are able to maintain and sustain consistent growth after start up
Mazzarol, Reboud & Souter, 2009; Jocumsen, 2004).
NUMBER OF PERMANENT EMPLOYEES
The study also sought to account for the number of permanent employees for the respective
SMEs that participated in the research. The results show that the majority of the SMEs (n=50,
42.7%) employ less than 10 permanent employees followed by those SMEs that employ between
11 and 20 permanent employees (n=36, 30.8%) and those who employ between 21 and 30
permanent employees (n=20, 17.1%). In contrast, SMEs that employ between 31 and 40
permanent employees were only 5 (4.3%) whilst those SMEs who employ between 41 and 50
permanent employees were 4 (3.4%). Finally, SMEs that employ more than 51 employees (n=2,
1.7%) constituted the small part of the sample.
32%
42%
21%
5%
<5Years
6-10 Years
11-20 Years
>21 Years
10 years followed by those who have
mainly because many existing SMEs
dollarisation era, which began in 2009, when the economic turmoil
that had crippled the country of Zimbabwe subsided, and saw the proliferation of the informal
which is indicated
terature as only few SMEs are able to maintain and sustain consistent growth after start up
The study also sought to account for the number of permanent employees for the respective
SMEs that participated in the research. The results show that the majority of the SMEs (n=50,
oyees followed by those SMEs that employ between
between 21 and 30
permanent employees (n=20, 17.1%). In contrast, SMEs that employ between 31 and 40
ilst those SMEs who employ between 41 and 50
permanent employees were 4 (3.4%). Finally, SMEs that employ more than 51 employees (n=2,
20 Years

55
Table 4.2 below summarises the distribution of respondents on account of the number of
permanent employees in their respective organisations.
Table 4.2: Classification by Number of Permanent Employees
Frequency Percent Valid Percent Cumulative Percent
Valid <10 50 42.7 42.7 42.7
11 - 20 36 30.8 30.8 73.5
21 - 30 20 17.1 17.1 90.6
31 - 40 5 4.3 4.3 94.9
41 - 50 4 3.4 3.4 98.3
>51 2 1.7 1.7 100.0
Total 117 100.0 100.0
4.3 RELIABILITY TEST
For a research instrument to be considered credible it must be valid and reliable (Sandada, 2015).
Therefore, it was deemed imperative to ensure that the questionnaire actually measured what it
was supposed to measure. Reliability test was also conducted to ensure that the questionnaire
could be depended upon to secure consistent results upon repeated application in future research
studies. The procedure that was adopted in both validating the questionnaire as well as testing for
its reliability is explained in the section below.
The validity of the questionnaire was ensured through consulting practitioners and academicians
in the field of strategic planning in order to check for relevancy or ambiguity in the wording of
the questions. In addition the questionnaire was also pilot tested to check for questions that were
not clear or irrelevant. The two-stage verification process helped in the purification of the
instrument.
The reliability of the scale is the degree to which a set of items measure the same construct (Hair
et al, 2010). According to Malhotra (2007), a scale is considered to be reliable if the Cronbach`s
Alpha values are equal to or exceed the recommended threshold of 0.70. From the computation
of the Chronbach’s Alpha, a significantly notable overall statistic was observed for the

56
questionnaire, whilst the alpha statistics for the variables under study was significantly higher
than the minimum threshold of 0.70.
The summarized tables below show the final reliability scores that were obtained after all the 117
questionnaires had been captured in SPSS for analysis.
Table 4.3: Reliability Test Table
Cronbach's Alpha N of Items
Strategic Planning .819 19
Business Performance .767 13
Drivers of Strategic Planning .763 9
The table indicates that the reliability scores for all the variables under study were perfectly
above 0.70 which imply that the scores were acceptable and the research instrument was reliable.
Table 4.4: Reliability Statistics
Cronbach's Alpha No of Variables
.847 3
The overall reliability score as indicated in table 4.4 above was 0.847 and this implies that the
research questionnaire had a good level of internal reliability such that the instrument was
acceptable for data collection.
After ascertaining that the questionnaire which was used was valid and reliable, the study
proceeded by carrying out a normality test. The results of the normality test are presented in the
next section.
4.4 NORMALITY TEST
The normality test can be conducted through either the Shapiro-Wilk test or Kolmogorov-
Smirnov test and the decision on which test to use between these two is based on the sample size
of the research study. The Shapiro-Wilk test is usually appropriate for small sample sizes (<1000
samples) whilst the Kolmogorov-Smirnov handle sample sizes greater than 1000 samples. The

57
normality test establishes how data is distributed. On a normality test, a p value greater than 0.05
(p>0.05) indicates that the data is normally distributed signifying that the sample selected does
not differ significantly from the population of the study and Parametric statistical tests can be
performed using this data. On the other hand, if the p value is less than 0.05 (p<0.05), then the
data is not normally distributed as a result sample differs significantly from the population and
this calls for the performance of Non-Parametric statistical tests on the data.
The sample size of this research study constituted of 117 respondents and the Shapiro-Wilk test
was deemed the most appropriate for normality analysis since the Kolmogrov-Smirnova test is
suitable for very large samples.
Table 4.5 depicts the SPSS analysis of the normality test.
Table 4.5: Tests of Normality
Shapiro-Wilk
Statistic df Sig.
Drivers of Strategic Planning .989 117 .465
Business Performance .992 117 .697
Strategic Planning .984 117 .166
From the analysis, the p-values in the Sig. column portrayed that all the three (3) variables under
study were above 0.05 (p>0.05). In this case, with significance levels greater than 0.05 (p>0.05)
it meant that the data was normally distributed and the Researcher had to use Parametric
statistical tests in analysing the data.
Parametric statistical tests make assumptions about the parameters (defining properties) of the
population distribution from which the data is drawn whilst Non-parametric statistical tests make
no such assumptions (Cooper and Schindler, 2003).

58
After determining the normal distribution of the data, the study went further to establish the
relationship between the variables in order to address the first objective which was stated as
follows:
• To determine if they are any significant differences in strategic planning practices in
respect of sex, level of education and industry among SMEs.
The study adopted the Independent Samples T-test and One-Way Analysis of Variance in
establishing whether there were any significant differences in strategic planning practices in
respect of sex, level of education and industry among SMEs. The results are explained in the
next section.
4.5 T-TESTS
According to Pallant (2005), T-tests are considered as one of the most critical analytical tools in
research. T-tests are used when comparing the values on some continuous variable for two
groups, or on two occasions. When conducting the T-tests if the value in the Sig (2 tailed)
column is equal or less than 0.05 (p≤0.05), then there is a significant difference in the mean
scores of the dependent variable for each of the two groups. If the value is greater than 0.05
(p>0.05), then there is no significant difference between the groups (Pallant, 2005).
4.5.1 INDEPENDENT SAMPLES T-TEST FOR STRATEGIC PLANNING AND SEX
An Independent Samples T-test was conducted to compare the strategic planning practices for
males and females operating in the SME sector. The results of the T-test are shown in tables 4.6
below and 4.7 overleaf.
Table 4.6 Group Statistics
Sex N Mean Std. Deviation
Std. Error Mean
Planning male 79 3.5567 .42831 .04819
female 38 3.7293 .37177 .06031

59
Table 4.7 Independent Samples Test
Levene`s Test for Equality of Variances F Sig
t
df
Sig. (2 tailed)
Equal variances assumed .770 .382 -2.128 115 .035
Equal variances not assumed -2.237 83.232 .028
The results revealed that there was a statistically significant difference in scores for males
[M=3.5567, SD=0.42831] and females [M=3.7293, SD=0.37177; t(115)=-2.128, p=0.035]. In
this study, there was a statistically significant difference in the mean strategic planning scores for
males and females. This claim is presented in table 4.15 above, where the Sig. (2-tailed) value is
0.035 implying that the value falls within the required cut off of less or equal to 0.05 (p≤0.05).
Therefore, it can be concluded that males and females operating within SMEs practice strategic
planning differently.
After establishing that males and females within the SME sector practice strategic planning
differently, the research proceeded to test whether there were any further significant differences
in strategic planning practices with regards to varying levels of education as well as the different
industries in which the respondents operated. In both cases there were more than two groups
being analysed therefore One-Way Analysis of Variance (ANOVA) was adopted. The results of
the analysis of variance on the two conditions are explained in the section to follow.
4.6 ANALYSIS OF VARIANCE
Analysis of variance (ANOVA) is applied when comparing values on some continuous variable
for more than two groups or conditions (Pallant, 2005). One-way between-groups analysis of
variance is used when there is one independent (grouping) variable with three or more levels
(groups) and one dependent continuous variable. According to Pallant (2005), the ‘One-Way’
part of the title indicates that there is only one independent variable, and ‘Between-Groups’
means that there are- different subjects or cases in each of the groups.

60
When conducting the one-way analysis of variance, the Sig. value should be equal or less than
0.05 (p≤0.05) in order to conclude that there is a significant difference among the mean scores of
the dependent variable for each of the three or more groups (Pallant, 2005). If the Sig. value is
greater than 0.05 (p>0.05), then there is no significant difference among the groups.
4.6.1 ONE WAY ANOVA FOR STRATEGIC PLANNING AND LEVEL OF EDUCATION
A one-way analysis of variance was conducted to compare the strategic planning practices across
the different levels of education that were attained by the respondents. The results of the one-way
analysis of variance are shown in tables 4.8 below.
The results from the one-way analysis of variance showed that the Sig. value was 0.141 which is
greater than 0.05 (p>0.05), thereby representing that there is no statistically significant difference
in strategic planning practices among incumbents who attained different levels of education
within the SME sector.
Having ascertained that there is no statistically significant difference in strategic planning
practices in SMEs among incumbents who possess different levels of education, the study
continued with testing whether there was a significant difference in strategic planning practices
across different industries within the SME sector. The findings from the one-way analysis of
variance are presented on the next page.
Table 4.8: ANOVA –Strategic Planning and Level of Education
Sum of Squares df Mean Square F Sig.
Between Groups .947 3 .316 1.854 .141
Within Groups 19.240 113 .170 Total 20.188 116

61
4.6.2 ONE WAY ANOVA FOR STRATEGIC PLANNING AND INDUSTRY
A one-way analysis of variance was conducted to compare the strategic planning practices across
the different industries within the SME sector. The results of the one-way analysis of variance
are shown in tables 4.9 below.
Table 4.9: ANOVA Strategic Planning and Industry
Sum of Squares df Mean Square F Sig.
Between Groups .782 6 .130 .738 .620 Within Groups 19.406 110 .176 Total 20.188 116
The results from the one-way analysis of variance depicted that the Sig. value was 0.620 which is
greater than 0.05 (p>0.05), hence bringing to a conclusion that there is no statistically significant
difference in strategic planning practices among the different industries within the SME sector.
Having dealt with the first objective which was meant to determine whether there were
significant differences in strategic planning practices of SMEs in respect of sex, level of
education and industry, the research study proceeded to focus on the second objective which was
meant to identify the relationship and strength between the perceived driving factors and
strategic planning of SMEs.
The study adopted Correlation analysis and Regression analysis in establishing the existing
relationship between perceived drivers and strategic planning of SMEs. The results are explained
in the next section.
4.7 RELATIONSHIP BETWEEN PERCEIVED DRIVERS AND STRATEGIC
PLANNING
One of the objectives for this research study was to establish the nature of bivariate relationship
that existed between perceived drivers of strategic planning and strategic planning itself among
SMEs. The study identified four variables as the perceived drivers of strategic planning among

62
SMEs namely, Environmental Dynamics; Innovation and Technological Advancement; Business
Ownership Motivations and Globalisation.
4.7.1 CORRELATION ANALYSIS
Pearson`s product-moment correlation coefficient was adopted in testing the correlations
amongst the above mentioned perceived drivers and strategic planning. Correlation analysis
depicts direction, statistical significance and magnitude of relationships. The sign of the
correlation coefficient indicates the direction of the relationship whilst the direction itself
describes whether there is a positive or negative relationship between the variables. The
correlations range from -1.0 for a perfect negative relationship to +1.0 for a perfect positive
relationship (Welman, Kruger, & Mitchell, 2005).
Table 4.10 illustrates the correlation analysis between the four perceived drivers and strategic planning of SMEs.
Table 4.10 Correlation Analysis – Perceived Drivers and Strategic Planning
Strategic Planning
Environmental Dynamism
Business Ownership Motivations
Globalisation
Innovation & Technological Advancement
Strategic Planning 1
Environmental Dynamism
Coefficient Sig. (2-tailed)
.276**
.003
1
Business Ownership Motivations
Coefficient Sig. (2-tailed)
.472**
.000
.102 .272
1
Globalisation
Coefficient Sig. (2-tailed)
.429**
.000
.146 .117
.172 .063
1
Innovation & Technological Advancement
Coefficient Sig. (2-tailed)
.395**
.000
.018 .851
.521**
.000
.103 .270
1
Correlations
**. Correlation is significant at the 0.01 level (2-tailed)

63
In this study all the four perceived drivers of strategic planning (Environmental Dynamism;
Business Ownership Motivations; Globalisation and Innovation & Technological Advancement)
which were under investigation proved to be positively correlated with Strategic Planning and all
the four associations were also statistically significant.
4.7.1.1 ENVIRONMENTAL DYNAMISM AND STRATEGIC PLANNING
The results showed that there is a positive, weak and statistically significant relationship between
Environmental Dynamism and Strategic Planning among SMEs [r=0.276, p<0.01 (p=0.003)].
4.7.1.2 BUSINESS OWNERSHIP MOTIVATIONS AND STRATEGIC PLANNING
Strategic Planning reported a positive, moderate and statistically significant association with
Business Ownership Motivations among SMEs [r=0.472, p<0.01 (p=0.000)].
4.7.1.3 GLOBALISATION AND STRATEGIC PLANNING
The results depicted that there is a positive, moderate and statistically significant relationship
between globalisation and Strategic Planning among SMEs [r=0.429, p<0.01 (p=0.000)].
4.7.1.4 INNOVATION & TECHNOLOGICAL ADVANCEMENT AND STRATEGIC
PLANNING
The results indicated that there is a positive, moderate and statistically significant relationship
between innovation and technological advancement, and strategic planning among SMEs
[r=0.395, p<0.01 (p=0.000)].
Having established the strength of the relationships between the four perceived driving factors
and strategic planning of SMEs, the study proceeded to conduct a regression analysis as
correlation analysis only measure the strength of a relationship but fails to determine predictive
relationship between the variables.
4.7.2 REGRESSION ANALYSIS
Regression analysis was performed to test the predictive relationship between two sets of
constructs; namely, perceived driving factors and strategic planning measures. The four

64
perceived driving factors of strategic planning were used as independent variables and strategic
planning itself was used as a dependent variable.
Table 4.11 below presents the model summary of the regression analysis between the four
perceived driving factors and strategic planning.
Table 4.11: Regression Analysis Model Summary
Model R R Square Adjusted R Square Std. Error of the Estimate
1 .642a .413 .392 .32536
Predictors: (Constant), Innovation, Dynamism, Globalisation, Motivations
From the above analysis, the regression coefficient for the relationship of the four perceived
drivers and strategic planning was 0.642 whilst the corresponding R-square statistic was 0.413.
The value of R-square (0.413) shows that the model is a moderate predictor of the perceived
driving forces of strategic planning among SMEs. This means that Environmental Dynamism,
Business Ownership Motivations, Globalisation and Innovation & Technological Advancement
explain 41.3% of the variation in strategic planning among SMEs. The remaining 58.7% is
explained by other factors that were not included in the study focus.
4.7.2.1 STATISTICAL SIGNIFICANCE OF THE REGRESSION MODEL
Table 4.12: Regression Model Validity
ANOVAa
Model Sum of Squares df Mean Square F Sig.
1 Regression 8.331 4 2.083 19.675 .000b
Residual 11.856 112 .106
Total 20.188 116
a. Dependent Variable: Strategic Planning
b. Predictors: (Constant), Innovation, Dynamism, Globalisation, Motivations
The F-ratio depicted in table 4.12 above was used to test whether the overall regression model
was a good fit for the data. It is given then that the independent variables were statistically
significant in predicting the dependent variable, F (4, 112) = 19.675, p < .05 (p=0.000).
Therefore, the regression model was a good fit for analysing the effect of perceived drivers on
strategic planning of SMEs.

65
4.7.2.2 MODEL COEFFICIENTS
The coefficient analysis gives the beta values (regression coefficients) which measure the extent
of contribution for independent variables to the dependent variable. In this study the focus was
on ascertaining the extent to which Environmental Dynamism, Business Ownership Motivations,
Globalisation and Innovation & Technological Advancement contributed to the adoption of
strategic planning among SMEs. The p-value for each coefficient was also used to determine
whether the relationship between the independent and dependent variable was statistically
significant.
The results showed that:
a) Globalisation makes the most significant contribution to Strategic Planning of SMEs [β =
0.329, p<0.05 (p=0.000)]. The increase in competition as a result of globalisation will
compel SMEs to engage in Strategic Planning.
b) Business Ownership Motivations make the second most significant contribution to
Strategic Planning of SMEs [β = 0.287, p<0.05 (p=0.001)]. Strategic Planning among
SMEs is a direct spin of how the owners of these enterprises are motivated to
strategically plan.
c) Innovation and Technological Advancement make the third most significant contribution
to Strategic Planning of SMEs [β = 0.208, p<0.05 (p=0.016)]. Improvement in innovation
and technology will encourage SMEs to Strategic Plan.
d) Environmental Dynamism makes the least significant contribution to Strategic Planning
of SMEs [β = 0.195, p<0.05 (p=0.009)]. The more the business environment becomes
unpredictable and uncertain the more the SMEs adopt strategic planning.
Table 4.13: Model Coefficients and Statistical Significance of Independent Variables
Model
Unstandardized Coefficients
Standardized Coefficients
t Sig.
Collinearity Statistics
B Std. Error Beta Tolerance VIF
1 (Constant) 1.846 .238 7.761 .000
Dynamism .109 .041 .195 2.658 .009 .971 1.030
Motivations .120 .036 .287 3.338 .001 .709 1.411
Globalisation .154 .035 .329 4.439 .000 .953 1.049
Innovation .119 .049 .208 2.448 .016 .727 1.375
a. Dependent Variable: Strategic Planning

66
4.7.2.2.1 MULTI-COLLINEARITY DIAGNOSTICS
Table 4.13 above shows that there is no problem at all with multi-collinearity. All the values of
the partial and part correlations do not drop sharply from the zero-order correlation. The
computed tolerance is the relative percentage of the variance in a dimension that cannot be
explained by the other dimensions (Zikmund et al., 2014). According to Cooper & Schindler
(2014), when the tolerances tend towards 0 than to 1, there is high multi-collinearity amongst the
variables and the standard error of the regression coefficients will be inflated, but in this study,
all the tolerances tended towards 1 than to 0.
From the foregoing it follows that with regards to the predictor variables:
� [ED] Environmental Dynamism
� [BOM] Business Ownership Motivations
� [GL] Globalisation
� [ITA] Innovation and Technological Advancement
Strategic Planning [SP] can be quantified as:
∴ �� = � + ��� + ���� + � !" + #$%
Where α, β, &, δ and ρ are regression coefficients, and k, is a constant
∴ �� = 1.846 + (0.329 × ��) + (0.287 × ���) + (0.208 × !") + (0.195 × $%)
It can be concluded that Globalisation is the most significant driver to the adoption of strategic
planning among SMEs, followed by Business Ownership Motivations, Innovation and
Technological Advancement, and last but not least Environmental Dynamism.
Apart from establishing the relationships between the perceived driving factors and strategic
planning among SMEs, the third and last objective of this research study was also to ascertain
the impact of strategic planning practices on business performance of SMEs.

67
Therefore, the study also adopted Correlation analysis and Regression analysis in ascertaining
the impact of strategic planning factors on business performance of SMEs and the results of
these analyses are explained in the segment to follow.
4.8 IMPACT OF STRATEGIC PLANNING PRACTICES ON BUSINESS
PERFORMANCE
This study focused on seven strategic planning factors among SMEs namely, Formality of
Strategic Planning; Environmental Scanning; Vision & Mission Statements; Employee
Involvement; Strategy Implementation; Evaluation & Control; and Time Horizon. The study also
sought to ascertain the impact that these seven strategic planning factors exerted on business
performance of SMEs.
4.8.1 CORRELATION ANALYSIS
Correlation analysis is used to describe the strength and direction of the linear relationship
between two variables. The correlations range from -1.0 for a perfect negative relationship to
+1.0 for a perfect positive relationship (Welman, Kruger, & Mitchell, 2005). Pearson`s product-
moment correlation coefficient was adopted in testing the correlations amongst the above
mentioned seven strategic planning factors and business performance.
This research study revealed that all the seven strategic planning factors that were under
investigation (Formality of Strategic Planning; Environmental Scanning; Vision & Mission
Statements; Employee Involvement; Strategy Implementation; Evaluation & Control; and Time
Horizon) were positively correlated with Business Performance. However, out of the seven
strategic planning factors only five associations (Formality of Strategic Planning; Environmental
Scanning; Vision & Mission Statements; Employee Involvement; Strategy Implementation)
proved to be statistically significant with the other two associations (Evaluation & Control; and
Time Horizon) reported to be statistically insignificant.
Table 4.14 overleaf illustrates the Pearson`s product-moment correlation coefficients that were
obtained from the correlation analysis.

68
Table 4.14: Correlation Analysis – Strategic Planning Factors and Business Performance
4.8.1.1 FORMALITY OF STRATEGIC PLANNING AND BUSINESS PERFORMANCE
The results showed that there is a positive, weak and statistically significant relationship between
Formality of Strategic Planning and Business Performance among SMEs [r=0.219, p<0.05
(p=0.018)].
4.8.1.2 ENVIRONMENTAL SCANNING AND BUSINESS PERFORMANCE
The results indicated that there is a positive, strong and statistically significant relationship
between Environmental Scanning and Business Performance among SMEs [r=0.540, p<0.01
(p=0.000)].
Business Performance
Formality Scanning Vision & Mission
Employee Involvement
Strategy Implement
Evaluation & Control
Time Horizon
Business Performance
1
Formality Coefficient Sig.
.219*
.018
1
Scanning Coefficient Sig.
.540**
.000
.395** .000
1
Vision & Mission
Coefficient Sig.
.210*
.023
.165 .075
.206* .026
1
Employee Involvement
Coefficient Sig.
.542**
.000
.237* .010
.369**
.000
.067 .471
1
Strategy Implement
Coefficient Sig.
568**
.000
-.022 .814
.220 .017
.090 .337
.633** .000
1
Evaluation & Control
Coefficient Sig.
.068 .467
-.012 .897
.063 .503
.052 .581
-.067 .470
-.054 .565
1
Time Horizon Coefficient Sig.
.125 .180
-.042 .650
.011 .908
.224 .015
-.070 .453
.073 .432
-.130 .163
1
Correlations
*. Correlation is significant at the 0.05 level (2-tailed).
**. Correlation is significant at the 0.01 level (2-tailed)

69
4.8.1.3 VISION & MISSION STATEMENTS AND BUSINESS PERFORMANCE
The results showed that there is a positive, weak and statistically significant association between
Vision and Mission Statements, and Business Performance among SMEs [r=0.210, p<0.05
(p=0.023)].
4.8.1.4 EMPLOYEE INVOLVEMENT AND BUSINESS PERFORMANCE
The results revealed that there is a positive, strong and statistically significant association
between Employee Involvement and Business Performance among SMEs [r=0.542, p<0.01
(p=0.000)].
4.8.1.5 STRATEGY IMPLEMENTATION AND BUSINESS PERFORMANCE
The results showed that there is a positive, strong and statistically significant relationship
between Strategy Implementation and Business Performance among SMEs [r=0.568, p<0.01
(p=0.000)].
4.8.1.6 EVALUATION & CONTROL AND BUSINESS PERFORMANCE
The results portrayed that there is a weak positive correlation between Evaluation and Control,
and Business Performance among SMEs. However, the results also showed that the relationship
between Evaluation and Control, and Business Performance among SMEs has no statistical
significance [r=0.068, p>0.05 (p=0.467)].
4.8.1.7 TIME HORIZON AND BUSINESS PERFORMANCE
The results indicated that there is a weak positive correlation between Time Horizon and
Business Performance among SMEs. However, the results also showed that the association
between Time Horizon and Business Performance among SMEs has no statistical significance
[r=0.125, p>0.05 (p=0.180)].
After ascertaining the strength of the relationships between the seven strategic planning factors
and business performance of SMEs, the study continued on identifying the predictive
relationship between these two variables through Regression analysis. Results of the regression
analysis are explained in the next section.

70
4.8.2 REGRESSION ANALYSIS
Regression analysis was performed to test the predictive relationship between two sets of
constructs; namely, strategic planning factors and business performance measures. The seven
strategic planning factors were used as independent variables and business performance
measures were used as the dependent variable.
Table 4.15 below presents the model summary of the regression analysis between the seven
strategic planning factors and business performance.
Table 4.15: Regression Analysis Model Summary
Model R R Square Adjusted R Square Std. Error of the Estimate
1 .735a .540 .510 .39319
Predictors: (Constant), Horizon, Scanning, Control, Implementation, Vision, Formality, Involvement
The results showed that the regression coefficient for the association of the seven strategic
planning factors and business performance was 0.735 whilst the corresponding R-square statistic
was 0.540. The value of R-square (0.540) shows that the model is a good predictor of the
strategic planning factors among SMEs. This implies that Formality of Strategic Planning,
Environmental Scanning, Vision & Mission Statements, Employee Involvement, Strategy
Implementation, Evaluation & Control and Time Horizon explain 54% of the variation in
Business Performance among SMEs. The remaining 46% is explained by other factors that were
not included in the study.
4.8.2.1 STATISTICAL SIGNIFICANCE OF THE REGRESSION MODEL
Table 4.16: Regression Model Validity
ANOVAa
Model Sum of Squares df Mean Square F Sig.
1 Regression 19.753 7 2.822 18.253 .000b
Residual 16.851 109 .155
Total 36.604 116
a. Dependent Variable: Business Performance
b. Predictors: (Constant), Horizon, Scanning, Control, Implementation, Vision, Formality, Involvement

71
The F-ratio in the ANOVA table above was used to test whether the overall regression model
was a good fit for the data. It is given then that the independent variables were statistically
significant in predicting the dependent variable, F (7, 109) = 18.253, p < .05 (p=0.000).
Therefore, the regression model was a good fit for analysing the effect of strategic planning
factors on business performance of SMEs.
4.8.2.2 MODEL COEFFICIENTS
One of the focal points of this study was to identify the impact of Formality of Strategic
Planning, Environmental Scanning, Vision & Mission Statements, Employee Involvement,
Strategy Implementation, Evaluation & Control and Time Horizon on Business Performance
among SMEs. The p-value for each coefficient was used to determine whether the relationship
between the independent and dependent variable was statistically significant.
The beta coefficients revealed that Strategy Implementation makes the greatest impact to the
Business Performance of SMEs [β = 0.370, p<0.05 (p=0.000)], followed by Environmental
Scanning [β = 0.360, p < 0.05 p=0.000)]. However, Employee Involvement [β = 0.175, p > 0.05
(p=0.059)], Time Horizon [β = 0.107, p > 0.05 (p=0.112)], Evaluation and Control [β = 0.089, p
>0.05 (p=0.185)], Vision and Mission Statements [β = 0.055, p >0.05(p=0.425)] and Formality
of Strategic Planning [β =0.039, p >0.05(p=0.594)] showed statistically insignificant contribution
to Business Performance of SMEs.
Table 4.17: Model Coefficients and Statistical Significance of Independent Variables
Model
Unstandardized Coefficients
Standardized Coefficients
t Sig.
Collinearity Statistics
B Std. Error Beta Tolerance VIF
1 (Constant) .469 .373 1.257 .211
Formality .030 .057 .039 .534 .594 .775 1.290
Scanning .241 .051 .360 4.758 .000 .737 1.357
Vision .032 .040 .055 .801 .425 .889 1.125
Involvement .112 .059 .175 1.909 .059 .500 1.250
Implementation .292 .069 .370 4.234 .000 .552 1.813
Control .066 .049 .089 1.335 .185 .960 1.041
Horizon .056 .036 .107 1.561 .122 .901 1.110
a. Dependent Variable: Business Performance

72
Whilst these five factors (Formality of Strategic Planning, Vision and Mission Statements,
Employee Involvement, Evaluation & Control and Time Horizon) depicted a statistically
insignificant contribution to Business Performance of SMEs, they however showed a positive
relationship with Business Performance of SMEs.
4.8.2.2.1 MULTI-COLLINEARITY DIAGNOSTICS
Table 4.17 above depicts that there is no problem with multi-collinearity. All the values of the
partial and part correlations do not drop sharply from the zero-order correlation. The computed
tolerance is the relative percentage of the variance in a dimension that cannot be explained by the
other dimensions (Zikmund et al., 2014). According to Cooper & Schindler (2014), when the
tolerances tend towards 0 than to 1, there is high multi-collinearity amongst the variables and the
standard error of the regression coefficients will be inflated, but in this study, all the tolerances
tended towards 1 than to 0.
From the obtained results it follows that with regards to the predictor variables:
� [ES] Environmental Scanning
� [SI] Strategy Implementation
Business Performance [BP] can be quantified as:
∴ �� = � + �� + �$�
� Where α and β are regression coefficients, and k, is a constant
� ∴ �� = 0.469 + (0.370 × � ) + (0.360 × $�)
It can be concluded that Strategy Implementation, has the most significant impact on Business
Performance of SMEs, followed by Environmental Scanning.
The Researcher performed T-tests, analysis of variance (ANOVA), correlation analysis and
regression analysis in an endeavour to address the three secondary objectives of this research
study. Furthermore, this research study sought to test and validate the two hypotheses that were
formulated from the review of literature. The data that was collected from the SMEs within the
Harare Metropolitan Province, Zimbabwe was used for hypothesis testing and the results are
discussed in the next section.

73
4.9 DISCUSSION OF FINDINGS
The first hypothesis (H1) predicted that perceived driving factors have a positive influence on
the adoption or practice of strategic planning among SMEs. The empirical results from this
current study confirmed this hypothesis in a significant way. This study confirmed the validity of
the four perceived drivers of strategic planning among SMEs (Environmental Dynamism,
Business Ownership Motivations, Globalisation and Innovation & Technological Advancement)
that were found in literature. From the study`s results it can be deduced that of the four perceived
driving factors which were investigated, globalisation [β = 0.329, p<0.05 (p=0.000)] posed the
greatest positive influence in compelling SMEs to practice strategic planning. This finding is
consistent with Govindarajan & Gupta (2000) who confirmed that globalisation and its
associated growing competition is heavily contributing in pushing organisations to engage in
more strategic planning. The results also demonstrated that business ownership motivations [β =
0.287, p<0.05 (p=0.001)] had the second most contributing influence on the adoption of strategic
planning by SMEs. From the findings of this research it can be inferred that strategic planning
among SMEs is a direct spin of how the owners of these enterprises are motivated to strategically
plan. This is also supported in the study carried out by Wang, Walker and Redmond (2006)
which confirmed that business ownership motivations had a significant influence on how
organisations strategically plan.
The outcome of this research also revealed that innovation and technological advancement [β =
0.208, p<0.05 (p=0.016)] play a significant part in compelling SMEs to engage in strategic
planning. This outcome is supported by Mazzarol (2008) who argued that the fast spreading of
new technology require firms to engage more strategic level planning. Lastly, this research study
also demonstrated that the more the business environment is dynamic and uncertain [β = 0.195,
p<0.05 (p=0.009)] the more likely it is for SMEs to adopt strategic planning practices. This
evidence is also in line with a study conducted by Stopford (2001) who found that the degree and
complexity of a changing business environment is driving firms to engage in strategic planning.
Kraus et al (2006) were also in support of Stopford`s study when they noted that increasing
environmental dynamism, complexity and uncertainty are compelling almost every organisation
to adopt strategic planning.

74
The second hypothesis (H2) predicted that the adoption or practice of strategic planning has a
positive impact on the business performance of SMEs. The results from this research study
partially confirmed this claim. The outcome revealed that there is a positive correlation between
the seven strategic planning factors which were investigated (Formality of Strategic Planning,
Environmental Scanning, Vision & Mission Statements, Employee Involvement, Strategy
Implementation, Evaluation & Control and Time Horizon) and business performance. Similar
findings about the positive correlation between strategic planning and business performance are
reported by other scholars such as Mcllquham-Schmidt (2010); Arasa and K’Obonyo (2012).
Furthermore, this study depicted that out of the seven strategic planning factors which were
under investigation, only two namely, strategy implementation SMEs [β = 0.370, p<0.05
(p=0.000)] and environmental scanning [β = 0.360, p<0.05 p=0.000)] had a statistically
significant relationship with business performance. This in literature is supported Karami (2008),
whose study found that in today’s high levels of competition, and uncertainty, businesses scan
the environment to improve their competitiveness. Popoola’s (2000) study of corporate banks in
Nigeria also revealed that environmental scanning enables banks to gain competitive advantage.
Ehlers and Lazenby (2006) posit that effective strategy implementation is a necessary condition
for the success of businesses. Okumus (2003) also asserts that successful strategy
implementation leads to business success. Therefore, it can be deduced that for SMEs to enhance
their business performance they need to largely engage in environmental scanning and ensure
effective strategy implementation.
Despite the fact that other five factors of strategic planning (Formality of Strategic Planning,
Vision & Mission Statements, Employee Involvement, Evaluation & Control and Time Horizon)
showed statistically insignificant relationships with business performance, these factors however
did not show a negative relationship with business performance. There is convincing evidence
from the literature that depict the positive association between these five factors and business
performance. Kraus et al. (2006) affirms that formalised strategic plans help a business to
achieve goals and to grow. With regard to business mission and vision, Forbes and Seena (2006),
Mazzarol, Rebound, and Soutar (2009), and Kantabutra (2008) confirm that a business mission
and vision statement enhances business performance as it guides in decision-making, and

75
motivates and inspires personnel. Concerning employee participation in strategic planning,
Gadiesh and Gilbert (2001) and Speculand (2009) assert that employee participation in strategic
planning leads to employee motivation and ensure unity of purpose and cooperation in the
business. In respect of evaluation and control, Pearce and Robinson (2005) posit that constant
monitoring and control of the implemented strategies will enable organisations to check on their
progress and correct deviations in a timely and cost-effective way. Moreover, a study by Dincer
et al. (2006) on strategic planning of Turkish firms confirms the importance of time horizon of
strategic planning in contributing to business performance.
The outcomes of the Hypothesis Testing are depicted in Table 4.18 below:
Table 4.18: Hypothesis Testing and Outcomes
Hypothesis Decision
H1: Perceived drivers have a positive influence on the adoption or practice of strategic planning among SMEs.
Hypothesis Accepted
H2: The adoption or practice of strategic planning has a positive impact on business performance of SMEs.
Hypothesis Partially Accepted
4.10 CHAPTER SUMMARY
This chapter presented an analysis of the research’s findings. The presentation of the findings
was done using tables and figures in order to openly bring out the salient issues from the study.
This study found that there is positive and statistically significant relationship between the
perceived drivers (environmental dynamism, business ownership motivations, globalisation and
innovation) and strategic planning among SMEs. All the four perceived drivers of strategic
planning of ERM were found to be relevant although they depicted a varying magnitude of
contribution. Furthermore, this study concluded that environmental scanning and strategy
implementation were the two main important factors of strategic planning that had a positive
impact on business performance of SMEs. The next chapter presents the conclusions and
recommendations of this study based on the findings explained in this chapter.

76
CHAPTER FIVE
CONCLUSIONS AND RECOMMENDATIONS
5.0 INTRODUCTION
The previous chapter focused on presentation, analysis and interpretation of the empirical
findings of the study. This chapter draws inferences and conclusions from the major findings that
were discussed in the previous chapter. Conclusions will be discussed based on the study`s
objectives which were set out in chapter one and on the basis of a theoretical framework that was
modeled from the literature review. The discussion on conclusions will be followed by
recommendations whose primary focus is on improving key areas which were identified in the
findings. Managerial implications as well as theoretical implications will also be presented. Last
but not least, contained in this chapter, are the limitations of the current study together with areas
that warrant further research.
5.1 SUMMARY OF FINDINGS AND CONCLUSIONS
The overall objective of this study was to determine the antecedents of strategic planning
practices and the business performance outcomes of strategic planning among SMEs. The study
also sought to ascertain if statistically significant differences exist in strategic planning practices
among SMEs in respect of sex, level of education and industry.
5.1.1.1 STRATEGIC PLANNING PRACTICES IN RESPECT OF SEX
The study findings revealed that the majority of owners and managers among SMEs were males
(67.5%) compared to females (32.5%). The Independent Samples T-test as depicted on Table 4.7
revealed that there exist statistically significant differences in the way SME male and female
owners/managers practice strategic planning.
77
From this outcome it is plausible to infer that owners and managers of SMEs are influenced by
their differing gender perceptual processes in selecting strategic planning practices in today`s
dynamic business environment.
5.1.1.2 STRATEGIC PLANNING PRACTICES IN RESPECT OF LEVEL OF
EDUCATION
The study showed that university graduates have a considerable presence in the SME Sector.
This was justified by the fact that 43 (36.8%) of the respondents had Undergraduate degrees as
their highest qualification, closely followed by 34 respondents (29.1%) who had Post-Graduate
degrees. The overriding conclusion is that the informal sector through SMEs is playing a
fundamental role in absorbing educated and qualified people who are failing to get employment
in the formal sector.
The One-Way Analysis of Variance shown in Table 4.8 indicates that there are no statistically
significant differences in the strategic planning practices even though they possess different
educational qualifications. Therefore as depicted by the results, the incumbents operating in the
SME sector share similar strategic planning practices regardless of the varying levels of
education that they attained.
5.1.1.3 STRATEGIC PLANNING PRACTICES IN RESPECT OF INDUSTRY
The study findings indicated that SMEs belonging to different industries are predominantly using
similar strategic planning practices in their businesses as shown by One-Way Analysis of
Variance in Table 4.9. This may be due to the perceived importance of strategic planning on the
performance of business by SME owners and managers operating in different sectors of the
Zimbabwean economy.

78
5.1.2 INFLUENCE OF PERCEIVED DRIVING FACTORS ON STRATEGIC PLANING
The review of available literature in chapter two of this study revealed that there are four
perceived drivers of strategic planning among SMEs, namely, environmental dynamism,
business ownership motivations, globalisation and innovation & technological advancement. The
findings revealed that all the four perceived drivers which were under investigation had positive
and statistically significant influence on strategic planning. Regression analysis in Table 4.11
also established that the four perceived drivers (environmental dynamism, business ownership
motivations, globalisation and innovation & technological advancement) were responsible for
41.3% of the variation in strategic planning among SMEs. This was also supported by the
positive correlations between the four perceived drives and strategic planning as revealed in
Table 4.10.
From the findings of this study, it can be concluded that globalisation has the greatest influence
on the adoption or practice of strategic planning among SMEs, followed by business ownership
motivations. Environmental dynamism has the least influence on the adoption or practice of
strategic planning among SMEs followed by innovation and technological advancement. Basing
on the analysis of results, this research study accepted the null hypothesis and concluded that
perceived driving factors have a positive influence on the adoption or practice of strategic
planning among SMEs.
5.1.3 IMPACT OF STRATEGIC PLANNING FACTORS ON BUSINESS PERFORMANCE
After investigating the association between the perceived driving factors and strategic planning,
the research study also sought to ascertain the impact of strategic planning factors on business
performance of SMEs. Regression analysis as shown in Table 4.15 revealed that the seven
strategic planning factors which were being investigated were responsible for 54 % of the
variation in business performance of SMEs. From the Correlation analysis depicted in Table
4.14, positive and statistically significant associations were established between five strategic
planning factors (formality of strategic planning, environmental scanning, vision & mission
statements, employee involvement and strategy implementation) and business performance.
Table 4.14 also show that time horizon and evaluation & control are positively correlated with

79
business performance of SMEs although the two associations are statistically insignificant. In
contrast, Regression analysis as depicted in Table 4.17 revealed that of the seven strategic
planning factors only two (environmental scanning and strategy implementation) were
ascertained to have a statistically significant impact on business performance of SMEs. The two
pertinent strategic planning factors which characterise the business performance of SMEs that
emerged from this study are also supported in other studies and scholars for example,
environmental scanning (Jorosi, 2008) and strategy implementation (Nah et al, 2001).
This study suggests that if SMEs practice or adopt strategic planning, they will be able to assess
their environment, adjust their strategies, cushion themselves from the dynamic environment,
and hence improve their performance. From the results it can also be inferred that increased
environmental scanning and strategy implementation lead to high levels of business
performance. Relying on the results obtained, this research study partially accepted the null
hypothesis that strategic planning factors have a positive impact on business performance of
SMEs.
5.2 EMPIRICAL AND THEORETICAL CONTRIBUTION
The research study endeavoured to provide both academic and practical contributions to the
existing body of literature on strategic planning practices and business performance of SMEs. On
the academic side, the study contributed fundamental literature to the often neglected research
area of business management among SMEs within a developing country. The study also seeks to
provide empirical evidence to substantiate other researches that were conducted especially in the
developed countries.
The study corroborated the findings from other researches concerning the validity of four
perceived driving factors of strategic planning among SMEs. The four driving factors of strategic
planning whose validity was confirmed are environmental dynamism, business ownership
motivations, globalisation and innovation & technological advancement. Also in line with
existing literature the study confirmed the prominence of strategic planning practices as the
forerunner to improved business performance among SMEs. Furthermore, the research advanced

a conceptual framework based on the
illustrated the strength, statistical significance and the relationships amongst the perceived
driving factors, strategic planning f
Figure 5.1 below and Figure 5.2 overleaf present the initial conceptual framework modelled from
the literature review and the revised conceptual framework, respectively.
Figure 5.1: Initial Conceptual Framework
80
a conceptual framework based on the context of Zimbabwean SMEs. The conceptual framework
illustrated the strength, statistical significance and the relationships amongst the perceived
driving factors, strategic planning factors and business performance of Zimbabwean SMEs.
and Figure 5.2 overleaf present the initial conceptual framework modelled from
the literature review and the revised conceptual framework, respectively.
Figure 5.1: Initial Conceptual Framework
context of Zimbabwean SMEs. The conceptual framework
illustrated the strength, statistical significance and the relationships amongst the perceived
actors and business performance of Zimbabwean SMEs.
and Figure 5.2 overleaf present the initial conceptual framework modelled from
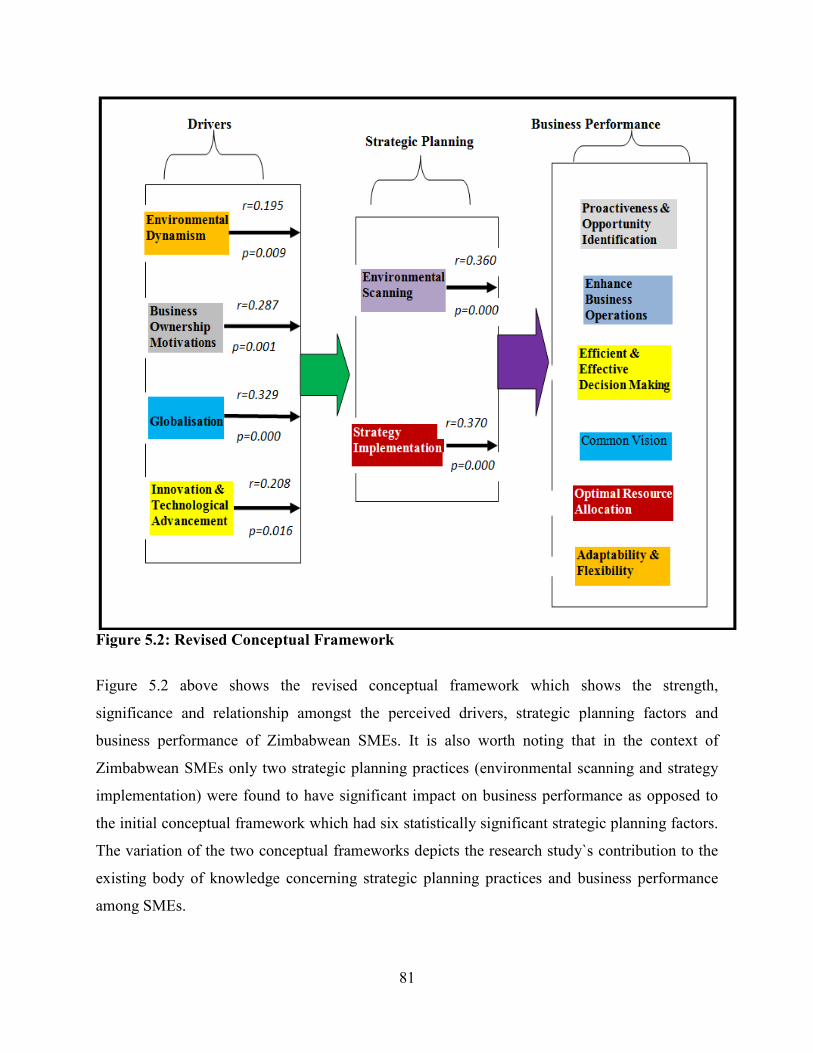
Figure 5.2: Revised Conceptual Framework
Figure 5.2 above shows the revised conceptual framework which shows the
significance and relationship amongst the perceived drivers, strategic planning factors
business performance of Zimbabwean SMEs.
Zimbabwean SMEs only two strategic planning practices (environmental scanning and strategy
implementation) were found to have significant impact on business perfor
the initial conceptual framework
The variation of the two conceptual frameworks depicts the research study`s contribution to the
existing body of knowledge concerning s
among SMEs.
81
Figure 5.2: Revised Conceptual Framework
shows the revised conceptual framework which shows the
and relationship amongst the perceived drivers, strategic planning factors
business performance of Zimbabwean SMEs. It is also worth noting that in the context of
Zimbabwean SMEs only two strategic planning practices (environmental scanning and strategy
were found to have significant impact on business performance
ramework which had six statistically significant strategic planning factors.
The variation of the two conceptual frameworks depicts the research study`s contribution to the
existing body of knowledge concerning strategic planning practices and business performance
shows the revised conceptual framework which shows the strength,
and relationship amongst the perceived drivers, strategic planning factors and
orth noting that in the context of
Zimbabwean SMEs only two strategic planning practices (environmental scanning and strategy
mance as opposed to
which had six statistically significant strategic planning factors.
The variation of the two conceptual frameworks depicts the research study`s contribution to the
trategic planning practices and business performance

82
5.3 MANAGERIAL AND POLICY RECOMMENDATIONS
The SME sector is deemed the engine for economic growth and a major source of employment in
Zimbabwe such that this study has useful implications for business owners, professionals and
academicians. This study examined the influence of the perceived driving factors on the adoption
or practice of strategic planning among SMEs and also investigated the impact of the strategic
planning factors on business performance of these small to medium business entities.
Recommendations can be drawn from the findings of the study and if they are seriously taken
into consideration by the relevant authorities they might bring the necessary changes which will
consequently improve business performance of SMEs.
At the time of this study, Zimbabwean SMEs were at the backdrop of being characterised by
high attrition rate. The study established that strategic planning factors lay the foundation to
improved business performance. It is imperative for SME owners and managers to have an
appreciation as well as to understand the strategic planning factors because it will help them
discern on which factors to apply in improving the performance of their businesses. The results
indicate that environmental scanning and strategy implementation are the two most influential
strategic planning dimensions that improve business performance of Zimbabwean SMEs.
Therefore, small business owners and managers in the SME sector could improve their business
performance by unconditionally prioritising environmental scanning and strategy
implementation.
Business environment is continuously being engulfed with volatility, turbulence and uncertainty
a condition now requiring owners and managers to judicially scan the environment.
Environmental scanning will assist business entities to gather relevant information that is useful
in strategic planning (Karami, 2008). The formulated strategic plans are only as good as their
implementation which emphasizes the strong need for owners and managers to consciously think
through how they will implement the planned strategies for improved performance. The fact that
environmental scanning and strategy implementation strongly influence business performance
implies that SME owners and managers should augment these two capabilities in order for them
to achieve successful business strategies.

83
The nation`s high attrition rate of SMEs has been regarded retrogressive by various sectors of the
economy such that there is now growing importance on entrepreneurship towards the socio-
economic development of Zimbabwe. It is against this backdrop that the government of
Zimbabwe is being recommended to assist SMEs by providing training on basic strategic
planning education which will consequently improve the skills and knowledge of SME owners
and managers. This can be realised through funded or subsidised workshops, short courses,
flexible university or college courses. Policy makers and academicians are also recommended to
assist SME owners and managers through drafting education programmes that will train this
targeted group on strategic planning.
In summary, this research study submits that in light of environmental dynamism, business
ownership motivations, globalisation and innovation & technological advancement, SME owners
and managers can successfully enhance their business performance by prioritising environmental
scanning and strategy implementation. Ultimately, enhanced business performance is expected to
generate more revenue for SMEs and hence, boost their profitability and chances of survival
especially in Zimbabwe`s challenging economic circumstances.
5.4 RESEARCH LIMITATIONS
Despite the fact that the current research study offers fruitful insights in respect of the strategic
planning practices and business performance of SMEs, it is not devoid of its own limitations.
The study only focused on Zimbabwean SMEs operating within the Harare Metropolitan
Province and this could present a potential drawback in terms of generalising the results to other
SMEs in the country as they could have different views about strategic planning and business
performance. Furthermore, the study only utilised owners and managers of SMEs as the key
informants during data collection and this is regarded a limitation in that the research could have
yielded biased results.
The fact that quantitative approach was adopted for this study also present some limitations in
the form of the research instrument (structured self administered questionnaire) that was used to
solicit the required information from respondents. Although the researcher had attempted to

84
design the study questionnaire in such a way that each variable under investigation had as much
information or questions as possible, structured close-ended questions inevitably restrict the
researcher to further probe for in-depth information from the respondents.
In addition, the research was carried out on limited time constraint (six months) such that cross-
sectional survey data was employed to test the proposed hypotheses yet a deeper understanding
of the relationships among the identified scale dimensions could have been obtained if
longitudinal survey data was used.
Another restraint was that some respondents were not comfortable to release information which
they classified as confidential in their operations. The hurdle was circumvented by assuring
respondents that all information gathered would be kept confidential and was for academic
purposes only. Furthermore, no identification information was required on the questionnaire as a
means of assuring respondents’ anonymity hence privacy.
5.5 AREAS OF FURTHER STUDY
From the findings and research limitations, it is recommended that future researches should
conduct a similar study in other provinces within Zimbabwe or in other countries in order to
examine the similarities and differences. Replication of this study is therefore warranted within
the SME industry in order to test the validity and reliability of the scales which were adopted.
This study examined SMEs within different sectors such it will be an interesting extension of the
study if future research is conducted to investigate the relationships among strategic planning
practices and business performance of SMEs within a specific sector as the findings will be more
focused and specific to a particular industry. In addition, future research may also consider
conducting comparative studies in respect of strategic planning practices between Zimbabwean
SMEs and SMEs from another developing country.

85
5.6 CHAPTER SUMMARY
This research study examined the relationships amongst the perceived driving factors, strategic
planning practices and business performance of Zimbabwean SMEs operating within Harare
Metropolitan Province. The results indicate that the four main driving factors of strategic
planning in their order of importance are globalisation, business ownership motivations,
innovation & technological advancement and environmental dynamism. Furthermore, the results
indicated that seven strategic planning factors (formality of strategic planning, environmental
scanning, vision & mission statements, employee participation, strategy implementation,
evaluation & control and time horizon) had a positive relationship with business performance of
SMEs. The study also confirmed that of these seven strategic planning factors, only
environmental scanning and strategy implementation make a statistically significant impact on
business performance of SMEs. Therefore, it is important for SMEs to prioritise scanning of the
environment and implementation of the planned strategies in order to enhance their business
performance. Through the adoption or practice of strategic planning, Zimbabwean SMEs may
continue to play an increased economic role as they will be cushioned from the dynamic, highly
competitive and unstable business environment.

86
REFERENCES
Al Ghamdi, S.M., 2005. The Use of Strategic Planning Tools and Techniques in Saudi Arabia: An Empirical Study. International Journal of Management, 22(3), pp. 376-395.
Al-Shammari, H.A. & Hussein, R.T., 2007. Strategic Planning Firm Performance Linkage: Empirical Investigation From An Emergent Market Perspective. Advances in
Competitiveness Research.
Ayyagari, M., Demirguic-Kunt, A. & Maksinmovic, V., 2011. Small vs Young Firms Across The
World - Contribution to Employment, Job Creation and Growth. Policy Working
Paper, 5611, The World Bank Development Research Group.
Babbie, E. & Mouton, J., 2002. The Practice of Social Research. Cape Town: Oxford University Press.
Balasundaram, N., 2009. Incidence of Strategic Planning in Small Business: An Overview, Sri
Lanka: University of Juffna. Department of Commerce.
Bryman, A. & Bell, E., 2007. Business Research Methods. 2nd ed. Oxford: Oxford University
Press.
Cohen, L. & Morrison, K., 2011. Research Methods in Education. 7th ed. London: Routledge.
Confederation of Zimbabwe (CZI), 2012. Annual CZI Manufacturing Sector Survey.
Cooper, D.R. & Schindler, P.S., 2014. Business Research Methods. Boston: Irwin McGraw Hill.
Creswell, J.W., 2008. Research Design: Qualitative, Quantitative and Mixed Methods Approaches., London: Sage Publications.
Dansoh, A., 2005. Strategic Planning Practices of Construction Firms in Ghana.. Construction
Management & Economics, Volume 23, pp. 163-168.
David, F.R., 2003. Strategic Management: Concepts and Cases. New Jersey: Pearson Education.
Delmar, F. & Shane, S., 2003. Does Business Planning Facilitates The Development Of New Ventures?. Strategic Management Journal, 24(12), pp. 1165-1185.

87
Dempsey, P. & Dempsey, A., 2000. Using Nursing Research. 5th ed. Baltimore: Lippincott.
Desai, A., 2000. Does Strtaegic Planning Create Value? The Stock Market`s Belief. Management
Decision Journal, 38(10), pp. 685-693.
Dincer, O., Tatoglu, E. & Glaister, K.W., 2006. The Strategic Planning Process: Evidence From Turkish Firms. Management Research News, 29(4), pp. 206-219.
Dubihlela, J. & Sandada, M., 2014. Impact of Strategic Planning in Small and Medium
Enterprises (SMEs) Performance: The Role of Employee Participation, Implementation Incentives and Evaluation & Control. Journal of Economics, 5(1), pp. 45-55.
Ehlers, T. & Lazenby, K., 2006. Strategic Management: Sourthern African Concepts and Cases. Pretoria: Van Schaik Publishers.
Fisher, C., 2010. Researching & Writing a Dissertation: An Essential Guide for Business Students. 3rd ed. England: Pearson Education Limited.
Forbes, D.J. & Seena, S., 2006. The value of a mission statement in an association of not-for- profit hospitals. Journal of Health Care Quality Assurance, 19(5), pp. 400-419.
Fraser, D.L. & Stupak, R.J., 2002. A Synthesis of the Strategic Planning Process with the Principles of Learning, Leading and Linking. International Journal of Public
Administration, 29(9), pp. 1199-1220.
French, J.S., Kelly, S. & Harrison, J., 2004. The Role of Strategic Planning in the Performance
of Small Professional Services Firms. Journal of Management Development,
23(8), pp. 765-776.
Gavetti, G., Levinthal, D. & Rivkin, J., 2004. Strategy Making in Novel and Complex Worlds: The Power of Analogy. Strategy Management Journal, 26(8), pp. 691-712.
Geissler, C. & Krys, C., 2013. 'The Challenges of Strategic Management in the Twenty-First Century'. B. Schwanker, T. Wulf (eds), Scenario-Based Strategic Planning,
Roland Berger School of Strategy and Economics.

88
Gibson, N.A., 2007. The Informal Sector in Kenya. A Presented at the Youth Micro Finance Forum Held at the University of Nairobi on 12 October 2007.
Harwell, M.R., 2011. 'Research Design in Qualitative/Quantitative/Mixed Methods' in The SAGE Handbook for Research in Education, Pursuing Ideas as the Keystone of
Exemplary Inquiry, Clifton, F.C and Ronald, C. (eds), pp. 147-163.
Hitt, M.A., Bierman, L., Shimizu, K. & Kochhar, R., 2001. Direct and Moderating Effects of Human Capitalon Strategy and Performance in Professional Service Firms: A
Resource-Based Perspective. The Academy of Management Journal, 44(1), pp. 13-28.
Hodgetts, R.M. & Kuratko, D.F., 2001. Effective Small Business Mangaement. Dryden: Fort Worth, TX. Hofstee, E., 2006. Constructing A Good Dissertation: A Practical Guide for Finishing a Master`s, MBA or PHD on Schedule, Johannesburg: EPE.
Huang, C.J., 2006. Strategic Planning and Dysfunction: The Dark Side of Mandating a Formal Planning System. Soochow Journal of Political Science , Volume 22, pp. 47-71.
Hunger, J.D. & Wheelen, T.L., 2007. Essentials of Strategic Management. 4th ed. New Jersey: Pearson Education.
Jennings, D. & Disney, J., 2006. Designing The Strategic Planning Process: Does Psychological Tyoe Matter. Management Decision Journal, 44(5), pp. 598-614.
Johnson, R.B. & Onwuegbuzie, A.J., 2004. Mixed Methods Research: A Paradigm Whose Time Has Come. American Educational Research Association, 33(7), pp. 14-26.
Kantabutra, S. & Avey, C.A., 2010. The Power of Vision: Statements That Resonate. Journal of
Business Strategy, 31(1), pp. 37-45.

89
Karami, A., 2008. An Investigation on Environmental Scanning and Growth Stratefy in High Tech Small and Medium Sized Enterprises: Paper Read at the High Technology
Firms Conference Held at the University of Twente between 21 and 23 May 2008.
Twente.
Kauffman, C., 2008. Financing of SMEs in Africa. Policy Insight No. 7. African Economic Outlook 2004/2005. pg 8-9.
Kraus, S., Harms, R. & Schwarz, E.J., 2006. Strategic Planning in Smaller Enterprises- New Empirical Findings. Management Research News, 29(1), pp. 334-344.
Kumar, R., 2005. Research Methodology- A Step by Step Guide for Beginners. Sage Publications.
Leedy, P.D., 2005. Practical Research - Planning and Design. Pearson Prentice Hall.
Lobontiu, G., 2002. Strategies and Strategic Management in Small Business- MPP Working Paper, 15 Copenhagen, Copenhagen Business School. Department of
Management, Politics and Philosophy.
Mazzarol, T., Rebound, S. & Soutar, G.N., 2009. Strategic Planning in Growth Oriented Small Firms. Journal of Entrepreneurial Behaviour and Research, 15(4), pp. 320-345.
Ministry of Industry and Commerce, Government of Zimbabwe, 2012. Trade and Investment.
Morris, M.H., Kuratko, D.F. & Covin, J.G, 2008. Corporate Entrepreneurship and Innovation.
Thompson South-Western.
Morse, J.M., Swanson, J. & Kuzel, A.J., 2001. The Nature of Qualitative Evidence.Sage Publications.
Neuman, W.L., 2000. Social Research Methods: Qualitative and Quantitative Approaches. 4th ed. Boston: Allyn & Bacon.
Norman, M.S. & Thomas, W., 2013. Effective Small Business Management: An Entrepreneurial Approach. New Jersey: Pearson Education.

90
Nyamwanza, T., 2013. A Case Review of Pre-requisites for Strategy Implementation Among SMEs in Zimbabwe. European Journal of Business and Social Sciences, Volume
2, pp. 124-133.
O`Regan, N. & Ghobadian, A., 2004. The Importance of Capabilities for Strategic Direction and Performance. Management Decision, 42(2), pp. 292-312.
O`Regan, N. & Ghobadian, A., 2007. Formal Strategic Planning: Annual Rain Dance or Wheel of Success. Strategic Change, 16(1), pp. 11-22.
Pellissier, R. & Kruger, J.I., 2011. A Study of Strategic Intelligence as a Strategic Management Tool in the Long-Term Insurance Industry in South Africa. European Business
Review, 23(6), pp. 609-631.
Raps, A., 2004. Implementing Strategy: June 49-53.
RBZ, 2012. Reserve Bank of Zimbabwe Monetary Policy Statement. January 2012. Harare, Zimbawe.
Robison, R.B. & Pearce, J.A., 2005. Formulation, Implementation and Control of Competitive Strategy. 9th ed. Boston: McGraw-Hill Irwin.
Sandada, M., Pooe, D. & Dhurup, M., 2014. Strategic Planning And Its Relationship With Business Performance Among Small and Medium Enterprises in South Africa.
International Business and Economic Research Journal, 13(3).
Sandada, M., 2015. Strategic Planning Dimensions in Small and Medium Enterprises (SMEs) in South Africa: Their Relative Importance and Variations in Selected Demographic
Variables. Economic Forum Journal, 4(1).
Saunders, M., Lewis, P. & Thornhill, A., 2009. Research Methods for Business Students. 5th ed. England: Pitman Publishing. Smit, P.J., Cronje, G.J.J., Brevis, T. & Vrba, M.J., 2007. Management Principles: A
Contemporary Edition for Africa. 4th ed. Cape Town: Juta & Co. Ltd.

91
Smith, Y. & Watkins, J.A., 2012. A Literature Review of Small and Medium Enterprises (SMEs): Risk Management Practices. African Journal of Business Management,
6(21), pp. 6324-6330.
Speculand, K., 2009. Six Necessary Mind Shifts for Implementing Strategy. Business Strategy
Series, 10(3), pp. 167-172.
Stonehouse, G. & Pemberton, J., 2002. Strategic Planning in SMEs: Some Empirical Findings. Management Decision, 40(9), pp. 853-861.
Tsikirayi, 2014. Small Enterprises Management: MBA Class Notes. Harare: Graduate School of Management - UZ.
Tustin, D.H., 2006. Marketing Research in Practice. Pretoria: Unisa Press.
Ungerer, M., Pretorious, M. & Herholdt, J., 2007. Viable Business Strategies: A Systematic,
People Centric Approach. 2nd ed. Johannesburg: Knowres Publishing.
Wang, C., Walker, E.A. & Redmond, J., 2007. Explaining the Lack of Strategic Planning in SMEs: The Importance of Owner Motivation. Journal of Organisational
Behaviour, 12(1), pp. 1-16.
World Economic Forum, 2014. The Global Competitiveness Report 2014-2015, Geneva.
Yamane, T., 1967. Statistics: An Introductory Analysis. 2nd ed. New York: Harper & Row.
Zikmund, Babin, Car & Griffin, 2009. Business Research Methods. 8th ed. Chicago: South Western Education.
Zikmund, W., 2014. Business Research Methods. Mason, OH: South-Western.
Government of Zimbabwe., 2011. SMEs ACT. Zimbabwe, Government Printers.
Government of Zimbabwe., 2013. Zimbabwe Agenda for Sustainable Socio-Economic Transformation (ZIMASSET) "Towards an Empowered Society and a Growing
Economy" October 2014-December 2018.

92
APPENDICES
APPENDIX A: COVER LETTER
UNIVERSITY OF ZIMBABWE
GRADUATE SCHOOL OF MANAGEMENT
04 January 2016
Attention: The Chief Executive Officer / Senior Official
RE: MBA RESEARCH PROJECT – RAYNOLD T. CHIKWAMA
Mr Raynold T. Chikwama is a registered student with the University of Zimbabwe and he is
currently working on his research project for the Masters in Business Administration degree
(MBA) in the Faculty of Commerce (Graduate School of Management). The title of his research
project is “Strategic Planning Practices: The Antecedents and Business Performance
Outcomes in Zimbabwe”.
Strategic Planning is an area of major concern for strategic leaders of contemporary
organisations, particularly SMEs as the literature is well documented that the high failure rate of
these organisations is partly attributed to lack of strategic planning. The primary objective of this
research is to investigate the perceptions of the strategic leaders in Zimbabwean SMEs with
regards to the drivers and benefits of strategic planning.
As a strategic leader of one of the identified organisations of the study population (using the
database that was availed with the Ministry of Small and Medium Enterprises and Cooperative
Development in Zimbabwe) you are hereby kindly invited to complete the attached questionnaire
(it will take approximately 15 minutes of your time). The success of this study largely depends
on your cooperation and it is greatly appreciated if you could complete the questionnaire on or
before 09 January 2016.
All information provided by you will be treated confidentially and under no circumstances will
this information be made public or used for any other purposes other than for the academic
research. If you have any queries or questions, please do not hesitate to contact Mr Chikwama on
0773 548 439.
Thank you very much for your cooperation.

93
APPENDIX B: RESEARCH QUESTIONNAIRE
THANK YOU FOR TAKING THE TIME TO COMPLETE THIS QUESTIONNAIRE
THE QUESTIONNAIRE CONSISTS OF FIVE SECTIONS
PLEASE INDICATE THE APPROPRIATE ANSWER WITH A TICK (
SECTION A
This section deals with information pertaining to YOURSELF and YOUR ORGANISATION.
Please be assured that this information is CONFIDENTIAL and will only be used to compare
groups of respondents.
A1 Please indicate your sex.
Male 1
Female 2
A2 Please indicate your age category.
20-29 Years 1
30-39 Years 2
40-49 Years 3
50-59 Years 4
>60 Years 5
A3 Please indicate your current primary job title.
Owner 1
Chief Executive Officer 2
Senior Manager 3
A4 Please indicate your highest qualification.
Post-Graduate Degree (Masters/ Doctorate) 1
Undergraduate Degree 2
Diploma 3
Certificate 4
Other (Please Specify) 5
PLEASE TURN OVER
���� )

94
A5 Please indicate the industry in which your organisation operate.
Manufacturing 1
Private Health Care/ Private Education & Entertainment Services 2
Private Financial Services 3
Travel/ Accommodation & Catering 4
Agriculture 5
Retail 6
Transport, Storage and Telecommunication 7
A6 Please indicate the period which your organisation has operated to date.
<5 Years 1
6-10 Years 2
11-20 Years 3
>21 Years 4
A7 Please indicate the number of permanent staff members employed by your
organisation.
<10 Employees 1
11-20 Employees 2
21-30 Employees 3
31-40 Employees 4
41-50 Employees 5
>51 Employees 6
PLEASE TURN OVER

95
SECTION B
This section deals with statements about strategic planning practices.
B1 Please indicate the extent to which you agree or disagree with the following
statements by using the scale prescribed below:
SD=Strongly Disagree; D=Disagree; N=Neutral; A=Agree; SA=Strongly Agree
FORMALITY OF STRATEGIC PLANNING SD D N A SA
1. The organisation has developed formal strategic plans. 1 2 3 4 5
2. Formal methods (facts, figures) are used to present the strategic plan. 1 2 3 4 5
3. Formal meetings are used to convey information about strategic planning. 1 2 3 4 5
ENVIRONMENTAL SCANNING SD D N A SA
4. The strategic plan includes scanning of the environment (assessment of the organisation`s Strengths, Weaknesses, Opportunities & Threats).
1
2
3
4
5
5. The business conducts environmental scanning in order to be informed about technological advances.
1
2
3
4
5
6. The business conducts environmental scanning in order to be informed about customers and their needs.
1
2
3
4
5
VISION AND MISSION STATEMENT SD D N A SA
7. The organisation does have the vision and mission statements. 1 2 3 4 5
8. There is a clear vision & mission statement about the future of the business 1 2 3 4 5
9. Everyone is aware of the vision &mission of the business 1 2 3 4 5
EMPLOYEE INVOLVEMENT SD D N A SA
10. Employees at all levels of the organisation are involved in the strategic planning process.
1
2
3
4
5
11. Employees are consulted in the strategic planning process. 1 2 3 4 5
12. There is open dialogue of the strategic planning procedures 1 2 3 4 5
STRATEGY IMPLEMENTATION SD D N A SA
13. Effective strategy implementation is at the core of the organisation`s competitiveness.
1
2
3
4
5
14. Non-monetary rewards are used to motivate employees to be committed to carry out the plan and accomplish goals.
1
2
3
4
5
15. The business rewards employees with bonuses to enforce commitment towards carrying out the strategic plan
1
2
3
4
5
EVALUATION AND CONTROL SD D N A SA
16. The organisation monitors and evaluates the execution of the planned strategies.
1
2
3
4
5
17. Feedback about progress in goal achievement is done during regular scheduled meetings.
1
2
3
4
5
TIME HORIZON SD D N A SA
18. The optimal time frame of the organisation`s strategic plan spans beyond two years before the strategic plan is reviewed and updated.
1
2
3
4
5
19. There are ad-hoc adjustments to the strategic plan whenever the need arises 1 2 3 4 5
PLEASE TURN OVER

96
SECTION C
This section deals with YOUR PERCEPTIONS of the drivers of strategic planning in YOUR
ORGANISATION.
C1 Please indicate the extent to which you agree or disagree with the following
statements by using the scale prescribed below:
SD=Strongly Disagree; D=Disagree; N=Neutral; A=Agree; SA=Strongly Agree
ENVIRONMENTAL DYNAMISM & UNCERTAINTY SD D N A SA
1. Organisations engage in strategic planning to counter market changes.
1 2 3 4 5
2. The degree and complexity of the changing business environment is compelling organisations to plan more strategically.
1 2 3 4 5
OWNER BUSINESS MOTIVATIONS SD D N A SA
3. The owner has the primary responsibility for setting strategic direction in the organisation.
1 2 3 4 5
4. The formulation of strategic plans is dependent upon the motivations and desires of the owner.
1 2 3 4 5
5. It is the owner who fosters the culture of strategic planning in the organisation.
1 2 3 4 5
GLOBALISATION & GROWING COMPETITION SD D N A SA
6. Globalisation is strongly influencing organisations to adopt strategic planning in a bid to gain competitiveness.
1 2 3 4 5
7. Growing competition requires an organisation to strategically plan. 1 2 3 4 5
INNOVATION & TECHNOLOGY SD D N A SA
8. Creativity and new product development are among the outcomes of strategic planning.
1 2 3 4 5
9. Technology and new business models evolve from strategic planning.
1 2 3 4 5
PLEASE TURN OVER

97
SECTION D
This Section deals with YOUR PERCEPTIONS of the benefits of strategic planning in YOUR
ORGANISATION.
D1 Please indicate the extent to which you agree or disagree with the following
statements by using the scale prescribed below:
SD=Strongly Disagree; D=Disagree; N=Neutral; A=Agree; SA=Strongly Agree
OPPORTUNITY IDENTIFICATION SD D N A SA
1. External orientation and environmental scanning maximise opportunity identification for the organisation.
1 2 3 4 5
2. Through strategic planning, the organisation is proactive in preparing for future contingencies and account for environmental dynamics & complexity.
1 2 3 4 5
IMPROVED BUSINESS PERFORMANCE SD D N A SA
3. Strategic planning assists the organisation to exploit core competencies and attain better business performance.
1 2 3 4 5
4. Strategic planning ensures that the organisation operates successfully in a dynamic and complex business environment.
1 2 3 4 5
EFFECTIVE & EFFICIENT DECISION MAKING SD D N A SA
5. Strategic planning avails the organisation with pertinent information to make the right decisions.
1 2 3 4 5
6. Adoption of strategic planning smoothens and makes the decision making process fast as well as easier.
1 2 3 4 5
EMPLOYEE INVOLVEMENT & COMMON VISION SD D N A SA
7. A strategic plan is a comprehensive master plan that gives employees` a common sense of direction as well as allowing them to work towards a common goal
1 2 3 4 5
8. Strategic planning unifies employees` and allows them to share a common vision.
1 2 3 4 5
9. Strategic planning help to keep the workforce informed about corporate goals and their attainment on a regular basis.
1 2 3 4 5
OPTIMAL RESOURCE ALLOCATION SD D N A SA
10. Strategic planning creates a rational basis for optimal resource allocation among stakeholders of the organisation.
1 2 3 4 5
11. Strategic planning ensures the most effective use of organisational resources by focusing the resources on key priorities.
1 2 3 4 5
ADAPTABILITY & FLEXIBILITY SD D N A SA
12. Strategic planning enhances the organisation`s flexibility and its ability for improvisation.
1 2 3 4 5
13. Strategic planning ensures that the organisation is stable and able to adapt to changes in the marketplace.
1 2 3 4 5
Thank you very much for taking the time to complete this questionnaire and for your
contribution to the research study.
THE END