Statistics on UK trade
18
commonslibrary.parliament.uk Research Briefing By Matthew Ward 21 December 2021 Statistics on UK trade with the Commonwealth Summary 1 The Commonwealth 2 Commonwealth member states 3 Trade statistics 4 International context 5 Trade with individual Commonwealth countries 6 Largest Commonwealth trading partners
Transcript of Statistics on UK trade

commonslibrary.parliament.uk
Research Briefing
By Matthew Ward
21 December 2021 Statistics on UK trade with the Commonwealth
Summary 1 The Commonwealth 2 Commonwealth member states 3 Trade statistics 4 International context 5 Trade with individual Commonwealth countries 6 Largest Commonwealth trading partners

Statistics on UK trade with the Commonwealth
2 Commons Library Research Briefing, 21 December 2021
Number CBP 8282
Image Credits 13th Commonwealth Foreign Affairs Ministers Meeting by Commonwealth Secretariat. Licensed under CC BY-NC-ND 2.0 / image cropped
Disclaimer The Commons Library does not intend the information in our research publications and briefings to address the specific circumstances of any particular individual. We have published it to support the work of MPs. You should not rely upon it as legal or professional advice, or as a substitute for it. We do not accept any liability whatsoever for any errors, omissions or misstatements contained herein. You should consult a suitably qualified professional if you require specific advice or information. Read our briefing ‘Legal help: where to go and how to pay’ for further information about sources of legal advice and help. This information is provided subject to the conditions of the Open Parliament Licence.
Feedback Every effort is made to ensure that the information contained in these publicly available briefings is correct at the time of publication. Readers should be aware however that briefings are not necessarily updated to reflect subsequent changes.
If you have any comments on our briefings please email [email protected]. Please note that authors are not always able to engage in discussions with members of the public who express opinions about the content of our research, although we will carefully consider and correct any factual errors.
You can read our feedback and complaints policy and our editorial policy at commonslibrary.parliament.uk. If you have general questions about the work of the House of Commons email [email protected].

Statistics on UK trade with the Commonwealth
3 Commons Library Research Briefing, 21 December 2021
Contents
1 The Commonwealth 5
2 Commonwealth member states 6
3 Trade statistics 8
4 International context 11
5 Trade with individual Commonwealth countries 14
6 Largest Commonwealth trading partners 16

The UK recorded a trade surplus of £8.2 billion with the Commonwealth in 2020.UK exports of goods and services to the
Commonwealth were worth £56.3 billion, while
imports totalled £48.2 billion.
The UK has now recorded a trade surplus with
the Commonwealth every year since 2010.
The value of UK exports to the Commonwealth
fell by 16% between 2019 and 2020, while the
value of imports fell by 25%.
The Commonwealth accounted for 8.7% of the UK's total trade in 2020 (i.e. the combined value of exports and imports).This was around the same as the UK's total
trade with Germany - the Commonwealth
accounted for a higher percentage of the UK's
exports than Germany, while Germany
accounted for a higher percentage of the UK's
imports than the Commonwealth.
UK trade with the Commonwealth is heavily concentrated on a small number of countries.Combined, India, Canada, Australia, Singapore
and South Africa accounted for 72% of the UK's
total trade with the Commonwealth in 2020;
44 countries accounted for the remaining 28%.
0
10
20
30
40
50
60
Exports Imports Balance
UK trade in goods and services withthe Commonwealth, 2020 (£ bn)
8.7%9.4%
8.1%
9.6%
8.2%
11.1%
0%
2%
4%
6%
8%
10%
12%
Total trade Exports Imports
Commonwealth Germany
UK trade with theCommonwealth compared, 2020
7.7%
13.4%
15.1%
17.7%
18.2%
SouthAfrica
Australia
Singapore
India
Canada
Trade as a percentage of all UK trade withthe Commonwealth, 2020
UK trade with the Commonwealth: a summary

Statistics on UK trade with the Commonwealth
5 Commons Library Research Briefing, 21 December 2021
1 The Commonwealth
The Commonwealth is a political association made up of 54 member states (including the UK) with a combined population of 2.5 billion.
Commonwealth countries vary greatly in size – India accounts for over half of the Commonwealth’s population with a population of 1.4 billion. Twenty-three Commonwealth countries have a population of under 1 million; Tuvalu and Nauru are the least populous Commonwealth members, with populations of around 10,000.1
Commonwealth countries also vary greatly in their economic development – in 2020, Australia and Singapore had a GDP per capita of over $50,000 while seven Commonwealth countries had a GDP per capita of less than $1,000.2
The vast majority of Commonwealth countries are former British colonies, though some have no historic colonial or constitutional links with the UK – for example, Mozambique gained independence from Portugal in 1975, while Rwanda gained independence from Belgium in 1962.
15 Commonwealth members states (including the UK) are ‘Commonwealth realms’, having the Queen as monarch and head of state – these are Antigua and Barbuda, Australia, The Bahamas, Belize, Canada, Grenada, Jamaica, New Zealand, Papua New Guinea, Saint Kitts and Nevis, Saint Lucia, Saint Vincent and the Grenadines, the Solomon Islands and Tuvalu.3
Two Commonwealth states – Cyprus and Malta - are also members of the European Union.
1 Commonwealth Secretariat, Member countries 2 Data from IMF, World Economic Outlook database 3 Royal.uk – Commonwealth realms

Statistics on UK trade with the Commonwealth
6 Commons Library Research Briefing, 21 December 2021
2 Commonwealth member states
The tables below list Commonwealth member states, the year they joined the Commonwealth, their population, GDP and GDP per head.
Commonwealth member states
Year joined
Antigua and Barbuda 1981 0.1 1.4 13,967Australia 1931 24.8 1,359.4 52,905Bahamas, The 1973 0.4 9.9 25,734Bangladesh 1972 163.2 323.1 1,962Barbados 1966 0.3 4.4 15,346Belize 1981 0.4 1.7 4,077Botswana 1966 2.3 15.1 6,420Brunei 1984 0.4 12.0 26,061Cameroon 1995 24.3 39.9 1,505Canada 1931 36.7 1,644.0 43,295Cyprus 1961 0.9 23.8 26,785Dominica 1978 0.1 0.5 7,416Eswatini 1968 1.1 4.0 3,533Fiji 1970 1 0.9 4.5 4,995Gambia, The 1965 2 2.1 1.9 770Ghana 1957 28.3 68.5 2,226Grenada 1974 0.1 1.0 9,130Guyana 1966 0.8 5.5 6,953India 1947 1,378.6 2,660.2 1,930Jamaica 1962 2.8 14.0 5,103Kenya 1963 46.7 102.4 2,104Kiribati 1979 0.1 0.2 1,673Lesotho 1966 2.0 2.0 970Malawi 1964 19.2 11.8 568Malaysia 1957 32.0 337.0 10,231Maldives 1982 3 0.4 3.7 9,889
2 The Gambia withdrew from the Commonwealth in 2013, rejoining in 2018
1 Fiji orignially joined the Commonwealth in 1970, before its membership lapsed in 1987. Fiji rejoined the Commonwealth in 1997 and was suspended between 2000-01 and 2009-14
3 The Maldives originally joined the Commonwelath in 1982, withdrew in 2016, before rejoining in 2020
CountryPopulation
(millions)
GDP, 2020 ($ billions)
GDP per head ($)

Statistics on UK trade with the Commonwealth
7 Commons Library Research Briefing, 21 December 2021
Source: Commonwealth Secretariat, and IMF World Economic Outlook database; flag images taken from http://www.countryflags.com
Commonwealth member states
Year joined
Malta 1964 0.5 14.9 28,955Mauritius 1968 1.3 10.9 8,619Mozambique 1995 29.5 14.0 449Namibia 1990 2.4 10.7 4,276Nauru 1968 0.01 0.1 8,867New Zealand 1931 4.8 209.4 41,165Nigeria 1960 188.7 429.4 2,083Pakistan 1947 4 197.3 261.7 1,255Papua New Guinea 1975 8.3 23.3 2,651Rwanda 2009 11.8 10.3 816Samoa 1970 0.2 0.8 4,090Seychelles 1976 0.1 1.1 11,702Sierra Leone 1961 7.4 4.2 527Singapore 1965 5.6 340.0 59,795Solomon Islands 1978 0.6 1.6 2,281South Africa 1931 5 56.5 335.3 5,625Sri Lanka 1948 21.4 80.7 3,682St Kitts and Nevis 1983 0.1 1.0 17,173St Lucia 1979 0.2 1.6 8,935St Vincent and the Grenadines 1979 0.1 0.8 7,304Tanzania 1961 50.0 64.4 1,110Tonga 1970 0.1 0.5 4,979Trinidad and Tobago 1962 1.4 21.6 15,425Tuvalu 1978 0.01 0.06 5,106Uganda 1962 37.7 38.1 925Vanuatu 1980 0.3 0.9 3,090Zambia 1964 17.2 19.3 1,023
5 South Africa withdrew from the Commonwealth in 1961, before being readmitted in 1994
4 Pakistan withdrew from the Commonwealth in 1972, rejoining in 1989. Pakistan was suspended from the Commonwealth between 1999 and 2004
CountryPopulation
(millions)
GDP, 2020 ($ billions)
GDP per head ($)

Statistics on UK trade with the Commonwealth
8 Commons Library Research Briefing, 21 December 2021
3 Trade statistics
In 2020:
• The UK exported £56.3 billion of goods and services to Commonwealth countries and imported £48.2 billion, resulting in a trade surplus of £8.2 billion.
• The UK recorded a trade deficit in goods – UK exports of goods to the Commonwealth were £26.5 billion while imports were £30.3 billion, resulting in a deficit of -£3.7 billion.
• The UK recorded a trade surplus in services – UK exports of services to the Commonwealth were £29.8 billion while imports were £17.9 billion, resulting in a surplus of £11.9 billion
UK trade with the Commonwealth (and the value of UK trade generally) contracted sharply in 2020 compared to 2019, though this should be viewed in the context of disruptions in international trade caused by the Coronavirus pandemic.
Exports to the Commonwealth fell by £11 billion between 2019 and 2020, a fall of 16%, while the value of imports fell by £16 billion, a fall of 25%. Over the same period, total UK exports fell by while imports fell by 14% while imports fell by 17%.
Source: ONS, Pink Book, 2021
UK trade with the Commonwealth, 2020Goods and services
Balance
£ billions % total £ billions % total £ billions
Goods 26.5 47.1% 30.3 62.8% -3.7Services 29.8 52.9% 17.9 37.2% 11.9
Total 56.3 100.0% 48.2 100.0% 8.2
Exports Imports

Statistics on UK trade with the Commonwealth
9 Commons Library Research Briefing, 21 December 2021
This fall in the value of UK trade with the Commonwealth in UK trade with a small number of Commonwealth countries, namely India, Australia, South Africa, Canada and Singapore.
The total value of UK trade (i.e., the combined value of exports and imports) with India fell by £5.4 billion, total trade with Australia fell by £4.0 billion, total trade with South Africa fell by £2.0 billion, total trade with Singapore fell by £3.2 billion and total trade with Canada fell by £4.1 billion.
The UK has now recorded a trade surplus with the Commonwealth every year since 2010 – the largest was £8.6 billion in 2018. The UK has recorded a trade deficit in goods and a trade surplus in services with the Commonwealth every year since 2000.
Source: ONS, Pink Book, 2021
Source: ONS, Pink Book, 2021
UK-Commonwealth trade, 2020 % change on 2019, goods and services
-17% -15% -16%
-25% -25% -25%
-35%
-30%
-25%
-20%
-15%
-10%
-5%
0%
Goods Services Total
Exports Imports
UK-Commonwealth trade, 2020 % change on 2019, total trade (exports + imports)
-23% -22%-20%
-18% -17%
-30%
-20%
-10%
0%
India Australia South Africa Canada Singapore

Statistics on UK trade with the Commonwealth
10 Commons Library Research Briefing, 21 December 2021
The increase in the UK’s trade surplus with the Commonwealth between 2019 and 2020 is a reversal of recent trends - the UK’s trade surplus with the Commonwealth narrowed significantly between 2018 and 2019, from £8.6 billion to £3.0 billion.
This was mainly due to a significant increase in the value of imports from the Commonwealth, driven by growth in imports from a small number of high value markets – imports from Australia increased by 47% (from £4.7 billion to £6.7 billion), imports from Canada increased by 30% (from £8.9 billion to £11.6 billion), while imports from India increased by 20% (from £12.4 billion to £14.9 billion).
While the total value of UK trade with the Commonwealth fell between 2019 and 2020, the fall in the value of imports from the Commonwealth was greater than the fall in value of exports from the Commonwealth, leading to the increased trade surplus.
Source: ONS, Pink Book, 2021
UK with the Commonwealth, 2000 - 2020 £ billions, goods and services
0
20
40
60
80
100
Series1
Series2
-10
0
10
20
30
40
50
60
70
2000 2002 2004 2006 2008 2010 2012 2014 2016 2018 2020
Imports
Exports
Balance

Statistics on UK trade with the Commonwealth
11 Commons Library Research Briefing, 21 December 2021
4 International context
In 2020, the Commonwealth accounted for 8.7% of the UK’s total trade (i.e., the combined value of exports and imports) – this was around the same as the value of UK trade with Germany, which accounted for 9.6% of the UK’s total trade in 2020.
The Commonwealth accounted for 9.4% of the UK’s exports in 2020, down from a high of 11.0% in 2011; imports from the Commonwealth accounted for 8.1% of UK imports in 2020, down from a high of 9.9% in 2009.
Taken as a bloc, the EU is the UK’s largest export market and source of imports – UK exports to the EU were four and a half times greater than exports to the Commonwealth, while imports from the EU were over six times
Source: ONS, Pink Book, 2021
UK trade with the Commonwealth, 2000 - 2020
Goods and services
Balance
£ billion % of total £ billion % of total £ billion
2000 24.0 8.6% 27.1 9.2% -3.12001 24.5 8.5% 28.8 9.2% -4.32002 23.5 8.1% 28.8 9.0% -5.32003 26.4 8.7% 31.0 9.4% -4.72004 28.8 9.1% 34.1 9.8% -5.32005 32.1 9.2% 37.2 9.7% -5.12006 36.0 8.9% 42.7 9.9% -6.72007 38.9 9.9% 40.5 9.5% -1.62008 43.0 9.9% 44.9 9.6% -1.92009 42.1 10.3% 42.9 9.9% -0.82010 48.9 10.8% 47.7 9.8% 1.22011 56.7 11.0% 51.6 9.7% 5.12012 55.3 10.7% 52.0 9.7% 3.32013 54.9 10.3% 54.3 9.7% 0.62014 52.5 9.9% 50.1 8.9% 2.42015 52.6 10.0% 45.1 8.1% 7.42016 55.2 9.7% 47.9 8.0% 7.32017 58.8 9.3% 52.6 8.0% 6.22018 63.9 9.6% 55.3 8.0% 8.62019 67.0 9.6% 64.0 8.9% 3.02020 56.3 9.4% 48.2 8.1% 8.2
Exports Imports

Statistics on UK trade with the Commonwealth
12 Commons Library Research Briefing, 21 December 2021
greater than UK imports from the Commonwealth. UK exports to the EU represented 41.8% of all UK exports in 2020 (down from a high of 54.2% in 2006); imports from the EU represented 50.4% of all UK imports (down from a high of 58.1% in 2002).
Looking at individual countries, the USA is the UK’s largest export markets and largest source of imports. In 2020, the USA accounted for 21.0% of UK exports and 12.5% of all UK imports.
The graph below shows the change in the importance of the Commonwealth, USA and EU as an export market for the UK (figures are for trade in goods only) since 1970.
Source: ONS, Pink Book, 2021
Source: IMF, Direction of Trade Statistics
UK trade with the Commonwealth, EU and USA, 2020% total, goods and services
46%
17%
9%
42%
21%
9%
50%
13%8%
0%
10%
20%
30%
40%
50%
60%
EU USA Commonwealth
Total trade Exports Imports
UK goods exports to the Commonwealth, EU and USA% total, 1970-2020
0
20
40
60
80
100
Series1
Series2
0%
10%
20%
30%
40%
50%
60%
70%
1970 1974 1978 1982 1986 1990 1994 1998 2002 2006 2010 2014 2018
USA
EU
Commonwealth

Statistics on UK trade with the Commonwealth
13 Commons Library Research Briefing, 21 December 2021
In 1970, the then EEC accounted for 22% of UK goods exports, while the Commonwealth accounted for 19% and the USA for 12%. At this point, the EEC consisted of 6 countries, while the Commonwealth consisted of 31 countries.
In 2020, the EU accounted for 46% of UK goods exports, while the Commonwealth accounted for 8% and the USA for 14%. At this point, the EU consisted of 27 countries, while the Commonwealth consisted of 53 other countries.

Statistics on UK trade with the Commonwealth
14 Commons Library Research Briefing, 21 December 2021
5 Trade with individual Commonwealth countries
The graph below shows UK trade with 50 of the 53 other Commonwealth member states in 2020 - data are not available for Tonga, Nauru and Tuvalu.
Source: ONS, Pink Book, 2021
UK-Commonwealth trade deficits/surpluses, 2020
£ billions, goods and services
-5 -4 -3 -2 -1 0 1 2 3 4 5
IndiaBangladeshSouth Africa
Sri LankaPakistanJamaica
MauritiusMaldives
Papua New GuineaSeychelles
Antigua and BarbudaBelize
St LuciaKiribati
EswatiniKenya
VanuatuSamoa
Solomon IslandsSt Kitts and Nevis
MalawiLesotho
DominicaFiji
RwandaSt Vincent
GrenadaNamibia
CameroonSierra Leone
TanzaniaBarbados
UgandaTrinidad and Tobago
ZambiaBrunei
Gambia, TheBahamas, TheNew Zealand
GhanaMalaysia
BotswanaMozambique
CyprusNigeriaGuyana
MaltaSingapore
CanadaAustralia

Statistics on UK trade with the Commonwealth
15 Commons Library Research Briefing, 21 December 2021
The UK had a trade surplus with 30 of these countries and a deficit with 20.
The UK’s largest Commonwealth trade surplus was with Australia and was worth £4.6 billion, followed by Canada (£4.5 billion) and Singapore (£3.9 billion).
The UK’s largest Commonwealth trade deficit was with India and was worth -£4.3 billion, followed by Bangladesh (-£1.9 billion) and South Africa (-£1.1 billion).

Statistics on UK trade with the Commonwealth
16 Commons Library Research Briefing, 21 December 2021
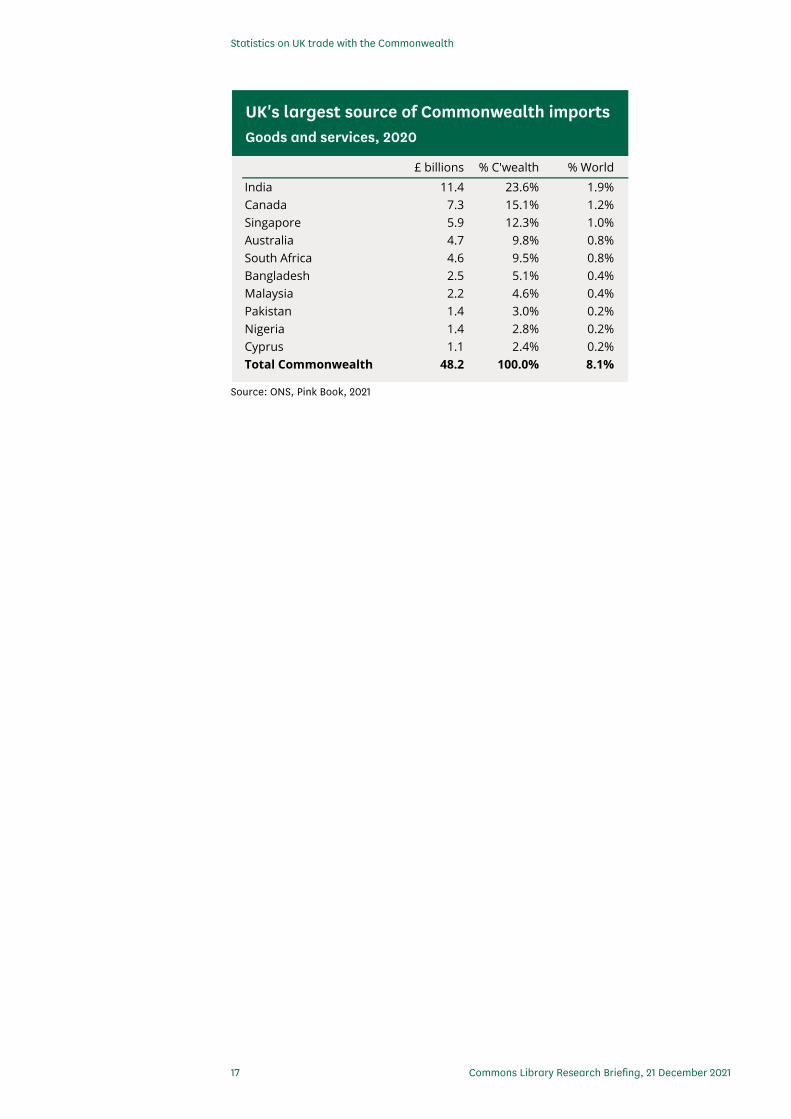
6 Largest Commonwealth trading partners
The tables below show the UK’s 10 largest Commonwealth export markets and sources of imports in 2020. UK trade with the Commonwealth is heavily concentrated with a small number of countries – combined, Australia, Canada, Singapore, India and South Africa accounted for 74% of UK exports to the Commonwealth and 74% of UK imports from the Commonwealth.
Australia was the UK single largest export market in the Commonwealth in 2020 - UK exports to Australia were £12 billion, just over a fifth of UK exports to the Commonwealth and 2% of all UK exports.
The UK imported more from India than any other Commonwealth country in 2020. UK imports from India were £11 billion, just under a quarter of UK imports from the Commonwealth and 2% of all UK imports.
Source: ONS, Pink Book, 2021
UK's largest Commonwealth eport marketsGoods and services, 2020
£ billions % C'wealth % World
Canada 11.8 20.9% 2.0%Singapore 9.8 17.5% 1.6%Australia 9.3 16.5% 1.5%India 7.1 12.5% 1.2%South Africa 3.5 6.2% 0.6%Malaysia 2.5 4.3% 0.4%Nigeria 1.8 3.2% 0.3%Cyprus 1.6 2.8% 0.3%New Zealand 1.2 2.2% 0.2%Malta 1.1 1.9% 0.2%Total Commonwealth 56.3 100.0% 9.4%
Statistics on UK trade with the Commonwealth
17 Commons Library Research Briefing, 21 December 2021
Source: ONS, Pink Book, 2021
UK's largest source of Commonwealth importsGoods and services, 2020
£ billions % C'wealth % World
India 11.4 23.6% 1.9%Canada 7.3 15.1% 1.2%Singapore 5.9 12.3% 1.0%Australia 4.7 9.8% 0.8%South Africa 4.6 9.5% 0.8%Bangladesh 2.5 5.1% 0.4%Malaysia 2.2 4.6% 0.4%Pakistan 1.4 3.0% 0.2%Nigeria 1.4 2.8% 0.2%Cyprus 1.1 2.4% 0.2%Total Commonwealth 48.2 100.0% 8.1%

The House of Commons Library is a research and information service based in the UK Parliament. Our impartial analysis, statistical research and resources help MPs and their staff scrutinise legislation, develop policy, and support constituents.
Our published material is available to everyone on commonslibrary.parliament.uk.
Get our latest research delivered straight to your inbox. Subscribe at commonslibrary.parliament.uk/subscribe or scan the code below:
commonslibrary.parliament.uk
@commonslibrary