UK Overseas Trade in Goods Statistics March 2021
20
UK Overseas Trade in Goods Statistics, March 2021 Trade in Goods, March 2021 • Total exports of goods for March 2021 were £34.9 billion. This was up £8.0 billion (30%) compared with last month, and up £6.4 billion (22%) compared with March 2020. • Total imports of goods for March 2021 were £41.9 billion. This was up £7.0 billion (20%) compared with last month, and up £0.4 billion (0.9%) compared with March 2020. • The UK was a net importer this month, with imports exceeding exports by £7.0 billion, narrowing by £1.0 billion on last month. Figure 1: Total UK monthly Trade in Goods From January 2021, the UK to EU export dataset incorporates both GB to EU customs export declaration data and NI Intrastat export (dispatch) data. This creates a break in the timeseries, users should take care when making comparisons with months and years prior to 2021. Website: https://www.uktradeinfo.com Email: [email protected] Statistical contact: H Mansfield Media contact: HMRC Press Office [email protected] UK Overseas Trade in Goods Statistics March 2021 About this release This release includes the 1st provisional estimates of trade-in-goods between the UK and both countries of the EU and those outside the EU for March 2021. Supporting tables, visuals and data can be found at www.uktradeinfo.com In this publication • Trade trends p.2 • Non-EU and EU trade p.3 • March 2021 Exports p.4 Country analysis Country analysis – 3 months Commodity analysis Commodity analysis – 3 months Combined analysis • March 2021 Imports p.11 Country analysis Country analysis – 3 months Commodity analysis Commodity analysis – 3 months Combined analysis • Methodology notes p.18 Coverage: United Kingdom Theme: Business and Energy Released: 12 May 2021 Next release: 11 June 2021
Transcript of UK Overseas Trade in Goods Statistics March 2021

UK Overseas Trade in Goods Statistics, March 2021
Trade in Goods, March 2021
• Total exports of goods for March 2021 were £34.9 billion.
This was up £8.0 billion (30%) compared with last month,
and up £6.4 billion (22%) compared with March 2020.
• Total imports of goods for March 2021 were £41.9 billion.
This was up £7.0 billion (20%) compared with last month,
and up £0.4 billion (0.9%) compared with March 2020.
• The UK was a net importer this month, with imports
exceeding exports by £7.0 billion, narrowing by £1.0
billion on last month.
Figure 1: Total UK monthly Trade in Goods
From January 2021, the UK to EU export dataset incorporates both GB to EU customs export declaration data and NI Intrastat export (dispatch) data. This creates a break in the timeseries, users should take care when making comparisons with months and years prior to 2021.
Website: https://www.uktradeinfo.com
Email: [email protected]
Statistical contact: H Mansfield
Media contact: HMRC Press Office [email protected]
UK Overseas Trade in Goods Statistics
March 2021
About this release
This release includes the
1st provisional estimates of
trade-in-goods between the
UK and both countries of
the EU and those outside
the EU for March 2021.
Supporting tables, visuals
and data can be found at
www.uktradeinfo.com
In this publication
• Trade trends p.2
• Non-EU and EU trade p.3
• March 2021 Exports p.4
Country analysis
Country analysis – 3 months
Commodity analysis
Commodity analysis – 3 months
Combined analysis
• March 2021 Imports p.11
Country analysis
Country analysis – 3 months
Commodity analysis
Commodity analysis – 3 months
Combined analysis
• Methodology notes p.18
Coverage: United Kingdom
Theme: Business and Energy
Released: 12 May 2021 Next release: 11 June 2021

UK Overseas Trade in Goods Statistics, March 2021 2
Figure 2: Quarterly UK Trade in Goods, 2009 – 2021
Methodology changes Trade in Goods Trends
↓ Exports down 1.9% on Q1 2020
↓ Imports down 8.3% on Q1 2020
↓ Trade deficit narrowed by 23% on Q1 2020
Following the global economic crisis, UK trade in goods dropped in 2009. Both imports and exports then steadily increased until 2012. From the start of 2013, imports remained relatively flat until a very sharp increase in Q3 of 2016. It has experienced large quarterly fluctuations since Q1 of 2019 and Q2 of 2020 saw the lowest quarterly imports value since Q3 of 2010. Exports peaked in Q2 of 2013, with a steady rise from Q2 of 2017 to Q3 of 2018. Q2 of 2020 also saw the lowest quarterly exports value since Q3 of 2010.
• The total export trade for Q1 of 2021 was £82.7 billion, which was adecrease of 1.9% compared with £84.2 billion for Q1 of 2020.
• The total import trade for Q1 of 2021 was £112 billion, which was adecrease of 8.3% compared with £122 billion for Q1 of 2020.
• There was a trade deficit of £29.2 billion for Q1 of 2021. This was anarrowing of 23% compared with £37.8 billion for Q1 of 2020.
• For many years Germany has been our largest trading import partner byvalue, recently surpassed by China, while the USA has been thedominant trading export partner, with occasional peaks for Switzerland.
• Mechanical appliances and Motor vehicles have generally been thelargest import commodities by value. For exports, Mechanicalappliances has also predominantly been the largest valued commodity,with occasional peaks for Precious metals.
• Due to the COVID-19 pandemic, trade in goods in 2020 and 2021experienced significant decreases, affecting our largest trade partnersand commodity groups at differing magnitudes, although some monthshave shown some recovery.

UK Overseas Trade in Goods Statistics, March 2021 3
Non-EU Trade in Goods:
EU Trade in Goods:
Figure 3: Total UK Trade in Goods, with EU and Non-EU, March 2021
Source: HM Revenue & Customs Overseas Trade in Goods Statistics
Note: 2021 data is provisional
Non-EU & EU Trade in Goods
↑ Non-EU exports up 36% on last month
↑ EU imports up 24% on last month
• Non-EU exports for March 2021 were £20.4 billion. This was an increase of£5.4 billion (36%) on last month, and an increase of £4.6 billion (30%)compared with March 2020.
• Non-EU imports for March 2021 were £21.6 billion. This was an increase of£3.1 billion (17%) on last month, and an increase of £1.2 billion (6.0%)compared with March 2020.
• For non-EU trade the UK was a net importer this month, with importsexceeding exports by £1.3 billion.
• EU exports for March 2021 were £14.6 billion. This was an increase of £2.6billion (22%) on last month, and an increase of £1.7 billion (14%) compared withMarch 2020.
• EU imports for March 2021 were £20.2 billion. This was an increase of £3.9billion (24%) on last month, but a decrease of £0.8 billion (4.0%) compared withMarch 2020.
• For EU trade the UK was a net importer this month, with imports exceedingexports by £5.7 billion.

UK Overseas Trade in Goods Statistics, March 2021 4
Table 1: UK exports of goods to the top 10 countries, March 2021
March 2021 February 2021 March 2020
Partner Country Total
(£ millions) Total
(£ millions)
Change from February 2021 (%)
Total (£ millions)
Change from March
2020 (%)
Switzerland 5,689 3,101 83.5 1,660 242.7
USA 4,276 3,413 25.3 4,146 3.1
Germany 3,029 2,331 29.9 2,825 7.2
Netherlands 1,936 1,906 1.5 1,758 10.1
Republic of Ireland 1,861 1,290 44.3 1,690 10.1
France 1,823 1,472 23.8 1,643 10.9
China 1,624 1,017 59.7 1,162 39.8
Belgium 1,525 1,379 10.6 994 53.4
Italy 865 772 12.1 744 16.3
Spain 719 582 23.5 723 -0.4
Others 11,561 9,608 20.3 11,180 3.4
Total EU 14,554 11,922 22.1 12,813 13.6
Total Non-EU 20,353 14,949 36.2 15,711 29.5
Total Exports 34,908 26,870 29.9 28,525 22.4
Source: HM Revenue & Customs Overseas Trade in Goods Statistics
Note: 2020 and 2021 data is provisional
Exports: Country Analysis
↑ Exports to Switzerland up 3.5 times the value on March 2020
↑ Exports to the USA up 25% on last month
• Switzerland replaced the USA as the largest export partner country. Itexperienced the largest value increase on last month and on March 2020, up£2,589 million (83%) and £4,029 million (3.5 times the value) respectively.
• The USA experienced the 2nd largest value increase on last month, up £863million (25%).
• Germany experienced the 3rd largest value increase on last month, up £698million (30%).
• China experienced the 4th largest value increase on last month, and the 3rdlargest increase on March 2020, up £607 million (60%) and £462 million(40%) respectively.
• Belgium experienced the 2nd largest value increase on March 2020, up £531million (53%).
• Hong Kong (in 11th place) experienced the largest value decrease on March2020, down £597 million (51%).

UK Overseas Trade in Goods Statistics, March 2021 5
Figure 4: Share of UK exports of goods to the top 5 countries, March 2021
Exports: Country Analysis
↑ Switzerland had a 16% share of total exports in March 2021
↓ The USA had a 12% share of total exports in March 2021
• The top 5 export partners accounted for 48% of total exports in goods inMarch 2021. This was an increase from 42% in March 2020.
• Switzerland accounted for 16% of the total value of exports from the UK.This was an increase from a 5.8% share in March 2020.
• The USA had the 2nd largest proportion, accounting for 12%. This was adecrease from a 15% share in March 2020.
• All of the top 10 export partner countries increased in value on lastmonth. Only Spain decreased in value on March 2020.
• The top 10 export partner countries (ranked by value) changed ordercompared with last month. Most notably, the Republic of Ireland rose to5th place from 7th, while Belgium fell to 8th place from 6th.
• The top 10 export partner countries (ranked by value) changed comparedwith March 2020. Most notably, Switzerland rose to 1st place from 5th,and Hong Kong fell to 11th place from 7th.
UK Overseas Trade in Goods Statistics, March 2021 6
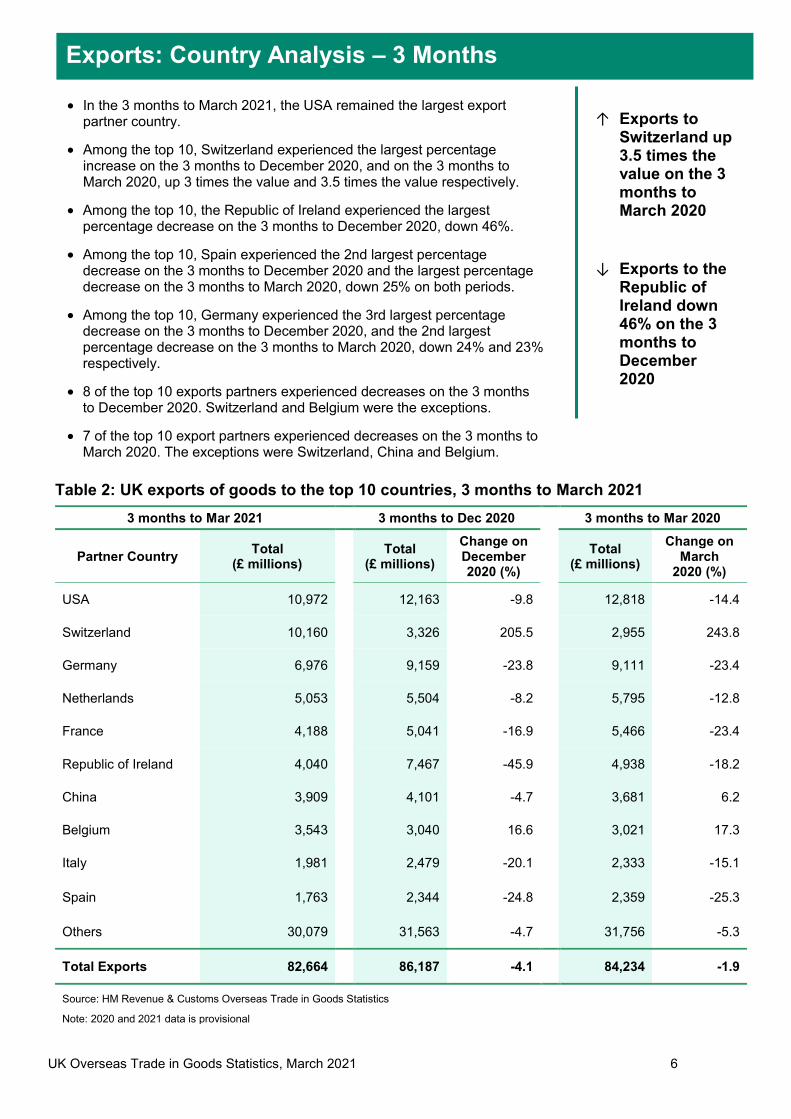
Table 2: UK exports of goods to the top 10 countries, 3 months to March 2021
3 months to Mar 2021 3 months to Dec 2020 3 months to Mar 2020
Partner Country Total
(£ millions) Total
(£ millions)
Change on December 2020 (%)
Total (£ millions)
Change on March
2020 (%)
USA 10,972 12,163 -9.8 12,818 -14.4
Switzerland 10,160 3,326 205.5 2,955 243.8
Germany 6,976 9,159 -23.8 9,111 -23.4
Netherlands 5,053 5,504 -8.2 5,795 -12.8
France 4,188 5,041 -16.9 5,466 -23.4
Republic of Ireland 4,040 7,467 -45.9 4,938 -18.2
China 3,909 4,101 -4.7 3,681 6.2
Belgium 3,543 3,040 16.6 3,021 17.3
Italy 1,981 2,479 -20.1 2,333 -15.1
Spain 1,763 2,344 -24.8 2,359 -25.3
Others 30,079 31,563 -4.7 31,756 -5.3
Total Exports 82,664 86,187 -4.1 84,234 -1.9
Source: HM Revenue & Customs Overseas Trade in Goods Statistics
Note: 2020 and 2021 data is provisional
↑ Exports to Switzerland up 3.5 times the value on the 3 months to March 2020
↓ Exports to the Republic of Ireland down 46% on the 3 months to December 2020
Exports: Country Analysis – 3 Months
• In the 3 months to March 2021, the USA remained the largest exportpartner country.
• Among the top 10, Switzerland experienced the largest percentageincrease on the 3 months to December 2020, and on the 3 months toMarch 2020, up 3 times the value and 3.5 times the value respectively.
• Among the top 10, the Republic of Ireland experienced the largestpercentage decrease on the 3 months to December 2020, down 46%.
• Among the top 10, Spain experienced the 2nd largest percentagedecrease on the 3 months to December 2020 and the largest percentagedecrease on the 3 months to March 2020, down 25% on both periods.
• Among the top 10, Germany experienced the 3rd largest percentagedecrease on the 3 months to December 2020, and the 2nd largestpercentage decrease on the 3 months to March 2020, down 24% and 23%respectively.
• 8 of the top 10 exports partners experienced decreases on the 3 monthsto December 2020. Switzerland and Belgium were the exceptions.
• 7 of the top 10 export partners experienced decreases on the 3 months toMarch 2020. The exceptions were Switzerland, China and Belgium.

UK Overseas Trade in Goods Statistics, March 2021 7
Table 3: UK exports of goods for the top 10 commodities, March 2021
March 2021 February 2021 March 2020
Commodity Description Total
(£ millions) Total
(£ millions)
Change from February 2021 (%)
Total (£ millions)
Change from March
2020 (%)
Precious metals 7,624 4,562 67.1 3,624 110.4
Mechanical appliances 4,547 3,568 27.5 4,353 4.5
Motor vehicles 3,598 2,947 22.1 3,039 18.4
Electronic equipment 1,783 1,462 22.0 1,714 4.0
Pharmaceutical products 1,750 1,503 16.5 1,780 -1.7
Mineral fuels 1,724 1,482 16.4 1,666 3.5
Other products 1,468 1,306 12.4 678 116.4
Measuring devices and gauges 1,461 1,116 30.9 1,247 17.1
Aircraft 1,051 981 7.1 870 20.7
Organic chemicals 1,025 400 155.8 888 15.4
Others 8,876 7,544 17.7 8,664 2.4
Total Exports 34,908 26,870 29.9 28,525 22.4
Source: HM Revenue & Customs Overseas Trade in Goods Statistics
Note: 2020 and 2021 data is provisional
Exports: Commodity Analysis
↑ Exports of Precious metals up more than double on March 2020
↑ Exports of Mechanical appliances up 27% on last month
• Precious metals remained the largest export commodity. It experienced thelargest value increases on last month and on March 2020, up £3,063 million(67%) and £4,000 million (more than double the value) respectively.
• Mechanical appliances experienced the 2nd largest value increase on lastmonth, up £979 million (27%).
• Motor vehicles experienced the 3rd largest value increases on last monthand on March 2020, up £651 million (22%) and £559 million (18%)respectively.
• Organic chemicals experienced the 4th largest value increase on last month,up £624 million (2.5 times the value).
• Art and antiques experienced the largest value decreases on last month andon March 2020, down £150 million (36%) and £112 million (29%)respectively.

UK Overseas Trade in Goods Statistics, March 2021 8
↑ Precious metals accounted for 22% of total exports in March 2021
↓ Mechanical appliances accounted for 13% of total exports in March 2021
Figure 5: Share of UK exports by the top 5 commodities, March 2021
Exports: Commodity Analysis
• The top 5 export commodities (ranked by value) accounted for 55% ofexports in March 2021, this was an increase from a 51% share in March2020.
• Precious metals accounted for 22% of total exports. This was an increasefrom a 13% share in March 2020.
• Mechanical appliances had the 2nd largest proportion, accounting for 13% oftotal exports. This was a decrease from a 15% share in March 2020.
• The top 10 export commodities (ranked by value) changed compared withlast month. Most notably, Electronic equipment rose to 4th place from 6th,and Organic chemicals rose to 10th place from 15th.
• The top 10 export commodities (ranked by value) changed compared withMarch 2020. Most notably, Precious metals rose to 1st place from 2nd.

UK Overseas Trade in Goods Statistics, March 2021 9
Table 4: UK exports of goods for the top 10 commodities, 3 months to March 2021
3 months to Mar 2021 3 months to Dec 2020 3 months to Mar 2020
Commodity Description Total
(£ millions) Total
(£ millions)
Change on December 2020 (%)
Total (£ millions)
Change on March
2020 (%)
Precious metals 14,770 7,427 98.9 8,246 79.1
Mechanical appliances 11,093 12,364 -10.3 13,573 -18.3
Motor vehicles 8,573 9,616 -10.8 8,867 -3.3
Mineral fuels 4,702 5,469 -14.0 6,642 -29.2
Electronic equipment 4,474 5,519 -18.9 4,997 -10.5
Pharmaceutical products 4,269 5,204 -18.0 4,626 -7.7
Other products 4,092 2,683 52.5 2,134 91.7
Measuring devices and gauges 3,494 3,777 -7.5 3,608 -3.2
Aircraft 2,740 2,553 7.3 3,406 -19.6
Plastics and plastic products 2,120 2,205 -3.9 2,237 -5.2
Others 22,337 29,371 -24.0 25,898 -13.8
Total Exports 82,664 86,187 -4.1 84,234 -1.9
Source: HM Revenue & Customs Overseas Trade in Goods Statistics
Note: 2020 and 2021 data is provisional
↑ Precious metals exports up 99% on the 3 months to December 2020
↓ Mineral fuels exports down 29% on the 3 months to March 2020
Exports: Commodity Analysis – 3 Months
• In the 3 months to March 2021, Precious metals replaced Mechanicalappliances as the largest export commodity. It experienced the largestpercentage increase on the 3 months to December 2020, and the 2nd largestpercentage increase on the 3 months to March 2020, up 99% and 79%respectively.
• Among the top 10, Mineral fuels experienced the largest percentage decreaseon the 3 months to March 2020, down 29%.
• Among the top 10, Electronic equipment experienced the largest percentagedecrease on the 3 months to December 2020, down 19%.
• Among the top 10, Pharmaceutical products experienced the 2nd largestpercentage decrease on the 3 months to December 2020, down 18%.
• 7 of the top 10 commodities experienced decreases on the 3 months toDecember 2020. Precious metals, Other products and Aircraft were theexceptions.
• 8 of the top 10 commodities experienced decreases on the 3 months to March2020. Precious metals and Other products were the exceptions.

UK Overseas Trade in Goods Statistics, March 2021 10
Country to commodity:
Commodity to country
Figure 6: The UK’s top commodity exports to the top 5 countries
Exports: Combined Commodity & Country Analysis
• The increase in exports of Mechanical appliances on last month was ledby the USA and Germany, up £161 million (29%) and £138 million (41%)respectively.
• The increase in exports of Motor vehicles on last month was led by theUSA, up £115 million (18%).
• The decrease in exports of Art and antiques on last month was led by theUSA, down £101 million (48%). The decrease on March 2020 was led bythe USA and Switzerland, down £83 million (43%) and £69 million (65%)respectively.
• The increase in exports to Switzerland on last month and on March 2020was dominated by Precious metals, up £2,515 million (89%) and £4,070million (more than 4 times the value) respectively.
• The decrease in exports to Hong Kong on March 2020 was dominated byPrecious metals, down £524 million (75%).
• The increase in exports to China on last month was led by Mineral fuels, up£295 million (from £3.0 million). The increase on March 2020 was led byMotor vehicles and Mineral fuels, up £196 million and £173 millionrespectively (more than double the value for both products).
• The increase in exports to the USA on last month was led by Organicchemicals, up £342 million (more than 4.5 times the value).
↑ Exports of Precious metals to Switzerland up 4 times the value on March 2020
↑ Exports of Mineral fuels to China up £295m from £3.0m last month

UK Overseas Trade in Goods Statistics, March 2021 11
Table 5: UK imports of goods from the top 10 countries, March 2021
March 2021 February 2021 March 2020
Partner Country Total
(£ millions) Total
(£ millions)
Change on February 2021 (%)
Total (£ millions)
Change on March
2020 (%)
China 5,442 4,987 9.1 2,300 136.6
Germany 5,416 4,221 28.3 5,425 -0.2
USA 3,580 3,159 13.3 4,654 -23.1
Netherlands 2,614 2,279 14.7 3,457 -24.4
Belgium 1,913 1,560 22.6 2,274 -15.9
France 1,893 1,549 22.2 2,106 -10.1
Italy 1,658 1,309 26.7 1,430 15.9
Spain 1,373 1,138 20.7 1,356 1.3
Norway 1,334 1,253 6.5 928 43.7
Russia 1,283 924 38.8 922 39.2
Others 15,379 12,470 23.3 16,647 -25.1
Total EU 20,243 16,324 24.0 21,079 -4.0
Total Non-EU 21,642 18,526 16.8 20,419 6.0
Total Imports 41,885 34,849 20.2 41,499 0.9
Source: HM Revenue & Customs Overseas Trade in Goods Statistics
Note: 2020 and 2021 data is provisional
Imports: Country Analysis
• China remained the largest import partner country. It experienced the 2ndlargest value increase on last month and the largest value increase on March2020, up £455 million (9.1%) and £3,142 million (more than double the value)respectively.
• Germany experienced the largest value increase on last month, up £1,195million (28%).
• The USA experienced the 3rd largest value increase on last month, up £420million (13%). Conversely, it experienced the largest value decrease on March2020, down £1,074 million (23%).
• The Netherlands experienced the 2nd largest value decrease on March 2020,down £843 million (24%).
• Australia experienced the 3rd largest value decrease on March 2020, down£789 million (80%).
• Norway experienced the 2nd largest value increase on March 2020, up £406million (44%).
↑ Imports from China up more than double the value on March 2020
↑ Imports from Germany up 28% on last month
UK Overseas Trade in Goods Statistics, March 2021 12
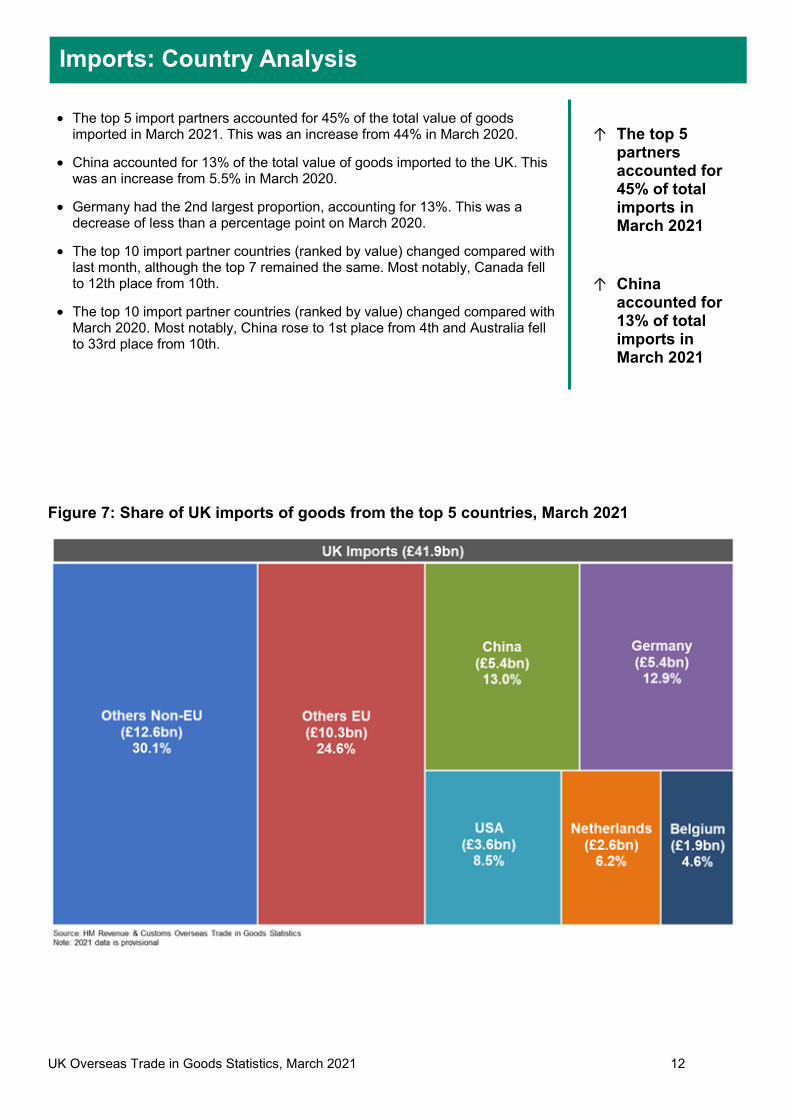
Figure 7: Share of UK imports of goods from the top 5 countries, March 2021
Imports: Country Analysis
↑ The top 5 partners accounted for 45% of total imports in March 2021
↑ China accounted for 13% of total imports in March 2021
• The top 5 import partners accounted for 45% of the total value of goodsimported in March 2021. This was an increase from 44% in March 2020.
• China accounted for 13% of the total value of goods imported to the UK. Thiswas an increase from 5.5% in March 2020.
• Germany had the 2nd largest proportion, accounting for 13%. This was adecrease of less than a percentage point on March 2020.
• The top 10 import partner countries (ranked by value) changed compared withlast month, although the top 7 remained the same. Most notably, Canada fellto 12th place from 10th.
• The top 10 import partner countries (ranked by value) changed compared withMarch 2020. Most notably, China rose to 1st place from 4th and Australia fellto 33rd place from 10th.
UK Overseas Trade in Goods Statistics, March 2021 13
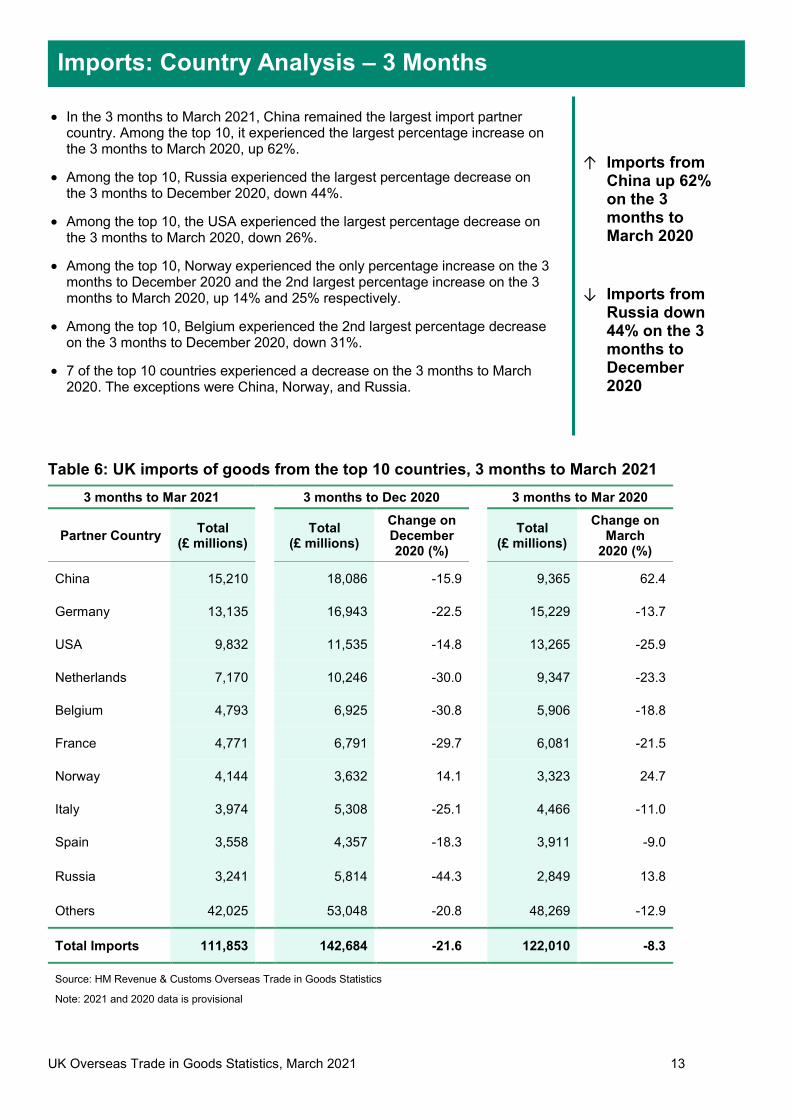
Table 6: UK imports of goods from the top 10 countries, 3 months to March 2021
3 months to Mar 2021 3 months to Dec 2020 3 months to Mar 2020
Partner Country Total
(£ millions) Total
(£ millions)
Change on December 2020 (%)
Total (£ millions)
Change on March
2020 (%)
China 15,210 18,086 -15.9 9,365 62.4
Germany 13,135 16,943 -22.5 15,229 -13.7
USA 9,832 11,535 -14.8 13,265 -25.9
Netherlands 7,170 10,246 -30.0 9,347 -23.3
Belgium 4,793 6,925 -30.8 5,906 -18.8
France 4,771 6,791 -29.7 6,081 -21.5
Norway 4,144 3,632 14.1 3,323 24.7
Italy 3,974 5,308 -25.1 4,466 -11.0
Spain 3,558 4,357 -18.3 3,911 -9.0
Russia 3,241 5,814 -44.3 2,849 13.8
Others 42,025 53,048 -20.8 48,269 -12.9
Total Imports 111,853 142,684 -21.6 122,010 -8.3
Source: HM Revenue & Customs Overseas Trade in Goods Statistics
Note: 2021 and 2020 data is provisional
↑ Imports from China up 62% on the 3 months to March 2020
↓ Imports from Russia down 44% on the 3 months to December 2020
Imports: Country Analysis – 3 Months
• In the 3 months to March 2021, China remained the largest import partnercountry. Among the top 10, it experienced the largest percentage increase onthe 3 months to March 2020, up 62%.
• Among the top 10, Russia experienced the largest percentage decrease onthe 3 months to December 2020, down 44%.
• Among the top 10, the USA experienced the largest percentage decrease onthe 3 months to March 2020, down 26%.
• Among the top 10, Norway experienced the only percentage increase on the 3months to December 2020 and the 2nd largest percentage increase on the 3months to March 2020, up 14% and 25% respectively.
• Among the top 10, Belgium experienced the 2nd largest percentage decreaseon the 3 months to December 2020, down 31%.
• 7 of the top 10 countries experienced a decrease on the 3 months to March2020. The exceptions were China, Norway, and Russia.

UK Overseas Trade in Goods Statistics, March 2021 14
Table 7: UK imports of goods for the top 10 commodities, March 2021
March 2021 February 2021 March 2020
Commodity Description Total
(£ millions) Total
(£ millions)
Change on February 2021 (%)
Total (£ millions)
Change on March
2020 (%)
Mechanical appliances 5,493 4,532 21.2 5,237 4.9
Motor vehicles 4,696 3,436 36.7 4,834 -2.9
Precious metals 4,361 3,595 21.3 5,761 -24.3
Electronic equipment 3,750 3,298 13.7 3,330 12.6
Mineral fuels 2,608 2,341 11.4 2,945 -11.4
Pharmaceutical products 1,636 1,509 8.4 1,761 -7.1
Measuring devices and gauges 1,351 1,001 35.0 1,280 5.6
Plastics and plastic products 1,285 1,126 14.1 1,096 17.2
Miscellaneous chemical products
932 995 -6.3 455 105.1
Furniture and light fittings 872 751 16.2 590 47.8
Others 14,899 12,265 21.5 14,211 4.8
Total Imports 41,885 34,849 20.2 41,499 0.9
Source: HM Revenue & Customs Overseas Trade in Goods Statistics
Note: 2020 and 2021 data is provisional
↓ Imports of Precious metals down 24% on March 2020
↑ Imports of Motor vehicles up 37% on last month
Imports: Commodity Analysis
• Mechanical appliances remained the largest import commodity, experiencingthe 2nd largest value increase on last month, up £962 million (21%).
• Precious metals experienced the 3rd largest value increase on last month, up£766 million (21%). Conversely, it experienced the largest value decrease onMarch 2020, down £1,400 million (24%).
• Motor vehicles experienced the largest value increase on last month, up£1,260 million (37%).
• Miscellaneous chemical products experienced the largest value decrease onlast month, down £63 million (6.3%). In contrast, it experienced the largestvalue increase on March 2020, up £478 million (double the value).
• Electronic equipment experienced the 4th largest value increase on lastmonth and the 2nd largest value increase on March 2020, up £452 million(14%) and £421 million (13%) respectively.
• Mineral fuels experienced the 2nd largest value decrease on March 2020,down £337 million (11%).

UK Overseas Trade in Goods Statistics, March 2021 15
Figure 8: Share of UK imports for the top 5 commodities, March 2021
↓ The top 5 import commodities accounted for 50% of total imports in March 2021
↑ Mechanical appliances accounted for 13% of total imports in March 2021
Imports: Commodity Analysis
• The top 5 import commodities (ranked by value) accounted for 50% of thetotal value of goods imported in March 2021. This was a decrease from a53% share in March 2020.
• Mechanical appliances accounted for 13% of the total value of goodsimported to the UK. This was an increase of less than a percentage point onMarch 2020.
• Motor vehicles had the 2nd largest proportion, accounting for an 11% share.This was a decrease from a 12% share in March 2020.
• The top 10 commodities (ranked by value) changed order compared with lastmonth. Most notably, Motor vehicles rose to 2nd place from 3rd and Preciousmetals fell to 3rd place from 2nd.
• The top 10 commodities (ranked by value) changed compared with March2020. Most notably, Miscellaneous chemical products rose to 9th place from17th and Furniture and light fittings rose to 10th place from 13th.

UK Overseas Trade in Goods Statistics, March 2021 16
Table 8: UK imports of goods for the top 10 commodities, 3 months to March 2021
3 months to Mar 2021 3 months to Dec 2020 3 months to Mar 2020
Commodity Description Total
(£ millions) Total
(£ millions)
Change on December 2020 (%)
Total (£ millions)
Change on March
2020 (%)
Mechanical appliances 14,222 15,070 -5.6 15,355 -7.4
Precious metals 13,002 22,553 -42.3 15,361 -15.4
Motor vehicles 10,910 14,698 -25.8 13,751 -20.7
Electronic equipment 10,595 13,784 -23.1 10,239 3.5
Mineral fuels 8,105 6,982 16.1 9,800 -17.3
Pharmaceutical products 4,173 5,930 -29.6 4,904 -14.9
Plastics and plastic products 3,535 4,022 -12.1 3,301 7.1
Measuring devices and gauges 3,319 4,397 -24.5 3,562 -6.8
Miscellaneous chemical products 2,710 2,060 31.5 1,247 117.3
Furniture and light fittings 2,350 2,372 -0.9 2,108 11.5
Others 38,935 50,816 -23.4 42,383 -8.1
Total Imports 111,853 142,684 -21.6 122,010 -8.3
Source: HM Revenue & Customs Overseas Trade in Goods Statistics
Note: 2020 and 2021 data is provisional
↓ Imports of Precious metals down 42% on the 3 months to December 2020
↑ Imports of Miscellaneous chemical products up more than double on the 3 months to March 2020
Imports: Commodity Analysis – 3 Months
• In the 3 months to March 2021, Mechanical appliances replaced Preciousmetals as the largest import commodity.
• Among the top 10, Precious metals experienced the largest percentagedecrease on the 3 months to December 2020, down 42%.
• Among the top 10, Miscellaneous chemical products experienced the largestpercentage increases on the 3 months to December 2020 and on the 3 monthsto March 2020, up 32% and more than double respectively.
• Among the top 10, Pharmaceutical products experienced the 2nd largestdecrease on the 3 months to March 2020, down 30%.
• 8 of the top 10 commodities experienced decreases on the 3 months toDecember 2020. The exceptions were Mineral fuels and Miscellaneouschemical products.
• 6 of the top 10 commodities experienced decreases on the 3 months to March2020. The exceptions were Electronic equipment, Plastics and plastic products,Miscellaneous chemical products, and Furniture and light fittings.

UK Overseas Trade in Goods Statistics, March 2021 17
Country to commodity:
Commodity to country:
Figure 9: The UK’s top commodity imports from the top 5 countries
Imports: Combined Commodity & Country Analysis
• The increases in imports from China on last month and on March 2020 weredriven by Mechanical appliances, up £203 million (19%) and £703 million(more than double the value) respectively.
• The increase in imports from the USA on last month was led by Preciousmetals, up £95 million (13%). The decrease on March 2020 was driven byMechanical appliances and Mineral fuels, down £373 million (40%) and £286million (48%) respectively.
• The decrease in imports from the Netherlands on March 2020 was driven byPharmaceutical products, down £489 million (78%)
• The increase in imports from Norway on March 2020 was dominated byMineral fuels, up £333 million (48%).
• T
• The increase in imports of Precious metals on last month was driven byRussia, South Africa, and Switzerland, up £288 million (51%), £188 million(more than double the value), and £125 million (almost double the value)respectively. The decrease on March 2020 was driven by Australia, down£779 million (95%).
• The increase in imports of Motor vehicles on last month was driven byGermany, up £507 million (42%).
• The decrease in imports of Miscellaneous chemical products on last monthwas dominated by China, down £130 million (21%). The increase on March2020 was also dominated by China, up £488 million (from £8.7 million).
• The increase in imports of Electronic equipment on March 2020 wasdominated by China, up £362 million (77%).
↓ Imports of Pharmaceutical products from the Netherlands down 78% on March 2020
↑ Imports of Precious metals from Russia up 51% on last month

UK Overseas Trade in Goods Statistics, March 2021 18
Metadata
Data behind this bulletin is available through our uktradeinfo web site:
• Detailed Trade Statistics data at 8-digit commodity code level is available in our interactive database.
• Aggregate OTS data is available in pre-prepared Excel tables.
Data sources
UK to EU exports Up to 31 December 2020, UK to EU export statistics were collected via the Intrastat statistical survey, which required traders to declare the value and volume of commodities exported to EU Member States within the relevant month of physical goods movement.
For goods moving from 1 January 2021, GB to EU export statistics are compiled direct from customs export declarations made according to the requirements of the Taxation (Cross Border Trade) Act. The customs declaration requirements are more complex than the single monthly aggregated Intrastat return, and can result in differences between dates of declaration and actual movement of the goods out of the country.
The TIGS compilation methodology relies upon the acceptance date of the customs export declaration for its inclusion within the relevant month of account, rather than the declared physical movement date used from the Intrastat survey.
Intrastat survey returns continue to be collected for goods exported from Northern Ireland to the EU, under the terms of the Northern Ireland Protocol.
Both the GB to EU customs export declaration data and NI Intrastat export (dispatch) data are incorporated into the overall UK to EU export dataset.
As a result of the changes and differences outlined above, there is a break in the timeseries for published UK to EU export statistics from January 2021. These will not be directly comparable to UK to EU export statistics published for previous months and years.
UK imports from EU UK imports from EU statistics is not impacted by any change in 2021. The Intrastat survey continues to operate for all UK (GB and NI) imports (arrivals) from the EU, to mitigate the effects of staging customs controls, and to comply with the Northern Ireland Protocol.
Figures derived from Intrastat include:
• Estimates for businesses who have yet to submit detailed data on the trade they had with other EUMember States this month.
• Estimates for businesses who do not have to submit detailed data on the trade they have with other EUMember States.
• An adjustment for trade associated with Missing Trader Intra Community fraud. More details of this can befound in the OTS methodology paper here.
Estimates are included in all high-level totals including commodity (HS2) and country totals.
The Non-EU figures provided in this publication of the March 2021 Overseas Trade in Goods Statistics are presented by customs declarations and collected by the CHIEF (Customs Handling of Import and Export Freight) system. Declarations collected via the Customs Declarations Service (CDS) are included: for imports from August 2020 month of account; and for exports from December 2020 month of account onwards.
Detailed trade information is presented according to the Harmonised System (HS) nomenclature.
Methodology
The Overseas Trade Statistics Methodology paper (March 2021) is available here. It covers all aspects of the Overseas Trade Statistics methodology – data sources, classifications and definitions, quality assurance,
Methodology Notes

UK Overseas Trade in Goods Statistics, March 2021 19
publications and governance. It is a useful companion to the trade data, providing the definitions and methodologies on which the data are based.
From 31 December 2020, the free movement of people and goods and services between the UK and the EU ended. This changed the way HMRC collects trade in goods statistics. The overall UK to EU export dataset will incorporate both GB to EU customs export declaration data and NI Intrastat export (dispatch) data. As a result, there will be a break in the timeseries for published UK to EU export statistics from January 2021. Users should take care when comparing previous months and years.
From the May 2016 month of account, there was a methodological change to the way our trade-in-goods statistics are compiled. Following a change in legislation, trade-in-goods statistics switched from the ‘general trade’ system of compilation to the ‘special trade’ system.
Non-Monetary Gold (NMG) can form a substantial part of the non-EU Overseas Trade Statistics (OTS). For further information, see Inclusion of Non-Monetary Gold in OTS. Data relating to monthly non-EU and EU import and export totals for January 2008 onwards with a breakdown of non-monetary gold and other trade is available in an OTS time series spreadsheet.
Relationship with other statistical publications
The aggregate estimates here will differ slightly from those that are published by the Office for National Statistics (ONS) as part of the Balance of Payments (BoP), as the 2 sets of data are compiled to different sets of rules. The ONS website provides an overview of BoP, where you can find their detailed monthly UK Trade Releases. The BoP publication shows a high-level picture of UK trade-in-goods, whereas the OTS publication shows a detailed picture of the UK’s trade-in-goods by commodity and partner country.
National Statistics Publication
HM Revenue & Customs released these latest statistics on Overseas Trade with countries on 12 May 2021 under arrangements set out in the Code of Practice for Official Statistics. The 1st release is published on HMRC’s trade data website www.uktradeinfo.com.
This release includes the 1st provisional estimates of trade-in-goods between the UK and both countries of the EU and those outside the EU for February 2021. At the same time revisions for all previously published non-EU and EU data for 2020 are also being released in line with the HM Revenue & Customs Policy on Revisions.
The next three publications are due for release on the following days:
Month of account First release date
April 2021 11 June 2021
May 2021 9 July 2021
June 2021 12 August 2021
The OTS has been reviewed as part of an assessment made of Overseas Trade in Goods Statistics by the UK Statistics Authority. The report of that assessment can be found here.
The United Kingdom Statistics Authority has designated these statistics as National Statistics, in accordance with the Statistics and Registration Service Act 2007 and signifying compliance with the Code of Practice for Official Statistics. Designation can be broadly interpreted to mean that the statistics:
• meet identified user needs;
• are well explained and readily accessible;
• are produced according to sound methods; and
• are managed impartially and objectively in the public interest.

UK Overseas Trade in Goods Statistics, March 2021 20
Once statistics have been designated as National Statistics it is a statutory requirement that the Code of Practice shall continue to be observed.
Now that the UK has left the EU, it is important that our statistics continue to be of high quality and are internationally comparable. All releases continue to be produced in accordance with the UK Statistics Authority’s Code of Practice for Statistics as well as internationally agreed statistical guidance and standards.