Starter Metrics For Agile Teams
29
Jolly Rajan Agile Coach with contributions from Mark Grove and Julie Wyman Starter Metrics for Agile Teams
-
Upload
jolly-rajan -
Category
Technology
-
view
226 -
download
1
Transcript of Starter Metrics For Agile Teams
Jolly Rajan
Agile Coachwith contributions from Mark Grove and Julie Wyman
Starter Metrics for Agile Teams

Agenda
1. Goals
2. Why are metrics valuable?
3. Recommended team metrics
4. Practice: Interpretation & common trends
5. Next Steps
Goals
1. Introduction to the Team Metrics
2. Deeper understanding of the selected metrics
3. Practice interpreting common trends
4. Review next steps
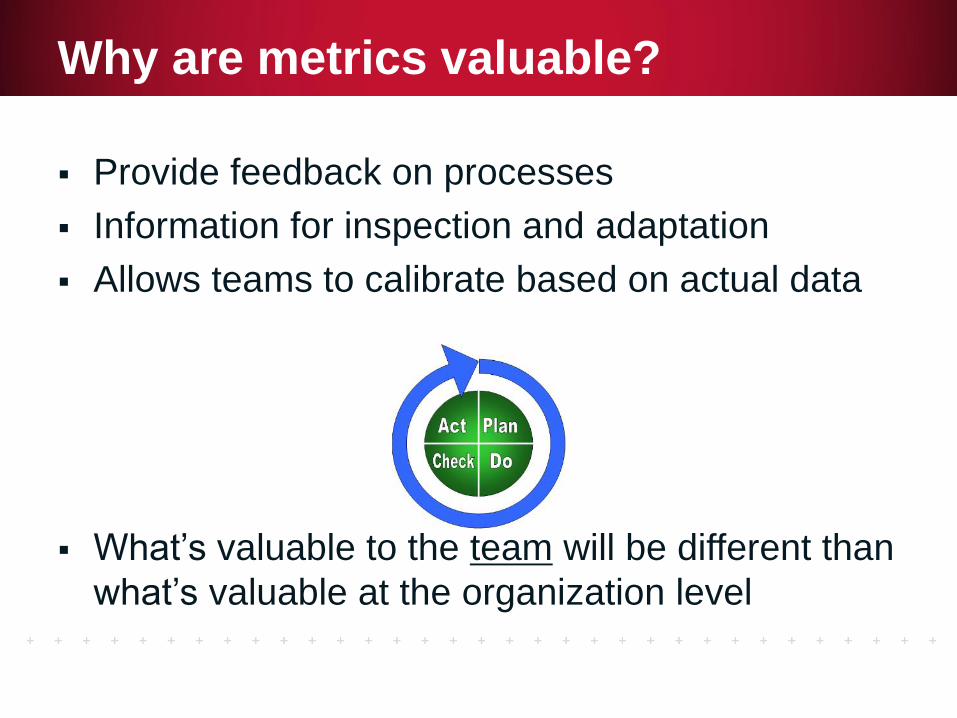
Provide feedback on processes
Information for inspection and adaptation
Allows teams to calibrate based on actual data
What’s valuable to the team will be different than
what’s valuable at the organization level
Why are metrics valuable?
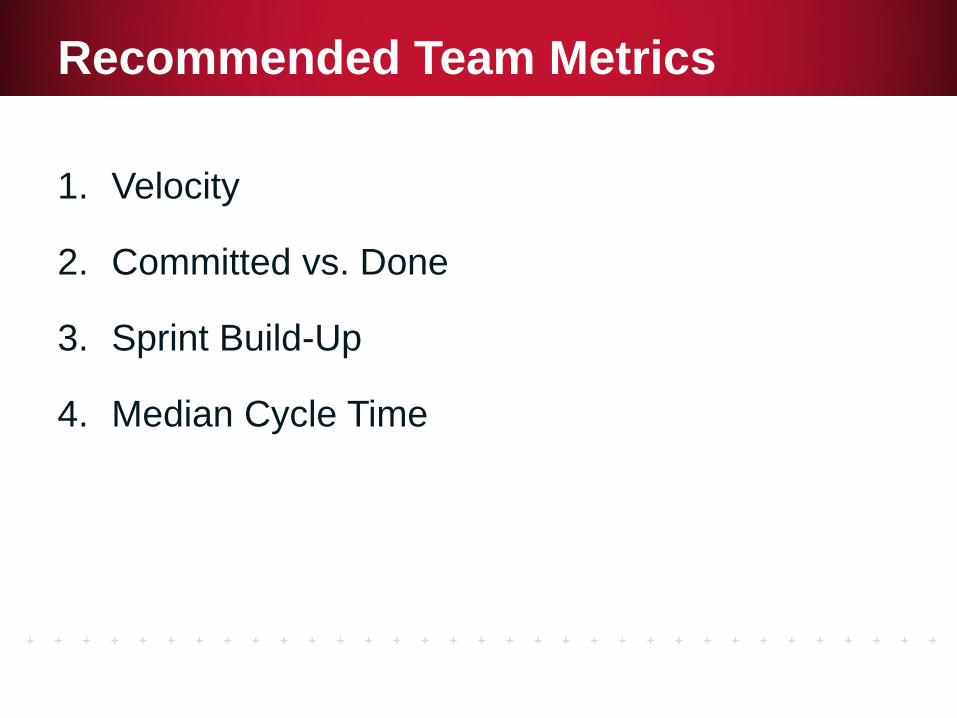
1. Velocity
2. Committed vs. Done
3. Sprint Build-Up
4. Median Cycle Time
Recommended Team Metrics
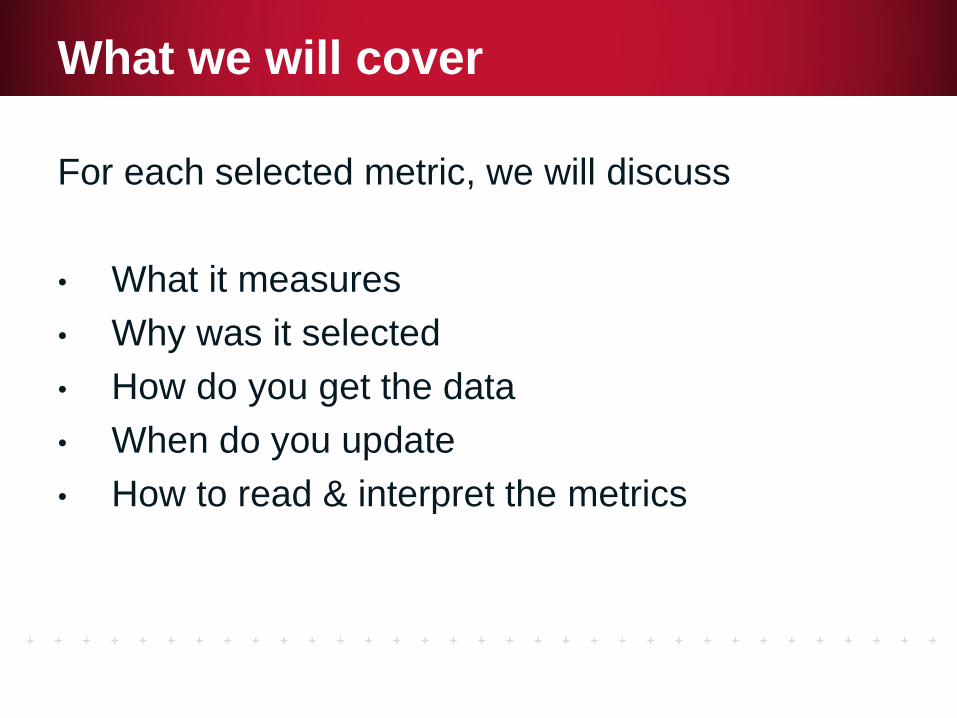
For each selected metric, we will discuss
• What it measures
• Why was it selected
• How do you get the data
• When do you update
• How to read & interpret the metrics
What we will cover

What it measures:
• Total number of story points completed in a sprint.
• Running average over the last 3 sprints.
Why selected:
• Indicator of how much a team can commit to in the next sprint.
• Leading indicator of trend for future sprints.
How to get the data:
• Observation & ALM Tool
When to update:
• At the end of each Sprint
Velocity

Velocity Sample
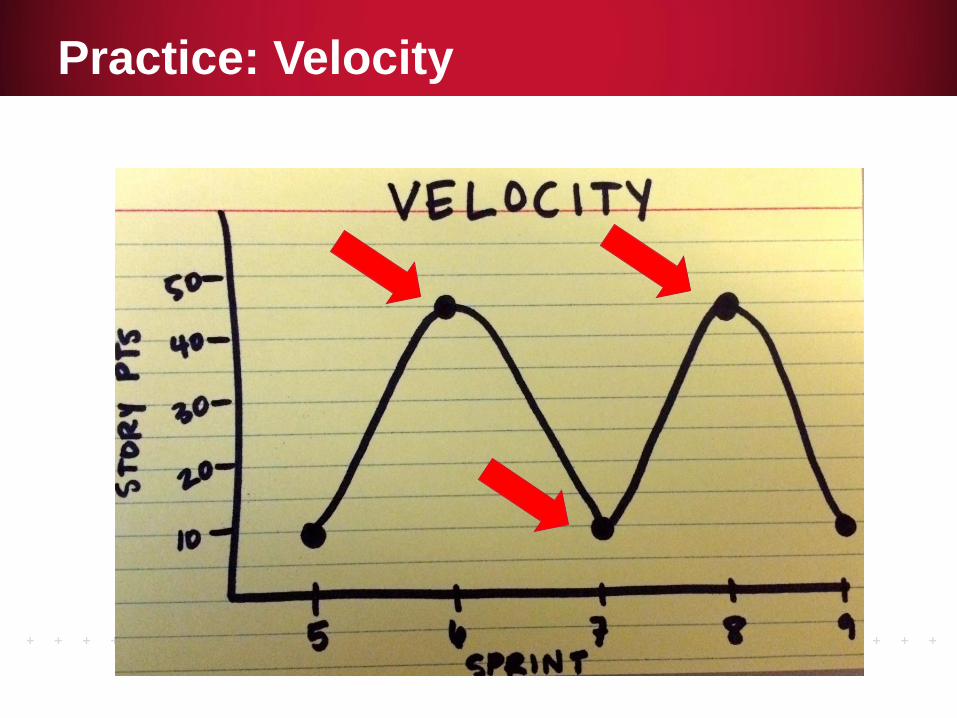
Practice: Velocity
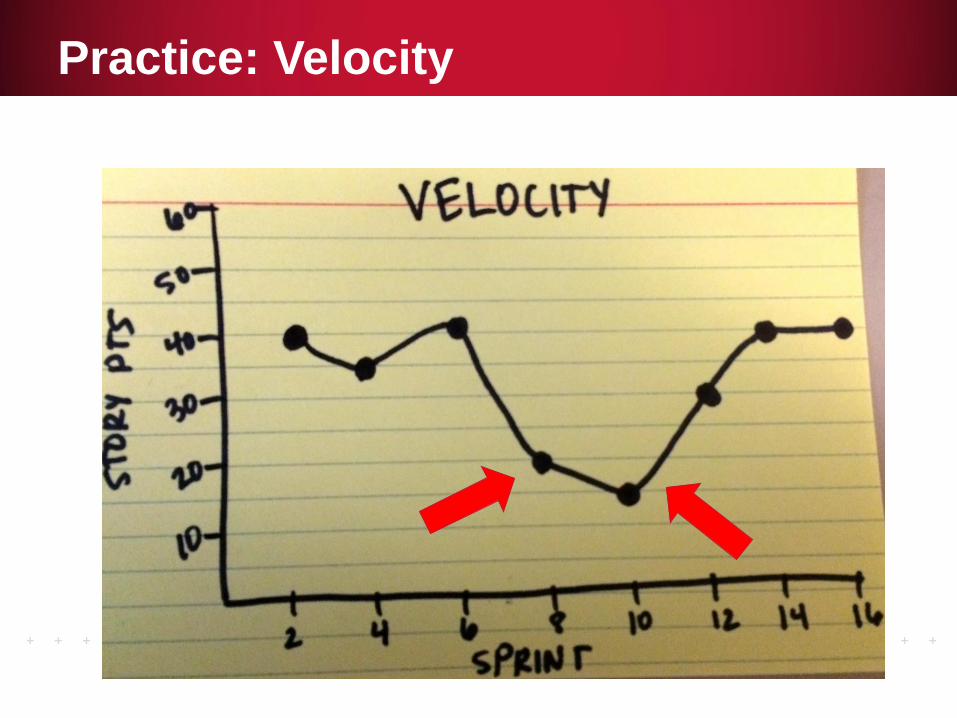
Practice: Velocity
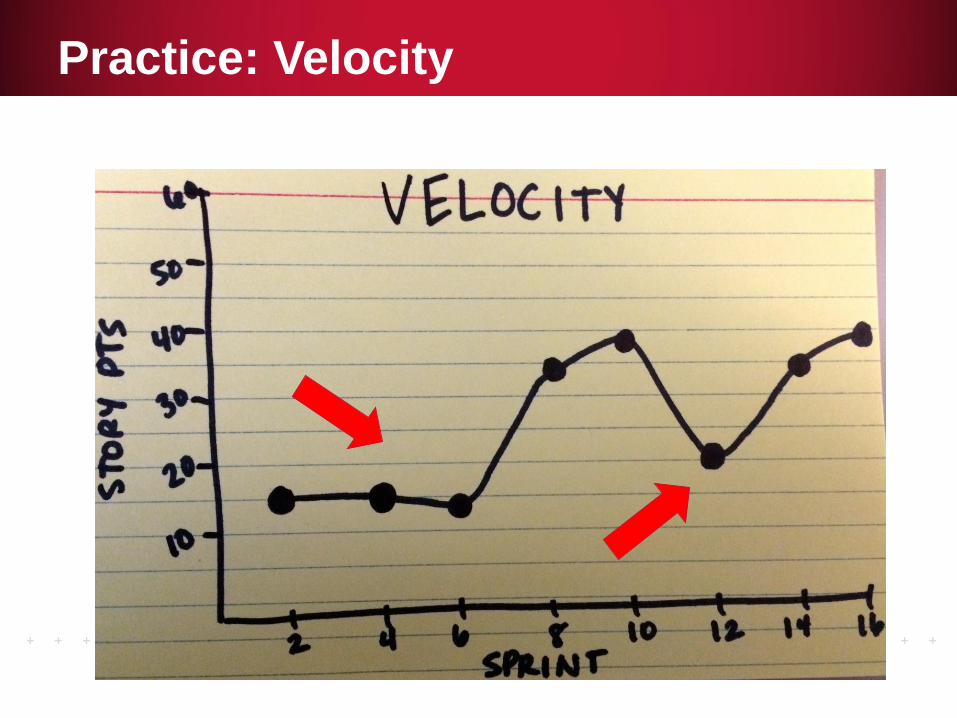
Practice: Velocity
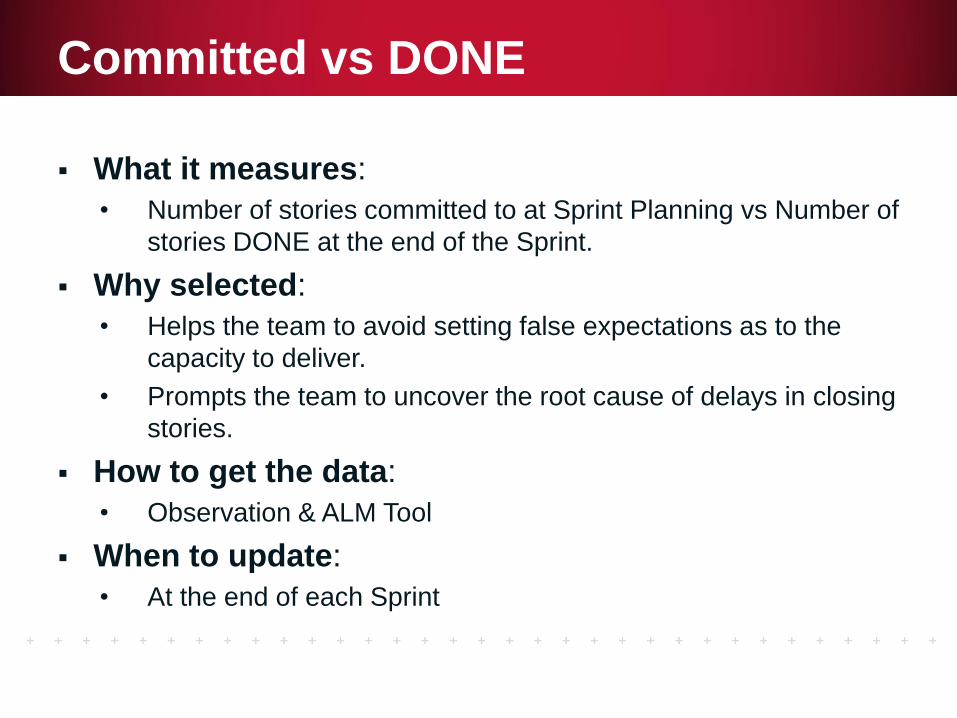
What it measures:
• Number of stories committed to at Sprint Planning vs Number of
stories DONE at the end of the Sprint.
Why selected:
• Helps the team to avoid setting false expectations as to the
capacity to deliver.
• Prompts the team to uncover the root cause of delays in closing
stories.
How to get the data:
• Observation & ALM Tool
When to update:
• At the end of each Sprint
Committed vs DONE

Committed vs Done Sample
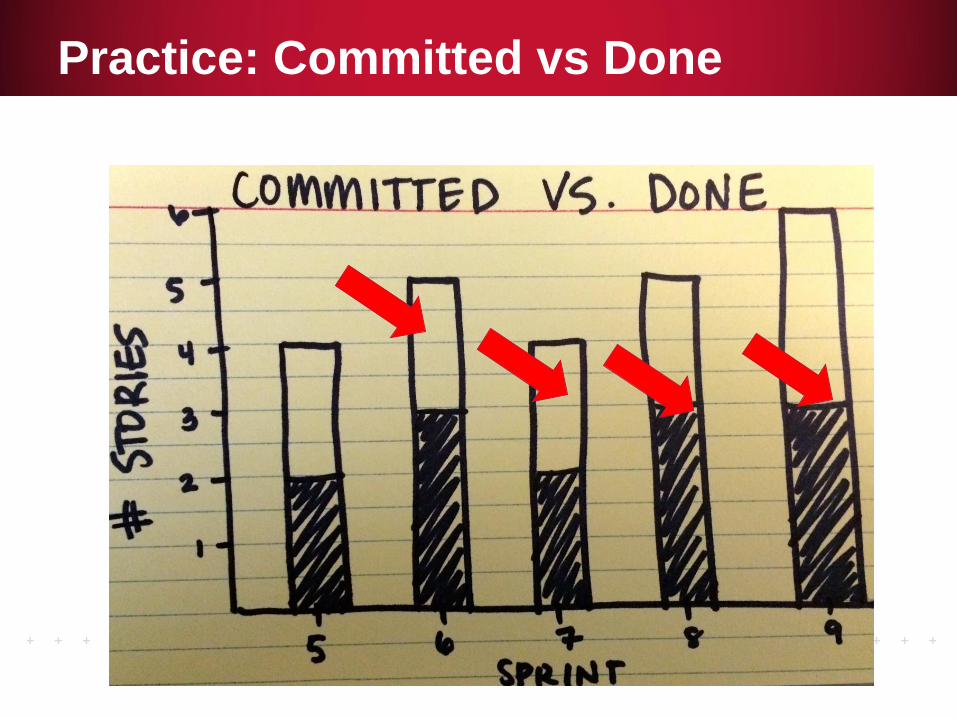
Practice: Committed vs Done

Practice: Committed vs Done
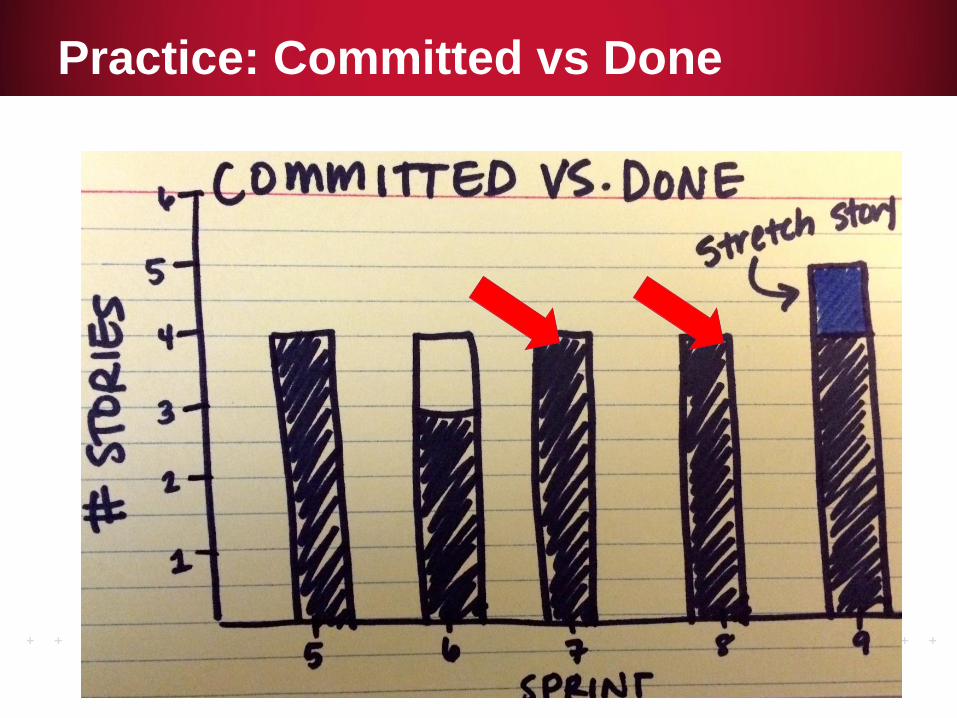
Practice: Committed vs Done
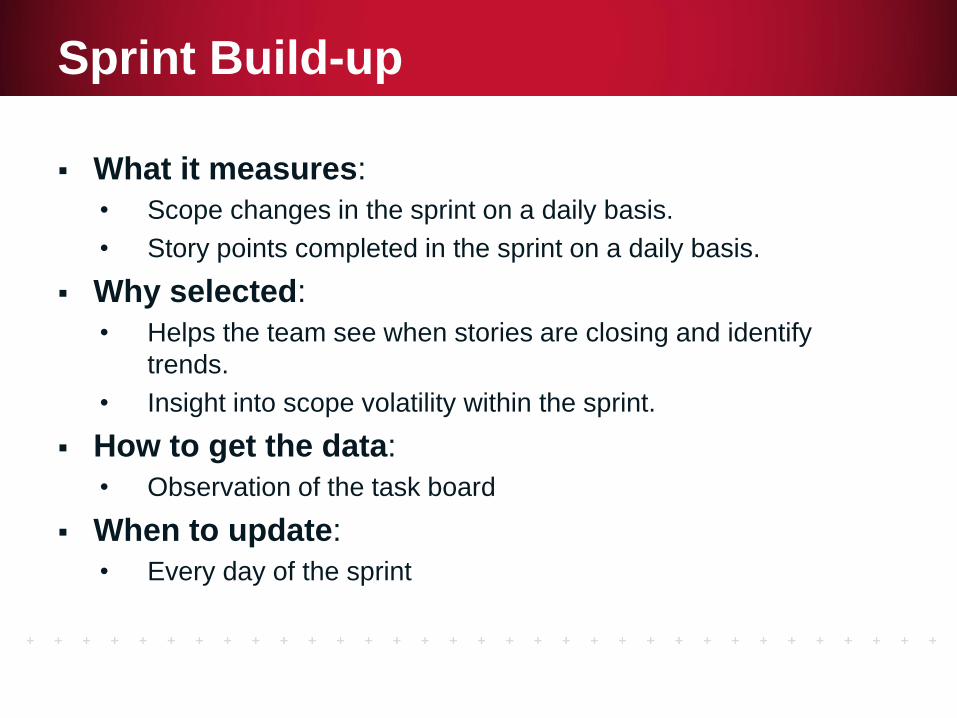
What it measures:
• Scope changes in the sprint on a daily basis.
• Story points completed in the sprint on a daily basis.
Why selected:
• Helps the team see when stories are closing and identify
trends.
• Insight into scope volatility within the sprint.
How to get the data:
• Observation of the task board
When to update:
• Every day of the sprint
Sprint Build-up

Sprint Build-Up Sample

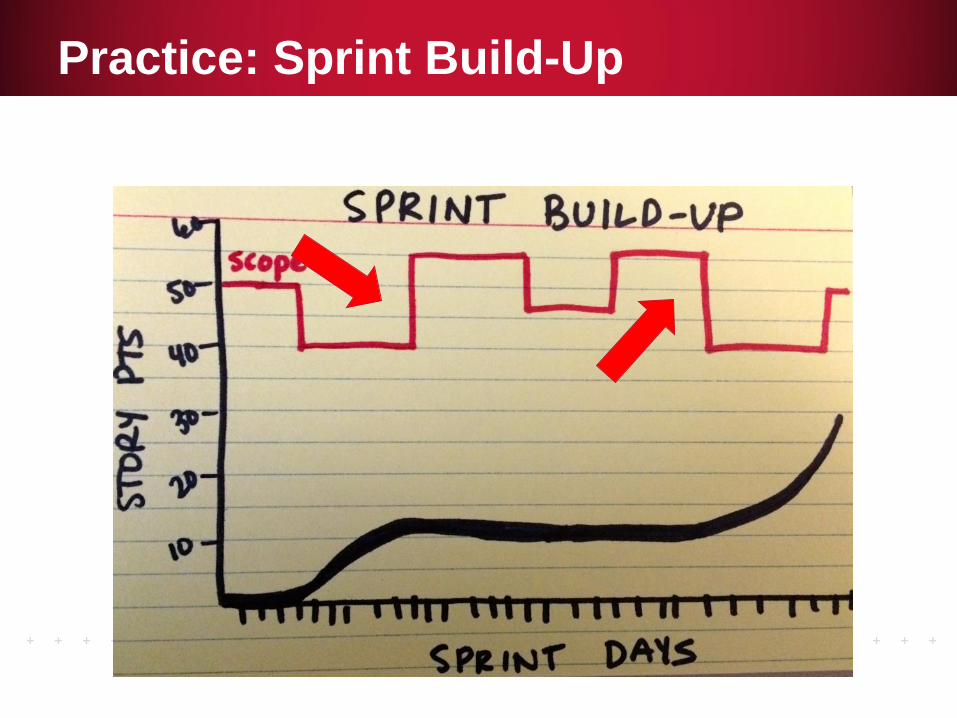
Practice: Sprint Build-Up
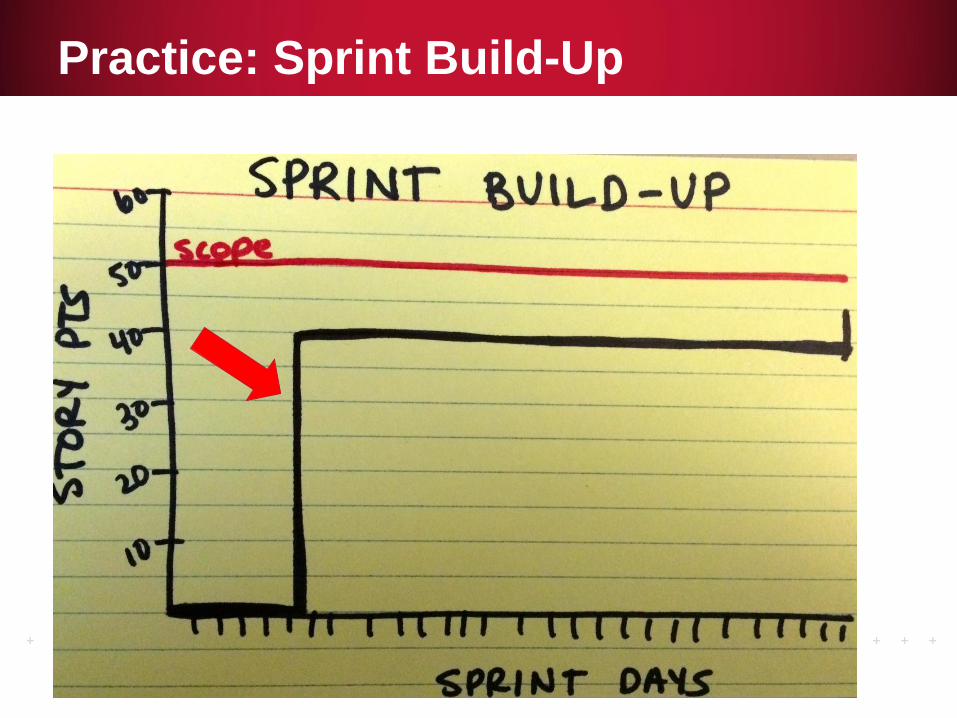
Practice: Sprint Build-Up
Practice: Sprint Build-Up
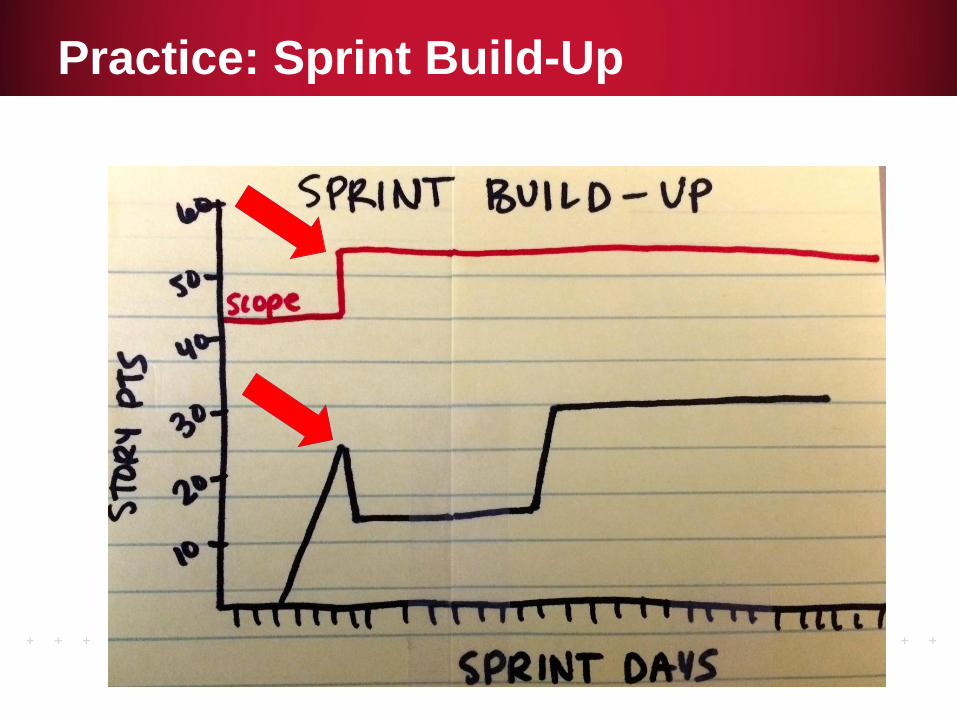
Practice: Sprint Build-Up
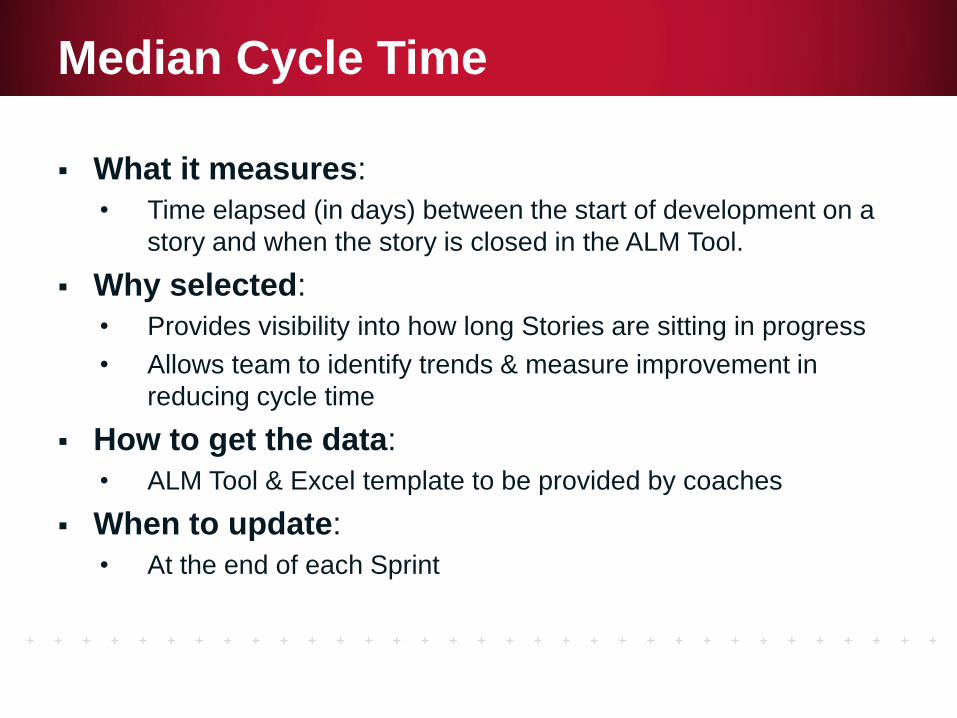
What it measures:
• Time elapsed (in days) between the start of development on a
story and when the story is closed in the ALM Tool.
Why selected:
• Provides visibility into how long Stories are sitting in progress
• Allows team to identify trends & measure improvement in
reducing cycle time
How to get the data:
• ALM Tool & Excel template to be provided by coaches
When to update:
• At the end of each Sprint
Median Cycle Time
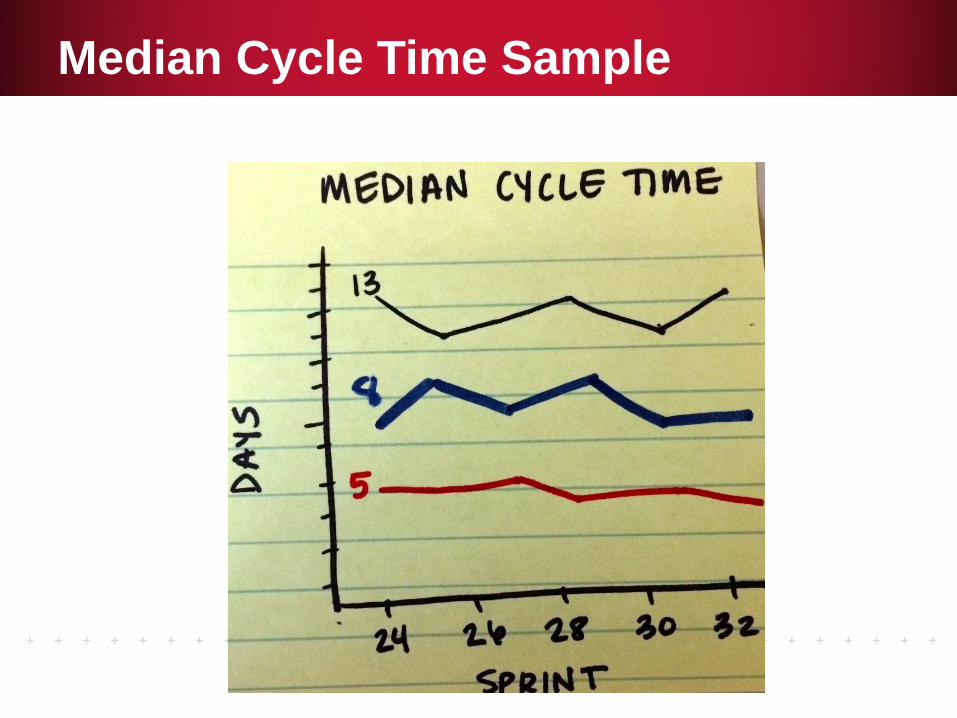
Median Cycle Time Sample
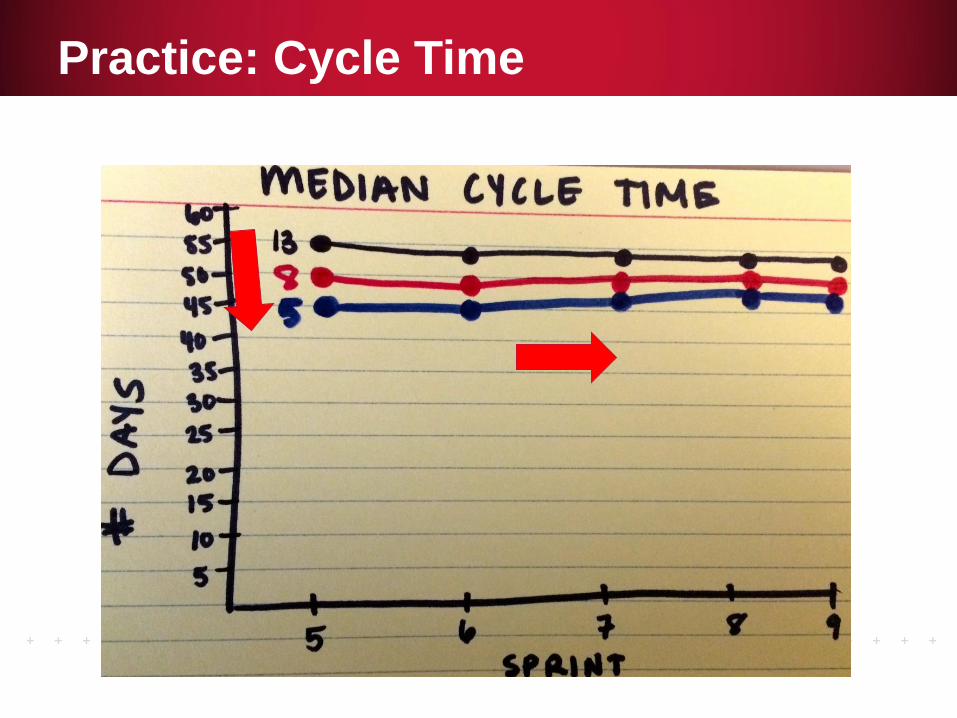
Practice: Cycle Time
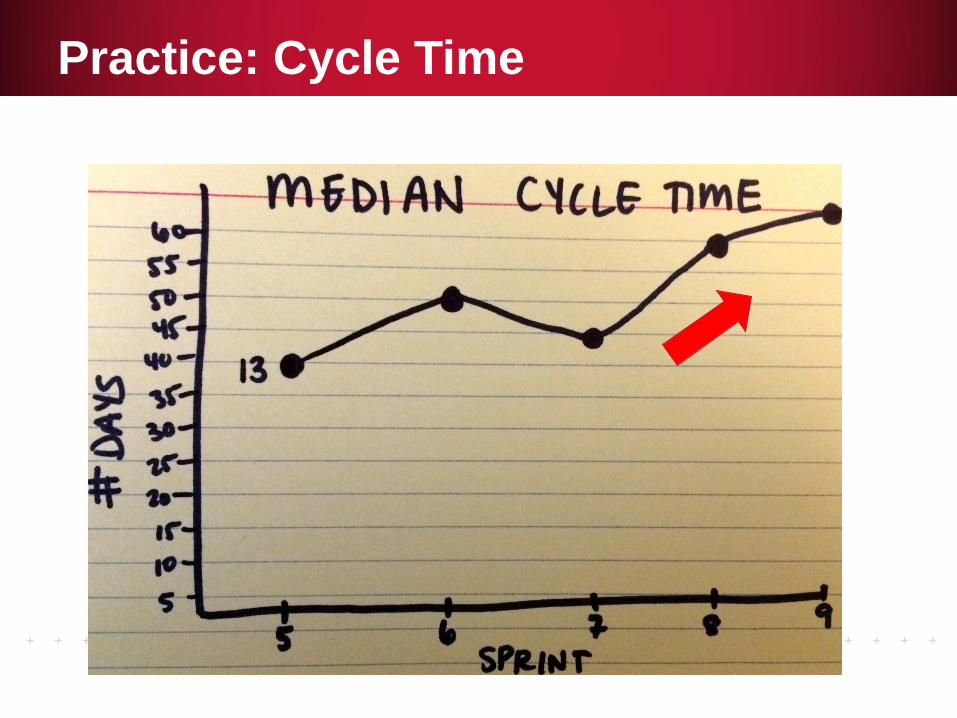
Practice: Cycle Time
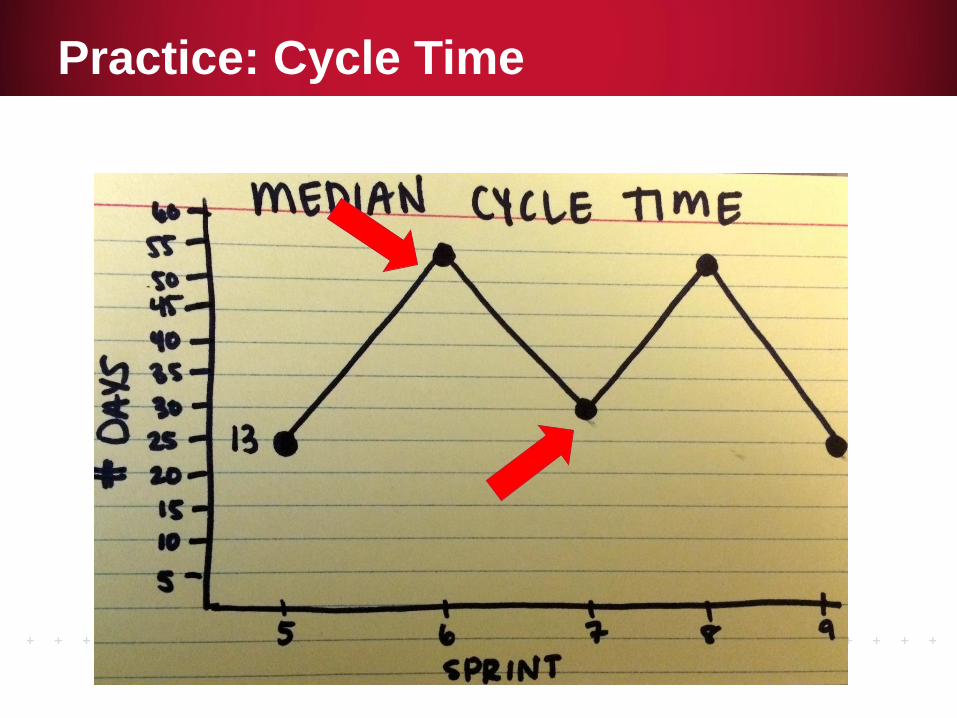
Practice: Cycle Time
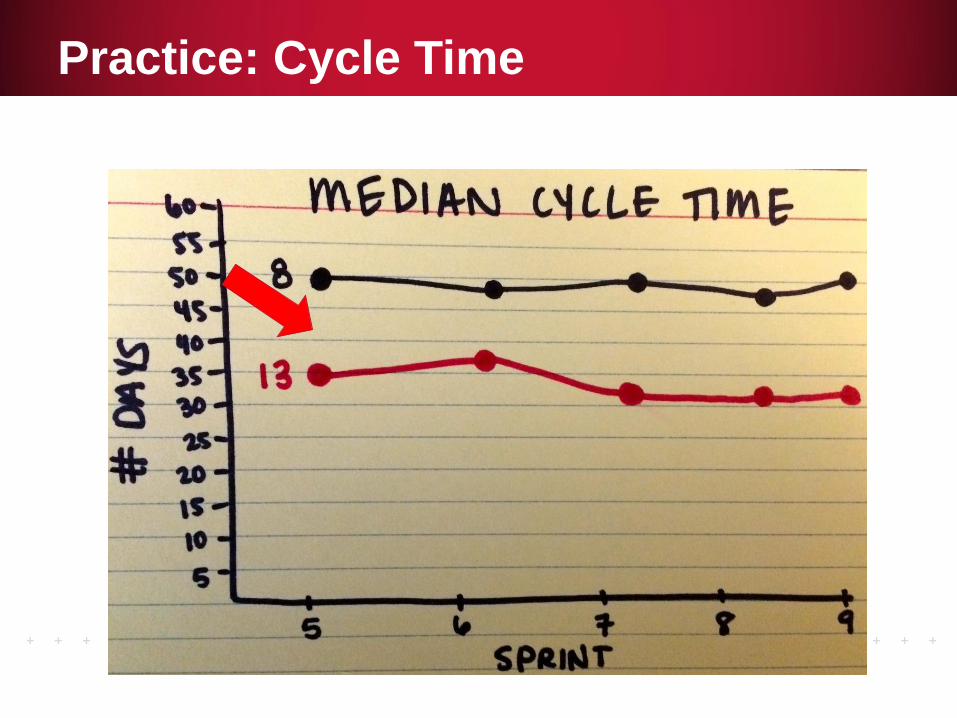
Practice: Cycle Time

Introduce teams to the metrics
Start radiating these metrics in the team space
• Velocity (updated at the end of the Sprint)
• Committed vs DONE (updated at the end of the Sprint)
• Median Cycle Time (updated at the end of the Sprint)
• Sprint Build-up (updated daily)
Use these metrics as input into retrospectives
Provide feedback and reach out to coaches with
questions
Next Steps