Keynote: Global Media Monitoring - M. Grobelnik - ESWC SS 2014

SS Monitoring – Manual
INDEX
• Introduction
• Sub-Station Data Entry & Reports
• Feeder Data Entry & Reports
• Transformer Data Entry & Report
• R&D Data Entry & Reports

SUB-INDEX
1. Introduction
2. Sub-Station Data Entry & Reports
• All SS List
• Circle SS List
• SS ABSTRACT
• SS List
• Data Updation
• SS Peak Year / MonthWise Rep
3. Feeder Data Entry & Reports
• Feeders List
• Circle SS Feeder List
• Circle Feeder Type
• KVWise Feeder List
• FeederPeak
• Over Load Feeders
• Under Load Feeders
• Feeder BD KV Wise Rep
• Feeder BD MonthWise Rep
• Feeder BD KVwise Annual Rep
• Feeder BD_Causewise rep
• Feeder BD Annual
• Fdr_outage_Yearwise Rep
• Fdr_outage_monthwise Rep
• FdrBD>2_Yearwise
• FdrBD>24 hrs_Yrwise
• Feeder BD KVwise Rep

• Fdr Peak Year / MonthWise Rep
4. Transformer Data Entry & Reports
• PrTr Mas Entry
• PrTr Allotment
• PrTr History
• Transformer Oil Test Result
• Transformer List
• Transformer Master
• Transformer Peak
• Transformer OverLoad
• Transformer UnderLoad
• Outage_Monthwise_Detail
• 70% Overloaded PrTrs
• Overloaded PrTrs
• PrTr Peak Year / MonthWise Rep
• Max PrTr Peak SoFar
• PrTr Peak SoFar
5. R&D Data Entry & Reports
• Tan Delta Test
• PrTr Oil Test
• Transformer Oil Test Report
• Transformer TAN Delta Report
• Tr Characteri Test Analysis
• Tr DGA Test Analysis

Introduction
Sub-Station Monitoring System captures Auto/Power Transformer, Feeders and Sub-Station peak details and breakdown details in the SS user’s login. The reports are generated for individual SS, Circles, Regions, Sub-Load Despatch Centres and Head Quarters. The URL is: http://192.168.150.66:8080/cc/ss
And the given username and password has to be entered to login to
the system.
Sub-Station Data Entry & Reports
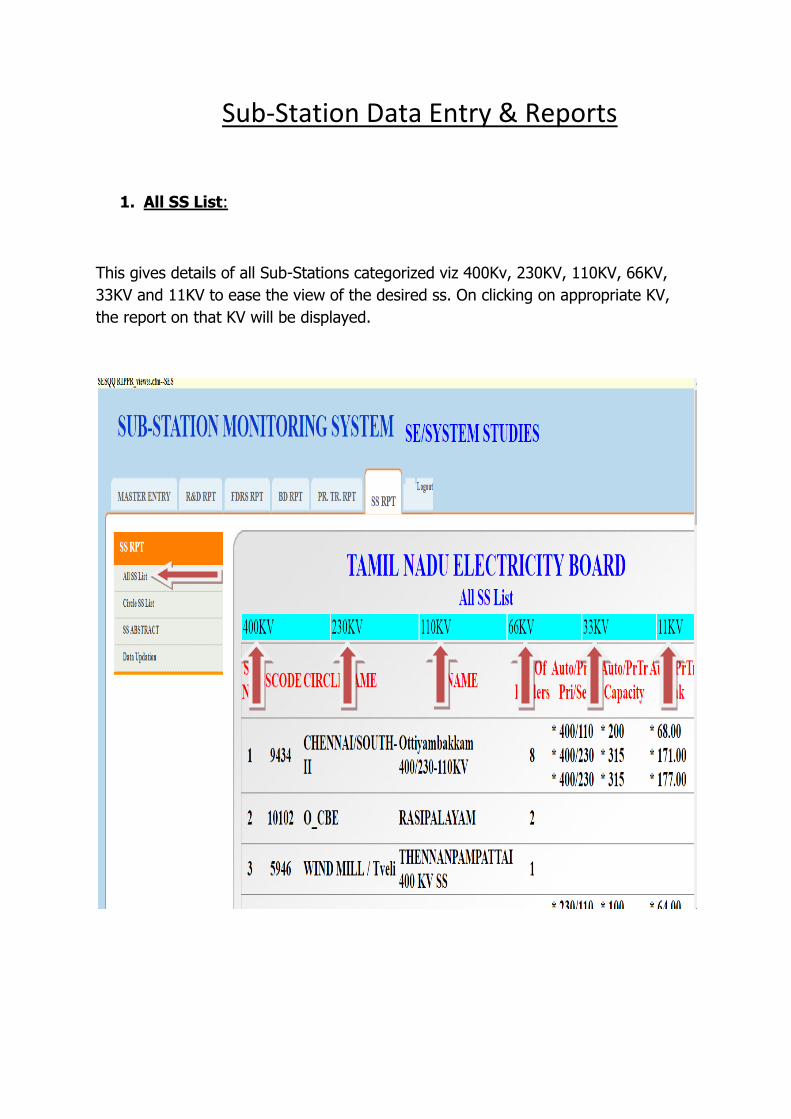
1. All SS List:
This gives details of all Sub-Stations categorized viz 400Kv, 230KV, 110KV, 66KV,
33KV and 11KV to ease the view of the desired ss. On clicking on appropriate KV,
the report on that KV will be displayed.

2. CIRCLE SS LIST:
The list of all Sub-stations will be displayed on selecting the particular Circle. The Circle has to be selected from the drop down menu, on selecting the circle the
report will be displayed as shown below:

3. SS ABSTRACT’:
Shows the Abstract report of the KV wise , Circle wise report.
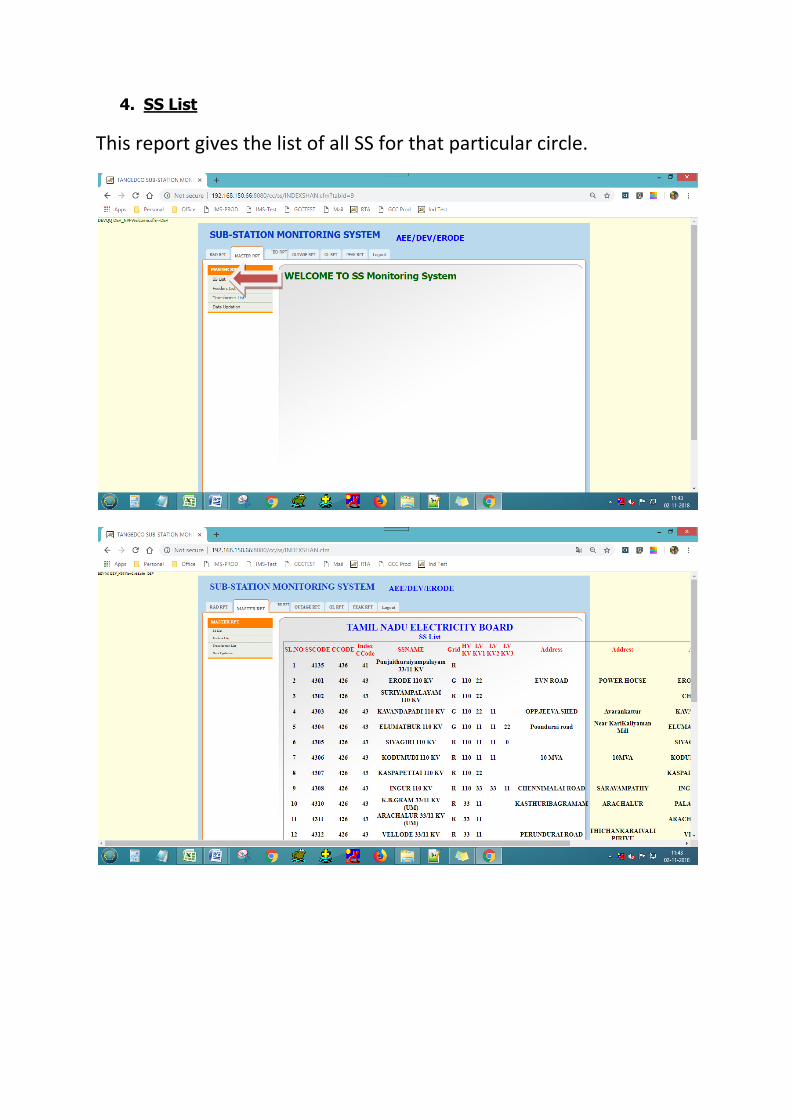
4. SS List
This report gives the list of all SS for that particular circle.

5. Data Updation
This menu helps in checking the SS Data Entry status for a particular
month. Select the month from the list and then click on the select
data.
Click on SS Total Peak Entry, Pr.Tr Peak Entry, Feeder Peak Entry to
view the status.

6. SS Peak Year / MonthWise Rep
This report gives the information about the Sub-Station peak
Year/Month wise as shown below. Select the year as shown.
Select the month as shown below.

Feeder Data Entry & Reports
1. Feeder List
This report gives the list of Feeders for a select Sub-Station.

2. Circle SS Feeder List
This report gives the feeders list of the Sub-Station by selecting that
circle and SS as shown below:

3. Circle Feeder Type
This report gives the type of feeders in all the Sub Station as shown
below.
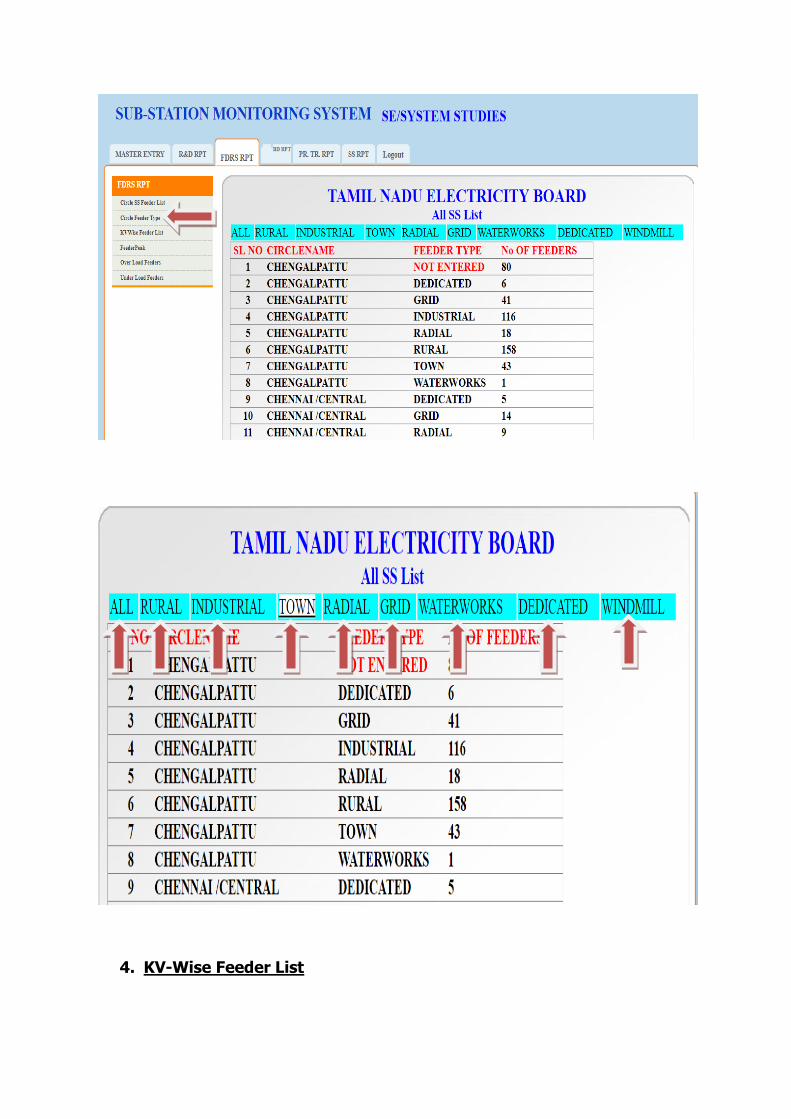
4. KV-Wise Feeder List

This report gives the Abstract OF KVWISE Feeder Type wise Feeder
List.
Click on the KV to list the Feeders as shown below.

5. Feeder Peak
This report gives the following information’s:
All SS of the Circle – Yearly report
All SS of the Circle – Monthly report
Particular SS – Yearly report
Particular SS -- Monthly report.


6. Over Load Feeders
This report gives the following information’s:
• Report on Overload Feeders for Month / Circle
• Report on Overload Feeders for Month / All Circles


7. Under Load Feeders
This report gives the following information’s:
• Report on Under load Feeders for Month / Circle
• Report on Under load Feeders for Month / All Circles

8. FEEDER BREAK DOWN ANNUAL:
This report gives the Feeder Break Down Annual Report.


9. FEEDER BREAK DOWN (Monthwise) Report:
This report gives the Feeder Break Down (Monthwise) Report.
Select the Feeder KV for the respective results (400KV, 230KV, 110KV, 66KV, 33KV,
11KV)

10. FEEDER BREAK DOWN (KVWise) Annual Report:
This report gives the Feeder Break Down (Monthwise) Report.
11. FEEDER BREAK DOWN (CauseWise) Report:
This report gives the Feeder Break Down (CauseWise) Report.

Select the year to view the failure year wise as shown below.
12. FEEDER OUTAGE (YearWise) Report:
This report gives the Feeder Outage (YearWise) Report.

13. FEEDER OUTAGE (MonthWise) Report:
This report gives the Feeder Outage (MonthWise) Report.

14. FEEDER BREAKDOWN >2 YearWise:
This report gives the Feeders under BD More Than 2 Times in a Year.
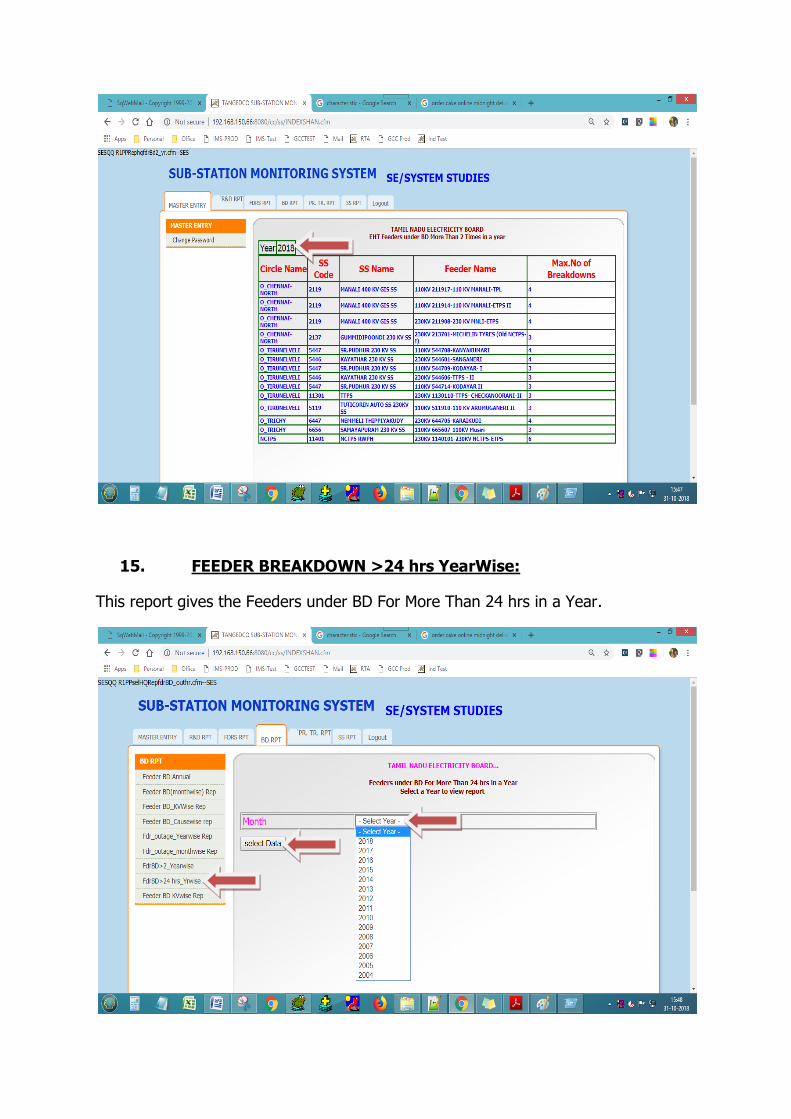
15. FEEDER BREAKDOWN >24 hrs YearWise:
This report gives the Feeders under BD For More Than 24 hrs in a Year.

16. Fdr_outage_monthwise Rep
This report give the information about EHT Feeders Outage
Monthwise.

Select the year as shown below.

17. Fdr Peak Year / MonthWise Rep
This report gives the information about the Feeder peak
Year/Month wise as shown below. Select the year as shown.
Select the month as shown below.

18. FEEDER BREAKDOWN KVWise Report:
This report gives the EHT Feeders Breakdown-Voltage wise.

Transformer Data Entry & Reports
1. PrTr Mas Entry
This menu gives the option for Data Entry for Auto / Power Tr Master
Entry. Fill all the information after selecting the Transformer type
and then click on “submit”.
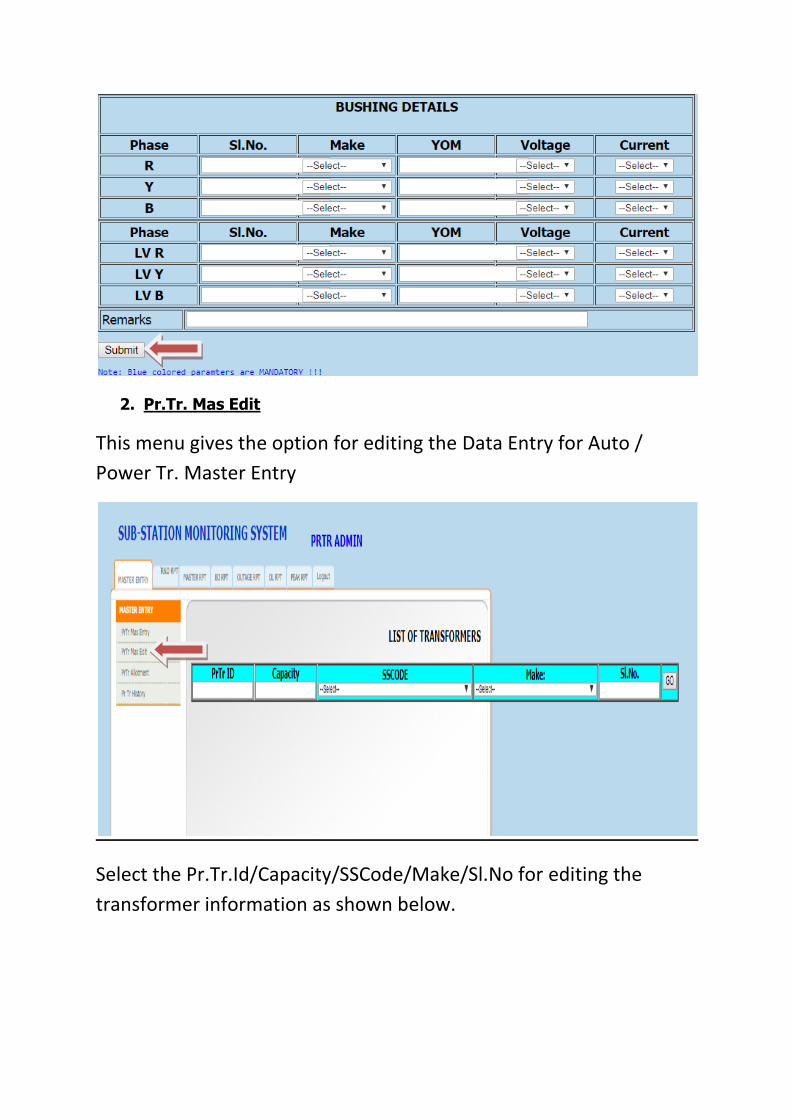
2. Pr.Tr. Mas Edit
This menu gives the option for editing the Data Entry for Auto /
Power Tr. Master Entry
Select the Pr.Tr.Id/Capacity/SSCode/Make/Sl.No for editing the
transformer information as shown below.
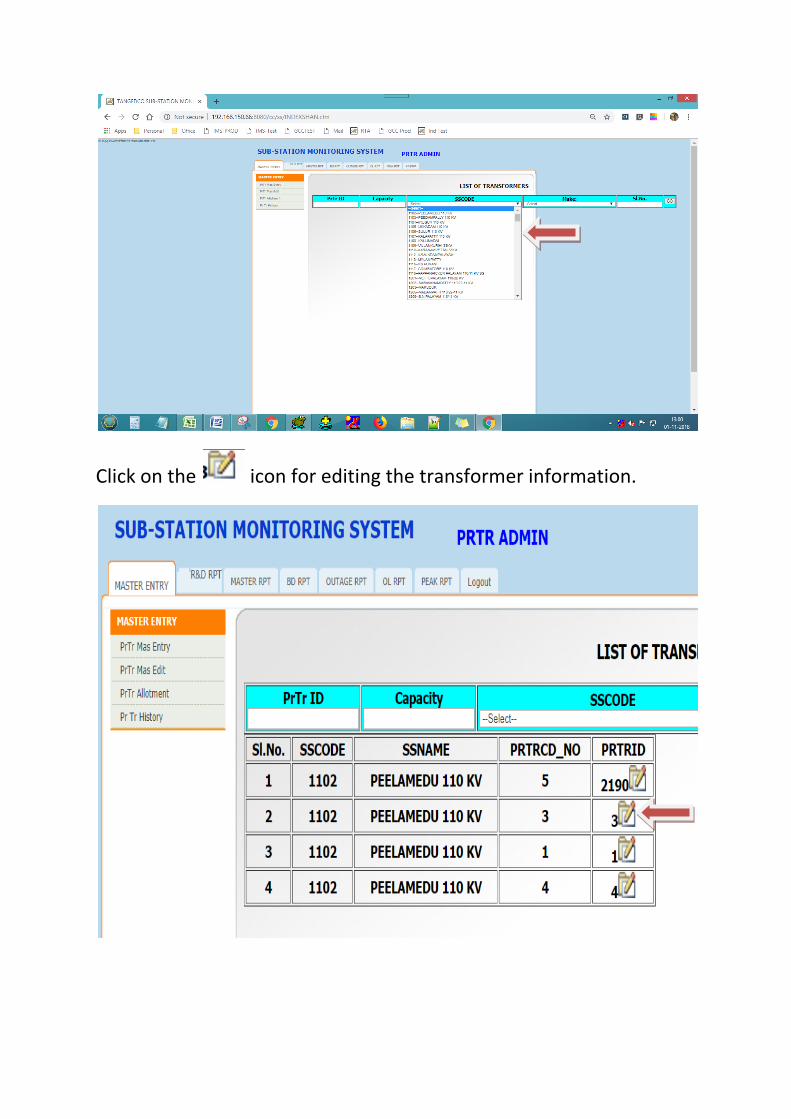
Click on the icon for editing the transformer information.

Change the necessary information and then click on the save button.
3. Pr.Tr.Allotment

This menu is used for allotting a Tansformer.
Click on “NEW” for allotting the Transformer as shown below.

Once you click on “NEW” it will list all the transformers and if you
want to allot a Transformer then click on “ALLOT” as shown below.
Once you click on “ALLOT” it will show the allotment information.
Please input all the data and then click on ”ALLOT” as shown below.

4. Pr.Tr.History
Click on “PrTr History” menu as shown below.
It will list all the Transformers as shown below.

Click on the icon for displaying the information about the
Transformer as shown below.
Once you click on the icon the information is displayed as shown
below. Click on the icon for generating the PDF report.
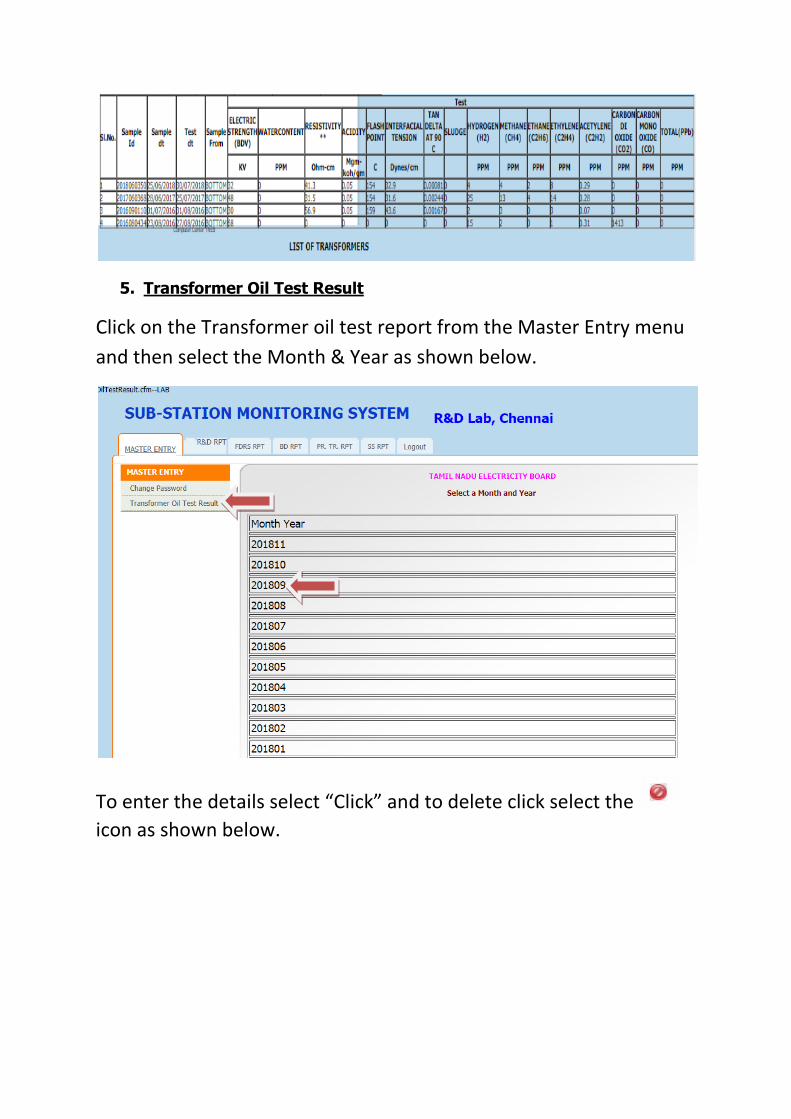
5. Transformer Oil Test Result
Click on the Transformer oil test report from the Master Entry menu
and then select the Month & Year as shown below.
To enter the details select “Click” and to delete click select the
icon as shown below.

Once you select the Click button the below information is displayed,
enter the information and click on Save button.


6. Transformer TAN-DELTA Result
Click on the “Master Entry” and then click on the “Transformer TAN Delta
Result” and then select the year as shown below.

It will list the entire request during that particular year as shown below.
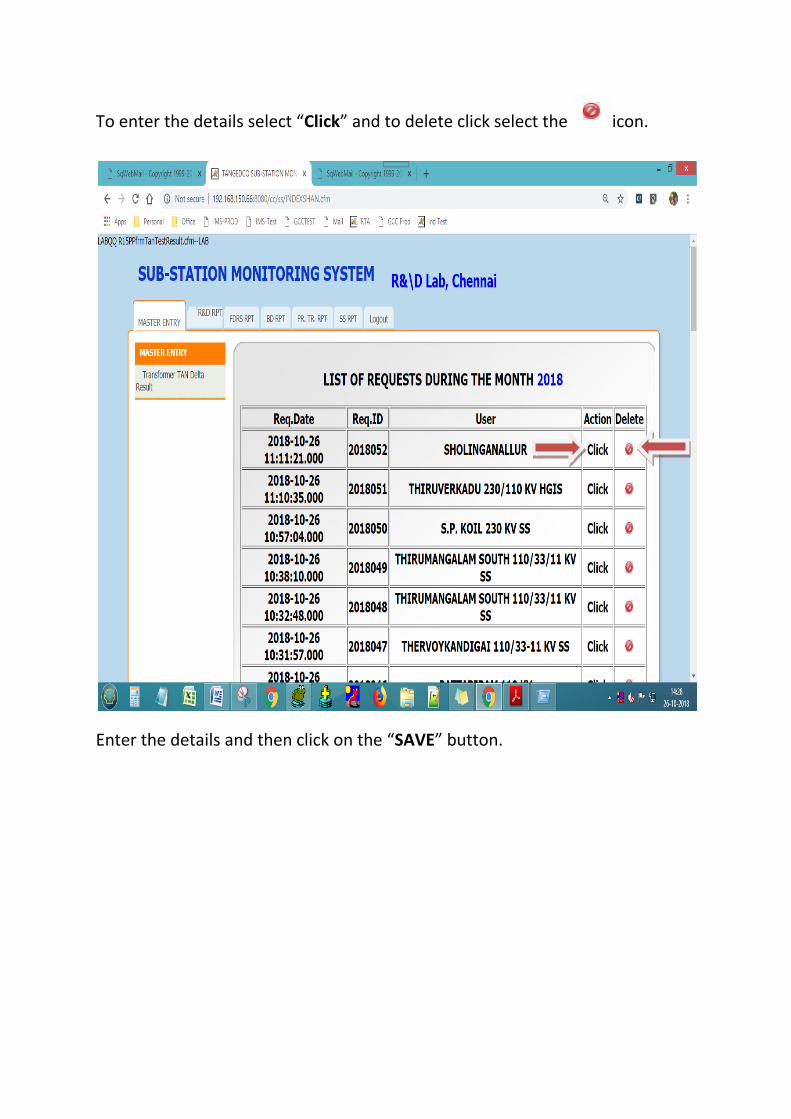
To enter the details select “Click” and to delete click select the icon.
Enter the details and then click on the “SAVE” button.

7. Transformer List
This report gives the list of Transformer’s for a particular Sub Station.
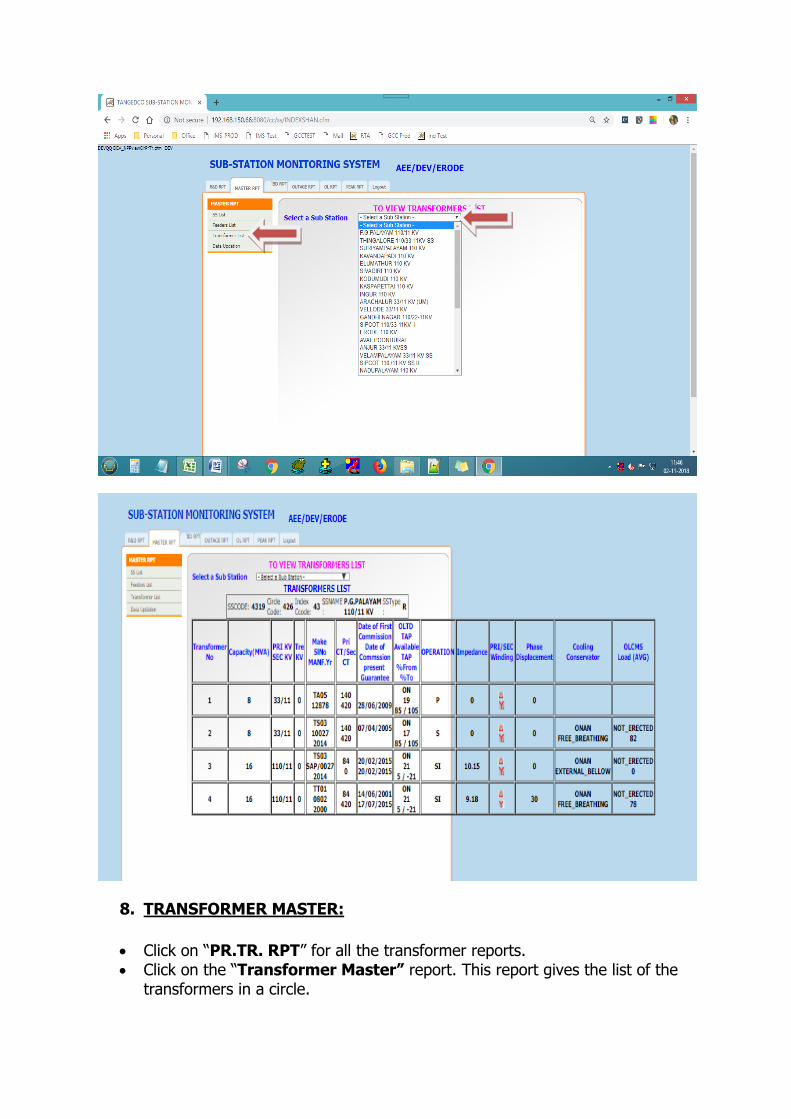
8. TRANSFORMER MASTER:
• Click on “PR.TR. RPT” for all the transformer reports. • Click on the “Transformer Master” report. This report gives the list of the
transformers in a circle.

9. TRANSFORMER PEAK:

This report gives the following information’s:
• Selected Circle All Sub-Station All Transformer Annual Peak data
• Selected Circle All Sub-Station All Transformer Monthly Peak data
• Selected Circle All Sub-Station All Transformer Annual Peak data
• Selected Circle All Sub-Station All Transformer Monthly Peak data
• Selected Circle Selected Sub-Station All Transformer Annual Peak data
• Selected Circle Selected Sub-Station All Transformer Monthly Peak data
• Selected Circle Selected Sub-Station Selected Transformer Annual Peak data
• Selected Circle Selected Sub-Station Selected Transformer Monthly Peak data


10. TRANSFORMER OVERLOAD:
This report gives the following information’s:
Overloaded Transformer Annual report for given range
Overloaded Transformer Monthly report for given range.
Default range is 70% to 70%

11. TRANSFORMER UNDER LOAD:
This report gives the information about the Transformer Under load data.

Select the month and the circle and click on the select data for displaying the
information.

12. Outage Monthwise Detail

This report gives the outage information month-wise for Pr.Tr.
Select the year as shown below.

13. 70% Overload Pr.Tr.’s
This report gives the list of 70% Overloaded Power
Transformers for a month.
It will display the result if there is a 70% overload as below.

14. Overloaded Pr.Tr.’s
This report gives the list of Overloaded Power Transformers
for a month.
It will display the result if there is an overload as below.
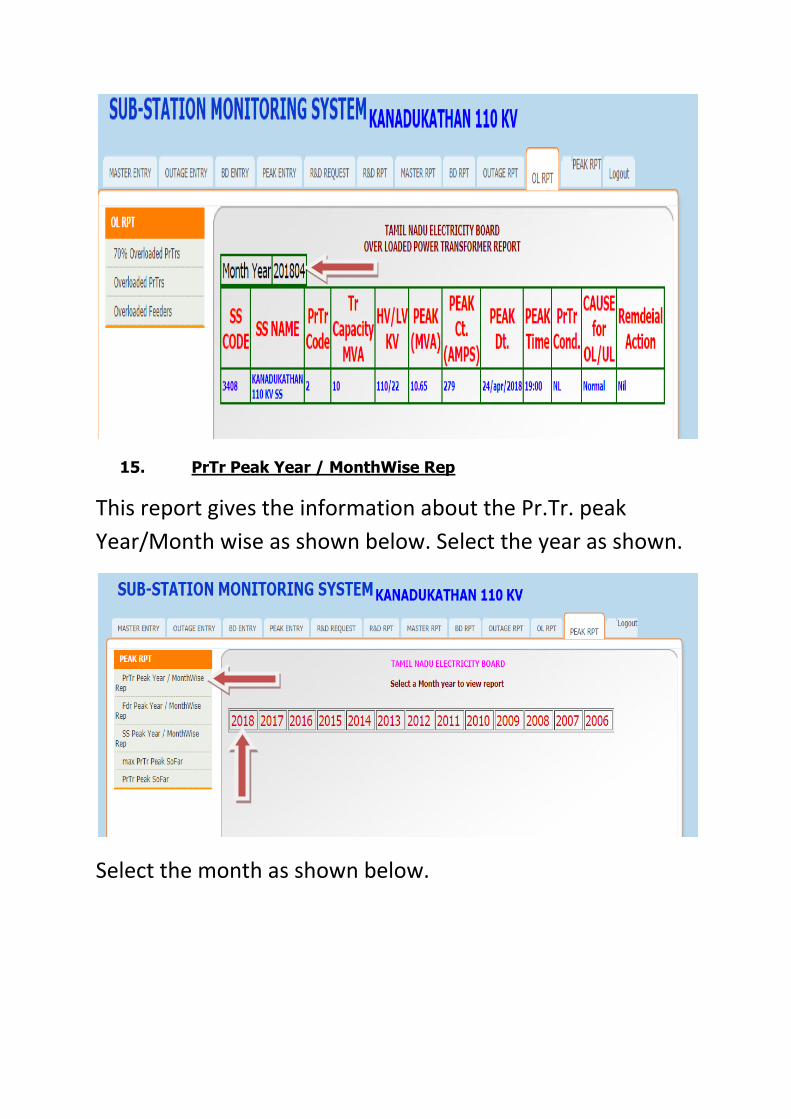
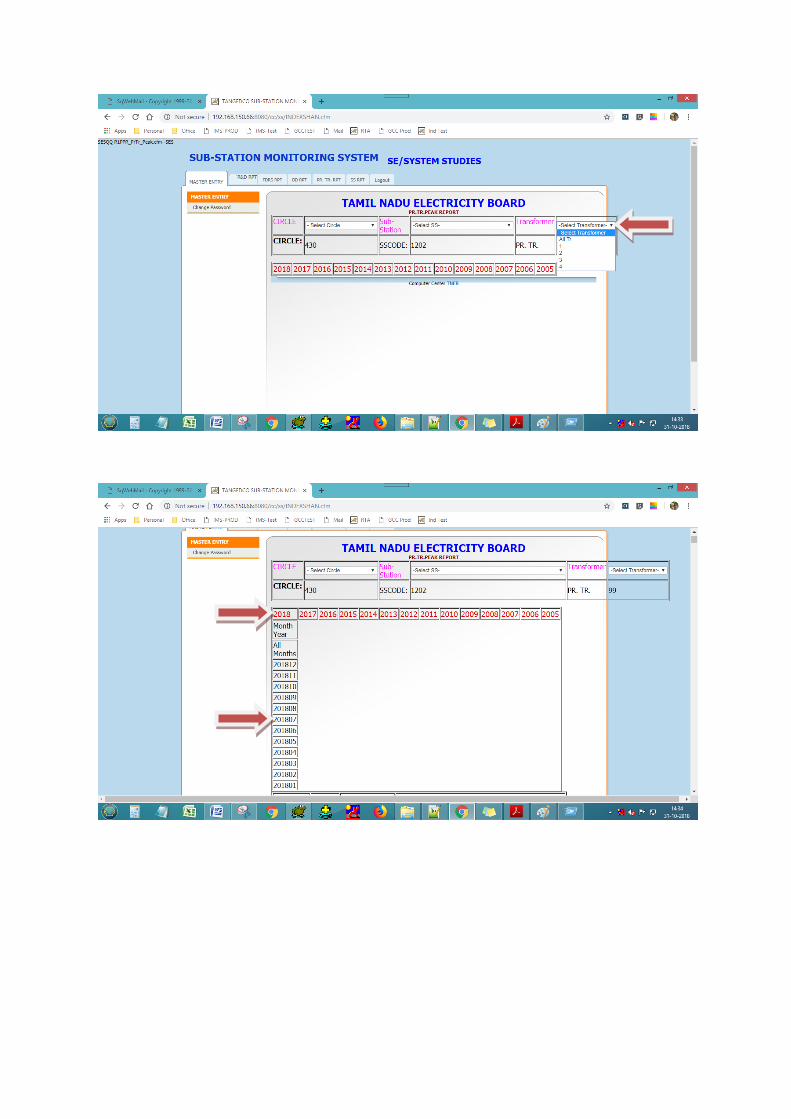
15. PrTr Peak Year / MonthWise Rep
This report gives the information about the Pr.Tr. peak
Year/Month wise as shown below. Select the year as shown.
Select the month as shown below.

The result is displayed as shown below.
This report gives the information about PR.TR. Max Peak
Sofar reached(Due to Load Growth, % Imp,NL) as shown
below.

16. max PrTr Peak SoFar
This report gives the information about PR.TR. Max Peak
Sofar reached(Due to Load Growth, % Imp,NL) as shown
below.

17. PrTr Peak SoFar
This report gives the information about the Pr.Tr.’s Peak for a
particular Sub-Station so far. Select the SS as shown below.
Select the Pr.Tr.Code to view the result as shown below.


R&D Data Entry & Reports
1. Pr.Tr. Oil Test:
This menu is used for Data Entry for Power Tr. Oil Test Request.
Select the Transformer from the list as shown below. Once you select
the transformer fill all the information and then click on the “SAVE”
Button.


2. TAN-DELTA TEST
Click on the “R&D Request” and then click on the “Tan Delta Test”.
Select the Transformer from the list as shown below and then click
on “Request to TANDELTA Test”. Select the transformer from the list
and then click on the Request TANDELTA Test button.

3. Transformer Oil Test Report
This report gives the transformer oil test information.


1. Click on the icon for viewing the report as shown below.
2. Click on the icon for generating the PDF for the report
3. Click on the icon for sending the report as an email.
4. Transformer TAN-DELTA Report
This report gives the transformer TAN-DELTA test information.

1. Click on the icon for viewing the report as shown below.
2. Click on the icon for generating the PDF for the report
3. Click on the icon for sending the report as an email.
5. Transformer Characteristic Test Report:
This report gives the transformer Characteristic test information.

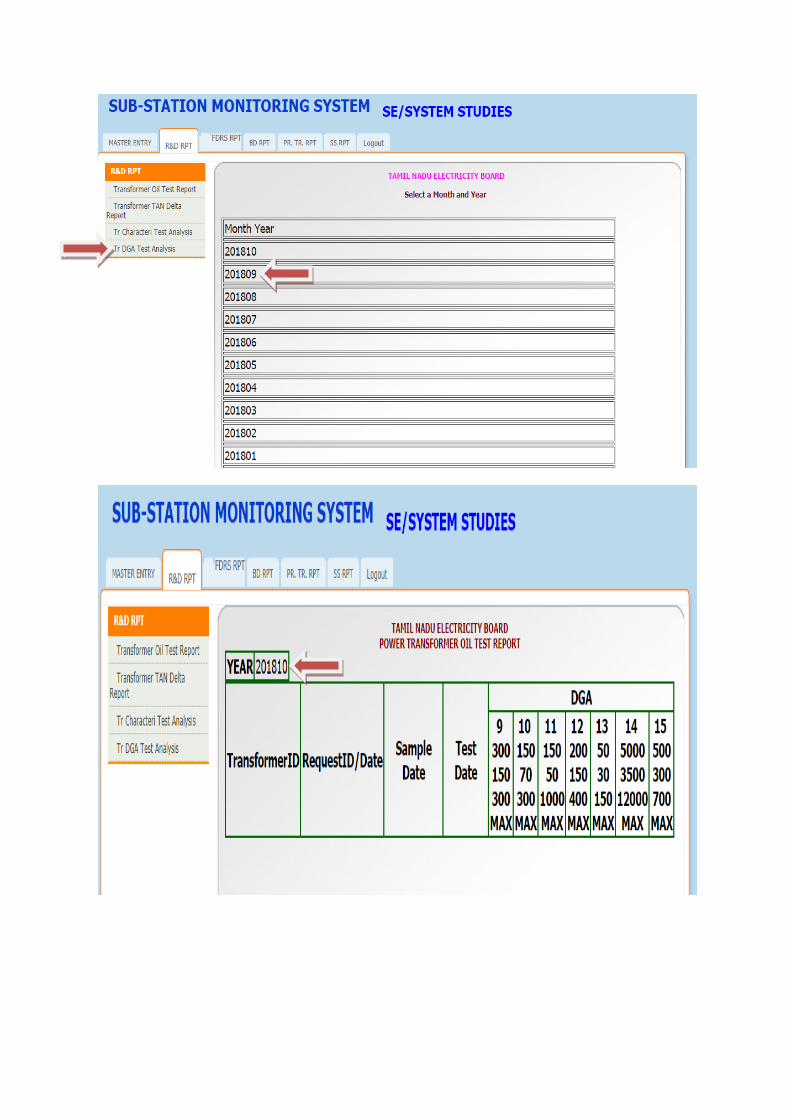
6. Transformer DGA Test Analysis
This report gives the transformer DGA test Analysis.