SOUTH COAST BIOREGION - fish.wa.gov.au COAST BIOREGION ... Fish stocks in this region are...
48
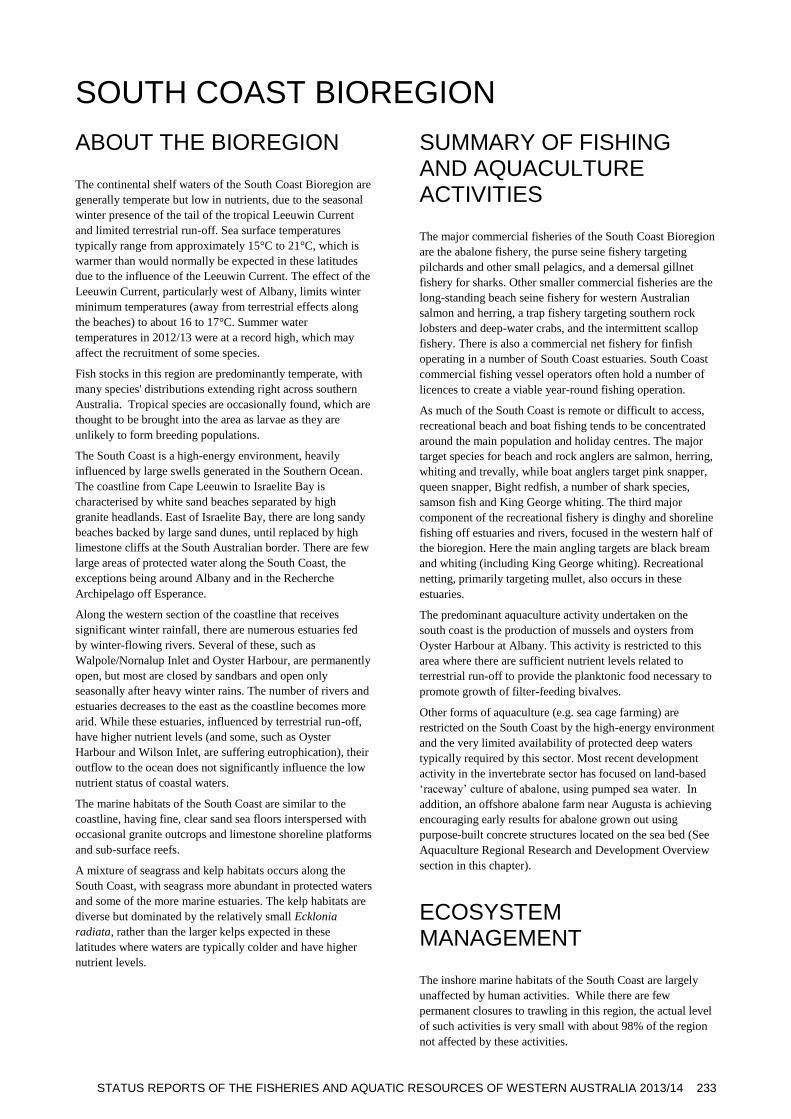
STATUS REPORTS OF THE FISHERIES AND AQUATIC RESOURCES OF WESTERN AUSTRALIA 2013/14 233 SOUTH COAST BIOREGION ABOUT THE BIOREGION The continental shelf waters of the South Coast Bioregion are generally temperate but low in nutrients, due to the seasonal winter presence of the tail of the tropical Leeuwin Current and limited terrestrial run-off. Sea surface temperatures typically range from approximately 15°C to 21°C, which is warmer than would normally be expected in these latitudes due to the influence of the Leeuwin Current. The effect of the Leeuwin Current, particularly west of Albany, limits winter minimum temperatures (away from terrestrial effects along the beaches) to about 16 to 17°C. Summer water temperatures in 2012/13 were at a record high, which may affect the recruitment of some species. Fish stocks in this region are predominantly temperate, with many species' distributions extending right across southern Australia. Tropical species are occasionally found, which are thought to be brought into the area as larvae as they are unlikely to form breeding populations. The South Coast is a high-energy environment, heavily influenced by large swells generated in the Southern Ocean. The coastline from Cape Leeuwin to Israelite Bay is characterised by white sand beaches separated by high granite headlands. East of Israelite Bay, there are long sandy beaches backed by large sand dunes, until replaced by high limestone cliffs at the South Australian border. There are few large areas of protected water along the South Coast, the exceptions being around Albany and in the Recherche Archipelago off Esperance. Along the western section of the coastline that receives significant winter rainfall, there are numerous estuaries fed by winter-flowing rivers. Several of these, such as Walpole/Nornalup Inlet and Oyster Harbour, are permanently open, but most are closed by sandbars and open only seasonally after heavy winter rains. The number of rivers and estuaries decreases to the east as the coastline becomes more arid. While these estuaries, influenced by terrestrial run-off, have higher nutrient levels (and some, such as Oyster Harbour and Wilson Inlet, are suffering eutrophication), their outflow to the ocean does not significantly influence the low nutrient status of coastal waters. The marine habitats of the South Coast are similar to the coastline, having fine, clear sand sea floors interspersed with occasional granite outcrops and limestone shoreline platforms and sub-surface reefs. A mixture of seagrass and kelp habitats occurs along the South Coast, with seagrass more abundant in protected waters and some of the more marine estuaries. The kelp habitats are diverse but dominated by the relatively small Ecklonia radiata, rather than the larger kelps expected in these latitudes where waters are typically colder and have higher nutrient levels. SUMMARY OF FISHING AND AQUACULTURE ACTIVITIES The major commercial fisheries of the South Coast Bioregion are the abalone fishery, the purse seine fishery targeting pilchards and other small pelagics, and a demersal gillnet fishery for sharks. Other smaller commercial fisheries are the long-standing beach seine fishery for western Australian salmon and herring, a trap fishery targeting southern rock lobsters and deep-water crabs, and the intermittent scallop fishery. There is also a commercial net fishery for finfish operating in a number of South Coast estuaries. South Coast commercial fishing vessel operators often hold a number of licences to create a viable year-round fishing operation. As much of the South Coast is remote or difficult to access, recreational beach and boat fishing tends to be concentrated around the main population and holiday centres. The major target species for beach and rock anglers are salmon, herring, whiting and trevally, while boat anglers target pink snapper, queen snapper, Bight redfish, a number of shark species, samson fish and King George whiting. The third major component of the recreational fishery is dinghy and shoreline fishing off estuaries and rivers, focused in the western half of the bioregion. Here the main angling targets are black bream and whiting (including King George whiting). Recreational netting, primarily targeting mullet, also occurs in these estuaries. The predominant aquaculture activity undertaken on the south coast is the production of mussels and oysters from Oyster Harbour at Albany. This activity is restricted to this area where there are sufficient nutrient levels related to terrestrial run-off to provide the planktonic food necessary to promote growth of filter-feeding bivalves. Other forms of aquaculture (e.g. sea cage farming) are restricted on the South Coast by the high-energy environment and the very limited availability of protected deep waters typically required by this sector. Most recent development activity in the invertebrate sector has focused on land-based ‘raceway’ culture of abalone, using pumped sea water. In addition, an offshore abalone farm near Augusta is achieving encouraging early results for abalone grown out using purpose-built concrete structures located on the sea bed (See Aquaculture Regional Research and Development Overview section in this chapter). ECOSYSTEM MANAGEMENT The inshore marine habitats of the South Coast are largely unaffected by human activities. While there are few permanent closures to trawling in this region, the actual level of such activities is very small with about 98% of the region not affected by these activities.
Transcript of SOUTH COAST BIOREGION - fish.wa.gov.au COAST BIOREGION ... Fish stocks in this region are...
STATUS REPORTS OF THE FISHERIES AND AQUATIC RESOURCES OF WESTERN AUSTRALIA 2013/14 233
SOUTH COAST BIOREGION
ABOUT THE BIOREGION
The continental shelf waters of the South Coast Bioregion are
generally temperate but low in nutrients, due to the seasonal
winter presence of the tail of the tropical Leeuwin Current
and limited terrestrial run-off. Sea surface temperatures
typically range from approximately 15°C to 21°C, which is
warmer than would normally be expected in these latitudes
due to the influence of the Leeuwin Current. The effect of the
Leeuwin Current, particularly west of Albany, limits winter
minimum temperatures (away from terrestrial effects along
the beaches) to about 16 to 17°C. Summer water
temperatures in 2012/13 were at a record high, which may
affect the recruitment of some species.
Fish stocks in this region are predominantly temperate, with
many species' distributions extending right across southern
Australia. Tropical species are occasionally found, which are
thought to be brought into the area as larvae as they are
unlikely to form breeding populations.
The South Coast is a high-energy environment, heavily
influenced by large swells generated in the Southern Ocean.
The coastline from Cape Leeuwin to Israelite Bay is
characterised by white sand beaches separated by high
granite headlands. East of Israelite Bay, there are long sandy
beaches backed by large sand dunes, until replaced by high
limestone cliffs at the South Australian border. There are few
large areas of protected water along the South Coast, the
exceptions being around Albany and in the Recherche
Archipelago off Esperance.
Along the western section of the coastline that receives
significant winter rainfall, there are numerous estuaries fed
by winter-flowing rivers. Several of these, such as
Walpole/Nornalup Inlet and Oyster Harbour, are permanently
open, but most are closed by sandbars and open only
seasonally after heavy winter rains. The number of rivers and
estuaries decreases to the east as the coastline becomes more
arid. While these estuaries, influenced by terrestrial run-off,
have higher nutrient levels (and some, such as Oyster
Harbour and Wilson Inlet, are suffering eutrophication), their
outflow to the ocean does not significantly influence the low
nutrient status of coastal waters.
The marine habitats of the South Coast are similar to the
coastline, having fine, clear sand sea floors interspersed with
occasional granite outcrops and limestone shoreline platforms
and sub-surface reefs.
A mixture of seagrass and kelp habitats occurs along the
South Coast, with seagrass more abundant in protected waters
and some of the more marine estuaries. The kelp habitats are
diverse but dominated by the relatively small Ecklonia
radiata, rather than the larger kelps expected in these
latitudes where waters are typically colder and have higher
nutrient levels.
SUMMARY OF FISHING AND AQUACULTURE ACTIVITIES
The major commercial fisheries of the South Coast Bioregion
are the abalone fishery, the purse seine fishery targeting
pilchards and other small pelagics, and a demersal gillnet
fishery for sharks. Other smaller commercial fisheries are the
long-standing beach seine fishery for western Australian
salmon and herring, a trap fishery targeting southern rock
lobsters and deep-water crabs, and the intermittent scallop
fishery. There is also a commercial net fishery for finfish
operating in a number of South Coast estuaries. South Coast
commercial fishing vessel operators often hold a number of
licences to create a viable year-round fishing operation.
As much of the South Coast is remote or difficult to access,
recreational beach and boat fishing tends to be concentrated
around the main population and holiday centres. The major
target species for beach and rock anglers are salmon, herring,
whiting and trevally, while boat anglers target pink snapper,
queen snapper, Bight redfish, a number of shark species,
samson fish and King George whiting. The third major
component of the recreational fishery is dinghy and shoreline
fishing off estuaries and rivers, focused in the western half of
the bioregion. Here the main angling targets are black bream
and whiting (including King George whiting). Recreational
netting, primarily targeting mullet, also occurs in these
estuaries.
The predominant aquaculture activity undertaken on the
south coast is the production of mussels and oysters from
Oyster Harbour at Albany. This activity is restricted to this
area where there are sufficient nutrient levels related to
terrestrial run-off to provide the planktonic food necessary to
promote growth of filter-feeding bivalves.
Other forms of aquaculture (e.g. sea cage farming) are
restricted on the South Coast by the high-energy environment
and the very limited availability of protected deep waters
typically required by this sector. Most recent development
activity in the invertebrate sector has focused on land-based
‘raceway’ culture of abalone, using pumped sea water. In
addition, an offshore abalone farm near Augusta is achieving
encouraging early results for abalone grown out using
purpose-built concrete structures located on the sea bed (See
Aquaculture Regional Research and Development Overview
section in this chapter).
ECOSYSTEM MANAGEMENT
The inshore marine habitats of the South Coast are largely
unaffected by human activities. While there are few
permanent closures to trawling in this region, the actual level
of such activities is very small with about 98% of the region
not affected by these activities.

SOUTH COAST BIOREGION
234 DEPARTMENT OF FISHERIES
The estuaries and near-shore marine embayments where there
is restricted water exchange, for example Princess Royal and
Oyster Harbours and Wilson Inlet, have experienced
eutrophication events associated with high nutrient loads
from adjacent land-based activity.
The Walpole–Nornalup Marine Park was declared on the 8th
May 2009 and is the first marine protected area on the South
Coast. The Department is developing a research and
monitoring plan for the Walpole-Nornalup Marine Park,
which forms one component of the Department’s research
and monitoring strategy within the broader bioregion.
Collectively, this monitoring information is used to assess the
effectiveness of management strategies applied to ensure
sustainable management of the State’s fish resources at the
bioregional level. Additional access restrictions in the
bioregion include closures under s.43 of the Fish Resources
Management Act 1994 surrounding the wreck of the ‘Perth’
(Albany), wreck of the ‘Sanko Harvest’ (east of Esperance),
and Esperance Jetty.
The Commonwealth Government’s is undertaking a Marine
Bioregional Planning process for Commonwealth waters
between Kangaroo Island, South Australia and Shark Bay.
The Department of Fisheries continues to provide advice to
the Environmental Protection Authority on development
proposals, which if implemented, have the potential to impact
on the aquatic environment. The Department also continues
to actively engage with the natural resource management
groups for the South Coast to promote sustainable use of the
aquatic environment.
ECOSYSTEM BASED FISHERIES MANAGEMENT
Identification of Ecological Assets
using the EBFM framework
Under the Integrated Marine and Coastal Regionalisation for
Australia scheme, the South Coast Bioregion has been
divided into 2 meso-scale regions: WA South Coast, Eucla
(IMCRA, V 4.0, 2006). This sub-regional scale of
management has now been adopted by the Department
through the implementation of an Ecosystem Based Fisheries
Management (EBFM) framework (Fletcher, et al., 2010) see
How to Use section for more details.
In terms of ecological assets, the Department has recognised
the following ecological values for the IMCRA regions
within the South Coast Bioregion:
Ecosystem structure and biodiversity (on a meso-scale basis);
Captured fish species;
Listed species (direct impact – capture or interaction);
Benthic habitats; and
External impacts.
For some issues a finer level of division of the IMCRA
ecosystems is used by the Department. This relates to recent
management initiatives necessary to recognise different suites
of exploited fish and invertebrates across the continental
shelf. These sub-components are defined by depth contours
(Estuarine, Nearshore 0-20m; Demersal 20-250m and
Pelagic). The full set of ecological assets identified for
ongoing monitoring are presented in South Coast Ecosystem
Management Figure 1.
Risk Assessment of Regional
Ecological Assets
The EBFM process identifies the ecological assets in a
hierarchical manner such that the assets outlined South Coast
Ecosystem Management Figure 1 are often made up of
individual components at species or stock level. The risks to
each of the individual stock or lower level components are
mostly detailed in the individual fishery reports presented in
this document. The following table (South Coast Ecosystem
Management Table 2) provides an overview and cumulative
assessment of the current risks to the ecological assets of the
South Coast Bioregion, at a bioregional level and provides a
mechanism for reporting on their status and the fisheries
management arrangements that are being applied. These
bioregional level risks are now used by the Department as a
key input into the Department’s Risk Register which,
combined with an assessment of the economic and social
values and risks associated with these assets, is integral for
use in the annual planning cycle for assigning priorities for
activities across all Divisions in this Bioregion.
Currently there are no marine pest monitoring programs
being undertaken by the Marine Biosecurity Research and
Monitoring Group in the South Coast Bioregion. However,
ongoing research includes an assessment of the likelihood of
a marine pest being introduced into ports via commercial
vessels and quantification of the risk associated with
recreational vessels for the introduction and translocation of
marine pests into this bioregion. Further detail may be found
in the Appendix section entitled “Activities of the Marine
Biosecurity Research Unit during 2012-13”.

SOUTH COAST BIOREGION
STATUS REPORTS OF THE FISHERIES AND AQUATIC RESOURCES OF WESTERN AUSTRALIA 2013/14 235
SOUTH COAST ECOSYSTEM MANAGEMENT TABLE 1
The areas and proportions of the South Coast Bioregion making up State Waters and all continental shelf waters, out to
200 m depth, which meet the IUCN criteria for classification as marine protected areas.
SOUTH COAST ECOSYSTEM MANAGEMENT TABLE 2
RISK LEVELS FOR EACH ASSET.
Risk levels in this table are developed by combining the individual (lower level) elements that make up each of the higher
level components. Low and Moderate values are both considered to be acceptable levels of risk. High and Significant
risks indicate that the asset is no longer in a condition that is considered appropriate and additional management actions
are required. Where the value is followed by (non-fishing) this indicates that all, or the majority of the risk value, was not
generated by fishing activities.
Ecosystem Structure and Biodiversity
Ecosystem Aquatic zone Risk Status and Current Activities
Estuarine Marine MODERATE
(non fishing)
The most likely cause of changes to community structure in estuarine
regions is changing rainfall levels and the manual opening or closing
of bars at river mouths.
Marine Marine LOW
An assessment by Hall and Wise (2011)1 of finfish community
structure using commercial data for the past 30 years found no
evidence of any concerning trend in mean trophic level, mean length
or FIB. Few other species are captured in this region.
Eucla Marine NEGLIGIBLE As above
Captured fish species
Fish species Aquatic zone Risk Status and Current Activities
Finfish
Estuarine MODERATE The catch and catch rate of this suite has been reasonably stable
for 10 years.
Nearshore HIGH
The capture of herring has been in decline for some years. A study
(reported in detail elsewhere In this report) has recently confirmed
that this is related to stock issues generated by reductions in
recruitment
Demersal HIGH
Given the concerns that there could be an increase in targeting of
demersal fishing on the south coast, an NRM funded project has
begun to examine the stock status of this suite.
Pelagic LOW
While the spawning biomass of sardines has returned to
appropriate levels, their capture levels and that of other pelagic fish
has not returned to pre-virus levels due to market problems and
changed fish behaviour.
1 Hall, N.G. and Wise, B.S. 2011. Development of an ecosystem approach to the monitoring and management of Western Australian fisheries. FRDC Report – Project 2005/063.
Fisheries Research Report No. 215. Department of Fisheries, Western Australia. 112pp.
IUCN
category or
equivalent
State Waters only All Waters (17,116 km2) (534,016 km2 (including State waters))
Fisheries Existing MPA Fisheries Existing MPA km2 % km2 % km2 % km2 %
I 0 0 0 0 0 0 0 0
II 1 < 1 0 0 1 < 1 0 0
III 0 0 0 0 0 0 0 0
IV 2,400 14 15 < 1 2,400 < 1 15 < 1
V 0 0 0 0 0 0 0 0
VI 14,700 86 0 0 531,600 99 0 0

SOUTH COAST BIOREGION
236 DEPARTMENT OF FISHERIES
Fish species Aquatic zone Risk Status and Current Activities
Crustaceans Shelf MODERATE The catch levels of lobsters and crabs remains at relatively low but
consistent levels.
Molluscs
Nearshore MODERATE The stocks of abalone are maintained at appropriate levels
Shelf NEGLIGIBLE The stocks of scallops varies annually and fishing only occurs
when stocks are abundant
Listed species
Listed fish
species Species Risk Status and Current Activities
Listed non
‘Fish’ species
Non fish (birds) MODERATE The capture of shearwaters in purse seine operations has been
addressed by a code of conduct
Mammals MODERATE
The potential for the capture of sealions and seals by all fishing
operations in this region, but especially gillnets has been the subject of a
number of recent studies.
Listed ‘Fish’
Species Fish NEGLIGIBLE There are few risks to the listed fish species in this region
Benthic habitat
External Drivers (Non Fishing)
Estuarine
Marine
WA South Coast
Eucla
Ecosystems
Estuarine
Shelf
Habitats
Estuarine
Nearshore
Demersal
Pelagic
Finfish
Shelf
Crustaceans
Nearshore (abalone)
Shelf (Scallops)
Molluscs
Captured Species
Fish
Non 'Fish'
Listed Species
South Coast Bioregion
Ecological Resources/Assets
SOUTH COAST ECOSYSTEM MANAGEMENT FIGURE 1
Component tree showing the ecological assets identified and separately assessed for the South Coast Bioregion.
Benthic Habitat Risk Status and Current Activities
Estuaries/
Nearshore
LOW
(non fishing)
There are few fishing activities that would impact on nearshore or estuarine
habitats. There may be risks at some locations due to coastal development
activities.
Shelf NEGLIGIBLE
The shelf region in this bioregion has very little habitat disturbance. Less
than 3% of the area is trawled and there are no other activities that would
materially impact on the habitats in these areas.
External Drivers Risk Status and Current Activities
Introduced Pests
and Diseases HIGH
The identification of the pest algae Codium fragile fragile in Albany highlights the
issues that now face many ports in Australia
Climate LOW This area is unlikely to be impacted by climate change in the near future.

SOUTH COAST BIOREGION
STATUS REPORTS OF THE FISHERIES AND AQUATIC RESOURCES OF WESTERN AUSTRALIA 2013/14 237
Introduced Pests Status Report
Regional Monitoring and Research Update
The introduction and spread of marine pests in WA waters
poses a serious threat to native biodiversity and can have
widespread effects on both our economy and health. There
are two key vectors for marine pest translocation: ballast
water and hull fouling. The Marine Biosecurity Research and
Monitoring group continue to implement a series of
biosecurity related projects in the South Coast Bioregion with
three aims. The first is to examine the likelihood of
inoculation, infection and establishment of compatible marine
pests in the North Coast Bioregion from commercial vessel
movements (see Bridgwood & McDonald 20141). The second
aim is for early detection of the presence of introduced
marine pests (IMPs) using a suite of tools. The third is to
undertake a control program targeting the marine pest
Codium fragile ssp fragile, a green alga present in Albany
Port’s waters.
From a biosecurity perspective the introduction of a marine
pest to any region is based on multiple factors that can be
grouped into two themes; the likelihood of inoculation and
the likelihood of infection and establishment. Inoculation
likelihood assumes that the greater the number of vessel visits
from a source with introduced marine pests (IMP) the greater
the risk of IMPs being brought into the recipient port i.e. a
positive linear relationship. Based on available commercial
vessel data from 2011, there were 302 commercial visits to
the South Coast Bioregion and the greatest inoculation risk
was from international vessel movements. The infection and
establishment likelihood takes into account the sources of
IMPs (based on a vessels last port of call (LPOC)), the
frequency of visits from those sources and the compatibility
between the IMPs salinity and temperature tolerances and
South Coast Bioregion. There was a 95% compatibility rating
of potential inbound IMPs with the environment of the South
Coast Bioregion from 19 international LPOC (Introduced
Pests Figure 1). When the cumulative effect of the number of
vessel visits from a LPOC and number of IMPs present at
that LPOC is considered, the greatest infection and
establishment risk to the South Coast Bioregion was from
China, followed closely by Japan (Introduced Pests Figure 2).
The Marine Biosecurity Research and Monitoring group,
with financial and in-kind assistance from the Esperance
Ports Sea and Land Authority and the Department of
Transport is running an Early Warning System program using
in-situ sampling arrays to aid in the early detection of marine
pests. Early detection of IMPs is vital if any attempt at
eradication or other management strategies is to be
successful. Through this surveillance the only species
detected to date is the colonial ascidian Didemnum
perlucidum.
In early 2014 the Marine Biosecurity Research and
Monitoring group undertook the first stage of a control
program to manage the population of C. fragile ssp. fragile in
Albany Port’s waters. Stage one consisted of divers removing
by hand any detected specimens of the algae. The second
stage, planned for late 2014 will involve a diving-based
survey of the controlled area to determine if the alga persists
and if so in what density. Further control strategies will
depend on the outcome of that repeat survey.
INTRODUCED PESTS FIGURE 1
The last port of call locations of compatible IMPs for the South Coast Bioregion
1 Bridgwood, S and McDonald, J. 2014. A likelihood analysis of the introduction of marine pests to Western Australian ports via commercial vessels. Fisheries Research Report No.
259. Department of Fisheries, Western Australia. 212pp.

SOUTH COAST BIOREGION
238 DEPARTMENT OF FISHERIES
INTRODUCED PESTS FIGURE 2
Ranking of the infection and establishment risk posed to the South Coast Bioregion by international and domestic last
ports of call. Each last port of call value is expressed as a relative percentage of the largest last port of call value (i.e.
China 100%).
FISHERIES
South Coast Crustacean Fisheries Status Report
J. How and R. Oliver
Fishery Description
The ‘south coast crustacean fisheries’ comprise four pot-
based fisheries, which operate from Augusta to the South
Australian border. They include the Windy Harbour/Augusta
Rock Lobster Managed Fishery, the Esperance Rock Lobster
Managed Fishery (ERLF), the Southern Rock Lobster Pot
Regulation Fishery operating in the Albany and Great
Australian Bight areas, and the South Coast deep-sea crab
fishery (South Coast Crustacean Figure 1).
The fisheries are multi-species and take southern rock lobster
(Jasus edwardsii) and western rock lobster (Panulirus
cygnus) as well as deep-sea crab species including giant crab
(Pseudocarcinus gigas), crystal crab (Chaceon albus) and
champagne crab (Hypothalassia acerba).
Southern rock lobster comprises the majority of the catch in
the eastern areas of the fishery, with crab species becoming
more prevalent in the south-western region (South Coast
Crustacean Figure 2). Western rock lobster is a significant
component of the catch in the Windy Harbour/Augusta Rock
Lobster Managed Fishery (not reported here due to
confidentiality provisions relating to the small number of
licensees).
Governing legislation/fishing authority
Commercial
Windy Harbour-Augusta Rock Lobster Managed Fishery
Management Plan 1987
Esperance Rock Lobster Managed Fishery Management Plan
1987
Southern Rock Lobster Regulation Licence
Fishing Boat Licence Condition 105
Commonwealth Government Environment Protection and
Biodiversity Conservation Act 1999 (Wildlife Trade
Operation).
Main Features
Status Current Landings
Stock level Adequate Southern Rock Lobster 46 t
Fishing Level Acceptable Deep sea crabs 23 t

SOUTH COAST BIOREGION
STATUS REPORTS OF THE FISHERIES AND AQUATIC RESOURCES OF WESTERN AUSTRALIA 2013/14 239
Recreational
Fish Resources Management Act 1994; Fish Resources
Management Regulations 1995 and other subsidiary
legislation
Consultation process
The Department is responsible for the statutory management
plan consultation and undertakes consultation directly with
licensees on operational issues and processes. Industry
Annual Management Meetings are convened by the West
Australian Fishing Industry Council (WAFIC), who are also
responsible for statutory management plan consultation under
a Service Level Agreement with the Department.
Boundaries
Management boundaries for the south coast crustacean
fisheries are shown in South Coast Crustacean Figure 1. The
‘boundaries’ of the deep-sea crab component of the fishery
(managed by Fishing Boat Licence Condition 105) include all
the waters of these fisheries deeper than 200 metres,
excluding those of the ERLF, where crabs may only be taken
by licensees in the ERLF.
Management arrangements
Commercial
These commercial fisheries are managed primarily through
input controls in the form of limited entry, pot numbers, size
limits and seasonal closures.
The fishing season for rock lobster across all four south coast
crustacean fisheries mirrors the previous West Coast Rock
Lobster Managed Fishery season (prior to the 2010/11 season
i.e. 15 November to 30 June). Fishing for deep-sea crabs can
currently occur all year, but during the rock lobster season
operators fishing under the authority of a Southern Rock
Lobster Pot Regulation Licence must only use the number of
pots specified on their authorisation. There is currently no
limit on the number of deep sea crab pots that can be used by
holders of Fishing Boat Licence Condition 105. This is being
addressed as part of the new management plan for the south
coast crustacean fishery. Catch statistics for the fisheries are
based on the period from 1 November to 31 October
inclusive.
In 2012/13 there were two Windy Harbour/Augusta Rock
Lobster Managed Fishery Licences; eight licences in the
ERLF (five vessels reported catch); 28 licences in the
Southern Rock Lobster Pot Regulation Fishery (17 vessels
reported catch) and 23 holders of Fishing Boat Licence
Condition 105 (ten vessels reported catch).
Recreational
Recreational fishers generally only target rock lobster. They
are restricted to the use of 2 pots per person and divers are
only permitted to take rock lobster by hand, or with the use of
a loop or other device that is not capable of piercing the rock
lobster.
Size limits, bag limits and seasonal closures apply and all
recreational fishers are required to hold a current Rock
Lobster Recreational Fishing Licence.
Research summary
A recent pre-assessment of the fishery for Marine
Stewardship Certification has been the focus of the research
for this fishery. It has resulted in the development of
standardised catch rates to evaluate the stock status and a
proposed harvest strategy and control rules framework, based
on the catch rates.
Retained Species
Commercial landings (season 2012/13):
Southern rock lobster 47 tonnes
Deep sea crabs 23 tonnes
Western rock lobster not reported
due to confidentiality policy (too few operators)
In 2012/13, the south coast catch of southern rock lobster
46.5 t was below the target catch range and slightly lower
than last year’s catch of 51.2 t (South Coast Crustacean
Figure 2a). However, this target catch range is currently
being reviewed as a part of the overall review of the
management for this fishery. The catch records are based on
monthly statutory (catch and effort) returns.
The deep-sea crab catch was similar to year’s catch of 22 t,
comprising of 4.0 tonne of champagne, 13.7 t of giant, and
5.0 t of crystal crab.
Recreational
Southern rock lobsters <5 tonnes
Estimates from mail surveys sent to a randomly selected
sample of Rock Lobster Recreational Fishing Licence holders
(approx. 10%) suggests that the recreational catch of southern
rock lobsters on the south coast is less than 5 t per year.
The number of Rock Lobster Recreational Fishing Licence
holders that catch southern rock lobster is small and
estimating the recreational catch more accurately would
require a dedicated survey or at least a different sampling
strategy to the current mail survey. The small quantities taken
on the south coast, does not significantly affect the overall
sustainability of the stock, and therefore a more detailed
survey is not a priority.
Fishing effort/access level
The effort figures are based on monthly statutory catch and
effort (CAES) returns. There was a total of 267,035 potlifts
recorded for all fishing in the south coast crustacean fisheries,
with almost half (114,925) potlifts occurring in the Albany
area. The remainder of the effort was spread between
Esperance (60,760 potlifts), Windy Harbour / Augusta
(47,648 potlifts) and the Bight (43,702 potlifts) areas.
As effort from CAES does not specify the effort level for
particular species, sub-setting of the data is required to
determine the effort levels relating to specific catches.
Therefore, fishers are assumed to be targeting a particular
species if that species represents >90% of the catch in a
CAES record. The associated effort for that trip and species is
then ascribed ‘targeted’ effort. Targeted effort for southern
rock lobster in south coast crustacean fisheries has declined
SOUTH COAST BIOREGION
240 DEPARTMENT OF FISHERIES
by 7% this season to 117,228 potlifts, after progressively
increasing for each of the last four seasons (South Coast
Crustacean Figure 2b).
Stock Assessment
Assessment complete Yes
Assessment level and method:
Level 2 - Catch rate
Breeding stock levels Adequate
As part of a recent MSC pre-assessment process, a harvest
strategy is being developed for a number of species captured
in the ‘south coast crustacean fisheries’. A standardised catch
rate assessment was undertaken and notional target, threshold
and limit reference points were developed for the southern
rock lobster. Similar measures were also established for the
deep sea crabs (crystal, giant and champagne crabs) which
are secondary target species for many of the south coast
crustacean fishers. The assessments of these secondary target
crab species are still being developed and will be presented in
future assessments.
The standardised catch rate for southern rock lobsters moved
from being near its threshold level in 2011/12 to within the
target region in 2012/13 (South Coast Crustacean Figure 2c).
In 2012/13 the standardised catch rate for southern rock
lobsters was 0.31 kg/potlift, representing a 9% increase from
the previous season
The proposed performance measures for the fishery were
established as part of the MSC pre-assessment and were:
a) the standardised catch rate of southern rock lobsters is
acceptable (above the proposed threshold value with a
degree of certainty).
Non-Retained Species
Bycatch species impact Low
The gear used in this fishery generates minimal bycatch and
the design of the pots is such that their potential to ‘ghost
fish’ if lost is negligible.
Listed species interaction Negligible
The pots and ropes used in crab longlines have limited
capacity to interact with listed species in this fishing area. In
the 2012/13 season there was a report of a leatherback turtle
which was entangled in fishing gear in the Windy Harbour /
Augusta fishery.
Ecosystem Effects
Food chain effects Negligible
The effects of the removal of lobster and deep sea crabs has
been assessed for the West Coast Deep Sea Crustacean
Fishery and Western Rock Lobster Managed Fishery on the
state’s west coast. Both of these fisheries have been assessed
as having negligible food chain effects by the removal of
crabs and lobsters respectively. Therefore, at current catch
levels, it is unlikely that removal of lobster and crabs on the
south coast are likely to result in food chain effects.
Habitat effects Low
Potting is considered to have a low impact on the habitat over
which the fishery operates.
Social Effects
This fishery is based on mobile vessels that employ a skipper
and two or three crew. The product is landed live at ports
between the South Australian / West Australian border and
Augusta, generating some additional economic activity and
benefits.
Economic Effects
Estimated annual value (to fishers) for 2012/13
Level 2 - $1 - 5 million ($3.6 million)
The beach value of the fishery was about $3.6 million in
2012/13 with the majority of the catch sold live to Asian
markets both locally and internationally.
Fishery Governance
Target commercial catch range:
Southern rock lobsters 50 – 80 tonnes
Current fishing (or effort) level Acceptable
In 2012/13, the south coast catch of 46.5 t was below the
target catch range (South Coast Crustacean Figure 2a). This
coincided with a reduction in the targeted effort for southern
rock lobster, and as such the catch and fishing effort is
considered acceptable. However, this target catch and
associated effort range is currently being reviewed as a part
of the overall review of the management for this fishery.
New management initiatives (2014/15)
In January 2009 the Department released Fisheries
Management Paper 232 entitled, ‘The South Coast
Crustacean Fishery: A Discussion Paper’. This public
discussion paper provided a review of the management
arrangements and history of the four south coast crustacean
fisheries, as well as making a number of recommendations on
future management arrangements. Two key recommendations
included that one management plan should cover all four
crustacean fisheries and that an independent panel make
recommendations on access and allocation of entitlement in
the new fishery.
In 2013, an independent access and allocation panel provided
a recommended method of determining the criteria for access
to each of the four proposed zones in the new fishery and the
level of entitlement to be allocated to those who gain access.
These recommendations were approved by the Minister for
Fisheries and will form the basis for entry into each zone
within the new South Coast Crustacean Fishery. A new
management plan is currently being drafted for the South
SOUTH COAST BIOREGION
STATUS REPORTS OF THE FISHERIES AND AQUATIC RESOURCES OF WESTERN AUSTRALIA 2013/14 241
Coast Crustacean Fishery to incorporate these management
arrangements and is expected to be implemented during
2014/15, superseding the two management plans, regulation
licence and licence condition which currently regulate the
four fisheries.
External Factors
Given a large export market, fluctuation in the Australian
dollar can have impacts on the economic performance of the
fishery.
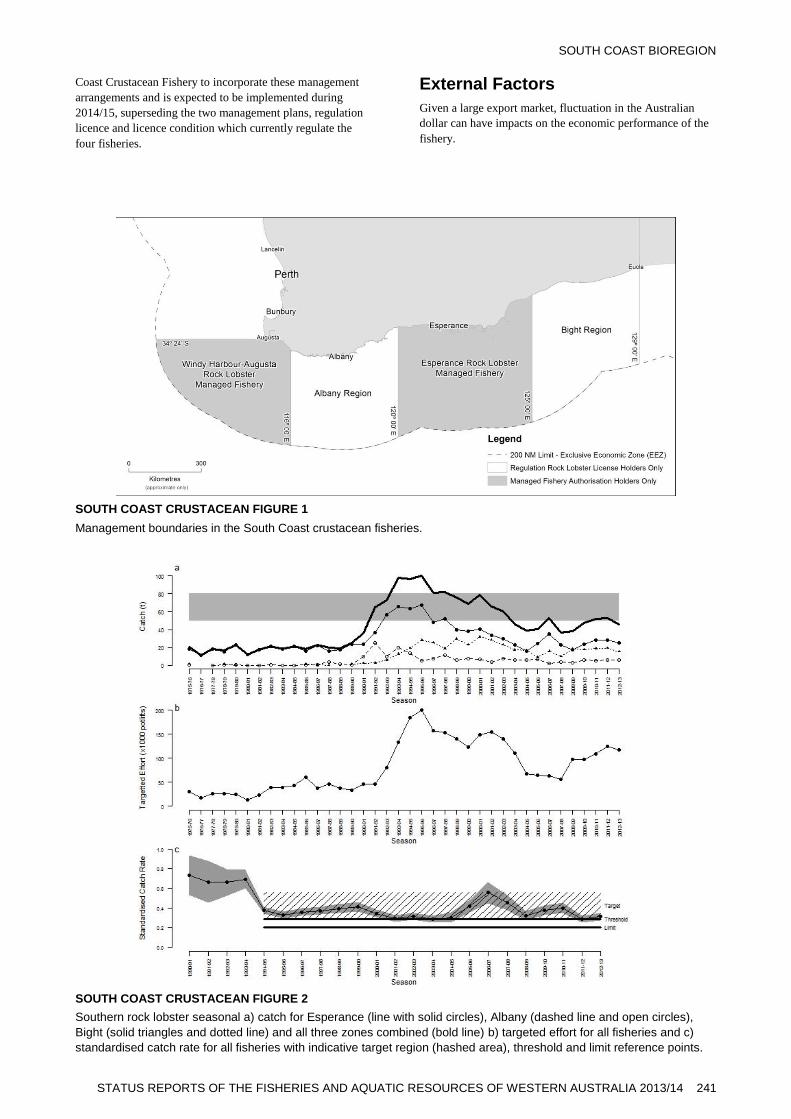
SOUTH COAST CRUSTACEAN FIGURE 1
Management boundaries in the South Coast crustacean fisheries.
SOUTH COAST CRUSTACEAN FIGURE 2
Southern rock lobster seasonal a) catch for Esperance (line with solid circles), Albany (dashed line and open circles),
Bight (solid triangles and dotted line) and all three zones combined (bold line) b) targeted effort for all fisheries and c)
standardised catch rate for all fisheries with indicative target region (hashed area), threshold and limit reference points.

SOUTH COAST BIOREGION
242 DEPARTMENT OF FISHERIES
Greenlip/Brownlip Abalone Fishery Status Report
A. Hart, F. Fabris and J. O'Malley
Fishery Description
The Western Australian greenlip and brownlip abalone
fishery is a dive fishery that operates in the shallow coastal
waters off the south-west and south coasts of Western
Australia. The fishery targets 2 large species of abalone:
greenlip abalone (Haliotis laevigata), and brownlip abalone
(H. conicopora), both of which can grow to approximately
200 mm shell length.
Abalone divers operate from small vessels (generally less
than 9 metres in length). The principal harvest method is a
diver working off ‘hookah’ (surface supplied breathing
apparatus) or SCUBA using an abalone ‘iron’ to prise the
shellfish off rocks – both commercial and recreational divers
employ this method.
Governing legislation/fishing authority
Commercial
Abalone Management Plan 1992
Abalone Managed Fishery Licence
Commonwealth Government Environment Protection and
Biodiversity Conservation Act 1999 (Export Exemption)
Recreational
Fish Resources Management Act 1994; Fish Resources
Management Regulations 1995 and other subsidiary
legislation.
Recreational Abalone Fishing Licence
Consultation process
Commercial
The Department undertakes consultation directly with
licensees on operational issues. Industry Annual Management
Meetings are convened by the West Australian Fishing
Industry Council (WAFIC), who are also responsible for
statutory management plan consultation under a Service
Level Agreement with the Department.
Recreational
Consultation processes are now facilitated by Recfishwest
under a Service Level Agreement although the Department
undertakes direct consultation with the community on
specific issues.
Boundaries
Commercial
The Abalone Management Plan covers all Western Australian
coastal waters, which are divided into eight management
areas. Commercial fishing for greenlip/brownlip abalone is
managed in three separate areas (Greenlip/Brownlip Abalone
Figure 1).
Recreational
The recreational abalone fishery regulations relate to three
zones: the Northern Zone (from Greenough River mouth to
the Northern Territory border), the West Coast Zone (from
Busselton Jetty to Greenough River mouth) and the Southern
Zone (from Busselton Jetty to the South Australian border).
Greenlip and brownlip abalone are only fished in the
Southern Zone.
Management arrangements
Commercial
The commercial greenlip/brownlip abalone fishery is part of
the overall Abalone Managed Fishery which is managed
primarily through output controls in the form of Total
Allowable Commercial Catches (TACCs), set annually for
each species in each area and allocated to licence holders as
Individually Transferable Quotas (ITQs).
The overall TACC for 2013 was 209 t (whole weight). The
TACC is administered through 16,100 ITQ units, with a
minimum unit holding of 450 units. The licensing period runs
from 1 April to 31 March the following year.
The legal minimum length for greenlip and brownlip abalone
is 140 mm shell length, although the commercial industry
fishes to self-imposed size limits of 145 mm, 150 mm and
153 mm in various parts of the main stocks. In ‘stunted
stocks’ areas, greenlip can be fished from 120 mm under
special exemptions with such fishing strictly controlled to
pre-arranged levels of catch and effort.
Main Features
Status Current Landings
Stock level Adequate Commercial
Fishing level Acceptable Total 202 t
Greenlip 166 t
Brownlip 36 t
Recreational 3-4% of total catch
SOUTH COAST BIOREGION
STATUS REPORTS OF THE FISHERIES AND AQUATIC RESOURCES OF WESTERN AUSTRALIA 2013/14 243
Recreational
The recreational component of the fishery for greenlip and
brownlip abalone is managed under a mix of input and output
controls and occurs primarily on the south and south-west
coasts. Recreational fishers must purchase an Abalone
Recreational Fishing Licence. Licences are not restricted in
number, but the recreational fishing season is limited to 7.5
months – from 1 October to 15 May.
The combined daily bag limit for greenlip and brownlip
abalone is five per fisher, and the household possession limit
(the maximum number that may be stored at a person’s
permanent place of residence) is 20.
General
A comprehensive ESD assessment of this fishery has been
undertaken to identify any potential sustainability risks
requiring direct management. The only issues identified
through this process were the breeding stock levels of
greenlip and brownlip abalone. Boxed text in this status
report provides the annual assessment of performance for
these issues.
Research summary
Current research is focused on stock assessment using catch
and effort statistics, meat weight indices, and length-
frequency sampling. Commercial abalone divers are required
to provide daily catch information on the weight and number
of abalone collected, the hours fished, the date and location
of harvest and the name of the person(s) harvesting. The
divers also supply a random selection of abalone shells from
each fishing day, and these are measured and used to estimate
fishing mortality.
An annual standardized catch per unit effort (SCPUE) index
was developed that takes into account diver, sub-area and
month of fishing as well as technological improvements that
aid fishing efficiency. This index forms the basis of the
revised decision-rule framework for the quota setting in each
area of the fishery.
Current research initiatives include fishery-independent
survey data collected from 220 sites across the fishery, and
mark-recapture analysis of growth and mortality in brownlip
abalone.
The telephone diary surveys have previously estimated the
statewide catch of greenlip and brownlip abalone. For the last
survey, in 2007, around 500 licence holders were randomly
selected from the licensing database, with selection stratified
by licence type (abalone or umbrella) and respondent location
(country or Perth metropolitan area). The licence holders
were sent a diary to record their fishing activity and were
contacted every 3 months by telephone for the duration of the
abalone season.
Research on brownlip abalone continued in 2013/14, under
the externally funded FRDC project titled “Demographic
Performance of Brownlip Abalone: Exploration of Wild and
Cultured Harvest Potential”. Results from this project will
inform industry and management about the development of
harvest control rules and sustainable catch levels for this
species.
Retained Species
Commercial landings (season 2013): 202 tonnes
In 2013 the greenlip/brownlip catch was 202 tonnes whole
weight (Greenlip Brownlip Abalone Table 1), which was
similar to the 2012 catch. The Area 1 (Nullarbor fishery)
exploratory quota remained at 1.2 t and has not been fished
since 2010.
The greenlip catch of 166.3 t whole weight from a total quota
of 173.4 t, was similar to the preceding three years catch of
greenlip. The brownlip catch of 36 t whole weight for the
2013 season was similar to the preceding two years catch and
represents 98% of the quota of 36.2 t (Greenlip Brownlip
Abalone Table 1).
Recreational catch (season 2007): 8 tonnes
Recreational catch: 3 – 4% of total catch
The estimate of recreational catch of greenlip and brownlip
abalone, based on the telephone diary survey of recreational
licence holders in 2007, was 8 t (range: 0 – 16 t), which is
similar to the 2006 estimate of 7 t. Given the catch estimates
from 2004, 2006 and 2007, the recreational catch corresponds
to approximately 3 – 4% of the total (commercial and
recreational) catch (Greenlip Brownlip Abalone Table 2) and
it is unlikely that this catch level would have differed greatly
in 2013.
Fishing effort/access level
Commercial
Total fishing effort on the main stocks in 2013 was 1,558
days. This was 8% higher than 2012 (1,438 days).
Recreational
For the 2013 season, 15,949 Abalone Recreational Fishing
Licences were issued allowing abalone fishing. This is
similar to the number of licences that have been obtained
since the “umbrella” Recreational Fishing Licenses, which
allowed for the catch of multiple species including abalone,
were phased out in 2010 (Greenlip/Brownlip Abalone Figure
2).
Effort estimates for recreational abalone fishing on the west
coast (excluding the Perth metropolitan area), from the 2007
telephone diary survey, was 6,300 days (3,800 – 8,800 days),
while the estimated effort on the south coast was 4,900 days
(1,700 – 8,000 days) (Greenlip Brownlip Abalone Table 2).
Stock Assessment
Assessment complete: Yes
Assessment level and method: Level 3
Standardised catch rates / Fishing mortality
Breeding stock levels: Adequate
A stock assessment of the greenlip/brownlip abalone fishery
was undertaken for the 2013 fishing season, based on
commercial catch and effort statistics, biological growth
studies, and fishery-independent surveys.

SOUTH COAST BIOREGION
244 DEPARTMENT OF FISHERIES
Standardised catch per unit effort (SCPUE): As a
result of a recent review1, the SCPUE for the greenlip fishery
is now used as the principal indicator of the abundance of
legal-sized abalone and the basis for the control-rule
framework. Raw CPUE data (kg whole wt per diver per day)
is also presented for comparative purposes.
In 2013, the SCPUE for the combined greenlip stocks was 29
kg whole weight per hour. This was a decrease from the 2012
and 2011 values of 31 kg per hour (Greenlip Brownlip
Abalone Table 1).
Fishing mortality (F): This analysis determines the
proportion of the available abalone stock that is being
harvested. No analysis of F was available for 2013 due to
lack of data, hence trends in previous years are examined.
Fishing mortality of greenlip abalone declined between 2011
and 2012 for the Augusta region and the South Coast of Area
3 (Greenlip Brownlip Abalone Figure 3a). Average F, based
on a 3-yr running mean (2010-2012) was 0.39 (Augusta),
0.44 (Area 3 South Coast) and 0.48 (Area 2).
Fishing mortality of brownlip abalone in Area 3 was stable
between 2011 and 2012, but no data were available from
Area 2 for 2012 to ascertain the trend (Greenlip Brownlip
Abalone Figure 3b). Average F, based on the most recent 3-
yr running mean was 0.31 (Area 3) and 0.27 (Area 2).
Breeding stock: Greenlip abalone mature between 80 and
110 mm shell length, and brownlip abalone mature between
90 and 130 mm shell length. These are both below the legal
minimum size limit set across the fishery (140 mm shell
length) with individual abalone expected to have spawned at
least twice before reaching legal size.
Industry-imposed length limits, that are larger than the
minimum legal limits, have been set in areas of fast-growing
stocks. In Area 2, there is a general 145 mm minimum length
across the fishing grounds. In Area 3, fishers have imposed a
minimum size limit of 153 mm shell length for the faster-
growing portions of the fishing grounds, 150 mm for the
average growing portions and 140 mm for the slower
growing portions of the fishing grounds.
In 2013, the average sizes of greenlip and brownlip caught
were 178 g and 238 g respectively which are both well above
the minimum breeding sizes of 140 g for greenlip and 160 g
for brownlip.
For brownlip, the assessment showed that the TACC was
being caught at a lower average meat weight i.e. declined
from 282 g in 2006 to 238 g in 2013. The TACC was
therefore reduced to 36.2 t in 2012 and 2013 (Greenlip
Brownlip Abalone Table 1) and the brownlip average meat
weight has stabilised.
The main performance measures for the fishery relate to the
maintenance of adequate breeding stocks in each area of the
fishery. This is assessed using a combination of measures
that reflect the average size of breeding individuals and the
overall biomass of breeding stock.
1 Hart, A., Fabris, F., Caputi, N. (2009). Performance indicators, biological
reference points and decision rules for Western Australian abalone fisheries
(Haliotis sp.): (1) Standardised catch per unit effort. Fisheries Research Report
No. 185. Department of Fisheries, Western Australia. 32 pp.
In 2013, the average sizes of greenlip and brownlip caught
were 178 g and 238 g respectively. These were well above the
minimum breeding sizes of 140 g for greenlip and 160 g for
brownlip. The effort (days fished) required to take the quota
(1,558 days) was above the set range that indicates sufficient
biomass of breeding stock for the fishery overall (907 – 1.339
days – see ‘Fishery Governance’ section). This was due to a
combination of lowered abundance and changes in
operational developments in the fishery including the use of 2
divers per day on some vessels and new divers with lower
catching efficiency. A 10% TACC reduction has been
implemented in the Area 3 fishery as a result of the lowered
abundance.
Non-Retained Species
Bycatch species impact: Negligible
Divers have the ability to target abalone of choice (species,
sizes and quality of abalone) and do not inadvertently harvest
bycatch in their normal fishing activities.
Listed species interaction: Negligible
The only listed species interaction occurring in this fishery is
with the white shark (Carcharodon carcharias), which has
been known to attack divers. Most divers now use diving
cages or electronic shark deterrent devices for their personal
protection. Divers are now recording their encounters with
white sharks and these will be documented in future reports.
Ecosystem Effects
Food chain effects: Negligible
Commercial abalone diving occurs over a small proportion of
the total abalone habitat of the Western Australian coastline.
In view of the relatively low exploitation rates and
consequent maintenance of a high proportion of the natural
biomass of abalone, it is considered unlikely that the fishery
has any significant effect on the food chain in the region. As
abalone are drift algae feeders, their removal is considered to
result in little change in algal growth cover and therefore the
ecosystems within the areas fished.
Habitat effects: Negligible
The fishing activity makes minimal contact with the habitat,
which typically consists of hard rock surfaces in a high wave-
energy environment.
Social Effects
There are 14 vessels operating in the greenlip/brownlip
commercial fishery, employing approximately 35 divers and
deckhands. The dispersed nature of the greenlip and brownlip
abalone fishery means that small coastal towns from
Busselton to the South Australian border receive income
from the activity of divers.
Recreational diving for greenlip and brownlip abalone is a
small but active sector, with dive shops and vessel
manufacturers’ benefiting from this activity. The recreational
fishery provides a major social benefit to those community
members that appreciate abalone as a delicacy. There were

SOUTH COAST BIOREGION
STATUS REPORTS OF THE FISHERIES AND AQUATIC RESOURCES OF WESTERN AUSTRALIA 2013/14 245
15,949 licenses issued that would have allowed fishers to
participate in the recreational abalone fishery, although most
of these would have targeted the Roe’s abalone fishery in the
Perth metropolitan area.
Economic Effects
Estimated annual value (to fishers) for 2013:
Level 3 - $5 - 10 million ($7.8 million)
The estimated average price received by commercial fishers
was $105/kg meat weight ($39/kg whole weight) for greenlip
and $87/kg meat weight ($35/kg whole weight) for brownlip
abalone, resulting in a fishery valued at $7.8 million, similar
to $8.0 million in 2012.
Greenlip prices in 2013 were similar to prices in 2012
($107/kg) and are still considerably lower compared to 10
years ago e.g. $126/kg meat weight in 2003, due to the high
value of the Australian dollar.
Fishery Governance
Target effort range: 907 – 1,339 days
Current effort level: Not Acceptable
To assess whether the catch quota set is appropriate
(sustainable) relative to the stock available, the effort
required to take a full season’s quota (201 t in 2013) from the
main stocks should fall within the effort range (907 – 1,339
diver days) derived from the 5-year period 1994 – 1998. This
range reflects the acceptable variation in catch rates for the
main stocks due to weather and natural recruitment cycles.
The fishing effort in 2013 was 1,558 days (main stocks),
which is above the governance range. The range was
exceeded due to lowered abundance in the Area 3 fishery,
operational changes in the fishery such as the use of 2 divers
per day on some vessels and new divers with lower catching
efficiency which are all incorporated within the calculation of
the standardised catch rates (see above). TACC reductions in
Area 3 have been implemented for the 2014 season, however
a review of the target effort range will also be undertaken.
New management initiatives (2014/15)
Consultation also took place with industry on relatively
minor operational changes to the Abalone Management Plan
1992. These matters are currently being progressed.
External Factors
In the last few years there have been a number of changes
which impact on fishery governance, and particularly on
catch rates. Lease divers are more common and industry size
limits have been varied substantially above the legal
minimum sizes. The value of the abalone fishery is still at
historical low levels however this may change with recent
decreases in the relative value of the Australian dollar.
In addition, environmental effects, such as weather
conditions, and the effect of technology changes, continue to
have significant effects on diver efficiency.
GREENLIP/BROWNLIP ABALONE TABLE 1
Greenlip and brownlip abalone catch and effort1 by quota period since 2001.
1. Data source: quota returns.
2. Effort (diver days): main stocks are separated from stunted stocks,
3. The conversion factor for meat weight to whole weight for Greenlip is 2.667 and Brownlip is 2.5.
Quota
period
Greenlip TAC
kg whole
weight
Greenlip
caught kg
whole weight
(all stocks)
Brownlip TAC
kg whole
weight
Brownlip
caught kg
whole
weight3
Combined
catch kg
whole weight
Diver days
(main
stocks
only)2
Greenlip Raw
CPUE kg
whole (meat)3
wt per diver
day)
Greenlip
standardised
CPUE (kg
whole weight)
per diver hour
2001 194,691 187,459 33,075 31,091 218,550 1,002 165 (62) 35
2002 194,691 166,828 33,075 27,458 194,286 1,027 134 (50) 32
2003 202,521 180,730 37,453 33,449 214,179 1,1442 136 (51) 32
2004 190,520 170,385 35,000 34,196 204,581 1,1542 129 (48) 32
2005 171,755 169,285 38,500 38,745 208,030 1,252 131 (49) 28
2006 171,755 168,752 39,750 37,265 206,017 1,161 133 (50) 28
2007 171,755 166,647 39,750 38,660 205,307 1,139 137 (51) 30
2008 163,220 157,224 41,900 39,515 196,739 1,144 135 (51) 30
2009 171,221 160,156 41,900 39,050 199,206 1,205 133 (50) 29
2010 171,221 165,558 41,900 39,006 204,564 1,196 138 (52) 34
2011 173,355 165,927 39,950 36,274 202,201 1,224 136 (51) 31
2012 173,355 167,562 36,150 34,187 201,749 1,438 116 (44) 31
2013 173,355 166,315 36,150 35,616 201,931 1,558 107 (40) 29

SOUTH COAST BIOREGION
246 DEPARTMENT OF FISHERIES
GREENLIP/BROWNLIP ABALONE TABLE 2
Summary of telephone diary surveys of recreational effort (fisher days), catch rate (abalone per fisher day) and catch
(tonnes whole weight) for the greenlip and brownlip abalone fisheries in 2004, 2006, and 2007.
Location Year Effort Greenlip Brownlip
Catch Rate Catch (tonnes) Catch Rate Catch (tonnes)
West Coast 2004 10,100 (6,500 – 13,600) 0.6 4 (2–6) 0.4 3 (1–5)
2006 8,000 (4,700 – 11,300) 0.3 2 (0–3) 0.4 3 (0–5)
2007 6,300 (3,800 – 8,800) 0.7 3 (0–6) 0.1 <1 (0–1)
South Coast1 2004 2,700 (1,700 – 3,700) 2.4 2 (1–5) <0.1 <1 (0–1)
2006 2,800 (1,600 – 3,900) 1.6 2 (0–4) 0.5 1 (0–2)
2007 4,900 (1,700 – 8,000) 1.8 4 (0–8) 0.2 <1 (0–1)
1. Survey area is South Coast Bioregion (i.e. east of Black Point).
GREENLIP/BROWNLIP ABALONE FIGURE 1
Maps showing the distribution of (a) greenlip and (b) brownlip abalone in Western Australia, and (c) the management
areas used to set quotas for the commercial fishery. Area 4 currently has no quota allocated.
GREENLIP/BROWNLIP ABALONE FIGURE 2
The number of licences issued in the recreational abalone fishery, by licence type, for the period since 1992. Data are
license counts at the end of the Perth metro abalone season (mid-December). Note umbrella licences were discontinued
in 2010.
19
92
19
93
19
94
19
95
19
96
19
97
19
98
19
99
20
00
20
01
20
02
20
03
20
04
20
05
20
06
20
07
20
08
20
09
20
10
20
11
20
12
20
13
Nu
mb
er
of
rec
rea
tio
na
l lic
en
ce
s
0
2000
4000
6000
8000
10000
12000
14000
16000
18000
20000
Abalone recreational licenses
Umbrella recreational licenses

SOUTH COAST BIOREGION
STATUS REPORTS OF THE FISHERIES AND AQUATIC RESOURCES OF WESTERN AUSTRALIA 2013/14 247
GREENLIP/BROWNLIP ABALONE FIGURE 3
Fishing mortality for greenlip (A) and brownlip (B) abalone. Estimates of fishing mortality (F) apply only to harvest-size
animals, and are derived from catch-curve analysis using length-frequency data, and annualised growth increments
based on following growth models. West Coast Greenlip: L∞=185 mm, K = 0.30; South Coast Greenlip: L∞=179 mm, K =
0.30; Brownlip: L∞=198 mm, K = 0.32. Natural mortality (M) is assumed to be 0.25.

SOUTH COAST BIOREGION
248 DEPARTMENT OF FISHERIES
South Coast Nearshore and Estuarine Finfish Resources Status Report
K. Smith, A. Quinn and T. Nicholas
Fishery Description
Commercial - Nearshore
Beach-based commercial fishers in nearshore waters of the
South Coast Bioregion catch various finfish species, mainly
using trap nets (Australian herring only), beach seines, haul
nets and gillnets. The main target species are western
Australian salmon (Arripis truttaceus) and Australian herring
(Arripis georgianus), with small quantities of southern sea
garfish (Hyporhamphus melanochir) and sea mullet (Mugil
cephalus) also taken.
Western Australian salmon and Australian herring both form
large schools, particularly during their autumn pre-spawning
seasons, that migrate along the coast in nearshore waters
between South Australia and Kalbarri (WA). The main
commercial fisheries for these species target pre-spawning
schools as they migrate along south-western beaches in
autumn. In WA, salmon is targeted exclusively by two
commercial fisheries – the South Coast Salmon Managed
Fishery (located in the South Coast Bioregion) and the South-
West Coast Salmon Managed Fishery (located in the West
Coast Bioregion). In these fisheries, salmon are captured by
teams of fishers who set beach seine nets from the shore
using either row boats or small jet-powered boats. Most of
the commercial catch of Australian herring in WA is taken on
beaches in the South Coast Bioregion using herring trap nets
(also known as ‘G’ trap nets) which are set from the shore.
The remainder of commercial herring catches are taken by
various small nearshore and estuarine fisheries in the South
Coast and West Coast Bioregions using beach seine nets,
gillnets and haul nets.
Commercial - Estuarine
Approximately 25 major estuaries exist in the South Coast
Bioregion, extending from Black Point in the west, to the
WA/SA border to the east. Thirteen estuaries are
conditionally open to commercial fishing as part of the South
Coast Estuarine Managed Fishery (SCEMF). This is a multi-
species fishery targeting many estuarine finfish species, with
the main fishing methods being gillnet and haul net. The
main target species are cobbler (Cnidoglanis macrocephalus),
black bream (Acanthopagrus butcheri), sea mullet and
Australian herring.
Recreational
Most finfish caught recreationally in South Coast Bioregion
estuaries and nearshore waters are taken by line fishing.
Shore and boat-based fishing are both popular. The most
commonly captured recreational species include Australian
herring, various species of whiting (Family: Sillaginidae),
trevally (Pseudocaranx spp.), black bream (estuaries only),
western Australian salmon and southern sea garfish.
A relatively small amount of recreational net fishing occurs
in the South Coast Bioregion, mainly targeting sea mullet.
Governing legislation/fishing authority
Commercial
South Coast Estuarine Fishery Management Plan 2005
South Coast Estuarine Managed Fishery Licence
Fisheries Notice No. 478 of 1991 (Herring ‘G’ nets)
Main Features
Status Current Landings (2013)
Stock levels: Commercial total 595 t (finfish only)
Australian herring Inadequate South Coast Salmon Fishery 139 t (salmon only)
Western Australian salmon Adequate South Coast herring trap net fishery 228 t (herring only)
Black bream (Stokes Inlet) Adequate South Coast Estuarine Fishery 211 t (finfish only)
Black bream (Beaufort Inlet) Adequate Other commercial 17 t (finfish only)
Black bream (Wilson Inlet) Adequate Recreational total (not available for current year)
Black bream (Oyster Harbour) Adequate Most recent survey 2000/01 368 t (key species only)
Black bream (Walpole-Nornalup Inlet) Not assessed Recreational estuarine
Cobbler (Wilson Inlet) Adequate Most recent survey 2002/03 50 t (key species only)
Cobbler (Oyster Harbour) Adequate Recreational boat-based
Fishing Level: Most recent survey 2011/12 37 t (key species only)
Australian herring Unacceptable
Other stocks Acceptable

SOUTH COAST BIOREGION
STATUS REPORTS OF THE FISHERIES AND AQUATIC RESOURCES OF WESTERN AUSTRALIA 2013/14 249
Fishing Boat Licence Condition 42 (Herring ‘G’ nets)
South Coast Salmon Fishery Management Plan 1982
South Coast Salmon Managed Fishery Licence
Proclaimed Fishing Zone Notice (South Coast) 1975
Salmon Block Net Prohibition Notice 1996
Salmon and Snapper Purse Seining Prohibition Notice 1987
Commonwealth Government Environment Protection and
Biodiversity Conservation Act 1999 (Export Exemption for
salmon fisheries)
Recreational
Fish Resources Management Act 1994; Fish Resources
Management Regulations 1995 and other subsidiary
legislation
Recreational Net Fishing Licence
Recreational Fishing From Boat Licence
Consultation processes
Commercial
The Department undertakes consultation directly with
licensees on operational issues. Industry Annual Management
Meetings are convened by the West Australian Fishing
Industry Council (WAFIC), who are also responsible for
statutory management plan consultation under a Service
Level Agreement with the Department.
Recreational
Consultation processes are now facilitated by Recfishwest
under a Service Level Agreement although the Department
undertakes direct consultation with the community on
specific issues.
Boundaries
Commercial - Nearshore
In the South Coast Bioregion, Australian herring can be taken
commercially by holders of an unrestricted Fishing Boat
Licence (FBL). The use of trap nets is restricted to holders of
FBLs with Condition 42, who can only operate at 10 specific
beaches along the south coast.
The South Coast Salmon Managed Fishery covers WA
waters from Cape Beaufort (Black Point) to the WA/SA
border.
Commercial - Estuarine
The South Coast Estuarine Managed Fishery encompasses
‘the waters of all estuaries on the south coast of Western
Australia between Cape Beaufort and 129º east longitude,
including Princess Royal Harbour and Oyster Harbour, and
all the rivers, streams and all the tributaries that flow into
those estuaries.’ The areas that are open to commercial
fishing are (from west-to-east) Broke Inlet, Irwin Inlet,
Wilson Inlet, Princess Royal Harbour, Oyster Harbour,
Waychinicup Inlet, Beaufort Inlet, Gordon Inlet, Hamersley
Inlet, Culham Inlet, Jerdacuttup Lakes, Oldfield Inlet and
Stokes Inlet.
Recreational
Recreational line fishing is permitted in most areas within
estuaries and nearshore waters of the South Coast Bioregion.
Some spatial closures exist, including closures around dive
wrecks.
A limited number of areas within certain estuaries and
nearshore waters of the South Coast Bioregion are open to
recreational netting. Recreational net fishers must hold a
licence. Recreational set nets are prohibited in all ocean
waters of the South Coast at all times. Recreational net
fishing regulations are complex – refer to the 'Recreational
Net Fishing Guide' for details.
Management arrangements
Commercial
The South Coast nearshore and estuarine commercial
fisheries are managed primarily through input controls in the
form of limited entry and gear restrictions, as well as seasonal
and time closures, area closures and size limits.
The South Coast Salmon Fishery Management Plan 1982
provides for licence holders to operate from assigned beaches
between Shoal Cape and Cape Beaufort, with each fishing
team having access to a single nominated beach only.
The Herring Trap Net Notice (Order 478 of 1991) prohibits
the use of herring trap nets except by licensed commercial
fishers using a fishing boat with the appropriate FBL
condition (Condition 42). Holders of FBLs with this
condition may take Australian herring using ‘G’ trap nets on
10 separately nominated south coast beaches. There is a
closed season for the use of ‘G’ trap nets (10 February to 25
March each year) that closely matches the peak western
Australian salmon migration season along the south coast.
Australian herring may also be commercially caught by
beach seine, set net and line methods by any licensed
commercial fisher holding an unrestricted FBL, provided the
use of this method is permitted in the particular area and the
waters being fished are not subject to other fishery
management arrangements.
Recreational
Recreational fishers in South Coast Bioregion estuaries and
nearshore waters take a diverse array of finfish species. Size
and possession limits apply to these species. A Recreational
Fishing from Boat Licence is required to undertake any
general fishing activity (including crabbing) conducted with
the use of a powered boat anywhere in the State.
As many of the recreationally targeted species are also
targeted by the commercial sector, resource-sharing issues
are a consideration in these fisheries.
Indicator species
The Department of Fisheries has selected indicator species
for monitoring and assessing the status of the finfish
resources in the South Coast Bioregion (DoF 20111). Western
Australian salmon, black bream and cobbler are indicators for
this Bioregion’s nearshore and estuarine finfish suites.
Australian herring and sea mullet are also significant
components of fishery landings in this Bioregion (see West
Coast Nearshore and Estuarine Finfish Resources Status
Report for the status of these stocks).
1 Department of Fisheries (DoF). 2011. Resource Assessment Framework (RAF)
for Finfish Resources in Western Australia. Fisheries Occasional Publication
No. 85. Department of Fisheries, Perth.
SOUTH COAST BIOREGION
250 DEPARTMENT OF FISHERIES
Research summary
The status of the fish resources in nearshore and estuarine
waters of the South Coast Bioregion is assessed by
monitoring the status of indicator species. Level 2
assessments of indicators are based on trends in commercial
catch and effort obtained from compulsory monthly fisher
returns, trends in recreational catch and effort obtained from
voluntary fisher logbooks (the ‘Research Angler Program’)
and recreational fishing surveys, and trends in juvenile
recruitment obtained from fishery-independent surveys.
Level 3 assessments of indicators include all of the above
information plus information about rates of fishing mortality
(F) estimated from the age composition of fishery landings.
Fish frames collected from recreational and commercial
fishers are used to determine age structure. When available,
archived biological samples are used to estimate historical F
levels.
All indicators are currently assessed at Level 2. Recent
monitoring of the age structure of fishery landings has been
undertaken for cobbler (Wilson Inlet only) and western
Australian salmon. In future, this information will be used to
develop Level 3 assessments for these stocks.
An integrated survey of boat-based recreational fishing was
conducted in WA during 2011/12 (Ryan et al. 20131). During
this survey, nearshore and estuarine species, including King
George whiting, black bream and Australian herring and
school whiting, were the most common species caught in the
South Coast Bioregion. This survey provided estimates for
boat-based recreational fishers. Catches from shore-based
fishers, who take a significant proportion of nearshore and
estuarine species, were not estimated.
Retained Species
Total commercial finfish landings (2013):
384 tonnes in nearshore waters
211 tonnes in estuarine waters
Commercial landings by fishery (2013):
South Coast Salmon 139 tonnes (salmon only)
Herring trap net 228 tonnes (herring only)
South Coast Estuarine 211 tonnes (finfish only)
Commercial finfish catches (South Coast Nearshore and
Estuarine Table 1) are taken by estuarine fisheries and beach-
based nearshore fisheries using trap nets (herring only),
gillnets, haul nets and beach seines. Minor quantities of the
same species that are taken by other methods (e.g. fish traps
and line) are generally not included in this report, although
catches by all methods and all fisheries are included in the
total catches reported for key species and are taken into
account in stock assessments.
In 2013, the total commercial catch of finfish by estuarine
and beach-based fisheries in the South Coast Bioregion was
595 t and included at least 37 species. The majority of the
catch consisted of Australian herring (42% by weight) caught
1 Ryan, K.L., Wise, B.S., Hall, N.G., Pollock, K.H., Sulin, E.H. & Gaughan, D.J.
(2013). An integrated system to survey boat-based recreational fishing in
Western Australia 2011/12. Fisheries Research Report No. 249, Department
of Fisheries, Western Australia. 162 pp.
primarily by the trap net fishery, western Australian salmon
(23%) caught by the South Coast Salmon Managed Fishery,
cobbler (11%) and black bream (7%) caught by the South
Coast Estuarine Managed Fishery.
In 2013, the nearshore finfish catch was comprised
predominantly of Australian herring (61% by weight) and
western Australian salmon (36%). The estuarine finfish catch
was comprised mainly of cobbler (31%), black bream (19%),
sea mullet (15%) and Australian herring (9%).
Since 2000, 95% of landings by the South Coast Estuarine
Managed Fishery have been finfish. The non-finfish
component is dominated by blue swimmer crabs (Portunus
armatus), which ranged from 1 t in 2006 to 39 t in 2001. In
2013, 32 t of blue swimmer crabs was reported by this
fishery. Almost all blue swimmer crabs were taken by
gillnets.
Key finfish species - nearshore
Australian herring: see West Coast Nearshore and
Estuarine Finfish Resources report.
Western Australian salmon: This species comprises a
single stock in southern Australian waters. It is targeted
commercially in Western Australia and South Australia (SA).
Since 2000, 68% of total commercial landings of western
Australian salmon in WA have been taken in the South Coast
Bioregion, with the remaining 32% taken in the West Coast
Bioregion.
Annual commercial landings of western Australian salmon in
WA have been highly variable since the commercial fishery
commenced in 1944. Peaks in total annual landings occurred
in 1968 (4,223 t), 1984 (3,543 t) and 1995 (4,046 t) (South
Coast Nearshore and Estuarine Figure 1). Total landings have
been declining since 1995, with the decline becoming more
pronounced after 2005. In 2012, a total catch of 122 t was
reported, which is the lowest since the commencement of
commercial fishing in the 1940s. In 2013, the total catch was
232 t. The declining trend since 1995 reflects the trend in the
South Coast Bioregion, where the annual catch steadily
declined from a peak of 2,728 t in 1995 to an historical low
of 75 t in 2012. In 2013, the South Coast catch was 139 t. In
the West Coast Bioregion, landings of salmon have ranged
from 0 to 1,364 t per year since the commencement of the
fishery (South Coast Nearshore and Estuarine Figure 1). In
2013, the West Coast catch was 93 t.
In WA, the historically low catch levels in recent years are
believed to be due to a combination of factors – lack of
targeting in response to low market demand, reduced
availability of fish in some years due to low recruitment and
environmental factors affecting catchability.
Commercial fishery landings of western Australian salmon in
SA have also declined, following a similar trend to WA
landings. From 1983/84 to 2002/3, total SA landings were
relatively stable at around 400-600 t per year. In the mid
2000s, landings declined sharply, and have subsequently been
<200 t per year2. A historically low total catch of 74 t was
2 Fowler, A.J., McGarvey, R., Steer, M.A. & Feenstra, J.E. (2013). The South
Australian Marine Scalefish Fishery Status Report - Analysis of Fishery
Statistics for 2012/13. Report to PIRSA Fisheries and Aquaculture. South
Australian Research and Development Institute (Aquatic Sciences), Adelaide.
SARDI Publication No. F2007/000565-8. SARDI Research Report Series No.
747. 44 pp.

SOUTH COAST BIOREGION
STATUS REPORTS OF THE FISHERIES AND AQUATIC RESOURCES OF WESTERN AUSTRALIA 2013/14 251
recorded in 2012/13. The decline in SA landings is partly due
to a reduction in targeted effort but may also partly reflect a
decline in the supply of recruits to SA from the spawning
area in WA.
Key finfish species - estuarine
Cobbler: Since 2000, 95% of commercial landings of
cobbler in WA have been caught in estuaries of the South
Coast Bioregion, with the remaining 5% taken in estuaries of
the West Coast Bioregion. Over this period, 79% of cobbler
landings in the South Coast Bioregion were in Wilson Inlet,
9% in Irwin Inlet, 8% in Oyster Harbour and 3% in Princess
Royal Harbour. Total annual landings in the South Coast
Bioregion ranged from 40 t (in 2004) to 95 t (in 2003).
In 2013, 67 t of cobbler was caught in the South Coast
Estuarine Managed Fishery. The majority (84%) of this catch
was taken in Wilson Inlet. In Wilson Inlet, annual cobbler
landings steadily increased after the 1940s (minimal catch at
this time) until the mid 1980s. Since 1985, annual landings
have varied substantially but the overall trend has been
stable. Annual landings reached an historical peak of 79 t in
1985 and again in 2003. Fluctuations in landings are
believed to mainly reflect variations in the availability of
cobbler due to variations in recruitment.
Black bream: In 2013, 97% of commercial landings of
black bream in WA were caught in the South Coast
Bioregion, with the remaining 3% from the West Coast
Bioregion. In the South Coast Bioregion, landings were
mainly taken in Beaufort Inlet (33% of landings), Stokes Inlet
(29%), Oyster Harbour (13%) and Wilson Inlet (10%).
Minor black bream landings were reported in 7 other
estuaries.
In 2013, a total of 41 t of black bream was landed in South
Coast estuaries. Since 2000, total South Coast landings of
black bream have ranged from 30 t (in 2000) to 65 t (in
2010). The 2010 catch was the highest recorded in the South
Coast Bioregion since 1993 (when the catch was 70 t),
mainly due to high landings within Stokes Inlet.
Historically, Stokes Inlet has contributed the greatest
proportion of black bream landings of any single South Coast
estuary. From 1980 to 2013, annual landings in Stokes Inlet
exhibited a stable (non-directional) trend and averaged 12 t
per year (range 1-37 t).
Since 2005, Beaufort Inlet has surpassed Stokes Inlet as the
main producer of black bream along the south coast. Minimal
landings of black bream were taken in Beaufort Inlet prior to
1993. From the late 1990s to 2005, landings gradually
increased and have remained relatively high in subsequent
years. Since 2005, annual landings have ranged from 10 to
26 t. Annual landings of black bream in Wilson Inlet and
Oyster Harbour also followed an increasing trend after the
late 1990s. Wilson Inlet landings peaked at 18 t in 2005 and
Oyster Harbour landings peaked at 12 t in 2008. The catches
in these estuaries then declined gradually, reaching 4 t and 5
t, respectively, in 2013. These catch trends appear to be the
result of strong recruitment by black bream in Beaufort Inlet,
Wilson Inlet and Oyster Harbour in the mid-1990s.
Recreational catch estimate (2013): NA
Key species
Nearshore + estuarine catch (most recent
estimate 2000/01): 368 tonnes
Estuarine catch only (most recent estimate
2002/03): 50 tonnes
Boat-based nearshore + estuarine catch (most
recent estimate 2011/12): 37 tonnes
Recreational catch levels of finfish in nearshore and estuarine
waters of the South Coast Bioregion were not estimated in
2013. The most recent nearshore estimates are from the
National Recreational and Indigenous Fishing Survey
conducted in 2000/01 (Henry and Lyle 20031). The most
recent estuarine estimates are from a creel survey in 2002/03
(Smallwood and Sumner 2007)2. While the dominant species
in the current catch are probably similar to those caught in
these surveys, the catch and effort levels by recreational
fishers may have changed substantially. Therefore, the
current total catch level cannot be estimated.
In 2000/01, the most abundant species retained in nearshore
waters in the South Coast Bioregion were Australian herring
(52% by number), skipjack trevally (Pseudocaranx
georgianus) (11%), King George whiting (Sillaginodes
punctata) (10%), whiting (various species, excluding King
George) (9%) and western Australian salmon (3%). In
estuarine waters, the most abundant species in the retained
catch in 2000/01 were black bream (39% by number), King
George whiting (23%), Australian herring (11%), mullet
(Mugilidae) (6%) and skipjack trevally (4%). In 2000/01,
shore-based fishers caught 73% of retained fish in nearshore
waters and 28% in estuaries.
The 2002/03 survey involved 17 estuaries, including 11 of
the 13 estuaries open to commercial fishing (no commercial
catches were taken in the remaining 2 estuaries during the
study period). The most commonly reported species were
King George whiting, black bream, Australian herring,
skipjack trevally, pink snapper (Pagrus auratus), flathead
(Platycephalidae), tarwhine (Rhabdosargus sarba) and
garfish, comprising approximately 80% of all fish (by
number) retained by recreational fishers during the survey.
In the commercially-fished estuaries, the recreational catch of
these 8 species was estimated to be approximately 29% (by
weight) of the combined recreational and commercial catch
of these species during the survey period. A total of 48
species were reported in the recreational catch from south
coast estuaries. However, the total recreational catch (by
weight) of all species could not be estimated in 2002/03 due
to uncertainties associated with small samples of less
abundant species and limited data on the average size of fish
in the catch.
With the inclusion of less abundant species and catches taken
in estuaries closed to commercial fishing, the recreational
catch share of recreationally-targeted finfish species in South
1 Henry, G.W. & Lyle, J.M. (2003). The National Recreational and Indigenous
Fishing Survey. FRDC Project No. 99/158. NSW Fisheries Final Report
Series No. 48.
2 Smallwood, C.B. & Sumner, N.R. (2007). A 12-month survey of recreational
estuarine fishing in the South Coast Bioregion of Western Australia during
2002/03. Fisheries Research Report No. 159. Department of Fisheries,
Western Australia. 56pp.
SOUTH COAST BIOREGION
252 DEPARTMENT OF FISHERIES
Coast Bioregion estuaries was estimated to be 30-40% in
2002/03. If the landings of non-recreational species (cobbler,
sea mullet and yellow-eye mullet) are also included, the
recreational catch share of total finfish landings was
estimated to be approximately 20%.
In 2002/03, the highest recreational fishing catch and effort
of any south coast estuary was reported from the
Walpole/Nornalup Inlet, which is closed to commercial
fishing. The main species taken in this estuary was black
bream, with an estimated recreational catch of 15 t during the
survey period.
A statewide survey of boat-based recreational fishing was
undertaken in 2011/12 (South Coast Nearshore and Estuarine
Table 2). During this survey, total of 112 finfish species
were taken by boat-based fishers in the South Coast
Bioregion with nearshore and estuarine species dominating
the catch. The most common were King George whiting
(26% of the South Coast catch by number), black bream
(18%), Australian herring (9%), southern school whiting
(Sillago bassensis) (5%), silver trevally (5%) and bight
redfish (Centroberyx gerrardi) (4%). An estimated 12 t of
King George whiting and 7 t of black bream was retained by
boat-based fishers in the South Coast Bioregion in 2011/12.
Total landings of nearshore and estuarine fish could not be
estimated from the 2011/12 survey data because shore-based
fishers, who are believed to take the majority of the
recreational nearshore and estuarine finfish catch, were not
included in the survey. The Department of Fisheries recently
conducted a pilot study of shore-based fishers in an attempt
to determine the best method to quantify recreational fishing
catch and effort from this sector (Smallwood et al. 20111).
Recreational catch share
The recreational catch share of total finfish landings in
nearshore and estuarine waters of the South Coast Bioregion
cannot be determined for the current year and since there has
been no survey for over five years it is not appropriate to
estimate the current catch share.
Fishing effort/access level
Commercial
Since 1990, the number of licences in nearshore and estuarine
commercial fisheries has been substantially reduced via a
Voluntary Fishery Adjustment Scheme (VFAS) (i.e. licence
buy-backs). The removal of licences has eliminated a
significant amount of latent effort (inactive licences) that
previously existed in these fisheries.
Fishing effort in nearshore and estuarine fisheries is usually
calculated as the number of days fished by each method.
Fishing effort is sometimes reported as the number of units of
access (vessels, licensees, teams, etc). This measure is
sometimes the only type of effort data available throughout
the history of the fishery and provides a general indication of
effort changes over time. The commercial method of fishing
for western Australian salmon and Australian herring (i.e.
beach-based netting) includes a considerable amount of time
spent observing or searching for fish (‘spotting’). Hence
effort in these fisheries is difficult to accurately quantify.
1 Smallwood ,C.B., Pollock, K.H., Wise, B.S., Hall, N.G. & Gaughan, D.J. (2011).
Quantifying recreational fishing catch and effort: a pilot study of shore-based
fishers in the Perth Metropolitan area. Fisheries Research Report 216.
Department of Fisheries, Perth.
The number of licensed teams that operate during each
fishing season provides an approximate measure of effort in
these fisheries.
South Coast Estuarine Fishery: Total effort in this
fishery was reduced by a VFAS, which reduced the number
of licensees from 66 in 1987 to 25 in 2002. The total annual
reported fishing days peaked at 6,747 days in 1992 and then
steadily declined until about 2004. Similarly, the average
number of boats fishing per month peaked at 42.9 in 1992
and then declined. Total effort assessed as both the number of
fishing days and the average number of boats fishing per
month has followed a stable trend since 2004. In 2013, the
fishery reported a total of 3859 fishing days and an average
of 18.2 boats fished per month.
In 2013, 42% of effort (method days) occurred in Wilson
Inlet, 24% in Oyster Harbour, 19% in Princess Royal
Harbour, 5% in Irwin Inlet, 5% in Beaufort Inlet, 2% in
Broke Inlet and 2% in Stokes Inlet. The remaining effort
(1%) occurred in Dempster Inlet, Culham Inlet, Oldfield
River and Jerdacuttup Lakes. Two estuaries (Gordon Inlet
and Waychinicup Inlet) were not fished during 2013.
Herring trap net fishery: The total number of licensed
teams reached a peak of 30 in 1984, and has since been
reduced by a VFAS to the current level of 11 (operating from
10 beaches). In 2013, only 3 teams recorded effort during the
season. This is a continuation of the low participation level in
this fishery in recent times. Commercial fishers report that
these historically low effort levels are in response to the lack
of markets and low wholesale prices paid for Australian
herring.
South Coast Salmon Fishery: Since 1999, there have
been 18 licensed teams in this fishery. Some teams are
inactive each year. Effort (number of active teams) has
followed a declining trend since 2002. In 2013, western
Australian salmon landings were reported by 7 of the 18
licensed teams.
Recreational
Current estimates of total recreational effort expended on
targeting nearshore or estuarine finfish in the South Coast
Bioregion are unavailable.
The 2000/01 National Recreational and Indigenous Fishing
Survey, which included all methods and Bioregions, provided
the most recent information on total recreational fishing
effort in the South Coast Bioregion (Henry and Lyle 2003).
About 90% of the nearshore and estuarine 'fishing events' that
were targeting finfish during the survey used line fishing (bait
or lure). About 85% of line fishing events (nearshore and
estuarine combined) occurred in nearshore waters. The
estimated nearshore line fishing effort in 2000/01 comprised
223,158 shore-based and 50,368 boat-based fishing events
during the 12-month survey period. In estuaries, the line
fishing effort comprised 21,800 shore-based and 30,087 boat-
based fishing events.
Recreational fishing effort in 17 south coast estuaries was
estimated by a creel survey conducted in 2002/03
(Smallwood and Sumner 2007). Total effort during the
survey period was estimated at 254,171 fisher hours or
86,482 fisher days. This total included boat-based (202,658
hours), shore-based (47,816 hours) and house boat (3,698
hours) fishing. Recreational netting and charter boat effort
was not quantified in this survey, but was considered to have

SOUTH COAST BIOREGION
STATUS REPORTS OF THE FISHERIES AND AQUATIC RESOURCES OF WESTERN AUSTRALIA 2013/14 253
been negligible (less than 2% of total effort). In the 2002/03
survey, recreational fishing effort was estimated to have
occurred mainly in Walpole/Nornalup Inlet (33% of total
effort), Oyster Harbour (29%), Princess Royal Harbour
(12%), Wilson Inlet (12%) and Wellstead Estuary (6%).
An integrated survey of boat-based recreational fishing in
WA was conducted in 2011/12 (Ryan et al. 2013). In this
survey, 49% of total annual boat-based fishing effort (boat
days) in the South Coast Bioregion was estimated to have
occurred in nearshore habitats (i.e. bottom depth <20m) and
22% in estuaries.
Stock Assessment
Assessments complete: Not all
Assessment level and method:
Level 3 - Fishing mortality
Breeding stock levels:
Australian herring1 Inadequate
Assessment level and method:
Level 2 - Catch rates
Breeding stock levels:
West Australian salmon Adequate
Cobbler (Wilson Inlet) Adequate
Cobbler (Oyster Harbour) Adequate
Black bream (Stokes Inlet) Adequate
Black bream (Beaufort Inlet) Adequate
Black bream (Wilson Inlet) Adequate
Black bream (Oyster Harbour) Adequate
Black bream (Walpole-Nornalup Inlet)
Not assessed
Indicator species - nearshore
Western Australian salmon: Western Australian salmon
form a single breeding stock across southern Australia.
Adults undertake a westward migration along the southern
coast of Australia to the lower West Coast Bioregion, where
they spawn during autumn. The Leeuwin Current disperses
eggs and larvae to coastal nurseries distributed from the West
Coast Bioregion to Victoria. After spawning, adults migrate
back to the South Coast Bioregion (but not to South Australia
or Victoria). Traditionally, commercial fishers in WA have
targeted western Australian salmon during the autumn
(mainly March/April) pre-spawning migration, with
approximately 95% of South Coast landings and 100% of
West Coast landings taken during the January-June period
each year.
Total landings of western Australian salmon in WA have
been declining since 1995, with the decline becoming more
pronounced after 2005. This trend has been primarily driven
by declining landings in the South Coast Bioregion, where
the majority of the annual catch is traditionally taken. The
1 The stock assessment for Australian Herring is presented in the West Coast
Nearshore and Estuarine Fisheries Report
South Coast Bioregion commercial catch and catch rate have
been declining since 1995 (South Coast Nearshore and
Estuarine Figures 1 and 2). In 2012, the catch (75 t) reached
the lowest level since the commencement of the South Coast
fishery in the 1940s. The catch rate (4 t per licenced team)
was also the lowest on record. In 2013, the catch was 139 t.
The historically low catch levels in recent years are believed
to be due to a combination of factors – lack of targeting in
response to the lack of markets and low wholesale prices paid
for this species, reduced availability of fish in some years due
to low recruitment and environmental factors affecting
catchability.
In 2013, a relatively low catch (93 t) was also reported in the
West Coast Bioregion. Very low (0-100 t) catches have
occurred periodically (approximately every 11 years)
throughout the history of this fishery and so the 2013 level
was not exceptional. However, very low catches have
occurred in the past 4 consecutive years (2010-2013), which
is atypical. Low catches have previously been restricted to a
single year.
Landings of salmon in the West Coast Bioregion are strongly
influenced by the Leeuwin Current and water temperature.
Low or nil catches typically occur during years of strong
Leeuwin Current (resulting in warmer water along the West
Coast). The low catch in 2011 was likely due to a ‘heatwave’
event during the spawning period, when a strong Leeuwin
Current and unusually high water temperatures discouraged
the northward migration of western Australian salmon
(Pearce et al. 20112). This behavioural response, resulting in
low catches, was also observed in 2000 when a strong
Leeuwin Current resulted in above average water
temperatures on the West Coast. Relatively warm ocean
conditions along the lower west coast in 2012 may have
again affected catchability. The ‘heatwave’ in 2011 is also
believed to have affected the catchability of salmon and
limited the catch in the South Coast Bioregion in 2011.
Annual recruitment by juvenile (age 0 years) western
Australian salmon has been variable since recruitment
surveys commenced in 1994 but the long-term trend has been
stable. Relatively high recruitment in 2008 and 2009 was
followed by relatively low recruitment in 2010, 2011 and
2012 (South Coast Nearshore and Estuarine Figure 3). The
lowest recorded recruitment coincided with the ‘heatwave’
event in 2011. Levels of annual recruitment provide an
indication of future breeding stock level and are likely to
influence catch rates 3-4 years later when each year class
recruits to the fishery.
Indicator species - estuarine
Cobbler: Commercial targeting of cobbler in WA is
restricted to estuaries. Each estuary hosts a discrete stock of
cobbler, which is genetically distinct to other estuarine
populations and also distinct to cobbler populations in
adjacent ocean waters. Historically, commercial targeting of
cobbler in the South Coast Bioregion has mainly occurred in
Wilson Inlet and to a lesser extent in the estuaries around
Albany (Oyster Harbour, Princess Royal Harbour).
2 Pearce, A., Lenanton, R., Jackson, G., Moore, J., Feng, M. & Gaughan, D.
(2011). The “marine heat wave” off Western Australia during the summer of
2010/11. Fisheries Research Report No. 222. Department of Fisheries,
Western Australia. 40 pp.

SOUTH COAST BIOREGION
254 DEPARTMENT OF FISHERIES
Commercial catch rates suggest a stable long-term trend in
the availability of cobbler in Wilson Inlet and Oyster Harbour
since 1980 (South Coast Nearshore and Estuarine Figure 4).
Catch rates suggest a slight increase in availability in these
estuaries after 2000. The catch rate in Wilson Inlet remained
relatively high in 2012/13. The catch rate in Oyster Harbour
has been declining since 2007/8 and the catch rate in 2011/12
was the lowest recorded in this estuary since 1980/81 (3rd
lowest on record). There was a slight increase in catch rate in
2012/13, although the level still suggests relatively low
current abundance.
The Department of Fisheries has conducted annual fishery-
independent surveys of juvenile recruitment of cobbler in
Wilson Inlet since 2006. Information from these surveys will
assist in interpreting variations in catch and catch rates.
Regular monitoring of the age structure of fishery landings
was recently implemented in Wilson Inlet. In future, this
information may be used to regularly monitor levels of
fishing mortality in this stock, which will be used in
conjunction with trends in recruitment and catch rates to
assess stock status.
Black bream: Black bream are restricted to estuaries. Each
estuary hosts a discrete stock of black bream, which is
genetically distinct to other estuarine populations. Most
estuaries and coastal lagoons in south-western WA host a
black bream population.
The majority of commercial black bream landings in the
South Coast Bioregion are taken in four main estuaries -
Stokes Inlet, Beaufort Inlet, Wilson Inlet and Oyster Harbour.
From 1980 to 1995, commercial catch rates in these estuaries
were relatively low and followed a stable trend, then steadily
increased until about 2005 (South Coast Nearshore and
Estuarine Figure 5). Since 2005, catch rates have remained
relatively high in Beaufort Inlet, Oyster Harbour and Stokes
Inlet. The catch rate has been declining since 2005 in Wilson
Inlet, although recent levels are still high relative to historical
levels.
Black bream landings vary in response to environmental
factors in individual estuaries. The simultaneous increases in
catch rates in numerous South Coast Bioregion estuaries from
1995 to 2005 suggest that a widespread factor, such as
rainfall, has influenced black bream availability and
recruitment across the region.
The current status of black bream in Walpole-Nornalup Inlet
cannot be assessed due to lack of recent data. Walpole-
Nornalup Inlet is the most popular recreational fishery for
black bream in the South Coast Bioregion. The estuary is
closed to commercial fishing.
Non-Retained Species
Bycatch species impact: Low
The small-scale commercial fisheries in nearshore and
estuarine waters mainly use gill, seine and haul nets that are
deployed in a targeted manner. Few non-target species are
taken. Mesh size regulations ensure that target species caught
by these methods are within an appropriate size range.
Minimal discarding occurs because virtually all fish taken
can be retained and marketed.
Recreational fishers mainly use line-based methods in
nearshore and estuarine waters. This method can result in the
capture and release of a significant number of non-target
species and undersized fish. The risks associated with post-
release mortality vary considerably among species. In
general, fish in nearshore and estuarine waters are captured
from shallow depths and suffer less barotrauma-related
injuries than deep water species.
Listed species interaction: Negligible
It is compulsory for commercial fishers to report all
interactions with listed marine species. New Zealand fur
seals and Australian sea lions are occasionally surrounded by
beach seine nets used in the South Coast nearshore and
estuarine fisheries, but are released immediately by the
fishers. This is possible because seine netting is a labour-
intensive operation and the fishing team will immediately
notice a seal in the net. Fishers are able to release a seal from
their seine net without injury to the animal.
The abundance of fur seals on the south coast has steadily
increased over the last 15 years, resulting in an increasing
level of interaction with fishers, especially in estuaries of the
Albany region (R. Campbell, pers. comm.). There have been
no reports of incidental mortalities of seals in these fisheries
and it is believed that the present level of interaction (direct
and indirect) is not a significant threat to the populations of
fur seals and sea lions. An assessment of the impact of
interactions is performed on an annual basis and, if required,
appropriate management plans will be devised to mitigate
these interactions.
Birds such as pelicans, cormorants and shearwaters
sometimes interact with commercial fishing nets in estuaries
and with recreational line-fishing gear but the risks to bird
populations are considered to be low.
Ecosystem Effects
Food chain effects: Low
Excessive removal by commercial and recreational fisheries
of certain species, such as Australian herring or western
Australian salmon, from the food chain could potentially
impact on prey and predator species including larger fish,
cetaceans and seabirds. However, commercial fishing effort
directed towards these species in recent years has been
declining and is relatively low compared to historic levels.
Recreational fishing effort directed towards Australian
herring is relatively high.
Habitat effects: Negligible
The operation of gillnets and haul nets over predominantly
sand and mud bottoms is unlikely to have any impact on
these habitats in estuaries and nearshore waters. Similarly,
the line fishing methods used by recreational fishers have a
negligible impact on the bottom substrates. Anchoring by
recreational fishing vessels may have localised impacts on
habitats such as seagrass.
Haul nets may be deployed over low or medium density
seagrass. This type of net tends to ‘roll’ over the surface of
seagrass beds without removing attached leaves or uprooting
plants. At times, haul nets may collect floating vegetation
including seagrass leaves or algae.

SOUTH COAST BIOREGION
STATUS REPORTS OF THE FISHERIES AND AQUATIC RESOURCES OF WESTERN AUSTRALIA 2013/14 255
Social Effects
Commercial
In 2013, there were approximately 31 commercial fishers
involved in the South Coast Salmon Fishery and
approximately 13 commercial fishers involved in the South
Coast herring trap net fishery. In 2013, the South Coast
Estuarine Managed Fishery employed an average of 23
fishers per month. Additional employment is created by
these fisheries in the processing and distribution networks
and retail fish sales sectors.
Australian herring and western Australian salmon fisheries in
the South Coast Bioregion supply WA bait and human
consumption markets. The South Coast Estuarine Fishery is
an important source of fresh local fish to regional centres.
Additionally, a small proportion of estuarine landings are
sold to zoos across Australia as animal food.
The use of trap nets and seine nets by Australian herring and
western Australian salmon fishers may temporarily impact on
beach access by members of the public.
Recreational
The 2000/01 National Recreational and Indigenous Fishing
Survey estimated that approximately 12% of the State’s total
recreational fishing effort occurred in the South Coast
Bioregion (Henry and Lyle 2003, Barharthah 20061). Fish
resources in estuaries and nearshore waters of the Bioregion
are a focus for recreational fishers and have a high social
value in the region.
Within the South Coast Bioregion, approximately 21% of the
recreational fishing effort is estimated to occur in estuaries
and rivers. A high proportion of people who fish in each
South Coast estuary are non-residents, travelling from Perth,
other WA regions or interstate. Consequently, fishing in
South Coast estuaries has a great benefit to local tourism.
Australian herring is the most common finfish species
retained by recreational fishers in the South Coast Bioregion
(and in WA) and therefore has high social value. In 2000/01
Australian herring were estimated to comprise 15% of all
finfish retained by South Coast recreational fishers.
Economic Effects
Estimated annual value (to fishers) for 2012/13:
South Coast Estuarine Fishery
(Level 2: $1 to 5 million (finfish only)
South Coast Salmon + Herring trap net fisheries
Level 1: <$1 million
Fishery Governance
Commercial
Current Fishing (or Effort) Level
South Coast Estuarine Fishery Acceptable
Herring trap net fishery Under Review
South Coast Salmon Fishery Under Review
1 Barhathah, T. (2006). Department of Fisheries community survey 2005.
Fisheries Occasional Paper No. 33. Department of Fisheries, Perth.
Target commercial catch range:
South Coast Estuarine Fishery 200 – 500 tonnes
South Coast herring 475 – 1,200 tonnes
Salmon (South Coast + South West Fisheries)
1,200 – 2,800 tonnes
The 2013 South Coast Estuarine Managed Fishery total catch
of finfish (211 t) was within the target range of 200-500 t. A
high abundance of blue swimmer crabs in south coast
estuaries is likely to have contributed to relatively low finfish
landings in 2013. This fishery has reported a steady increase
in landings of blue swimmer crabs, from 1 t in 2006 to 14 t in
2012 and 32 t in 2013. In some estuaries, fishers report that
the presence of large numbers of undersized crabs in fishing
nets has been inhibiting the capture of finfish. In some
estuaries, fishing effort appears to have been redirected
towards targeting crabs instead of finfish.
The 2013 South Coast catch of Australian herring (251 t) was
well below the target range. The catch has now been below
the target range for 11 consecutive years. Recent research
outcomes regarding stock status are being used as a basis for
reviewing management arrangements to ensure ongoing
sustainability for this iconic species.
The total catch of western Australian salmon (West Coast and
South Coast landings combined) in 2013 (232 t) was below
the target range. The catch has now been below the target
range for 7 consecutive years. Low catches are believed to
be due to the combined effects of lack of targeting due to
weak market demand, low catchability due to environmental
factors (relatively high water temperatures) and low
availability of fish due to recruitment variation. The
recreational catch of Western Australian salmon is relatively
low (unlike the closely related species Australian herring
which has a high recreational catch). Hence, given the very
limited commercial targeting of this species recently, the
overall fishing pressure on western Australian salmon has
been relatively low and is unlikely to have resulted in low
stock availability. A higher level assessment (e.g. level 3 –
age based) of salmon is being considered in order to increase
certainty about stock status.
Recreational
Current Fishing (or Effort) Level: Not available
Target catch range: Not developed
New management initiatives (2014/15)
An application to the Commonwealth Department of the
Environment has been submitted to maintain export
accreditation for the western Australian salmon fisheries
(South Coast Salmon Managed Fishery and South West
Coast Salmon Managed Fishery), effectively declaring the
fisheries exempt from Part 13 and 13A of the EPBC Act for a
period of 5 years. The current exemption expires on 15
November 2014.
South Coast nearshore and estuarine fisheries underwent
MSC pre-assessment in 2014. Outcomes are expected in late
2014.
SOUTH COAST BIOREGION
256 DEPARTMENT OF FISHERIES
External Factors
Climate change is expected to have impacts on nearshore and
estuarine ecosystems. Changes in environmental variables
such as ocean temperature, currents, winds, nutrient supply,
rainfall, ocean chemistry and extreme weather conditions are
expected to have major impacts on marine ecosystems
(Hobday et al. 20081). These impacts are expected to create
both difficulties and opportunities for fisheries.
In 2011, a very strong Leeuwin Current resulted in unusually
warm ocean temperatures in coastal waters of the southern
West Coast Bioregion and the western South Coast Bioregion
(Pearce et al. 2011). This ‘heatwave’ event resulted in
atypical distributions of various species (e.g. tropical species
occurring in temperate waters) and unusual fish behaviour.
The event altered the distribution and behaviour (eg.
spawning activity, migration) of western Australian salmon
and Australian herring, which reduced catch levels of these
species in 2011 and may continue to affect them in
subsequent years (due to effects on recruitment). Relatively
warm coastal ocean temperatures also occurred in 2012 and
2013 in the West Coast Bioregion and the western South
Coast Bioregion.
It is likely that annual variation in coastal currents
(particularly the Leeuwin and Capes Currents) influences the
recruitment patterns of larvae of nearshore species such as
Australian herring and western Australian salmon and thus
their subsequent recruitment into each region. Coastal
currents also influence the distribution and catchability of
adult fish. For example, warmer beach water temperatures
are associated with lower catchability of western Australian
salmon.
Fluctuating market demand is a significant factor affecting
the annual commercial catch level of many species. Limited
demand and low wholesale prices paid for Australian herring
and western Australian salmon in recent years have limited
commercial catch and effort levels. By purchasing only a
limited quantity of Australian herring and western Australian
salmon each year, fish processors effectively restrict catch
levels. Commercial fishers sometimes elect not to capture a
school of fish, or release part of their catch, when a market is
not available.
Variations in the abundance of target species in South Coast
Bioregion estuaries are largely driven by environmental
factors, independent of fishing. These factors often have a
dominant influence on the commercial catch and effort from
year-to-year. For example, high rainfall may contribute to
higher catches of black bream.
Catchment processes, such as clearing of vegetation, flow
regulation and nutrient input, can have major downstream
effects on estuary condition and on fishery production.
Attempts to quantify the influence of these complex,
interacting factors on fishery production are difficult with the
limited biological and environmental monitoring data that are
available from South Coast Bioregion estuaries.
The influence of environmental factors on recruitment to
estuaries is further complicated by the practice of human
intervention to breach estuarine sandbars, mostly for reasons
related to estuarine amenity coupled with ecosystem ‘health’.
1 Hobday, A.J., Poloczanska, E.S. & Matear, R.J. (eds) (2008). Implications of Climate Change for Australian Fisheries and Aquaculture: a preliminary assessment. Report to the
Department of Climate Change, Canberra, Australia. August 2008.
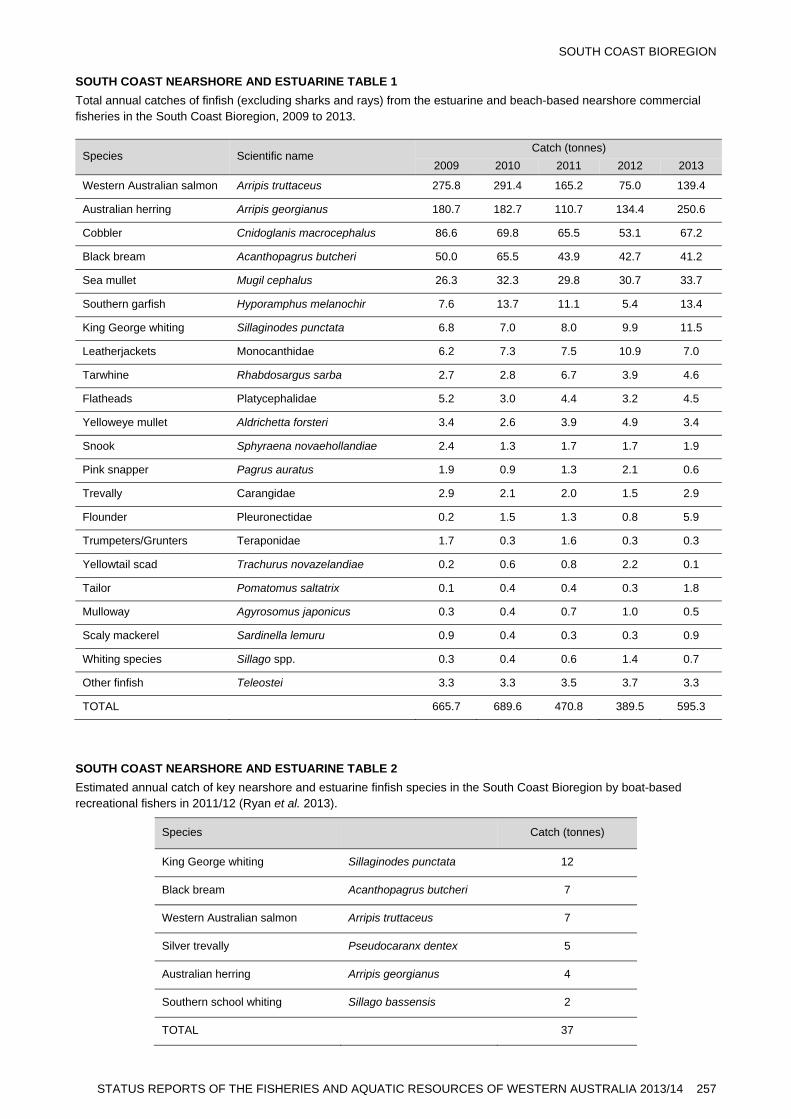
SOUTH COAST BIOREGION
STATUS REPORTS OF THE FISHERIES AND AQUATIC RESOURCES OF WESTERN AUSTRALIA 2013/14 257
SOUTH COAST NEARSHORE AND ESTUARINE TABLE 1
Total annual catches of finfish (excluding sharks and rays) from the estuarine and beach-based nearshore commercial fisheries in the South Coast Bioregion, 2009 to 2013.
SOUTH COAST NEARSHORE AND ESTUARINE TABLE 2
Estimated annual catch of key nearshore and estuarine finfish species in the South Coast Bioregion by boat-based recreational fishers in 2011/12 (Ryan et al. 2013).
Species Catch (tonnes)
King George whiting Sillaginodes punctata 12
Black bream Acanthopagrus butcheri 7
Western Australian salmon Arripis truttaceus 7
Silver trevally Pseudocaranx dentex 5
Australian herring Arripis georgianus 4
Southern school whiting Sillago bassensis 2
TOTAL 37
Species Scientific name Catch (tonnes)
2009 2010 2011 2012 2013
Western Australian salmon Arripis truttaceus 275.8 291.4 165.2 75.0 139.4
Australian herring Arripis georgianus 180.7 182.7 110.7 134.4 250.6
Cobbler Cnidoglanis macrocephalus 86.6 69.8 65.5 53.1 67.2
Black bream Acanthopagrus butcheri 50.0 65.5 43.9 42.7 41.2
Sea mullet Mugil cephalus 26.3 32.3 29.8 30.7 33.7
Southern garfish Hyporamphus melanochir 7.6 13.7 11.1 5.4 13.4
King George whiting Sillaginodes punctata 6.8 7.0 8.0 9.9 11.5
Leatherjackets Monocanthidae 6.2 7.3 7.5 10.9 7.0
Tarwhine Rhabdosargus sarba 2.7 2.8 6.7 3.9 4.6
Flatheads Platycephalidae 5.2 3.0 4.4 3.2 4.5
Yelloweye mullet Aldrichetta forsteri 3.4 2.6 3.9 4.9 3.4
Snook Sphyraena novaehollandiae 2.4 1.3 1.7 1.7 1.9
Pink snapper Pagrus auratus 1.9 0.9 1.3 2.1 0.6
Trevally Carangidae 2.9 2.1 2.0 1.5 2.9
Flounder Pleuronectidae 0.2 1.5 1.3 0.8 5.9
Trumpeters/Grunters Teraponidae 1.7 0.3 1.6 0.3 0.3
Yellowtail scad Trachurus novazelandiae 0.2 0.6 0.8 2.2 0.1
Tailor Pomatomus saltatrix 0.1 0.4 0.4 0.3 1.8
Mulloway Agyrosomus japonicus 0.3 0.4 0.7 1.0 0.5
Scaly mackerel Sardinella lemuru 0.9 0.4 0.3 0.3 0.9
Whiting species Sillago spp. 0.3 0.4 0.6 1.4 0.7
Other finfish Teleostei 3.3 3.3 3.5 3.7 3.3
TOTAL 665.7 689.6 470.8 389.5 595.3

SOUTH COAST BIOREGION
258 DEPARTMENT OF FISHERIES
SOUTH COAST NEARSHORE AND ESTUARINE FIGURE 1
Total annual commercial catches of western Australian salmon in the South Coast and West Coast Bioregions, 1965 –
2013.
SOUTH COAST NEARSHORE AND ESTUARINE FIGURE 2
Total annual commercial catch rate (tonnes per licensee per year) of western Australian salmon in the South Coast
Salmon Fishery (South Coast Bioregion) and the South West Coast Salmon Fishery (West Coast Bioregion), 1995 –
2013.
SOUTH COAST NEARSHORE AND ESTUARINE FIGURE 3
Annual fishery-independent relative recruitment index for western Australian salmon in the South Coast Bioregion, 1996
– 2013. Data represent annual deviations from the long-term average. e.g. bars above the line Indicate better than
average number of recruits. (x – no sampling conducted in that year).
Year
1965 1970 1975 1980 1985 1990 1995 2000 2005 2010
Annua
l ca
tch (
t)
0
1000
2000
3000
4000
Total WA
South Coast Bioregion
West Coast Bioregion
Year
1996 1998 2000 2002 2004 2006 2008 2010 2012
Ca
tch
ra
te (
ton
ne
s p
er
lice
nce
e)
0
50
100
150 South Coast Salmon Fishery
South West Coast Salmon Fishery
Year class
1996 1998 2000 2002 2004 2006 2008 2010 2012
Re
cru
itme
nt in
de
x
-6
-3
0
3
6
x x x
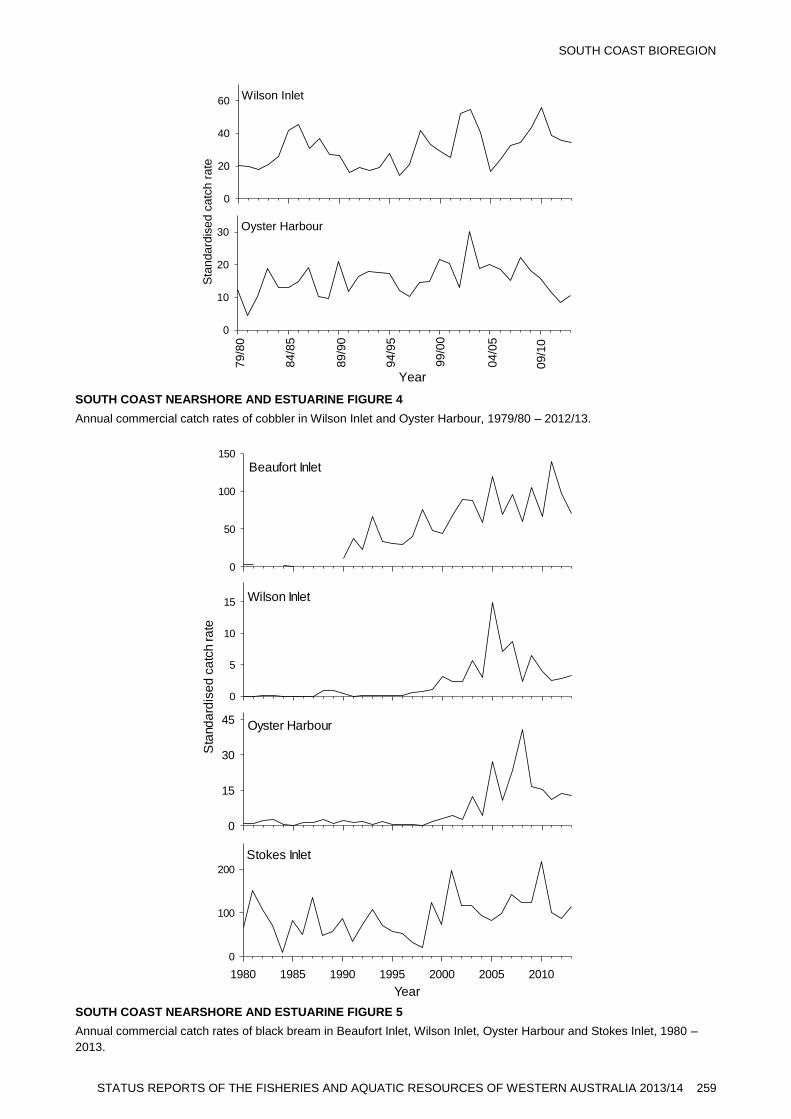
SOUTH COAST BIOREGION
STATUS REPORTS OF THE FISHERIES AND AQUATIC RESOURCES OF WESTERN AUSTRALIA 2013/14 259
SOUTH COAST NEARSHORE AND ESTUARINE FIGURE 4
Annual commercial catch rates of cobbler in Wilson Inlet and Oyster Harbour, 1979/80 – 2012/13.
0
50
100
150
Beaufort Inlet
Year
1980 1985 1990 1995 2000 2005 2010
0
100
200
Sta
nd
ard
ise
d c
atc
h r
ate
0
5
10
15
0
15
30
45
Wilson Inlet
Oyster Harbour
Stokes Inlet
SOUTH COAST NEARSHORE AND ESTUARINE FIGURE 5
Annual commercial catch rates of black bream in Beaufort Inlet, Wilson Inlet, Oyster Harbour and Stokes Inlet, 1980 –
2013.
0
20
40
60
Year
Sta
nda
rdis
ed
ca
tch
ra
te
0
10
20
307
9/8
0
84/8
5
89/9
0
94/9
5
99/0
0
04/0
5
09/1
0
Wilson Inlet
Oyster Harbour

SOUTH COAST BIOREGION
260 DEPARTMENT OF FISHERIES
South Coast Purse Seine Fishery Report: Statistics Only
B. Molony, E. Lai, M. Holtz and S. Walters
Fishery Description
The South Coast Purse Seine Managed Fishery (SCPSF) is
based on the capture of pilchards (Sardinops sagax) by purse
seine nets in the waters between Cape Leeuwin and the
Western Australia/South Australia border. The South Coast
Purse Seine Limited Entry Fishery Notice 1994 also covers
the take of yellowtail scad (Trachurus novaezelandiae),
Australian anchovy (Engraulis australis), scaly mackerel
(Sardinalla lemuru), sandy sprat (Hyperlophus vittatus) blue
sprat (Spratelloides robustus) and maray (Etrumeus teres).
Boundaries
The SCPSF consists of five Management Zones (South Coast
Purse Seine Fishery Figure 1). Zone 1 extends from Peak
Head to Vancouver Peninsula (the waters in and around King
George Sound, Albany). Zone 2 extends from Point
D’Entrecasteaux to Cape Knob. The Bremer Bay Zone (Zone
3) extends from Cape Knob to longitude 120ºE. The large
Esperance Zone (Zone 4) extends from 120ºE to the WA/SA
border. An additional zone (Zone 5) exists between Cape
Leeuwin and Point D‘Entrecasteaux but has not been
significantly fished to date. The Zones are broken down into
finer spatial scale blocks for reporting of catch and effort in
the statutory catch and effort Disposal forms but for this
report catches are reported for the major zones (Zones 1 and
2 combined; Zone 3 and Zone 4 separately) plus the total
catches (South Coast Purse Seine Fishery Figure 2) based on
statutory return submissions.
Management arrangements
The SCPSF is primarily managed through output controls in
the form of Individually Transferable Quota (ITQ) units. The
quota season for the SCPSF runs from 1 July to 30 June the
following year. Four of the five zones in the fishery (i.e.
zones 1 – 4) have been allocated a set amount of ITQ units
whose values are determined by dividing the Total Allowable
Catch (TAC) for that zone by the total number of units
allocated to that zone. The TAC has been relatively stable
over the past 10 years and will be reviewed on an as-needs
basis but is primarily dependant on the status of fish stocks.
The total number of units allocated across each of the four
zones in the fishery amount to 890 and remained unchanged
from the previous season. The Albany zone has an annual
TAC of 2,683 tonnes, while both the Bremer Bay and
Esperance zones each have an annual TAC of 1,500 tonnes.
Zone 5 of the fishery is considered a development zone and
can only be fished by a licence holder in the SCPSF with a
minimum holding in another zone, it has no specific TAC or
units and has not been fished for a number of years.
Landings and Effort 2012/13
Bremer Bay and Esperance: Cannot report
as less than three vessels fished in 2012/13
Albany 1,128 tonnes
Effort in the SCPSF was much lower than in recent years
with a total of 845 days of fishing (2009/10: 1,450 days;
2010/11: 1,290 days, 2011/12: 1,359 days). Effort levels
decreased in all zones.
The 2012/13 pilchard catch in the South Coast Purse Seine
fishery (1,408 tonnes) was the lowest since 2003 and ended
the trend of slowly increasing catches since the late 1990s
(South Coast Purse Seine Figure 2). Although catches in
2012/13 were much lower than previous years, the low effort
levels do not suggest a decline in biomass as nominal daily
catch rate has shown an increasing trend since reopening
(South Coast Purse Seine Figure 2). Most of the commercial
catches were reported from the Albany Zones (1,128 t). Less
than 6 t of other pelagic species were also landed, dominated
by yellowtail scad.
Overall effort and catches remain below those recorded
during the late 1980s and 1990s. Catch rates are now greater
than the pre-virus levels.
Fishery Governance
Target commercial catch range: Acceptable
For the 2012/13 season, the total pilchard catch (1,408 t) was
still well below the total TAC for the entire fishery (5,683 t)
(South Coast Purse Seine Fishery Table 1) with catches from
each of the Management Zones remaining below their
respective TACs.
Current Fishing (or Effort) Level: Acceptable
Based on the most recent assessment (completed in 2006)
and the recent history of the fishery, the level of spawning
biomass in each Management Zone is likely to be at adequate
levels and the current level of fishing is acceptable. The
catch levels in other jurisdictions further support the
continued recovery in the biomass of pilchards across
southern Australia.
New management initiatives (2014/15)
Since 2006/07, the SCPSF listed species bycatch mitigation
program has undertaken a range of measures to monitor and
mitigate shearwater bycatch during the peak interaction
period between 1 March and 30 April. These bycatch
mitigation measures are reviewed annually and are
continually being refined and improved.
There are no significant legislative management changes
planned for this fishery.
In 2014, the fishery underwent pre-assessment for Marine
Stewardship Certification. Outcomes of the pre-assessment
are expected in late 2014.
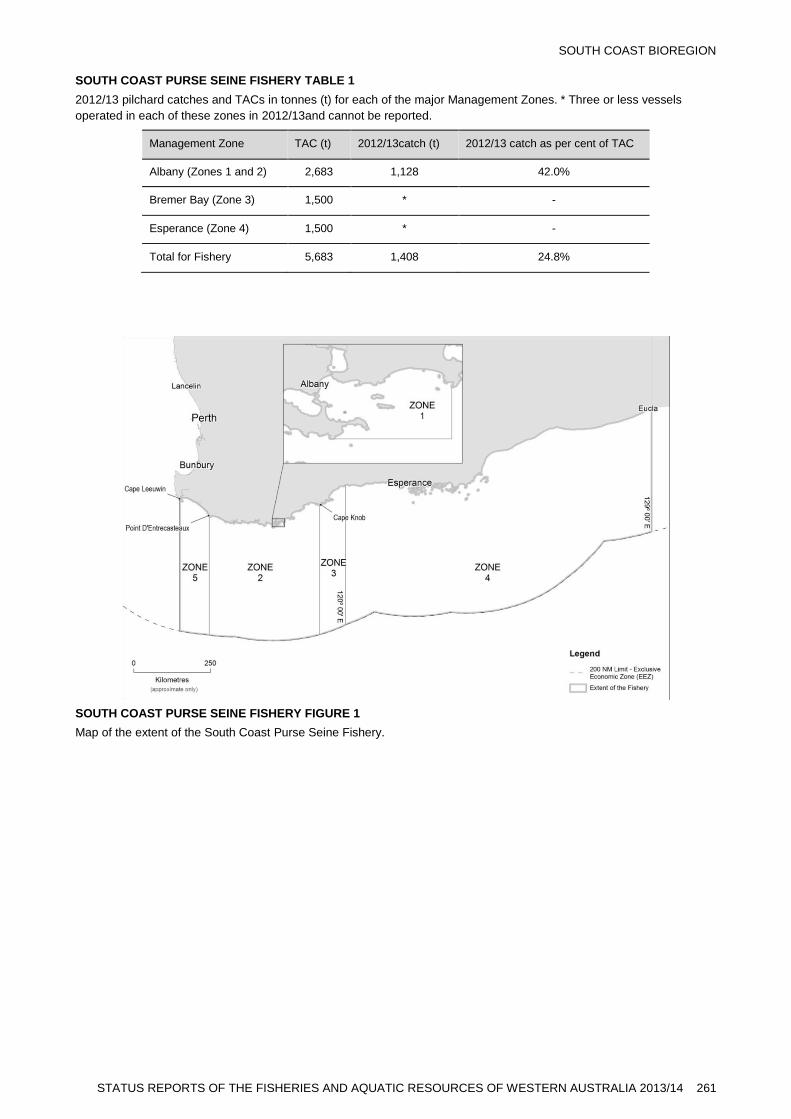
SOUTH COAST BIOREGION
STATUS REPORTS OF THE FISHERIES AND AQUATIC RESOURCES OF WESTERN AUSTRALIA 2013/14 261
SOUTH COAST PURSE SEINE FISHERY TABLE 1
2012/13 pilchard catches and TACs in tonnes (t) for each of the major Management Zones. * Three or less vessels
operated in each of these zones in 2012/13and cannot be reported.
Management Zone TAC (t) 2012/13catch (t) 2012/13 catch as per cent of TAC
Albany (Zones 1 and 2) 2,683 1,128 42.0%
Bremer Bay (Zone 3) 1,500 * -
Esperance (Zone 4) 1,500 * -
Total for Fishery 5,683 1,408 24.8%
SOUTH COAST PURSE SEINE FISHERY FIGURE 1
Map of the extent of the South Coast Purse Seine Fishery.

SOUTH COAST BIOREGION
262 DEPARTMENT OF FISHERIES
SOUTH COAST PURSE SEINE FISHERY FIGURE 2
Number of vessels, total effort (days), annual catches of pilchards (Sardinops) by main zone, catches of other species and nominal pilchard catch rate in the South Coast Purse Seine Fishery, 1975 –2013. For pilchard catches, Alb. = Albany (Zones 1 and 2), Brem. = Bremer Bay (Zone 3), Esp. = Esperance (Zone 4). Catch data for years when less than three vessels fished in any zone in any one year are not shown due to confidentiality restrictions. However, the total pilchard catches for the SCPSF include catches reported from all Zones of the fishery for all years.
1980 1990 2000 2010
010
2030
4050
Nu
mb
er
of
vess
els
Vessels
1980 1990 2000 2010
020
0060
00N
um
be
r o
f fis
hin
g d
ays
Effort (days)
1980 1990 2000 2010
020
0060
00
Year
Ca
tch
(to
nn
es)
Pilchard Catch
TotalAlb.Brem.Esp.
1980 1990 2000 20100
5015
025
0Year
Oth
er
ca
tch
es
(t)
Other catches
1980 1990 2000 2010
0.0
0.5
1.0
1.5
Ca
tch
ra
te (
ton
ne
s/d
ay) Nominal Pilchard Catch Rate
Year

SOUTH COAST BIOREGION
STATUS REPORTS OF THE FISHERIES AND AQUATIC RESOURCES OF WESTERN AUSTRALIA 2013/14 263
Temperate Demersal Gillnet and Demersal Longline Fisheries Status Report
M. Braccini, R. McAuley & J.O'Malley
Fishery Description
The Temperate Demersal Gillnet and Demersal Longline
Fishery (TDGDLF) is comprised of the Joint Authority
Southern Demersal Gillnet and Demersal Longline Managed
Fishery (JASDGDLF) and the West Coast Demersal Gillnet
and Demersal Longline (Interim) Managed Fishery
(WCDGDLF).These fisheries operate in continental shelf
waters along the south and lower west coasts, respectively.
The majority of operators employ demersal gillnets and
power-hauled reels to target sharks, with scalefish also being
a legitimate component of the catch. Demersal longline is
also a permitted method of fishing, but is not widely used.
The main shark species targeted in the TDGDLF are gummy
shark (Mustelus antarcticus), dusky shark (Carcharhinus
obscurus), whiskery shark (Furgaleus macki) and sandbar
shark (Carcharhinus plumbeus). On the south coast,
operators primarily target gummy and dusky sharks, while
dusky and sandbar sharks are targeted on the west coast.
Whiskery sharks are an important component of the catch for
both fisheries. These four species have been selected as
indicators for the status of the temperate shark ‘suite’ as they
account for approximately 80% of the fisheries’ shark catch
and represent the range of life history strategies of the other
shark species caught by these fisheries.
As their stocks span multiple Bioregional boundaries, dusky,
sandbar and whiskery sharks are assessed and monitored as
indicators of the Statewide inshore demersal suite of shark
species. Gummy sharks, however, have a more limited
southern range and are an indicator species of the South
Coast Bioregion inshore demersal shark species suite. The
two fisheries are reported together here because extensive
research has demonstrated that they share these key unit
stocks.
Governing legislation/fishing authority
South Coast
Joint Authority Southern Demersal Gillnet and Demersal
Longline Management Plan 1992
Joint Authority Southern Demersal Gillnet and Demersal
Longline Managed Fishery Licences
West Coast
West Coast Demersal Gillnet and Demersal Longline
(Interim) Management Plan 1997
West Coast Demersal Gillnet and Demersal Longline
(Interim) Managed Fishery Permits
Consultation processes
The Department undertakes consultation directly with
licensees on operational issues. Industry Annual General
Meetings are convened by the West Australian Fishing
Industry Council (WAFIC), who are also responsible for
statutory management plan consultation under a Service
Level Agreement with the Department.
Boundaries
The JASDGDLF spans the waters from 33° S latitude to the
WA/SA border and comprises three management zones
(Demersal Gillnet and Longline Figure 1). Zone 1 extends
southwards from 33° S to 116° 30’ E longitude off the south
coast. Zone 2 extends from 116°30’ E to the WA/SA border
(129° E). A small number of Zone 3 units permit fishing
throughout Zone 1 and eastwards to 116° 55’40” E. For the
Main Features
Status Current Landings (2012/13)
Stock level Demersal Gillnet and Demersal Longline Fishery
Gummy shark Adequate Total sharks and rays 938 t
Dusky shark Recovering Total scalefish 134 t
Sandbar shark Recovering Indicator species
Whiskery shark Adequate Gummy shark 378 t
Fishing Level Dusky shark 204 t
JASDGDLF Zone 1 Acceptable Sandbar shark 49 t
JASDGDLF Zone 2 Acceptable Whiskery shark 119 t
WCDGDLF Acceptable Sharks and rays by other commercial fisheries 3 t
Recreational catch (2011/12) <5% of commercial catch

SOUTH COAST BIOREGION
264 DEPARTMENT OF FISHERIES
purposes of this report, Zone 3 catch and effort data are
amalgamated into Zone 1 or Zone 2 as appropriate.
The WCDGDLF technically extends northwards from 33° S
latitude to 26° S longitude (Demersal Gillnet and Longline
Figure 1). However, the use of shark fishing gear has been
prohibited north of 26° 30’ S (Steep Point) since 1993.
Demersal gillnet and longline fishing inside the 250 metre
depth contour has been prohibited off the Metropolitan coast
(between latitudes 31° S and 33° S) since November 2007.
Management arrangements
The Southern and West Coast fisheries are regulated through
two complementary management plans. The JASDGDLF
(Joint Authority jurisdiction fishery) became managed under
WA state law in 1988 and since then the fishery has been
managed by the Western Australian Government on behalf of
a Joint Authority comprising the Western Australian and
Commonwealth Governments. The WCDGDLF (a state
jurisdiction fishery) is managed by the Western Australian
Government under an interim management plan introduced in
1997.
Both fisheries are managed via input controls in the form of
transferable time/gear effort units, with additional restrictions
on mesh and hook sizes, net height (‘drop’) and maximum
net length. Historically, each unit has permitted the use of a
specified length of net or an equivalent number of hooks for
one month. However, in 2009, the Department transitioned
the fishery to a more explicit hourly effort management
system, with the objectives of removing excessive latent
effort capacity and restricting effort within each management
zone to 2001/02 levels. All units were permitted to use 27 m
of gillnet or 9 longline hooks for 288 hours in the
WCDGDLF, 264 hours or 380 hours in Zone 2 of the
JASDGDLF. However in 2014 the unit value in the
WCDGDLF in respect of hooks was reduced to 1 hook x 1
hour in response to a dramatic increase in demersal longline
effort and catch of demersal scalefish. In addition to these
effort controls all boats operating in the TDGDLF are closely
monitored by the Department’s satellite-based Vessel
Monitoring System.
A suite of shark management arrangements in target and non-
target fisheries have been in effect since the 2006/07 season
to ensure sustainable catches of target, byproduct and bycatch
species, to assist in the recovery of historically over-exploited
whiskery, dusky and sandbar shark stocks and to maintain
acceptably low risks to endangered, threatened and protected
species (ETPs). These include:
the Statewide commercial protection of all sharks and
rays;
a general prohibition of metal trace wire and large hooks
(except in the Northern Shark and Mackerel Fisheries),
which had previously been used to target large whaler
sharks;
a significant increase in penalties for illegally possessing
sharks or rays; and
a closure during the main whiskery shark pupping season,
of inshore waters to 200m depth throughout all of the
WCDGDLF and the waters of the South Coast west of
118° E (in the JASDGDLF) to assist in the recovery of
the over-exploited whiskery shark stock.
In addition, to further assist in the protection of medium-high
risk dusky stocks, a 70 cm maximum (inter-dorsal fin) size
limit for all whaler sharks taken by recreational fishers within
the waters of the South Coast and West Coast Bioregions,
was introduced in February 2009.
The metropolitan zone between latitudes 31° S and 33° S
(inshore of 250 metres depth) was closed to most commercial
fishing activities, including those of the WCDGDLF, in
November 2007. To offset the Metropolitan Area Closure and
mitigate potential impacts of effort displacement to northern
grounds of the fishery, the Government established a
Voluntary Fisheries Adjustment Scheme (VFAS) that bought
back 36% of WCDGDLF entitlements.
The TDGDLF was first declared as an approved Wildlife
Trade Operations (WTO) in February 2006. The fishery has
been reassessed twice, and most recently re-accredited in
May 2012, under the Commonwealth Environment
Protection and Biodiversity Conservation Act 1999 (EPBC
Act). The accreditation allows continued export of product
from these fisheries for a period of three years. The current
WTO expires on 28 August 2015.
In addition to the renewal of the WTO, the fishery was
reaccredited for the purposes of Part 13 of the EPBC Act
which provides protection for operators who may interact
with ETPs. Addressing the potential interaction between
fishers and Australian sea lions is a condition of this Part 13
accreditation.
Following the outcomes of the Wetline Review, the
Government made a commitment to address the long-term
sustainability of demersal scalefish on the West Coast by
reducing both commercial and recreational demersal scalefish
catches by at least 50% of 2005/06 levels. Demersal
scalefish are an important component of the TDGDLF catch
and the fisheries are being closely monitored to ensure the
combined catch of demersal scalefish taken from the
commercial sector does not exceed the target (see West Coast
Demersal Scalefish Fishery Status Report).
Research summary
Major FRDC-funded studies of the shark fishery on the south
and west coasts of Western Australia, undertaken over the
period 1993–2004, have provided a detailed basis for
monitoring and assessing the fisheries. The extensive
biological and fishery information gained from these studies
have been reported in three FRDC final reports, numerous
international journal publications and have been used to
develop stock assessment models for the fisheries’ key target
stocks to determine their likely responses to current levels of
exploitation and to test alternative harvest regimes. A FRDC-
funded study of movements of the four indicator shark stocks
commenced in 2011. Results from this study will be used to
help in the reassessment of the status of these stocks enabling
greater reference to their spatial and temporal dynamics.
Current research monitoring involves analysis of statutory
fishing returns data and periodic biological sampling of
commercial and fishery-independent catches. To support the
fishery management arrangements introduced in 2006 and to
improve assessments of key stocks and facilitate the more
detailed reporting requirements of the fisheries’ export
accreditation under the Commonwealth’s EPBC Act,
statutory daily/trip catch and effort logbooks were introduced

SOUTH COAST BIOREGION
STATUS REPORTS OF THE FISHERIES AND AQUATIC RESOURCES OF WESTERN AUSTRALIA 2013/14 265
in 2006/07. After rectifying some initial problems this
exercise generally improved reporting standards and has
provided the basis for development and implementation of
new catch and effort data validation protocols.
Tactical research is also completed on bycatch issues with
ETP species. Two National Heritage Trust funded projects
investigated movements and aggregation locations of grey
nurse sharks (Carcharias taurus) and a recent FRDC-funded
project examined the relative spatial risks of Australian sea
lion (Neophoca cinerea) interactions with demersal gillnets.
A further FRDC-funded study to estimate quantitative rates
of Australian sea lion encounters with demersal gillnets was
undertaken in 2010‒11. WA Government-funded research
into white shark (Carcharodon carcharias) movements
around the south-west of Western Australia may also yield
information on the ecology and population structure of this
protected species.
Retained Species
Commercial landings (seasons 2012/13)1:
All sharks (and rays): 938 tonnes
Indicator shark species: 750 tonnes
Gummy: 378 tonnes
Dusky2: 204 tonnes
Whiskery: 119 tonnes
Sandbar: 49 tonnes
Other finfish (i.e. non shark) catch: In addition to their
primary catch of sharks, the JASDGDLF and WCDGDLF
land a variety of scalefish species, which totalled 134 t in
2012/13 (Demersal Gillnet and Longline Figure 3). This
catch included 37 t of demersal scalefish species taken in the
West Coast Bioregion and 70 t of demersal scalefish taken in
the South Coast Bioregion and a total of 26 t of non-demersal
scalefish species (Demersal Gillnet and Longline Table 1).
For details of other fisheries’ demersal scalefish catches in
those Bioregions, see West Demersal Scalefish Resource
Status Report and South Coast Demersal Scalefish Resource
Report.
Shark catches in other fisheries: Sharks were also
historically caught off the south and west coasts in a variety
of other commercial fisheries. However, due to the very poor
standard of reported species identification of non-targeted
shark catches and those catches’ contribution to identified
sustainability risks to some stocks (e.g. dusky shark), the
retention of sharks and rays was prohibited in most non-target
fisheries throughout the State by commercially protecting all
sharks and rays (elasmobranchs) in November 2006.
Reported elasmobranch catches by vessels operating in other
managed fisheries between North West Cape and the South
Australian border subsequently declined to less than 5 t per
year (3 t in 2012/13).
1 All reported weights are live weight
2 Dusky shark catches include catches of bronze whaler (Carcharhinus
brachyurus), which cannot be accurately separated in catch returns data prior
to 2006/07.
Recreational catch estimates: < 5% of total catch
The recreational catch of sharks by fishers operating from
trailer-boats between Augusta and Kalbarri was estimated
from two Department of Fisheries surveys conducted in
1996/97 and 2005/06. The total recreational shark catch was
estimated to have declined from ca. 7,000 sharks per year in
1996/97 to ca. 5,500 sharks per year in 2005/06, although
only about half of these were reported to have been retained.
The reported species composition of the retained catch in
2005/06 was similar to that of the TDGLF. Whaler shark
species were the most commonly retained group (31%),
followed by hound sharks (gummy, whiskery, etc.; 28%),
wobbegongs (14%) and hammerheads (10%). Assuming an
average weight of 5 kg per shark, then the recreational take of
sharks in the West Coast Bioregion would have been about
13.5 t.
An integrated survey of boat-based recreational fishing in
WA during 2011/12 estimated the recreational capture of
sharks at 25,908 individuals, from which only 4,514 were
retained (Ryan et al. 20133). For the West Coast and South
Coast Bioregions, a total of 15,086 individuals were captured
and 3,056 retained, which equates to approximately 15 t. The
most commonly retained species were hound sharks (43%),
followed by whalers (28%), other sharks (14%), wobbegongs
(9%) and hammerheads (5%). For the West Coast Bioregion,
a total of 2,664 individuals were retained. The most
commonly retained species were also hound sharks (38%),
followed by whalers (31%), other sharks (16%), wobbegongs
(10%) and hammerheads (5%). This is consistent with the
number of retained sharks estimated for this region in
2005/06.
Fishing effort/access level
There are 57 licences in the JASDGDLF (24 in Zone 1 and
33 in Zone 2) and 20 WCDGDLF permits, which can be used
collectively in conjunction with a fishing boat licence. Only 5
Zone 1, 13 Zone 2 and 4 WCDGDLF vessels reported active
fishing returns during 2012/13, similar to the levels of
participation in the fisheries over the last five years.
As gillnetting is by far the dominant method employed in the
fisheries, the historically small amount of longline fishing
effort is incorporated within analyses by transforming
longline shark catches by gillnet Catch Per Unit Effort
(CPUE). Although standardised fishing effort has previously
been reported in units of kilometre gillnet hours (km gn.hr-1),
the hourly component of effort reported in monthly fishing
returns prior to 2006/07 is known to be a poor indication of
the time nets actually spent fishing (i.e. ‘soak time’). With the
transition from monthly to hourly effort entitlement units and
the introduction of a daily catch and effort logbooks in
2006/07, actual soak times have been more accurately
reported over the last seven years. Thus, the hourly
components of fishing effort reported in monthly and daily
fishing returns are not directly comparable. To allow for
historical comparison and assessment of effort and CPUE
trends in the fisheries, the entire time series of effort data
have been recalculated in comparable units of kilometre
3 Ryan, K.L., Wise, B.S., Hall, N.G., Pollock, K.H., Sulin, E.H., & Gaughan, D.J.
(2013). An integrated system to survey boat-based recreational fishing in
Western Australia 2011/12. Fisheries Research Report No. 249, Department
of Fisheries, Western Australia 162 pp.
SOUTH COAST BIOREGION
266 DEPARTMENT OF FISHERIES
gillnet days (km gn.d-1; Demersal Gillnet and Longline
Figure 4). For these same reasons, fishing effort is also
monitored against 2001/02 target levels in units of km gn.d-1.
Fishery and zone-specific limits on demersal gillnet and
demersal longline fishing effort, equivalent to their 2001/02
levels, were agreed for the start of the 2006/07 season by
specifying the number of days that monthly units could be
fished in each management zone. These (daily) effort limits
are considered likely to deliver sustainable catches of target,
byproduct and bycatch species and acceptably low risks to
ETP species. Effort limits were subsequently re-defined and
legislated as hourly units of entitlement using conversion
rates of 24 hours day-1 in Zones 1 and 3 of the JASDGDLF,
20 hours day-1 in Zone 2 and 24 hours day-1 in the
WCDGDLF. Thus, specified fishing effort limits for each
management zone of the fishery are:
JASDGDLF Zones 1 and 3: 84,075 km gn.hr -1 (3,503
km gn.d-1)
JASDGDLF Zone 2: 144,102 km gn.hr -1 (7,205
km gn.d-1)
WCDGDLF1: 67,692 km gn.hr-1 (2,832 km
gn.d-1)
Expended effort in 2012/13 was 62,868 km gn.hr (3,494 km
gn.d-1) in Zone 1; 97,057 km gn.hr (5,368 km gn.d-1) in Zone
2 and 10,034 km gn.hr (438 km gn.d-1) in the WCDGDLF
(Demersal Gillnet and Longline Table 1). The effort decline
in the WCDGDLF is consistent with the gradual declining
trend observed in recent years explained by the combination
of reduction of fishing units due to the VFAS, area closures
and new effort management regimes. When measured in km
gn.hr-1, 57% of the fisheries’ effort capacity was utilised in
2012/13 (75% in Zone 1, 67% in Zone 2 and 15% in the
WCDGDLF). When measured in km gn.d-1, 69% of the
fisheries’ effort capacity was utilised in 2012/13 (100% in
Zone 1, 75% in Zone 2 and 15% in the WCDGDLF). Zone 1
km gn.d-1 effort is at its maximum and must be closely
monitored.
Stock Assessment
Assessment complete: Yes
Assessment level and method:
Gummy shark Level 2 - CPUE
(annual -relative to previous Level 5 assessment)
Dusky shark Level 2 - CPUE
(annual -relative to previous Level 4 assessment)
Sandbar shark Level 2 - CPUE
(annual -relative to previous Level 4 assessment)
Whiskery shark Level 5 - Age Structured Model
Breeding stock levels:
Gummy shark Adequate
Dusky shark Recovering
1 The WCDGDLF limit is adjusted to 64% of the 2001/02 effort level to account for
the reduction in entitlement units arising from the 2008 Voluntary Fishery
Adjustment Scheme.
Sandbar shark Recovering
Whiskery shark Adequate
The current status of the whiskery and gummy shark stocks is
adequate. The current effort levels and consequent CPUE and
catch levels are all acceptable. The dusky and sandbar shark
stocks are currently recovering. The current effort levels and
consequent CPUE and catch levels are all acceptable,
permitting recovery of the stock. It is highly likely that the
four stocks are above the point where recruitment would be
impaired.
Stock assessments are carried out for the four indicator shark
species caught by the fishery using a combination of catch
and effort data, periodic empirical estimates of fishing
mortality rates, biological information and dynamic biomass
and demographic simulation models. For assessment
purposes, monthly catch and effort data are corrected to
account for missing fishing returns prior to 1989/90,
inaccurately reported species compositions and an increasing
effort efficiency of 2% yr-1 prior to 1995/96, to account for
major advances in gear technology (e.g. monofilament nets
and GPS) and vessel development (i.e. introduction of larger
vessels). Missing, misreported and confounded catches
submitted in daily/trip logbook returns between 2006/07 and
2008/09 were recovered or corrected using fishers’ personal
records, fish processor returns, face to face and phone
interviews with fishers or were derived from average fish
weights in accurately-reported logbook records or from
previously observed size frequency data and available length
weight relationships.
Trends in the relative abundance of the fisheries’ four
indicator species are inferred from each species’ annual
‘effective’ Catch Per Unit Effort (CPUE) data. Effective
CPUE is calculated by dividing the corrected gillnet-only
catch by the equivalent gillnet effort from the regions of the
fisheries that overlap each species’ primary distribution (as
defined below). Due to the introduction in 2006 of an annual
two month closure to protect near-term pregnant whiskery
sharks and the prohibition of demersal gillnet fishing in the
metropolitan region in November 2007, catch and effort data
reported from west of 118°E during August, September and
October and between latitudes 31°S and 33°S are excluded
from the effective CPUE time series.
Gummy shark: The best (median) estimate from age-
structured modelling indicated that in 1997/98 the Western
Australian gummy shark stock was 42.7% of its virgin
biomass, slightly above its minimum acceptable level of 40%
of its virgin level. As gummy shark catches are almost
exclusively comprised of adults, the upward trend in effective
CPUE from the area off the south coast between longitudes
116°E and 129°E between the mid 1990s and 2005/06,
suggested that breeding biomass steadily increased following
reductions in demersal gillnet fishing effort commencing in
1992 (Demersal Gillnet and Longline Figure 5). Although
recent CPUE estimates have been higher than at any time
since records began, the unprecedented spike and subsequent
decline in effective CPUE over the last five years is
inconsistent with previous estimates and will be considered in
more detail during development of a new integrated stock
assessment model that incorporates contemporary catch,
effort, size and movement information that is due to be
developed over the next three years.
SOUTH COAST BIOREGION
STATUS REPORTS OF THE FISHERIES AND AQUATIC RESOURCES OF WESTERN AUSTRALIA 2013/14 267
Dusky shark: Due to the size selectivity characteristics of
the mesh sizes permitted in the fishery and its area of
operation, dusky shark catches have historically consisted of
neonate (young of the year) and one to two year old fish,
which collectively accounted for 89% of the observed catch
during the 1990s. Due to the age-selective nature of the
fishery and longevity of the species, which takes about 30
years to reach maturity and may live for more than 50 years,
the available time series of catch and effort data are
insufficient for developing a dynamic population simulation
model for this stock (as has been used for gummy and
whiskery sharks). The status of the Western Australian dusky
shark stock was therefore assessed using stochastic
demographic modelling techniques to evaluate the
sustainability of empirically-estimated fishing mortality rates
of sharks born between 1994 and 1996.
The most recent demographic assessment for this stock was
conducted in 2005 and subsequent assessments have relied on
analyses of catch and CPUE data from south of 28°S latitude
to 120°E longitude off the south coast, in relation to the
demographic rates estimated by that model. This analysis
confirmed that demersal gillnet and longline fishing mortality
rates were likely to have been sustainable for the cohorts of
sharks born in 1994/95 and 1995/96. However, the model
also predicted that very low levels of fishing mortality (1–2%
yr-1) applied to sharks older than 10 years of age would result
in negative rates of population growth. Although the area of
the WCDGDLF between 26° 30’ S and North West Cape was
closed in 1993 to protect adult dusky sharks, they are known
to have been caught by various fisheries operating within and
outside WA jurisdiction. Previous assessments therefore
concluded that the declining trend observed in the effective
CPUE series between the mid 1990s and 2004/05 (Demersal
Gillnet and Longline Figure 6) could indicate that breeding
biomass had been gradually depleted by these poorly-
quantified sources of fishing mortality.
There has been an overall increasing trend in the effective
CPUE over the past eight years. While the effects of reduced
gear competition in the WCDGDLF resulting from the
reduction in fishing units due to the VFAS and a general
reduction in fishing effort could have contributed to the
increasing trend, the average effective CPUE for the past five
years has been higher than any time since 1984/85. This
suggests that recruitment has been increasing strongly since
measures were introduced to protect adult sharks and
constrain effort in the TDGDLF. Combined with the recent
catches of juvenile sharks of this species having been reduced
to approximately half of the quantity determined to be
sustainable in 1994/95 and 1995/96, along with the
comprehensive measures to mitigate cryptic mortality of
older dusky sharks that have been introduced from 20061, the
current management arrangements are considered suitably
precautionary to ensure that fishing mortality is now at a
level such that recovery of this stock is occurring. The
decline in effective CPUE over the last two years will be
considered in more detail during development of the new
stock assessment models.
1 i.e. commercial protection of sharks in most non-target fisheries, total protection of
all whaler sharks with an inter-dorsal fin length greater than 70 cm in the South
and West Coast Bioregions, 70 cm maximum (inter-dorsal fin) size limit for
dusky sharks in the TDGDLF, implementation of bycatch reduction devices in
trawl fisheries, prohibition of metal snoods in most commercial fisheries.
Whiskery shark: Previous age structured modelling of the
whiskery shark stock (based on hourly CPUE data)
concluded that total biomass was depleted to less than 40% of
its virgin level by the early 1990s but the stock had shown
preliminary signs of recovery to slightly above 40% of virgin
biomass by the late 2000s. Using the new series of daily
effective CPUE data from south of 28°S latitude to 129°E
longitude off the south coast (Demersal Gillnet and Longline
Figure 7) in the model supports the conclusion that total
biomass was heavily depleted during the 1980s. However,
this model implementation indicates that total biomass at the
commencement of mandatory catch and effort reporting in
1975/76 was less certain than previous assessments suggested
(95% confidence intervals that biomass was between 69%
and 100%). Significantly, the model also suggests (with 95%
confidence) that biomass may only have fallen as low as
45.4% in 1995/96. The best (median) estimates of total
biomass indicated only very modest increases and that
biomass in 2009/10 was 52.1% of its virgin level (95%
confidence intervals of 46.4 to 56.8%). Further analyses of
CPUE data are currently being undertaken in conjunction
with exploration of alternative model assumptions, in an
attempt to better understand these model results.
Nevertheless, as these and previous model outputs suggest
that whiskery shark biomass currently exceeds the minimum
acceptable level and all recent modelling indicates that total
and mature female biomass trends are increasing, the status
of the WA whiskery shark stock is now considered to be
acceptable.
Furthermore, accelerated rates of whiskery stock recovery are
expected to become evident in catch and CPUE data when
sharks born since the introduction of the annual closed season
(see management arrangements above) begin recruiting to the
fishery (around 2012/13).
Sandbar shark: Due to the sandbar shark’s longevity and
age-specific nature of fishing mortality in the target fisheries,
stock assessment was undertaken using empirically-derived
estimates of fishing mortality and demographic modelling
techniques, similar to those used for dusky shark. FRDC-
funded research undertaken between 2000 and 2005
confirmed that sandbar sharks taken in the TDGDLF were the
same unit stock as was being targeted in the Northern Shark
Fisheries. The model indicated that combined levels of
fishing mortality in the target TDGDLF and Northern Shark
Fisheries, as well as in non-target commercial fisheries and
the recreational fishing sector were increasingly
unsustainable between 2001 and 2004 and had probably been
so since at least 1997/98. As those mortality rates
corresponded to combined reported catches of 250–440
tonnes year-1, the combined catch of 918 tonnes reported by
the target sector in 2004/05 (762 tonnes of which was
reported by the northern shark fisheries) is considered to have
been highly unsustainable. This conclusion was supported by
fishery-independent survey data collected from the area
between northern Shark Bay and Eighty Mile Beach where
mature sandbar sharks are prevalent, which indicate there was
a significant decline in breeding stock abundance between
2002 and 2005.
Subsequent assessments of stock status have used analyses of
the combined catches by the TDGDLF and northern shark
fisheries (see Northern Shark Fisheries Status Report),
relative to those fisheries’ catches during the assessment
period. Although an effective CPUE region has been

SOUTH COAST BIOREGION
268 DEPARTMENT OF FISHERIES
identified as south of 26°S latitude to 118°E longitude off the
south coast (Demersal Gillnet and Longline Figure 8), the full
extent of expected reductions in recruitment caused by
previous excessive catches of breeding stock, are unlikely to
be reflected in CPUE data until cohorts born since 2004/05
enter the fishery between 6 and 9 years of age. Although the
significant declines in WCDGDLF fishing effort may mask
the magnitude of reductions in those cohorts’ abundance,
TDGDLF sandbar shark catches since 2008/09 have been at
levels that should allow a gradual recovery of the breeding
stock. With the breeding stock likely to be close to the
minimum acceptable limit (40% of virgin biomass), the
WCDGDLF will need to be carefully monitored over coming
years to ensure that catch levels of sandbar sharks are
maintained consistent with continued stock recovery.
Other sharks: The four indicator species of the temperate
shark ‘suite’ account for approximately 80% of the fisheries’
and Bioregional shark catch and represent the range of life
history strategies of other shark species caught by the
fisheries. Thus, the status of indicator stocks is believed to
generally reflect the status of other sharks in the South and
West Coast Bioregion.
Non-Retained Species
Bycatch species impact: Low
The catch composition of the fishery was examined in detail
for the period 1994 to 1999. There is some discarded bycatch
of unsaleable species of sharks, rays and scalefish. During
ESD risk assessment of these fisheries in 2002, all impacts on
stocks of bycatch species were determined to be low risk. As
maximum potential fishing effort is now explicitly capped at
less than 70% of the mid to late 1990s levels, bycatch in all
management zones is expected to have been proportionally
reduced. Recent multi-fisheries bycatch risk assessment has
identified the Port Jackson shark among the higher risk
bycatch species in the West Coast Bioregion. Although this
species is one of the largest components of the demersal
gillnet and demersal longline fisheries bycatch and is
recorded as bycatch in other commercial fisheries,
cumulative risks were assessed as low-moderate due to its
very high post-capture survival from gillnet fisheries
(Braccini et al. 20121).
Listed species interaction: Negligible-Low
Historical on-board observer programs have shown that ETP
species interactions were very low throughout the fishery.
The Demersal Gillnet and Longline Table 2 details individual
interactions between the fishery and all ETP species since
recording began in fishery returns in 2006/07.
Recently completed analyses of potential encounter rates of
Australian sea lions with demersal gillnet gear and
interpretation of those rates in the light of historical observer
data have supported Department’s Negligible-Low risk rating
and suggested that sea lion captures in these fisheries are
likely to be extremely low frequency events.
It should also be noted that demersal gillnet and longline
1 Braccini, J.M., Van Rijn, J.A. & L.H. Frick. High post-capture survival for sharks,
rays and chimaeras discarded in the main shark fishery of Australia? PLoS
ONE, 7: e32547
fishing is not permitted between Steep Point (26°30’ S) and a
line drawn north of North West Cape (114°06’ E) to Koolan
Island, or within 3 nautical miles of the Abrolhos Islands
baselines, where populations of turtles and Australian sea
lions are present.
Ecosystem Effects
Food chain effects: Low
The recent analysis of potential changes in ecosystem
structure of finfish on the South and West Coast Bioregions
(Hall & Wise, 2011)2 found no evidence of any systematic
change in species diversity, richness or trophic index
indicating that this fishery is not having a material impact on
food chain or trophic structure.
Habitat effects: Negligible
The level of effort is such that the gear is deployed
infrequently over approximately 40% of the fisheries’
operational area (Demersal Gillnet and Longline Figure 1)
and under normal circumstances the physical impact of the
gear on the bottom is minimal. Moreover the very small
footprint of each net would combine to make a very small
percentage (<< 5%) of the area that would be contacted by
this gear on an annual basis.
Social Effects
Direct: Fishing returns reported that between 57 and 74 crew
were employed in the JASDGDLF and between 14 and 15
were employed in the WCDGDLF during 2012/13. As sharks
are generally not targeted by recreational fishers in Western
Australia, their direct social importance to this group is
negligible.
Indirect: Sharks are viewed as a menace by some members
of the community due to their perceived danger to humans
and their predation of recreationally caught fish. However,
others consider them to be important components of marine
ecosystems that need to be conserved.
Economic Effects
Estimated annual value (to fishers) for 2012/13:
JASDGDLF: Level 2 - $1 - 5 million
WCDGDLF: Level 1 - <$1 million
* As fishers do not specify the value of fins on their catch
returns, fin values were calculated at an average of 3% of
sharks’ whole weight and value was conservatively
estimated using a price of $20/kg. Categories of shark
which do not have saleable fins were excluded from fin
valuation.
2 Hall, N.G. and Wise, B.S. 2011. Development of an ecosystem approach to the
monitoring and management of Western Australian fisheries. FRDC Report –
Project 2005/063. Fisheries Research Report No. 215. Department of
Fisheries, Western Australia. 112 pp.

SOUTH COAST BIOREGION
STATUS REPORTS OF THE FISHERIES AND AQUATIC RESOURCES OF WESTERN AUSTRALIA 2013/14 269
Fishery Governance
Target commercial catch range:
All key shark species 725–1,095 tonnes
Individual key shark species:
Gummy shark 350–450 tonnes
Dusky shark 200–300 tonnes
Sandbar shark < 120 tonnes
Whiskery shark 175–225 tonnes
Current Fishing Level
JASDGDLF Zone 1 Acceptable
JASDGDLF Zone 2 Acceptable
WCDGDLF Acceptable
The total catch for 2012/13 was within target range, similar to
previous years and considered acceptable given effort levels.
Maximum acceptable effort levels for each management zone
have been based on their respective 2001/02 (daily) levels.
These levels are considered likely to deliver sustainable
harvests of the fisheries’ target and byproduct species and
acceptably low levels of bycatch and listed species
interactions. Under explicit hourly-gear input control
arrangements, effort should not exceed these limits.
Gummy shark catches exceeded the upper limit of their
acceptable range between 2003/04 and 2009/10, and reached
a historically high level in 2007/08 (755 t). As the steadily
increasing CPUE trend observed between the early-mid
1990s and 2005/06 is believed to have been a result of
increasing stock abundance, the consistently high catches
reported in recent years are not of concern. Although gummy
shark catches were lower than their historical peak, current
catches were similar to last year and at the lower limit of their
target range. As gummy CPUE appears to have been
maintained at a relatively high rate, this year's catch is not of
concern. However, until the implications of the
unprecedented recent spike in effective CPUE can be
ascertained and a new stock assessment model developed,
CPUE will be closely monitored to ensure that it remains at
expected levels and the downwards trajectory of the last three
years does not continue.
Dusky shark catches have been within their acceptable
range since 20004/05, except for 2006/07 when they were 5
tonnes below the minimum limit. The dusky shark catch in
2012/13 was 204 t which is within the target range of 200‒
300 t. Catch rates in 2012/13 were similar to previous years.
It is worth noting that the fishery has not utilised its full
entitlement during 2012/13 and as such the Department will
need to carefully monitor the catch levels to ensure they do
not increase above sustainable levels. The acceptable catch
range will require re-evaluation if catches increase in coming
years.
Whiskery shark Total catches of whiskery shark have
steadily declined since the mid-1990s although until 2010/11
catches had been maintained slightly above or below the
minimum acceptable level. The 127 t catch in 2010/11 and
102t catch in 2011/12 were 48 and 73 t, respectively, less
than the minimum level and had been the fisheries’ lowest
annual catch since 1975/76. The low catches of recent years
mostly reflect the outcomes of management measures to
recover this stock, in particular, the introduction of the
seasonal whiskery ‘pupping’ closure. As these measures are
intended to increase catch rates in coming years the
acceptable catch range may need to be reviewed as the
magnitude and rate of stock recovery can are determined.
Sandbar shark catches exceeded their maximum
acceptable level until effort declined dramatically in the
WCDGDLF in 2008/09 when catches declined to more
sustainable levels of 81 t in 2008/09, 107 t in 2009/10, 71 t in
2010/11, 34 t in 2011/12, and 49 t in 2012/13. The
historically low catch of sandbar sharks is likely to reflect the
low level of fishing effort and other fleet dynamics in the
WCDGDLF. At these levels, recruitment to the breeding
stock should improve in coming years and gradually allow
the mature biomass to recover from more than a decade of
excessive catches in the northern shark fisheries (see
Northern Shark Fisheries Status Report).
New management initiatives (2014/15)
The review of the whiskery shark ‘pupping’ closure for the
2013/2014 fishing season resulted in a reduction of the
closure to the peak pupping period of the entire month of
September only. The area of the closure remained as in
previous years. Given that the virgin biomass has likely
exceeded B40 a reduction in the duration of the closure was
considered appropriate. However, although cohorts born
since 2006 were expected to recruit to the fisheries around
2012/13, with the long-term sustainability of the species in
mind, and the uncertainty surrounding the status of the
whiskery shark stocks in the absence of a formal stock
assessment (due for commencement in 2014/15) the
Department will review the closure again for the 2014/15
fishing season. The FRDC-funded desktop study that began
in August 2010 to estimate potential interaction rates of
Australian sea lions with demersal gillnets in the TDGDLF
was completed and accepted by FRDC in early 2012. The
model developed as part of the project was used to conduct a
(partial) reanalysis of existing independent observer data
form the TDGDLF to assist in evaluating management
options to ensure interactions with Australian sea lions are
maintained with acceptable levels.
On 1 June 2014 West Coast Demersal Gillnet and Demersal
Longline (Interim) Management Plan 1997 was amended to
significantly reduce the value of a demersal longline unit in
the West Coast Demersal Gillnet and Demersal Longline
Interim Managed Fishery in response to a dramatic increase
in demersal longline effort and catch of demersal scalefish.
The value of a demersal longline unit was reduced from 288
hours at nine hooks to one hour at one hook.
The WTO for the TDGDLF was renewed on 31 May 2012
and expires on 28 August 2015. In addition, the Part 13
accreditation of the management plans for the fisheries were
re-accredited. This accreditation allows fishers to interact
with ETPs without fear of prosecution. The accreditation
carries a condition associated with addressing interactions
between the fishery and Australian sea lions. The Department
has convened an Australian sea lion Working Group (the
Working Group) that consists of Departmental staff from
both management and research, as well as industry, the
conservation sector and the Department of Parks and Wildlife
(formerly the Department of Environment and Conservation).

SOUTH COAST BIOREGION
270 DEPARTMENT OF FISHERIES
The Working Group are developing strategies to address the
EPBC Act’s Part 13 accreditation condition and specifically
are identifying management measures that will mitigate
interaction between the fishery and Australian sea lions.
The proposed South-west Commonwealth marine reserve
network was proclaimed in November 2012. Following the
change of Federal Government in 2013 the marine reserve
network is to be reviewed. The potential for the reserves to
impact on the TDGDLF will depend on the outcomes of that
review. The State Ngari Capes Marine Park was also reserved
in June 2012, however the zoning scheme has not yet been
given effect. This marine park is likely to have some impact
on Zone 1 TDGDLF operators.
The TDGDLF underwent MSC pre-assessment in 2014.
Outcomes are expected in late 2014.
External Factors
As the TDGDLF key target species span multiple regional
boundaries there are a number of factors outside of the
control of the fishery which can negatively impact the
performance of key temperate shark stocks. In particular, the
potential for ongoing catches of breeding stock of sandbar
sharks across the northern shark fisheries (from Western
Australia, Northern Territory and northern Queensland and
Commonwealth managed fisheries) remains cause for
concern. Other potential factors affecting key temperate shark
stocks include targeted fishing for gummy shark by
Commonwealth managed vessels that occurs to the east of
Zone 2 of the JASDGDLF (although the fishery is tightly
managed via quota controls) and incidental catches of dusky
and gummy sharks in other State and Commonwealth
Government-managed fisheries. While the risks associated
with these outside influences are largely unqualified they
must be taken into account in the stock assessment for
individual species (and the TDGDLF ‘suite’) to ensure
appropriate management strategies are implemented that
address the long-term sustainability of the shark stocks.
DEMERSAL GILLNET AND LONGLINE TABLE 1
Summary of 2012/13 catch (t live wt.) by the WA temperate Demersal Gillnet and Demersal Longline Fisheries. Data are
given by management zone and also by Bioregion (italicised). Indicator species and catches are highlighted in bold.
Name Species or taxon
JASDGLF WCDGDLF Bioregion
Zone 1 Zone 2 South
Coast
West
Coast Total
Sharks and rays
Gummy Mustelus antarcticus 27.6 349.4 0.7 358.5 19.1 377.7
Dusky whaler Carcharhinus obscurus 120.6 78.5 5.0 97.1 107.0 204.1
Whiskery Furgaleus macki 27.2 90.5 1.4 102.3 16.8 119.1
Sandbar Carcharhinus plumbeus 21.4 5.9 21.3 13.4 35.2 48.6
Hammerheads F. Sphyrnidae 21.6 37.5 0.8 42.9 17.0 59.9
Spinner (long nose grey) Carcharhinus brevipinna 50.0 9.5 8.0 16.5 51.1 67.6
Wobbegongs F. Orectolobidae 17.8 7.7 2.1 13.6 14.0 27.6
Rays Batoidea 3.6 5.9 2.3 6.2 5.6 11.8
Common saw shark Pristiophorus cirratus 1.2 6.6 6.6 1.2 7.8
Other elasmobranchs 4.8 6.2 2.4 7.0 6.4 13.5
Total elasmobranchs 295.8 597.6 44.1 664.1 273.4 937.5
Scalefish
Queen Snapper Nemadactylus valenciennesi 10.5 22.0 <0.1 28.0 4.6 32.6
Blue Groper Achoerodus gouldii 18.6 14.8 0.2 21.6 12.0 33.6
Dhufish Glaucosoma hebraicum 8.6 0.5 1.8 2.1 8.8 10.9
Pink snapper Pagrus auratus 9.7 5.5 2.8 9.0 8.9 17.9
Boarfishes F. Pentacerotidae 1.3 5.3 5.5 1.1 6.6
Samsonfish Seriola hippos 6.8 2.3 0.9 3.1 6.9 10.0
Redfishes Centroberyx spp. 0.2 3.3 <0.1 3.5 0.1 3.6
Mulloway Argyrosomus hololepidotus 2.3 2.3 0.5 2.3 2.8 5.2

SOUTH COAST BIOREGION
STATUS REPORTS OF THE FISHERIES AND AQUATIC RESOURCES OF WESTERN AUSTRALIA 2013/14 271
Name Species or taxon
JASDGLF WCDGDLF Bioregion
Zone 1 Zone 2 South
Coast
West
Coast Total
Sweetlips F. Haemulidae 0.6 0.6 0.6
Baldchin groper Choerodon rubescens 0.6 0.6 0.6
Other scalefish 7.8 1.8 2.5 4.5 7.5 12.1
Total scalefish 65.9 57.8 9.9 79.7 53.9 133.6
'Demersal scalefish suite' component 49.0 51.7 6.6 70.0 37.2 107.2
Fishing effort (km gn d) 3,494
(100)1
5,368
(75)1
438
(15)2
9,300
(69)2
Fishing effort (1000 km gn hr) 63
(75)3 97 (67)3
10
(15)3
170
(57)3
1 Percentage of respective 2001/02 levels
2 Percentage of VFAS adjusted 2001/02 levels
3 Values in parentheses are percentages of each management zone’s maximum hourly effort capacity
DEMERSAL GILLNET AND LONGLINE TABLE 2
Recorded interactions with Endangered, Threatened, Protected (ETP) species.
ETP SPECIES 2006/07 2007/08 2008/09 2009/10 2010/11 2011/12 2012/13
Alive(A)/Dead(D) A D A D A D A D A D A D A D
Dolphins 6 1 1 2 2 3
Manta Rays 2 2 1
Muttonbird, General 7 4
Sawfish, General 1 1
Sea Birds 1 3 2 2 1
Sea Lions 2 3 1
Seal, NZ Fur 1 1 2 1 5 7 1 3
Shark, Grey Nurse 61 18 38 16 63 18 59 27 53 19 69 18 68 19
Shearwater, Fleshfooted 2
Snake, Sea 2
Turtle, General 4 3 5 2 2 2 1 1 3 3
Whales 1
White Shark 10 3 10 3 14 2 2 1 3 5 19 3 17 1
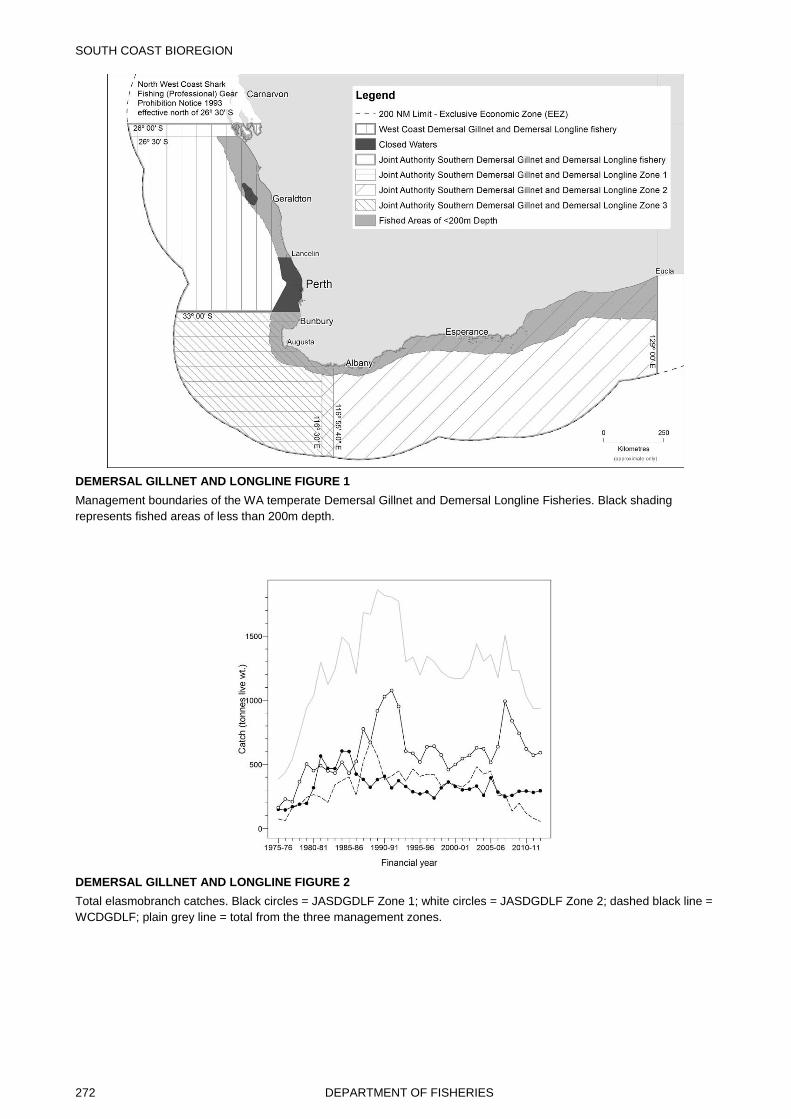
SOUTH COAST BIOREGION
272 DEPARTMENT OF FISHERIES
DEMERSAL GILLNET AND LONGLINE FIGURE 1
Management boundaries of the WA temperate Demersal Gillnet and Demersal Longline Fisheries. Black shading
represents fished areas of less than 200m depth.
DEMERSAL GILLNET AND LONGLINE FIGURE 2
Total elasmobranch catches. Black circles = JASDGDLF Zone 1; white circles = JASDGDLF Zone 2; dashed black line =
WCDGDLF; plain grey line = total from the three management zones.

SOUTH COAST BIOREGION
STATUS REPORTS OF THE FISHERIES AND AQUATIC RESOURCES OF WESTERN AUSTRALIA 2013/14 273
DEMERSAL GILLNET AND LONGLINE FIGURE 3
Total scalefish catch. Black circles = JASDGDLF Zone 1; white circles = JASDGDLF Zone 2; dashed black line =
WCDGDLF; plain grey line = total from the three management zones. Catches prior to 1988/89 cannot be distinguished
from other fisheries' gillnet and longline catches and are omitted.
DEMERSAL GILLNET AND LONGLINE FIGURE 4
Standardised demersal gillnet and demersal longline effort. Black circles = JASDGDLF Zone 1; white circles =
JASDGDLF Zone 2; dashed black line = WCDGDLF; plain grey line = total from the three management zones.
DEMERSAL GILLNET AND LONGLINE FIGURE 5
Gummy shark effective effort (grey line) and CPUE (black circles).

SOUTH COAST BIOREGION
274 DEPARTMENT OF FISHERIES
DEMERSAL GILLNET AND LONGLINE FIGURE 6
Dusky shark effective effort (grey line) and CPUE (black circles).
DEMERSAL GILLNET AND LONGLINE FIGURE 7
Whiskery shark effective effort (grey line) and CPUE (black circles),
DEMERSAL GILLNET AND LONGLINE FIGURE 8
Sandbar shark effective effort (grey line) and CPUE (black circles).

SOUTH COAST BIOREGION
STATUS REPORTS OF THE FISHERIES AND AQUATIC RESOURCES OF WESTERN AUSTRALIA 2013/14 275
South Coast Demersal Scalefish Resource Report: Statistics Only
J. Norriss, E. Lai and S. Walters
Fishery Description
Commercial
Operators in this fishery target demersal scalefish species
such as pink snapper, Bight redfish, blue morwong (queen
snapper) and hapuku, and the pelagic Samson fish in waters
of the South Coast Bioregion, primarily using droplines and
handlines. The fishery is herein referred to as the south coast
“wetline” fishery, although the catch reported here also
includes minor quantities of demersal scalefish taken in
nearshore waters by haul nets and set nets whilst targeting
nearshore species (e.g. herring, whiting, mullet), and by fish
trapping whilst targeting leatherjackets.
The take of scalefish by trawl methods, salmon by line and
beach netting, estuarine netting and pilchards by purse seine
in the South Coast Bioregion are separately managed
fisheries and their catches are not included here. The capture
of demersal species by the Joint Authority Southern
Demersal Gillnet and Demersal Longline Fishery operating
in the South Coast Bioregion is also managed and reported
separately (see Temperate Demersal Gillnet and Longline
Fisheries Status Report).
Recreational
Recreational fishers, mostly using line based methods from
boats, also take these species.
Boundaries
This wetline fishery operates in the South Coast Bioregion’s
(SCB) oceanic waters from near Black Point at 115 30’ E to
the WA/SA border at 129 E (South Coast Demersal
Scalefish Resource Figure 1).
Governing Legislation
Commercial
Fish Resources Management Act 1994, Fish Resources
Management Regulations 1995 and other subsidiary
legislation.
The commercial ‘wet line’ fishery is currently ‘open access’
for the holder of an unrestricted Fishing Boat Licence (for the
boat) and a Commercial Fishing Licence (for the fisher).
Recreational
Fish Resources Management Act 1994, Fish Resources
Management Regulations 1995 and other subsidiary
legislation.
Total Landings (Season 2013):
61.3 tonnes demersal scalefish
53.1 tonnes non-demersal scalefish
Commercial
Catch estimates (South Coast Demersal Scalefish Resource
Table 1) are monitored through the Department’s statutory
Catch and Effort Statistics (CAES) return system. Bight
redfish, blue groper, blue morwong and pink snapper have
been identified as indicator species for the inshore demersal
suite of finfish for the SCB. These indicator species are used
to monitor the status of the resource and represent the large
majority of the catches in this suite by the commercial
fishery. Hapuku, blue-eye trevalla and eightbar grouper have
been identified as indicator species for the offshore demersal
suite.
Two new catch statistics are included in this chapter for the
first time as they are unreported elsewhere: Samson fish, one
of the indicator species for the SCB pelagic suite; and the
catch of leatherjackets unconnected to the South Coast
Estuarine Managed Fishery and taken mostly by trap. The
high leatherjacket catch in 2011 was due to a concerted
attempt to develop that fishery at the time.
The catch of 61.3 t of demersal scalefish during 2013 is much
lower than any year since at least 2000, which had ranged
from 104 to 147 tonne (South Coast Demersal Scalefish
Resource Figure 2). Pink snapper, Bight redfish, blue
morwong and hapuku catches were at their lowest since
2000. This may be due to reduced fishing effort, although the
reason is currently not well understood. In addition, 53.5 t of
non-demersal scalefish catch was reported in 2013, including
Samson fish (13.1 t), leatherjackets species (9.0 t) and an
unusually high catch of bonito (21.7 t).
Recreational
A survey of boat based recreational fishing for the 12 months
to 29 February 2012 estimated the SCB catch (tonnes
±standard error) of some demersal indicator species: Bight
redfish 11.8 (±1.7), blue morwong 12.0 (±1.8), snapper 9.4
(±2.3). The recreational catch of Samson fish was estimated
to be 670 fish kept and 568 fish released.
Fishery Governance
Target commercial catch range: Not available
Current Fishing (or Effort) Level: Not available
A formal catch range has not been developed for this fishery,
but will be considered following the completion of a Western
Australian Natural Resource Management (WANRM) Office
funded research project in 2015, described under New
Management Initiatives (below).
New management initiatives (2014/15)
Following the introduction of the West Coast Demersal
Scalefish (Interim) Management Plan 2007 and reductions in
effort applied to the West Coast Rock Lobster Managed
Fishery, there have been concerns about a shift in fishing
effort to the SCB and consequential resource sharing issues.
A new WANRM-funded research project commenced in
2013, with the objective of providing age based stock

SOUTH COAST BIOREGION
276 DEPARTMENT OF FISHERIES
assessments of inshore demersal indicator species for the
South Coast Bioregion (pink snapper, Bight redfish, blue
morwong and western blue groper), and to elucidate the stock
structure of Bight redfish. A research report will be finalised
in 2015 which will inform the development of more formal
fishery management arrangements.
The Department commenced a review of wetline fishing
(including ‘open access’ commercial line, net and fish trap
fishing) on the South Coast in late 2013. Through this
review, the Department intends to implement more formal
management arrangements for these open access fisheries to
address stakeholder concerns and provide an improved
framework for the sustainable management of commercial
line, net and trap fisheries into the future.
This fishery underwent pre-assessment for Marine
Stewardship Certification in mid 2014. Outcomes will be
available late in 2014.
External Factors
Bight redfish are an important component of the catch of the
Great Australia Bight Trawl Sector (GABTS), part of a
Commonwealth managed fishery operating across southern
Australia as far west as Cape Leeuwin. Off the Western
Australia coast (i.e. west of 129 º E) it operates outside State
fishery shelf waters (depth less than 200 metres), except for
east of 125º E (approximately 250 km east of Esperance)
where shelf waters are fished. A preliminary estimate of 297 t
was taken in the 2012-13 fishing season, including 37 t from
all waters (shelf and slope) off the West Australian coastline.
Thus the South Coast Demersal Scalefish resource is also
exploited by the GABTS and is affected by management
arrangements in that fishery. The current WANRM-funded
project is working in collaboration with the Australian
Fisheries Management Authority that manages the GABTS.
SOUTH COAST DEMERSAL SCALEFISH RESOURCE TABLE 1
Catches (t) of demersal indicator species, total demersal and total non demersal scalefish catches by the ‘open access’
commercial wetline fishery in the South Coast Bioregion, 2009–2013.
Species 2009 2010 2011 2012 2013
Bight Redfish* 33.5 31.2 36.4 45.6 21.3
Blue groper 1.4 0.7 1.4 0.4 0.9
Blue Morwong 8.1 5.0 5.2 4.4 4.0
Pink Snapper 44.9 40.7 30.2 27.2 17.4
Hapuku 18.5 12.8 16.8 14.5 7.4
Blue-eye trevalla 2.4 2.2 3.4 3.1 0.6
Eightbar grouper 0.8 0.6 1.6 3.4 1.5
Other demersal scalefish 16.7 14.8 11.8 10.1 8.3
Total demersal scalefish 126.4 108.0 106.8 108.8 61.3
Samson fish (pelagic) 16.2 15.4 19.4 13.3 13.1
Leatherjackets 4.5 4.9 39.1 6.2 9.0
Total other non-demersal
scalefish** 8.4 4.6 11.5 9.3 31.4
Total Scalefish 155.5 133.0 176.8 137.6 114.8
* Estimates of Bight redfish catches include fishes reported as ‘Bight redfish’, ‘yelloweye redfish’ and ‘redfish’, confirmed by recent catch
sampling to be almost exclusively Bight redfish.
** Non demersal scalefish includes fishes from the pelagic and nearshore suites excluding samson fish and leatherjackets.

SOUTH COAST BIOREGION
STATUS REPORTS OF THE FISHERIES AND AQUATIC RESOURCES OF WESTERN AUSTRALIA 2013/14 277
SOUTH COAST DEMERSAL SCALEFISH RESOURCE FIGURE 1
Map of the extent of the "open access" wetline fishery in the South Coast Bioregion.
SOUTH COAST DEMERSAL SCALEFISH RESOURCE FIGURE 2
Catches (t) of demersal and non demersal scalefish in the "open access" wetline fishery, 2000—2013.
AQUACULTURE
Regional Research and Development Overview
Greenlip abalone (Haliotis laevigata) is considered a key
species for aquaculture development on the south coast of
WA.
An abalone farm and associated hatchery near Bremer Bay
have been upgraded and modified to cater for planned growth
in production and to accommodate biosecurity requirements.
The land-based farm and hatchery are being operated
according to a Management and Environmental Monitoring
Plan (MEMP), which includes provisions for biosecurity.
Independent audits are undertaken to ensure compliance with
the Biosecurity Plan.
An offshore abalone farm near Augusta has achieved
encouraging results for abalone being cultured using purpose-
built concrete grow-out structures located on the sea bed.
Following the successful outcome of trials undertaken at two
sites under an Exemption issued by the Department of
Fisheries, the operator has submitted an application for a
variation to its current aquaculture licence to add two new
sites; and an application for a new aquaculture lease for the
two new areas. The Department is in the final stages of
assessing the applications.
The abalone aquaculture industry sector is now operating and
being managed according to the July 2013 Abalone
Aquaculture in Western Australia Policy. A key purpose of
the Abalone Aquaculture Policy, which places a high level of
emphasis on biosecurity, is to establish clear management
guidelines and hence provide greater certainty to the sectors
of the abalone industry.
0
50
100
150
200
250
20002001200220032004200520062007200820092010201120122013
Non-demersal speciesDemersal species
Scal
efi
sh C
atc
h
SOUTH COAST BIOREGION
278 DEPARTMENT OF FISHERIES
COMPLIANCE AND COMMUNITY EDUCATION
Commercial and recreational fisheries compliance in the
South Coast Bioregion is undertaken by Fisheries and Marine
Officers (FMOs) based at Albany and Esperance District
Offices and using a Recreational Mobile patrol vehicle.
FMOs conducted compliance activities of both the
recreational and commercial fisheries. The compliance
strategies include both overt and covert operations.
Inspections of fishing activities are conducted on land, at-sea,
at commercial fish processors establishments, aquaculture
sites and wholesale/retail outlets. Vessels, catches, fishing
gear, marine safety equipment are inspected and commercial
and recreational licences are checked.
There are two part-time South Coast Marine Education
Officers who deliver the Education program for the South
Coast.
Activities during 2012/2013
Compliance
Due to the variety of commercial and recreational fisheries,
expanse of coastline and the variable and seasonal weather
conditions, FMOs employ a risk management driven
approach to prioritise and plan compliance activities.
Overall, FMOs delivered a total of 3,665 hours ‘on-patrol’
officer hours to the bioregion, similar to that in 2011/12
(South Coast Compliance Figure 1).
Commercial Fisheries
FMOs made contact with a total of 392 commercial fishers in
the field, across the south coast. Offences detected included
licensing issues, quota management and breaches of
individual fisheries management arrangements (South Coast
Compliance Table 1.).
The remainder of the commercial fishery compliance effort
was directed to the wide range of minor commercial fisheries
operating in the bioregion. There was an increase in catch
inspections of the estuarine fisheries and commercial licence
inspections.
During the year, 12 infringement warnings and 10
infringement notices were issued with a further 10 cases
resulted in prosecution action being taken against commercial
fishers (or those offending against commercial gear).
Recreational Fisheries
Recreational compliance activities concentrated mainly on
checking shore and boat based anglers, net fishers and
shellfish collectors. FMOs contacted a total of 9680
recreational fishers. During 2012/13, there were 123
infringement warnings and 55 infringement notices issued
and 7 prosecution actions were taken against recreational
fishers (South Coast Compliance Table 1).
Compliance patrols in recreational fisheries principally
involve checks to ensure that fishers are adhering to size and
bag limits and complying with restrictions that apply in the
recreational net fishery.
The areas of highest risk of non-compliance with the
management arrangements were considered to be abalone,
marron, marine finfish and estuarine netting. There
continues to be a growing awareness of the open season and
availability of abalone on the south coast.
Education
Community and school education programs in the Southern
Bioregion were conducted by the Marine Education Officers.
Activities included the delivery of school programs and
excursions to primary and secondary students across the
region in structured sessions. People were contacted through
structured community education activities such as school
holiday programs, presentations to interest groups and direct
community engagement with recreational fishers.
Four regional events were also attended. These included
agricultural shows and science expos. Where possible,
education initiatives were delivered in collaboration with
other environmental education providers. Partnerships
included Recfishwest, the Department of Parks and Wildlife,
South Coast Natural Resource Management, the WA
Museum, the Fishers with Disabilities Association and the
Oyster Harbour Catchment Group.
Initiatives in 2013/2014
Compliance
Compliance and management personnel continue to refine
compliance planning to deliver greater efficiencies and
outcomes through the use of risk assessments and intelligence
processes. This has resulted in greater capacity to target
specific offence types, utilising risk analysis to deploy
resources more efficiently.
There will be a renewed focus on complaints and
investigations with a view towards improving the keeping of
records, gathering and managing evidence and delivering
outcomes of those matters in a more timely fashion – with
feedback (where appropriate) to the complainants.
Biosecurity is a strategic focus for the region with the
complimentary efforts between compliance staff and the
Biosecurity Unit.
Training and development of staff will continue to be driven
with FMOs attending several investigation and management
courses.
Peak fishing periods including higher influx of holiday
makers and fishers will become a focus of both high-profile
presence of FMOs, and of community education activities.
The Mobile Recreational Fishing vehicle will be rostered to
conduct patrols in the Bioregion and increase the high profile
presence with roster start-times designed to maximise
contacts with recreational fishers.
The Walpole – Nornalup Inlets Marine Park will see the
personnel in the southern bioregion engaged in a range of
tasks including delivery of marine park compliance services
and education programs. Operational plans have been
developed with the Department of Parks and Wildlife, and
the Department of Transport with a focus on joint operations
to maximize the management presence in the marine park.
A dedicated and targeted approach on the unlawful taking of
abalone by recreational fishers for commercial purposes will
concentrate on known high risk areas. Intelligence
information identifies this activity is taking place and the
mostly likely locations and methods that are being used by
some recreational fishers.

SOUTH COAST BIOREGION
STATUS REPORTS OF THE FISHERIES AND AQUATIC RESOURCES OF WESTERN AUSTRALIA 2013/14 279
Education
The education program will aim to strengthen direct
engagement with the community, including recreational and
commercial fishers. This will be done through providing
direct engagement opportunities for the community at boat
ramps and caravan parks, as well as regional events and
fishing competitions.
Education staff will continue the delivery of community
activities such as school holiday programs and workshops, in
partnership with other agencies where possible. The
education program will continue to deliver at schools and
school excursions focused on sustainability and key
departmental initiatives, as well as providing resources to
teachers which help to create positive marine stewardship
within their class.
Education for the Walpole-Nornalup Inlets Marine Park will
continue to be delivered in collaboration with the Department
of Parks and Wildlife. The Marine Education Officers will
also support all local community participation initiatives such
as the South Coast Demersal Send Us Your Skeletons
program, the Research Angler Program and Biosecurity
Watch.
SOUTH COAST COMPLIANCE TABLE 1
Summary of compliance and educative contacts and detected offences within the South Coast Bioregion during the
2012/13 financial year.
PATROL HOURS DELIVERED TO THE BIOREGION 3,665 Officer Hours
CONTACT WITH THE COMMERCIAL FISHING COMMUNITY
Field Contacts by Fisheries & Marine Officers 392
Infringement warnings 12
Infringement notices 10
Prosecutions 10
Fishwatch reports** 6
VMS (Vessel Days)*** 2,996
CONTACT WITH THE RECREATIONAL FISHING COMMUNITY
Field Contacts by Fisheries & Marine Officers 9,680
Infringement warnings 123
Infringement notices 55
Prosecutions 7
Fishwatch reports 26
OTHER FISHING-RELATED CONTACTS WITH THE COMMUNITY*
Field Contacts by Fisheries & Marine Officers 1,082
Fishwatch reports 0
*Contacts are classified according to the specific fishery, which is usually clearly delineated as being either commercial or recreational.
The “Other” category is used where multiple fisheries are contacted and it is not possible to accurately classify the contacts into one
specific fishery – typically, the majority of these contacts are recreational in nature (e.g. personal contacts in Marine Protected
Areas), but contacts made in relation to fish kills, shark patrols and inspections of commercial fish wholesale and retail premises etc.
are also included in this category.
**Fishwatch reports are allocated to the District Offices relevant to the Bioregion. It is not possible to distinguish between calls relating
to Inland Bioregions.
***VMS (Vessel Days) represents the number of vessel days recorded in this bioregion. That is, a count for each day that each vessel
was polled within the bioregion.

NORTHERN INLAND BIOREGION
280 DEPARTMENT OF FISHERIES
SOUTH COAST COMPLIANCE FIGURE 1
“On Patrol” Officer Hours showing the level of compliance patrol activity delivered to the South Coast Bioregion over the
previous 5 years. The 2012/13 total gives the patrol hours in the bioregion that resulted in the contacts detailed in Table
1. (The totals exclude time spent on other compliance related tasks e.g. travel time between patrol areas, preparation
and planning time etc.)