A Parable of Compliance issues and their link to EBFM ...
33
A Parable of Compliance issues and their link to EBFM outcomes. . By John G. Pope 1 and Charlotte T. Weber 2 . This is a scientific parable mostly based on an investigation of Compliance issues and their link to EBFM that arose as part of the MAREFRAME Atlantos CASE STUDY. Highlights are Cost of Compliance is proposed as a useful statistic for assessing any proposed change in management in any fishery. Methods of how it might be calculated draws on approaches developed for the MAREFRAME Atlantos Case Study. It provides a succinct summary of the proceedings of an important meeting on compliance issues and EBFM held with Atlanterro Stakeholders and the Atlantis Board of Commerce. It suggests how its specific techniques could be adapted to other areas and gives an example of the transfer of advanced technical methods from Atlantos Scientists to the (backward) North Sea Case Study. It notes the common problems of including Atlanterro and other Stakeholders in the fisheries management process. Highlights (for review)
Transcript of A Parable of Compliance issues and their link to EBFM ...

A Parable of Compliance issues and their
link to EBFM outcomes.
.
By John G. Pope1 and Charlotte T. Weber2.
This is a scientific parable mostly based on an investigation of Compliance issues and
their link to EBFM that arose as part of the MAREFRAME Atlantos CASE STUDY.
Highlights are
Cost of Compliance is proposed as a useful statistic for assessing any proposed
change in management in any fishery.
Methods of how it might be calculated draws on approaches developed for
the MAREFRAME Atlantos Case Study.
It provides a succinct summary of the proceedings of an important meeting on
compliance issues and EBFM held with Atlanterro Stakeholders and the
Atlantis Board of Commerce.
It suggests how its specific techniques could be adapted to other areas and
gives an example of the transfer of advanced technical methods from Atlantos
Scientists to the (backward) North Sea Case Study.
It notes the common problems of including Atlanterro and other Stakeholders
in the fisheries management process.
Highlights (for review)

1
A Parable of Compliance issues and their 1
link to EBFM outcomes. 2
By John G. Pope1 and Charlotte T. Weber2. 3
1Corresponding Author, NRC (EUROPE) LTD, The Old Rectory, Staithe Road, Burgh St Peter, Beccles, 4
Suffolk, UK. NR34OBT. Email [email protected]. Tel. +1502677377 5
2 Norwegian College of Fishery Science, UiT – The Arctic University of Norway, Tromsø, Norway 6
Abstract. 7
Fisheries Stakeholders are understandably most concerned with immediate problems. Often these 8
problems are related to proposed rule changes. This short term focus is in itself a serious problem for 9
introducing Ecosystems Based Fisheries Management (EBFM), which is typically seen as a long-term 10
approach. However, the short-term response of fishers to rule changes may well have long-term 11
consequences by either changing their fishing patterns or by changing the extent to which fishers obey the 12
rules. Either response could have a long-term impact on achieving EBFM. 13
This is a difficult area to study because it involves fishers’ unrecorded behaviour, but it is probably the case 14
that many of the responses of fishers may be influenced by how much it costs them to change their 15
behaviour to comply with new rules. Changes in behaviour may include changes in fishing gear, fishing 16
grounds or fishing effort. To examine these possibilities requires that a short-term area based model is 17
available that can consider the costs and consequences of changes in fishing gear or fishing ground. There 18
can be technical difficulties with doing this, but this paper attempts to show how these might be overcome. 19
However, given the sensitive nature of compliance issues, these approaches are applied to the mythical 20
*Manuscript including abstractClick here to view linked References

2
fisheries of Atlantis rather than to real life fisheries. Initial results of the model applied to the important 21
Atlantean Fishing fleets are shown, and most importantly how much compliance might cost in these cases 22
is indicated (i.e. the profit forgone by complying). Pursuing this scientific parable further also allows an 23
open discussion of ways to mitigate non compliance. It suggests how stakeholders and managers might be 24
able to improve trust and compliance by adding fishers’ information to the scientific information used in 25
models of compliance to increase transparency and by identifying and encouraging responsible behaviours 26
that improve compliance and thus the chances of EBFM being successful. The purpose of the parable is to 27
spark discussion and wider thinking about fisheries management and compliance in an EBFM context. 28
29
Key Words: EBFM, Stakeholder views, Fishers’ Behaviour, Area Based models, Atlantis Fable, Compliance. 30
1 Introduction 31
1.1 Preamble 32
In 2014 the EU funded a large research project (MareFrame) to remove the barriers that prevent a more 33
widespread use of the EBFM in Europe. At the onset of the MareFrame project North Sea Stakeholders 34
expressed the wish that work should focus on 35
The need to achieve Fmsy1. 36
The Landing Obligation. 37
The Risks of Incompatible Regulation. 38
In practice the first of these topics was most congruent with the pre-agreed work plan of MareFrame and 39
thus commanded the bulk of time and resources. However, it was wished in some way to consider the 40
1 Fmsy is the level of fishing mortality for a species that will give Maximum Sustainable Yield and is a common limit
reference point for fisheries management

3
other two stakeholder concerns. Undoubtedly, it would have been best to base this on a real system and 41
indeed preliminary work was started on this using the small mesh beam trawl fisheries of the Netherlands 42
as an example and work done on this is shown in the results. However, to complete this would have 43
required the ability to visit and have extensive consultations with Dutch Stakeholders and human and travel 44
resources that were not available under MareFrame. Hence such an endeavour has to await another time. 45
Consequently a thought experiment is presented to both demonstrate what might be a first way forward 46
for what is certainly a complex problem and to air some of the opinions, concerns, considerations and 47
opportunities that might come into play when Stakeholders are involved in such a process. 48
Hence in this paper, the authors use a scientific parable that will take the reader to a mythical world—the 49
EU state of Atlantis. The story revolves around an imaginary fishery placed somewhere in the North 50
Atlantic, which faces ‘real-world’ issues of a recently introduced discard ban and associated concerns about 51
compliance. The purpose of this ‘mythical approach’ is to discuss the delicate and sometimes controversial 52
issues of compliance freely. Therefore, despite the (at time) whimsical storyline, all ideas brought forward 53
in this paper are meant earnestly, with the aim to spark discussion and wider thinking about fisheries 54
management and compliance in an EBFM context. 55
56
1.2 Rationale 57
Most proposals for long-term fisheries management suppose that fishers will comply with the proposed 58
regulations. History however suggests that this has not always been the case. Clearly the extent of 59
compliance with regulations will affect their outcomes and therefore the success or failure of measures 60
designed to further Ecosystem Based Fisheries Management (EBFM). The literature suggests that there are 61
multiple factors that influence fishers’ willingness to comply with regulations or that tempt them not to 62
comply. 63

4
Rule compliance is often analysed from an economic perspective and much of today’s fisheries 64
management is grounded in such economic theory, where fishers are seen as self-interested, rational 65
agents that strive to maximise their economic utility, while decimating the resource if offered open access 66
(Gordon, 1954). In this case, individuals will comply if the cost of breaking the rule is higher than the utility, 67
while the opposite case will lead to non-compliance. This is in the same line of thought as Hardin’s 68
influential piece on the Tragedy of the Commons (Hardin, 1968). Based on these assumptions, the 69
behaviour of individuals is determined by a system of reward and punishment (Raakjær Nielsen, 2003). This 70
understanding narrows down individuals’ compliance behaviour to a purely economic incentive which can 71
be controlled through monitoring, surveillance and enforcement. Ostrom’s work expanded this 72
understanding and introduced the idea of how reciprocity, reputation, and trust affect people’s behaviour 73
(Ostrom, 1998). Further social, cultural, and political factors like norms, perceptions, community, 74
transparency and legitimacy have also been found to impact fishers’ behaviour (Hønneland, 1999; Ostrom, 75
1998; Raakjær Nielsen, 2003). Therefore, individuals’ decisions to comply can be influenced by both 76
tangible and intangible motivations, like moral obligations and social influence, as suggested by the 77
literature and empirical evidence. In such cases, fishers can show cooperation even though this results in 78
economic loss, just to `do the right thing´, and individuals are more non-compliant the more their 79
community and peers are non-compliant or vice-versa (Sutinen and Kuperan, 1999). This may mean that 80
non-compliance mitigations would have to involve more complex considerations, such as increasing fishers’ 81
perceptions of the legitimacy of policies and regulations, introducing equitable procedures for imposing 82
restrictions and empowering participants through co-management, for example (Sutinen and Kuperan, 83
1999). At other times, the issues at hand can be as simple as a lack of understanding of the rules and fishers 84
breaking rules unknowingly. 85
For this reason, the solutions to non-compliance issues are very dependent on the framing of the problem, 86
that is the factors leading to, or preventing, rule compliance (Jagers et al., 2012). In return, the diversity of 87
factors potentially influencing compliance exacerbates the development of generalizable and suitable 88

5
mitigation and counter measures. So how can we start to understand the costs of compliance—the profit 89
forgone by complying—and its long-term consequences to ecosystem-based fisheries management? 90
Despite the multiple factors, it seems likely that the cost of compliance is potentially the most important 91
factor to consider or at least a first step in the process. However, compliance is often a sensitive and time 92
consuming subject to address for a real fishery. Consequently in this paper, we develop a scientific parable 93
based around the mythical EU state of Atlantis. 94
1.3 History:- Atlantis Resurgum 95
Far away and long ago in a parallel universe (that exists as a Riemann surface like extension to the real 96
Earth), Atlantis had slipped below the waves. However, following intense volcanic activity, it rose again 97
from the depths in AD i18502. It is situated in the North Atlantic Ocean on the south Rockall Bank 98
(57.24⁰+i720N⁰, 19.36⁰+i360⁰W). Ownership of the newly emerged land was initially disputed between the 99
countries of iEurope. But, the Atlantean Government in exile, a covert cabal that had existed since those 100
earlier classical times (with secret HQ on Malta, the Atlanteans being a Phoenician people) laid historical 101
claims to the resurgent land mass. Their claims to sovereignty, perhaps cynically supported by the leading 102
maritime power of the day and backed up by dubious archaeology, were finally accepted and 103
internationally ratified by the Atlantis Treaty. The Government of Atlantis in exile thus claimed and settled 104
the land of Atlantis. Its population subsequently swelled to about 1 million. It is a devotedly Catholic 105
democracy but perhaps not surprisingly given its cabalistic roots, anachronisms remain such as the 106
matriarchally descended High Priestess of Astarte remaining the titular head of state (deemed by many to 107
be of divine origin). Although trading and banking are now the predominant industries of Atlantis, fishing 108
and fish processing were the pioneer industries and are consequently hallowed in the Atlantean psyche. 109
110
Background to the Fisheries Management of Atlantis. 111
2 Here and elsewhere in the paper a prefix of i indicates an imaginary entity. I.e. i=-1.

6
As part of the initial International accommodation, signatories of the Atlantis treaty (signed in St Petersburg 112
i1868) retained rights to share Alantean waters (somewhat like those subsequently granted signatories of 113
the Svalbard Treaty, 1925) and these rights were recognised when Atlantis extended its EEZ under UNLOS 114
in i1997. Atlantis joined the iEU in i1999 and Atlantean waters are fished both by Atlantis based fisheries, 115
by fleets of other iEU countries and by fleets of some non iEU signatories of the Atlantis Treaty. However, in 116
recent years fishing by non Atlantean fisheries has become uncommon but all fishing is subject to the CFP 117
of the iEU. Figure 1 shows the topography of the Atlantean shelf. Fish resources in Atlantean waters, being 118
toward the northern end of the Boreal-Lusitanian province, are not dissimilar to those about the Faroe 119
plateau or the Northern North Sea and the fisheries are conducted with similar fishing methods to those 120
areas. 121
Traditionally, the Atlatean Fishers, having Mediterranean ancestry, organised their management on a Guild 122
like basis. However, membership of the iEU meant its one size fits all management in the Atlantic has 123
somewhat superseded these earlier approaches though some traditional management rules still persist and 124
these traditional rules are religiously observed by Atlantean fishers. Atlantean fisheries follow a restricted 125
vessel licensing system based on traditional usage rights but this is overlaid with an iEU imposed system of 126
TACs. ITQs have not been adopted in Atlantis. 127
More recently the iEU has striven to introduce ecosystem-based fisheries management (EBFM) to Atlantis 128
as to other iEU regions. This aims to account for all factors within a fisheries system in a holistic and 129
integrated fashion. The outcomes from this approach are: more precautionary management 130
recommendations, consideration of non-target species, addressing trade-offs among sectors and catch 131
allocation, improved short- and long-term economics for participants, and long-term sustainability (Link, 132
2010). Of course not all Atlanteans viewed these changes as beneficial but the Government of Atlantis had 133
little choice but to accept this aspect of the iCFP. 134

7
Recently, the landing obligation (LO) of the i2013 Common Fisheries Policy, i.e. a discard ban, was 135
introduced into iEU and Atlantean fisheries and will be fully implemented by 2019. With this regulation in 136
place, discarding, i.e. returning catch to the sea, of over-quota, unwanted and undesirable catch will no 137
longer be an option. This has raised concerns of the risk of early closures in fisheries due to what is referred 138
to as the “choke-species” effect, which occurs when the quota of one species is exhausted before those of 139
others. This presents a particular problem for mixed-fisheries, where it can be difficult to target or avoid 140
single species as many are caught together (Mortensen et al., 2018). Such a discard ban can have large 141
associated costs in terms of drastic reductions of long-term profits. This could have a strong impact on 142
fishers compliance, as discarding practices have been found to be most closely linked to economic 143
incentives (Simons et al., 2015). 144
Atlantean fisheries are based upon a mixture of Boreal and Lusitanian species. A particular concern is the 145
round fish fisheries for cod, haddock and saithe, which are largely fished by Atlantis based fishers. 146
In Atlantis, fishers and scientists have a long history of liaising, and it is common practice to address any 147
fisheries issues directly through dialogue between industry and science. The Atlantean traditionally 148
involved in these discussions include The Atlantis Board of Commerce (ABC) and the Atlantis Regional 149
Advisory Council (ARAC). Members of the ARAC include Atlantean (environmental) Non-Governmental 150
Organizations (NGOs), Fishers organizations, fishers unions, the transport federation, the High Priestess of 151
Astarte, fish processors, a few selected consumers, and governmental scientists from the social and natural 152
sciences. 153
Given the current changes in policy, the Atlantean case study was brought into being as part of the EU-154
funded MareFrame project, a project aiming to support co-creation processes for ecosystem-based 155
fisheries management solutions. As part of the MareFrame Atlantean case study, the Atlantean 156
stakeholders were invited for an initial consultation regarding the concerns of the newly introduced LO in 157
Atlantis. In the course of the consultation it became clear that: 158

8
1. Atlanteans were concerned to achieve EBFM. 159
2. However, their attention was necessarily focused on short-term issues. In particular they were 160
concerned with the impending Landings Obligation (LO) and its possible effect on compliance. 161
3. The Atlantis Board of Commerce (ABC), which participated in these consultations, noting that reductions 162
in compliance would have implications for the long-term success of EBFM measures, requested that the 163
MareFrame Atlantean Case Study conduct a preliminary scoping study into the potential extent and cost 164
implications of non-compliance in the context of the Atlantean offshore demersal round-fish fishery. 165
1.4 Objective 166
This paper provides the initial response of the MareFrame Atlantean Case Study team to the request by the 167
ABC. It aims: 168
1) To set out the likely short-term economic scope for non-compliance in the Atlantean round-fish 169
fishery. 170
2) To record the results of discussions held with ABC and the Atlantis Regional Advisory Council 171
(ARAC) on ways forward to encourage compliance. 172
173
2 Materials and Methods 174
2.1 Approach: 175
Compliance is a complex amalgam of economic, social and governance factors. However, assuming that 176
non-compliance is driven by economic forces rather than by bad habits or being anti-authority, the cost of 177
compliance (the profit forgone by complying) becomes the measure of the driver that may lead to non-178
compliant behaviour. In defining this measure no judgment is made as to the likely behaviour of fishers 179

9
under the proposed Landings Obligation (LO) in Atlantean waters or elsewhere. Rather it is a way to scale 180
“the wages of sin” for a particular case and thus to appreciate the strength of temptation not to comply. 181
To predict the size of the cost of compliance (in the short term) with a discard ban (AKA Landing Obligation 182
- LO) requires that the economic consequences of compliant and non-compliant behaviours be calculated. 183
The most obvious behavioural differences between compliant and non-compliant behaviours might be in 184
choice of fishing gear adopted, the areas fished and the amount of fishing effort deployed. Compliant 185
behaviour, which would be landing all fish species caught up to their given quota, might involve the choice 186
of mesh-sizes that reduced the proportion of unwanted sizes of various species and/or avoiding fishing 187
grounds where those sizes of those species are prevalent. Non-compliant behaviours would continue 188
fishing with existing or smaller mesh gears, seek the most profitable grounds and illicitly discard unwanted 189
catch. In the case of the Atlantean fishing grounds the wider and more productive fishing banks are 190
situated off the East Coast, which are more sheltered and more accessible to the main harbour and market 191
at Atlanto Porto (see Fig 1) in the South East Bight of Atlantis. These grounds tend to be more profitable 192
than those on the steeper and more exposed West Coast but are also the nursery grounds of the round-fish 193
species and hence the areas where more unwanted, undersized fish are caught and discarded. The problem 194
for Atlantean fishers is thus somewhat similar to that of the beam trawl flatfish fisheries of the Netherlands 195
and Belgium where the main sole fishing areas overlap with the distribution of undersized plaice and sole 196
and are close to their main harbours. 197
To model this for Atlantean waters it is necessary first to acquire information on the distribution of fish by 198
area by size. Area distributions of catch by species and effort are available at the STECF website (STECF 199
i2017)3. This also provides estimates of total discard weight by species from past years but not their 200
distribution by area. Consequently, not all the information needed for input to a model that operates at a 201
subarea level is available in these existing data; e.g. there are no ICES rectangle data for discards by size 202
3 Go to https://stecf.jrc.ec.europa.eu/dd/effort/graphs-annex and for Atlantos data select the LANT Annex.
10
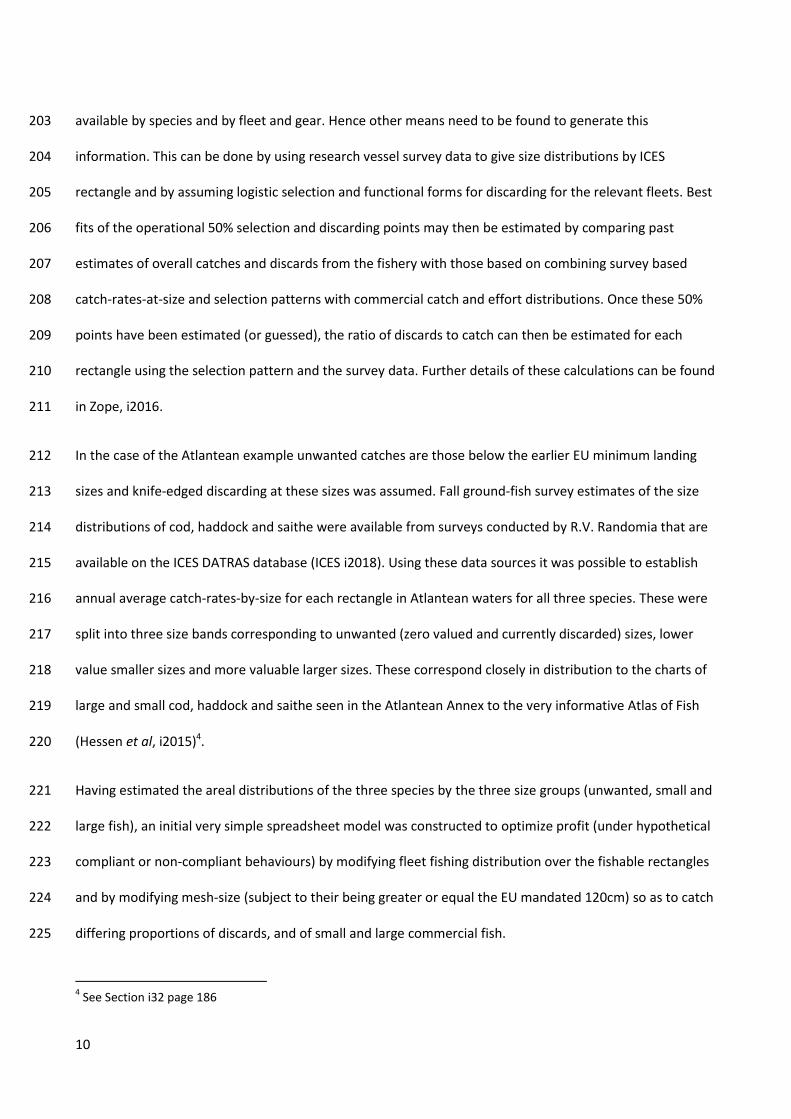
available by species and by fleet and gear. Hence other means need to be found to generate this 203
information. This can be done by using research vessel survey data to give size distributions by ICES 204
rectangle and by assuming logistic selection and functional forms for discarding for the relevant fleets. Best 205
fits of the operational 50% selection and discarding points may then be estimated by comparing past 206
estimates of overall catches and discards from the fishery with those based on combining survey based 207
catch-rates-at-size and selection patterns with commercial catch and effort distributions. Once these 50% 208
points have been estimated (or guessed), the ratio of discards to catch can then be estimated for each 209
rectangle using the selection pattern and the survey data. Further details of these calculations can be found 210
in Zope, i2016. 211
In the case of the Atlantean example unwanted catches are those below the earlier EU minimum landing 212
sizes and knife-edged discarding at these sizes was assumed. Fall ground-fish survey estimates of the size 213
distributions of cod, haddock and saithe were available from surveys conducted by R.V. Randomia that are 214
available on the ICES DATRAS database (ICES i2018). Using these data sources it was possible to establish 215
annual average catch-rates-by-size for each rectangle in Atlantean waters for all three species. These were 216
split into three size bands corresponding to unwanted (zero valued and currently discarded) sizes, lower 217
value smaller sizes and more valuable larger sizes. These correspond closely in distribution to the charts of 218
large and small cod, haddock and saithe seen in the Atlantean Annex to the very informative Atlas of Fish 219
(Hessen et al, i2015)4. 220
Having estimated the areal distributions of the three species by the three size groups (unwanted, small and 221
large fish), an initial very simple spreadsheet model was constructed to optimize profit (under hypothetical 222
compliant or non-compliant behaviours) by modifying fleet fishing distribution over the fishable rectangles 223
and by modifying mesh-size (subject to their being greater or equal the EU mandated 120cm) so as to catch 224
differing proportions of discards, and of small and large commercial fish. 225
4 See Section i32 page 186
11
Catch proportions appropriate to a mesh size were based upon a logistic selection curves using the previous 226
average fish sizes of the catch of each of the three size components for each species. Costs of a day’s fishing 227
(the unit of effort adopted) and the average additional costs of steaming to different grounds were 228
ascribed to each rectangle. This enabled the costs to be calculated of expending a given number of days 229
fishing in each rectangle. The catch value of each size of each species was then combined with the 230
calculated catch rates of each size and species in each rectangle. This enabled the catch value of a given 231
number of days fishing at each rectangle to be calculated. Profit for such effort was then calculated as the 232
difference of the calculated fishing costs and catch values for each rectangle and summed to give a total 233
profit. Total catches of each species were also calculated for each rectangle and summed to give the total 234
catch. Fishing effort was also summed across all rectangles. 235
Optimizations of the fleet effort distribution by rectangle and of the average mesh size that maximized 236
profit were made using the SOLVER optimizing routine of EXCEL . This enabled optimizations to be suitably 237
constrained to the TAC landings of each species and also constrained to limit (in line with Atlantean 238
customs) the total effort per rectangle. Optimizations were made under the two extreme hypotheses of 239
fishers’ behaviour. Under the first hypothesis all fishers are compliant while under the second hypothesis 240
all fishers are non-compliant. The simulations were subject to the following rules. 241
Under the compliance hypothesis all fish (unwanted and small and large commercial sized fish) are 242
landed and all landed fish count equally towards binding species TAC’s. 243
Under the non-compliance hypothesis, zero value fish and over quota commercial sized fish are 244
discarded if this allows greater profit. This would be possible because there is presently little at sea 245
inspection. However, the same TACs are still binding on landings as under the compliant 246
hypothesis. This is because all landings pass through Atlanto Porto (Atlantis’ only fishing harbour 247
and fish market situated in the South Eastern Bight) where landings are subject to strict monitoring. 248

12
In both cases the fleet, if it wishes, may increase mesh size and change fishing patterns and effort 249
to obtain the most profitable outcome. 250
There is a longstanding industry-backed rule that statistical rectangles are closed after a maximum 251
annual effort of 16665 days fishing (long supported by religious taboo but now also monitored by 252
satellite). 253
In both cases the optimization of effort by rectangle and mesh size leads to estimates of overall profit, 254
overall days fishing, species catch and value by size group and actual levels of discards or landed discard 255
sized fish. Overall profit reflects the value of catch and the immediate costs of applying effort and also 256
indirect costs such as increases in steaming time for more distant grounds. 257
3 Results 258
Summary of the Initial Report of the MareFrame Atlantean Case Study to the ABC (ABC i2018). 259
3.1 Areal Distributions. 260
The report shows the annual fish areal distribution for the mature, immature and juvenile (i.e. below MLS ) 261
fish. The full results are available in the report annex tables. For illustrative purposes Figures 2 to 4 are 262
shown here for the immature size group of each species. Distributions of juvenile, immature and mature 263
distributions are available in ABC i2018 - annex 3. Here these are referred to as unwanted catch and as, 264
small and large commercial fish. Figure 2 shows the relative catch-rate per day of small cod. Note that 265
larger cod (not shown) tend to lie further offshore while smaller unwanted sizes (not shown) are found 266
further inshore. 267
Figure 3 shows the relative catch-rate per day of small haddock. Larger sizes of haddock (not shown) and 268
smaller unwanted sizes (not shown) have very similar distributions to these. 269
5 As associated with the mark of the beast linked to the Great Fire of London in that year.

13
Figure 4 shows the relative catch-rate per day of small saithe. Larger saithe (not shown) tend to lie much 270
deeper while smaller unwanted sizes (not shown) occur very close to the coast. 271
3.2 Model Results. 272
More detailed results from the optimization program are shown in (ABC i2018 - annex 4). Here we show 273
Figures 5 and 6 that indicate relative fishing effort by rectangle for the two hypotheses. Note that there are 274
markedly different distributions for the two hypotheses, and that non-compliance allows more fishing days. 275
Table 1 shows the broad differences between the compliant and non-compliant behaviours. The Table 276
shows that with non-compliance the hours fished, the landings value and the profit are all increased by 277
about one third and discarded catch by 43%. The cost of compliance is thus estimated at about €4.4million, 278
i.e. the profit forgone by complying. The implications are that fishing mortality rate would be about 1/3 279
higher under the non-compliant hypothesis than the compliant hypothesis. Thus if the former is what will 280
actually happen then the EBFM objective of bringing fishing mortality rate on all species down to the Fmsy 281
level would be severely compromised and by extension so would EBFM. 282
4 Discussion and Conclusions 283
4.1 Stakeholder Discussions. 284
On receiving this report the Fisheries Secretary of the ABC convened a meeting with the members of the 285
Atlantis Regional Advisory Council (ARAC) to discuss both the initial report and possible ways forward. The 286
meeting was held under Chatham House rules. 287
The Mareframe Atlantean Case study leader Dr Zope presented the report and stressed that it in no way 288
claimed that Atlantean fishers engaged in non-compliant behaviour, but it simply tried to estimate the size 289
of the potential driver for non-compliant behaviour under the proposed LO. He noted that under the non-290
compliant hypothesis: 291
14
There would be a 35% greater fishing effort and presumably concomitant increases in fishing 292
mortality with non-compliance 293
Capture of unwanted catch/discards might increase particularly for saithe. 294
Profit might be 33% higher. 295
That at €4.4million the wages of sin are substantial! 296
He also noted the overall increase in profit from non-compliance (33%) was less than expected by 297
some NGO commentators in a year where high haddock discards were anticipated. 298
Discussions of the report by members of the ARAC were later described as frank and comradely6! The main 299
points were: 300
There were various accusations by various fleet sectors about other fleet sectors’ lack of 301
compliance in the past! This was echoed by the NGO delegates attending, but then denied by all 302
fleet sectors! 303
With respect to the report many ARAC members were suspicious of areal distributions of catch rate 304
based upon research vessel data, which did not reflect real fish catch rates by real fishers. 305
In particular, changing seasonal distributions of smaller sizes was considered likely to be important. 306
Local fishermen who know their fishing grounds very well were particularly vocal on this point 307
These fishermen argued that catch composition varies greatly on a very fine scale in space and 308
time, if you know what you are doing you could thus avoid discarding. 309
All the fishermen pointed out they had been shown to be right about such issues in the past. 310
Various opinions of the scale of the economic advantage of non-compliance were expressed but 311
most were not wildly dissimilar to those estimated by the model. 312
NGOs noted that the non-compliant effort distributions tended to concentrate in areas with 313
sensitive habitats. 314
6 Some members subsequently received PTS counselling

15
Stakeholders expressed concerns regarding the reliability of the model outcomes and the 315
associated uncertainties. 316
Dr Zope accepted the more serious criticisms of the report while pointing out that it represented an 317
estimate the worst case scenario for the cost of compliance that was designed as a “straw man” to initiate 318
the discussion. 319
From his own experience on chartered fishing vessels he had always been in awe of fishers’ ability to catch 320
clean catches when they “chose to”. The important question would be to find ways to encourage them to 321
choose to be compliant with the Landings Obligation. He note that the analysis was designed to provide a 322
worst case scenario for discussion. The non-compliant case of course was based upon the historical 323
behaviour of the fishery and reflected how fishers had chosen to fish in the past. This presumably was the 324
pattern of fishing that was most profitable to them. Discard data confirmed and fishermen themselves 325
acknowledged that extensive discarding had occurred in the past and would presumably still occur in the 326
future if fishers maintained past (short term profitable) patterns of fishing. Thus he said the question 327
should be –“are there patterns of fishing, which based upon the undoubted skills of fishers, would allow 328
compliant fishing to be undertaken in a fashion, which caused less profit to be foregone that that seen in 329
the non-compliant scenario presented?” 330
Dr Zope stated he would be very willing to improve the input to the model using industry knowledge of fish 331
distributions if these could be provided. He said this would be helpful since RV Randomia was only able to 332
make one Autumn Ground-Fish survey each year and he accepted that its’ young fish catches would not 333
describe annual distributions accurately. Far more importantly such a collaborative study should also help 334
identify behaviours that should be encouraged both by the Government of Atlantis and the fishers 335
themselves in order to decrease discarding, to improve the long term state of the fishery by working “with 336
the grain” of the fishery and by reducing the costs of compliance as far as possible. 337
338

16
The Fisheries Secretary of the ABC thanked Dr Zope for his initial “thought provoking” report and for the 339
offer to improve it using industry knowledge. He proposed a small joint working group formed of Dr Zope 340
and experienced members of ARAC to foster trust and increase transparency. This group would explored 341
the fishers knowledge that could improving both the details of the model and more importantly help come 342
up with proposals for action in the traditional spirit of cooperative fisheries management native to Atlantis. 343
He asked them to provide an interim report for the next meeting in two months’ time. He noted that 344
despite caveats about the inputs there seemed broad agreement about the scale of the economic 345
advantage of non-compliance, at round about 33% extra profit, and that this might constitute a serious 346
temptation to non-compliant behaviour to some. He was concerned to help fishers to resist temptation7 in 347
the interests of the long-term sustainability of the resource. He asked for suggestions of ways to curb non-348
compliant behaviour while noting that an increased offshore inspection regime would be expensive and 349
probably ineffective. The ensuing discussion produced (inter alia) the following useful suggestions: 350
Introduce a targeted inspection of inshore waters. 351
Encourage industry reporting of areas of high undersized catch. 352
Instigate industry led temporary closures in areas of high discarding. 353
Further encourage a social inclusion policy in decision making (this might serve to encourage 354
compliance with the LO). 355
Involve women more as at sea observers (perhaps under the aegis of the High Priestess). 356
Find ways to compensate the landing of undersized fish with a general levy. 357
Improve heavy fines for discarding. 358
Empower fishery participants and increase regulation legitimacy by creating ownership and 359
acceptance through co-creation processes (to increase rule uptake). 360
7 Noting that some like Oscar Wilde could ”Resist anything except temptation”

17
Identify possible other factors leading to non-compliant behaviour and ways to mitigate them 361
through interdisciplinary (i.e. involving natural and social sciences) and trans-disciplinary efforts 362
(i.e. involving academic and non-academic participants). 363
Foster the use of decision support frameworks that can highlight alternatives and consequences to 364
stakeholders. 365
Build trust through transparency and openness during scientific/planning/decision-making 366
processes. 367
The Fisheries Secretary thanked the meeting for their suggestions. He noted it was important to reach an 368
early solution to avoid non-compliant behaviour becoming widespread, socially acceptable and entrenched. 369
This is important because non-compliance could increase fishing mortality on these species by 35%, 370
discards would increase by 43% and bottom disturbance would increase on some vulnerable grounds. He 371
advised that he would return next month to discuss practical measures with the ARAC. He stressed that 372
Atlantean traditions lead him to prefer measures that worked “with the grain” of the fishing industry rather 373
than to adopt a command and control approach. 374
4.2 Back to reality 375
To conclude: While the Atlantis case study is fabulous8, it suggests that estimating the cost of compliance 376
(the profit forgone by complying) with any proposed measure would be a useful statistic for any fishery. In 377
regard to non-compliance with the Landing Obligation it should be noted that non-compliance would 378
increase fishing mortality rate on all sizes of fish but particularly undersized fish. The increased fishing 379
mortality rate would mean that EBFM targets such as achieving Fmsy would be compromised. Increases in 380
discards would be a point of concern for any implementation of EBFM. Discarding is directly related to 381
EBFM as it can affect the functioning of ecosystems and reduce long term fisheries profits(Bellido et al., 382
2011). Moreover, under a Landings Obligation where discarding is illegal it would become far more difficult 383
8Fabulous should of course be understood here as mythical, from the word fable.

18
to monitor discarding accurately and thus it might go largely undetected. 384
Estimating the difference in potential profit between compliant and non-compliant behaviours appears a 385
good place to start in compliance studies in order to get a first impression of the pressure on fishers to 386
evade regulation. At least the initial modelling stages used in Atlantis seem a feasible approach for non-387
fabulous fisheries. This is demonstrated in Figure 7, showing estimates of potential plaice discard 388
proportions estimated for small mesh beam trawl (BT2) fisheries in the North Sea. These were kindly 389
calculated by Dr Zope pers. comm. following the same procedure used for Atlantean Waters fisheries. 390
Clearly, effective ways to discourage non-compliance are needed since it seems likely that non-compliance 391
would weaken all forms of fisheries management including EBFM. Hence effective measures to reduce or 392
eliminate non-compliance with a Landings Obligation must be an urgent requirement particularly when 393
there is a strong profit motivation in favour of non-compliance with this measure. At sea inspection is costly 394
and may have insufficient deterrent value to eliminate non-compliant behaviour unless it is coupled with 395
punitive fines or confiscation of fishing rights. Moreover it is likely to alienate fishers. Consequently more 396
successful approaches might be those that use social pressures amongst fishers themselves to discourage 397
discarding and/or which use fishers detailed knowledge in ways that finds less unprofitable solutions to 398
avoiding discarding. 399
Such an approach to the problem would be more in tune with EBFM. EBFM aims to improve conventional 400
decision making frameworks by increasing leverage from stakeholders (Link, 2010). This could be achieved 401
by adding active stakeholder involvement and co-creation in the form of working groups (or other similar 402
events) to the process, which offers room for discussion and the inclusion of Stakeholder perspectives. 403
While such processes build trust, they can also provide insights into possible issues of peer pressure, 404
legitimacy, and transparency. In addition, they offer the opportunity to include trade-offs and concerns 405
relevant to stakeholders, which can make the scientific approach more relevant and also increases the 406
likelihood of its acceptance among the participants (Epstein et al., 2018). To achieve this the Stakeholders 407

19
involved should be diverse and include fishers, managers, and representatives of other relevant sectors and 408
institutions associated with the resource use to ensure a fair co-creation process (Ballesteros et al., 2018). 409
Subsequently, a combined modelling and stakeholder involvement approach could potentially support 410
resource assessments (e.g. by fishers sharing data with scientists to facilitate model interpretation 411
(Ramírez-Monsalve et al., 2016)) and help to develop appropriate management measures and responses to 412
non-compliant behaviour. The Sustainable Fisheries Resource Advisory Council of Canada (SFRACC)9, a 413
national arm’s-length advisory body designed to offer the Minister broad-based advice and 414
recommendations on fisheries issues might form a useful template for such a body. 415
For successful EBFM and long-term sustainability for the resource and resource users, further consideration 416
should be given to the complexity of fishers’ motivations for non-compliance as well as the socio-ecological 417
context in which they interact. The inclusion of social scientists could help provide the necessary approach 418
together with insights to gain a deeper understanding of the drivers and factors influencing fisher 419
behaviour. However, the necessary extent of such an endeavour would depend on the type and context of 420
the fishery (e.g. geographical location, scale of fishery, gear type, etc.) and the extent of the problem (e.g. 421
high/low compliance). Early stakeholder involvement and consultation would help support the framing of 422
the problem and aid the process of delving deeper into the complexities of fisher’s compliance. 423
424
425
9 See https://www.canada.ca/en/fisheries-oceans/news/2018/07/government-of-canada-announces-new-
sustainable-fisheries-resource-advisory-council.html

20
5 Acknowledgement: 426
The research leading to these results has received funding from the European Union’s Seventh Framework 427
Programme Project MareFrame: Co-creating Ecosystem-based Fisheries Management Solutions under 428
Grant Agreement no. 613571 and from the project SAF21 Social science aspects of fisheries for the 21st 429
century, financed by the EU Horizon 2020 Marie Skłodowska-Curie MSC ITN-ETN Programme under Grant 430
Agreement no. 642080. 431
Particular thanks are due to Dr Xoh Zope of the Instituto Atlanterro Maritimo (IAM) for making the 432
Atlantean Case Study Report available and for providing the calculations for Figure 7. 433
In addition, the authors wish to thank three anonymous reviewers for improving earlier version of this 434
paper. 435
6 References 436
6.1 Real References 437
Ballesteros, M., Chapela, R., Raakjaer, J., Ramirez-Monsalve, P., Hegland, T.J., Degnbol,P., Nielsen, K., 438
Rahikainen, M., Baudron, A., Bartolino, V., Colloca, F., Ruiz, J.,Rincón, M.M., Pope, J., Agnarsson, S., 439
Elvarson, B. Stefansson, G., 2018. Who Joins the Table? A Critical Overview of the Co-Creation Approach for 440
the Implementation of an Ecosystem-based Fisheries Management Approach. J. Fish. Res VSI: Advancing 441
EBFM. 442
Bellido, J.M., Santos, M.B., Pennino, M.G., Valeiras, X., Pierce, G.J., 2011. Fishery discards and bycatch: 443
solutions for an ecosystem approach to fisheries management? Hydrobiologia 670, 317–333. 444
doi:10.1007/s10750-011-0721-5 445
Epstein, G., Andrews, E., Armitage, D., Foley, P., Pittman, J., Brushett, R., 2018. Human dimensions of 446
ecosystem-based management: Lessons in managing trade-offs from the Northern Shrimp Fishery in 447
21
Northern Peninsula, Newfoundland. Mar. Policy 97, 10–17. doi:10.1016/j.marpol.2018.08.018 448
Gordon, H.S., 1954. The Economic Theory of a Common-Property Resource: The Fishery. J. Polit. Econ. 62, 449
124–142. doi:10.1086/257497 450
Hardin, G., 1968. The Tragedy of the Commons. Science (80-. ). 162, 1243–1248. 451
doi:10.1126/science.162.3859.1243 452
Hønneland, G., 1999. A model of compliance in fisheries: Theoretical foundations and practical application. 453
Ocean Coast. Manag. 42, 699–716. doi:10.1016/S0964-5691(99)00041-1 454
Jagers, S.C., Berlin, D., Jentoft, S., 2012. Why comply? Attitudes towards harvest regulations among 455
Swedish fishers. Mar. Policy 36, 969–976. doi:10.1016/j.marpol.2012.02.004 456
Link, J., 2010. Ecosystem-Based Fisheries Management. Cambridge University Press, Cambridge. 457
doi:10.1017/CBO9780511667091 458
Mortensen, L.O., Ulrich, C., Hansen, J., Hald, R., 2018. Identifying choke species challenges for an individual 459
demersal trawler in the North Sea, lessons from conversations and data analysis. Mar. Policy 87, 1–11. 460
doi:10.1016/j.marpol.2017.09.031 461
Ostrom, E., 1998. A Behavioral Approach to the Rational Choice Theory of Collective Action: Presidential 462
Address, American Political Science Association, 1997. Am. Polit. Sci. Rev. 92, 1–22. 463
doi:10.2307/2585925 464
Raakjær Nielsen, J., 2003. An analytical framework for studying: compliance and legitimacy in fisheries 465
management. Mar. Policy 27, 425–432. doi:10.1016/S0308-597X(03)00022-8 466
Ramírez-Monsalve, P., Raakjær, J., Nielsen, K.N., Santiago, J.L., Ballesteros, M., Laksá, U., Degnbol, P., 2016. 467
Ecosystem Approach to Fisheries Management (EAFM) in the EU - Current science-policy-society 468
interfaces and emerging requirements. Mar. Policy 66, 83–92. doi:10.1016/j.marpol.2015.12.030 469
22
Simons, S.L., Döring, R., Temming, A., 2015. Modelling fishers’ response to discard prevention strategies: 470
The case of the North Sea saithe fishery. ICES J. Mar. Sci. 72, 1530–1544. doi:10.1093/icesjms/fsu229 471
Sutinen, J.G., Kuperan, K., 1999. A socio-economic theory of regulatory compliance. Int. J. Soc. Econ. 26, 472
174–193. doi:10.1108/03068299910229569 473
6.2 iReferences 474
475
ABC. i2018. ABC internal report 2018 no 6. pp62, ABC publications. Astartia. 476
Heessen, H.J.L., Daan, N. and Ellis, J.R. i2015. Fish Atlas of the Celtic Sea, North Sea and Baltic Sea with an 477
Annex on Atlantean Waters. Based upon International research-vessel surveys. i2015. Wageningen 478
Academic Publishers. 725pp. 479
ICES DATRAS Data base. i2018. http://ices.dk/marine-data/data-portals/Pages/DATRAS.aspx 480
STECF i2017. https://stecf.jrc.ec.europa.eu/dd/effort/graphs-annex 481
Zope, X. i2016. Calculating areal distribution of unwanted catch of cod, haddock and saithe in Atlantos 482
Waters. Proc Atlat. Acad. Sci. Vol. 45. P134-146. 483
484
485
486
23
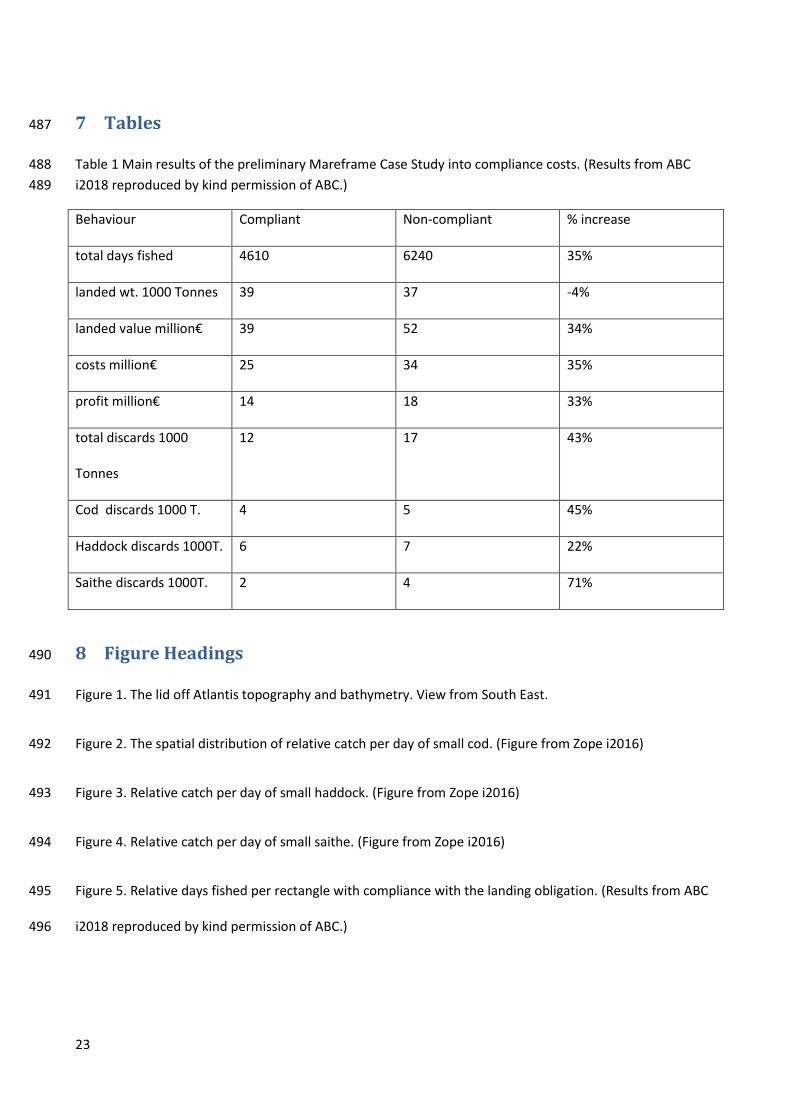
7 Tables 487
Table 1 Main results of the preliminary Mareframe Case Study into compliance costs. (Results from ABC 488
i2018 reproduced by kind permission of ABC.) 489
Behaviour Compliant Non-compliant % increase
total days fished 4610 6240 35%
landed wt. 1000 Tonnes 39 37 -4%
landed value million€ 39 52 34%
costs million€ 25 34 35%
profit million€ 14 18 33%
total discards 1000
Tonnes
12 17 43%
Cod discards 1000 T. 4 5 45%
Haddock discards 1000T. 6 7 22%
Saithe discards 1000T. 2 4 71%
8 Figure Headings 490
Figure 1. The lid off Atlantis topography and bathymetry. View from South East. 491
Figure 2. The spatial distribution of relative catch per day of small cod. (Figure from Zope i2016) 492
Figure 3. Relative catch per day of small haddock. (Figure from Zope i2016) 493
Figure 4. Relative catch per day of small saithe. (Figure from Zope i2016) 494
Figure 5. Relative days fished per rectangle with compliance with the landing obligation. (Results from ABC 495
i2018 reproduced by kind permission of ABC.) 496

24
Figure 6. Relative days fished per rectangle with non-compliance with the landing obligation. (Results from 497
ABC i2018 reproduced by kind permission of ABC.) 498
Figure 7. Estimates of potential plaice discard proportions estimated for small mesh beam trawl fisheries in 499
the North Sea. Kindly calculated by Dr Zope pers comm. following the same the procedure used for Atlantis 500
fisheries. 501
502
503

Figures for A Fabulous attempt to link the cost of Compliance to EBFM.
Figures 1-7

Figure 1 The Lid off Atlantis: Topology and Bathymetry.

Figure 2

Figure 3
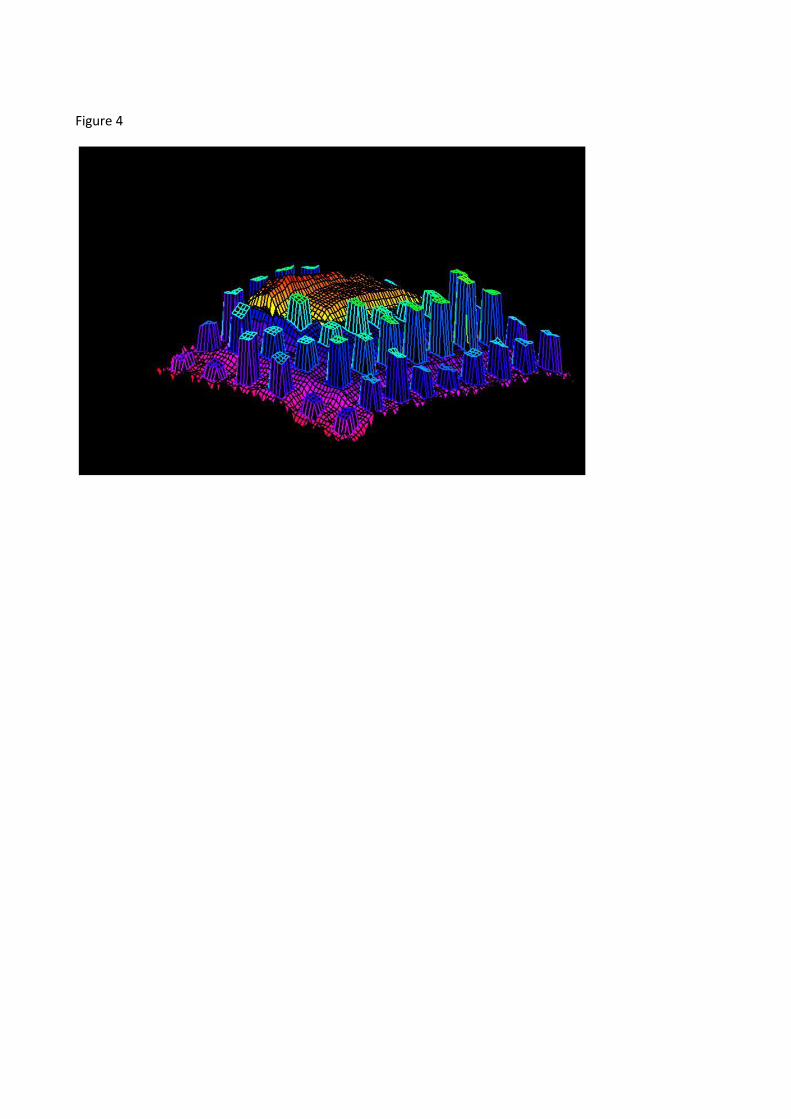
Figure 4

Figure 5

Figure 6

Figure 7