
Solutions for control of nitrogen discharges at mines and ... · Keywords: mines, quarries,...
117
• V I S I O N S • S C I E N C E • T E C H N O L O G Y • R E S E A R C H H I G H L I G H T S 225 Solutions for control of nitrogen discharges at mines and quarries Miniman project final report
Transcript of Solutions for control of nitrogen discharges at mines and ... · Keywords: mines, quarries,...

Solutions for control of nitrogen discharges at mines and quarries Miniman project final report
ISBN 978-951-38-8319-5 (URL: http://www.vttresearch.com/impact/publications) ISSN-L 2242-1211 ISSN 2242-122X (Online)
VT
T T
EC
HN
OL
OG
Y 2
25
So
lutio
ns fo
r co
ntro
l of n
itrog
en
...
•VISIONS•S
CIE
NC
E•T
ECHNOLOGY•R
ES
EA
RC
HHIGHLIGHTS
225
Solutions for control of nitrogen discharges at mines and quarries Miniman project final report

VTT TECHNOLOGY 225
Solutions for control of nitrogen discharges at mines and quarries Miniman project final report
Johannes Jermakka, Elina Merta, Ulla-Maija Mroueh, Helena Arkkola, Sini Eskonniemi, Laura Wendling, Jutta Laine-Ylijoki, Elina Sohlberg, Hanna Heinonen & Tommi Kaartinen
VTT Technical Research Centre of Finland Ltd
Jaakko Puhakka, Minna Peltola, Stefano Papirio, Aino-Maija Lakaniemi, Gang Zou, Anna Ylinen & Francesco di Capua
Tampere University of Technology
Raisa Neitola, Henrik Gustafsson, Tero Korhonen, Teemu Karlsson, Tommi Kauppila, Janita Laakso & Pekka Mörsky
Geological Survey of Finland

ISBN 978-951-38-8319-5 (URL: http://www.vttresearch.com/impact/publications)
VTT Technology 225
ISSN-L 2242-1211 ISSN 2242-122X (Online)
Copyright © VTT 2015
JULKAISIJA – UTGIVARE – PUBLISHER
Teknologian tutkimuskeskus VTT Oy PL 1000 (Tekniikantie 4 A, Espoo) 02044 VTT Puh. 020 722 111, faksi 020 722 7001
Teknologiska forskningscentralen VTT Ab PB 1000 (Teknikvägen 4 A, Esbo) FI-02044 VTT Tfn +358 20 722 111, telefax +358 20 722 7001
VTT Technical Research Centre of Finland Ltd P.O. Box 1000 (Tekniikantie 4 A, Espoo) FI-02044 VTT, Finland Tel. +358 20 722 111, fax +358 20 722 7001
Cover image: Teemu Karlsson, GTK

3
Abstract
Solutions for control of nitrogen discharges at mines andquarriesMiniman project final report
Authors: Johannes Jermakka, Elina Merta, Ulla-Maija Mroueh, Helena Arkkola, SiniEskonniemi, Laura Wendling, Jutta Laine-Ylijoki, Elina Sohlberg, Hanna Heinonen,Tommi Kaartinen (VTT); Jaakko Puhakka, Minna Peltola, Stefano Papirio, Aino-Maija Lakaniemi, Gang Zou, Anna Ylinen, Francesco di Capua (TUT); Raisa Neitola,Henrik Gustafsson, Tero Korhonen, Teemu Karlsson, Tommi Kauppila, Janita Laak-so, Pekka Mörsky (GTK)Keywords: mines, quarries, explosives, nitrate, ammonium, water treatment tech-nologies
The growth of Finnish extractive industry increases the need to study and monitordifferent environmental impacts and to integrate the environmental issues moretightly into the overall framework of the activities. Nitrogen released from explosivesor from mining processes and ending up in the water system can have negativeenvironmental effects. The MINIMAN project, financed by the Tekes Green MiningProgramme and the industry aimed at comprehensive understanding on the nitrogenissue in the extractive industry. The project collected essential data on nitrogencompounds present in the environments of mines and quarries, and developedtechnologies for the treatment of nitrogen containing mine water.
Based on a technology review, selective sorption, electrochemically assistedmembrane separation and biological treatment were selected to be studied anddeveloped in the project. Denitrification and nitrification studies on synthetic minewastewater in laboratory scale revealed that denitrification was possible at low pH(2.5) and temperatures as low as 7°C. Nitrification was more pH sensitive. Bothprocesses tolerated metals (Fe, Ni, Co and As). In the adsorption tests with zeolite,complete ammonium removal from real mine wastewater was achieved with a hy-draulic retention time of 2 minutes, with complete regeneration. In addition, a novelelectropervaporative nitrogen capture technology was developed. Further largerscale testing and development of all technologies is required to ensure their feasibil-ity in a real mining site.
A follow-up period in lysimeters showed that the explosives originated nitrogencontent of left over stones from natural stone quarrying is relatively low and ca. halfof the nitrogen is leached within the first weeks after detonation. The main sourcesof nitrogen are process and dewatering waters, irrespective of the scale of extractiveactivity. The total potential nitrogen load to the environment depends on the scaleand type of the activity as well as the type of explosives used. In addition to factorsrelated to the activity itself, the overall nitrogen management should take into ac-count the background concentrations and sensitivity of the local ecosystem.

4
Tiivistelmä
Kaivannaistoiminnan typpipäästöjen hallintaMiniman-hankkeen loppuraportti
Tekijät: Johannes Jermakka, Elina Merta, Ulla-Maija Mroueh, Helena Arkkola, SiniEskonniemi, Laura Wendling, Jutta Laine-Ylijoki, Elina Sohlberg, Hanna Heinonen,Tommi Kaartinen (VTT); Jaakko Puhakka, Minna Peltola, Stefano Papirio, Aino-Maija Lakaniemi, Gang Zou, Anna Ylinen, Francesco di Capua (TUT); Raisa Neitola,Henrik Gustafsson, Tero Korhonen, Teemu Karlsson, Tommi Kauppila, Janita Laak-so, Pekka Mörsky (GTK)Asiasanat: kaivokset, louhimot, räjähdysaine, nitraatti, ammonium, vesienkäsittely-teknologiat
Suomen kaivannaisteollisuuden kasvu lisää tarvetta tutkia ja seurata erilaisia ympä-ristövaikutuksia sekä tiedostaa ympäristöasiat yhä paremmin osana toimintaa. Rä-jähdysaineista tai kaivosprosessista ympäristöön vapautuvalla typellä voi olla nega-tiivisia ympäristövaikutuksia. Tekesin Green Mining -ohjelman ja teollisuuden rahoit-tamassa MINIMAN-projektissa pyrittiin luomaan kattava näkemys kaivannaistoimin-nan typpikysymyksestä. Projektissa kerättiin tietoa kaivosten ja louhimojen ympäris-töissä esiintyvistä typpiyhdisteistä ja kehitettiin teknologioita typpipitoisten vesienkäsittelyyn.
Teknologiaselvityksen perusteella projektin teknologiakehityksen kohteiksi valittiinselektiivinen sorptio, elektrokemiallisesti avustettu membraanierotus sekä biologinenkäsittely. Denitrifikaatio- ja nitrifikaatiokokeet synteettisellä kaivosjätevedellä labora-toriomittakaavassa osoittivat, että denitrifikaatio oli mahdollista matalassa pH:ssa(2,5) ja lämpötilassa (7 °C). Nitrifikaatio oli herkempi pH:n vaihteluille. Molemmatprosessit sietivät metalleja (Fe, Ni, Co and As). Adsorptiokokeissa zeoliitin havaittiinpoistavan tehokkaasti ammoniumtyppeä 2 min hydraulisella viipymällä, ja materiaalisaatiin regeneroitua täydellisesti. Projektissa kehitettiin lisäksi uudenlainen elektro-pervaporatiivinen menetelmä typen talteen ottamiseksi. Suuremman mittakaavantestausta ja kehitystyötä tarvitaan, jotta voidaan varmistua teknologioiden soveltu-vuudesta kaivosympäristöön.
Lysimetrikokeiden perusteella luonnonkivilouhimon sivukivien räjähdysaineistaperäisin olevan typen pitoisuus on melko matala, ja noin puolet typestä huuhtoutuuräjäytyksen jälkeen jo muutamassa viikossa. Riippumatta kaivannaistoiminnan mit-takaavasta prosessi- ja kuivatusvedet ovat pääasiallisia typen lähteitä. Ympäristöönkohdistuvan kokonaistyppikuorman suuruus riippuu toiminnan mittakaavasta ja luon-teesta sekä myös käytettävien räjähdysaineiden ominaisuuksista. Itse kaivostoimin-taan liittyvien tekijöiden lisäksi typen hallinnassa tulisi ottaa huomioon ympäristöntaustapitoisuudet sekä paikallisen ekosysteemin herkkyys.

5
PrefaceThis publication presents an overview and conclusions of the project “Solutions forControl of Nitrogen Discharges at Mines and Quarries” (MINIMAN), aiming at aholistic understanding and technology development regarding nitrogen compoundsin mining waters.
The MINIMAN-project was co-funded by Tekes – the Finnish Funding Agency forInnovation, Ekokem-Palvelu Oy, Kemira Oyj, Outotec Finland Oyj, Yara Suomi Oy,Agnico-Eagle Finland Oy, FQM Kevitsa Mining Oy, Outokumpu Chrome Oy, NordicMines Oy, Nordkalk Oy Ab, Kiviteollisuusliitto ry / The Finnish Natural Stone Associ-ation, BK-Automation Ky, Infra ry, VTT Technical Research Centre of Finland Ltd(VTT), GTK Geological Survey of Finland (GTK) and Tampere University of Tech-nology (TUT).
The steering group consisted of the following persons: Mika Martikainen, KemiraOyj, chairman (until 15.3.2013), Juha Saari, Kemira Oy, Chairman (15.3.2013–2.10.2013); Anita Alajoutsijärvi, Agnico-Eagle Finland Oy, vice-chair (until2.10.2013); Chairman (from 2.10.2013); Jussi Ruotsalainen, Kemira Oyj (from2.10.2013); Anita Salo, BK-Automation Ky; Jan Österbacka, Ekokem-Palvelu Oy;Eija Ehrukainen, Infra ry; Ulla Syrjälä, Kevitsa Mining Oy; Olavi Selonen, Kivite-ollisuusliitto ry; Juha Koskela, Nordic Mines Oy (until 3.10.2012), Riina Mäkelä Nor-dic Mines Oy (from 15.3.2013); Tua Welin, Nordkalk Oy Ab; Samuli Nikula, Ou-tokumpu Chrome Oy; Antti Salokannel, Outotec Finland Oy; Jouni Torssonen, YaraSuomi Oy; Kari Keskinen, TEKES; Harry Sandström, Spinverse Oy; Juhani Itkonen,Pohjois-Suomen AVI; Eva Häkkä-Rönnholm, VTT (until 3.10.2012), Olli Salmi, VTT(from 3.10.2012); Pekka Mörsky, GTK and Jaakko Puhakka, TUT.
The project work was conducted at three research institutions. At VTT the re-search was supervised by Principal Scientist Ulla-Maija Mroueh and the workinggroup included Research Scientist Johannes Jermakka, Research Scientist HannaHeinonen, Senior Scientist Jutta Laine-Ylijoki, Research Scientist Elina Merta, Re-search Scientist Helena Arkkola, Senior Research Technician Sini Eskonniemi,Research Scientist Elina Sohlberg, Senior Scientist Minna Vikman, and Senior Sci-entist Laura Wendling. At Tampere University of Technology the research was su-pervised by Professor Jaakko Puhakka and the working group included Postdoctoralresearcher Minna Peltola, Postdoctoral researcher Stefano Papirio, Postdoctoralresearcher Aino-Maija Lakaniemi, PhD candidate Gang Zou, M.Sc. student Anna

6
Ylinen and M.Sc. student Francesco di Capua. At GTK Geological Survey of Finlandthe research was supervised by Senior Scientist Pekka Mörsky and the workinggroup included Senior Scientist Raisa Neitola, Research Scientist Henrik Gustafssonand Research Scientist Tero Korhonen, Geologist Teemu Karlsson, Chief ScientistTommi Kauppila and Research Scientist Janita Laakso.

7
Contents1. Introduction .................................................................................................... 9
1.1 Project background ................................................................................... 91.1.1 Overview of different sectors within extractive industry .................. 10
1.2 Project targets ........................................................................................ 111.3 Project realization ................................................................................... 11
1.3.1 Project partners and their responsibilities ...................................... 111.3.2 Dissemination and networking ...................................................... 11
2. Nitrogen sources and behaviour in mining ................................................. 13
2.1 Nitrogen released in mining ..................................................................... 142.2 Nitrogen in mining in comparison with other nitrogen flows ....................... 16
3. Technologies for nitrogen removal and recovery from mine wastewaters . 18
3.1 Biological methods.................................................................................. 183.2 Physico-chemical methods ...................................................................... 193.3 Technologies selected for further study ................................................... 21
4. Results of water treatment studies .............................................................. 23
4.1 Biological treatment ................................................................................ 234.1.1 Denitrifying applications ............................................................... 24
4.1.1.1 Batch bioassays ............................................................ 244.1.1.2 Fluidized-bed reactors ................................................... 284.1.1.3 Microbial community analysis ......................................... 37
4.1.2 Nitrifying applications ................................................................... 384.1.2.1 FBR .............................................................................. 384.1.2.2 Arsenic effects on nitrification ......................................... 414.1.2.3 DGGE profiles ............................................................... 42
4.1.3 Conclusions ................................................................................. 444.2 Adsorption experiments for nitrate and ammonium................................... 44
4.2.1 Introduction .................................................................................. 444.2.2 Batch mode adsorption tests ........................................................ 45
4.2.2.1 Materials and methods................................................... 454.2.2.2 Results .......................................................................... 464.2.2.3 Conclusions .................................................................. 49

8
4.2.3 Continuous mode adsorption tests for nitrate and ammonium ........ 494.2.3.1 Materials and methods................................................... 494.2.3.2 Results .......................................................................... 544.2.3.3 Discussion..................................................................... 564.2.3.4 Conclusions and further research ................................... 58
4.3 Adsorption and regeneration experiments for ammonium with zeolite ....... 594.3.1 Introduction .................................................................................. 594.3.2 Materials and methods ................................................................. 59
4.3.2.1 Materials ....................................................................... 594.3.2.2 Analyses ....................................................................... 604.3.2.3 Experimental setup ........................................................ 604.3.2.4 Regeneration of zeolite columns .................................... 624.3.2.5 Experimental setup for larger scale column test .............. 62
4.3.3 Results ........................................................................................ 634.3.3.1 Rapid wastewater filtration ............................................. 634.3.3.2 Slow wastewater filtration............................................... 654.3.3.3 Larger scale column test ................................................ 67
4.3.4 Discussion ................................................................................... 684.3.5 Conclusions and further research ................................................. 69
4.4 Electrochemical treatment ....................................................................... 694.4.1 Materials and methods ................................................................. 694.4.2 Results ........................................................................................ 704.4.3 Conclusions ................................................................................. 71
5. Behaviour and release of N from natural stone quarrying left over stone .. 72
5.1 Materials and methods ............................................................................ 735.1.1 Field measurements and sampling ............................................... 765.1.2 Laboratory measurements ............................................................ 76
5.2 Results ................................................................................................... 765.3 Discussion .............................................................................................. 805.4 Laboratory scale studies ......................................................................... 815.5 Conclusion ............................................................................................. 82
6. Nitrogen balances at case study areas ........................................................ 83
6.1 Varpaisjärvi natural stone quarry ............................................................. 836.2 Kemi mine .............................................................................................. 896.3 Conclusions ............................................................................................ 94
7. Conclusions ................................................................................................. 96
7.1 Nitrogen management procedure ............................................................ 977.2 Nitrogen removal technologies .............................................................. 1007.3 Nitrogen balances and flushing ............................................................. 102
Appendix A: List of publications ..................................................................... 111

9
1. Introduction
In early 2010s, the Finnish mining industry was in a period of rapid growth. Theincreased extraction of mineral resources places added pressure on the environ-mental issues. Explosive usage has been shown to release significant concentra-tions of nitrogenous compounds to the environment. In addition, certain mineralprocessing activities can generate significant nitrogenous contamination. Thetightening environmental permit requirements for nitrogen compounds in minewaters increase the need for water treatment. In addition, high nitrogen content inwaste rock may affect its classification and thus its further utilization.
The MINIMAN project sought to gather essential data on nitrogenous com-pounds present in the environments of mines and quarries, and to develop treat-ment technologies to allow the Finnish extractive industry to increase the use ofexplosives in a sustainable manner. Furthermore, by collecting and creating newknowledge the project aimed at a more holistic view on the nitrogen issue in min-ing and other extractive industries.
1.1 Project background
The excessive release of nutrients from municipalities and industrial activities tothe environment can cause eutrophication in the receiving waterways. Nitrate ionis the primary source of nitrogen for aquatic plants, thus inducing eutrophicationbut elevated levels may also be toxic to aquatic animals.
The spreading of nitrogenous compounds into water and their incorporation intomineral materials is a common challenge in the extractive industries. Most miner-als and rocks contain relatively low concentrations of nitrogenous compounds.However, typical explosives and leaching processes, especially cyanide leaching,used in mining activities can release a range of nitrogen-containing compounds ofenvironmental concern. The rate of explosive-originated nitrogen discharges de-pends e.g. on the hydrological conditions present at the site. In the Nordic condi-tions, the seasonal variations in precipitation and temperature may play a signifi-cant role in the nitrogen loading. Different sources report variable percentages (1–6%; 12–28%; Morin and Hutt 2009) for nitrogen that is released from explosives tothe environment. Once in environment, the nitrogen can convert to different spe-

10
cies (nitrate, nitrite, ammonium, nitrogen gas), depending on the redox conditionsand biological activities.
Nitrogen emissions are getting more attention in the environmental permit re-quirements for mines increasing the need for water treatment. The water treatmenttechnologies currently utilized at mines are necessarily not optimized to removenitrogen. Thus, development of water treatment technologies for nitrogen removalis needed. ‘Nitrogen smudging’ (contamination by explosive originated nitrogencompounds) of otherwise mineralogically and chemically inert waste rocks of goodtechnical quality hinders the utilization of these product streams. This is an im-portant economic and environmental issue at several quarries and mines.
1.1.1 Overview of different sectors within extractive industry
The extractive industry covers different sectors utilizing natural mineral resources.The impact assessment report on the Finnish Mineral Cluster (Hernesniemi et al.2011) defines the extractive industry to include mining, aggregate production andnatural stone quarrying.
Mining includes the extraction of metallic ores as well as industrial minerals.Mines produce concentrates to be further processed in relevant industries. Theprocessing of concentrates to metals and industrial mineral products mainly takesplace in Finland. In 2012 metallic ores were extracted at 12 mine sites and indus-trial minerals at ca. 30 sites. The boom of the mining sector relates specifically tothe extraction of metallic ores. The basic legislative framework of mines includesthe Mining act and the Environmental protection act. The Mining act covers alsothe production of industrial stones (soap stone and mineral wool) and extraction ofgem stones. Altogether sites under the Mining act numbered 46 (TEM 2013).(Finland’s Mineral Strategy 2010; Kananoja et al. 2013; Hernesniemi et al. 2011)
Aggregates include natural sand and gravel as well as crushed rock which fulfilcertain quality specifications. These materials can be further processed to differentproducts, e.g. concrete or asphalt. Aggregate production is the largest sector inthe Finnish extractive industry, measured either by revenue, production rate or theamounts of personnel. Typically aggregate production is local activity, and thenumber of enterprises (2011) on the sector exceeds 400. Aggregate production ismainly regulated by the Land extraction act, the Environmental protection act andthe Water act if relevant. (Kananoja et al. 2013; Hernesniemi et al. 2011)
In natural stone quarrying large stone blocks are extracted from the bedrock.The sector further mechanically processes the material into products, such as rawconstruction stones (blocks) or boards. Natural stone products are used in buildingcladdings, indoor decoration (floors, staircases, fireplaces) and in environmentalconstruction projects. Finnish bedrock contains several rock types, e.g. granites,slates and soap stone that are suitable for natural stone quarrying. In natural stonequarrying the amount of left over stone is high due to the high product qualityrequirements. Around 200 companies operate within the Finnish natural stoneindustry. Natural stone quarrying is mainly regulated by the Land extraction actand the Environmental protection act. However, soap stone, limestone and marble

11
quarrying fall in the scope of the Mining act. (Kananoja et al. 2013; Finland’s Min-eral Strategy 2010)
1.2 Project targets
The target of MINIMAN project was to create holistic solutions for nitrogen controlin extraction activities. The project generated new know-how on the behaviour ofN compounds at mines and quarries to facilitate better understanding of the nitro-gen discharge issue. Advanced technologies were developed for the removal ofnitrogen compounds from mine waters with the specific focus on the characteris-tics of mine water.
The subsequent objectives of the project were to help the extractive industry toenhance their operational preconditions and to generate new possibilities for ser-vice and technology businesses.
1.3 Project realization
1.3.1 Project partners and their responsibilities
The project work was realized in cooperation of VTT, GTK and TUT. VTT coordi-nated the project, studied general aspects of nitrogen management and carriedout research tasks related to chemical characterization of materials as well asdevelopment of water treatment technologies utilizing physical-chemical methods.
GTK investigated and compared the sources and balances of explosives-originated nitrogen compounds at mines and quarries of different sizes. Further-more, GTK also focused on the ‘nitrogen smudging’ problem of waste rocks andstudied the intensity, evolution and chemical characteristics of their nitrogen con-tamination and participated in the development of water treatment methods.
TUT was responsible for developing nitrification and denitrification bioprocessesfor treating nitrogen containing waste streams from the extractive industry.
1.3.2 Dissemination and networking
In addition to the final report at hand, the results of the project have been or will bepublished or presented in a number of media. Appendix A gives a detailed list ofpublications.
Several visiting researchers participated in the MINIMAN project work. SeniorScientist Laura Wendling from CSIRO, Australia worked at VTT in 04–10/2012contributing on the planning of experimental sorption studies and on the literaturereview on water technologies. TUT hosted international researchers Stefano Pa-pirio, Francesco di Capua, Zou Gang, Emre Oguz Koroglu and Mehmet Cakmakci,who participated in the nitrification/denitrification studies.

12
Research Scientist Johannes Jermakka from VTT worked as an exchange re-searcher in the University of Queensland in 03–06/2013 concentrating on theelectrochemical removal of nitrogen.
Other international contacts of the project include research collaboration withthe University of Luleå aiming at the exploitation of synergies with the researchprogramme “Smart Mine of the Future” (SMIFU). Meetings in Espoo (05/2012) andin Kiruna (02/2013) were organized to facilitate exchange of experiences andnetworking.

13
2. Nitrogen sources and behaviour in mining
Nitrogen is a common element in the nature, constituting the majority of earth’satmosphere as well as playing a key role in all organic compounds as one of thethree macronutrients. Nitrogen has a complex chemistry with a wide range ofstable oxidation states (-3 to +5) (see Figure 1). It is part of numerous organic andinorganic compounds and reactions.
Nitrate, NO3-, is the natural stable and non-reactive degradation end product of
nitrogen in the environment. It is present in all natural waters in low quantities.Increased concentrations in aquatic systems cause eutrophication, but are notdirectly harmful to organisms. Nitrite, NO2
-, is a harmful unstable precursor tonitrate but is usually present in very minute concentrations.
Ammonia, NH3, is the reduced form of nitrogen in the nature, an importantcomponent of natural nitrogen cycle and the main source of biologically availablenitrogen. Ammonia and its ion form ammonium, NH4
+, have a pH determined equi-librium in aquatic systems with ammonia dominating under high pH. Ammonia isvery toxic to aquatic organisms and thus the levels of ammonia are very low innatural waters.
This section gives a brief overview on nitrogen emissions in mining. For moreinformation, see the MINIMAN literature report “Nitrogen compounds at mines andquarries. Sources, behaviour and removal from mine and quarry waters” (Jermak-ka et al. 2015).

14
Figure 1. Common nitrogen pathways and forms (Jermakka et al. 2014).
2.1 Nitrogen released in mining
Nitrogen is extensively used in mining explosives. Explosives are chemical com-pounds or mixtures which release large quantities of heat and gases when deto-nated. The reaction is initiated mechanically and by heat, typically using an explo-sion starter. (OAMK 2007; Forsberg and Åkerlund 1999)
While several types of explosives are available for mining activities, all containnitrogen in some form. A rule of thumb is that around 25% of the explosive mass iselemental nitrogen. The water resistance of different types varies depending onthe form in which nitrogen is added in the product, and therefore nitrogen is re-leased from them at different rates. However, in a time frame long enough, all Ncontained in explosives is released to the environment in some form. (Forsyth etal. 1995; Halonen 2012)
Today the total consumption of explosives in Finland is around 50 000 t/a, andthe usage has approximately doubled in the past decade. It is evident that theboom of the mining industry has to do with the recent rise. The future usage ofexplosives will also depend on several other factors, such as increased share of

15
underground mining, and growing need of crushed rock in infra and building con-struction. In open pit mining the specific explosives usage (/tonne of rock) issomewhat lower than in underground mining.
The main source for nitrogen emissions in mining are explosive residues due toincomplete detonation and leaching, accounting for approximately 2–10% of thetotal explosive usage. Other sources for nitrogen emissions to waterways andatmosphere can be cyanide used in the ore processing and nitrogen present in thewaste rock or ore itself.
Figure 2. Routes of explosive originated nitrogen to the environment. Photo: OyForcit Ab.
The potential of nitrogen to release into the water system from explosion site de-pend on the type of explosives used, local water conditions, explosives manage-ment and overall efficiency of the blasting operations. (Forsyth et al. 1995) Inpractical blasting projects the majority of blast holes are ignited. It is however quitecommon that a blast hole is only partly detonated, due to e.g. poor design, pres-ence of water, rock fractures etc. (Halonen 2012; Forcit 2010)
The reaction gases released to air after detonation contain nitrogen as NO2.Other reaction products may also occur, such as phthalates, aliphatic hydrocar-bons or benzene. (Brochu 2010) The generation of NOx compounds usually indi-cates the occurrence of improper or incomplete detonation reaction (Rowland et
Explosionfumes to air •Gases: N2, NOx
Spillage tosurface and
groundwater•Ions : NO3
-, NH4+
Mined oreand waste
rock
•Remnants ofexplosives to theextraction facility tailings
•Remnants ofexplosives to thewaste rock area potential leaching
Finalproduct

16
al. 2001). The reasons for fume generation are somewhat similar to those causingdischarges to water.
The main process originated sources of nitrogen in mine waters and wastes in-clude:
cyanide used in gold extraction pH regulating agents (nitric acid HNO3) use of ammonia as lixiviant in copper and nickel hydrometallurgy use of nitric acid in acid washing of activated carbon used in gold recov-
eryIn addition to these, cyanide is also used at mines as a depressant for sphalerite,pyrite and some copper sulphides in flotation processes.
2.2 Nitrogen in mining in comparison with other nitrogenflows
The scale of nitrogen emissions from the extractive industry can be compared toother nitrogen emission sources, e.g. agricultural streams.
In Finland, the total use of explosives in 2010 is estimated at 50 000 t/a (Hal-onen 2012). 94% of explosives used are bulk emulsions, ANFO or emulsion car-tridges with ammonium nitrate as the effective compound present (Halonen 2012).The nitrogen content of ammonium nitrate is 35 mass-% and can be assumed asthe maximum mass of released nitrogen during incomplete detonation (in com-plete detonation, all nitrogen is theoretically transformed into nitrogen gas). Theextent of incomplete detonation has been estimated at a very wide range from 0%to over 40% of explosive loading, depending on the type of operation, skill andexplosives used. In Finland, explosive practices are well controlled and low leach-ing explosives are used. An estimation of 5% incomplete detonation for open pitmines and as high as 20% incomplete detonation for underground operations ispresented, with half of this left completely un-burned (Halonen 2012). This is par-tially released as NOx and N2O compounds in the air, partially as soluble com-pounds in the waterways and partially fixed in the solid waste rock and ore. Asmore than half of explosives used are in open pit rock production or mining, a totalestimation of max. 10% of nitrogen release to the environment from all explosivesused in Finland can be assumed. Taking 10% of 50 000 t of explosives and 35%of nitrogen content gives an estimate of under 2 kt N/a released into environmentin Finland through mining operations. Experimentally, detonation of ANFO re-leased app. 13 g N/kg of ANFO into atmosphere (Martel et al. 2004 in Brochu2010) and if 35 g N/kg is estimated as total maximum release, we can estimatethe gaseous fraction to be app. 40% of the release.
The total reactive nitrogen emissions to water and air in Finland are estimatedin several sources. The total N-emissions to waterways were estimated as 147kt/a in 2002 (Leap et al. 2011) and emissions to atmosphere have been estimatedas 172 kt/a in 2000 (as 25, 130 and 17 kt/a NH3-N, NOx-N and N2O-N, respective-ly) (Leap et al. 2011) and as 77.2 kt/a in 2011 (as 46.7 and 30.5 kt/a as NOx-N and

17
NH3-N, respectively) (Bartnicki 2013). The 2 kt N/a released from mining in Fin-land accounts to approximately 0.6–0.9% of total nitrogen emission to air andwater in Finland, and if 60/40 division between water/air is assumed, it covers for0.8% and 0.5–1% of nitrogen emission into water and air, respectively.
Finnish mines consume an estimate of 500–11000 t of ammonium nitrate peryear and (e.g. 500, 2000, 7000 and 11000 t NH4NO3/a by Pyhäsalmi, Suurikuusik-ko, Kevitsa and Talvivaara, respectively) (PSAVI 2011a, PSAVI 2011b, Pöyry2012, PSY 2004). This corresponds to estimated total nitrogen emissions to airand water of 17.5–385 t N/a, if 10% nitrogen loss is assumed. The average nitro-gen overflow (i.e. the “worst case” amount of leachable nitrogen) of farmland inFinland is estimated at 49 kg N/ha in 2005–2010 (TIKE 2013), and the actualannual nitrogen drainage from agriculture is estimated to be 8–20 kg/ha(Rekolainen 1992). Based on the worst case amounts of nitrogen overflow, a minein Finland can have nitrogen emissions comparable to average emissions from360–7860 ha farmland. A mid-sized mine, using 2000 t of NH4NO3 annually, ifreleasing 10% of applied nitrogen, has the same scale of potential nitrogen re-lease as 1400 ha farmland. In conclusion, a mine can have nitrogen emissionscomparable to very large scale farming units. The environmental effects of suchemissions depend on the receiving waterways and can be significant especially inbarren subarctic environments, typical to Nordic mines.

18
3. Technologies for nitrogen removal andrecovery from mine wastewaters
Nitrogen removal from wastewaters is a common procedure in industrial and mu-nicipal wastewater treatment with a number of full scale and experimental technol-ogies available. However, many of the currently available technologies are notsuitable for the treatment of mine wastewaters containing low levels of nitrogenouscompounds due to treatment costs or operating parameters. Robust, low-costtechnologies with no or low temperature- or pH-dependence are needed for thetreatment of mine wastewaters with a range of physico-chemical characteristics.This section gives a brief overview on the technologies investigated in the MIN-IMAN-project. For more detailed information, see the MINIMAN literature report“Nitrogen compounds at mines and quarries. Sources, behaviour and removalfrom mine and quarry waters” and the related article. (Jermakka et al. 2015,Jermakka et al. 2014)
3.1 Biological methods
Biological methods are widely used in wastewater treatment and potentially offeran effective and inexpensive alternative for the removal of nitrogen from miningwastewaters. A distinct advantage of biological methods utilizing the natural nitro-gen cycle is their minimal impact on the environment. In some applications, use ofbiologically-based wastewater treatment systems such as constructed wetlandscan enhance biological diversity and ecological sustainability.
Biological nitrification and denitrification are commonly performed in municipalwastewater treatment for nitrogen removal. The conventional treatment systemsare not readily suited for mine wastewaters as they are based on an activatedsludge process with high organic carbon substrate input and are sensitive to tem-perature and toxicity changes.
Constructed wetlands can be an effective method for the removal of nitrogenfrom mine wastewaters where sufficient oxygen is available for optimal nitrificationand adequate organic carbon is provided for denitrification reactions to proceed.Alternately, constructed wetlands which substitute autotrophic denitrification, inwhich elemental sulphur is utilized in place of organic carbon, can mitigate the

19
need for external organic carbon addition associated with heterotrophic denitrifica-tion. Limitations to the use of constructed wetland systems include the relativelyhigh land area requirement for the treatment of large volumes of wastewater, andthe temperature dependence of biological processes within wetlands. Tempera-ture limitations are particularly important in cold regions, as wetland processes(e.g. nitrification) require temperatures > 10oC. Constructed wetlands are com-monly used worldwide in mine wastewater treatment but there are limitations intheir applicability in subarctic or arctic conditions.
Nitrification and denitrification can be more efficiently maintained in “controlledengineered systems” such as bioreactors. As a consequence of the increasinginterest in applying these biological processes for mine wastewater and acid minedrainage treatment, many different bioreactor configurations have been designed.Fluidized-bed reactors are surely a promising alternative biofilm process for bio-logical wastewater treatment thanks to their advantages such as: 1) efficient bio-mass retention; 2) higher mass transfers and reaction rates; 3) large surface areafor biofilm formation; 4) enhanced contact between biomass and substrates; 5)great resistance to inhibitors (i.e. heavy metals commonly present in mining efflu-ents).
Anammox is a quite recent process used for nitrogen removal fromwastewaters. It is based on autotrophic granular bacteria that utilize nitrate tooxidize ammonia into nitrogen. The technology potentially offers numerous ad-vantages for wastewater treatment when applied at a large scale due to its lowenergy and no external carbon requirements. Further advantages of the Anammoxprocess include the minimization of surplus sludge production and compatibilitywith high volumetric loading rates, resulting in reduced operational and investmentcosts. Anammox technology can be used in combination with systems which con-centrate NH4
+ to improve biological nitrogen removal in dilute nitrogenouswastewater steams, such as mine effluents. The Anammox method is still fairlynew, has a long start-up time and is sensitive to temperature, pH and toxicity andis thus not suitable for subarctic conditions. Anammox could however becomesuitable for selected mine wastewaters as the technology matures and can beproofed for different streams.
In summary, numerous processes and treatment methods are available for bio-logical nitrogen removal from wastewaters. Based on the particular water charac-teristics and environmental conditions, one process can be preferred to other onesin order to enhance the removal efficiencies.
3.2 Physico-chemical methods
In addition to biological processes, physical-chemical treatment processes havebeen proposed to remove nitrogen from mine waters. The chemical processes areregarded as less sensitive to changes in temperature and effluent quality whichare important assets when dealing with water streams from mines.

20
Air stripping is the most common ammonia removal method in the industry. Thesolution pH is risen to >10, the temperature is increased and the liquid is contact-ed with an air stream to move the ammonia into the gas stream. While broadlyused in small high concentration volumes, it is not feasible for large streams dueto pH and temperature requirements.
Water soluble nitrate and ammonia can be separated by membrane filtration,using nanofiltration or reverse osmosis membranes. Nanofiltration can removeions partially (25–60%) and reverse osmosis almost completely (>96%). Mem-brane filtration is used for the treatment of sulphate and metals containing mineprocess water in Finland but high energy demand, potential fouling problems andneed for pretreatment limit the feasibility of the technology for removal of low con-centrations of nitrogen from mine wastewaters (e.g. Häyrynen et al. 2008).
Electro-oxidation and electro-denitrification are methods of nitrogen removal us-ing an electrochemical cell-reactor. The electro-oxidation of ammonia is a fullscale technology based on indirect oxidation in a high chloride content water,where the chloride ion forms hypochlorite at the anode, oxidizing ammonia directlyinto nitrogen gas. This electro-oxidation can be linked with cathodic electro-denitrification at the anode, reducing nitrate into nitrogen gas and ammonia. Fullscale applications of the method have been developed for industrial use and in-clude trademarks Elonita and AmmEl. Electrochemical oxidation technologies canbe feasible for selected mine wastewater streams with high chloride and ammoniaconcentrations. For bulk mine wastewater, a concentration step is required.
Electrochemistry can be linked with membrane technologies. Electrodialysisremoves cations and anions through ion exchange membranes. A commercialelectrodialysis application is DesEl, that can be used for mining wastewaters, butis potentially not feasible for lean streams. A novel technology developed andtested in the MINIMAN project is an electropervaporative ammonia capture, whichcombines electro-denitrification and local ammonia stripping at the cathode.
Bio-electrochemical systems, including microbial fuel cells and microbial elec-trolysis cells, as well as electro-coagulation methods show potential for futureapplications for nitrogen removal, but both technologies are still in early laboratoryphase and not applicable in short term.
Sorption technologies offer a wide range of methods for ion or particle removalfrom water streams. For nitrogen removal from mine wastewater, a selectivesorbent is required as mine wastewater typically has high ion content and methodstargeting all ions and particles are not feasible. There are a wide variety of sorp-tion materials available, including low cost industrial by-products such as ashes,slags and waste rocks, activated carbon and non-activated carbon-based materi-als, and mineral ion exchange materials, especially zeolite. For mine wastewatertreatment, zeolite is identified as the most promising sorption material as it is anatural mined mineral with a specific affinity for ammonium.

21
3.3 Technologies selected for further study
Based on the technological survey, two physico-chemical technologies were se-lected for laboratory development in MINIMAN project by VTT and GTK: a novelelectropervaporative ammonium capture technology and sorption technologies,focusing on zeolite sorption of real mine wastewater. A compilation of physico-chemical technologies and their suitability is presented in Table 1.
Furthermore, TUT investigated denitrification and nitrification processes of min-ing water with the specific focus on the parameters relevant in real mine environ-ment, such as toxicity effects, temperature and acidity. Fluidized-bed reactors(FBRs) were used as they have been observed being effective in mining watertreatment.

22
Table 1. Summary of selected technologies with demonstrated effectiveness for treatment of water containing nitrogenous compounds.
Technique Advantages DisadvantagesReported removal rate or efficiency Suitability for mine
wastewater treatmentNO3-/NO2
- NH4+ Org. N CN-
Biological N removalmethods
>99% efficiency can be achieved Moderate operational cost
May require biomass waste disposal pH and temperature effects are important Post-treatment may be required
60–99%1 12–97%1 ND NDToxicity and low tempera-ture may limit the applica-
bility
Reduction using zero-valent metals
Moderate operational cost Surface passivation and/or reduced per-meability may limit efficacy/lifespan
pH effects are critical
Fe0: 13->92%Al0: <30–62%Mg0: 83–93%
Low 10–30%Fe0: 50–
71%
Poor due to surface pas-sivation, requirement for
strict pH control
Electrochemicalmethods
No waste disposal is required Temperature effects are not im-portant
High removal efficiency Moderate operational cost
pH effects may influence effectiveness Post-treatment may be required
98%2 > 97%2 90%2 ND Good
Sorption, precipitationand ion exchangemethods
Removal efficiency varies withsorbent and but can be targeted tospecific contaminants
Moderate operational cost
May require disposal of saturated/spentsorbent or waste brine
pH and temperature effects are important Post-treatment may be required
3.5–11 mg/g (HDTMA-zeolite)
60–82 mg/g (Mg/Al LDH)6–10 g/mg (activated C)
6–28 mg/g(zeolite)>70%
ND ND Good
Membranes High quality water Monovalent ion separation
Require maintenance High pressure Pretreatment recommended High operation costs
91–99% > 90% ND 90–95% Poor
Air stripping Relatively cheap technology High pH required ND> 95%
(>pH 10.5)ND ND
Fair in combined technol-ogy
Combined technolo-gies
Can be selected and optimised tosuit a particular wastewater
Research/testing may be required to opti-mize treatment system for individual appli-cations
Variable Variable Variable Variable Good
ND = not determined/no data, 1depends on conditions in reactor/wetland, efficiency good when optimal conditions for microbial processes are achieved, 2depends highly on the electrochemical methodselected

23
4. Results of water treatment studies
4.1 Biological treatment
The use of biological processes has gained increasing interest. Microorganismsare intimately involved in metal and nitrogen biogeochemistry with a variety ofprocesses that can be used in environmental biotechnology applications. Denitrifi-cation and nitrification are the bioprocesses used for nitrate and ammonium re-moval from waters, respectively.
Denitrification uses nitrate as electron acceptor and simple organic compoundsas electron donors (Dahab and Lee 1988; Gayle et al. 1989). Mine waters requireorganic compound supplementation for denitrification (Borden et al. 2012). Amongthe simple electron donors, ethanol has resulted in higher denitrification rates,reaction completeness and microbial growth (Christensson et al. 1994; dos Santoset al. 2004). The denitrification reaction with ethanol is expressed by the followingequation 1:
12 + 5 6 + 10 + 9 + 12 (1)
Nitrogen gas is produced with OH- ions that have the potential of neutralizingacidic pH. Incomplete nitrate reduction results in nitrite accumulation, see equation2:
+ 2 + 2 + (2)
In this case, nitrite still represents nitrogen pollution.Nitrification is carried out by several species of autotrophic microorganisms ca-
pable to oxidize ammonium to nitrate via nitrite. The overall reaction is expressedby the following equation 3:
+ 2 + + 2 (3)
Oxygen is needed in order to maintain the reaction. Moreover, enough alkalinity isrequired in the water to balance the acid produced by nitrification. Nitrate can bereduced to nitrogen gas through biological denitrification as mentioned above.

24
Denitrification and nitrification of mine waters can be affected by acidity andsignificant concentrations of heavy metals such as Fe, Cu, Ni, Co and As. De-pending on metal concentration, heavy metals have different effects on microbialprocesses. They can be either essential as trace nutrients or toxic by alteringenzyme conformation and blocking important functional groups (Gikas 2007; Gilleret al. 2009). Moreover, over long-term exposure, microorganisms may developmetal resistance, tolerating high metal concentrations (Bruins et al. 2000; Gadd2010; Holtan-Hartwig et al. 2002).
In the present work, four fluidized-bed reactors (FBRs) and numerous batch bi-oassays were performed to study denitrification and nitrification. FBRs have beenobserved to be very efficient for mining water treatment due to the great resistanceto inhibitors and the potential of recycling the produced pH-buffered water. Themain goal of this work was to maintain denitrification and nitrification by simulatingreal mining conditions (e.g. low pH’s and high metal concentrations). In particular,the research on denitrification aimed at: 1) delineating the effects of temperature,pH and hydraulic retention time (HRT) on denitrification in two FBRs; 2) evaluatingFBR capacity of treating acidic wastewater; 3) optimizing the ethanol/nitrate ratiofor denitrification; 4) assessing the effects of iron, copper, nickel and cobalt ondenitrifying microorganisms in batch bioassays; 5) evaluating Ni impact over longperiod in the FBRs under acidic and neutral conditions.
Nitrifying cultures were enriched in FBR and then used in batch tests for evalu-ating As effects on nitrification. Arsenic speciation was monitored during nitrifica-tion. For both denitrifying and nitrifying applications, the enriched microbial cul-tures were identified using a polymerase chain reaction – denaturing gradient gelelectrophoresis (PCR-DGGE) approach.
4.1.1 Denitrifying applications
4.1.1.1 Batch bioassays
Batch experiments were performed to assess the effect of acidic pH, iron, copper,nickel and cobalt concentration on the bacterial activity at room temperature(22°C) in serum bottles of 117 mL. The pH of the solution was adjusted to thedesired value using HCl. A stoichiometric ethanol/nitrate ratio (0.42:1 mol/mol andinitial nitrate concentration of 200 mg/L) was used in the experiments aimed atevaluating the effect of the feed pH. Denitrification was monitored by measuringethanol, nitrate, nitrite and pH (Figure 3) from samples taken every 1.5 h intervalfor a total duration of 9 h.

25
Figure 3. Effect of pH on nitrate (A) and ethanol (B) removals, pH (C) and nitrite(D) accumulation in batch assays.
Figure 3 shows that nitrate and ethanol removals and nitrite accumulation weresimilar at initial pH’s of 3.5–4.5 and were inhibited at initial pH of 3. Accounting forthe initial rapid pH increase in the first 3 h, the actual inhibitory pH for denitrifica-tion was 4.8.
The impact of iron, copper, nickel and cobalt on denitrification was studied atdifferent initial metal concentrations at pH 7 (Figure 4, Figure 5). 200 mg/L of ni-trate and 123 mg/L of ethanol (double stoichiometric amount) were added to thebottles. pH was maintained stable by using a phosphate buffer solution. In order toallow metal oxidation and reach a constant dissolved metal concentration, thebottles were stored for 24 h and placed at 7–8°C to avoid any change in ethanoland nitrate concentrations. Afterwards, 10 mL of activated carbon/biofilm wasadded to the bottles and N2 was used to get rid of oxygen in the solutions. Granu-lar activated carbon covered by the denitrifying biofilm was collected from theoperating FBR3 (see Section 4.1.1.2 for further information of the FBR). Samplesfor nitrate, nitrite, ethanol and soluble metals were taken at predetermined timeintervals for a total duration of 24 h.

26
Figure 4. Evolution of nitrate (A,D), soluble Fe and Cu (B,E) and nitrite (C,F,) iniron and copper toxicity tests.
During the preliminary period, 98–99% of iron precipitated at pH 7 resulting in lowand stable dissolved Fe concentrations ranging between 0.4–1.6 mg FeTOT/L. Ironsupplementation stimulated denitrification increasing nitrate removal rate. Thisconfirms the reports present in the literature that demonstrate the enhancement ofdenitrification in the presence of iron (Devlin et al. 2000; Nielsen and Nielsen1998). In the present work, nitrate remained below the detection limit after 4 h inthe bottles. Nitrite accumulated in the solution until 3 h followed by a sharp de-crease after 4 h.
Unlike iron, Cu exhibited a higher toxicity on denitrifiers at all tested Cu concen-trations. Added concentrations of 50, 100, 250 and 500 mg/L resulted all in anaverage dissolved Cu concentration of 0.15 mg/L. Nitrate removal rate was lowerthan in absence of copper, averagely resulting in 50% inhibition in the first 6 h.Denitrification was further inhibited at the highest soluble Cu concentration of 0.7

27
mg/L (1000 mg/L Cu added). After 8 h, nitrate removal only reached 57.2%,whereas nitrate was below the detection limit in 24 h. These results confirm thework of Ochoa-Herrera et al. (2011) that found a half maximum inhibitory concen-tration (IC50) of 0.95 mg/L Cu in biological wastewater treatment systems. Nitriteremained in solution and averagely ranged around 10 mg/L in all the bottles.
Figure 5 shows the fates and effects of nickel and cobalt on denitrification inbatch environments. After the injection of microbial cultures in the bottles, Ni con-centrations decreased from 1.2, 2.2, 5.4, 10.9, 50.0, 100.0 to 0.47, 0.62, 1.53,3.52, 26.4, 75.2 mg/L, respectively, after 7 h. In the same period, Co concentra-tions clearly decreased from 0.5, 5.3, 20.2, 50.7, 86.6 to 0.23, 3.23, 10.49, 13.08,25.90 mg/L, respectively. After 6 h, 90% of nitrate was removed at initial Ni con-centrations lower than 50 mg/L, whereas nitrate removal only reached 35% in thebottle with 100 mg/L of soluble Ni. Nitrite accumulated until 5 h but then it sharplydecreased at 6 h. On the contrary, in Co toxicity tests, soluble Co concentrationsdid not affect denitrification. Previous results reported that Co stimulated bothmicrobial growth and COD removal in activated sludge at Co concentrations rang-ing from 0 to 50 mg/L and that 160 mg/L Co repressed microbial activity complete-ly (Gikas 2007).

28
Figure 5. Nitrate (A,D), Co and Ni (B,E) and nitrite (C,F) profiles in cobalt andnickel toxicity tests.
Ethanol, fed two times in excess to nitrate, was consumed during the first 5 h inFe, Cu, Ni and Co toxicity tests (data not shown).
4.1.1.2 Fluidized-bed reactors
Three laboratory-scale glass FBRs (volume 1.1 L) (Figure 6) were used to enrichand maintain denitrifying bacterial cultures as reported by Papirio et al. (2014a).Reactor 1 (FBR1) was operated at 7–8°C, and FBR2 and FBR3 were operated at22 ± 2°C. FBR1 and FBR2 were used for studying process performance, whileFBR3 was used for biomass enrichment for batch assays. Granular activatedcarbon (volume = 200 mL, particle size = 0.5–1 mm) was used as biomass carrier.The recirculation was adjusted to maintain the carrier fluidization at 25% by using

29
a flow rate of 800 mL/min. FBRs were seeded with 240 mL of activated sludge(2.53 g VSS/L) from municipal wastewater treatment plant in Helsinki, Finland.
After seeding, a medium containing ethanol, nitrate and nutrients (Table 2) wasflushed with nitrogen and fed to the FBRs.
Figure 6. Laboratory-scale fluidized bed reactor operated at 7–8 °C.
Table 2. Composition of the FBR nutrient solution.
Compound Concentration (mg/L)KH2PO4 50
CaCl2·2H2O 20MgCl2·6H2O 150
Na2MoO4·2H2O 0.1MnCl2·4H2O 1.75CoCl2·6H2O 0.05

30
Removal of nitrate from the synthetic medium was investigated during three differ-ent experimental phases in FBR1 and FBR2 operated for 860 days under differentoperational conditions.
In the first experimental period (days 0–415), FBRs were studied with the aim toevaluate the effects of temperature, acidic pH, HRT and ethanol/nitrate ratio ondenitrification and FBR performance. Figure 7 (B–C) shows FBR ethanol andnitrate removals and the pH evolution at 7–8°C and 22°C. Both reactors showedhigh removal efficiencies as effluent nitrate and ethanol mostly remained belowtheir detection limits.

31
Figure 7. The effects of pH and HRT on denitrification in FBRs at 7–8°C (B) and22°C (C).
From day 43 to 126, the FBRs were operated at a 9h HRT and a stoichiometricethanol/nitrate ratio (0.42 mol/mol). This decreased the denitrification efficiencies.

32
The average nitrate concentration in the effluent increased to 69 and 49 mg/L at7–8 and 22°C, respectively, accompanied by nitrite accumulation in both FBRs(Figure 8). Ethanol was completely oxidized although nitrate removal was incom-plete.
Figure 8. Nitrite accumulation if FBR1 (7–8°C) and FBR2 (22°C).
After increasing the feed ethanol/nitrate ratio to 0.83, nitrate was again removed.The present work demonstrated that the ethanol/nitrate ratio is the most criticalparameter to control. The excess of ethanol over nitrate was needed for completedenitrification. When ethanol was fed to the system with an ethanol/nitrate ratio of0.83 (mol/mol), 200 mg/L of nitrate were removed in FBR1 and FBR2 even with afeed pH of 2.5 and a 5.4 h HRT. Ethanol and nitrate remained below the detectionlimits and the production of alkalinity neutralized the acidic feed. The potential ofthe FBR technology for neutralizing acidic pH through biological alkalinity produc-tion and internal recycling was here demonstrated.
Over long-term continuous operation at 7–8 and 22°C, the FBRs performedsimilarly with the exception of days 43–126 when FBR2 responded faster to thefeed and hydraulic condition changes. Temperature was demonstrated not toaffect denitrification. Zaitsev et al. (2008) operated a denitrifying fixed-bed biofilmreactor at 5°C. Contrarily to this work, they reported unstable denitrification (30–70% of nitrate removal) during the first six months, most likely due to slow growthof methylotrophic denitrifying bacteria at 5°C. On the other hand, Martin et al.(2009) reported removal of 200 mg/L of nitrate in contaminated groundwater at atemperature of 6°C by ethanol injection.
During the second experimental period (days 416–567), Ni, a common metal inmining environments, was added twice to the feed solutions of both FBR1 andFBR2, first as NiSO4 6H2O and then as NiCl2 6H2O, in concentration of 5.5 mg/L.

33
The first Ni injection was performed during days 416–460. Samples for Ni2+ analy-sis were taken three times a week. Biofilm coated-activated carbon was sampledonce to measure the amount of Ni entrapped as reported by Zou et al. (2014).Figure 9 shows the nitrate and nitrite profiles in the FBR solutions from day 403 ofoperation.
Figure 9. Nitrate and nitrite in FBR1 (A) and FBR2 (B) in presence of 5.5 mg/L Ni.
Effluent nitrate concentration first increased up to 25 mg/L on day 425 in bothreactors, followed by decrease after 2 weeks. No nitrite accumulated during Ni
34
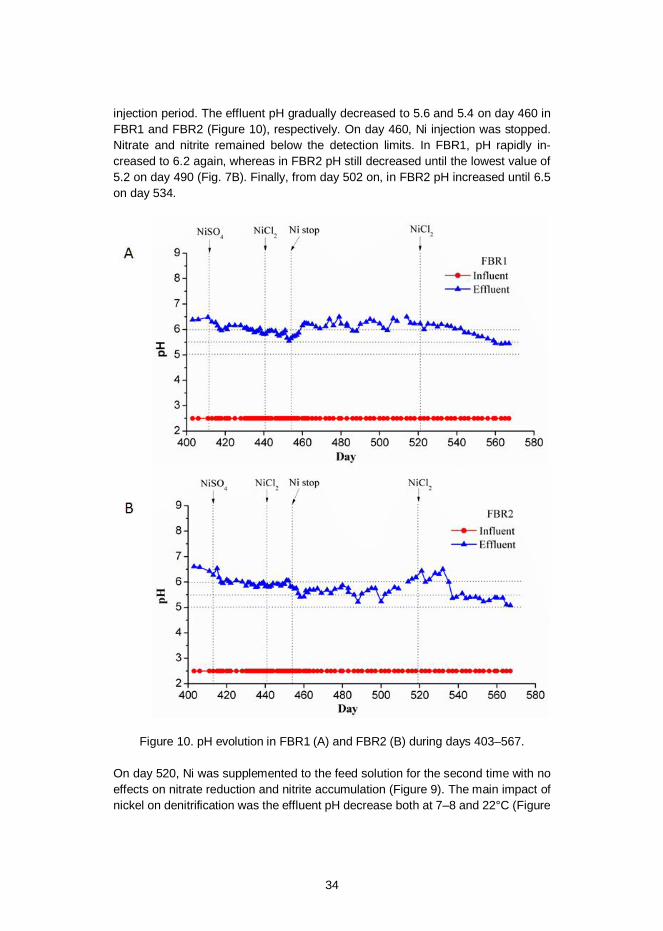
injection period. The effluent pH gradually decreased to 5.6 and 5.4 on day 460 inFBR1 and FBR2 (Figure 10), respectively. On day 460, Ni injection was stopped.Nitrate and nitrite remained below the detection limits. In FBR1, pH rapidly in-creased to 6.2 again, whereas in FBR2 pH still decreased until the lowest value of5.2 on day 490 (Fig. 7B). Finally, from day 502 on, in FBR2 pH increased until 6.5on day 534.
Figure 10. pH evolution in FBR1 (A) and FBR2 (B) during days 403–567.
On day 520, Ni was supplemented to the feed solution for the second time with noeffects on nitrate reduction and nitrite accumulation (Figure 9). The main impact ofnickel on denitrification was the effluent pH decrease both at 7–8 and 22°C (Figure

35
10). pH sharply decreased in FBR2, from 6.0 to 5.4 in two days, before keepingstable around 5.2, whereas only a slight pH decrease from 6.2 to 5.4 was ob-served in FBR1 in 47 days. This may be attributed to both nickel sulphide precipi-tation and nickel toxicity on denitrifiers.
Based on Ni mass balances, 31% and 23% of nickel precipitated in FBR1 andFBR2, respectively. Nickel sulphide (NiS) was the only possible Ni precipitateformed in the FBRs. Hydrogen sulphide was biologically produced by the reduc-tion of 30 mg/L of sulphate present in the feed. NiS precipitation resulted in theproduction of acidity that partially repressed effluent pH increase.
The slow recovery of the process in FBR2 demonstrated that the pH decreasewas also due to a partial inhibition of denitrification that resulted in less acidityconsumption. Nickel possibly affected the last two steps of denitrification (NOconversion to N2O and N2O conversion to N2) as also supported by Slater andCapone (1984).
Effluent Ni concentrations were as shown in Figure 11.
Figure 11. Feed and soluble Ni in FBR1 and FBR2 at feed pH of 2.5.
The actual soluble Ni concentrations inside FBR1 and FBR2 were on average1.25 and 0.74 mg/L during the first injection and 1.49 and 0.92 mg/L, respectively,during the second injection. Under these conditions, nitrate and nitrite removalswere not affected. FBR internal recirculation and nickel precipitation alleviated Nieffects on denitrifiers, resulting in nitrate and nitrite concentrations below the de-tection limits. In both FBRs, the only nitrate effects were observed when Ni wasfed as sulphate from day 416 to day 446. This was likely due to activity of sul-

36
phate-reducing bacteria that competed with denitrifiers for ethanol, decreasingnitrate removal efficiencies.
The fate of Ni in FBRs was also estimated through mass balances. During days415–460, 24% and 14% of the Ni injected was removed with the soluble effluentfrom FBR1 and FBR2, respectively. 38% and 37% of Ni injected was entrappedonto the biomass of FBR1 and FBR2, respectively. On average 31% and 23% ofNi precipitated as sulphide in FBR1 and FBR2, respectively. Effluent VSS concen-trations were negligible resulting in non-significant Ni amounts entrapped onto thebiofilm detached. The discrepancy of 7% and 26% found in FBR1 and FBR2 massbalances, respectively, was due to non-frequent sampling.
From day 633, Ni was supplemented to the FBRs at increasing concentrationsat feed pH of 5.5. Initially, 10 and 20 mg/L of added Ni resulted in nitrate, nitriteand soluble Ni below the detection limits (Figure 12, Figure 13). When the feed Niconcentration was increased to 40 mg/L, soluble Ni in FBRs gradually increasedup to 22 mg/L on day 686. A lower Ni concentration in the effluent indicated thatnickel sulphide precipitation still occurred in both FBRs.
Figure 12. Feed and soluble Ni in FBR1 and FBR2 at feed pH of 5.5.
Denitrification and concomitant sulphate reduction were both maintained at feed Niconcentration up to 40 mg/L. Effluent pH was stable at approximately 7.2 in bothFBRs (Figure 13C–D). When Ni was fed at 60 mg/L, nitrate and nitrite concentra-tions increased in both FBRs. Nitrate concentration reached 107 mg/L on day 695and 101 mg/L on day 707 in FBR1 and FBR2, respectively (Figure 13A–B). Deni-trification was partially repressed whereas sulphate reduction was completelyinhibited by nickel. Nickel sulphide precipitation did not occur and Ni was removed

37
with soluble effluent in both FBRs. However, after 34 days of adaptation to 60mg/L Ni, denitrification recovered resulting in complete nitrate and nitrite removalsin both FBRs, even at 80–500 mg/L Ni in the following experimental phases(Figure 13).
Figure 13. Effluent nitrate and nitrite (A,B) and feed and effluent pH (C,D) in FBR1(A,C) and FBR1 (B,D).
4.1.1.3 Microbial community analysis
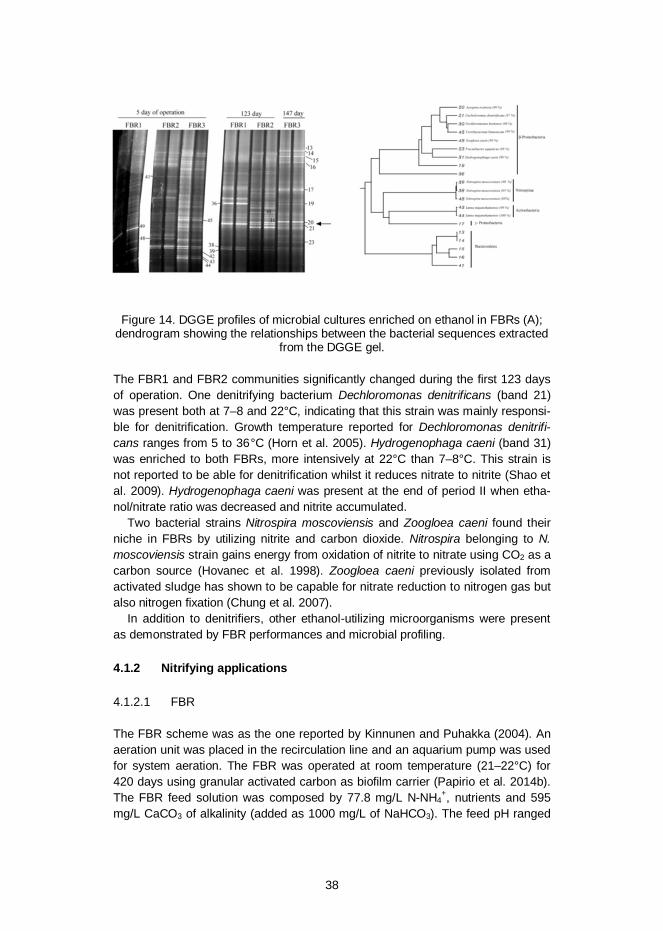
DGGE analysis was performed two times to reveal changes in the microbial com-munities at 7–8 and 22°C during the enrichment phase and operation of the FBRs(Figure 14). Dendrogram in Figure 14B shows the relationship between the bacte-rial sequences obtained by DGGE.
38
Figure 14. DGGE profiles of microbial cultures enriched on ethanol in FBRs (A);dendrogram showing the relationships between the bacterial sequences extracted
from the DGGE gel.
The FBR1 and FBR2 communities significantly changed during the first 123 daysof operation. One denitrifying bacterium Dechloromonas denitrificans (band 21)was present both at 7–8 and 22°C, indicating that this strain was mainly responsi-ble for denitrification. Growth temperature reported for Dechloromonas denitrifi-cans ranges from 5 to 36°C (Horn et al. 2005). Hydrogenophaga caeni (band 31)was enriched to both FBRs, more intensively at 22°C than 7–8°C. This strain isnot reported to be able for denitrification whilst it reduces nitrate to nitrite (Shao etal. 2009). Hydrogenophaga caeni was present at the end of period II when etha-nol/nitrate ratio was decreased and nitrite accumulated.
Two bacterial strains Nitrospira moscoviensis and Zoogloea caeni found theirniche in FBRs by utilizing nitrite and carbon dioxide. Nitrospira belonging to N.moscoviensis strain gains energy from oxidation of nitrite to nitrate using CO2 as acarbon source (Hovanec et al. 1998). Zoogloea caeni previously isolated fromactivated sludge has shown to be capable for nitrate reduction to nitrogen gas butalso nitrogen fixation (Chung et al. 2007).
In addition to denitrifiers, other ethanol-utilizing microorganisms were presentas demonstrated by FBR performances and microbial profiling.
4.1.2 Nitrifying applications
4.1.2.1 FBR
The FBR scheme was as the one reported by Kinnunen and Puhakka (2004). Anaeration unit was placed in the recirculation line and an aquarium pump was usedfor system aeration. The FBR was operated at room temperature (21–22°C) for420 days using granular activated carbon as biofilm carrier (Papirio et al. 2014b).The FBR feed solution was composed by 77.8 mg/L N-NH4
+, nutrients and 595mg/L CaCO3 of alkalinity (added as 1000 mg/L of NaHCO3). The feed pH ranged

39
between 7.5 and 8.0. After the initial 15 days, FBR operation was continuous byusing first a 12h (days 15–84) and then a 7h HRT (days 85–420). The FBR wassampled twice a week for ammonium, pH, DO, alkalinity, nitrate and nitrite anal-yses.
Ammonium was completely oxidized throughout the operation and nitrite re-mained below the detection limit (Figure 15A). N-NO3- rapidly increased to 76.7mg/L and nitrate production averagely remained at 85.9% during the first 84 days.From day 85 on, N-NO3- concentration strongly fluctuated with the average valueof 52 mg/L and the average ammonium conversion to nitrate decreased to 66.4%during the second experimental phase (days 85–420). This discrepancy found inthe nitrogen mass balance may have resulted from a simultaneous nitrifica-tion/denitrification or the presence of other nitrogen-utilizing organisms in the FBR.

40
Figure 15. Ammonium, nitrate, nitrite (A), pH and alkalinity (B) profiles in the nitrify-ing FBR.
At a HRT of 12h, the effluent pH remained stable at 7.60 (Figure 15B). After HRTdecrease, pH in the FBR solution significantly varied throughout the second exper-imental phase fluctuating around a mean value of 7.15. Alkalinity consumptionwas higher than acidity produced by nitrification.

41
4.1.2.2 Arsenic effects on nitrification
Arsenic is highly toxic in natural environments and it is often associated with sul-fidic minerals present in gold mines. The effect of arsenic on nitrification was in-vestigated in batch assays at initial As(III) concentrations of 0, 5, 20, 50, 100, 150and 200 mg/L at pH 7.5 and room temperature (22°C). 5 mL of activated carboncoated with biofilm (0.49 g TSS/mL, 0.24 g VSS/mL) was taken from the nitrifyingFBR and added to each bottle. A phosphate buffer (50 mM HPO4
2- and 50 mMH2PO4
-) was used to maintain the pH stable. During 48 h batch assays, the bottleswere monitored for arsenic (total As, As(III) and As(V)), ammonium, nitrate, nitrite,pH and dissolved oxygen (DO).
Figure 16. Evolution of ammonium (A), nitrate (B), pH (C) and total As (D) in batchbioassays.
Nitrification was not inhibited by 100 mg AsTOT/L. Ammonium oxidation and nitrateproduction were similar at initial 0–100 mg AsTOT/L (Figure 16). At 150 and 200 mgAsTOT/L, nitrification was 25% inhibited resulting in a final N-NH4
+ concentration of20.3 mg/L. Nitrite remained below the detection limit (data not shown). N-NO3
-
concentration was 27.3 mg/L after 48h, i.e. 21% lower than at 0–100 mg AsTOT/L.The speciation of arsenic is of major importance in order to assess As toxicity
and bioavailability. Figure 17 shows As(III) and As(V) concentrations at 100 and200 mg AsTOT/L in the batch tests.

42
Figure 17. Liquid phase As(III) and As(V) species during nitrification in batch bio-assays.
At 100 mg AsTOT/L, As(III) was completely oxidized to As(V) after 3h. Differently, 5mg/L of As(III) remained after 6h at 200 mg AsTOT/L. At the end of the test, As(V)was the sole As species and As(V) concentration corresponded to the initial totalarsenic concentration. Ammonium oxidation and nitrate production were onlyrepressed during the first 12h at 200 mg AsTOT/L, when As(III) was still present.This demonstrates that the toxic effects of As(III) were neutralized resulting in highammonium oxidation efficiencies.
4.1.2.3 DGGE profiles
The microbial communities were studied four times during FBR operation andbatch tests (Figure 18). Ferruginibacter lapsinasis (band 72), Sediminibacteriumsalmoneum (band 122), two aerobic heterotrophs optimally growing at 10–37°Cunder neutral conditions, were recognized in the activated sludge seeded to theFBR. At this stage, the quantity of nitrifying organisms was below DGGE detec-tion. DGGE bands were too close to each other for separation and sequencing.

43
Figure 18. DGGE profiles of nitrifying microbial cultures in the original seed, FBRand batch bioassays.
After 35 days of FBR operation, Candidatus Nitrospira defluvii was revealed(bands 93 and 94). This bacterium is one of the most abundant nitrifiers in naturalenvironments and wastewater treatment plants (Daims et al. 2001). FBR culturesalso contained Terrimonas lutea (band 85), a typical activated sludge nitrate re-ducer under aerobic conditions, indicating that this strain was probably responsiblefor the reduction of part of nitrate produced by nitrification.
After 306 days of operation, two uncultured Nitrospira bacteria, responsible ofnitrite oxidation, were seen in both FBR (bands 51 and 35–39) and batch bioas-says (bands 31–32). One species of Lysobacter (bands 20, 23) and one Ther-momonas, all belonging to the group of -Proteobacteria, were present in batchbioassays. Species of genus Lysobacter have been observed in a nitrifying sludgelagoon (Ducey et al. 2010). On the contrary, Thermomonas species reduce nitrateand nitrite in aerobic and anoxic environments (Margaert et al. 2003), possiblyexplaining the nitrogen loss from the mass balance in batch tests. All the microbialspecies demonstrated to tolerate arsenic. No arsenic oxidizers were found in theFBR cultures.

44
4.1.3 Conclusions
Nitrification and denitrification of simulated mining waters was evaluated in sepa-rate laboratory scale fluidized-bed reactors. Denitrification was efficiently main-tained at low feed pH (2.5) and temperature as low as 7–8°C. A hydraulic retentiontime (HRT) of 5.4 h was reached and 890 mg/L d of nitrate was reduced in etha-nol/nitrate ratio of 0.84 mol/mol. In the nitrification process, 77.8 mg/L N-NH4
+ wascompletely oxidized throughout the operation and nitrite remained below the de-tection limit at HRT of 7 h and feed alkalinity of 595 mg/L CaCO3. Batch bioassaysindicated that denitrification and nitrification process can tolerate heavy metals(Fe, Co and Ni) and As, respectively, in concentrations typical to mining waters.DGGE analyses revealed that the dominant bacteria in the denitrification FBRwere Dechloromonas denitrificans and Hydrogenophaga caeni, and CandidatusNitrospira defluvii and bacteria belonging to genera Lysobacter and Nitrospirawere present nitrification process.
4.2 Adsorption experiments for nitrate and ammonium
4.2.1 Introduction
Nitrogen adsorption by different media has been widely studied in the literature,and based on a wider literature review, four adsorbents were selected for thestudy in continuous mode. Zeolite has been reported and utilized as a cation ex-change medium with a high affinity and selectivity to ammonium. Literature reportsindicate that surface modification of zeolite can result in simultaneously cati-on/anion exchanging and treatment with the cationic surfactant hexadecyltrime-thylammonium (HDTMA) has been reported to result in up to 5 mg NO3—N/gsorption. Activated carbon is a multisorbent that can be used as a control sub-stance. ZnCl-treatment of activated carbon has been shown to significantly in-crease regenerative nitrate binding of activated carbon.
Furthermore, batch mode adsorption tests were carried out on vermiculite andnatural zeolite clinoptilolite both having an affinity for ammonium ions. Clinoptilolitehas a cage-like structure consisting of SiO4 and AlO4 tetrahedra joined by sharedoxygen atoms, see Figure 19. Cations, such as Na+, balance the negative chargeof the framework, and can be displaced by ammonium ions NH4
+.

45
Figure 19. Clinoptilolite structure.
See Figure 20 for a model of vermiculite’s layered structure. The interlayer con-tains cations, such as Mg2+, which can be displaced by ammonium ions NH4
+.
Figure 20. Vermiculite structure.
4.2.2 Batch mode adsorption tests
4.2.2.1 Materials and methods
The natural zeolite clinoptilolite was purchased from Rota mining corporation,Turkey. Its experimental chemical formula was (Ca, K2, Na2, Mg)4Al8Si40O96 •24H2O and the mineral composition: clinoptilolite 90–95%, cristobalite 0–5% andtridymite 0–5%. The effective diameter of the pores was 4 • 10-10 m and the grainsize 0.7–1.6 mm. Its cation exchange capacity was reported to be 1.5–2.1 meq/g.Modified, i.e. slowly heated, vermiculite (Geosmart SPb, Russia) was used as
46
obtained. Vermiculite has the chemical formula (Mg,Fe,Al)3(Al,Si)4O10(OH)2 · 4H2O and its CEC is 1.0–1.5 meq/g (Rama 2011).
The clinoptilolite was pretreated in 1 M NaCl (J. T. Baker) solution by shakingfor 48 hours with an Edmund Bühler SM 25 mechanical shaker at 200 rpm. TheNaCl solution was replaced by fresh solution twice a day. The clinoptilolite wasthen filtrated, washed with deionised water, filtrated again and dried in 105 °C for24 h.
Batch mode adsorption tests were performed with the Edmund Bühler SM 25shaker. Shake flasks containing synthetic mine water, i.e. NH4NO3 (Merck) solu-tion (0.14–3.3 g/L NH4NO3, corresponding to 25–600 mg/L NH4
+-N) and either 0–300 g/L clinoptilolite or 0–200 g/L vermiculite were shaken at 200 rpm for 24 h atroom temperature. After filtration, the NH4
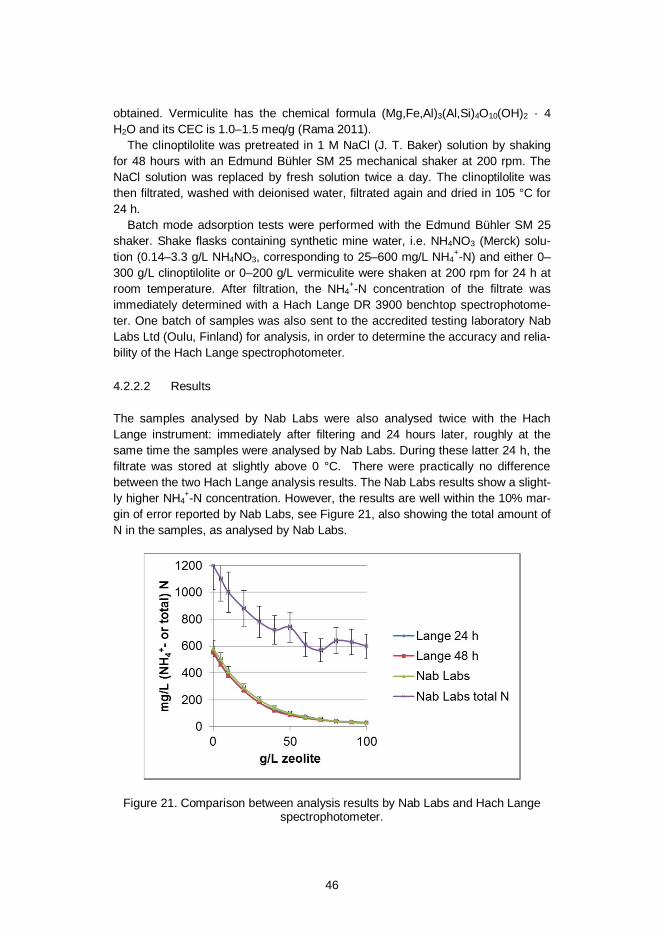
+-N concentration of the filtrate wasimmediately determined with a Hach Lange DR 3900 benchtop spectrophotome-ter. One batch of samples was also sent to the accredited testing laboratory NabLabs Ltd (Oulu, Finland) for analysis, in order to determine the accuracy and relia-bility of the Hach Lange spectrophotometer.
4.2.2.2 Results
The samples analysed by Nab Labs were also analysed twice with the HachLange instrument: immediately after filtering and 24 hours later, roughly at thesame time the samples were analysed by Nab Labs. During these latter 24 h, thefiltrate was stored at slightly above 0 °C. There were practically no differencebetween the two Hach Lange analysis results. The Nab Labs results show a slight-ly higher NH4
+-N concentration. However, the results are well within the 10% mar-gin of error reported by Nab Labs, see Figure 21, also showing the total amount ofN in the samples, as analysed by Nab Labs.
Figure 21. Comparison between analysis results by Nab Labs and Hach Langespectrophotometer.

47
Because of the similarity between these results, Hach Lange spectrophotometerwas used for the analysis and the results presented in Figure 22–Figure 25 wereobtained using this instrument.
Figure 22 shows the adsorption behaviour of both clinoptilolite and vermiculite.Similarly shaped curves were achieved at all the ammonium concentrations test-ed. Clinoptilolite adsorbs most of the NH4
+-N already at rather low adsorbent con-centrations, after which there is not any significant improvement of the adsorptioneven though more zeolite is used. The vermiculite curves level out at higher ad-sorbent concentrations, still leaving more NH4
+-N in the solution than in the caseof clinoptilolite.
Figure 22. Typical NH4+-N adsorption behaviour of clinoptilolite and vermiculite.
The rise between 50 and 100 g/L adsorbent in the adsorption curve of clinoptilolitein Figure 23 is most probably the result of inefficient filtration of the solution. Thelower the NH4
+-N concentration, the more sample solution is needed for the HachLange analysis. Furthermore, it was not possible to dilute samples of low initialNH4
+-N concentration as much as samples of high concentration. A part of thesmall zeolite particles always penetrates the filter paper, causing turbidity in thefiltrate, which in turn causes Hach Lange analysis problems at low NH4
+-N con-centration.

48
Figure 23. NH4+-N adsorption by clinoptilolite and vermiculite.
Zooming in on clinoptilolite’s adsorption curve shows that an initial NH4+-N con-
centration of 50 mg/L is reduced to 1 mg/L by 10 g/L zeolite and to 0.2 mg/l by 20g/L zeolite (Figure 24). In real mine water, the initial NH4
+-N concentration wouldprobably be lower than 50 mg/L; a report (Mattila et al. 2007) published by theFinnish Forest Research Institute mentions concentrations between 5.1 and 17.2mg/L NH4
+-N in mine water samples collected from 3 different mines in Finland.
Figure 24. NH4+-N adsorption by clinoptilolite.
An extreme case of the aforementioned analysis problems can be seen in Figure25 where the initial NH4
+-N concentration is slightly below 25 mg/L. The analysisof samples treated with vermiculite is not affected by turbidity even at low NH4
+-N

49
concentrations, since the vermiculite flakes are much bigger than the smallestzeolite particles.
Figure 25. NH4+-N adsorption by clinoptilolite and vermiculite, low initial NH4
+-Nconcentration.
4.2.2.3 Conclusions
Both clinoptilolite and vermiculite adsorb NH4+-N from synthetic mine water, ac-
cording to our experimental results. Of these two materials, clinoptilolite is moreefficient, removing more NH4
+-N at lower adsorbent concentrations.
4.2.3 Continuous mode adsorption tests for nitrate and ammonium
4.2.3.1 Materials and methods
Granular activated carbon (GAC) and zeolite were used as adsorbents in continu-ous mode tests. The properties of zeolite are reported in 4.2.2.1. AQUACARB TM207C 12X30 granular activated carbon was bought from Chemviron Carbon and itwas manufactured from specific grades of coconut shell.
The zeolite was washed with deionised water and dried in 105 °C for 24 hoursbefore use. Synthetic wastewater was prepared from NH4NO3 (Baker Analyzed).All the chemicals used were pro analysis grade.
Analyses
pH and electrical conductivity were analysed by MeterLab PHM240 pH/ION meterand by MeterLab CDM210 Conductivity meter, respectively. NH4
+ and NO3- con-
centrations in the feed and in the effluents were analysed by Seal AQ1 Automated

50
Discrete Analyzer and by Hach Lange spectrophotometer and Ammonium andNitrate cuvette tests. The AQ1 methods used for Ammonia-N and Nitrate-N +Nitrite-N were equivalent to USEPA methods 350.1 rev 2.0 and 353.2 rev. 2.0,respectively.
Treatment of GAC and zeolite
Zeolite was washed with deionized water and dried for 24 hours in 105 °C. Then, apart of the zeolite was treated with the cationic surfactant hexadecyltrime-thylammonium (HDTMA). A part of GAC was treated with 1.42 mol/l ZnCl2 anddried in furnace at 500 °C.
The first experimental setup
Two in-line setups were constructed and each setup consisted of two laboratorycolumns sizing 5 cm x 30 cm (see Figure 26). Sartorius Cellulose nitrate filterswith the pore size of 8.0 µm were used in the top of the columns and Schleicher &Schuell membrane filters with the pore size of 0.45 µm in the bottom of the col-umns. The empty and packed columns were weighted and the masses were rec-orded. In order to calculate the pore volumes, also the wet columns were weighed.For the first setup, the first column was packed with untreated GAC and the otherone with ZnCl2-treated GAC. For the second setup, the first column was packedwith untreated zeolite and the second with HDTMA-treated zeolite. The columnswere set up in saturated up flow series: untreated GAC + ZnCl2 treated GAC anduntreated zeolite + HDTMA-treated zeolite. Valve tubing was installed betweencolumns for sampling. A schematic description of the setup is shown in Figure 27.

51
Figure 26. The first experimental setup. The GAC columns are in series on the lefthand side and zeolite columns in series on the right hand side.
Synthetic wastewater was prepared by diluting 0.8 g of NH4NO3 in 10 litres ofwater. The first batch of the synthetic wastewater contained 13 mg NH4-N/L and33 mg NO3
--N/L. After 180 hours and about 10 litres of water had run througheach system, NH4 and NO3 concentrations were increased to 500 mg NH4
+-N/Land 557 mg NO3
--N/L, in order to obtain the breakthrough faster. All the experi-ments were conducted in ambient temperature, at 20 ± 2 °C. The system was runabout 48 hours with distilled water before the synthetic wastewater was fed to thecolumns.

52
Figure 27. Schematic description of the first experiment. The first column waseither untreated zeolite (Zeo U) or untreated granular activated carbon (GAC U).The second column was either HDTMA-treated zeolite (Zeo T) or ZnCl2-treated
granular activated carbon (GAC T).
The second experimental setup
Because of the results obtained for NH4+ removal by untreated zeolite and NO3
removal by both untreated and treated GAC, the setup of the columns waschanged so that there were untreated zeolite columns as the first columns in bothsystems and untreated GAC in the first and ZnCl2-treated GAC in the secondsetup. The setup with untreated zeolite and untreated GAC is shown in Figure 28.Unused materials were used for these experiments. The zeolite was washed anddried and the GAC was treated with ZnCl2 as described earlier. The syntheticwastewater fed to the columns contained 35–47 mg NH4
+-N/L and 60–68 mg NO3-
-N/L.
Regeneration of GAC columns
After the breakthrough occurred, the GAC columns were regenerated with 0.05 MNaOH. The columns were regenerated in series in co-current i.e. in up-flow mode.5 litres of 0.05 mol/l NaOH was used with the flow rate of 0.5 L/h to regenerate theGAC columns. Then, the columns were washed with approximately 5 litres ofdistilled water. Samples were taken between 0.5–2 hours during the regenerationand washing. The second regeneration was conducted with higher flow rate (0.67L/h) and 6 litres of 0.05 M NaOH. 6 litres of distilled water was used for washing.In the second experimental setup, untreated GAC was regenerated alone with 6

53
litres of 0.1 M NaOH in counter current mode i.e. in down flow mode. After all theregenerations, other cycles were carried out.
Regeneration of zeolite columns
After the breakthrough occurred, the zeolite columns were regenerated in series inco-current mode with 7 litres of 0.5 M NaCl solution, which pH was adjusted toover 12 with NaOH. 6 litres of distilled water was used for washing. In the secondsetup, untreated zeolite was regenerated alone in counter current mode with 9litres of 0.5 M NaCl and 1 litre of 1 M NaCl, which pH was adjusted to over 12 withNaOH. After both the regenerations, another cycle was carried out.
Figure 28. Second experimental setup with untreated zeolite on the left hand side(the 1st column) and untreated GAC on the right hand side (the 2nd column). Thepicture was taken in the beginning where the zeolite column is getting filled with
water.

54
4.2.3.2 Results
Ammonia removal
Ammonia was adsorbed onto untreated zeolite and untreated GAC. Also ZnCl2-treated GAC could adsorb some remaining ammonia after untreated GAC. Un-treated GAC could adsorb only 0.06 mg NH4
+-N /g GAC before ammonia startedto leak. The total NH4
+-N/L adsorption capacity was approximately 0.3 mg NH4+-
N/g GAC. Untreated zeolite could adsorb NH4+-N effectively and its breakthrough
NH4+-N adsorption capacity was approximately 10.9 mg NH4
+-N/g zeolite beforethe zeolite columns were regenerated. The effluent NH4
+-N concentration did notreach the influent NH4
+-N concentration and therefore, there would have beenNH4
+-N adsorption capacity left. Thus, 10.9 mg/g cannot be considered as thetotal NH4
+-N exchange capacity. NH4+-N concentrations after GAC and zeolite
column are shown in Figure 29 until the feed concentration was increased.
Figure 29. NH4+-N concentration after zeolite and GAC columns.
Nitrate removal
Both untreated and ZnCl2-treated GAC could adsorb NO3-, with total capacities of
0.5–1.1 and 0.9–1.1 mg NO3- -N/g GAC, respectively. Untreated zeolite did not
adsorb NO3-, but HDTMA-treated zeolite had total NO3
- adsorption capacity of 1.1mg NO3
--N/g. Despite the similar total adsorption capacities, GAC could keep the

55
effluent NO3- concentration low longer (Figure 30), while zeolite started to leak
NO3- already after 2 litres of synthetic wastewater had flown through the columns.
Figure 30. NO3- -N concentration after zeolite and GAC columns.
Regeneration of GAC columns
The GAC columns were regenerated as described before. Regeneration of GACcolumns could remove the NO3
--N adsorbed onto GAC. However, after the regen-eration, GAC could not adsorb NO3
-. When untreated GAC was regenerated alonein counter current mode, 62% of the NO3
- was desorbed.
Regeneration of zeolite columns
Zeolite columns were regenerated in series in co-current mode as described earli-er. Regeneration of untreated zeolite was successful in counter current. Approxi-mately 92% of adsorbed NH4
+-N was desorbed. However, 10 litres of 0.5 mol/lNaCl solution was not enough to desorb all the NH4
+. After regeneration the NH4+-
N concentration in the effluent was approximately 0.15 mg/L, but after 4 litres ofsynthetic wastewater had flown through the columns NH4
+-N concentration de-creased to < 0.04 mg/L. After the regeneration at least 15.6 litres of syntheticwastewater with NH4
+-N concentration of 42 mg/L could be treated and the regen-erated zeolite could adsorb at least 2.2 mg NH4
+-N /g zeolite.

56
Figure 31. Effluent NH4+-N concentration in zeolite regeneration, when untreated
zeolite was regenerated alone.
Figure 32. Effluent pH and electrical conductivity in untreated zeolite regeneration.
4.2.3.3 Discussion
Untreated zeolite had good NH4+-N adsorption capacity. The experiment was run
until breakthrough and the adsorption capacity was 10.9 mg NH4+-N/g zeolite.
Rahmani et al. (2004) obtained total NH4+-N adsorption capacity of 17.31-18.98

57
mg NH4+-N /g zeolite in a column study. The capacity until breakthrough was
9.61–11.17 mg NH4+-N /g zeolite, which is similar to the breakthrough capacity
obtained in this experiment. The total capacity of untreated zeolite was notreached in this study i.e. the columns could still have removed NH4
+ when thecolumns were regenerated. Du et al. (2005) attained 5.81–7.74 mg NH4
+-N /gbreakthrough capacity. They carried out six loading and five regeneration cycleswithout loss of NH4
+ removal capacity. In addition, the NH4+ removal capacity
increased after the first regeneration. The mineralogy of the zeolite, its particlesize, relative porosity and density also have an influence on the ion exchangecapacity of zeolite. Also the influent NH4
+ concentration and the presence of otherions in the feed may affect the ion exchange capacity.
HDTMA treatment of zeolite improved the NO3--N adsorption from < 0.05 mg/g
to 1.1 mg/g. However, the adsorption of NO3- by HDTMA treated zeolite was still
significantly lower than NH4+ adsorption by untreated zeolite. Li (2003), Guan et al.
(2010), Onyango et al. (2010) obtained NO3- adsorption capacities of 1.1 mg NO3
--N/g, 0.8 mg NO3--N/L, and 2.6 mg NO3
--N/g, respectively.Namasivayam and Sangeetha (2005) examined NO3
- removal using ZnCl2-treated GAC in a batch study and they achieved adsorption capacity of 2.3 mgNO3
--N/L. They also examined desorption of NO3- and influence of other anions on
NO3- adsorption. They found that desorption of NO3
- from ZnCl2-treated GAC wasthe highest at pH 11 (> 92%) and at pH 2 (> 58%). At pH 3-11 desorption wasnegligible. They found that from the tested anions perchlorate, chloride, and sul-phate reduced NO3- adsorption.
Higher NO3--N concentrations were observed for ZnCl2-treated GAC in the
samples taken in the afternoon compared to the samples taken in the morning,approximately 1 mg/L in the afternoon and < 0.05 in the morning (Figure 30). Thetemperature in the laboratory was 1–3 °C lower in the night than in the day time. Itwas possible that the higher temperature in the day time caused lower NO3
- ad-sorption onto ZnCl2 treated GAC and higher NO3
- concentration in the effluent inthe samples measured in the afternoon. Bhatnagar et al. (2008) noticed that ni-trate adsorption onto ZnCl2 treated GAC increased slightly by decreasing tempera-ture. Differences between morning and afternoon samples for the effluent NO3
--Nconcentrations were observed with neither the untreated GAC nor the zeolitecolumns.
In the first experiment, the regeneration was conducted in series. It could havebeen better if all the columns had been regenerated separately. HDTMA-treatedzeolite was regenerated only once with NaCl-solution. Regeneration with NaOHwas not examined. Because the regeneration of GAC columns was not success-ful, it could not be evaluated here whether the adsorption capacity decreases aftergeneration. Cho et al. (2011) noticed that the amount of adsorbed nitrate de-creased from 4.8 mg NO3
--N /g to 3.4 mg NO3--N /g after four cycles of adsorption
on [3-(methacryloylamino)propyl]-trimethylammonium chloride coated GAC.

58
4.2.3.4 Conclusions and further research
Four different sorption materials were tested for ammonia and nitrate adsorption.Untreated and hexadecyltrimethylammonium (HDTMA)-treated zeolite and un-treated and ZnCl2-treated granular activated carbon (GAC) were examined andtested by column experiments for their nitrate and ammonia removal capabilitiesas well as regeneration capabilities.
Both the GAC columns could remove NO3- from the synthetic wastewater, but
NH4+ removal by both GAC columns was weak. Untreated zeolite was the best of
the tested adsorbents for NH4+ removal and could adsorb ammonia approximately
10.9 mg NH4+-N /g zeolite. HDTMA-treated zeolite, untreated and ZnCl2-treated
GAC had similar adsorption capacities for NO3- adsorption, but both untreated and
ZnCl2-treated GAC kept NO3--N concentration in the effluent lower than HDTMA-
treated zeolite. The NO3- adsorption capacities obtained for GAC and HDTMA-
treated zeolite in this study were 0.5–1.1 mg NO3--N/g, being in similar range with
literature results obtained in similar column studies. Untreated zeolite could notadsorb NO3
-. NH4+ breakthrough adsorption capacities for untreated zeolite were
comparable with other similar studies. However, NH4+ adsorption was lower in this
study than results obtained by others.The regeneration of GAC or HDTMA-treated zeolite columns was not success-
ful. More NO3--N and NH4
+-N was desorbed than was calculated to have beenadsorbed onto GAC. However, after regeneration, the GAC columns could notadsorb NO3
--N and the NO3--N concentration in the effluent was immediately close
to the influent NO3- concentration. It seemed that even though NO3
--N was re-moved from GAC, the adsorption sites were not active or available for NO3
- ad-sorption again. When untreated GAC was regenerated alone in counter currentmode, 62% of the NO3
--N was desorbed indicating that neither counter currentregeneration nor regeneration of the column alone improved the regeneration ofGAC. In addition, increasing the NaOH concentration from 0.05 M to 0.1 M did notimprove the regeneration. Because of the unsuccessful regeneration of GAC col-umns, neither untreated nor ZnCl2-treated GAC was suitable for NO3
--N removal inthis study. Zeolite columns could be regenerated with 0.5–1 M NaCl-solution (pH >12). Comparing different materials, only untreated zeolite proved potential forregenerative use.
Therefore the experiments were continued with zeolite only. The aim was to findthe shortest retention time needed for NH4
+ adsorption on zeolite and improve theregeneration. Real mine wastewater contains also other ions besides NH4
+ andNO3
-, and the other ions may decrease the adsorption capacity. Thus, adsorptionof NH4
+ from real mine wastewater was examined in subsequent testing series.
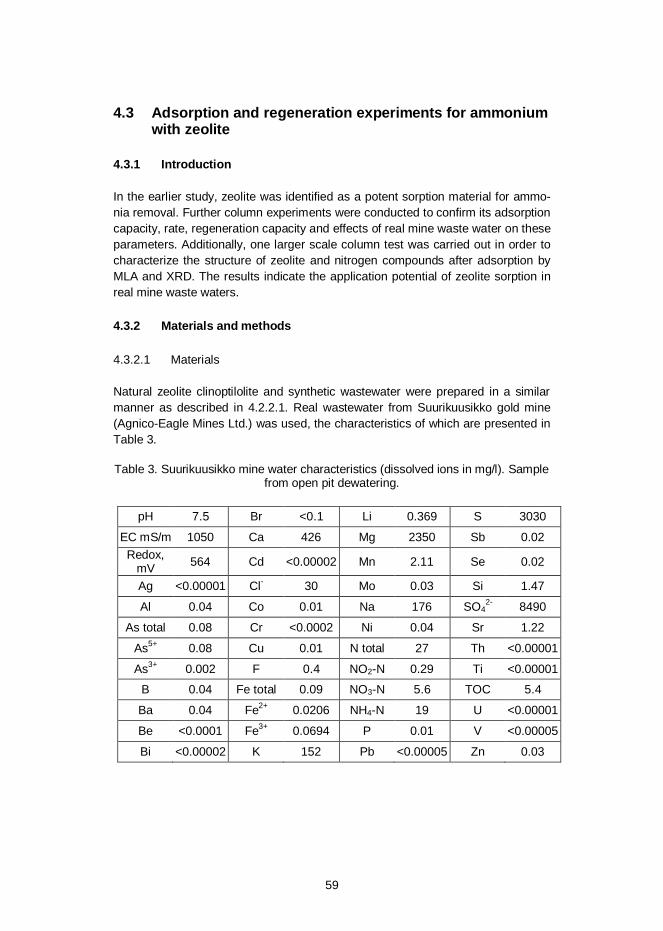
59
4.3 Adsorption and regeneration experiments for ammoniumwith zeolite
4.3.1 Introduction
In the earlier study, zeolite was identified as a potent sorption material for ammo-nia removal. Further column experiments were conducted to confirm its adsorptioncapacity, rate, regeneration capacity and effects of real mine waste water on theseparameters. Additionally, one larger scale column test was carried out in order tocharacterize the structure of zeolite and nitrogen compounds after adsorption byMLA and XRD. The results indicate the application potential of zeolite sorption inreal mine waste waters.
4.3.2 Materials and methods
4.3.2.1 Materials
Natural zeolite clinoptilolite and synthetic wastewater were prepared in a similarmanner as described in 4.2.2.1. Real wastewater from Suurikuusikko gold mine(Agnico-Eagle Mines Ltd.) was used, the characteristics of which are presented inTable 3.
Table 3. Suurikuusikko mine water characteristics (dissolved ions in mg/l). Samplefrom open pit dewatering.
pH 7.5 Br <0.1 Li 0.369 S 3030
EC mS/m 1050 Ca 426 Mg 2350 Sb 0.02Redox,
mV 564 Cd <0.00002 Mn 2.11 Se 0.02
Ag <0.00001 Cl- 30 Mo 0.03 Si 1.47
Al 0.04 Co 0.01 Na 176 SO42- 8490
As total 0.08 Cr <0.0002 Ni 0.04 Sr 1.22
As5+ 0.08 Cu 0.01 N total 27 Th <0.00001
As3+ 0.002 F 0.4 NO2-N 0.29 Ti <0.00001
B 0.04 Fe total 0.09 NO3-N 5.6 TOC 5.4
Ba 0.04 Fe2+ 0.0206 NH4-N 19 U <0.00001
Be <0.0001 Fe3+ 0.0694 P 0.01 V <0.00005
Bi <0.00002 K 152 Pb <0.00005 Zn 0.03
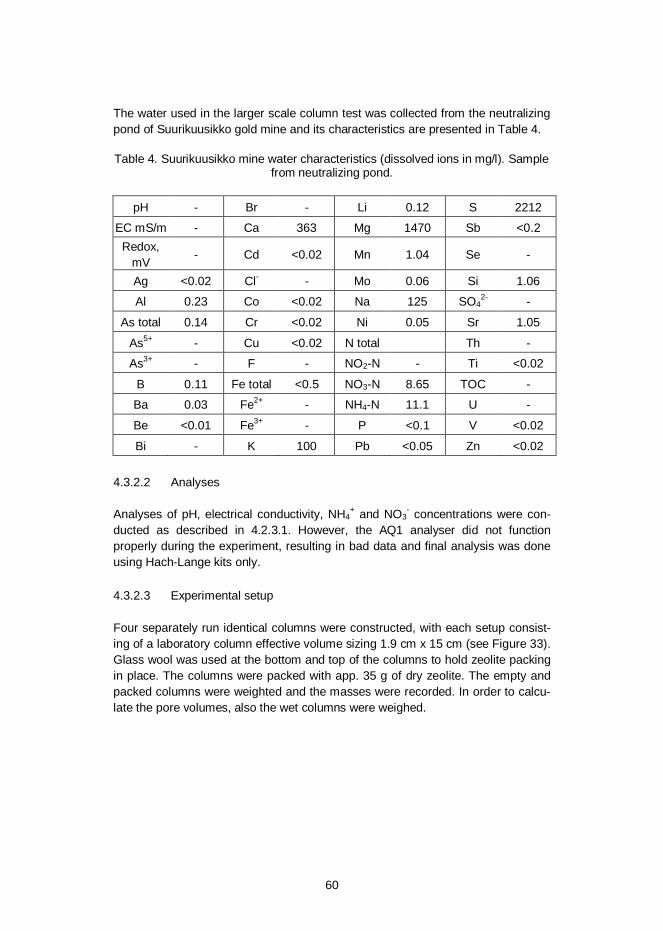
60
The water used in the larger scale column test was collected from the neutralizingpond of Suurikuusikko gold mine and its characteristics are presented in Table 4.
Table 4. Suurikuusikko mine water characteristics (dissolved ions in mg/l). Samplefrom neutralizing pond.
pH - Br - Li 0.12 S 2212
EC mS/m - Ca 363 Mg 1470 Sb <0.2Redox,
mV - Cd <0.02 Mn 1.04 Se -
Ag <0.02 Cl- - Mo 0.06 Si 1.06
Al 0.23 Co <0.02 Na 125 SO42- -
As total 0.14 Cr <0.02 Ni 0.05 Sr 1.05
As5+ - Cu <0.02 N total Th -
As3+ - F - NO2-N - Ti <0.02
B 0.11 Fe total <0.5 NO3-N 8.65 TOC -
Ba 0.03 Fe2+ - NH4-N 11.1 U -
Be <0.01 Fe3+ - P <0.1 V <0.02
Bi - K 100 Pb <0.05 Zn <0.02
4.3.2.2 Analyses
Analyses of pH, electrical conductivity, NH4+ and NO3
- concentrations were con-ducted as described in 4.2.3.1. However, the AQ1 analyser did not functionproperly during the experiment, resulting in bad data and final analysis was doneusing Hach-Lange kits only.
4.3.2.3 Experimental setup
Four separately run identical columns were constructed, with each setup consist-ing of a laboratory column effective volume sizing 1.9 cm x 15 cm (see Figure 33).Glass wool was used at the bottom and top of the columns to hold zeolite packingin place. The columns were packed with app. 35 g of dry zeolite. The empty andpacked columns were weighted and the masses were recorded. In order to calcu-late the pore volumes, also the wet columns were weighed.

61
Figure 33. Four small columns. Zeolite packing was decreased before starting theexperiment to facilitate flow.
Synthetic wastewater containing 20 mg NO3--N and 20 mg NH4
+-N per litre wasprepared. Two columns were run in parallel using synthetic wastewater and realmine wastewater at minimum retention time (2–5 min) to test the adsorption rateand regeneration. Two were run in parallel using synthetic wastewater and realmine wastewater with a constant, slower retention time of 30 min. All the experi-ments were conducted in ambient temperature, at 20 ± 2 °C. The column piping’swere not designed for constant pressure and there were several flow cut-offs andleaks due to braking fittings and pipes.

62
4.3.2.4 Regeneration of zeolite columns
Always after the breakthrough occurred, the zeolite columns were regenerated inin co-current mode with variable amounts of 0.5 M NaCl solution, the pH of whichwas adjusted to over 12 with NaOH. Distilled water was used for washing.
4.3.2.5 Experimental setup for larger scale column test
The larger scale column test parameters are shown in Table 5. In this column testzeolite was sieved to the particle size fraction over 630 µm. A metallic net orscreen was placed in both ends of the column in order to keep the zeolite materialin place. The duration of the test was almost 20 days and nearly 1800 litres ofmine wastewater was pumped through the column. The mine wastewater wasstirred 100 rpm in 1m3 container. Water was pumped with a peristaltic pumpthrough the zeolite containing column. The ammonium and nitrate contents weremeasured from the column upper outlet. The ammonium contents were deter-mined from the purified water almost daily, the nitrate contents were measuredless frequently. The test equipment is shown in Figure 34.
Table 5. Column test parameters.
Column height, cm 60Inside diameter, cm 5.5Volume, l 5.7Pore volume, l 0.7Flow rate ml/min 70Residence time, min 10Water consumption l/hour 4.2Water consumption l/24 hour 100.8Zeolite in column, kg 1

63
Figure 34. Test equipment of the larger column test.
4.3.3 Results
4.3.3.1 Rapid wastewater filtration
Synthetic wastewater was run through an adsorption column with high flowrate.First the hydraulic residence time (HRT) was set to app. 45 minutes and filtrationwas continued for a week, until a rise in concentration was detected. HRT wasdropped to 10 minutes for the next 24 hours after which it was further decreasedto 5 minutes. 2 minutes was also tested but there were pressure problems. Break-through point was estimated for this case to match the point when effluent ammo-nium concentration exceeds 1 mg/l. The test was continued for three regenerationcycles. The results are presented in Figure 35 and Table 6.

64
Figure 35. Short HRT cumulative flow of synthetic wastewater through column andeffluent ammonia concentration. 1 mg/l breakthrough limit is marked with a red
line.
Table 6. Breakpoints in rapid synthetic wastewater filtration.
Breakthrough point 1 2 3Time point, h 165 247 391Cumulative flow, L 9.9 17.3 26.8Sorption capacity, mg/g 6.3 11.0 17.1
The sorption capacity increased with each regeneration cycle starting from 6.3mg/g in the first run and reaching 17.1 at the third cycle. This represents the fur-ther activation of the zeolite ion exchange capacity by each activation cycle. Thevery short residence time was found more than adequate for full sorption – even 2minutes contact time was enough to decrease the concentration to near zero.
Real mine wastewater was run in a parallel column. First a cycle with 45 minHRT was run (similar to the synthetic wastewater), but no signs of breakthroughappeared after 200 hours and the experiment was halted, zeolite regenerated andrun continued with a 5 min HRT. The test was continued for two full regenerationcycles. The third cycle was aborted after 100 hours as no signs of breakthroughwere detected. The results are presented in Figure 36 and Table 7.

65
Figure 36. Short HRT cumulative flow of mine wastewater through column andeffluent ammonia concentration. 1 mg/l breakthrough limit is marked with a red
line.
Table 7. Breakpoints in rapid mine wastewater filtration.
Breakthrough point 1 2 3Time point, h 63 128 >255Cumulative flow, L 16.1 16.9 >59Sorption capacity, mg/g 10.0 10.5 >36
The sorption remained constant for two cycles at a similar level to the secondcycle of the synthetic run. The third run was not run into completion, but a highincrease in sorption capacity was experienced. The very short residence time wasfound more than adequate for full sorption – even 2 minutes contact time wasenough to decrease the concentration to near zero.
The regeneration solution usage was not minimized or optimized, and varyingamounts of regeneration solution was used. This resulted in varying regenerationsolution ammonia concentrations, ranging from 5 to 100 mg NH4
+ -N/l for totalregeneration solutions.
4.3.3.2 Slow wastewater filtration
Synthetic wastewater and mine wastewater were run through columns using aconstant HRT averaging 31 min and 37 min respectively. The test was continuedto find column breakpoints and full capacities. The experiment with minewastewater was stopped after 700 hours when no signs of breakthrough wereexperienced. The results are presented in Figure 37, Figure 38 and Table 8.

66
Figure 37. Long HRT cumulative flow of synthetic wastewater through column andeffluent ammonia concentration. 1 mg/l breakthrough limit is marked with a red
line.
Figure 38. Long HRT cumulative flow of mine wastewater through column andeffluent ammonia concentration. 1 mg/l breakthrough limit is marked with a red
line.
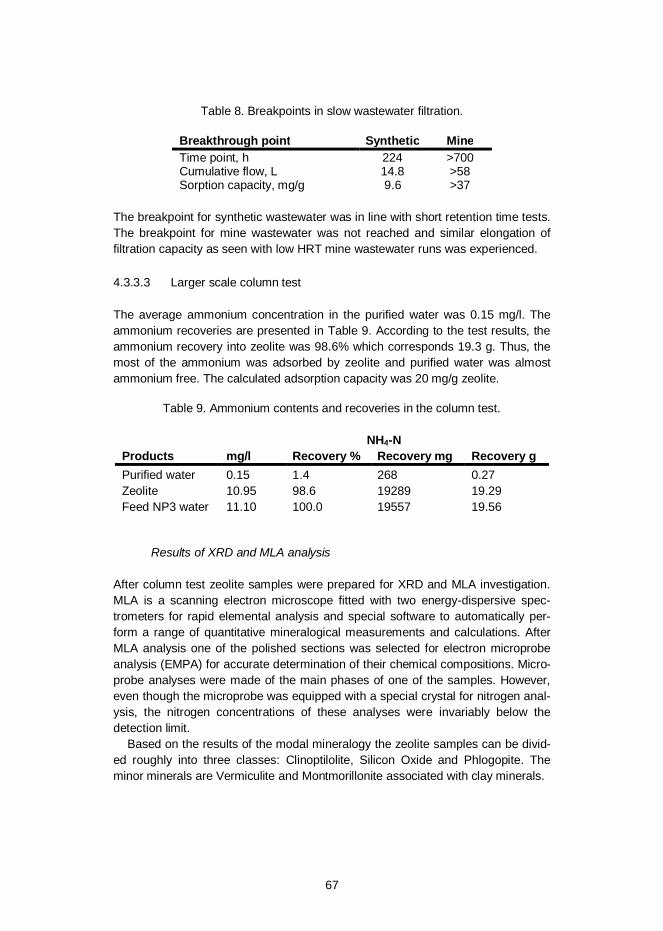
67
Table 8. Breakpoints in slow wastewater filtration.
Breakthrough point Synthetic MineTime point, h 224 >700Cumulative flow, L 14.8 >58Sorption capacity, mg/g 9.6 >37
The breakpoint for synthetic wastewater was in line with short retention time tests.The breakpoint for mine wastewater was not reached and similar elongation offiltration capacity as seen with low HRT mine wastewater runs was experienced.
4.3.3.3 Larger scale column test
The average ammonium concentration in the purified water was 0.15 mg/l. Theammonium recoveries are presented in Table 9. According to the test results, theammonium recovery into zeolite was 98.6% which corresponds 19.3 g. Thus, themost of the ammonium was adsorbed by zeolite and purified water was almostammonium free. The calculated adsorption capacity was 20 mg/g zeolite.
Table 9. Ammonium contents and recoveries in the column test.
NH4-NProducts mg/l Recovery % Recovery mg Recovery gPurified water 0.15 1.4 268 0.27Zeolite 10.95 98.6 19289 19.29Feed NP3 water 11.10 100.0 19557 19.56
Results of XRD and MLA analysis
After column test zeolite samples were prepared for XRD and MLA investigation.MLA is a scanning electron microscope fitted with two energy-dispersive spec-trometers for rapid elemental analysis and special software to automatically per-form a range of quantitative mineralogical measurements and calculations. AfterMLA analysis one of the polished sections was selected for electron microprobeanalysis (EMPA) for accurate determination of their chemical compositions. Micro-probe analyses were made of the main phases of one of the samples. However,even though the microprobe was equipped with a special crystal for nitrogen anal-ysis, the nitrogen concentrations of these analyses were invariably below thedetection limit.
Based on the results of the modal mineralogy the zeolite samples can be divid-ed roughly into three classes: Clinoptilolite, Silicon Oxide and Phlogopite. Theminor minerals are Vermiculite and Montmorillonite associated with clay minerals.

68
Figure 39. XRD results.
4.3.4 Discussion
The results show clearly, that zeolite effectively binds ammonia in column experi-ments with as low retention time as 2 minutes into a negligible concentration. Theadsorption capacity averages 10 mg/g zeolite for both synthetic wastewater andreal mine wastewater.
The time scale of the experiments was limited and much longer experimentswith multiple regeneration cycles would be required to find the real long term ionexchange capacity and zeolite attrition and the potential long term effects of minewastewater on these effects.
The adsorption capacity of zeolite for the mine wastewater sample did increasesignificantly in the last runs that never reached their breakthrough points. Thishappened only after a certain time period and only in mine water runs. There areseveral possible explanations for the phenomena. An error in the mine wastewaterruns is possible: this could come from a wrong handling of the sample causingevaporation and dilution of the source feed, but no indication of such was report-ed. The mine wastewater can potentially form and sustain biological activity in thezeolite column potentially utilizing or converting ammonia – such reactions couldinclude anammox and nitrification as well as organic uptake of ammonia. Minewastewater also contains a myriad of other ions that could potentially form precipi-tates or reactions involving ammonia compounds or their reactions. It is also pos-sible that the ion content and characteristics of the mine wastewater are extremelyfavourable for ammonia adsorption and that the true retention capacity of thecolumns is higher for the mine wastewater in question.

69
4.3.5 Conclusions and further research
Zeolite sorption and regeneration with synthetic wastewater and real minewastewater were studied with columns using short hydraulic retention time andlong hydraulic retention time. Zeolite columns were found to remove ammoniavery efficiently from both mine wastewater and synthetic wastewater. The contacttime required was <2 min and average sorption capacity measured was approxi-mately 10 mg/g. For mine wastewater, much higher sorption capacities, exceeding37 mg/g were recorded, but confirmative research would be needed to validatethese results. The results showed that mine wastewater and synthetic wastewaterbehave similarly and the sorption capacity averages 10 mg NH4
+-N/g zeolite.According to these experiments, zeolite sorption seems well suited and non-
problematic for mine wastewater ammonia removal. More long term experimentswith multiple regeneration cycles are needed to confirm the regeneration capacityand long term effects of mine water on the process.
4.4 Electrochemical treatment
Nitrogen electrochemistry is complex and involves nine oxidation states and aspectrum of intermediate products and reactions; however, the basic chemistryrevolves around inert nitrogen gas (N2), reduced nitrogen as ammonium (NH4
+)and oxidized nitrogen as nitrate (NO3
-). Nitrogen from organic sources enterswater as ammonium but in oxic environments is biologically oxidized into a lessharmful nitrate form.
The majority of existing and researched technologies for nitrogen containingwaters aim at releasing nitrogen as inert nitrogen gas through specific oxidationand reduction reactions. In MINIMAN project, a novel electrochemical method ofcombined nitrate and ammonium capture as ammonia, using a combination ofelectrochemical and membrane technology was developed.
4.4.1 Materials and methods
A poly(methyl methacrylate) electrochemical flowthrough cell reactor (see Figure40) was constructed and utilized with an active volume of 40 ml and active mem-brane surface area of 70 cm2. Materials used in the reactor configuration includeda Celgard EZ2090 microporous membrane, a Nafion 424 membrane, a 70 cm2
brass mesh and a 70 cm2 Ru/IrO-coated Ti-mesh. Ag/AgCl reference electrodewas used. Ammonia was captured in 100 ml of 0.1% H2SO4.

70
Figure 40. The acrylic 3-chamber reactor.
Model ammonia and nitrate containing wastewater were used containing Na2SO4,NaCl and NaHCO3 as electrolytes supplemented with NH4NO3, (NH4)2SO4 andNaNO3 to reach desired ammonium and nitrate concentrations. Ammonia, nitrateand nitrite were measured using standardized flow injection analysis equipmentand methods provided by University of Queensland Advanced Water ManagementCentre.
A series of 23 runs was conducted using different voltages, reaction times, ionicstrengths and ionic compositions to find out the properties of the novel electro-chemical method of nitrogen capture.
4.4.2 Results
The laboratory results supported the hypothesis of the functional principle of theelectrochemical reactor.
The key elements affecting the reduction of nitrate were identified as the cata-lyst material and the voltage applied. Materials with catalytic properties includeiron, steel, tin, copper and copper alloys. A step potential is required to achievecomplete reduction and stepwise decrease of cathodic potential from -0.6 V to -1.5V shows first no reduction activity, then partial reduction to nitrite and finally in-creasing rate of nitrate reduction.
The capture of ammonia from wastewater was validated for waters containingnitrogen in nitrate and ammonia or both forms. The key elements affecting thecapture efficiency were identified as reactor configuration and especially surfaceparameters used, but clear correlation was seen with solution conductivity, volt-age, ammonium concentration and ion composition.

71
The energy consumption of different setups and materials was measured andwhen energy price was estimated at 0.18 USD/kWh, a price range for ammoniacapture for the technology was calculated. With optimal settings, a sample of 50mg/l NH4-N and 50 mg/l NO3-N was treated to obtain 95% total nitrogen removal(99.7% nitrate removal) with 96% capture as ammonia utilizing 2.17 Wh of energyresulting in an energy price of 36 USD/kg N captured.
4.4.3 Conclusions
The results from the electrochemical tests were very encouraging and the tech-nology is seen as potential for further development and possible large scale use.The technology is however still in early development stage and continuing re-search efforts are required to understand the complete reaction paths, kinetics,potential efficiency and feasibility in full scale real applications.

72
5. Behaviour and release of N from naturalstone quarrying left over stone
The presence of nitrogen compounds in mining areas can have a detrimentaleffect to the environment. Besides environmental effects, contamination by explo-sive originated nitrogen compounds may be problematic due to the definition andclassification of inert waste. “Nitrogen smudging” of otherwise mineralogically andchemically inert waste rocks of good technical quality may hinder the utilization ofthese product streams, which is an important economic and environmental issueat several quarries and mines.
The hypothesis was that nitrogen compounds gradually wash out or are re-leased in gaseous form from the waste rock surfaces under atmospheric condi-tions but the rate at which this ‘ageing’ happens at small scale quarries is not wellstudied.
To study the ageing and the amount of nitrogen contamination on left overstone surfaces and to demonstrate the non-reactivity of the materials, a long-termfield study was conducted at a selected site. The study area was a natural stonequarry located in Varpaisjärvi in Lapinlahti municipality in the Northern Savoniaregion (Figure 41).

73
Figure 41. The target area (a natural stone quarry) was located in Varpaisjärvi inthe Northern Savonia region of Finland.
5.1 Materials and methods
The main product of the target quarry is black, fine grained diabase, with averagedensity of 3080 kg/m3. The amount of total extraction is approximately 28500m3/year, of which around 24000 m3, i.e. 73920 tons is left over stone. The use ofexplosives, mainly K-pipecharges by Forcit Oy, is roughly 5700 kg/year, the spe-cific charges being around 0.2 kg/m3 or 0.065 kg/t. According to the product infor-mation sheet (Forcit Oy 2013) the raw materials of the K-pipecharge powder ex-plosives are nitroglycol (ethylene-glycol-dinitrate, content 17–25%), kieselguhr(diatomaceous earth), sodium nitrate and sodium chloride, packed in polypropyl-ene pipes. The average nitrogen concentration of K-pipecharge is low comparedto other explosives usually used in larger scale mining, only 4.2%. The water re-sistance of K-pipecharges is reasonable, but the unexploded agent dissolves

74
gradually into water. The left over stones consist mainly of the same diabase ma-terial as the final products.
To evaluate the temporal changes in the quality of water emanating from leftover stone, two ageing test units were installed at the quarry site. The test unitsconsisted of 1 m3 lysimeters, which were filled with left over rock material collectedimmediately after the excavation of a large diabase block. The rock material inboth lysimeters was supposed to be identical and the purpose of setting up twounits was to examine the repeatability of the test. Unit 1 contained approximately1970 kg of rocks with 38% porosity (proportion of void space in the lysimeter), andUnit 2 contained approximately 1790 kg of rocks with 44% porosity. The test unitsare shown in Figure 42 and the material source in Figure 43.
The rain water flowing through the lysimeters was collected in separate 70-litreplastic tanks and analysed 9 times between 10th of October 2012 and 16th of Oc-tober 2013, excluding the winter months when the test units were frozen. Thesampling interval was 2 weeks during the first month and once a month during therest of the monitoring period.
The monitored parameters included nitrogen species (NO2, NO3, NH4 and total-N), Cl, pH, Ec and temperature. Chloride (Cl) is present in the rock dust and in theblasting residuals (as sodium chloride), and is considered a good indicator of thefirst flush of water through the test units (Bailey et al. 2013).
At the end of the observation period, the test units were filled (washed) with tapwater three times (Unit 2 only once) to remove and quantify the remaining explo-sives-originated nitrogen and to determine the porosity and approximate weight ofthe rocks inside the test units.
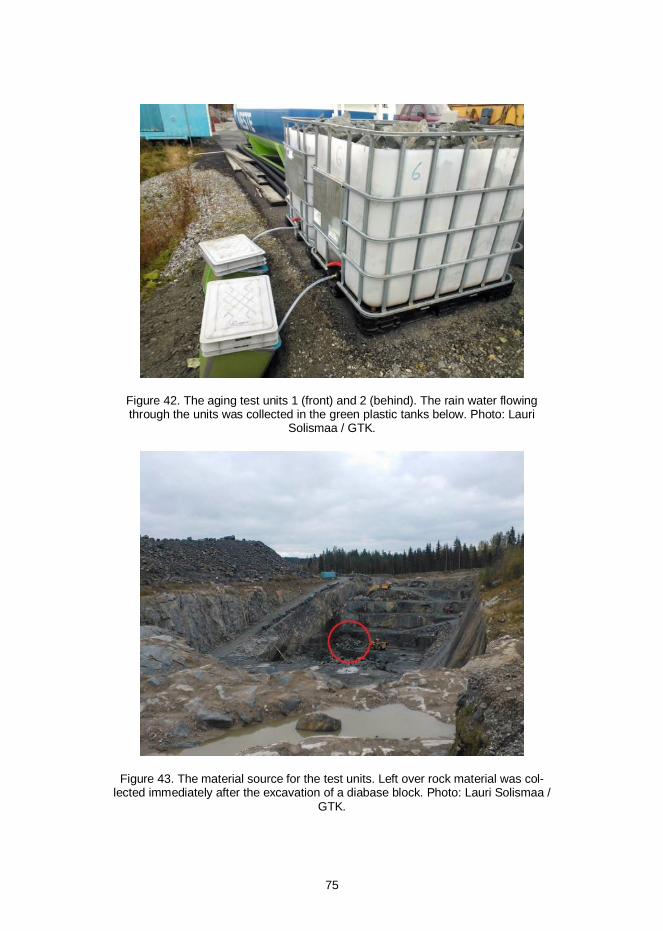
75
Figure 42. The aging test units 1 (front) and 2 (behind). The rain water flowingthrough the units was collected in the green plastic tanks below. Photo: Lauri
Solismaa / GTK.
Figure 43. The material source for the test units. Left over rock material was col-lected immediately after the excavation of a diabase block. Photo: Lauri Solismaa /
GTK.

76
5.1.1 Field measurements and sampling
The untreated samples were collected into HDPE sample bottles that had beentriple-rinsed with sample water. The sample bottles were sent to the laboratory in acool box during the same day. The samples arrived to the laboratory next morningand were analysed as soon as possible, to minimize the alteration of the samples,especially the sensitive NO2.
pH, temperature, electric conductivity, nitrite and ammonium were measured onthe field. The pH was measured by the Mettler Toledo SevenGo pH-meter. Theelectric conductivity and temperature were measured by the WTW-electric con-ductivity meter Cond 340i. The nitrite and ammonium concentrations were ana-lyzed with a portable Hach Lange DR2800 spectrophotometer using Lange cu-vette tests LCK342 (0.6–6 mg/l NO2-N) and LCK 304 (0.015–2 mg/l NH4-N). Theamount of rain water accumulated in the tanks was measured and the tanks wereemptied after every sampling occasion.
Besides field measurements, the nitrogen species were also analysed in a la-boratory to estimate the performance of the DR2800 spectrophotometer and toinvestigate the effects of transportation of the water samples to the laboratory. Theresults were comparable between the methods, although the portable spectropho-tometer gave lower concentrations when the weather was colder.
5.1.2 Laboratory measurements
The laboratory measurements in an accredited laboratory (Labtium Oy) includedtotal nitrogen, nitrite, nitrate and chloride. The NO2 was measured by spectropho-tometry. The anions NO3 and Cl were measured using ion chromatography (IC)according to the standard SFS-EN-ISO 10304-1. NH4 was measured by theAquakem analysator (salicylate-spectrophotometric method). Total nitrogen wasmeasured by the peroxodisulphate oxidation and Aquakem analysator (hydrazinereduction and spectrophotometric sulphanilamide method).
5.2 Results
The monitored concentrations and values followed similar trends in both test units,but the concentrations of the Test Unit 2 were somewhat lower (Table 10). At first,the electric conductivity and the concentrations e.g. of total-N and Cl were relative-ly high, but declined rapidly to rain water background values after the “first flush”(Figure 44, Figure 45). Cl declined more sharply and remained low for the remain-der of the study. The nitrogen concentrations were more erratic, but the absenceof Cl suggests that most of the nitrogen was derived from rain water / atmosphere.
The most abundant nitrogen species was NO3. The NH4-N concentrations wererelatively high during the first flush, around 40% of the total N concentration. Thefield measurement values of NH4 and NO2 were mainly higher than those meas-

77
ured in laboratory, which may indicate the instability of the different nitrogen spe-cies during transport.
The total-N concentrations in rainwater have been measured by the Finnish En-vironment Institute (SYKE) in the closest weather station at Maaninka (about 40km south west from Varpaisjärvi) during 2004–2012. The rainwater samples col-lected at the test units at Varpaisjärvi had similar total-N concentrations toMaaninka, around 0.6 mg/L. During two observation periods (30.4.2013 and20.8.2013) the rainwater tanks were full and probably overflowed.
Table 10. Measured concentrations of NH4-N, NO2-N, NO3-N, tot-N and Cl (mg/L),electric conductivity (µS/cm) and total amount of water collected in the tanks (L).
Test Unit 1Samplingdate
NH4-N(lab)
NH4-N(field)
NO2-N(lab)
NO2-N(field)
NO3-N tot-N Cl eC Litres
10.10.2012 1.09 0.43 N/A 0.09 1.27 2.5 898 1947 28
25.10.2012 0.06 0.03 0.01 0.08 1.15 0.8 55 507 48
8.11.2012 0.09 0.02 0.01 0.03 0.47 0.7 17.3 357 28
30.4.2013 0.01 0.04 0.01 0.06 N/A 0.9 3.7 199 > 70
6.6.2013 0.11 0.17 0.01 0.04 1.02 1.2 3.8 261 21
3.7.2013 0.01 0.01 0.01 0.02 N/A 0.7 3.4 399 49
20.8.2013 0.01 0.02 0.01 0.02 0.61 0.8 2.0 420 > 70
11.9.2013 0.04 0.03 0.02 0.02 0.41 0.6 1.0 313 7
16.10.2013 0.01 0.01 0.01 0.01 0.66 0.7 5.4 522 26
Test Unit 2Samplingdate
NH4-N(lab)
NH4-N(field)
NO2-N(lab)
NO2-N(field)
NO3-N tot-N Cl eC Litres
10.10.2012 0.53 0.30 N/A 0.10 1.13 1.3 574 1911 27.5
25.10.2012 0.03 0.06 0.01 0.04 0.86 0.4 43 376 48
8.11.2012 0.04 0.01 0.03 0.08 0.32 0.5 11.5 251 28
30.4.2013 0.05 0.09 0.02 0.05 0.53 0.8 6.0 112 > 70
6.6.2013 0.02 0.07 0.01 0.04 0.97 1.0 4.0 218 21
3.7.2013 0.02 0.01 0.01 0.02 N/A 0.3 2.6 218 49
20.8.2013 0.01 0.02 0.02 0.03 0.34 0.5 1.4 197 > 70
11.9.2013 0.21 0.21 0.01 0.02 0.38 0.7 0.9 181 10
16.10.2013 <0.01 0.00 0.01 0.01 0.43 0.6 4.3 287 29

78
Figure 44. Total-Nitrogen and Chloride concentrations in the recharge waters ofTest Unit 1 and total-N of rainwater in Maaninka (monthly averages during the
years 2004–2012) measured by the Finnish Environment Institute.
Figure 45. Total-Nitrogen and Chloride concentrations in the recharge waters ofTest Unit 2 and total-N of rainwater in Maaninka (monthly averages during the
years 2004–2012) measured by the Finnish Environment Institute.
The measured residual concentrations left in the lysimeters after the follow-upperiod are presented in Table 11. The amount of water to fill Unit 1 was 380 litresand 440 litres for Unit 2 (i.e. the porosities were 38% and 44%). The weight of rockin the units was calculated by volume and density of the diabase (in Unit 1 approx-imately 1970 kg and in the Unit 2 approximately 1790 kg).
0
200
400
600
800
1000
0,0
0,5
1,0
1,5
2,0
2,5
3,0
Oct-12 Jan-13 Apr-13 Aug-13
mg/
l(Cl
)
mg/
l(to
t-N
)Test Unit 1
tot-N Rainwater tot-N Cl
0
200
400
600
800
1000
0,00,51,01,52,02,5
3,0
Oct-12 Jan-13 Apr-13 Aug-13
mg/
l(Cl
)
mg/
l(to
t-N
)
Test Unit 2
tot-N Rainwater tot-N Cl

79
Table 11. Wash water amounts and concentrations (mg/L) of tot-N, NH4-N (fieldand lab), NO2-N (field and lab), NO3-N and Cl of the test units. Unit 1 was filledwith tap water three times, Unit 2 only once. The tap water concentrations have
been subtracted.
SampleNH4-N(lab)
NH4-N(field)
NO2-N(lab)
NO2-N(field) NO3-N tot-N Cl
Water(L)
Test Unit 1
1st wash 0.01 0.21 0.03 0.11 0.0 0.1 0.2 380
2nd wash 0.00 0.01 0.00 0.00 0.0 0.1 0.0 380
3rd wash 0.00 N/A 0.01 0.00 0.0 0.0 0.0 380
Test Unit 2
1st wash 0.02 N/A 0.01 0.02 0.0 0.0 0.0 440
The amounts of total nitrogen released from the test units were calculated bymultiplying the amounts of water (litres) by the concentrations of total nitrogen(Table 12). The nitrogen concentrations of the first flush were determined by sub-tracting the background value (0.6 mg/L in October) from the measured concentra-tions. The first flush includes the first samplings in October 2012 when the concen-trations are higher than the background values of rainwater (Unit 1 10.10.2012and 25.10.2012, Unit 2 only 10.10.2012).
The total amount of explosives-originated nitrogen leached from the Test Unit 1was 138.8 mg i.e. 0.07 mg/kg and 32.5 mg i.e. 0.02 mg/kg for Test Unit 2. At theend of the test about half of the total nitrogen seemed to be left in the units afterone year of ageing. Presumably some traces of explosives originated nitrogen wasreleased also after the first flush, but the nitrogen concentrations were so close tothe background values in rain water that assessment of the exact numbers isdifficult. Also some small amounts were probably left in the stone material after thewashings. Considering the uncertainty factors, the scale of the explosives origi-nated nitrogen amount in the type of stone material used in this study is up toaround 0.1 mg/kg or 0.1 g/t. Multiplying this by the annual average amount of leftover stones (24 000 m3 i.e.73 920 t) at the target quarry results in an explosivesoriginated nitrogen load to runoff waters of around 7.4 kg/year from the waste rockpile (“worst case”).

80
Table 12. The amounts of total nitrogen released from the test units during firstflush and washing. *NH4-N+ NO2-N concentrations.
Sample tot-N (mg/L) Water (L) Released N (mg)
Test Unit 1
10.10.2012 1.9 28 53.2
25.10.2012 0.2 48 9.60
1st wash 0.1 380 38
2nd wash 0.1 380 38
3rd wash 0.0 380 0
Total N 138.8
Test Unit 2
10.10.2012 0.7 27.5 19.3
1st wash 0.03* 440 13.2
Total N 32.5
5.3 Discussion
The rock material in the test units presented a ”worst case”; real left over stonematerial contains more big boulders, so it has less surface area / kg (= less explo-sives-N / kg) than the finer material in the test units. Furthermore, because of thequarrying method not all of the left over stones have been in contact with explo-sives (approx. 50/50). This indicates that in practice the possible leaching from theleft over stones is small.
Left over stones produced by natural stone industry seem to contain less explo-sives-originated nitrogen than the waste rocks produced by larger mining activi-ties. For example waste rock at the Diavik diamond mine in Canada contains tot-Naround 4.6 mg/kg (Bailey et al. 2013), and the waste rock and ore at the Kemichromium mine around 20 mg/kg (Mattila et al. 2007).
The leaching tests conducted in this study apply for the K-pipecharge explo-sives used at the target quarry that contain relatively low amounts of nitrogen,about 4.2%. Different types of explosives exist for different purposes and theirnitrogen contents and solubility may vary. In general the nitrogen content of differ-ent rock blasting explosives varies between 20–30% of total weight (Chlot 2011).
Lysimeters were relatively small scale compared to the size fractions of normalwaste rock material, which gives uncertainty to the test setup. Also the explosiveresiduals are heterogeneously distributed in a waste rock material, as demonstrat-ed by the differences between the two test units in this study.

81
5.4 Laboratory scale studies
During loading of the field test vessels sub-samples were taken aside from thesame waste rock material and sent to VTT for laboratory scale comparison stud-ies. At the laboratory samples were crushed to particle size below 4 mm. Up-flowpercolation test CEN/TS 14405 was performed for the <4 mm material to study theleaching of N compounds.
The up-flow percolation test CEN/TS 14405 is used to simulate the leachingbehaviour of a granular or powdery material in placement conditions at differenttime frames. In the test granular material is packed into a vertical column withdiameter of 5 cm to a bed height of 30 cm. A peristaltic pump is used to passdemineralised water through the column. Liquid (the eluate) appearing at the out-let is collected in 7 fractions ranging from a liquid to solid (L/S) ratio of 0 l/kg to 10l/kg. The eluate fractions are filtered and prepared for subsequent chemical analy-sis. The results are expressed in terms of accumulated leached amounts (mg/kg)as a function of L/S. Time to reach a certain liquid to solid ratio at the site ofplacement can be roughly estimated when annual infiltration through the materialbed is known.
Figure 46 shows the evolution in leaching of N compounds from the waste rockmaterial. In this case the tests were stopped when cumulative L/S ratio of 2 wasreached. For comparison, results from the field test unit 1 are plotted alongside thelaboratory results for total nitrogen.
Figure 46. Leaching of N compounds from waste rock in up-flow percolation testand comparison to field test leaching.
0,00
0,10
0,20
0,30
0,40
0 1 2 3
mg/
kgni
trog
enle
ache
d
L/S, l/kg
NO3-N
NH4+-N
NO2-N
Ntot
Ntot field

82
It can be seen from Figure 46, that the leaching of total N in lab-scale is somewhathigher than in the field. They are however at the same order of magnitude.
5.5 Conclusion
Based on the observation period of more than a year the “first flush” of rechargewater from the natural stone quarrying waste rock occurs quickly, during the firstfew weeks, after which the nitrogen drainage settles to natural rainwater levels.Based on calculations the first flush removes approximately half of the total nitro-gen, mainly as NO3 and NH4.
Chloride, which is present in the pipecharge explosives as sodium chloride(Forcit Oy 2013), was observed to be a good indicator and representative of thefirst flush of recharge water, as the amount of Cl in waste rock does not increaseby an external source. Nitrogen, on the other hand, had a more erratic tail, asnatural rain water contains significant amounts of nitrogen species.
Calculations on the nitrogen leached out of the test units during the observationperiod and the remaining nitrogen detected on the rocks after the test period indi-cate that some explosive residuals remain within the test material. The remainingnitrogen is leached out fairly slowly, promoting also loss to the atmosphere.
The two seemingly identical units had different nitrogen concentrations, whichsuggest that the undetonated explosives are heterogeneously distributed in awaste rock pile.
The total amount of explosives-originated nitrogen on the waste rock material ofa natural stone quarry seems to be on the scale of 0.1 mg/kg or below, which iswell below the amount detected on the waste rock produced by a larger scalemine. The main reason for the difference is probably the moderate use of lownitrogen containing explosives in natural stone quarrying.
As the “nitrogen smudging” of natural stone quarrying left over stones is rela-tively low to begin with and enhanced by the rapid flushing by rainwater, the resi-dues of explosives should not be considered to prevent the utilization of otherwisemineralogically inert waste rocks of good technical quality.

83
6. Nitrogen balances at case study areas
Most of the nitrogen load produced by the extractive industry is originated from theuse of explosives. Explosives that remain unexploded after blasting are carriedalong with the ore, waste rock and dewatering water into different parts of the siteand to receiving water systems. Despite the importance of case studies for as-sessing nitrogen related risks in the extractive industry, there is a deficiency of welldocumented ones, especially in smaller scale activities. (Morin & Hutt 2009)
In this project the nitrogen migration routes and balances were studied at twocase study areas; Varpaisjärvi natural stone quarry and Kemi mine. The studyincluded sampling of the surface waters around the sites. The sampling and fieldand laboratory measurements are described in Chapter 5.
6.1 Varpaisjärvi natural stone quarry
The research target was a diabase quarry located in Varpaisjärvi, in the NorthernSavonia region of Finland (for more details, see Chapter 5). To evaluate the nitro-gen discharge from the mine site, the surface waters around the quarry were mon-itored from August 2012 to November 2013. The sampling points are presented inFigure 47 and the monitored concentrations and values in Table 13.

84
Figure 47. Surface water sampling points around the target quarry.

85
Table 13. Measured nitrogen and Cl concentrations (mg/L), eC (µS/cm) and pHaround the Varpaisjärvi quarry.
Background
Samplingdate
NH4-N(lab)
NH4-N(field)
NO2-N(lab)
NO2-N(field) NO3-N tot-N Cl eC pH
29.8.2012 0.02 0.03 N/A 0.05 <0.05 0.6 0.8 22 6.1
25.9.2012 0.02 0.03 0.02 0.04 <0.05 0.5 0.8 17 6.7
25.10.2012 0.02 0.07 0.03 0.06 0.23 0.5 0.8 27 6.1
30.4.2013 N/A N/A N/A N/A N/A N/A N/A N/A N/A
6.6.2013 0.03 0.10 <0.01 0.07 <0.09 0.5 0.8 29 7.9
3.7.2013 0.01 0.09 0.05 0.07 <0.05 0.8 0.6 33 6.5
20.8.2013 0.03 0.06 0.02 0.04 0.18 1.3 <0.4 34 5.2
16.10.2013 0.01 N/A 0.03 0.04 <0.05 0.8 0.6 35 6.5
Ditch 1 (next to the left over stone pile)Samplingdate
NH4-N(lab)
NH4-N(field)
NO2-N(lab)
NO2-N(field) NO3-N tot-N Cl eC pH
29.8.2012 0.12 0.15 N/A 0.07 0.18 1.1 5.7 98 6.4
25.9.2012 0.16 0.11 <0.01 0.03 0.16 1.1 3.6 62 6.2
25.10.2012 0.19 0.08 <0.01 0.04 0.27 1.2 1.2 53 5.8
30.4.2013 0.15 0.22 0.05 0.08 0.20 1.1 3 32 6
6.6.2013 0.26 0.30 0.02 0.08 <0.05 1.2 35 433 7.7
3.7.2013 0.16 0.21 <0.01 0.04 <0.05 1.1 13.2 337 6.2
20.8.2013 0.09 0.13 0.03 0.05 0.32 1.5 1.5 61 4.7
16.10.2013 0.16 N/A 0.02 0.02 0.41 1.1 11.1 145 6.5
Ditch 2 (near Lake Syväri)Samplingdate
NH4-N(lab)
NH4-N(field)
NO2-N(lab)
NO2-N(field) NO3-N tot-N Cl eC pH
29.8.2012 0.06 0.07 N/A 0.03 0.14 1.1 3.9 77 6.1
25.9.2012 0.09 0.06 <0.01 0.08 0.09 1.1 4.8 71 6
25.10.2012 0.14 0.05 <0.01 0.04 0.27 1.2 1.8 51 5.8
30.4.2013 0.17 0.15 0.03 0.06 0.26 1.2 2 27 5.8
6.6.2013 0.20 0.20 0.02 0.06 <0.05 1.1 32 441 6.8
3.7.2013 0.19 0.31 0.06 0.08 <0.05 1.4 9.1 268 6.5
20.8.2013 0.06 0.09 0.05 0.05 0.36 1.5 1.6 65 4.7
16.10.2013 N/A N/A N/A N/A N/A N/A N/A N/A N/A

86
Pit dewatering (drained to the left over stone pile)Samplingdate
NH4-N(lab)
NH4-N(field)
NO2-N(lab)
NO2-N(field) NO3-N tot-N Cl eC pH
3.7.2013 0.02 0.04 <0.01 0.02 <0.05 0.4 35.4 442 8.3
20.8.2013 0.01 0.09 0.04 0.07 0.63 1.0 14 354 7.1
11.9.2013 0.25 N/A 0.12 N/A 0.77 1.0 68 489 8.1
16.10.2013 8.54 N/A 0.21 0.38 10.2 19.0 137 741 7.7
20.11.2013 0.01 N/A <0.01 N/A 1.17 1.4 19 N/A N/A
Lake SyväriSamplingdate
NH4-N(lab)
NH4-N(field)
NO2-N(lab)
NO2-N(field) NO3-N tot-N Cl eC pH
3.7.2013 0.02 0.03 <0.01 0.02 <0.05 0.5 0.9 39 6.4
20.8.2013 0.01 0.02 0.02 0.01 <0.09 0.6 0.9 39 7.0
According to the results (Table 13), the average background concentration of tot-Nwas around 0.7 mg/l (forest trenches and rain water average), with seasonalchanges from 0.5 to 1.3 mg/l. The amount of tot-N in the trench flowing throughthe quarry site (Ditch 1) rises on average about 0.47 mg/l compared to the back-ground value, being 1.18 mg/l, with proportional and quantitative increase in NO3
and NH4. The quarry impact can also be detected as an increased amount of Cland electric conductivity. The average amount of tot-N in pit dewatering water was4.56 mg/l, in which the most abundant nitrogen species were NO3 (56%) and NH4
(39%). The measured tot-N concentrations in Lake Syväri were around 0.6 mg/l.The average proportions of different nitrogen species in background, pit de-
watering, ditch 1 and Lake Syväri samples are presented in Figure 48 (calculatedwith laboratory values). The average measured (laboratory) concentrations arepresented in Figure 49.

87
Figure 48. The average proportions of different nitrogen species in selectedsample points. The amount of organic nitrogen was calculated by subtracting NO2,
NO3 and NH4 values from tot-N value.

88
Figure 49. The average measured nitrogen concentrations (mg/L).
The average flow of the ditch was estimated to be around 4 litres / second. Theestimated annual nitrogen load from the target quarry to Lake Syväri can be calcu-

89
lated by multiplying the flow (4 l/s) by the average input of tot-N by the quarry(0.47 mg/l), which results in a nitrogen load of around 59 kg/year.
An assessment of the nitrogen load can be made also by calculating the drain-age from the waste rock pile and pit dewatering. No data exists concerning theamount of pit dewatering water, but an estimation can be made by multiplying theaverage annual precipitation 650 mm (Ilmatieteen laitos 2014), the pit area 24 000m2, and a “rule of thumb” evaporation of 50% (Mustonen 1986), which results in7800 m3 of water. Multiplying this amount of water with the average tot-N concen-tration of 3.9 mg/l (4.56 mg/l minus the average rain water concentration of 0.7mg/l), explosives originated nitrogen load caused by dewatering can be estimatedto be around 30.4 kg/year. The nitrogen load from the waste rock pile of the targetquarry was estimated to be around 7.4 kg/year (Chapter 5). Combining the de-watering and waste rock pile drainages, the total estimated nitrogen load of thetarget quarry is around 38 kg/year.
Both estimations include obvious uncertainties, but the order of magnitude ofthe nitrogen load can be expected to be tens of kilograms / year. The results alsosuggest that pit dewatering water is the main source of explosives originated ni-trogen, while emissions from the waste rock pile have a smaller role.
At the target quarry about 5 700 kg of K-pipecharges are used annually. The ni-trogen concentration of average K-pipecharge explosive is 4.2%, which results in239 kg of tot-N per year. The estimations on nitrogen load calculated above indi-cate that 16–25% of nitrogen used in natural stone blasting is leached into drain-ages.
6.2 Kemi mine
The Kemi chromium mine is located in North-West Finland, some kilometres northof the city of Kemi. The production started in 1968, first in open pit mining butgradually transferred underground during the early 2000’s. Today the mine oper-ates fully underground and the production has been increasing. In 2013 the mineproduced over 1.7 Mt of chromium ore, the total extraction being around 2.7 Mt.While moving underground, the amount of piled waste rock has been decreasingas the empty stopes are filled with barren rock. (Outokumpu Chrome Oy 2014)
The mine waters (mine area drainage, process water and mine dewatering wa-ter) are directed to a pond system, from where some water is circulated back tothe mine processes and the rest is further discharged into dike Iso-Ruonanoja.The annual nitrogen load is estimated by comparing the nitrogen concentrations inbackground samples and the samples taken from Iso-Ruonanoja downstreamfrom the mine area. The Kemi mine site, including the tailings area and settlingponds, water routes, background sampling point and the sample point down-stream from the mine area is presented in Figure 50. (Outokumpu Chrome Oy2013)

90
Figure 50. The Kemi mine site and water routes.
According to Mattila et al. (2007) and Tuokila (2008) the main nitrogen inputs tothe pond system are the process water from the refinery and the mine dewatering.To evaluate the nitrogen balances at the pond system water samples were takenin June 2013 and additional nitrogen data was obtained from the OutokumpuCompany and the Hertta database of Finland’s environmental administration. Theanalytical results are presented in Table 14. Figure 51 presents how the totalnitrogen concentration and proportions of different nitrogen species vary from thefirst pond to the last in different seasons of the year. Figure 52 presents the sea-sonal change of nitrogen concentrations in the dike Iso-Ruonanoja, downstreamfrom the mine.

91
Table 14. Measured nitrogen and Cl concentrations, eC and pH along the watersystem of the Kemi mine. Concentrations mg/L, eC µS/cm.
Kemi mine, 13.6.2013
SampleNH4-N(lab)
NH4-N(field)
NO2-N(lab)
NO2-N(field) NO3-N tot-N Cl eC pH
Dewatering 4.81 x 1.7 x 46.09 55.0 1085 3780 8.0
Enrichment
plant 3.73 x 0.30 x 13.22 17.0 123 825 9.2
Pond 7 0.30 0.31 0.09 0.11 5.06 6.1 151 794 8.3
Pond 4 0.03 0.04 0.05 0.06 2.55 2.7 129 747 9.2
Pond 5 0.02 0.03 0.03 0.03 1.73 1.8 103 605 9.0
Kemi mine, 17.9.2012 (by Nablabs Oy in 2012)
SampleNH4-N(lab)
NO2,3-N(lab) tot-N
Dewatering 2.90 32.00 35.0
Enrichment
plant 1.70 5.80 7.5
Pond 7 0.07 1.40 2.0
Pond 4 0.06 0.26 2.8
Pond 5 0.03 <0.005 0.9
Kemi mine, 15.1.2013 (by Nablabs Oy in 2013)
SampleNH4-N(lab)
NO2,3-N(lab) tot-N
Pond 7 1.30 5.00 6.8
Pond 4 0.41 1.20 1.8
Pond 5 0.67 1.70 2.8

92
Figure 51. The total nitrogen concentration and proportions of different nitrogenspecies vary from the first pond to the last in different seasons of the year. Theamount of organic nitrogen was calculated by subtracting NO2, NO3 and NH4
values from tot-N value.

93
Figure 52. Seasonal variation of total nitrogen, NO2+3 and NH4 concentrations inthe dike Iso-Ruonanoja, downstream from the Kemi mine. Concentrations and icecover data from Hertta database (sample place name: ISO-RUONAOJA, KAIVOS
AP, samples taken and analysed by NabLabs Oy).
In general the concentrations of total nitrogen and mineral nitrogen speciesdecrease along the watersystem from Pond 7 to Pond 5, also during winter. Theseasonal data indicates that the pond system’s ability to remove mineral nitrogenspecies (NO2, NO3, and NH4) is at its highest level during late summer andautumn, from July to November, when the vegetation is full-grown. The amount ofnitrogen, especially NO2+3 and NH4 concentrations, increase significally during icecover. The concentration levels begin to drop in spring when biological activityincreases.
The results support the estimation of Mattila et al. (2007) that the total in situremoval of nitrogen in the pond system is around 58% annually. The key elementsfor nitrogen removal at the pond system are long retention time and richvegetation that provides a carbon source for denitrifying processes (Mattila et al.2007).
In general, estimations of how much nitrogen of the total nitrogen in theexplosives end up into the environment vary between 0.2% and 28%, the averageof underground metal mines being around 10% or higher (Morin & Hutt 2009,Kauppila et al. 2011).
Data about the use of explosives, extracted rock material, measured nitrogenconcentrations and precipitation during the years 2007-2013 was obtained fromthe mining company and is presented in Table 15. The amount of nitrogen in theexplosives mainly used (Kemiitti 810) is estimated to be 28%. The nitrogen loadsto the environment have been estimated by comparing background values andconcentrations after the mine (Outokumpu Chrome Oy2014).

94
Table 15. Data about used explosives, extracted material, measured nitrogenamounts and precipitation at the Kemi mine during 2007–2013.
Year
Explo-sivesused (t)
Explo-sives-N(kg)
Extracted(t)
Explo-sives /extracted(kg/t)
tot-N load(kg), byPöyry
Explosives-Nto environ-ment (%)
Precipita-tion (mm)
2007 679 190120 1611682 0.42 10376 5.5 710.1
2008 740 207200 1822408 0.41 10023 4.8 666.0
2009 379 106120 712780 0.53 6555 6.2 486.6
2010 898 251440 2052901 0.44 5786 2.3 545.2
2011 1120.6 313768 2264147 0.49 9457 3.0 754.5
2012 915.1 256228 1901269 0.48 21283 8.3 864.2
2013 1333.2 373296 2684182 0.50 17233 4.6 640.6
The measured nitrogen loads suggest that an average of 5% of total nitrogen inexplosives ends up to the water system below the Kemi mine, ranging annuallyfrom 2.3 to 8.3%.
6.3 Conclusions
Nitrogen contamination of natural stone quarrying is relatively low (tens of kilo-grams per year) compared to larger mining activities (thousands of kilograms peryear), which is obvious when taking into account the amounts of explosives used.For further comparison, annual nitrogen drainage from agriculture is estimated tobe 8–20 kg/ha (Rekolainen 1992). Based on the relatively small nitrogen load ofthe natural stone quarrying the need for additional nitrogen purification is ques-tionable.
Although some undetonated explosives are carried to the waste rock pilesalong with the stone material, the main sources of nitrogen loads are process anddewatering waters, irrespective of the scale of mining activity.
Type of the explosives used affects the relative amount of leached nitrogen.The calculations on nitrogen released from the target quarry in Varpaisjärvi corre-spond to a 16–25% loss of nitrogen from blasting explosives used commonly innatural stone extraction. At the Kemi mine the loss of nitrogen of the emulsion typeexplosive is probably around 10%, but the efficient pond system together withclosed process water circulation reduces the amount of explosives-originatednitrogen ending up to the water system to 5%. The pond system’s efficiency hasseasonal variation; natural biological processes remove inorganic nitrogen wellduring summer and autumn, but the amount of nitrogen, especially NO2+3 and NH4
concentrations, increases significantly during ice cover and remains high until thevegetation is full-grown. If the water reservoir has to be emptied during winter or

95
spring, the mineral nitrogen load to environment will be higher. Another importantaspect regarding the annual nitrogen load to the environment seems to be theamount of precipitation; excess of water leaches more nitrogen and complicatesthe water management at the mine site.

96
7. Conclusions
The natural nitrogen cycle is of crucial importance to living organisms. Atmospher-ic nitrogen is converted to nitrate ions through lightning storms and nitrogen fixingbacteria. The nitrates fertilize plant growth whereby N becomes bound in com-pounds (amino acids, DNA and proteins) that can be consumed by animals. Overtime, the nitrogen from plants and animals is returned to the soil and atmosphere.However, the excessive release of nutrients from municipalities and industrialactivities to the environment can cause eutrophication in the receiving waterways.Nitrate ion is the primary source of nitrogen for aquatic plants, thus inducing eu-trophication. Ammonia is toxic for aquatic animals in relatively low concentrations.Also nitrate can be toxic in elevated levels.
The concentration of nitrogen compounds in groundwater and surface water isnormally low, but can reach higher levels, if it is contaminated by human activities(CCME 2012). Anthropogenic sources of nitrogen compounds in water includeagricultural fertilizers, manure, domestic sewage, biowaste, industrial wastewatersfrom e.g. fertilizer plants, food industry, oil refineries and chemical production, aswell as precipitation.
Extractive industries, including mining and quarrying operations is one of thesectors where the spreading of nitrogenous compounds into water and their incor-poration into mineral materials can be a challenge. Most minerals and rocks con-tain very low concentrations of nitrogenous compounds. However, typical explo-sives and leaching processes, especially cyanide leaching, used in mining activi-ties can produce a range of nitrogen-containing compounds of environmentalconcern.
Once in environment, nitrogen can convert to different species (nitrate, nitrite,ammonium, nitrogen gas), depending on the redox conditions and biological activi-ties. In the Nordic conditions, the seasonal variations in precipitation and tempera-ture may play a significant role in the nitrogen loading and transformations.
Because of the complex behaviour and sensitive environments, it is importantto minimise the nitrogen discharges to the environment by using good manage-ment practices and by developing cost effective water treatment techniques.

97
7.1 Nitrogen management procedure
First estimation of the nitrogen balance and nitrogen load into the environment iscarried out in the planning stage of the activity. The first estimate of impacts is alsomade, including predicted concentrations and their influence in the recipients. Theinformation needed for the assessment includes quantities and types of explosivesas well as other nitrogen containing chemicals, process, water and solid materialflow schemes, background concentrations of nitrogen compounds, sensitivity ofthe local ecosystem to nitrogen as well as the other local nitrogen sources. Nor-mally this data is also needed for the Environmental Impact Assessment (if theactivity is subject to the EIA procedure) and environmental permissions.
In later stages the calculations should be revised based on the more exact dataabout the use of explosives and other nitrogen containing chemicals and themeasured environmental loads.As an example, the main stages of the nitrogen management procedure for explo-sive originated N compounds are described below (Figure 53, Figure 54). Typicalvalues of the parameters needed in the estimation of the nitrogen load in blastingare given in Table 16.

98
Figure 53. Nitrogen management procedure for explosive originated nitrogencompounds.
Compilation of the data on the state of recipients and local environment•Existing nitrogen sources and their impact to the recipients, existing N levels in the recipients•Sensitivity of recipients:
•are sensitive aquatic animals found, such as salmon fish, mussels•sensitivity to eutrophication, limiting nutrient (TN:TP ratio)•temperature variation and pH of the recipient water (determines NH3:NH4 ratio/ toxicity to
aquatic animals)
Estimation of the N compound levels in waste rock, tailings and in thedischarge waters based on:•Type of activity (mining, quarrying, underground, surface..)•Quantity and properties of the rock•Explosive type(s) used, their nitrogen content•Process scheme, quantities of products, waste rock and tailings•Water flow scheme and volumes of water discharges•Release of N compounds to air
Estimation of the impact of discharges to the N levels in recipients based onthe predicted N concentrations in discharge flow(s) and dilution•Release of N from the waste area and estimated impact to concentrations of N compounds in
the waters•Estimated concentrations in the discharged process water as well as drying waters (if
discharged) and other potential N containing water flows•Dilution during the transport and in the recipient
Assessment of the potential impacts of discharges as well as need to reducethem•Comparison of the estimated recipient water quality with existing water quality requirements
and other water quality indicators
Identification and evaluation of alternatives for reduction of N discharges asa part of the activity's water management plan

99
Figure 54. Identification and evaluation of alternatives for reduction of N discharges.
Minimisation of N release to water and solid materials•Good explosives management and blasting practices
•selection of explosives•minimisation of spills in all explosive handling stages•tight control of explosive quality•best possible loading and blasting practices•education, regular monitoring and control of the activities
•Collection of runoff water from waste rock areas and sufficient prevention of seepage togroundwater
Reduction of the amount of the water that will be contaminated by recycling,by separation of water streams, by optimal location of the potential watertreatment plants.•Planning of nitrogen management integrated to the water management planning of the activity
Evaluation of the possibilities for “natural” reduction of ammonium-N(volatilisation, nitrification)•Increasing retention time in the ponds•pH > 8•Better aeration•More challenging in cold environments
Evaluation of the feasibility of nitrogen removal technologies•Integration to the water treatment system of the mine and optimal locations for nitrogen
removal in the processing chain needs to be considered. E.g. following solutions may be used•anaerobic passive systems (reactive barriers) for nitrates•electrochemical, biological or sorption technologies•membrane technologies

100
Table 16. Typical values of the parameters needed in the calculation of nitrogenload from blasting.
Component Type Typical values Background infor-mation
Nitrogen contentof explosives,weight %
Emulsified explo-sives
25–28% Typical composition:70–80% NH4NO3, 10–20% water, ca. 4% oil,1–2% additives
ANFO ca. 33% 94.5%, 5.5% fuel oilDynamite basedcartridges
20–30% Nitroglycerol or nitro-glycol, diatomite orother impregnationmaterial, plastic tubes
Typical explosiveuse
Open pit mining 1 kg/m3 rock(0.5–1.2 kg/m3)
Undergroundmining
1.5–2.5 kg/m3 rock
Non-detonated, % Open pit mining 2.5–3%Undergroundmining
10–20% 10–12% with specificattention to blasting,loading and storagepractices
Specific densitiesof rock, examples(SImetric)
Crushed wasterock (most typical)
1.5–2.2 t/m3
Gneiss, crushed 1.8 t/m3
Gneiss, solid 2.6–2.9 t/m3
Granite, crushed 1.6–1.7 t/m3
Granite, solid 2.6–2.7 t/m3
Pyrites 2.4–5.0 t/m3
Copper ore 1.9–2.6 t/m3 Depends on mineralcomposition
Iron ore, crushed ca 2.1–2.9 t/m3
7.2 Nitrogen removal technologies
Nitrogen removal from water is a common process in municipal and industrialwastewater treatment. In mining activities, no specific nitrogen removal or treat-ment unit, apart from cyanide destruction, has been conventionally used to treatwastewater. Thus, nitrogen is usually mitigated through wetlands treatment, dilu-tion and natural attenuation and is usually in an oxidized nitrate form when enter-ing the environment.

101
In municipal and industrial wastewater treatment nitrogen is most commonlyremoved by biological nitrification and denitrification, and air stripping, respective-ly. Neither of these technologies is, however, readily suited for subarctic miningwastewater applications due to low organics concentration, low temperature, highvolume and low ammonium concentration.
A selection of other technologies for nitrogen removal from wastewater havebeen developed and also commercialized. These include membrane separation,wetland treatment (physical), anammox reactors and autotrophic denitrificationreactors (biological), catalytic denitrification, electrochemical treatment options andsorption technologies (chemical). Based on a literature review, selective sorptionand electrochemically assisted membrane separation were identified as mostpromising technologies for subarctic mining wastewaters, as well as biologicaltreatment, if it could be operated on mine wastewater in cold climates.
TUT tested the denitrification and nitrification of mine wastewater in separatelaboratory scale bioreactors and the inhibition of pH, temperature and metal ions.The outcomes revealed that denitrification was possible at low pH (2.5) and tem-peratures as low as 7°C. Nitrification was more pH sensitive as ammonium oxida-tion was partially inhibited already at pH 6.5. Both processes tolerated metals (Fe,Ni, Co and As) typically present in mine processing waters and acid mine drain-age.
VTT and GTK tested the selective adsorption of nitrogen compounds. Whiletests with nitrate adsorption gave discouraging results, selective ammonium sorp-tion using natural zeolite ion exchange worked well and complete ammoniumremoval from real mine wastewater was achieved with a hydraulic retention time of2 minutes, with complete regeneration. Zeolite sorption is identified as a feasibleammonium removal method for mine wastewaters.
VTT also developed a novel electropervaporative nitrogen capture technologythat can recover nitrate and ammonium nitrogen from a water stream simultane-ously as pure ammonia gas. The technology is patented, but is still in a develop-ment stage for real scale applications. For simulated mine wastewater completenitrogen removal and capture as ammonia was achieved with an energy cost ofapp. 40 $/kg N. Further material and technology development could potentiallyreduce the cost close to 1 $/kg N, which would make it an economically feasibletechnology for large mine wastewater streams. VTT will continue the developmentof the technology in continuing projects.
The technology review, testing and development showed that a wide range oftechnologies exist for nitrogen removal, but no direct full scale technology refer-ences were directly applicable for subarctic mine conditions, and further largerscale testing and development of novel sorption, electrochemical or biologicaltechnologies is required to ensure their feasibility in a real mining site. While nitro-gen removal is not technically limited, the mining water quantity makes the cost ofremoval a key question in assessing the feasibility of the technologies.

102
7.3 Nitrogen balances and flushing
The left over stones produced by natural stone quarrying seem to be relativelynitrogen free. Based on the observation period of more than a year at the targetquarry, the “first flush” of recharge water from the left over stones occurs shortly,during the first few weeks after the detonation, after which the nitrogen drainagesettles to natural rainwater levels. Based on calculations the first flush removesapproximately half of the total nitrogen, mainly in NO3 and NH4 forms.
Chloride was observed to be a good indicator and representative of the firstflush of recharge water, as the amount of Cl in waste rock does not increase by anexternal source. Nitrogen, on the other hand, had a more erratic tail, as naturalrain water contains significant amounts of nitrogen species.
Calculations on the nitrogen leached out of the test units during the observationperiod and the remaining nitrogen detected on the rocks after the test period indi-cate that some explosive residuals remain within the test material. The remainingnitrogen is leached out fairly slowly, promoting also loss to the atmosphere.
The two seemingly identical units had different nitrogen concentrations, whichsuggest that the undetonated explosives are heterogeneously distributed in awaste rock pile.
The total amount of explosives-originated nitrogen on the waste rock material ofa natural stone quarry seems to be on the scale of 0.1 mg/kg or below, which iswell below the amount detected on the waste rock produced by larger scale min-ing activities. The main reason for the difference is probably the moderate use oflow nitrogen containing explosives in natural stone quarrying.
As the “nitrogen smudging” of natural stone quarrying left over stones is rela-tively low to begin with and enhanced by the rapid flushing by rainwater, the resi-dues of explosives should not be considered to prevent the utilization of otherwisemineralogically inert waste rocks of good technical quality.
Nitrogen load of natural stone quarrying is relatively low (tens of kilograms peryear) compared to larger mining activities (thousands of kilograms per year),which is obvious when taking into account the amounts of explosives used. Basedon the relatively small nitrogen load of the natural stone quarrying the need foradditional nitrogen purification is questionable.
Although some undetonated explosives are carried to the waste rock pilesalong with the stone material, the main sources of nitrogen loads are process anddewatering waters, irrespective of the scale of activity.
Type of the explosives used influences the relative amount of leached nitrogen.The calculations on nitrogen released from the target quarry in Varpaisjärvi corre-spond to a 16–25% loss of nitrogen from blasting explosives commonly used innatural stone extraction. At the Kemi mine the loss of nitrogen of the emulsion typeexplosive is probably around 10%, but the efficient pond system reduces theamount of nitrogen ending up to the water system to 5%. The pond system’s effi-ciency has seasonal changes; natural biological processes remove inorganicnitrogen well during summer and autumn, but the amount of nitrogen, especiallyNO2+3 and NH4 concentrations, increases significantly during ice cover and re-

103
mains high until the vegetation is full-grown. If the water reservoir has to be emp-tied during winter or spring, the mineral nitrogen concentrations will be higher.Another important aspect regarding the annual nitrogen load to the environmentseems to be the amount of precipitation; excess of water leaches more nitrogenand complicates the water management at the mine site.
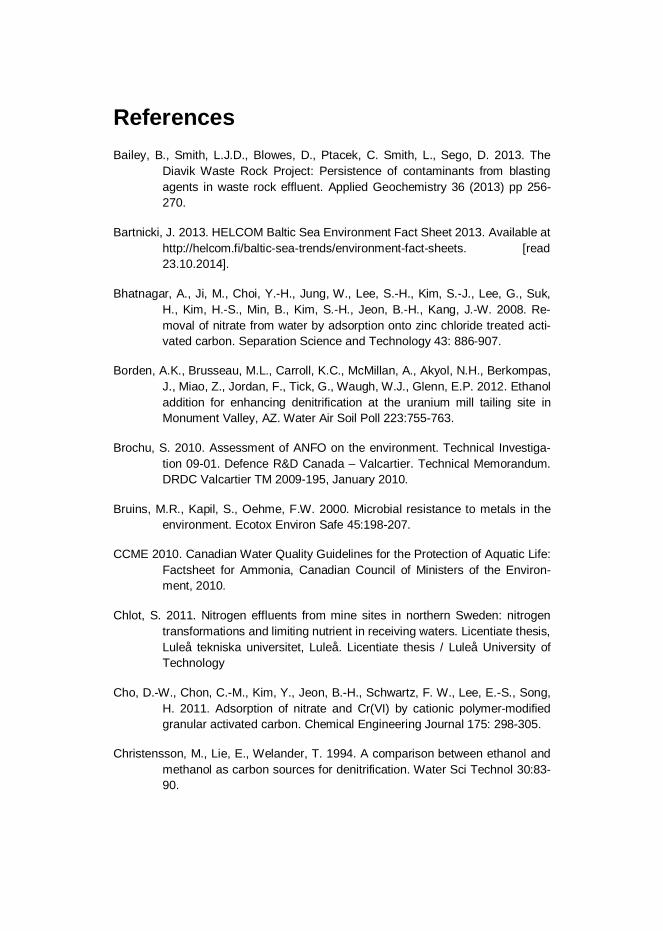
ReferencesBailey, B., Smith, L.J.D., Blowes, D., Ptacek, C. Smith, L., Sego, D. 2013. The
Diavik Waste Rock Project: Persistence of contaminants from blastingagents in waste rock effluent. Applied Geochemistry 36 (2013) pp 256-270.
Bartnicki, J. 2013. HELCOM Baltic Sea Environment Fact Sheet 2013. Available athttp://helcom.fi/baltic-sea-trends/environment-fact-sheets. [read23.10.2014].
Bhatnagar, A., Ji, M., Choi, Y.-H., Jung, W., Lee, S.-H., Kim, S.-J., Lee, G., Suk,H., Kim, H.-S., Min, B., Kim, S.-H., Jeon, B.-H., Kang, J.-W. 2008. Re-moval of nitrate from water by adsorption onto zinc chloride treated acti-vated carbon. Separation Science and Technology 43: 886-907.
Borden, A.K., Brusseau, M.L., Carroll, K.C., McMillan, A., Akyol, N.H., Berkompas,J., Miao, Z., Jordan, F., Tick, G., Waugh, W.J., Glenn, E.P. 2012. Ethanoladdition for enhancing denitrification at the uranium mill tailing site inMonument Valley, AZ. Water Air Soil Poll 223:755-763.
Brochu, S. 2010. Assessment of ANFO on the environment. Technical Investiga-tion 09-01. Defence R&D Canada – Valcartier. Technical Memorandum.DRDC Valcartier TM 2009-195, January 2010.
Bruins, M.R., Kapil, S., Oehme, F.W. 2000. Microbial resistance to metals in theenvironment. Ecotox Environ Safe 45:198-207.
CCME 2010. Canadian Water Quality Guidelines for the Protection of Aquatic Life:Factsheet for Ammonia, Canadian Council of Ministers of the Environ-ment, 2010.
Chlot, S. 2011. Nitrogen effluents from mine sites in northern Sweden: nitrogentransformations and limiting nutrient in receiving waters. Licentiate thesis,Luleå tekniska universitet, Luleå. Licentiate thesis / Luleå University ofTechnology
Cho, D.-W., Chon, C.-M., Kim, Y., Jeon, B.-H., Schwartz, F. W., Lee, E.-S., Song,H. 2011. Adsorption of nitrate and Cr(VI) by cationic polymer-modifiedgranular activated carbon. Chemical Engineering Journal 175: 298-305.
Christensson, M., Lie, E., Welander, T. 1994. A comparison between ethanol andmethanol as carbon sources for denitrification. Water Sci Technol 30:83-90.

Chung, B.S., Ryu, S.H., Park, M., Jeon, Y., Chung, Y.R., Jeon, C.O. 2007. Hy-drogenopha-ga caeni sp. nov., isolated from activated sludge. Int J SystEvol Micr 57:1126-1130.
Dahab, M.F., Lee, Y.W. 1988. Nitrate removal from water supplies using biologicaldenitrification. J Water Pollut Cont Fed 60:1670-1674.
Daims, H., Nielsen, J.L., Nielsen, P.H., Schleifer, K.H., Wagner, M. 2001. In situcharacterization of Nitrospira-like nitrite-oxidizing bacteria active inwastewater treatment plants. Appl Environ Microbiol 67:5273-5284.
Devlin, J.F., Eedy, R., Butler, B.J. 2000. The effects of electron donor and granulariron on nitrate transformation rates in sediments from a municipal watersupply aquifer. J Contam Hydrol 46:81-97.
dos Santos, S.G., Amancio Varesche, M.B., Zaiat, M., Foresti, E. 2004. Compari-son of methanol, ethanol, and methane as electron donors for denitrifica-tion. Environ Eng Sci 21:313-320.
Du, Q., liu, S., Cao, Z., Wang, Y. 2005. Ammonia removal from aqueous solutionusing Chinese clinoptilolate. Separation and purification Technology 44:229-234.
Ducey, T.F., Vanotti, M.B., Shriner, A.D., Szogi, A.A., Ellison, A.Q. 2010. Charac-terization of a microbial community capable of nitrification at cold tem-perature. Bioresource Technol 101:491-500.
Finland's Mineral Strategy 2010. Available:http://projects.gtk.fi/export/sites/projects/mineraalistrategia/documents/FinlandsMineralsStrategy_2.pdf
Forcit 2010. Ympäristöasiaa. Ympäristöesite. February 2010. Available:http://www.forcit.fi/tietoa-yrityksesta/ymparisto (in Finnish)
Forcit Oy 2013. K-pipecharge / KK-pipecharge Product information version02.04.2013.
Forsberg, H., Åkerlund, H. 1999. Kväve och sprängämnerester i LKAB:s malm-,gråbergs- och produktflöden. MSc Thesis. Luleå tekniska universitet. 116p. ISSN 1402-1617. (in Swedish)
Forsyth, B., Cameron, A., Miller, S. 1995. Explosives and water quality. Sudbury’95, Mining and the environment, Sudbury Canada. Pp. 795-803.
Gadd, G.M. 2010. Metals, minerals and microbes: geomicrobiology and bioreme-diation. Microbiology 156:609-643.

Gayle, B.P., Boardman, G.D., Sherrard, J.H., Benoit, R.E. 1989. Biological denitri-fication of water. J Environ Eng 115:930-943.
Gikas, P. 2007. Kinetic responses of activated sludge to individual and joint nickel(Ni (II)) and cobalt (Co (II)): an isobolographic approach. J Hazard Mater143:246-256.
Giller, K.E., Witter, E., McGrath, S.P. 2009. Heavy metals and soil microbes. SoilBiol Biochem 41:2031-2037.
Guan, H., Bestland, E., Zhu, C., Albertsdottir, D., Hutson, J., Simmons, C.T., Gin-ic-Markovic, M., Tao, X., Ellis, A.V., 2010. Variation in performance ofsurfactant loading and resulting nitrate removal among four selected nat-ural zeolites. Journal of Hazardous Materials 183:616-621.
Halonen, T. 2012. Forcit Oy. Personal communication 5.9.2012.
Hernesniemi, H., Berg-Andersson, B., Rantala, O., Suni, P. 2011. Kalliosta kullak-si, kummusta klusteriksi. Suomen mineraaliklusterin vaikuttavuusselvitys.Elinkeinoelämän Tutkimuslaitos ETLA. Kustantaja: Taloustieto Oy.
Holtan-Hartwig, L., Bechmann, M., Risnes Høyås, T., Linjordet, R., Reier Bakken,L. 2002. Heavy metals tolerance of soil denitrifying communities: N2Odynamics. Soil Biol Biochem 34:1181-1190.
Horn, M.A., Ihssen, J., Matthies, C., Schramm, A., Acker, G., Drake, H.L. 2005.Dechloromonas denitrificans sp. nov., Flavobacterium denitrificans sp.nov., Paenibacillus anaericanus sp. nov. and Paenibacillus terrae strainMH72, N2O-producing bacteria isolated from the gut of the earthwormAporrectodea caliginosa. Int J Syst Evol Micr 55:1255-1265.
Hovanec, T.A., Taylor, L.T., Blakis, A., Delong, E.F. 1998. Nitrospira-like bacteriaasso-ciated with nitrite oxidation in freshwater aquaria. Appl Environ Mic-rob 64:258-264.
Häyrynen, K., Langwaldt, J., Pongrácz, E., Väisänen, V., Mänttäri, M., Keiski, R.L.2008. Separation of nutrients from mine water by reverse osmosis forsubsequent biological treatment. Minerals Engineering 21(1):2-9.
Ilmatieteen laitos 2014. “Vuositilastot”, retrieved August 20, 2014, fromhttp://ilmatieteenlaitos.fi/vuositilastot
Jermakka, J., Wendling, L., Sohlberg, E., Heinonen, H., Laine-Ylijoki, J., Merta, E.,Kaartinen, T., Mroueh, U.-M. 2015. Nitrogen compounds at mines andquarries. Sources, behaviour and removal from mine and quarry waters.Literature study. VTT Technology. VTT, Espoo.

Jermakka, J., Wendling, L., Sohlberg, E., Heinonen, H., Vikman, M. 2014. Poten-tial Technologies for the Removal and Recovery of Nitrogen Compoundsfrom Mine and Quarry Waters in Subarctic Conditions. Critical Reviews inEnvironmental Science and Technology. In press.DOI:10.1080/10643389.2014.900238.
Kananoja, T., Pokki, J., Ahtola, T., Hyvärinen, J., Kallio, J., Kinnunen, K., Luodes,H., Sarapää, O., Tuusjärvi, M., Törmänen, T., Virtanen, K. 2013. Geolo-gisten luonnonvarojen hyödyntäminen Suomessa vuonna 2011. GTKTutkimusraportti 203.
Kauppila, P., Räisänen, M., Myllyoja, S. 2011. Metallimalmikaivostoiminnan par-haat ympäristökäytännöt. Suomen Ympäristö 29/2011. (in Finnish)
Kinnunen, P.H.M., Puhakka, J.A. 2004. High-rate ferric sulfate generation by aLeptospirillum ferriphilum-dominated biofilm and the role of jarosite in bi-omass retainment in a fluidized-bed reactor. Biotechnol. Bioeng. 85, 697-705.
Leap, A., Achermann, B., Billen, G., Bleeker, A., Bouwman, A., de Vries, W.,Dragosits, U., Döring, U., Fernall, D., Geupel, M., Herolstab, J., Johnes,P., Le Gall, A., Monni, S., Neve al, R., Orlandini, L., Prud’homme, M.,Reuter, H., Simpson, D., Seufert, G., Spranger, T., Sutton, M., vanAardenne, J., Voß, M., Winiwarter, W. 2011 Integrating nitrogen fluxes atthe European Scale. In: Sutton, Mark A., Howard, Clare M., Erisman, JanW., Billen, G., Bleeker, A., Grennfelt, P., Grinsven H., Grizzetti, B. 2011.The European Nitrogen Assessment. Cambridge University Press.
Li, Z., 2003. Use of surfactant-modified zeolite as fertilizer carriers to control ni-trate release. Microporous and Mesoporous Materials 61:181-188.
Margaert, J., Cnockaert, M.C., Swings, J. 2003. Thermomonas fusca sp. nov. andThermomonas brevis sp. nov., two mesophilic species isolated from adenitrification reactor with poly( -caprolactone) plastic granules as fixedbed, and emended description of the genus Thermomonas. Int J SystEvol Micr 53:1961-1966.
Martin, D., Salminen, J.M., Niemi, R.M., Heiskanen, I.M., Valve, M.J., Hellstén,P.P., Nystén, T.H. 2009. Acetate and ethanol as potential enhancers oflow tempera-ture denitrification in soil contaminated by fur farms: a pilot-scale study. J Hazard Mater 163:1230-1238.
Mattila, K., Zaitsev, G., Langwaldt, J. 2007. Biological removal of nutrients from minewaters. Biologinen ravinteiden poisto kaivosvedestä. Kaira-hankkeen lop-puraportti. Metla, Rovaniemi. 99 s. ISBN 978-951-40-2060-5.

Morin, K., Hutt, N. 2009. Mine-Water Leaching of Nitrogen Species from ExplosiveResidues. Proceedings of GeoHalifax 2009, the 62nd Canadian Ge-otechnical Conference and 10th Joint CGS/IAH-CNC Groundwater Con-ference, Halifax, Nova Scotia, Canada, September 20-24, pp. 1549-1553.
Mustonen, S. (Ed.) 1986. Sovellettu hydrologia, Vesiyhdistys ry, Helsinki.
Namasivayam, C., Sangeetha, D. 2005. Removal and recovery of nitrate fromwater by ZnCl2 activated carbon from coconut coir pith, an agriculturalsolid waste. Indian Journal of Chemical Technology 12: 513-521.
Nielsen, J.L., Nielsen, P.H. 1998. Microbial nitrate-dependent oxidation of ferrousiron in activated sludge. Environ Sci Technol 32:3556-3561.
OAMK 2007. Räjäytystekniikka. Opintojakso 1, Räjähdysaineet.
Ochoa-Herrera, V., Leo´n, G., Banihani, Q., Field, J.A.,, Sierra-Alvarez, R., 2011Toxicity of copper (II) ions to microorganisms in biological wastewatertreatment systems. Sci Total Environ 412–413:380–385
Onyango, M.S., Masukume, M., Ochieng, A., Otieno, F. 2010. Functionalisednatural zeolite and its potential for treating drinking water containing ex-cess amount of nitrate. Water SA 36(5): 655-662.
Outokumpu Chrome Oy 2013. Kemin kaivoksen ympäristöluvan muutoshakemus2.1.2013.
Outokumpu Chrome Oy 2014. Outokumpu Chrome Oy Kemin kaivoksen ympäris-tönsuojelun vuosiyhteenveto vuodelta 2013.
Papirio, S., Ylinen, A., Zou, G., Peltola, M., Esposito, G., Puhakka, J.A. 2014a.Fluidized-bed denitrification for mine waters. Part I: low pH and tempera-ture operation. Biodegradation 25, 425-435.
Papirio, S., Zou, G., Ylinen, A., Di Capua, F., Pirozzi, F., Puhakka, J.A. 2014.Effect of arsenic on nitrification of simulated mining water. BioresourceTechnol (submitted).
PSAVI 2011a. Pohjois-Suomen Aluehallintovirasto. Lupapäätös Nro 36/2014/1,Dnro PSAVI/58/04.08/2011. Talvivaaran kaivoksen ympäristö- ja vesita-lousluvan muuttaminen, Sotkamo ja Kajaani.
PSAVI 2011b. Pohjois-Suomen Aluehallintovirasto. Lupapäätös Nro 79/2014/1,Dnro PSAVI/144/04.08/2011. Kevitsan kaivoksen tuotannon laajentami-sen ympäristö- ja vesitalouslupa sekä töiden ja toiminnan aloittamislupa,Sodankylä.

PSY 2004. Pohjois-Suomen Ympäristölupavirasto. Lupapäätös Nro 85/07/02,Dnro Psy-2004-y-199. Pyhäsalmen kaivoksen ympäristö- ja vesitalouslu-pa, Pyhäjärvi.
Pöyry 2012. Agnico-Eagle Oy Kittilän kaivoksen laajennus YVA-selostus.16WWE0797.B720M.SLU.
Rahmani, A.R., Mahvi, A.H., Mesdaghinia, A.R., Nasseri, S. 2004. Investigation ofammonia removal from polluted waters by clinoptilolite zeolite. Interna-tional Journal of Environmental Science and Technology 1(2):125-133.
Rama, M. 2011. Kaatopaikkojen suotovesien typenpoisto muokatulla vermikuliitil-la, Master’s thesis. Turun yliopisto, Maantieteen ja geologian laitos, Tur-ku. 93 p.
Rekolainen, S. 1992. Eroosion ja fosforikuormituksen vähentäminen viljelyteknii-kan avulla. In: Maatalous- ja vesien kuormitus. Yhteistutkimusprojektintutkimusraportti. Vesi- ja ympäristöhallituksen monistesarja nro 359.
Rowland, J.H., Mainiero, R., Hurd, D.A. 2001. Factors affecting fumes productionof an emulsion and ANFO/emulsion blends. Proceedings of the 27th An-nual Conference on Explosion and Blasting Technique Vol. II. 28-31 Jan2001, Cleveland, OH. International Society of Explosives Engineers,2001:133-141
Shao, Y., Chung, B.S., Lee, S.S., Park, W., Lee, S.S., Jeon, C.O. 2009. Zoogloeacaeni sp. nov., a floc-forming bacterium isolated from activated sludge.Int J Syst Evol Micr 59:526-530.
SImetric. Material densities. Available: http://www.simetric.co.uk/si_materials.htm.
Slater, J., Capone, D.G. 1984. Effects of metals on nitrogen fixation and denitrifi-cation in slurries of anoxic saltmarsh sediment. Mar Ecol Prog Ser 18:89-95.
TEM 2013. Kaivosteollisuus. Ministry of employment and the economy Availablehttp://www.tem.fi/yritykset/kaivosteollisuus (in Finnish).
TIKE 2013. Information Centre of the Ministry of Agriculture and Forestry. Year-book of Farm Statistics 2013.
Tuokila, M. 2008. Cycle, behaviour and importance of nitrogen in aquatic environ-ment of the Bothnian Bay nearby the discharging points of OutokumpuTornio works and Kemi mine. Master’s thesis, May 2008, Department ofGeography, University of Oulu.

Zaitsev, G., Mettänen, T., Langwaldt, J. 2008. Removal of ammonium and nitratefrom cold inorganic mine water by fixed-bed biofilm reactors. Miner Eng21:10-15.
Zou, G., Papirio, S., Ylinen, A., Di Capua, F., Lakaniemi, A.M., Puhakka, J.A.2014. Fluid-ized-bed denitrification for mine waters. Part II: effects of Niand Co. Biodegradation 25, 417-423.

Appendix A: List of publications
Peer-reviewed articles
Papirio, S., Ylinen, A., Zou, G., Peltola, M., Esposito G. & Puhakka, J.A. 2013.Fluidized-bed denitrification for mine waters. Part I: low pH and tempera-ture operation. Biodegradation. 25:425-435
Zou, G., Papirio, S., Ylinen, A., Di Capua, F., Lakaniemi, A.M. & Puhakka, J.A.2013. Fluidized-bed denitrification for mine waters. Part II: effects of Niand Co. Biodegradation 25:417–423
Zou, G., Ylinen A., Di Capua, F., Papirio, S, Lakaniemi A.M. & Puhakka, J.A.2013. Impact of heavy metals on denitrification of simulated miningwastewaters. Advanced Materials Research 825:500-503
Papirio, S., Zou, G., Ylinen, A., Di Capua, F., Pirozzi, F. & Puhakka, J.A. 2014.Effect of arsenic on nitrification of simulated mining water. BioresourceTechnology 164:149–154.
Zou, G., Papirio, S., Van Hullebusch, E.D. & Puhakka, J.A. 2015. Fluidized-beddenitrification of mining water tolerates high nickel concentrations. Biore-source Technology 179:284-290.
Jermakka, J., Wendling, L., Sohlberg, E., Heinonen, H. & Vikman, M. 2014. Poten-tial Technologies for the Removal and Recovery of Nitrogen Compoundsfrom Mine and Quarry Waters, Critical Reviews of Environmental Sci-ence and Technology. doi: 10.1080/10643389.2014.900238
Jermakka, J., Mehta, C. & Batstone, D. Combined cathodic recovery of ammonia,nitrate and nitrite from low-organics wastewater using cathodic pervapo-ration (submitted)

Conference and other presentations
Arsenic and nitrogen compound discharges in mining and solutions to their re-moval’, Annual seminar of Tekes Green Mining -program, Finlandiatalo24.10.2012.
Ulla-Maija Mroueh, Johannes Jermakka, Elina Merta, Raisa Neitola, Teemu Karls-son, Jaakko Puhakka, Stefano Papirio and Aino-Maija Lakaniemi. 2014.Control of nitrogen discharges at mines and quarries. Poster. AnnualSeminar of Tekes Green Mining Program 24.11.2014.
R. Neitola, T. Korhonen, P. Mörsky, S. Backnäs, K.Turunen, T. Karlsson, GTK; T.Kaartinen, J. Laine-Ylijoki, J. Jermakka, U-M. Mroueh, VTT; S. Ahoranta,S.Papirio, J.A. Puhakka, Tampere University of Technology. 2013. Solu-tions for Control of Arsenic and Nitrogen Discharges in Mining Areas andProcesses. FEM, Poster presentation.
Arsenic and Nitrogen handling in Mining Areas and Processes. 2013. Euromining2013. Green Mining Seminar, Tampere.
Teemu Karlsson, Tommi Kauppila, Kaisa Turunen, Pekka Forsman, Janita Laak-so. 2014. Behaviour of explosives-originated nitrogen compounds in left-over stone of a dimension stone quarry. 11. Geokemian päivät, 5.-6.2.2014
S. Papirio, G. Zou and J.A. Puhakka. 2014. Nitrification of arsenic-containing min-ing waters. Biohydrometallurgy’14, Falmouth, UK.
G. Zou, S. Papirio and J.A. Puhakka. 2014. Impact of Ni2+ on denitrification ofmining waters in fluidized-bed reactors. Sustainability through ResourceConservation and Recycling ’14 (SRCR’14), Falmouth, UK.
Presentations of the project in Tekes Green Mining workshops and in collaborationmeeting with the Technical University of Luleå and LKAB
Teemu Karlsson, et al. Article on behaviour of explosives-originated nitrogen com-pounds in left-over stone. In writing
Patent applications
Jermakka, J. Patent Application No. 20145623. Nitrate, nitrite and ammoniumcapture from wastewater. Filed 27.6.2014.

Additional project reports
Jermakka, J., Wendling, L., Sohlberg, E., Heinonen, H., Laine-Ylijoki, J., Merta, E.,Kaartinen, T. and Mroueh, U.-M. 2015. Nitrogen compounds at mines and quar-ries. Sources, behaviour and removal from mine and quarry waters, Literaturestudy. Will be published in VTT Technology Series.

Series title and number
VTT Technology 225
Title Solutions for control of nitrogen discharges at mines and quarries Miniman project final report
Author(s) Johannes Jermakka, Elina Merta, Ulla-Maija Mroueh, Helena Arkkola, Sini Eskonniemi, Laura Wendling, Jutta Laine-Ylijoki, Elina Sohlberg, Hanna Heinonen, Tommi Kaartinen, Jaakko Puhakka, Minna Peltola, Stefano Papirio, Aino-Maija Lakaniemi, Gang Zou, Anna Ylinen, Francesco di Capua, Raisa Neitola, Henrik Gustafsson, Tero Korhonen, Teemu Karlsson, Tommi Kauppila, Janita Laakso & Pekka Mörsky
Abstract The growth of Finnish extractive industry increases the need to study and monitor different environmental impacts and to integrate the environmental issues more tightly into the overall framework of the activities. Nitrogen released from explosives or from mining processes and ending up in the water system can have negative environmental effects. The MINIMAN project, financed by the Tekes Green Mining Programme and the industry aimed at comprehensive understanding on the nitrogen issue in the extractive industry. The project collected essential data on nitrogen compounds present in the environments of mines and quarries, and developed technologies for the treatment of nitrogen containing mine water. Based on a technology review, selective sorption, electrochemically assisted membrane separation and biological treatment were selected to be studied and developed in the project. Denitrification and nitrification studies on synthetic mine wastewater in laboratory scale revealed that denitrification was possible at low pH (2.5) and temperatures as low as 7°C. Nitrification was more pH sensitive. Both processes tolerated metals (Fe, Ni, Co and As). In the adsorption tests with zeolite, complete ammonium removal from real mine wastewater was achieved with a hydraulic retention time of 2 minutes, with complete regeneration. In addition, a novel electropervaporative nitrogen capture technology was developed. Further larger scale testing and development of all technologies is required to ensure their feasibility in a real mining site. A follow-up period in lysimeters showed that the explosives originated nitrogen content of left over stones from natural stone quarrying is relatively low and ca. half of the nitrogen is leached within the first weeks after detonation. The main sources of nitrogen are process and dewatering waters, irrespective of the scale of extractive activity. The total potential nitrogen load to the environment depends on the scale and type of the activity as well as the type of explosives used. In addition to factors related to the activity itself, the overall nitrogen management should take into account the background concentrations and sensitivity of the local ecosystem.
ISBN, ISSN ISBN 978-951-38-8319-5 (URL: http://www.vttresearch.com/impact/publications) ISSN-L 2242-1211 ISSN 2242-122X (Online)
Date June 2015
Language English, Finnish abstract
Pages 110 p. + app. 3 p.
Name of the project Solutions for Control of Nitrogen Discharges at Mines and Quarries (MINIMAN)
Commissioned by Tekes, Ekokem-Palvelu Oy, Kemira Oyj, Outotec Finland Oyj, Yara Suomi Oy, Agnico-Eagle Finland Oy, FQM Kevitsa Mining Oy, Outokumpu Chrome Oy, Nordic Mines Oy, Nordkalk Oy Ab, The Finnish Natural Stone Association, BK-Automation Ky and Infra ry
Keywords mines, quarries, explosives, nitrate, ammonium, water treatment technologies
Publisher VTT Technical Research Centre of Finland Ltd P.O. Box 1000, FI-02044 VTT, Finland, Tel. 020 722 111

Julkaisun sarja ja numero
VTT Technology 225
Nimeke Kaivannaistoiminnan typpipäästöjen hallinta Miniman-hankkeen loppuraportti
Tekijä(t) Johannes Jermakka, Elina Merta, Ulla-Maija Mroueh, Helena Arkkola, Sini Eskonniemi, Laura Wendling, Jutta Laine-Ylijoki, Elina Sohlberg, Hanna Heinonen, Tommi Kaartinen, Jaakko Puhakka, Minna Peltola, Stefano Papirio, Aino-Maija Lakaniemi, Gang Zou, Anna Ylinen, Francesco di Capua, Raisa Neitola, Henrik Gustafsson, Tero Korhonen, Teemu Karlsson, Tommi Kauppila, Janita Laakso & Pekka Mörsky
Tiivistelmä Suomen kaivannaisteollisuuden kasvu lisää tarvetta tutkia ja seurata erilaisia ympäristövaikutuksia sekä tiedostaa ympäristöasiat yhä paremmin osana toimintaa. Räjähdysaineista tai kaivosprosessista ympäristöön vapautuvalla typellä voi olla negatiivisia ympäristövaikutuksia. Tekesin Green Mining ohjelman ja teollisuuden rahoittamassa MINIMAN-projektissa pyrittiin luomaan kattava näkemys kaivannaistoiminnan typpikysymyksestä. Projektissa kerättiin tietoa kaivosten ja louhimojen ympäristöissä esiintyvistä typpiyhdisteistä ja kehitettiin teknologioita typpipitoisten vesien käsittelyyn. Teknologiaselvityksen perusteella projektin teknologiakehityksen kohteiksi valittiin selektiivinen sorptio, elektrokemiallisesti avustettu membraanierotus sekä biologinen käsittely. Denitrifikaatio- ja nitrifikaatiokokeet synteettisellä kaivosjätevedellä laboratoriomittakaavassa osoittivat, että denitrifikaatio oli mahdollista matalassa pH:ssa (2,5) ja lämpötilassa (7 °C). Nitrifikaatio oli herkempi pH:n vaihteluille. Molemmat prosessit sietivät metalleja (Fe, Ni, Co and As). Adsorptiokokeissa zeoliitin havaittiin poistavan tehokkaasti ammoniumtyppeä 2 min hydraulisella viipymällä, ja materiaali saatiin regeneroitua täydellisesti. Projektissa kehitettiin lisäksi uudenlainen elektro-pervaporatiivinen menetelmä typen talteen ottamiseksi. Suuremman mittakaavan testausta ja kehitystyötä tarvitaan, jotta voidaan varmistua teknologioiden soveltuvuudesta kaivosympäristöön. Lysimetrikokeiden perusteella luonnonkivilouhimon sivukivien räjähdysaineista peräisin olevan typen pitoisuus on melko matala, ja noin puolet typestä huuhtoutuu räjäytyksen jälkeen jo muutamassa viikossa. Riippumatta kaivannaistoiminnan mittakaavasta prosessi- ja kuivatusvedet ovat pääasiallisia typen lähteitä. Ympäristöön kohdistuvan kokonaistyppikuorman suuruus riippuu toiminnan mittakaavasta ja luonteesta sekä myös käytettävien räjähdysaineiden ominaisuuksista. Itse kaivostoimintaan liittyvien tekijöiden lisäksi typen hallinnassa tulisi ottaa huomioon ympäristön taustapitoisuudet sekä paikallisen ekosysteemin herkkyys.
ISBN, ISSN ISBN 978-951-38-8319-5 (URL: http://www.vtt.fi/julkaisut) ISSN-L 2242-1211 ISSN 2242-122X (Verkkojulkaisu)
Julkaisuaika Kesäkuu 2015
Kieli Englanti, suomenkielinen tiivistelmä
Sivumäärä 110 s. + liitt. 3 s.
Projektin nimi Kaivannaistoiminnan typpipäästöjen hallinta (MINIMAN)
Rahoittajat Tekes, Ekokem-Palvelu Oy, Kemira Oyj, Outotec Finland Oyj, Yara Suomi Oy, Agnico-Eagle Finland Oy, FQM Kevitsa Mining Oy, Outokumpu Chrome Oy, Nordic Mines Oy, Nordkalk Oy Ab, Kiviteollisuusliitto ry, BK-Automation Ky ja Infra ry
Avainsanat kaivokset, louhimot, räjähdysaine, nitraatti, ammonium, vesienkäsittelyteknologiat
Julkaisija Teknologian tutkimuskeskus VTT Oy PL 1000, 02044 VTT, puh. 020 722 111

Solutions for control of nitrogen discharges at mines and quarries Miniman project final report
ISBN 978-951-38-8319-5 (URL: http://www.vttresearch.com/impact/publications) ISSN-L 2242-1211 ISSN 2242-122X (Online)
VT
T T
EC
HN
OL
OG
Y 2
25
So
lutio
ns fo
r co
ntro
l of n
itrog
en
...
•VISIONS•S
CIE
NC
E•T
ECHNOLOGY•R
ES
EA
RC
HHIGHLIGHTS
225
Solutions for control of nitrogen discharges at mines and quarries Miniman project final report