Solid-state 27Al and 29Si NMR studies of the reactivity of the aluminum-containing clay mineral...
11
Solid State lonics 32/33 (1989) 378-388 North-Holland, Amsterdam SOLID-STATE ZVAl AND zgSi NMR STUDIES OF THE REACTIVITY OF THE ALUMINUM-CONTAINING CLAY MINERAL KAOLINITE John J. FITZGERALD *, Abdullatef I. HAMZA Department of Chemistry and Chemwal Engineering. South Dakota School ~/Mines and Technology. Rapid ('ity. SD 57701. USA and Charles E. BRONNIMANN, Steven F. DEC Department qf Chemisto,, Colorado State University. Fort Collins. CO 80523, USA Received 19 June 1988; accepted for publication 5 August 1988 Solid-state ~-VA1 and 2'Si NMR spectroscopy, X-ray powder diffraction and other chemical analyses have been used to study the dealumination of uncalcined and calcined (850°C) kaolinite following extraction with aqueous HC1 solutions at 98'('. The degree of the dealumination is dependent on the extraction stoichiometry and the temperature of calcination pretreatmem of the kaolinite. Solid-state MASS 27A1 and CP/MASS 29SiNMR studies provide unique information about the aluminum and silicon atoms in kaolinite samples before and following the dealumination process. The results are discussed in light of the current mech- anisms proposed for the dehydration and dealumination processes of kaolinite. I. Introduction Reactions of clay minerals in the solid-state and at the solid/solution interface are important to nu- merous chemical processes used to produce special- ized chemicals [ 1 ], clay-based materials [2-4 ] and ceramics [ 5-7 ]. Kaolin (serpentine) minerals, which include the dioctahedral 1:1 layered aluminosilicate clays [8], have extensive use as fillers and pigment coatings in paper production [9], as precursors in the production of zeolites [ 10,11 ] and ceramic ma- terials [12 ], and are used to produce numerous ce- ramic articles [9]. The mineral kaolinite, ALSi40~o(OH)s or 2(AI203.2SiO2'2H20), is the major constituent of kaolin and is made up of Si/AI layers about 7.2 ~ thick [13]. The unit cell consists of a gibbsite (AI(OH)3) layer sheet and a two-di- mensional single tetrahedral silica sheet joined to- gether by A1-O-Si linkages. The majority of the 13.95% total water content of kaolinite is contained * Author to whom correspondence should be addressed. in the form of lattice hydroxyl groups [ 8,13 ], Recently, high-resolution magic-angle sample- spinning (MASS) :VA1 and 29Si nuclear magnetic resonance (NMR) spectroscopy of solids has been shown to be a powerful tool to understand the struc- ture and chemical nature of silicate and aluminos- ilicate minerals [14-20,25], layered silicate clays [14,19-24], Si/A1 zeolites [ 15,25,26], crystalline and amorphous silicon and aluminum-containing ceramics [26], A1/Si gels and glasses [25,27-31], and mullite and its precursors [26,31,32]. Kaolin clays, the mineral kaolinite, and the related diocta- hedral mineral pyrophyllite, in particular, have been examined by both solid-state MASS ~TAI [ 17,19,20,24] and 29Si [ 14,17,19,20,22] MASS and MASS/CP (cross-polarization) NMR techniques. Recently, these spectroscopic approaches have been applied to study two major solid-state thermal re- actions of kaolinite-derived materials: ( 1 ) the de- hydration of kaolinite to metakaolinite [ 19,33,34,36 ] between 650-800°C and, (2) the high temperature (>980°C) conversion of metakaolinite to mullite [33,35,36]. 0 167-2738/89/$ 03.50 © Elsevier Science Publishers B.V. ( North-Holland Physics Publishing Division )
-
Upload
john-j-fitzgerald -
Category
Documents
-
view
212 -
download
0
Transcript of Solid-state 27Al and 29Si NMR studies of the reactivity of the aluminum-containing clay mineral...

Solid State lonics 32/33 (1989) 378-388 North-Holland, Amsterdam
SOLID-STATE ZVAl AND zgSi NMR STUDIES OF T H E REACTIVITY O F T H E A L U M I N U M - C O N T A I N I N G CLAY M I N E R A L K A O L I N I T E
John J. F I T Z G E R A L D *, Abdul la tef I. H A M Z A Department of Chemistry and Chemwal Engineering. South Dakota School ~/Mines and Technology. Rapid ('ity. SD 57701. USA
and
Charles E. B R O N N I M A N N , Steven F. DEC Department qf Chemisto,, Colorado State University. Fort Collins. CO 80523, USA
Received 19 June 1988; accepted for publication 5 August 1988
Solid-state ~-VA1 and 2'Si NMR spectroscopy, X-ray powder diffraction and other chemical analyses have been used to study the dealumination of uncalcined and calcined (850°C) kaolinite following extraction with aqueous HC1 solutions at 98'('. The degree of the dealumination is dependent on the extraction stoichiometry and the temperature of calcination pretreatmem of the kaolinite. Solid-state MASS 27A1 and CP/MASS 29Si NMR studies provide unique information about the aluminum and silicon atoms in kaolinite samples before and following the dealumination process. The results are discussed in light of the current mech- anisms proposed for the dehydration and dealumination processes of kaolinite.
I. Introduction
Reactions of clay minerals in the solid-state and at the so l id / so lu t ion interface are impor tan t to nu- merous chemical processes used to produce special- ized chemicals [ 1 ], clay-based mater ia ls [2 -4 ] and ceramics [ 5-7 ]. Kaolin (serpent ine) minerals, which include the dioctahedral 1:1 layered aluminosi l icate clays [8] , have extensive use as fillers and pigment coatings in paper product ion [9] , as precursors in the product ion of zeolites [ 10,11 ] and ceramic ma- terials [12 ], and are used to produce numerous ce- ramic articles [9] . The mineral kaolinite, ALSi40~o(OH)s or 2 (AI203 .2SiO2 '2H20) , is the major const i tuent of kaolin and is made up of Si /AI layers about 7.2 ~ thick [13]. The unit cell consists of a gibbsite ( A I ( O H ) 3 ) layer sheet and a two-di- mensional single te t rahedral silica sheet jo ined to- gether by A1-O-Si linkages. The major i ty of the 13.95% total water content of kaolini te is contained
* Author to whom correspondence should be addressed.
in the form of lattice hydroxyl groups [ 8,13 ], Recently, high-resolution magic-angle sample-
spinning (MASS) :VA1 and 29Si nuclear magnetic resonance ( N M R ) spectroscopy of solids has been shown to be a powerful tool to unders tand the struc- ture and chemical nature of silicate and aluminos- ilicate minerals [14-20 ,25] , layered silicate clays [14 ,19-24] , Si/A1 zeolites [ 15,25,26], crystall ine and amorphous silicon and a luminum-conta in ing ceramics [26] , A1/Si gels and glasses [25 ,27-31] , and mull i te and its precursors [26,31,32]. Kaolin clays, the mineral kaolinite, and the related diocta- hedral mineral pyrophyll i te, in part icular, have been examined by both solid-state MASS ~TAI [ 17,19,20,24] and 29Si [ 14,17,19,20,22] MASS and M A S S / C P (cross-polar izat ion) NMR techniques. Recently, these spectroscopic approaches have been appl ied to study two major solid-state thermal re- act ions of kaol ini te-der ived materials: ( 1 ) the de- hydrat ion of kaolinite to metakaolini te [ 19,33,34,36 ]
between 650-800°C and, (2) the high temperature ( > 9 8 0 ° C ) conversion of metakaol ini te to mull i te [33,35,36].
0 167-2738/89/$ 03.50 © Elsevier Science Publishers B.V. ( Nor th-Hol land Physics Publishing Divis ion )

J.J. Fitzgerald et al. ~Aluminum-containing clay mineral kaolinite 379
An equally significant solid/solution reaction of importance in the chemistry of kaolinite-derived materials is the extraction of aluminum from cal- cined kaolinite under acidic condition [37-40]. Bengston [4] has recently demonstrated that the ex- traction of aluminum from abundant calcined ka- olinitic clays by HC1 is the most favorable techno- logical approach to produce alumina materials from non-bauxitic minerals. While natural kaolinite is re- sistant to acid attack, nearly all the aluminum is acid extractable in kaolin calcined between 425 and 525°C, where it loses most of the 13.95% water, and is converted to X-ray diffraction amorphous metak- aolinite [37]. Recent studies of the HC1/kaolin pro- cess by Bremmer et al. [3], have shown that kaolin clay which was calcined to 850°C for 4 to 8 h, was 93% dealuminated using a basic chloride method with 26% boiling HC1. Upon further calcination above 900°C, where mullite, "/-alumina and crystobalite begin to form, the percent aluminum extracted ab- ruptly decreases (less than 30% above 900°C).
Solid-state MASS 27A1 and 298i NMR studies of the hydrochloric acid extraction of kaolinite and its calcined products have not been reported to date. Such investigations have tremendous potential for examining the mechanisms of dehydration and deal- umination of kaolinite. In the work reported herein, three approaches are used to study the dealumina- tion of kaolinite and its calcined products: (1) chemical analysis of the degree of dealumination of kaolinite solids, (2) X-ray powder diffraction mea- surements, (3) CP/MASS 29Si NMR and MASS 27A1 NMR studies of these kaolinite-derived materials.
2. Experimental
2.1. Kaolinite and chemical reagents
2.2. Elemental analysis of kaolinite
Elemental analysis for %A1203 and %SIO2 (theo- retical 39.6% and 46.5%) was obtained by atomic absorption, (AA) analysis at SDSM & T and X-ray fluorescence analysis by X-ray Assay Laboratories Limited, Don Mills, Ontario. AA analyses results were 40.20+0.81% A1203 and 46.85+2.93% SiO2, whereas the X-ray fluorescence results were 38.6% A1203 and 46.7% SiO2. Minor element analysis re- sults were: 0.37% TiO2, 0.15% Fe203, 0.028% K20, < 0.2% P205, 0.033% MgO, 0.072% CaO and 0.016% Na20. Water loss by ignition was found to be 14.03% (theoretical value of 13.95%). The experimentally derived formula for the kaolinite sample was AI203"2.06SiOz'2.07H20.
2.3. Aluminum and silicon analysis
Aluminum and silicon contents of kaolinite and extracted kaolinite solids were determined by atomic absorption using solutions obtained from solids fused with LiBO2 in a graphite crucible for 30 min at 1000°C, followed by dissolution in 5% HNO3 solutions.
AA analysis of solutions obtained from the lithium metaborate fusion, and Si, A1 and Fe-containing so- lutions from the HC1 extraction experiments were determined using a Varian Model AA-6 Atomic Ab- sorption instrument at standard conditions. Addi- tion reagents containing 50000 ppm of ammonium molybdate, (NH4)6MoTO24 4H20, 5000 ppm KCI/ 0.1 M HC1 mixture, and 24000 ppm of LiBO2 in 5% HNO3 were used for AI analysis, whereas addition reagents containing 1000 ppm A1 in a KC1/HCI mix- ture, and 24000 ppm LiBO2 solution in 5% HNO3 were used for Si analysis as described by Hodgins [48].
All chemicals were of reagent grade quality. The kaolinite was obtained from D.J. Mineral Kit Com- pany, P.O. Box 761, Butte, Montana (Lot M-188, from a natural deposit in Lewiston, Montana), ground with mortar and pestle, and dessicated prior to their use.
2.4. X-ray powder diffraction
X-ray powder diffraction analysis of kaolinite and its treated solid products were obtained using a Phil- lips-Norelco diffractometer equipped with a graph- ite monochrometer, a CuKct X-ray source at 1.5418
and a Dynamaster 64A recorder over the 20 range 1-45 o.

380 J.J. Fitzgerald et at. ~Aluminum-containing clay mineral kaolinite
2.5. Solid-state :TAl and :~Si N M R measurements
2~Si NMR spectra were recorded on a "home-bui l t" Nicolet NT-200 spectrometer at 39.7 MHz (4 .7T) , with 2~Si and IH RF field strengths of 41.5 kHz. Samples were conta ined in sealed 8 m m diameter N M R quartz tube ( C P / M A S S ) or 8 mm diameter dri l led Delrin rods (capaci ty 400 mg.) suppor ted in a modif ied Gay- type spinner [41 ], and spun at 1.8- 2.2 KHz in a a "home-bu i l t " solids probe. Typical C P / M A S S spectral condi t ions were: 2 s delay t imes, a ~H-2~Si contact t ime of 7.5 ms, 1000 to 2000 scans with a 10 kHz sweep width. The 7.5 ms contact t ime was chosen based on variable contact t ime studies on a number of samples. For 2')Si F T N M R experiments using high-power proton decoupling, spectra were obtained using 2'~Si pulse widths of 30-70 ~, delay t imes from 250-600 s, and 144 or 256 scans at a 10 kHz sweep width. 2~'Si N M R spectra were externally referenced to tetrakis (t r imethylsi lyl ) methane (TTSM), which was assigned a chemical shift of 0.00 ppm (ca. - 2 ppm lower than chemical shifts for TMS) .
All 27A1 N M R spectra were recorded using a Bru- ker AM-600 N M R spectrometer operat ing at 156.4 MHz (14.1T) using a "home-bu i l t " probe. Spectra were obta ined using po ly (methy lmethac ry la t e ) spinners (25 gl sample capaci ty) capable of spin- ning speeds of 15 kHz [42]. All spectra were re- corded using a pulse-acquire-delay pulse sequence using 1.0 gs 27A1 pulses, 50 ms delay t imes and 5000 scans at 166.67 kHz sweep width. Spectra were ex- ternally referenced to a 1 M A1CI3.6H:O solution (7 gs 90 ° pulse) , which was assigned a 27A1 chemical shift of 0.00 ppm. For quant i ta t ive 27A1 N M R mea- surements, the intensity of each spectrum was scaled to the 27A1 N M R signal for kaolini te (corresponding to 100% AI), and these signal intensit ies normal ized to the sample mass. A luminum contents obta ined by this procedure were within 4% of AA analysis results on known samples.
2.6. Preparation o f kaolinite-derived solids
The first series of kaol ini te-der ived solids was pre- pared using 2.50 g samples of kaolini te and kaolini te calcined to 850°C in ceramic crucibles for 8 h. The samples were dea lumina ted by refluxing with stir-
ring in 9.6 mls of boiling 3M HCI for 4 h at 95-98°C. The calcined kaolinite samples had an average weight loss due to dehydrat ion of 13.8%. The mole ratio of the HC1/kaol ini te reaction,
Al4Si40~tl(OH)s + HCI-~A1CI3 + H 2 0 + SiO2
was 5.265, whereas the HCl /ca lc ined kaolinite ratio was 4.627. Following extraction, the suspension was filtered, the dea lumina ted product washed with water, air-dried, dessicated for 48 h, and the wt% loss determined. The filtrate from the HCI extraction and the washes were combined for analysis by AA. The second series of HCl-extracted kaolinite samples were prepared by reacting 2.50 g kaolini te samples with 17.3 mls o f 3 M HC1 from 4 h to 16 d at a 10.79/1 reaction stoichiometry. The dea luminated solid products and liquors were separated for AA analysis for silicon and a luminum.
3. Results
3. I. Extraction o f kaolinite and calcined kaolinite solids'
The extract ion of kaolinite by hydrochloric acid was used to prepare two series of kaol ini te-derived solids. In the first series, kaolinite and kaolini te cal- cined at 850°C for 8 h were extracted in 3 M HCI for 4 h at 98°C using an exper imental HCl /kao l in i t e mole ratio of 5.256/1 and 4.627/1 to obtain par- tially dea lumina ted samples of kaolini te and cal- cined kaolinite, respectively. Table 1 summarizes the wt% losses due to dehydrat ion, wt% losses following extraction and the % A1, % Si and % Fe extracted. The wt% loss of the calcined sample following de-
Table l Chemical analyses of extracted kaolinite and calcined kaolinite.
Sample Loss Loss Element extracted calc. extrael. (wt%) (wt%) AI Si Fc
(%! (%) (%)
kaolinite 0.00 3.94 1.86 0.36 99.0 kaolinite 13.80 22.8 66.5 4.70 29.2 calcined
850'(i'

1 1 Fitzgerald et al. ~Aluminum-containing clay mineral kaolinite 3 81
hydration for 8 h at 850°C is 13.80%. Minimal alu- minum and silicon is extracted, wheras nearly 100% of the 0.15% iron content is removed. By contrast, extraction of calcined kaolinite or metakaolinite re- moves 66.5% of the aluminum, 4.70% of the silicon and 29% of the iron. This is consistent with the HCI extraction behavior of kaolinite from the literature [2-4,37-40].
The extraction of kaolinite in 3 M HCI at 98°C was further examined for the time periods: 4 h, 24 h, 48 h, 96 h, 192 h (8 d) and 384 h (16 d) at a 10.79/1 HC1/kaolinite mole ratio corresponding to ca. 90% of the theoretical value. Results of chemical analysis including % sample wt. loss following deal- umination, and the % AI, % Si and % Fe extracted are depicted in fig. 1. The % A1, % Si and % Fe anal- yses are reported from leachant solution analysis, al- though similar percent extraction results were ob- tained from analysis of the solids by the fusion/AA method. The calculated Si/A1 ratio of the dealumi- nated solid reaction products is also depicted in fig. 1.
Chemical analyses of the HCl-extracted kaolinite shows that iron extraction is nearly complete in 4 h, the percent Si extraction varies from 0.19-0.58%, with the highest in 4 h (0.582%), whereas the degree of aluminum extraction varies from 1.66% in 4 h to 83.3% in 16 d. The percent aluminum extraction
C H E M I C A L ANALYSES OF KAOL IN ITE
EXTRACTED 16 DAYS IN 3M HCI A T 9 8 ° C
10o - ~ ~ ~ -- I r ~ t •
90 12
80 • % AI Extrmcted • % Sl Extr=cted 1~
70 • % Fe Extractod
.~ ~ o ' Nt ' LOIS 8 c 8 ~ ~1 Rit lo
o E so -_ ~
40
3O 4
20 I
I 2 10
0 - : J 1 • l [ I I • 0 0 50 100 150 200 250 300 350 400
Extraction Time (hrs.)
Fig. 1. Chemical analyses results of various kaolinite samples ex- lracted in 3 M HC1 at 98 °C for 16 d, including %AI, %Si and %Fe extracted, wt% loss due to extraction, and calculated Si/A1 ratio of the dealuminated solids.
o
profile parallels the wt%. loss profile. The Si/A1 ratio of the dealuminated kaolinite increases from 1/1 to a maximum of 10.37/1 after 16 d extraction (fig. 1 ).
3.2. X-ray powder diffraction of dealuminated kaolinite solids
X-ray powder diffraction was used to monitor the various dehydrated and dealuminated kaolinite sol- ids. For example, kaolinite calcined at 850°C was found to be amorphous, evidence for the formation of disordered metakaolinite. Metakaolinite ex- tracted to remove 67% of the aluminum likewise shows no diffraction pattern. Partially dealuminated uncalcined kaolinite by contrast exhibits the normal diffraction lines for kaolinite (e.g., the two intense lines at 20 values of 12.3 * (7.2 A) and 24.8 ° (3.59 .~) ), the intensities decreasing in proportion to the degree of dealumination [47 ].
3.3. Solid-state 2~4l ?v\~lR studies of various kaolinite samples
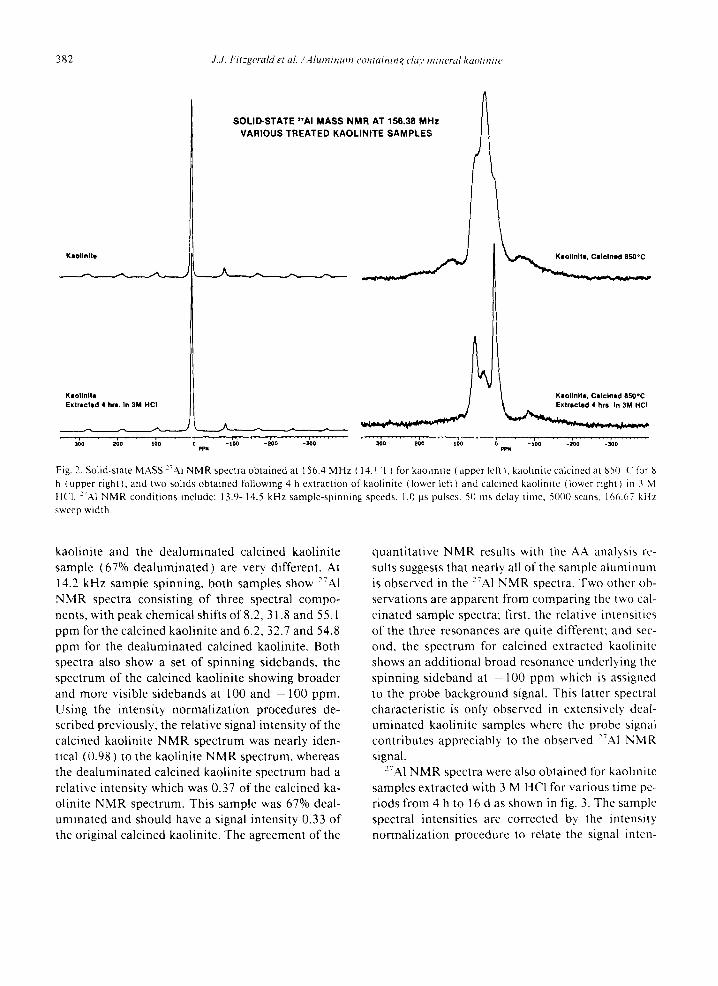
Solid-state MASS 27Al spectra were obtained for various kaolinite samples at the highest available magnetic field (14.1 Tesla) using sample-spinning speeds of 8.4-14.5 kHz. Fig. 2 shows the 27A1 NMR spectra of four samples: kaolinite, kaolinite ex- tracted for 4 h in 3 M HCI, kaolinite calcined at 850°C, and kaolinite calcined at 850°C followed by HCI extraction. With magic-angle sample-spinning for a quadrupolar nucleus such a s 27A1, the NMR spectra of all kaolinite samples showed the presence of only the central transition ( 1/2,--,- 1/2), which is independent of the quadrupolar interaction to the first order. The NMR spectrum of kaolinite (fig. 2) exhibits a single sharp resonance at 5.1 ppm due to octahedrally coordinated aluminum, and a very weak tetrahedral resonance at 70.5 ppm. All other peaks are spinning sidebands caused by quadrupole satel- lite interactions. The relative intensity of the Oh /Td aluminum signals was ca. 400/1. The 27A1 NMR spectrum of kaolinite following HC1 extraction of ca. 2% AI and 0.4% Si again shows only the intense oc- tahedral aluminum signal and the low intensity te- trahedral signal. However, the overall spectral inten- sity is decreased by 5%.
By contrast, the 27A1 NMR spectra of the calcined
382 J . . l . F t t z g e r a / d e t a l . ~ A l u m i n u m - c o n t a i n i n g c l a y m i n e r a l k a o l i n i t e
Kaollnlta
Kaolinite Extractad 4 hrs. In 3M HCI
SOLID-STATE ='AI MASS NMR AT 156.38 MHz VARIOUS TREATED KAOLINITE SAMPLES
' ;;o " " " ~ o " " , ;o " ; " 7o'0 . . . . -~oo " - ~ o pPx
Keo l ln l ta , Ca l c ined 850"C
Fig. 2. Solid-state MASS 2"AI NMR spectra obtained at 156.4 MHz ( 14. I T ) for kaolinite ( upper left ), kaolinite calcined at 850 ( tk)r 8 h (upper right), and two solids obtained following 4 h extraction of kaolinite (lower left) and calcined kaolinite (lower right) in 3 M HC1. :'A1 NMR conditions include: 13.9-14.5 kHz sample-spinning speeds, 1.0 gs pulses. 50 ms delay lime, 5000 scans. 166.67 kHz sweep width.
kaolinite and the dealuminated calcined kaolinite sample (67% dealuminated) are very. different. At 14.2 kHz sample spinning, both samples show ~TA1 NMR spectra consisting of three spectral compo- nents, with peak chemical shifts of 8.2, 31.8 and 55.1 ppm for the calcined kaolinite and 6.2, 32.7 and 54.8 ppm for the dealuminated calcined kaolinite. Both spectra also show a set of spinning sidebands, the spectrum of the calcined kaolinite showing broader and more visible sidebands at 100 and - 100 ppm. Using the intensity normalizat ion procedures de- scribed previously, the relative signal intensity of the calcined kaolinite NMR spectrum was nearly iden- tical (0.98) to the kaolinite NMR spectrum, whereas the dealuminated calcined kaolinite spectrum had a relative intensity which was 0,37 of the calcined ka- olinite NMR spectrum. This sample was 67% deal- uminated and should have a signal intensity 0.33 of the original calcined kaolinite. The agreement of the
quanti tat ive NMR results with the AA analysis re- sults suggests that nearly all of the sample a luminum is observed in the 27A1 NMR spectra. Two other ob- servations are apparent from comparing the two cal- cinated sample spectra; first, the relative intensities of the three resonances are quite different: and sec- ond, the spectrum for calcined extracted kaolinite shows an addit ional broad resonance underlying the spinning sideband at - 100 ppm which is assigned to the probe background signal. This latter spectral characteristic is only observed in extensively deal- uminated kaolinite samples where the probe signal contributes appreciably to the observed ~'TAl NMR signal.
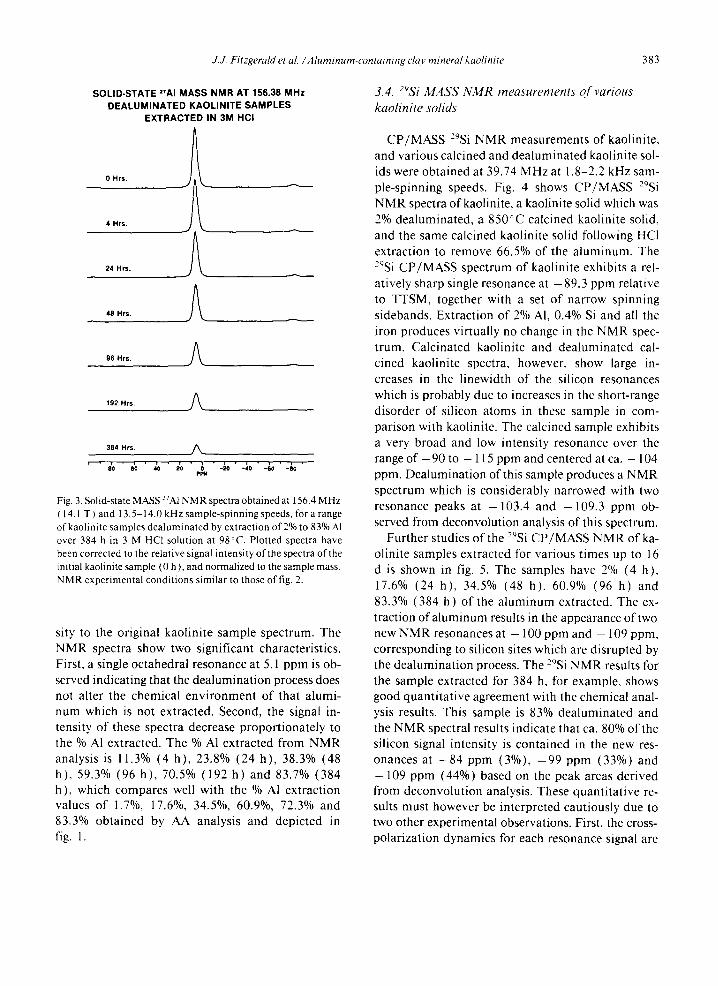
27A1 NMR spectra were also obtained for kaolinite samples extracted with 3 M HCI for various time pe- riods from 4 h to 16 d as shown in fig. 3. The sample spectral intensities are corrected by the intensity normalizat ion procedure to relate the signal inten-
J.J. Fitzgerald et al. ~Aluminum-containing clay mineral kaolinite 383
SOLID-STATE 2rAI M A S S N M R AT 156.38 M H z DEALUMINATED KAOLINITE S A M P L E S
EXTRACTED IN 3M HCI
0 Hrs.
4 Hrs.
24 Hrs.
48 Hrs.
96 Hrs.
192 Hrs.
J<
_<
<
£
A
384 Hrs. //~
' " io ' go ' ,'o " 2'o " p i , - ~ o ' - ; o ' - ~ o ' - ; o '
Fig. 3. Solid-state MASS 27A1NMR spectra obtained at 156.4 MHz ( 14.1 T ) and 13.5-14.0 kHz sample-spinning speeds, for a range of kaolinite samples dealuminated by extraction of 2% to 83% AI over 384 h in 3 M HC1 solution at 98°C. Plotted spectra have been corrected to the relative signal intensity of the spectra of the initial kaolinite sample (0 h), and normalized to the sample mass. NMR experimental conditions similar to those of fig. 2.
sity to the original kaolini te sample spectrum. The NMR spectra show two significant characteristics. First, a single octahedral resonance at 5.1 ppm is ob- served indicating that the dealuminat ion process does not alter the chemical envi ronment of that alumi- num which is not extracted. Second, the signal in- tensity of these spectra decrease propor t ionate ly to the % Al extracted. The % A1 extracted from N M R analysis is 11.3% (4 h) , 23.8% (24 h) , 38.3% (48 h), 59.3% (96 h) , 70.5% (192 h) and 83.7% (384 h), which compares well with the % AI extract ion values of 1.7%, 17.6%, 34.5%, 60.9%, 72.3% and 83.3% obtained by AA analysis and depicted in fig. 1.
3.4. 2%i M A S S N M R measurements o f various
kaolinite solids
CP/MASS 298i N M R measurements of kaolinite, and various calcined and dea lumina ted kaolini te sol- ids were obtained at 39.74 MHz at 1.8-2.2 kHz sam- ple-spinning speeds. Fig. 4 shows C P / M A S S 29Si N M R spectra of kaolinite, a kaolinite solid which was 2% dealuminated , a 850°C calcined kaolini te solid, and the same calcined kaolini te solid following HC1 extract ion to remove 66.5% of the a luminum. The 29Si C P / M A S S spectrum of kaolini te exhibits a rel- at ively sharp single resonance at - 89.3 ppm relative to TTSM, together with a set of narrow spinning sidebands. Extraction of 2% AI, 0.4% Si and all the iron produces virtually no change in the N M R spec- trum. Calcinated kaolinite and dea lumina ted cal- cined kaolini te spectra, however, show large in- creases in the l inewidth of the silicon resonances which is probably due to increases in the short-range disorder of silicon a toms in these sample in com- parison with kaolinite. The calcined sample exhibits a very broad and low intensity resonance over the range of - 90 to - 115 ppm and centered at ca. - 104 ppm. Dealuminat ion of this sample produces a NMR spectrum which is considerably narrowed with two resonance peaks at - 1 0 3 . 4 and - 1 0 9 . 3 ppm ob- served from deconvolution analysis of this spectrum.
Fur ther studies of the 29Si C P / M A S S N M R of ka- olinite samples extracted for various t imes up to 16 d is shown in fig. 5. The samples have 2% (4 h) , 17.6% (24 h), 34.5% (48 h), 60.9% (96 h) and 83.3% (384 h) of the a luminum extracted. The ex- traction of a luminum results in the appearance of two new N M R resonances at - 100 ppm and - 109 ppm, corresponding to silicon sites which are disrupted by the dea lumina t ion process. The 29Si N M R results for the sample extracted for 384 h, for example, shows good quant i ta t ive agreement with the chemical anal- ysis results. This sample is 83% dea lumina ted and the N M R spectral results indicate that ca. 80% of the silicon signal intensity is contained in the new res- onances at - 8 4 ppm (3%), - 9 9 ppm (33%) and - 109 ppm (44%) based on the peak areas derived from deconvolut ion analysis. These quant i ta t ive re- sults must however be interpreted cautiously due to two other experimental observations. First, the cross- polar izat ion dynamics for each resonance signal are

384
Kaolinite Extracted 4 hrs. in 3M H C I
F . . . . I . . . . I 50 0 -50
PPH
Kaolini te
J.J. Fitzgerald et al. /Aluminum-containing clay mineral kaolinite
SOLID-STATE CP/MASS ~'Si NMR AT 39.74 MHz VARIOUS TREATED KAOLINITE SAMPLES
/ ~ , . . ~ ~ K a o l l n i t e , Calcined 850"C
- 1 0 0 150 50 0 - 5 0 - 1 0 0
ppH
/
- 1 5 0
Fig. 4. CP/MASS 2"Si NMR spectra (at 39.7 MHz and 1.8-2.2 kHz sample-spinning speed) of kaolinite (upper left ), kaolinite calcined at 850~C for 8 h (upper right), and dealuminated kaolinite (lower left) and dealuminated calcined kaolinite (lower right) produced following extraction for 4 h in 3 M HC1 solution at 98°C. CP/MASS 2°Si NMR conditions for the kaolinite samples were: 8 #s pulses, 2 s delay times, 7.5 ms contact time, 1000-2000 scans, 10 kHz sweep width. NMR spectra conditions used for the calcined kaolinite and dealuminated calcined kaolinite samples were identical except that 28000 scans were required,
0 Hrs.
A_ J
SOLID-STATE CPIMASS "SI NMR AT 39.74 MHz DEALUMINATED KAOLINITE SAMPLES
EXTRACTED IN 3M HCI
J
48 Hrs.
J
24 Hrs. t
f . . . . I" . . . . I ' ' ' ' I . . . . F ' ' ' ' I ' ' ' ' I ' ' r 50 0 -50 -100 -150 PPH SO 0 -50
J
- 1 0 0 - I 5 0
Fig. 5.CP/MASS 29Si NMR spectra (at 39.7 MHz and 1.8-2.2 kHz sample-spinning speed ) for the same range of dealuminated kaolinite samples obtained from the extraction of kaolinite in 3 M HC1 for up to 16 d as described in fig. 3. CP/MASS 2'Si NMR experimental conditions identical to fig. 4.
J.J. Fitzgerald et al. ~Aluminum-containing clay mineral kaolinite 385
SOLID.STATE CP/MASS "Si NMR AT 39.74 MHz KAOLINITE SAMPLE DEALUMINATED
16 DAYS IN 3M HCI CONTACT TIME STUDY
10 rnsec.
? inlet, i
S m=ee. V'~
3 reset. ~ 2 msec.
250 ~sec. 100 ~sec.
50 ~sec.
25 ~ s e e ~
10 .sec.
o ~sec.
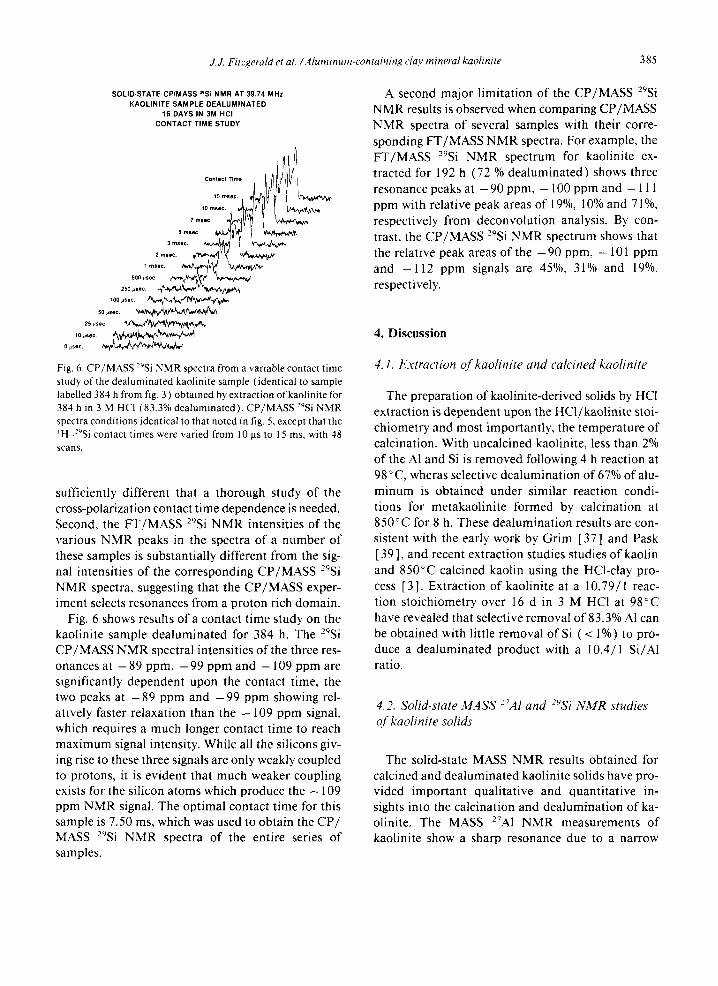
Fig. 6. CP/MASS >Si NMR spectra from a variable contact time study of the dealuminated kaolinite sample (identical to sample labelled 384 h from fig. 3 ) obtained by extraction of kaolinite for 384 h in 3 M HCI (83.3% dealuminated). CP/MASS 29Si NMR spectra conditions identical to that noted in fig. 5, except that the 'H--'gSi contact limes were varied from 10 ~s to 15 ms, with 48 scans.
sufficiently different that a thorough study of the cross-polarization contact time dependence is needed. Second, the FT/MASS 29Si NMR intensities of the various NMR peaks in the spectra of a number of these samples is substantially different from the sig- nal intensities of the corresponding CP/MASS 29Si NMR spectra, suggesting that the CP/MASS exper- iment selects resonances from a proton rich domain.
Fig. 6 shows results of a contact time study on the kaolinite sample dealuminated for 384 h. The -~gSi CP/MASS NMR spectral intensities of the three res- onances at - 8 9 ppm, - 9 9 ppm and - 109 ppm are significantly dependent upon the contact time, the two peaks at - 8 9 ppm and - 9 9 ppm showing rel- atively faster relaxation than the - 1 0 9 ppm signal, which requires a much longer contact time to reach maximum signal intensity. While all the silicons giv- ing rise to these three signals are only weakly coupled to protons, it is evident that much weaker coupling exists for the silicon atoms which produce the - 109 ppm NMR signal. The optimal contact time for this sample is 7.50 ms, which was used to obtain the CP/ MASS 29Si NMR spectra of the entire series of samples.
A second major limitation of the CP/MASS 298i
NMR results is observed when comparing CP/MASS NMR spectra of several samples with their corre- sponding FT/MASS NMR spectra. For example, the F T / M A S S 29Si NMR spectrum for kaolinite ex- tracted for 192 h (72 % dealuminated) shows three resonance peaks at - 90 ppm, - 100 ppm and - 111 ppm with relative peak areas of 19%, 10% and 71%, respectively from deconvolution analysis. By con- trast, the CP/MASS >Si NMR spectrum shows that the relative peak areas of the - 9 0 ppm, - 101 ppm and - 1 1 2 ppm signals are 45%, 31% and 19%, respectively.
4. Discussion
4.1. Extraction of kaolinite and calcined kaolinite
The preparation of kaolinite-derived solids by HC1 extraction is dependent upon the HCl/kaolinite stoi- chiometry and most importantly, the temperature of calcination. With uncalcined kaolinite, less than 2% of the A1 and Si is removed following 4 h reaction at 98 ° C, wheras selective dealumination of 67% of alu- minum is obtained under similar reaction condi- tions for metakaolinite formed by calcination at 850°C for 8 h. These dealumination results are con- sistent with the early work by Grim [37] and Pask [39], and recent extraction studies studies of kaolin and 850°C calcined kaolin using the HCl-clay pro- cess [3 ]. Extraction of kaolinite at a 10.79/1 reac- tion stoichiometry over 16 d in 3 M HC1 at 98°C have revealed that selective removal of 83.3% A1 can be obtained with little removal of Si ( < 1%) to pro- duce a dealuminated product with a 10.4/1 Si/AI ratio.
4.2. Solid-state MASS :TAl and zgSi NMR studies of kaolinite solids
The solid-state MASS NMR results obtained for calcined and dealuminated kaolinite solids have pro- vided important qualitative and quantitative in- sights into the calcination and dealumination of ka- olinite. The MASS 27A1 NMR measurements of kaolinite show a sharp resonance due to a narrow

386 Y.J. Fitz£,erald et al. ~Aluminum-containing cla v mineral kaolinile
range of octahedral sites in the gibbsite-like layer of this 1 : 1 dioctahedral mineral [ 13 ]. The peak chem- ical shift of 5.1 ppm is consistent with previously re- ported high-field ( 11.7 T) measurements of the cen-
tral transition of this octahedral a luminum resonance by Kinsey [20]. Faster sample-spinning speeds al- low the observat ion of a minor Td a luminum reso- nance ( < 1%) not previously reported [17,19,20,24]. The N M R measurements provide a quant i ta t ive measure of the dea luminat ion of ka- olinite by 3 M HC1 extraction and are in excellent agreement (within 4%) with the AA analysis results for these dea luminated solids. In addit ion, the deal- uminat ion of kaolinite produces no significant changes in the remaining a luminum sites in the gibb- site layer since the l ineshape and chemical shift of the Oh a luminum N M R resonance is unchanged ex- cept for signal intensity decreases due to the degree of dealuminat ion.
The most interesting MASS 27A1 NMR spectral re- sulls were obtained for metakaol ini te and dealumi- nated metakaol ini te solids, which show three re- solved e~A1 NMR resonances at 8.2, 31.8, and 55.1 ppm. Due to the fast spinning speeds employed, these spectra are uncomplicated by the overlap of the spin- ning sidebands as has been observed previously us- ing lower-field N M R measurements [19,33,34,36]. These results thus provide the first MASS -'TAI NMR solid-state observat ions of these three NMR signals for calcined kaolini te which may be unambiguously dist inguished from spinning sidebands, and resolved sufficiently to obtain quant i ta t ive relative peak in- tensities. In addit ion, previous MASS 27A1 N M R studies for dehydroxyla ted kaolinite or metakaol in- lie samples at lower fields [ 33,34,36 ] have been lim- ited by the fact that the major i ty of the sample alu- minum (up to 90%) has been unobservable due to substantial line broadening due to the large second order quadrupolar effects at these lower fields. The work reported herein indicates that MASS 27A1 NMR measurements at 14.1 T and fast sample spinning fa- cilitate the observat ion of nearly all the a luminum resonance signal intensity. Interpretat ion of the three resolved resonances for metakaol in i te and dealu- minated metakaol ini te indicate that the 8.2 ppm res- onance arises from Oh sites s imilar to gibbsite (re- ported at 7.8 ppm for 11.7 T by Kinsey [20 ] ) , the 31.8 ppm resonance to either 5-coordinate [34,43]
or highly distorted tetrahedral a luminum [34], and the 55.1 ppm signal to tetrahedral a luminums, e.g. AI(OSi)4 or AI(OSi)3 etc. [15,20,46]. These latter two resonance assignments are clearly tentat ive at besl. since further NMR measurements are needed.
The -'TAI NMR spectra obtained for metakaol ini te dea luminated by 67% also shows thal nearly all the a luminum is N M R observable, and that these lhree NMR resonances have different relative intensities than the NMR peaks for metakaolini te . A decrease in the relative intensity of the 32 ppm signal relative to the Oh and Td signals following dealuminat ion suggests thai the dealuminat ion process may be more favorable for these 5-coordinate or dis torted Td alu- minums compared with the Oh or Td a luminum sites observed at 8 and 55 ppm, respectively. However, more detai led -~TAI NMR work is needed to obtain quant i ta t ive informat ion about this dealuminat ion process.
The C P / M A S S >Si NMR results reported herein have also shown new information about kaolinite and metakaol ini te before and following HC1 extraction. The >Si NMR spectrum of kaolinite exhibits a single sharp resonance at - 8 9 ppm due to Q ' (S i (OSi )~) sites in a chemical shift range consistent with the fourth second nearest neighbor being an Oh alumi- num atom [20,46]. HCI extraction of kaolinite from 32% to 83% dealuminat ion shows the appearance of two new addi t ional broad resonance signals at - 9 9 ppm and - 109 ppm, interpreted as due to silicon sites where the local chemical environment is sub- stantial ly altered following removal of a luminums from the nearby gibbsite-like a luminum lattice [ 13 ]. While the latter resonance at - 109 ppm, which re- quires longer contact t imes for max imum CP/MASS signal intensity (these silicons are probably poorly coupled to pro tons) , is probably due to Q4 Si(OSi )4 sites of amorphous silica formed in regions of this solid which are completely dea lumina ted and de- hydroxylatcd, the former signal at - 100 ppm may be associated with Q~ or Q4 silicon sites which have 1 or 2 second nearest neighbor a luminums [20,46] a n d / o r are not completely dehydroxylated, and therefore are more strongly coupled to protons. The s imilar dependence of the intensity of the - 89 ppm and - 1 0 0 ppm resonance on the ~H->Si contact t ime is in agreement with these tentat ive assign- ments of the local chemical environmenl of the sil-

J.J. Fitzgerald et al. ~Aluminum-containing clay mineral kaolinite 387
icon sites observed. The quant i ta t ive C P / M A S S 29Si N M R measurements for a number of the dealumi- nated kaolini te samples (e.g., 384 h extract ion sam- ple) show that the relative intensity of the three res- onances may be correlated with the degree of dealuminat ion . However, further s tudy of the cross- polar izat ion dynamics of these mater ia ls using con- tact t ime study approaches such as those repor ted by Maciel [44,45] for silica gels, is needed to fully val- idate these quant i ta t ive relationships. In addi t ion, the large spectral intensi ty differences between CP and FT spectra for a number of samples also suggest an area for more detai led investigation.
5. Conclusions
to the absence of changes in the a luminum local chemical envi ronment in the AI (OH)3 layer follow- ing dea lumina t ion from the 27A1 N M R results. The CP/MASS 29Si N M R results also suggest that quan- t i tat ive informat ion may be obta ined on the nature of these new silicon sites following further contact t ime studies and F T / M A S S measurements of these samples.
The combined use of high-field 27A1 MASS N M R and C P / M A S S 29Si N M R will likely provide addi- t ional insights into the thermal and dea luminat ion processes of this 1:1 dioctahedral clay mineral , and will be appl ied to future studies of the solid-state re- actions of other 2:1 dioctahedral or tr ioctahedral clay minerals.
These investigations have defined the reaction condi t ions needed to prepare kaolini te solids of var- ious degrees of dealuminat ion by HC1 extraction. The dea lumina t ion is dependent upon the HC1/kaol ini te reaction ratio and most important ly , the .degree of dehydroxyla t ion of kaolini te up to 850°C. Metaka- olinite, a poorly ordered material , can be dealumi- nated completely in four hours at 98°C.
MASS 27A1 and C P / M A S S 29Si N M R studies of kaolinite, metakaol ini te , and various dea lumina ted solids der ived from these clay mater ia ls by HC1 ex- t ract ion offer unique oppor tuni t ies to examine the mechanisms of dehydroxyla t ion and dea lumina t ion processes of this mineral . This work has demon- strated that high-field ( 14.1 T) fast sample-spinning ( 14.5 kHz) MASS 27A1 N M R spectroscopy provides a means to not only quant i fy the dea lumina t ion of kaolinite, but to also obtain new structural infor- mat ion about the chemical envi ronment o f the alu- minum sites in solids produced from this l : l dioc- lahedral clay mineral before and following dea luminat ion . While previous MASS 27A[ N M R work at the lower fields used to study the thermal reactions of kaolini te and metakaol in i te has been l imited by the fact that 90% of the a luminum is not NMR observable, this 27A1 N M R work at 14.1 T with fast sample-spinning suggests that these exper iments provide a means to observe nearly all of the alumi- num in these materials. The C P / M A S S 29Si N M R results suggest that the dea lumina t ion of kaolini te greatly alters the silica layer of this clay, in contrast
Acknowledgement
The authors gratefully acknowledge the Colorado State Univers i ty Regional N M R Center, funded by Nat ional Science Founda t ion Grant No. CHE8616437, for use of their excellent N M R facilities.
References
[ 1 ] P. Laszlo, Science 235 (1987) 1473. [ 21 D.L. Sawyer, Jr and T.L. Turner, Pressure Leaching Alumina
From Raw Kaolinitic Clay Using Hydrochloric Acid (U.S. Bureau of Mines, Dept. of Interior, Report RI 8978, 1985 ) pp. 1-18.
[ 3 ] P.R. Bremner, L.N. Nicks and D.J. Bauer, A Basic Chloride Method for Extracting Aluminum from Clay (U.S. Bureau of Mines, Dept. of Interior, Report RI 8866 1984) pp. 1-8.
[4] K.B. Bengtson, Light Metals 1 (1979) 217. [ 5 ] L.L. Hench, D.R. Ulrich, eds. in: Ultrastructure processing
of ceramics, glasses and composites (Wiley, New York 1984}.
[6] N. lchinose, Introduction to fine ceramics (Wiley, New York, 1987).
[7] L.L. Hench and D.R. Ulrich, eds. in: Science of ceramic chemical processing (Wiley, New York, 1986 ).
[ 8 ] S.W. Bailey, in: Crystal structures of clay minerals and their X-ray identification, eds. G.W. Brindley and G. Brown, Mineralogical Society Monograph No. 5 (Mineral. Soc. London 1980) pp. 28-39, chapt. 1.
[9] W.B. Jepson, Phil. Trans. R. Soc. Lond. A311 (1984) 411. [10] R.M. Barrer, in: Hydrothermal chemistry of zeolites
(Academic Press, London, 1982 ) pp. 216-230.

388 J.J. Fitzgerald et al. ~Aluminum-containing clay mineral kaolinite
[ I 1 ] R.M. Breck, in: Zeolite molecular sieves: structure, chemistry' and use (Wiley. New York, 1974) pp. 731-738.
[12] W. Ryan, Properties of ceramic raw materials (Pergamon Press, Oxford, 1978 ).
[ 13] G. Brown, Phil. Trans. R. Soc. Lond. A3111 91984) 22l. [ 14 ] E. Lippmaa. M. Magi, A. Samoson. G. Engelhardt and A.R.
Grimmer, J. Am. Chem. Soc. 102 (1980) 4889. [15]E. Lippmaa, M. Magi, A. Samoson, M. Tarmak and G.
Engelhardt, J. Am. Chem. Soc. 103 ( 1981 ) 4992. [ 16 ] J. Sanz and J.M. Serratosa, Clay Miner. 19 ( 1984 ) 113. [ 17 ] K.J.D. MacKenzie. I.W.N. Brown, R.H. Meinhold and M.E.
Bowden, J. Am. Ceram. Soc. 68 (1985) 266. [18] K.A. Smith, R.J. Kirkpatrick, E. Oldfield and D.M.
Henderson, Am. Miner. 68 (1983) 1206. [ 19] S. Komarneni, C.A, Fyfe and G.J. Kennedy, Clay Miner. 20
(1985)327. [20] R.A. Kinsey, R.J. Kirkpatrick, J. Hower. K.A. Smith and E.
Oldfield, Am. Miner. 70 (1985) 537. [21 ] J.G. Thompson, Clay Miner. 19 (1984) 229. [22] P.F. Barron, L.F. Raymond, J.O. Skjemstad and A.J, Koppi,
Nature 302 (1983) 49. [ 23 ] J.G. Thompson, Clays Clay Miner. 32 ( 1984 ) 233. [24J Y.V. Shulepov. A.S. Litovchenko, A.A. Melnikov, V.Y.
Proshko and V.V. Kulik, J. Magn. Reson. 53 (1983) 178. [25] J. Klinowski, Prog. NMR Spectroscopy 16 (1984) 237;
J.M. Thomas and J. Klinowski, Adv. Catal. 33 ( 1985 ) 199. [26J G.L. Turner, R.J. Kirkpatrick, S.H. Risbud and E. Oldfield,
~m. Ceram. Soc. Bull. 66 (1987) 656. [27} R.J. Kirkpatrick, T. Dunn, S. Schramm, K.A. Sinter, R.
Oestrike and G, Turner, in: Structure and bonding noncrystallne solids, eds. G.E. Walrafer and A.G. Revesz ( Plenum Press, New York, 1986 ) pp. 303-323.
[28] M. NoD, G. Engelhardt, F.G. Wihsmann, K. Forkel, M. Magi and E. Lippmaa, Z, Chem. 26 (1986) 221.
[29] E. Hallas, B. Schnahel and M. Haehnert, Silikattechnik 37 (1986)279.
[30] R.V. Mulkern, S.H. Chung, P.J. Bray, G.d. Chwssikos, D.E. Turcotte and W.M. Risen, J. Non-Cyst. Solids 85 (1986) 69.
[ 31 ] J.M. Thomas, J. Klinowski, P.A. Wright and R. Roy, Angew. Chem. Ind. Ed. Engl. 22 (1983) 614.
[32] C.W. Burnham, Year Book Carnegie Inst., Washington 63 (1964) 223.
[33] R.H. Meinhold, K.J.D. MacKenzie and I.W.M. Brown, J. Mater. Sci. Letters 4 (1985) 163.
[ 34 ] K.J.D. MacKenzie, I.W.N, Brown, R.H. Meinhold, and M.E. Bowden J. Am. Ceram. Soc. 68 (1985) 293.
[35] I.W.M. Brown, K.J.D. MacKenzie, M.W. Bowden and R.H. Meinhold, J. Am. Ceram. Soc. 68 ( 1985 ) 298.
[36] T. Watanabe, H. Shimizu, K. Nagasawa, A. Masuda and H. Saito, Clay Miner. 22 (1987) 37.
[37] R.W. Grim, Clay mineralogy, 1st Ed. (McGraw-Hill, New York, 1953) pp. 190-216.
[38] G.S. Tilley, R.W. Millar and O.C. Ralston, Acid Processes for the Extraction of Aluminum (Bureau of Mines, Dept. of Interior) B267 (1972) pp. 19-45.
[ 39 ] J.A. Pask and B. Davies, Thermal Analysis of Clay Minerals and Acid Extraction of Alumina From Clays (Bureau of Mines, Dept. of Interior) Technical paper 664 ( 1945 ) pp. 661-687.
[40] N K . Mitra, P.K. Das Poddar and R.K. Mandal, J. Aust. Ceram. Soc. I 7 (1981) 52.
[41 ] I.D. Gay, J. Magn. Reson. 58 (1984) 413. [42]S.F. Dec. R.A. Wind, G.E. Maciel and F.E. Anthonio, J.
Magn. Reson. 70 (1986) 355. [43] L.B. Alemany and G.W. Kirker, J. Am. Chem. Soc. 108
(1986) 6158. [44] G.E. Maciel and D.W. Sindorf, J. Am. Chem. Soc. 102
(1980) 7606. [45] D.W. Sindorf and G.E. Maciel, J. Am. Chem. Soc. 105
(1983) 1487. [46] R.J. Kirpatrick, K.A. Smith, S. Schramm, G. Turner and
W.H. Yang, Ann. Rev. Earth Planet, Sci. 13 (1985) 29. [47] R.E. Grim, in: Clay mineralogy, 2nd Ed., (McGraw-Hill,
New York, 1968)pp. 130-134. [48] L.A. Hodgins, M.S. Thesis (South Dakota School of Mines
and Technology, South Dakota, 1982 ).