KAOLINITE PARTICLE SIZES IN THE
11
Clays and Clay Minerals, Vol. 41, No. 5, 613~523, [993. KAOLINITE PARTICLE SIZES IN THE <2 pM RANGE USING LASER SCATTERING IAN D. R. MACKINNON, PHILIPPAJ. R. UWINS, ANYA YAGO, AND DAVID PAGE Centre for Microscopy and Microanalysis, The University of Queensland St. Lucia QLD 4072 Australia Al~tract--The Clay Minerals Society Source Clay kaolinites, Georgia KGa-1 and KGa-2, have been subjected to particle size determinations by 1) conventional sedimentation methods, 2) electron micros- copy and image analysis, and 3) laser scattering using improved algorithms for the interaction of light with small particles. Particle shape, size distribution, and crystallinity vary considerablyfor each kaolinite. Replicate analyses of separated size fractions showed that in the <2 pm range, the sedimentation/ centrifugation method of Tanner and Jackson (1947) is reproducible for different kaolinite types and that the calculated size ranges are in reasonable agreement with the size bins estimated from laser scattering. Particle sizes determined by laser scattering must be calculated using Mie theory when the dominant particle size is less than - 5 urn. Based on this study of two well-known and structurally different kaolinites, laser scattering, with improved data reduction algorithms that include Mie theory, should be considered an internally consistent and rapid technique for clay particle sizing. Key Words--Kaolinite, Laser scattering, Particle size. INTRODUCTION Detailed studies of kaolins from a range of different localities show that these clays occur in a wide variety of forms of varying crystalline perfection and show wide ranges of particle size distributions. Kaolins from the Georgia region alone demonstrate a range of crystal perfection from "well ordered" to "poorly ordered," and contain variable proportions of crystalline and non- crystalline material (e.g., Hinckley, 1963; Fripiat and van Olphen, 1979). The structural order or disorder of kaolinite grains has been studied, usually by powder X-ray diffraction (XRD) methods, in order to correlate such data with geological environment, mechanical processing (such as grinding or transport), or industrial utility (Murray and Lyons, 1956; Brindley et al., 1986). In addition, studies that assess the variation of a ka- olinite property with particle size have noted widely varying correlations between, for example, particle size and "crystallinity index" for a given kaolinite sample (Olivier and Sennett, 1973; Brindley et al., 1986; Tet- tenhorst and Corbato, 1986; Lombardi et al., 1987), Some of this particle size variation observed in natural samples may be due to inappropriate use of sizing tech- niques for a particular size range (e.g., McCave et al., 1986), poor reproducibility of the sizing technique; or, alternatively, this may be due to natural variations in kaolin size distributions with a specific property. For some clays, the <2 pm size range is an important frac- tion that may determine the nature of bulk physical properties. Indeed, as shown by Lombardi et al. (1987) marked differences in structural and compositional properties can be obtained between size fractions of the same kaolin. In most, if not all, cases, particle size fractions are determined by the gravitational settling method out- Copyright 1993, The Clay Minerals Society lined by Tanner and Jackson (1947) or variations on this approach. This method is practical for particle sizes greater than about 2 pm equivalent spherical di- ameter. Thus, some size distribution studies have in- cluded sample splits into size fractions greater than 2 urn, with all smaller particles classified into the <2 ~m fraction. For < 2 pm particles, separation into smaller- sized fractions can be effected by centrifugation using the nomograms and algorithms developed by Tanner and Jackson (1947). As noted by Lombardi et al. (1987) and others, the size range of these separates bears only a nominal relationship to the actual sizes of the sep- arated particles due to the non-spherical shape of ka- olinite particles and their subsequent settling behav- iour in an aqueous solution. In this study, no attempt is made to correct for the particular shape of individual clay particles or to average shape effects in the calcu- lation of size distributions. Corrections for particle shape are possible with the laser scattering process described below (Brown and Felton, 1985), but are outside the scope of this study. Furthermore, size distribution methods commonly used for clays do not correct for shape in any rigorous fashion. Hence, all methods com- monly used will inherently contain a systematic error related to the presumed average shape of clay particles. With the advent of laser-based particle sizing tech- niques, a rapid basis for the determination of size dis- tributions from low concentrations or small quantities of sample emerged, particularly for spherical particles of diameter > ] 0 pm (Cornillault, 1972). A comparison of laser scattering techniques with conventional siev- ing-pipette methods showed that, for ten standard soil samples, there was good agreement between the two methods for size ranges from about 16 pm to 62 #m (Cooper et al., 1984). However, data obtained via laser 613
Transcript of KAOLINITE PARTICLE SIZES IN THE
Clays and Clay Minerals, Vol. 41, No. 5, 613~523, [993.
KAOLINITE PARTICLE SIZES IN THE <2 pM RANGE USING LASER SCATTERING
IAN D. R. MACKINNON, PHILIPPA J. R. UWINS, ANYA YAGO, AND DAVID PAGE
Centre for Microscopy and Microanalysis, The University of Queensland St. Lucia QLD 4072 Australia
Al~tract--The Clay Minerals Society Source Clay kaolinites, Georgia KGa-1 and KGa-2, have been subjected to particle size determinations by 1) conventional sedimentation methods, 2) electron micros- copy and image analysis, and 3) laser scattering using improved algorithms for the interaction of light with small particles. Particle shape, size distribution, and crystallinity vary considerably for each kaolinite. Replicate analyses of separated size fractions showed that in the <2 pm range, the sedimentation/ centrifugation method of Tanner and Jackson (1947) is reproducible for different kaolinite types and that the calculated size ranges are in reasonable agreement with the size bins estimated from laser scattering. Particle sizes determined by laser scattering must be calculated using Mie theory when the dominant particle size is less than - 5 urn. Based on this study of two well-known and structurally different kaolinites, laser scattering, with improved data reduction algorithms that include Mie theory, should be considered an internally consistent and rapid technique for clay particle sizing. Key Words--Kaolinite, Laser scattering, Particle size.
INTRODUCTION
Detailed studies of kaolins from a range of different localities show that these clays occur in a wide variety of forms of varying crystalline perfection and show wide ranges of particle size distributions. Kaolins from the Georgia region alone demonstrate a range of crystal perfection from "well ordered" to "poorly ordered," and contain variable proportions of crystalline and non- crystalline material (e.g., Hinckley, 1963; Fripiat and van Olphen, 1979). The structural order or disorder of kaolinite grains has been studied, usually by powder X-ray diffraction (XRD) methods, in order to correlate such data with geological environment, mechanical processing (such as grinding or transport), or industrial utility (Murray and Lyons, 1956; Brindley et al., 1986). In addition, studies that assess the variation of a ka- olinite property with particle size have noted widely varying correlations between, for example, particle size and "crystallinity index" for a given kaolinite sample (Olivier and Sennett, 1973; Brindley et al., 1986; Tet- tenhorst and Corbato, 1986; Lombardi et al., 1987), Some of this particle size variation observed in natural samples may be due to inappropriate use of sizing tech- niques for a particular size range (e.g., McCave et al., 1986), poor reproducibility of the sizing technique; or, alternatively, this may be due to natural variations in kaolin size distributions with a specific property. For some clays, the <2 pm size range is an important frac- tion that may determine the nature of bulk physical properties. Indeed, as shown by Lombardi et al. (1987) marked differences in structural and compositional properties can be obtained between size fractions of the same kaolin.
In most, if not all, cases, particle size fractions are determined by the gravitational settling method out-
Copyright �9 1993, The Clay Minerals Society
lined by Tanner and Jackson (1947) or variations on this approach. This method is practical for particle sizes greater than about 2 pm equivalent spherical di- ameter. Thus, some size distribution studies have in- cluded sample splits into size fractions greater than 2 urn, with all smaller particles classified into the <2 ~m fraction. For < 2 pm particles, separation into smaller- sized fractions can be effected by centrifugation using the nomograms and algorithms developed by Tanner and Jackson (1947). As noted by Lombardi et al. (1987) and others, the size range of these separates bears only a nominal relationship to the actual sizes of the sep- arated particles due to the non-spherical shape of ka- olinite particles and their subsequent settling behav- iour in an aqueous solution. In this study, no attempt is made to correct for the particular shape of individual clay particles or to average shape effects in the calcu- lation of size distributions. Corrections for particle shape are possible with the laser scattering process described below (Brown and Felton, 1985), but are outside the scope of this study. Furthermore, size distribution methods commonly used for clays do not correct for shape in any rigorous fashion. Hence, all methods com- monly used will inherently contain a systematic error related to the presumed average shape of clay particles.
With the advent of laser-based particle sizing tech- niques, a rapid basis for the determination of size dis- tributions from low concentrations or small quantities of sample emerged, particularly for spherical particles of diameter > ] 0 pm (Cornillault, 1972). A comparison of laser scattering techniques with conventional siev- ing-pipette methods showed that, for ten standard soil samples, there was good agreement between the two methods for size ranges from about 16 pm to 62 #m (Cooper et al., 1984). However, data obtained via laser
613
614 Mackinnon, Uwins, Yago, and Page Clays and Clay Minerals
scattering for size ranges < 16 #m and, in particular, for the 1.9 #m to 3.0 #m size range showed the poorest agreement with the conventional sedimentat ion meth- od. Another evaluation of a laser scattering particle sizer from a competing manufacturer by McCave et al. (1986) showed similarly poor results for small-sized particles. Results for clay-sized particles were partic- ularly disappointing, being neither accurate nor precise (McCave et al., 1986).
In both these cases, the Fraunhofer diffraction theory was used to model the forward scattering of light. Bay- vel and Jones (1981) noted that particles smaller than between 2 #m to 7 ~tm should not be sized using Fraun- borer diffraction models (depending on whether the particles are transparent or opaque) as errors in excess of 20% will occur. In general, the reason for these errors in this size range is that the wavelength of the incident light must be significantly smaller than the size of the particle to be measured. For He-Ne lasers (the most commonly used), the wavelength is ~ 0.6 #m and thus, particles to be measured must be significantly larger than 1 gm (Miller and Lines, 1988). However, other studies have shown that the laser scattering method, when combined with an appropriate data reduction algorithm such as the Mie model for light scattering (Mie, 1908), provides good estimates of particle size distributions for sizes much closer to the wavelength of incident light (e.g., Dodge, 1987; de Boer et al., 1987).
In this paper, we discuss the application of improved laser scattering instrumentat ion to particle size anal- yses of kaolinite clays that show various crystallograph- ic and morphological properties. A comparison of par- ticle size distr ibutions calculated using Fraunhofer and Mie scattering theories is also undertaken for selected kaolinite samples to demonstrate the variations in ca- pabili ty of the respective algorithms used to reduce laser scattering data. In addition, we report on a study of kaolinite size fractions separated by the method of Tanner and Jackson (1947). This comparison of mea- sured particle size fractions in the <2 #m diameter range provides an assessment of the effectiveness of the size fractionation by centrifugation process.
EXPERIMENTAL MATERIALS A N D METHODS
Materials
Kaolinite samples from the CMS Source Clays from Georgia, K G a - l and KGa-2 (Fripiat and van Olphen, 1979), as well as a sample from an Australian deposit, an actively mined site at Weipa, were chosen for this study. The Weipa sample is included in this study to illustrate specific difficulties associated with size frac- t ionation of clays. The kaolinites, Georgia KGa-1 and KGa-2, are from Cretaceous and Tert iary brackish to marine environments with waters of similar isotopic composi t ion (Hassanipak and Eslinger, 1985). The
Georgia samples represent kaolinite crystallographic properties of widely varying type, including Hinckley indices for "well-crystall ized" and "poorly-crystal- l ized" clays (Hinckley, 1963) or, alternatively, both single phased and biphased defect structure types (Plancon and Zacherie, 1990). In general, differences in the degree of disorder appear related to differences in the geological environments of kaolinite accumu- lation (Brindley et al., 1986).
Particle size fractionation
Well-dispersed kaolinite samples were prepared by adding 100 ml of ultra-pure water to 5g o f kaolinite. This solution was placed in an ultrasonic tank for 15 min. Three ml of 10% Calgon solution were added to this slurry as an antiflocculant. The aqueous suspension was then separated into six size fractions by repeated ccntrifugation following the method outlined by Tan- ner and Jackson (1947). Each size fraction was dried in an oven at 120~ and subsequently weighed on a Mettler balance to determine the weight percentage abundance of each separate with respect to the bulk sample. For most samples, the smallest size fraction (i.e., <0.3 ~m, or fraction "F") proved very difficult to characterize by the laser scattering technique due to coagulation of particles during analysis and, thus, data are not reported for this fraction. For samples KGa-1 and KGa-2, replicate size fractionations were per- formed in order to estimate the level of reliability of the sedimentat ion process.
Characterization
Imaging methods. Transmission electron microscopy (TEM) was performed on samples dispersed on carbon films using the following instruments: a JEOL 4000FX operating at 400 kV equipped with a Link Ge energy dispersive spectrometer (EDS) and Moran Scientific Analyser, a Philips 400T operating at 120 kV, and a Hitachi H-800 operating at 200 kV. Over this range of operating voltages, variations in electron beam dam- age rates were observed for some samples. In specific cases, this beam damage was minimized by the use of a Gatan LN2 double tilt holder. Scanning electron mi- croscopy (SEM) was undertaken with two instruments: a JEOL 6400F and a JEOL 890F both equipped with field emission guns. In general, both SEMs were op- erated at low accelerating voltages (i.e., < 5 kV) as the majori ty of samples were examined without a con- ductive coating. The JEOL 6400F was equipped with a Link ultra-thin window Si(Li)EDS and Moran Sci- entific Analyser. Image analysis for particle sizing uti- lized a Wild Leitz M D - 3 0 + image analysis system that included a video camera with 512 x 512 pixel size for capture o f optical or electron-optical images. Standard image processing software was used to reduce raw data to compiled size distributions.
Estimates of particle size distr ibutions within each
Vol. 41, No. 5, 1993 Kaolinite particle sizes 615
size fractionated sample were obtained 1) by weight of kaolinite and 2) by laser scattering of dispersed sam- pies. These two approaches are not directly compa- rable, as they measure quite different parameters of each sample (e.g., mass and light scattering), but they provide an approximate guide to the interpretations provided in the discussion section. Individual particle sizes of a standard spherical sample with nominal monomodal size distribution have been obtained by calibrated measurements from SEM micrographs. In general, over 1500 measurements have been made in order to estimate the size distribution of this standard material.
Diffraction methods. Particle size distributions may be measured over the range 0.1-600 um using laser scat- tering in a flow-through cell with a Malvern Master- sizer E. For experiments reported here, only the size range from 0.1-80 um was examined using the 45 mm lens of the Malvern Mastersizer E. During analysis, samples were constantly stirred in a 25 ml water sus- pension containing 3 ml of 10% Calgon solution. In the Malvern Mastersizer E used, the beam diameter is 13 mm, and the path length in the sample cell is 14.3 mm for all experiments reported. For all sizings of kaolinites using laser diffraction, the refractive index for kaolinite was used in the data reduction algorithm. All scattering data, except the Fraunhofer models shown in Figures 4 and 6, were reduced to size distributions using Mie theory. Techniques for size determination via laser scattering are well established and are docu- mented in the particle characterization literature (Al- len, 1981; Miller and Lines, 1988). Replicate analyses of the same sample, as well as replicate analyses of sample fractions (using the method of Tanner and Jack- son, 1947), were analyzed by the Malvern Mastersizer E. For replicate analyses, estimated standard devia- tions for each mean value are calculated by standard statistical techniques and are shown in parentheses to the last significant figure of each value (i.e., 2.47(3) means 2.47 _+ 0.03).
RESULTS
Imaging method
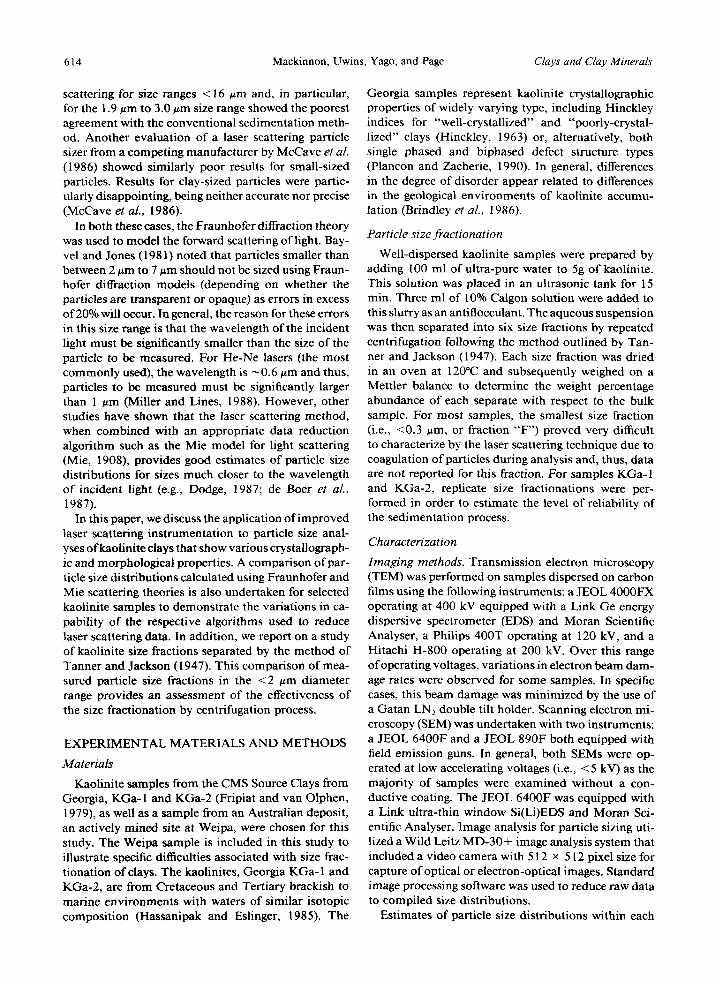
Measurement of kaolinite grain sizes from SEM and TEM micrographs shows that the centrifuge/sedimen- tation procedure of Tanner and Jackson (1947) gen- erally produced well-defined, unimodal size fractions. Typical SEM micrographs of three different size frac- tions ("A," "C" and "E," respectively) for the Weipa sample are shown in Figure 1. SEM micrographs of the large size fraction ofKGa- 1 show similar morphologies to the Georgia kaolinite presented by Lombardi et al. (1987). The larger-sized grains in KGa-2 are less de- fined with embayed edges.
For the smaller particles, measured particle sizes within individual fractions varied by less than 0.3 #m
Figure 1. Scanning electron micrographs of size separated fractions of the Weipa sample: A) fraction A, >2.0 ~tm; B) fraction C, between 0.5 gm and 0.6 um; and C) fraction E, between 0.3 um and 0.4 ~m, Each size fraction appears uni- form in distribution and progressively smaller in size.
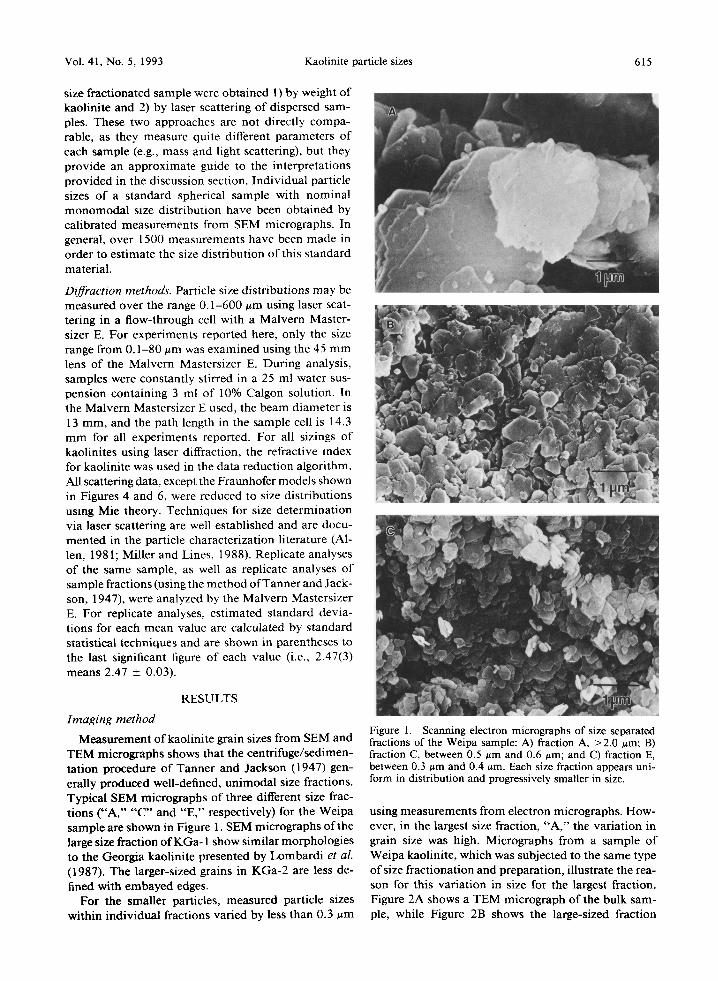
using measurements from electron micrographs. How- ever, in the largest size fraction, "A,'" the variation in grain size was high. Micrographs from a sample of Weipa kaolinite, which was subjected to the same type of size fractionation and preparation, illustrate the rea- son for this variation in size for the largest fraction. Figure 2A shows a TEM micrograph of the bulk sam- ple, while Figure 2B shows the large-sized fraction
616 Mackinnon, Uwins, Yago, and Page Clays and Clay Minerals
Figure 2. Transmission electron micrographs of dispersed particles from four different size ranges of Weipa kaolinite: A) the bulk sample, without size fractionation; B) size fraction A, nominally > 2 ~m size, showing both large particles and adhering small particles; C) size fraction C, between 0.5 and 0.6 urn; and D) size fraction E, between 0.3 and 0.4 ~tm. In the latter two cases, relatively uniform particle sizes can be observed.
(fraction "A") for the Weipa kaolinite. Even though large kaolinite particles are well-dispersed on the sub- strate, there is clearly a residual amount of finer grained material adhering to the larger particles. This adhesion of smaller particles on larger kaolinite plates appeared to be insignificant for the smaller size fractions, Re- tention of these smaller, residual particles on larger plates clearly makes difficult the precise estimate of clay particle size distributions using electron micros- copy and/or image processing techniques. In addition, the range of particle sizes in the >2 um fraction is considerably greater than in any other separated frac- tion. Thus, a large error in the determination of average particle size using measurements from electron micro- graphs can be expected for the A size fraction. For comparison, Figures 2C and 2D show TEM micro- graphs of the Weipa C and E size fractions, respectively. Both these fractions show a relatively uniform distri- bution of particle sizes.
Gravimetric method
Table 1 gives a summary list of weight percentages of the bulk sample determined by gravimetric methods for each of five size fractions separated by centrifu- gation. The two Georgia kaolinites (averaged data from two sets of analyses) show distinctly different distri- butions of particles in each size fraction range. In some cases, (e.g., fractions C and D of KGa-2) the same weight percentage value for the given size fraction was obtained for each replicate analysis.
Laser diffraction method
Calibration and reproducibility. For typical clay sizes, it is appropriate to test for both the absolute calibration of the instrument and the reproducibility of results over a given period of time. In this study, a monomodal distribution of latex spheres has been analyzed using laser diffraction with the Malvern Mastersizer E and
Vol. 41, No. 5, 1993 Kaolinite particle sizes 617
Table 1. Weight percentage* of size fractions.
Frac t ion Geo rg i a K G a - 1 G e o r g i a K G a - 2
A 49 (4) 9 (1) B 28 (5) 17 (1) C 13 (4) 23 (0) D 5 (I) l0 (0) E 6 (1) 42 (1)
* Values in parentheses are one esd (estimated standard deviation) for replicate analyses.
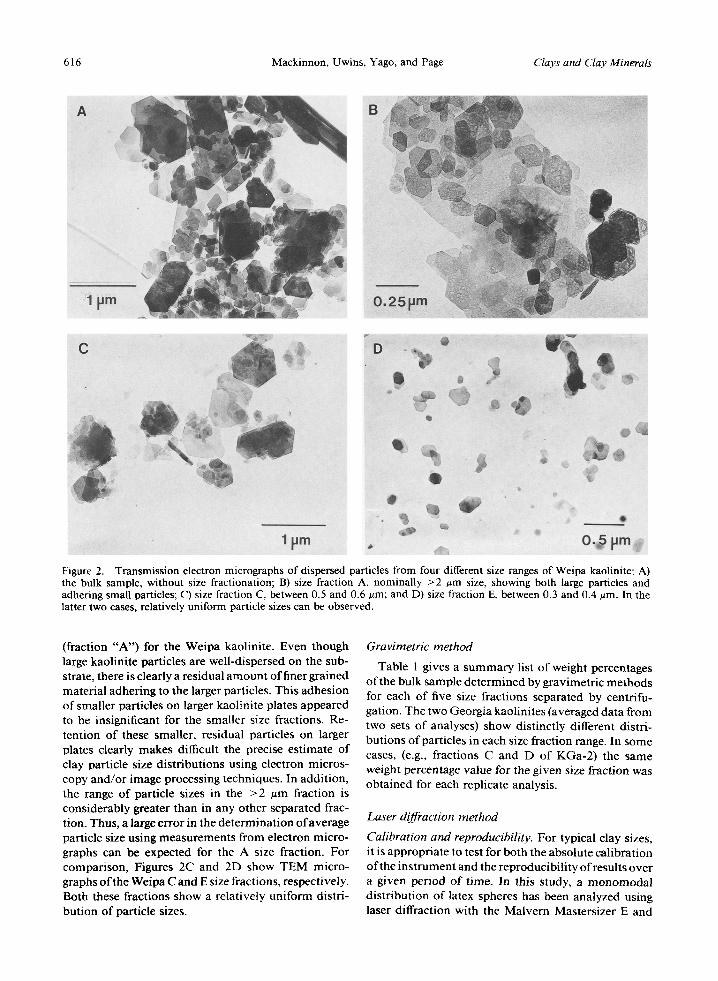
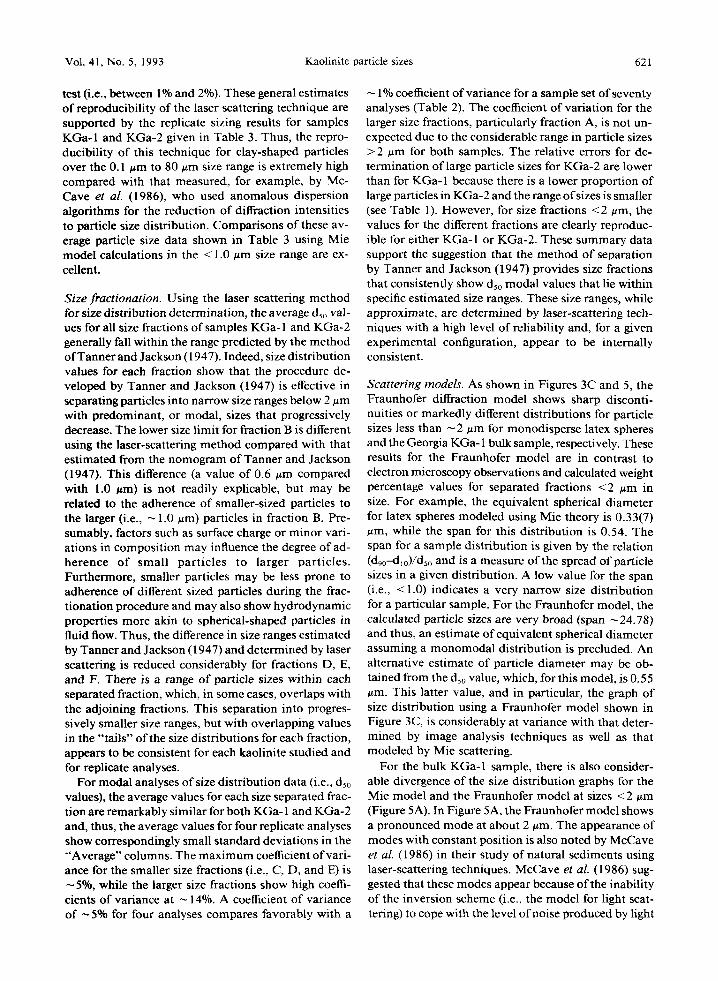
using image analysis of calibrated SEM images. Figure 3 shows the results of size distribution analyses for this sample of latex spheres via both methods. In Figure 3A, the sizes determined by laser diffraction follow a typical monodisperse distribution with an equivalent spherical particle diameter of 0.33(7) #m. Using the image analysis technique on 1644 individual latex spheres, the average particle diameter for the distri- bution shown in Figure 3B is 0.34(7) #m. For com- parison, Figure 3C shows the same particle size dis- tribution as in Figure 4A using Mie scattering theory as well as for the Fraunhofer diffraction model plotted as volume distribution.
The Malvern Mastersizer E has been carefully con- figured to provide reproducible results over the 0.1- 80 #m size range. In order to test for long-term repro- ducibility of this technique over periods of weeks and to assess systematic errors not related to shape for a typical clay sample, kaolin-microwhite supplied by Commercial Minerals was used for a series of 70 sep- arate size distribution determinations using the same conditions for the 0.1-80 ~zm range lens (45 mm). The 70 determinations consisted of seven separate samples of the same material, analyzed l0 times. The repro- ducibility of results using this technique for the three primary modal values used in this study are given in Table 2. For the size range containing the majority of particles, d~o, the coefficient of variance is less than 0.5%. For the lower abundance size ranges, the coef- ficient of variance ranged between 1% and 2%.
For all size separated fractions of the Georgia sam- ples, replicate analyses were performed on the same size fraction using the Malvern Mastersizer E. In some cases, samples were constantly stirred and ultrasoni- cated in solution and constantly monitored for size d is t r ibut ion(s ) un t i l a u n i m o d a l d i s t r i bu t ion was achieved. This precaution was taken because, for some of the smaller size fractions, agglomeration of particles was observed on initial dispersion in the flow-through cell. Figure 4 shows particle size distributions for two size-separated fractions, Weipa E and Georgia KGa-1 B, taken at various times after initial dispersion in the flow-through cell. For the Georgia sample (Figure 4B), the same size distribution is shown in three measure- ments taken over a 30-minute period, with the same dso value for each measurement. However, the Weipa
Z
-i
V.,
m o
2 0
; ! �9 !
12 ~ ~. a
s #
a
0 . . . . '+'i; : 0.I
. . . . . Mie Model ]
i ! i. i s i. t
i. s
I
P a r t i c l e S i z e ( g m )
A
10
300
25O
200
lSO
100
50
0 0.1
i
I
Particle Size (p.m)
I i l
10
20
| " .'-.-Mic Model 16 i ! L-- - =Fraunhofer Model
! t ; i
; ;
I . %.
0 ~ :" : : , t ' ~ : ' , ~ : ~ ' ~ , ' , . : ~ : ~ : ~ 0.1 1 10 100
P a r t i c l e S i z e (p .m)
Figure 3. Particle size distributions for a standard sample of latex spheres determined by A) laser scattering using the Mie model and B) image analysis from calibrated electron micrographs. C) indicates distributions from the same laser- scattering data calculated using the Mie and Fraunhofer models respectively.
618 Mackinnon, Uwins, Yago, and Page Clays and Clay Minerals
@
1 0
- - - - t = 4 0 ra ins , d 5 0 = 0 . 3 5
8 . . . . . t = 3 0 ra ins , d 5 0 = 0 . 4 5
. . . . . t = 2 0 m i n s , d 5 0 = 0 . 5 5
- - - t = l O ra ins , d50=0 .71
6 - - t - - O min, d 5 0 = 2 . 6 5
/ . \
|/,..),'
O.1 1 1 0 100
Particle Size (~tm)
_=
1 0 A
. . . . . M i e M o d e l / - - - F r a u n h o f e r M o d e l |
J
4
/ . %.
2 . s t " ' ~ _ _
I ~ I . ~ " / "%
s Nt.
0 . 1 1 ' ' 1 0 100
Particle Size (~tm)
1 0
4 /
/
/ i "
0 " / , *
0 . 1
B
d :0 .88 pm J . ~ �9 ,4 5 e
i, I
I. I
: : : : : : ~ , , , , , q ~ ' ~ ] - ' - - - r - - a - ' r ' r - : - ~ : ,
1 1 0 100
Particle Size (~m)
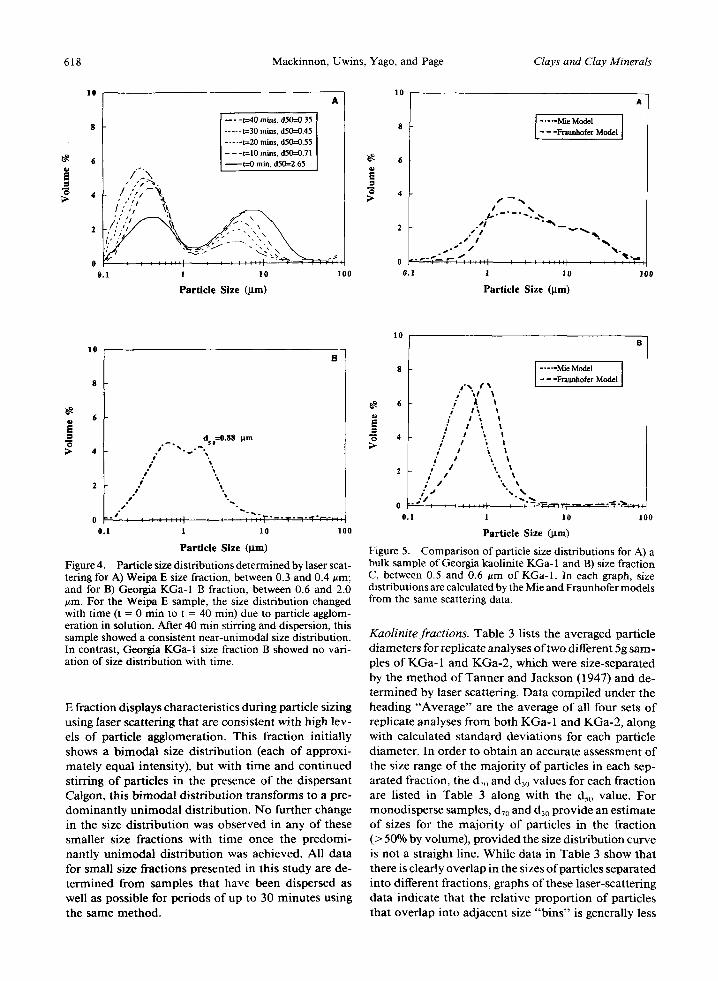
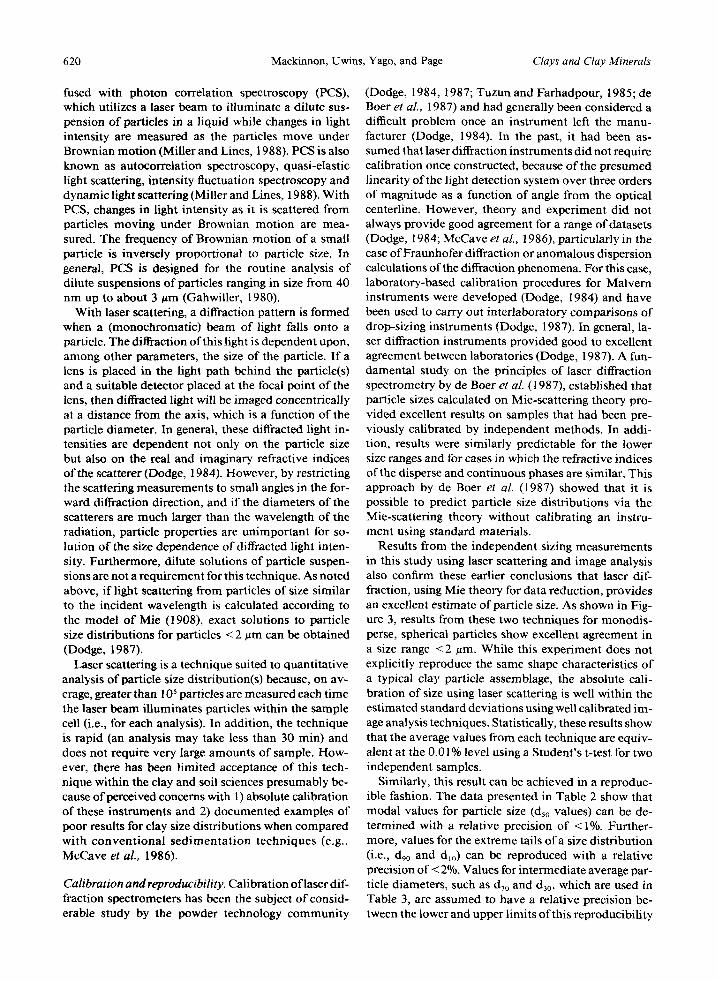
Figure 4. Particle size distributions determined by laser scat- tering for A) Weipa E size fraction, between 0.3 and 0.4 ,m; and for B) Georgia KGa-1 B fraction, between 0.6 and 2.0 urn. For the Weipa E sample, the size distribution changed with time (t = 0 rain to t = 40 min) due to particle agglom- eration in solution. After 40 rain stirring and dispersion, this sample showed a consistent near-unimodal size distribution. In contrast, Georgia KGa-1 size fraction B showed no vari- ation of size distribution with time.
E fraction displays characteristics during particle sizing using laser scattering that are consistent with high lev- els of particle agglomeration. This fraction initially shows a bimodal size distribution (each of approxi- mately equal intensity), but with time and continued stirring o f particles in the presence o f the dispersant Calgon, this bimodal distribution transforms to a pre- dominantly unimodal distribution. No further change in the size distribution was observed in any of these smaller size fractions with time once the predomi- nantly unimodal distribution was achieved. All data for small size fractions presented in this study are de- termined from samples that have been dispersed as well as possible for periods of up to 30 minutes using the same method.
1 0
. . . . . Mie M o d e l ]
- - - F r a u n h o f e r M o d e l
= i t "~ t
; J "~ I / / "~ I x 2 ; z "~
; z "x x
. . . . . . . . i . . . . . . . .
0 . 1 1 1 0 1 0 0
Particle Size Otm)
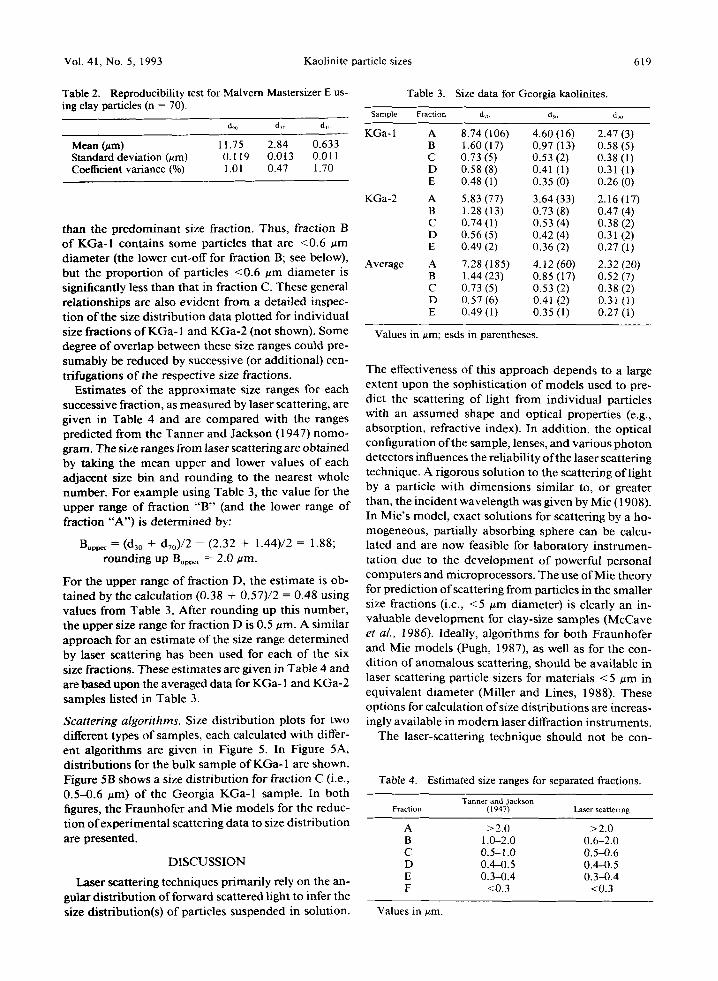
Figure 5. Comparison of particle size distributions for A) a bulk sample of Georgia kaolinite KGa- l and B) size fraction C, between 0.5 and 0.6 um of KGa-1. In each graph, size distributions are calculated by the Mie and Fraunhofer models from the same scattering data.
Kaolinite fractions. Table 3 lists the averaged particle diameters for replicate analyses o f two different 5g sam- ples of KGa-1 and KGa-2, which were size-separated by the method of Tanner and Jackson (1947) and de- termined by laser scattering. Data compiled under the heading "Average" are the average of all four sets of replicate analyses from both KGa-1 and KGa-2, along with calculated standard deviations for each particle diameter. In order to obtain an accurate assessment of the size range of the majority of particles in each sep- arated fraction, the dT0 and d3o values for each fraction are listed in Table 3 along with the also value. For monodisperse samples, d70 and d30 provide an estimate of sizes for the majority of particles in the fraction (> 50% by volume), provided the size distribution curve is not a straight line. While data in Table 3 show that there is clearly overlap in the sizes of particles separated into different fractions, graphs of these laser-scattering data indicate that the relative proportion of particles that overlap into adjacent size "bins" is generally less
Vol. 41, No. 5, 1993 Kaolinite particle sizes 619
Table 2. Reproducibility test for Malvern Mastersizer E us- ing clay particles (n = 70).
do 0 dso dj~
Mean (~m) 11.75 2.84 0.633 Standard deviation (um) O. 119 0.013 0.011 Coefficient variance (%) 1.01 0.47 1.70
than the predominant size fraction. Thus, fraction B of KGa-I contains some particles that are <0.6 #m diameter (the lower cut-off for fraction B; see below), but the proportion of particles <0.6 um diameter is significantly less than that in fraction C. These general relationships are also evident from a detailed inspec- tion of the size distribution data plotted for individual size fractions of KGa-1 and KGa-2 (not shown). Some degree of overlap between these size ranges could pre- sumably be reduced by successive (or additional) cen- trifugations of the respective size fractions.
Estimates of the approximate size ranges for each successive fraction, as measured by laser scattering, are given in Table 4 and are compared with the ranges predicted from the Tanner and Jackson (1947) nomo- gram. The size ranges from laser scattering are obtained by taking the mean upper and lower values of each adjacent size bin and rounding to the nearest whole number. For example using Table 3, the value for the upper range of fraction "B" (and the lower range of fraction "'A") is determined by:
Buppe~ = (d3o + d7o)/2 = (2.32 + 1.44)/2 = 1.88; rounding up Bup~r = 2.0 #m.
For the upper range of fraction D, the estimate is ob- tained by the calculation (0.38 + 0.57)/2 = 0.48 using values from Table 3. After rounding up this number, the upper size range for fraction D is 0.5 #m. A similar approach for an estimate of the size range determined by laser scattering has been used for each of the six size fractions. These estimates are given in Table 4 and are based upon the averaged data for KGa- 1 and KGa-2 samples listed in Table 3.
Scattering algorithms. Size distribution plots for two different types of samples, each calculated with differ- ent algorithms are given in Figure 5. In Figure 5A, distributions for the bulk sample ofKGa-1 are shown. Figure 5B shows a size distribution for fraction C (i.e., 0.5-0.6 #m) of the Georgia KGa-1 sample. In both figures, the Fraunhofer and Mie models for the reduc- tion of experimental scattering data to size distribution are presented.
DISCUSSION
Laser scattering techniques primarily rely on the an- gular distribution of forward scattered light to infer the size distribution(s) of particles suspended in solution.
Table 3. Size data for Georgia kaolinites.
Sample Fraction dv~ d~o d3o
KGa-1 A 8.74 (106) 4.60 (16) 2.47 (3) B 1.60 (17) 0.97 (13) 0.58 (5) C 0.73 (5) 0.53 (2) 0.38 (1) D 0.58 (8) 0.41 (1) 0.31 (1) E 0.48 (1) 0.35 (0) 0.26 (0)
KGa-2 A 5.83 (77) 3.64 (33) 2.16 (17) B 1.28 (13) 0.73 (8) 0.47 (4) C 0.74 (1) 0.53 (4) 0.38 (2) D 0.56 (5) 0.42 (4) 0.31 (2) E 0.49 (2) 0.36 (2) 0.27 (1)
Average A 7.28 (185) 4.12 (60) 2.32 (20) B 1.44 (23) 0.85 (17) 0.52 (7) C 0.73 (5) 0.53 (2) 0.38 (2) D 0.57 (6) 0.41 (2) 0.31 (1) E 0.49 (1) 0.35 (1) 0.27 (1)
Values in #m; esds in parentheses.
The effectiveness of this approach depends to a large extent upon the sophistication of models used to pre- dict the scattering of light from individual particles with an assumed shape and optical properties (e.g., absorption, refractive index). In addition, the optical configuration of the sample, lenses, and various photon detectors influences the reliability of the laser scattering technique. A rigorous solution to the scattering of light by a particle with dimensions similar to, or greater than, the incident wavelength was given by Mie (1908). In Mie's model, exact solutions for scattering by a ho- mogeneous, partially absorbing sphere can be calcu- lated and are now feasible for laboratory instrumen- tation due to the development of powerful personal computers and microprocessors. The use of Mie theory for prediction of scattering from particles in the smaller size fractions (i.e., < 5 gm diameter) is clearly an in- valuable development for clay-size samples (McCave et al., 1986). Ideally, algorithms for both Fraunhofer and Mie models (Pugh, 1987), as well as for the con- dition of anomalous scattering, should be available in laser scattering particle sizers for materials < 5 ~tm in equivalent diameter (Miller and Lines, 1988). These options for calculation of size distributions are increas- ingly available in modem laser diffraction instruments.
The laser-scattering technique should not be con-
Table 4. Estimated size ranges for separated fractions.
Tanner and Jackson Fraction (1947) Laser scattering
A >2.0 >2.0 B 1.0-2.0 0.6-2.0 C 0.5-1.0 0.5-0.6 D 0.4--0.5 0.4-4).5 E 0.3-0.4 0.3-0.4 F <0.3 <0.3
Values in ~zm.
620 Mackinnon, Uwins, Yago, and Page Clays and Clay Minerals
fused with photon correlation spectroscopy (PCS), which utilizes a laser beam to i l luminate a dilute sus- pension of particles in a liquid while changes in light intensity are measured as the particles move under Brownian mot ion (Miller and Lines, 1988). PCS is also known as autocorrelation spectroscopy, quasi-elastic light scattering, intensity fluctuation spectroscopy and dynamic light scattering (Miller and Lines, 1988). With PCS, changes in light intensity as it is scattered from particles moving under Brownian mot ion are mea- sured. The frequency of Brownian motion of a small particle is inversely proport ional to particle size. In general, PCS is designed for the routine analysis of dilute suspensions of particles ranging in size from 40 nm up to about 3 ~tm (Gahwiller, 1980).
With laser scattering, a diffraction pattern is formed when a (monochromatic) beam of light falls onto a particle. The diffraction of this light is dependent upon, among other parameters, the size of the particle. I f a lens is placed in the light path behind the particle(s) and a suitable detector placed at the focal point of the lens, then diffracted light will be imaged concentrically at a distance from the axis, which is a function of the particle diameter. In general, these diffracted light in- tensities are dependent not only on the particle size but also on the real and imaginary refractive indices o f the scatterer (Dodge, 1984). However, by restricting the scattering measurements to small angles in the for- ward diffraction direction, and i f the diameters of the scatterers are much larger than the wavelength of the radiation, particle properties are unimportant for so- lution o f the size dependence of diffracted light inten- sity. Furthermore, dilute solutions of particle suspen- sions are not a requirement for this technique. As noted above, i f light scattering from particles of size similar to the incident wavelength is calculated according to the model o f Mie (1908), exact solutions to particle size distributions for particles < 2 #m can be obtained (Dodge, 1987).
Laser scattering is a technique suited to quantitative analysis o f particle size distribution(s) because, on av- erage, greater than 105 panicles are measured each t ime the laser beam il luminates particles within the sample cell (i.e., for each analysis). In addition, the technique is rapid (an analysis may take less than 30 min) and does not require very large amounts o f sample. How- ever, there has been limited acceptance of this tech- nique within the clay and soil sciences presumably be- cause of perceived concerns with l) absolute calibration of these instruments and 2) documented examples o f poor results for clay size distr ibutions when compared with conven t iona l s ed imen ta t i on techniques (e.g., McCave et al., 1986).
Calibration and reproducibility. Calibration oflaser dif- fraction spectrometers has been the subject o f consid- erable study by the powder technology communi ty
(Dodge, 1984, 1987; Tuzun and Farhadpour, 1985; de Boer et al., 1987) and had generally been considered a difficult problem once an instrument left the manu- facturer (Dodge, 1984). In the past, it had been as- sumed that laser diffraction instruments did not require calibration once constructed, because of the presumed linearity of the light detection system over three orders of magnitude as a function of angle from the optical centerline. However, theory and experiment did not always provide good agreement for a range ofdatase ts (Dodge, 1984; McCave et al., 1986), particularly in the case of Fraunhofer diffraction or anomalous dispersion calculations of the diffraction phenomena. For this case, laboratory-based calibration procedures for Malvern instruments were developed (Dodge, 1984) and have been used to carry out interlaboratory comparisons of drop-sizing instruments (Dodge, 1987). In general, la- ser diffraction instruments provided good to excellent agreement between laboratories (Dodge, 1987). A fun- damental study on the principles o f laser diffraction spectrometry by de Boer et al. (1987), established that particle sizes calculated on Mie-scattering theory pro- vided excellent results on samples that had been pre- viously calibrated by independent methods. In addi- tion, results were similarly predictable for the lower size ranges and for cases in which the refractive indices of the disperse and continuous phases are similar. This approach by de Boer et al. (1987) showed that it is possible to predict particle size distributions via the Mie-scattering theory without calibrating an instru- ment using standard materials.
Results from the independent sizing measurements in this study using laser scattering and image analysis also confirm these earlier conclusions that laser dif- fraction, using Mie theory for data reduction, provides an excellent estimate of particle size. As shown in Fig- ure 3, results from these two techniques for monodis- perse, spherical particles show excellent agreement in a size range < 2 urn. While this experiment does not explicitly reproduce the same shape characteristics of a typical clay particle assemblage, the absolute cali- bration of size using laser scattering is well within the est imated standard deviations using well calibrated im- age analysis techniques. Statistically, these results show that the average values from each technique are equiv- alent at the 0.01% level using a Student 's t-test for two independent samples.
Similarly, this result can be achieved in a reproduc- ible fashion. The data presented in Table 2 show that modal values for particle size (dso values) can be de- terrnined with a relative precision of < 1%. Further- more, values for the extreme tails of a size distr ibution (i.e., d9o and d~o) can be reproduced with a relative precision of < 2%. Values for intermediate average par- ticle diameters, such as dT0 and d3o, which are used in Table 3, are assumed to have a relative precision be- tween the lower and upper limits of this reproducibil i ty
Vol. 41, No. 5, 1993 Kaolinite particle sizes 621
test (i.e., between 1% and 2%). These general estimates of reproducibil i ty of the laser scattering technique are supported by the replicate sizing results for samples KGa-1 and KGa-2 given in Table 3. Thus, the repro- ducibility of this technique for clay-shaped particles over the 0.1 #m to 80 gm size range is extremely high compared with that measured, for example, by Mc- Cave et aL (1986), who used anomalous dispersion algorithms for the reduction of diffraction intensities to particle size distribution. Comparisons of these av- erage particle size data shown in Table 3 using Mie model calculations in the < 1.0 #m size range are ex- cellent.
Size fractionation. Using the laser scattering method for size distribution determination, the average dso val- ues for all size fractions of samples KGa-1 and KGa-2 generally fall within the range predicted by the method of Tanner and Jackson (1947). Indeed, size distr ibution values for each fraction show that the procedure de- veloped by Tanner and Jackson (1947) is effective in separating particles into narrow size ranges below 2 um with predominant , or modal, sizes that progressively decrease. The lower size l imit for fraction B is different using the laser-scattering method compared with that est imated from the nomogram of Tanner and Jackson (1947). This difference (a value of 0.6 ~m compared with 1.0 urn) is not readily explicable, but may be related to the adherence of smaller-sized particles to the larger (i.e., ~ 1.0 um) particles in fraction B. Pre- sumably, factors such as surface charge or minor vari- ations in composit ion may influence the degree o f ad- herence o f smal l pa r t i c les to larger par t ic les . Furthermore, smaller particles may be less prone to adherence of different sized particles during the frac- t ionation procedure and may also show hydrodynamic properties more akin to spherical-shaped particles in fluid flow. Thus, the difference in size ranges est imated by Tanner and Jackson (1947) and determined by laser scattering is reduced considerably for fractions D, E, and F. There is a range of particle sizes within each separated fraction, which, in some cases, overlaps with the adjoining fractions. This separation into progres- sively smaller size ranges, but with overlapping values in the " tai ls" of the size distributions for each fraction, appears to be consistent for each kaolinite studied and for replicate analyses.
For modal analyses of size distribution data (i.e., ds0 values), the average values for each size separated frac- tion are remarkably similar for both KGa- 1 and KGa-2 and, thus, the average values for four replicate analyses show correspondingly small s tandard deviat ions in the "Average" columns. The maximum coefficient of vari- ance for the smaller size fractions (i.e., C, D, and E) is ~ 5%, while the larger size fractions show high coeffi- cients of variance at ~ 14%. A coefficient of variance o f ~ 5% for four analyses compares favorably with a
1% coefficient of variance for a sample set of seventy analyses (Table 2). The coefficient of variat ion for the larger size fractions, particularly fraction A, is not un- expected due to the considerable range in particle sizes > 2 um for both samples. The relative errors for de- terminat ion of large particle sizes for KGa-2 are lower than for KGa-1 because there is a lower proport ion of large particles in KGa-2 and the range o f sizes is smaller (see Table 1). However, for size fractions <2 um, the values for the different fractions are clearly reproduc- ible for either KGa-1 or KGa-2. These summary data support the suggestion that the method o f separation by Tanner and Jackson (1947) provides size fractions that consistently show dso modal values that lie within specific est imated size ranges. These size ranges, while approximate, are determined by laser-scattering tech- niques with a high level of reliability and, for a given experimental configuration, appear to be internally consistent.
Scattering models. As shown in Figures 3C and 5, the Fraunhofer diffraction model shows sharp disconti- nuities or markedly different distributions for particle sizes less than ~ 2 um for monodisperse latex spheres and the Georgia KGa- 1 bulk sample, respectively. These results for the Fraunhofer model are in contrast to electron microscopy observations and calculated weight percentage values for separated fractions <2 ttm in size. For example, the equivalent spherical diameter for latex spheres modeled using Mie theory is 0.33(7) um, while the span for this distr ibution is 0.54. The span for a sample distribution is given by the relation (d9o---dlo)/dso and is a measure o f the spread o f particle sizes in a given distribution. A low value for the span (i.e., < 1.0) indicates a very narrow size distr ibution for a particular sample. For the Fraunhofer model, the calculated particle sizes are very broad (span ~24.78) and thus, an estimate of equivalent spherical diameter assuming a monomodal distr ibution is precluded. An alternative estimate of particle diameter may be ob- tained from the dso value, which, for this model, is 0.55 ~tm. This latter value, and in particular, the graph of size distribution using a Fraunhofer model shown in Figure 3C, is considerably at variance with that deter- mined by image analysis techniques as well as that modeled by Mie scattering.
For the bulk KGa-1 sample, there is also consider- able divergence of the size distr ibution graphs for the Mie model and the Fraunhofer model at sizes < 2 um (Figure 5A). In Figure 5A, the Fraunhofer model shows a pronounced mode at about 2 #m. The appearance of modes with constant posit ion is also noted by McCave et al. (1986) in their study of natural sediments using laser-scattering techniques. McCave et al. (1986) sug- gested that these modes appear because of the inabili ty of the inversion scheme (i.e., the model for light scat- tering) to cope with the level o f noise produced by light
622 Mackinnon, Uwins, Yago, and Page Clays and Clay Minerals
scattered from clays in the < 2 ~m size range. There is good agreement between the Fraunhofer and Mie mod- els for sizes above about 7 ttm. The Mie model shows a gradual decrease in the proportion of particles in the < 2 #m range. This distribution is consistent with the weight percentage values for each size fraction deter- mined by independent gravimetric methods as shown in Table 1.
The effect of an inappropriate scattering model, such as the Fraunhofer model, on the calculated size distri- bution of a size fractionated sample in the < 2 ~tm range is demonstrated in Figure 5B. In this figure, both the Mie and the Fraunhofer model distributions for KGa- 1 fraction "C" (i.e., 0.5 #m--0.6 urn) are shown. For the Fraunhofer model, the size distribution is shifted to higher values. The dso values for each scattering model are 0.51 gm and 0.83 #m, for the Mie and Fraunhofer models, respectively. In addition, the Fraunhofer mod- el shows a small, but significant mode at very high particle sizes (e.g., 30 #m-60 #m). The presence of such large particles in this size-fractionated sample could not be confirmed by any imaging or other independent technique. It is clear that this mode is an artifact of the size distribution calculation using the Fraunhofer model (McCave et al., 1986).
CONCLUSIONS
An assessment of laser-scattering techniques for par- ticle size determination of clays indicates that the method provides a rapid and reliable approach to size analyses if suitable models for light scattering are in- corporated into data analysis. In particular, for particle sizes less than a few micrometers, it is essential to utilize Mie theory for exact calculation of light scat- tering by particles that approach the size of the incident light wavelength. Using Georgia kaolinite Source Clays as test samples, six size fractions were prepared for replicate analyses using the separation methods out- lined by Tanner and Jackson (1947). Comparison of particle sizes determined by laser scattering and cal- culated from nomograms (Tanner and Jackson, 1947) indicates that, in general, there is good agreement be- tween the size range estimates for both methods. The high reliability of the laser-scattering technique when Mie theory is applied to scattering intensities suggests that the size ranges determined for the separated frac- tions should hold for all types of kaolinites provided the method outlined by Tanner and Jackson (1947) is followed.
ACKNOWLEDGMENTS
This work benefited from discussions with Roger Taylor from Scientific Adaptations and John Thomp- son, Research School of Chemistry, Australian Na- tional University. In addition, comments from Ray
Ferrell on an earlier version of this manuscript are greatly appreciated. Funding for this work was provid- ed by the Australian Research Council through Grants A290891 (to IDRM) and AB9130015 (to IDRM and J. Thompson).
REFERENCES
Allen, T. (1981) Particle Size Measurement: 3rd ed., Powder Technology Series, Chapman and Hall, London, 678 pp.
Bayvel, L P. and Jones, A.R. (1981) Electromagnetic Scat- tering and its Applications: Applied Science, London, 289 pp.
Brindley, G. W., Kao, C.-C., Harrison, J. L., Lipsicas, M., andRaythatha, R. (1986) Relation between structuraldis- order and other characteristics of kaolinites and dickites: Clays & Clay Minerals 34, 239-249.
Brown, D. J. and Felton, P. G. (1985) Direct measurement of concentration and size for particles of different shapes using laser light diffraction: Chem. Eng. Res. Des. 63, 125- 134.
Cooper, L. R., Haverland, R. L., Hendricks, D. M., and Kni- sel, W. G. (1984) Microtrac particle-size analyzer: An alternative particle-size determination method for sedi- ment and soils: Soil Science 138, 138-146.
Cornillault, J. (1972) Particle size analyser: Applied Optics 11,265-268.
De Boer, G. B. J., de Weerd, C., Thoenes, D., and Goossens, H. W. J. (1987) Laser diffraction spectrometry: Fraun- hofer diffraction versus Mie scattering: Part. Charact. 4, 14-19.
Dodge, L. G. (1984) Calibration of the Malvern particle sizer: App. Optics 23, 2415-2419.
Dodge, L. G. (1987) Comparison of the performance of drop-sizing instruments: App. Optics 26, 1328-1341.
Fripiat, J. J. and van Olphen, H., eds. (1979) Data Hand- book for Clay Materials and other Non-metallic Minerals: Pergamon Press, New York, 346 pp.
Gahwiller, C. (1980) A new method for the rapid deter- mination of the averaged size and an index ofpolydispersity of submicron particles in liquids using laser light-scattering spectroscopy: Powder Technology 25, 11-13.
Hassanipak, A. A. and Eslinger, E. (1985) Mineralogy, crys- tallinity, O~8/O16, and D/H of Georgia kaolins: Clays & Clay Minerals 33, 99-106.
Hinckley, D.N. (1963) Variability in "crystallinity" values among the kaolin deposits of the coastal plain of Georgia and South Georgia: Clays & Clay Minerals 11, 229-235.
Lombardi, G., Russell, J. D., and Keller, W.D. (1987) Com- positional and structural variations in the size fractions of a sedimentary and hydrothermal kaolin: Clays & Clay Min- erals 35, 321-335.
McCave, I. N., Bryant, R. J., Cook, H. F., and Coughanowr, C.A. (1986) Evaluationofalaser-diffraction-sizeanalyzer for use with natural sediments: J. Sed. Petrol. 56, 561-564.
Mie, G. (1908) Beitrage zur Optik truber Medien, speziell kolloidaler Metallosungen: Ann. Physik 25, 377.
Miller, B. V. and Lines, R. W. (1988) Recent advances in particle size measurements: A critical review: CRC Critical Reviews in Analytical Chemistry 20, 75-116.
Murray, H. H. and Lyons, S. C. (1956) Correlation of paper- coating quality with degree of crystal perfection of kaolinite: Clays & Clay Minerals 4, 31-40.
Olivier, J. P. and Sennett, P. (1973) Particle size-shape re- lationships in Georgia sedimentary kaolins. II: Clays & Clay Minerals 21,403-4 12.
Plancon. A. and Zacherie, C. (1990) An expert system for

Vol. 41, No. 5, 1993 Kaolinite particle sizes 623
the structural characterization of kaolinites: Clay Miner. 25, 249-260.
Pugh, D. G. (1987) Analysis of materials in the 0.12-300 micron range (using Mie and Fraunhofer theories): Curr. Aware. Part. Technol. 20, 243-251.
Tanner, C. B. and Jackson, M. L. (1947) Nomographs of sedimentation times for soil particles under gravity or cen- trifugal acceleration: Soil Sci. Soc. Amer. Proc. 11, 60--65.
Tettenhorst, R. T. and Corbato, C. E. (1986) Properties of a sized and ground kaolinite: Clay Miner. 21, 971-976.
Tuzun, U. and Farhadpour, F. A. (1985) Comparison of light scattering with other techniques for particle size mea- surement: Part. Charact. 2, 104-112.
(Received 4 September 1992; accepted 11 June 1993; Ms. 2273)