Characterisation of Kaolinite and Adsorption of Europium on Kaolinite
66
POSIVA OY FI-27160 OLKILUOTO, FINLAND Tel +358-2-8372 31 Fax +358-2-8372 3709 Markus Olin, Eini Puhakka, Jarmo Lehikoinen Esa Puukko, Martti Hakanen Antero Lindberg October 2007 Working Report 2007-82 Characterisation of Kaolinite and Adsorption of Europium on Kaolinite
Transcript of Characterisation of Kaolinite and Adsorption of Europium on Kaolinite

P O S I V A O Y
FI -27160 OLKILUOTO, F INLAND
Tel +358-2-8372 31
Fax +358-2-8372 3709
Markus O l i n , E i n i Puhakka , Ja rmo Leh iko inen
Esa Puukko , Mar t t i Hakanen
Antero L i ndberg
October 2007
Work ing Repor t 2007 -82
Characterisation of Kaolinite and Adsorptionof Europium on Kaolinite

October 2007
Working Reports contain information on work in progress
or pending completion.
The conclusions and viewpoints presented in the report
are those of author(s) and do not necessarily
coincide with those of Posiva.
Markus O l in , E in i Puhakka , Jarmo Leh iko inen
Techn ica l Resea rch Cent re o f F in l and (VTT )
Esa Puukko , Mart t i Hakanen
Un ive rs i t y o f He l s ink i
Antero L indberg
Geo log ica l Su rvey o f F in l and
Work ing Report 2007 -82
Characterisation of Kaolinite and Adsorptionof Europium on Kaolinite

ABSTRACT
Kaolinite is a common fracture mineral in many crystalline rocks and, thus, a potential sorbent for groundwater solutes. The low cation-exchange capacity makes kaolinite a good mineral to study sorption by inner-sphere complexation of multivalent ions, such as trivalent actinides or their analogues, the trivalent lanthanides. The sorption of europium and americium on kaolinite has been studied previously by Puukko and Hakanen (2001a) using a natural kaolinite, KGa-1b (from the Clay Minerals Society, USA).
This work describes the determination of surface-charging mechanism and surface acidity constants for KGa-1b kaolinite, and adsorption of Eu(III) on both the natural (KGa-1b) and its acid-conditioned form (HKGa). The ionic strength of the background NaNO3 electrolyte used in these titrations was 0.05 M, 0.1 M and 0.5 M. The surface acidity of kaolinite was explained using the FITEQL software by applying the 1-pK model. The optimized concentration of surface sites was close to a value previously reported for KGa-1b kaolinite.
The adsorption modelling of europium was carried out by adopting one surface-complexation and one cation-exchange reaction. In the acidic pH range, sorption of europium decreased with increasing ionic strength of the NaNO3 solution, which is an indication of the dominance of cation exchange or outer-sphere complexation. At the lowest ionic strength, the sorption was reversible. In the 0.1 M and 0.5 M NaNO3
solutions, the sorption of europium in the basic pH range was only partly reversible, or desorption kinetically slow. The degree of irreversibility increased with increasing pH and ionic strength. A diffuse-layer model was readily fitted on the per-cents sorbed scale (default in FITEQL), but the results were not as good on a Kd scale, especially at circumneutral pH values.
In the water analysis of the batch titration of KGa-1b kaolinite, the main observed elements were aluminium and zinc. The concentrations of Al and Zn decreased with pH. Lanthanides were detectable in the solution only in the acidic pH range 3-6 and showed a decreasing concentration with increasing pH, in good agreement with sorption behaviour of added europium. KGa-1b contained organic and iron impurities, which did not have an effect on the sorption of europium.
The results from molecular-level modelling were used for further development of surface-complexation models for both kaolinite surface charging and adsorption of europium.
The experimental part of this study was carried out at the University of Helsinki (Laboratory of Radiochemistry) and at Geological Survey of Finland, and the modelling part at VTT.
Keywords: Adsorption, titration, surface complexation, modelling, europium, kaolinite, FITEQL
Kaoliniitin karakterisointi ja europiumin adsorptio kaoliniittiin TIIVISTELMÄ Kaoliniitti on yleinen rakomineraali kiteisessä kallioperässä ja siten todennäköinen pohjaveden liuoskomponenttien pidättäjä. Kaoliniitin matala kationinvaihtokapasiteetti tekee siitä hyvän mineraalin kolmenarvoisten aktinidien, tai niiden kanssa analogisten kolmenarvoisten lantanidien, muodostumisen tutkimiseen. Europiumin ja amerikiumin sorptiota on tutkittu jo aiemmin (Puukko ja Hakanen, 2001a) käyttäen luonnon kaoliniittia, KGa-1b (Clay Minerals Society, USA).
Työssä kuvataan KGa-1b-kaoliniitin ja sen happopestyn variantin pinnan varautumismekanismin ja happovakioiden sekä europiumin sidosvakioiden määrit-tämistä kokeellisesta datasta. Titrauksissa käytettyjen NaNO3-taustaelektrolyyttien ionivahvuudet olivat 0,05 M, 0,1 M ja 0,5 M. Pinnan happovakiot sovitettiin FITEQL-ohjelmalla käyttäen 1-pK mallia. Yhteensopivuus kokeellisiin tuloksiin oli hyvä siten, että kummankin tutkitun kaoliniittityypin pintapaikkojen tiheydeksi saatiin suunnilleen sama. Tulokset täsmäsivät hyvin kaoliniitille kirjallisuudessa esitettyjen arvojen kanssa.
Sorptio mallinnettiin kationinvaihto- ja pintakompleksaatioreaktioilla käyttäen diffuusi-kerrosmallia. Happamassa pH-alueessa Eu:n hallitseva sorptiomekanismi on kationin-vaihto tai ulkokehäkompleksien muodostuminen, sillä europiumin sorptio väheni ionivahvuuden kasvaessa. Alimmassa ionivahvuudessa europiumin sorption havaittiin olevan palautuvaa, mutta molemmissa suuremmissa ionivahvuuksissa emäksisellä puolella sorptio oli osin palautumatonta, tai desorptio huomattavan hidasta. Sorption mallinnus onnistui hyvin ja etenkin prosenttiosuuksina esitettyyn adsorptioon sovitetut mallit sopivat kokeelliseen aineistoon hyvin. Sen sijaan mallinnettujen ja mitattujen jakaantumiskertoimien (Kd) ero oli selvästi suurempi etenkin neutraalissa pH-alueessa. Osasyynä tähän voi olla se, että FITEQL sovittaa nimenomaan sorption prosentti-osuuksia.
KGa-1b-kaoliniitin erätitrausten vesianalyyseissä pääalkuaineet olivat alumiini ja sinkki, joiden pitoisuudet laskivat pH:n kasvaessa. Lantanideja havaittiin liuoksissa pH-alueella 3-6. Niiden liuospitoisuudet laskivat pH:n nousun myötä kuten sorptiokokeissa käytetyllä europiumilla. KGa-1b sisältää sekä orgaanista ainesta että rautaa. Niiden vaikutus sorptioon todettiin hyvin vähäiseksi.
Molekyylitason mallinnustuloksia käytettiin varsinaisten pinnan varautumismallien ja europiumin pintakompleksaatiomallien kehittämisessä.
Työn kokeellinen osa tehtiin Helsingin yliopiston Radiokemian laboratoriossa ja Geologian tutkimuskeskuksessa ja mallinnustyö VTT:ssä.
Avainsanat: Adsorptio, titraus, pintakompleksaatio, mallinnus, europium, kaoliniitti, FITEQL

1
TABLE OF CONTENTS
ABSTRACT
TIIVISTELMÄ
CONTENTS
PREFACE
1 INTRODUCTION .................................................................................................... 5
2 EXPERIMENTAL AND MODELLING METHODS .................................................. 7
2.1 Materials ......................................................................................................... 7
2.2 Titration of KGa-1b kaolinite ........................................................................... 7
2.2.1 Methods of titration.................................................................................. 7
2.2.2 Continuous titration of kaolinite ............................................................... 7
2.2.3 Determination of pH in batch titrations and adsorption experiments....... 8
2.2.4 Batch titration of kaolinite ........................................................................ 8
2.3 Adsorption of Eu on kaolinite .......................................................................... 9
2.3.1 Sorption of europium on kaolinite............................................................ 9
2.3.2 Determination limit of the retardation factor ............................................ 9
2.3.3 On equilibration time ............................................................................. 10
2.3.4 Desorption of europium from kaolinite .................................................. 10
2.3.5 Sorption isotherms of europium on kaolinite ......................................... 11
2.4 Molecular-modelling methods ....................................................................... 11
2.5 Modelling of aqueous and surface reactions ................................................ 11
2.5.1 Aqueous speciation of the electrolyte and Eu(III).................................. 12
2.5.2 Modelling of titrations ............................................................................ 12
2.5.3 Adsorption ............................................................................................. 13
2.5.4 Software ................................................................................................ 14
3 RESULTS ............................................................................................................. 15
3.1 Kaolinite characterisation.............................................................................. 15
3.1.1 Iron in KGa-1b kaolinite......................................................................... 16
3.1.2 Organic impurities ................................................................................. 16
3.2 Results of the titrations ................................................................................. 17
3.2.1 Results of batch titrations...................................................................... 17
3.3 Sorption and desorption results .................................................................... 21
3.3.1 Sorption of europium on KGa-1b and HKGa kaolinites......................... 21

2
3.3.2 Desorption of europium......................................................................... 21
3.3.3 Sorption isotherms ................................................................................ 25
3.4 Molecular-modelling results .......................................................................... 25
3.4.1 The unit cell of kaolinite......................................................................... 25
3.4.2 Kaolinite surfaces.................................................................................. 26
3.4.3 Eu(H2O)93+ ion and its adsorption onto kaolinite surface....................... 30
3.5 Aqueous speciation of Eu(III) ........................................................................ 31
3.6 Titrations ....................................................................................................... 34
3.7 Adsorption..................................................................................................... 36
3.7.1 Desorption models ................................................................................ 40
3.7.2 Isotherm models.................................................................................... 43
4 DISCUSSION ....................................................................................................... 45
4.1 Adsorption of Eu ........................................................................................... 45
4.2 Reversibility of sorption................................................................................. 45
5 CONCLUSIONS ................................................................................................... 47
REFERENCES
APPENDICES
Appendix A: Composition of kaolinite by Clay Mineral Society
Appendix B: Gaines-Thomas cation exchange
Appendix C: Experimental results

3
PREFACE
This study has been carried out jointly by VTT Technical Research Centre of Finland and the Laboratory of Radiochemistry at the University of Helsinki (UH) for Posiva Oy. The contact persons were Mr. Aimo Hautojärvi from Posiva and Mr. Jarmo Lehikoinen and Dr. Markus Olin from VTT, and Mr. Esa Puukko and Mr. Martti Hakanen from UH.

4

5
1 INTRODUCTION
The relevance of kaolinite for this study stems from its presence as a fracture-filling mineral in water-conducting rock fractures in the far-field of a repository for spent nuclear fuel, and hence its potential role as a sink for radioactive elements. It is, therefore, of importance to predict the order of magnitude of adsorption for these elements under different conditions. Surface-complexation modelling offers a powerful tool to accomplish this by describing the adsorption as a complex formation, in close analogy to aqueous complexation reactions. It is also helpful in determining the partitioning between the fluid and solid phases for a particular element and, consequently, in evaluating the efficiency of the mineral surface to retard mass transfer from a repository.
Europium is a lanthanide element and has an oxidation state of +3 in aqueous solution. Europium can be considered as an analogue for trivalent transuranic nuclides. The sorption of europium and americium on acid-conditioned HKGa kaolinite has been studied previously by Puukko & Hakanen (2001a). Here, the sorption of europium on the natural KGa-1b kaolinite and on the HKGa kaolinite was studied in order to determine the differences in sorption parameters for these kaolinites.
In these experiments, natural KGa-1b kaolinite obtained from the Clay Minerals Society (USA) was used. KGa-1b is a sedimentary kaolinite, eroded, transported and deposited with other sedimentary rocks (Giese, 1991). The HKGa kaolinite was prepared from KGa-1b by acid leaching with HCl.
Organic and iron impurities may influence the sorption behaviour of kaolinites for radionuclides. The way of formation of the KGa-1b kaolinite deposit gives a reason to investigate the presence of organic substances and to determine if the iron in KGa-1b is amorphous, crystalline or structural.
A prerequisite for being able to interpret any experimental results with the aid of a mechanistic surface-complexation model is an adequate characterization of the surface charging of the adsorbent. To determine surface hydrolysis constants, kaolinite was titrated in 0.05 M, 0.1 M and 0.5 M NaNO3 solutions with HCl and NaOH. The surface hydrolysis constant of KGa-1b for the 1-pK model was derived from the results of titration results using the FITEQL (v. 4.0) computer program (Herbelin & Westall, 1999).
In order to apply a surface-complexation model to the sorption of europium on kaolinite, the sorption reaction must be reversible. This was studied by first making the sorption experiments and then desorbing europium from kaolinite.
The surface hydrolysis constant and Eu sorption results were modelled using aqueous speciation and a 1-pK surface-complexation model. A molecular modelling approach was made to investigate the structure of the hydrated Eu3+ ion and to visualise the atomic structures and charge-density distributions of the different kaolinite crystal planes.
The experimental part of this work was carried out at the Laboratory of Radiochemistry at the University of Helsinki (HYRL). The solutions of the batch titrations were analysed at Geological Survey of Finland (GSF). The sorption and molecular modelling were performed at VTT.

6
7
2 EXPERIMENTAL AND MODELLING METHODS
2.1 Materials
KGa-1b kaolinite was purchased from the Clay Minerals Society, USA (Appendix A). According to the supplier, KGa-1b is a "well-crystallised" natural kaolinite. KGa-1b is a sedimentary kaolinite, which was eroded, transported and deposited with other sedimentary rocks (Moll, 2001). The ideal chemical formula of kaolinite can be presented as Al2Si2O5(OH)4, consisting of 46.54w-% SiO2, 39.50w-% Al2O3 and 13.96w-% H2O (Giese, 1991). The loss in ignition of KGa-1b was 14.3w-% according to the Clay Minerals Society. KGa-1b kaolinite was included in the base-line studies of Clay Minerals Society (Moll, 2001). The main impurities, as reported by the manufacturer, were Ti (1.6w-% as TiO2) and Fe (0.26w-% as Fe2O3), (Appendix A)
The other kaolinite used in the experiments, HKGa, was an acid-washed KGa-1b kaolinite (Puukko & Hakanen, 1998). The acid washing removed some iron, but no TiO2.
2.2 Titration of KGa-1b kaolinite
2.2.1 Methods of titration
The KGa-1b kaolinite was titrated with HCl and NaOH for the determination of its surface hydrolysis constants (continuous titrations) and concentrations of dissolved cations and silica (batch titrations). Continuous titrations were done in 0.05 M, 0.1 M and 0.5 M NaNO3 solutions. In batch titrations, the highest ionic strength was excluded due to a probable high screening by sodium. In the continuous titration, NaOH was added stepwise to the mixture of KGa-1b kaolinite and NaNO3 solution and the pH measured. In the batch titrations, HCl or NaOH was added to separate batches of the mixture of kaolinite and NaNO3 solution. After a contact time of 18 hours, the pH of the mixture was measured. The solutions of the batch titrations were analysed for dissolved cations and silica at GSF.
The concentration of kaolinite was 10 g/L. The HCl solution used was 0.1 M HCl (Merck Titrisol 1.09973) and the NaOH solution was carbon-oxide-free 0.1 M NaOH (Merck Titrisol 1.09959). Before the NaOH-titrations the concentration of NaOH was checked with the HCl-solution. All experiments were performed under nitrogen or argon atmosphere.
2.2.2 Continuous titration of kaolinite
The concentration of the hydronium ion was determined with the system used in the titration of kaolinite (washed with acid), quartz and aluminium oxide (Puukko & Hakanen, 2001b). The measuring system consisted of an indicator electrode (Ross 91-01) and a reference electrode (Ross 90-02), connected to an Orion 720A pH (mV) meter. The indicator electrode (Ross 91-01) was a glass electrode. The reference electrode (Ross 90-02) was a double junction electrode, which had an Ag|AgCl electrode in AgCl solution in the inner chamber and 0.05 M, 0.1 M or 0.5 M NaNO3

8
solution in the outer chamber according to the solution to be titrated. The titrations were done in a closed polyethylene vessel. The solution was continuously purged with nitrogen gas to prevent the effect of carbonates. The temperature of the solution was measured with a Pt100 probe connected to the pH meter.
2.2.3 Determination of pH in batch titrations and adsorption experiments
The concentration of the hydronium ion was determined with a system consisting of Orion AquaPro combination pH electrode and the Orion 920A pH/mV meter. The measuring system was calibrated by measuring the electromotive force (EMF) of
solutions of known +3H O concentrations. The solutions were prepared by adding the
HCl or NaOH standard solutions (Titrisol) to the NaNO3 solution of the same concentration as was used in the titration.
The pH of a solution is given by
+HpH log a (1)
where +Ha is the activity of the +
3H O and
+3H H
H Oa f (2)
whereH
f is the activity constant and +3H O the concentration of +
3H O ,
respectively.
The activity coefficient H
f was calculated using the Davis equation, which is valid up
to an ionic strength of 0.5 M.
2log 0.5 0.21
If z I
I (3)
where I is the ionic strength and z is the charge of the ion. Note the use of the value 0.2 instead of the often-used 0.3.
2.2.4 Batch titration of kaolinite
The batch titration of KGa-1b kaolinite was done in an argon atmosphere glove box. First, 0.7 g of kaolinite was weighed in a centrifuge tube (Sorvall) in an ambient atmosphere. The centrifuge tubes and solutions needed were transferred to the glove box. A volume of 35 ml of NaNO3 solution was added to the centrifuge tube. A small known volume of HCl or NaOH was added to the mixture of kaolinite and NaNO3. The centrifuge tubes were put in an end over end mixer. After two to three hours, the pH of the mixture was measured and adjusted if necessary. After measuring the pH, the mixture of kaolinite and NaNO3 solutions was put in the end over end mixer overnight

9
(18 hours). After that, the pH of the mixtures was measured. Kaolinite was separated from the NaNO3 solution by centrifuging. The supernatant was filtered through 0.45-µm Millipore filter into a polyethylene vial. The solutions were analysed at GSF with ICP-AES (Inductively Coupled Plasma - Atomic Emission Spectrometry) and ICP-MS (Inductively Coupled Plasma - Mass Spectrometry) techniques.
2.3 Adsorption of Eu on kaolinite
The sorption of europium on kaolinite was studied in 0.05, 0.1 and 0.5 M NaNO3
solutions. The experiments were made in a glove box under an argon atmosphere to minimize the effects of carbon dioxide on the experimental conditions. Dissolved inorganic carbon (DIC) was determined in some of the NaNO3 solutions. The observed amount of inorganic carbon was converted to a corresponding amount of carbon dioxide.
The effects of the nitrate complexation on the sorption of Eu on the kaolinite was studied by making experiments also in NaClO4 solution. The sorption in the both solutions were at the same level indicating that the effect of Eu nitrate complexation on the sorption was negligible (Appendix C, Figure C1).
2.3.1 Sorption of europium on kaolinite
For adsorption experiments, 0.07 g of KGa-1b or HKGa kaolinite was weighed into a polypropylene centrifuge tube (Sorvall) in an ambient atmosphere. In the glove box, 35 ml of NaNO3 solution was added so that the concentration of kaolinite was 2 g/l. The pH of the suspension was adjusted with HCl or NaOH solutions (Titrisol). The centrifuge tubes were agitated in a rotary mixer. After one hour, the pH of the suspension was measured and the pH adjusted when necessary. This equilibration time was sufficient to stabilise the pH conditions (Puukko et al., 2004). The Eu-152 tracer was then added as easily soluble EuCl3 dried on a piece of Teflon. The initial solution concentration of europium was 10-8 M. The addition of europium did not change the pH of the suspension. The sample tubes were in a mixer for 18 hours, after which the pH of the suspension was measured. After that, the sample tubes were weighed to determine the total amount of kaolinite and NaNO3 solution. Kaolinite was separated from the solution by centrifugation (Sorvall RC-5b, G = 14 500). A sample of the supernatant was filtered through 0.22-µm filter in a plastic vial. The radioassay of Eu-152 was performed with a Wallac 1480 Wizard gamma counter (NaI detector) by counting the X-ray region of spectrum. The signal-to-background ratio in the X-ray region was much greater than in the gamma ray region of Eu-152.
2.3.2 Determination limit of the retardation factor
The mass distribution ratio, dR , was calculated from the quantities of radionuclide
absorbed on the kaolinite and in the solution:

10
Eu_solid
d
Eu_solution
c VR
c M (4)
where c is the concentration in the solid and solutions phase (Bq), V is the volume of the solution, and M is the mass of kaolinite. A typical unit of dR is ml/g or m3/kg.
The minimum determinable radioactivity, MDA , with a confidence level of 90% for Eu-152 in the solution was calculated by applying the following equation (Currie, 1968)
BMDA = 50 1+ 1 + µ 25 (5)
where Bµ is the number of background counts.
The maximum values of dR based on the determination limits of Eu-152 were
calculated for each experiment. They are presented in the figures of chapter 3.3 as sorption and desorption of europium.
2.3.3 On equilibration time
The sorption of Eu on KGa-1b in 0.05 M NaNO3 solution after different equilibration times (5.9 h, 18.8 h and 23.8 h) was tested in Puukko et al. (2004). The experiments were carried out by using separate series of samples for different equilibrium times. The sorption was very similar for the different equilibration times. At pH 10, variance between different equilibration times was observed. Europium was almost completely removed from the solution, so that the uncertainties in the Rd values were high and the variance within this uncertainty. As a conservative measure, the sorption time of 18 hours was used in the experiments (Puukko et al., 2004).
2.3.4 Desorption of europium from kaolinite
Reversibility of sorption was investigated by measuring desorption of europium attached on kaolinite during the sorption experiments. Due to the fact that, at high pH, the solution Eu concentrations in sorption experiment were at the detection limit, it was decided to lower the pH for desorption to improve the accuracy of the measurements.
After the sorption experiments, the supernatant was removed from the centrifuge tubes and the tubes were weighed for the amount of residual NaNO3 solution. In the glove box, 35 ml of europium-free NaNO3 solution of the same ionic strength as in the sorption experiment was added to each centrifuge tube containing kaolinite. To each suspension 20 µL of 0.1 M HCl (Titrisol) was added to adjust the pH of the solution. The added concentration of H3O
+ in the NaNO3 solution was 0.002 mmol/35 ml = 5.7·10-5 M, which corresponded to a pH value of 4.2 (assuming the kaolinite surface is not reacting). The same experimental time as in the sorption experiments, 18 hours, was used, after which the pH of the suspensions was measured. Samples for assays of Eu-152 were taken, as in the sorption experiments. To some samples a second desorption phase was made using 0.1 M HCl (pH 1) as the desorption solution.

11
2.3.5 Sorption isotherms of europium on kaolinite
The effect of europium concentration on the sorption on kaolinite in batch experiments was investigated at constant pH. The solid-to-solution ratio was 2 g/L. Two ionic strengths, 0.05 M and 0.5 M, were considered. The pH values were 3 (only 0.05 M) and 6. The impact of the lanthanides in KGa-1b found in the solutions at pH 3 in the batch titrations was taken into account. The total concentration of Eu was varied from 10-10 M to 10-3 M.
2.4 Molecular-modelling methods
Molecular-modelling methods were used to investigate the crystal and surface structures of kaolinite, and the structure of the hydrated europium(III) ion, Eu(H2O)9
3+. The calculations were done by utilizing the Cerius2 version 4.6 software (Accelrys, 2001). Ab initio quantum mechanics calculations were performed with the CASTEP code. The exchange correlation was described with a generalized gradient approximation, GGA-PW91, during the geometry optimization of the crystal, surface and molecular structures. For each element, ultrasoft pseudopotentials were used. The kinetic cut-off energy for a plane-wave expansion of the wave function was 340 eV in the case of kaolinite structures, and 410 eV for Eu(H2O)9
3+.
2.5 Modelling of aqueous and surface reactions
The development of an adsorption model includes successive steps, where choices between different options must be made. First, a model for aqueous speciation is needed for both the electrolyte and the studied element. The model consists of a chosen set of the most important and probable reactions in relevant conditions, consistent with thermodynamic data for the reactions (e.g. equilibrium constants, K ) and an appropriate activity-coefficient model. This model can then be implemented in almost any available computer program for solving of a set of mass-balance and mass-action equations.
Second, the addition of a reactive surface to a model is done by adding the surface-hydrolysis and cation-exchange reactions as well as all the reactions between the electrolyte and surface sites. Third, a surface-charging model must be chosen. Fourth, the surface-site concentrations, surface-acidity constants and all the adjustable parameters must be fitted to an experimental data set, if no literature data are available. For the fitting, there exist special versions of aqueous chemical computer programs, including the well-known FITEQL software package, which is applied in the present work. Fifth, the reactions of the studied element between the aqueous and surface phases must be chosen and the binding constants fitted by applying the specific fitting program again. Quite often, supporting data, like the specific surface area of the adsorbing mineral or some other data, are also available.
In principle, the full data set, including, for example, all the ionic strengths, should be used for fitting in a single data set, but, quite often, these types of modelling attempts do not converge to a physical solution.

12
2.5.1 Aqueous speciation of the electrolyte and Eu(III)
The electrolyte reactions and the equilibrium constants considered in this study are listed in Table 1, and Table 2 gives the aqueous reactions and their equilibrium constants. The Davies equation has been applied for activity corrections and the corrected log K values applied in FITEQL calculations are also shown in the tables.
Table 1. Electrolyte reactions, their log K values and log K values corrected at ionic
strengths needed in the FITEQL calculations.
Reaction 0.0 M 0.05 M 0.1 M 0.5 M
+2H O OH H -14.00 a -13.82 -13.77 -13.73
+ +2Na H O NaOH aq H -14.80 a -14.80 -14.80 -14.80
+3 3NO H HNO aq -1.30 a -1.47 -1.52 -1.57
+3 3Na NO NaNO aq -0.40 b -0.57 -0.62 -0.66
a Wolery (1992) b Papelis et al. (1988)
Table 2. Aqueous reactions of Eu(III) (Wolery, 1992), their log K values and log K
values corrected at ionic strengths needed in the FITEQL calculations.
Reaction 0.0 M 0.05 M 0.1 M 0.5 M
3+ 2+ +2Eu H O EuOH H -7.82 -8.17 -8.26 -8.35
+3+ +2 2
Eu 2H O Eu OH 2H -14.86 -15.38 -15.52 -15.65
3+ +2 3
Eu 3H O Eu OH aq 3H -24.13 -24.64 -24.79 -24.92
4+3+ +2 2 2
2Eu 2H O Eu OH 2H -6.92 -6.92 -6.92 -6.92
3+ 23 3Eu NO EuNO 1.04 0.52 0.38 0.25
2.5.2 Modelling of titrations
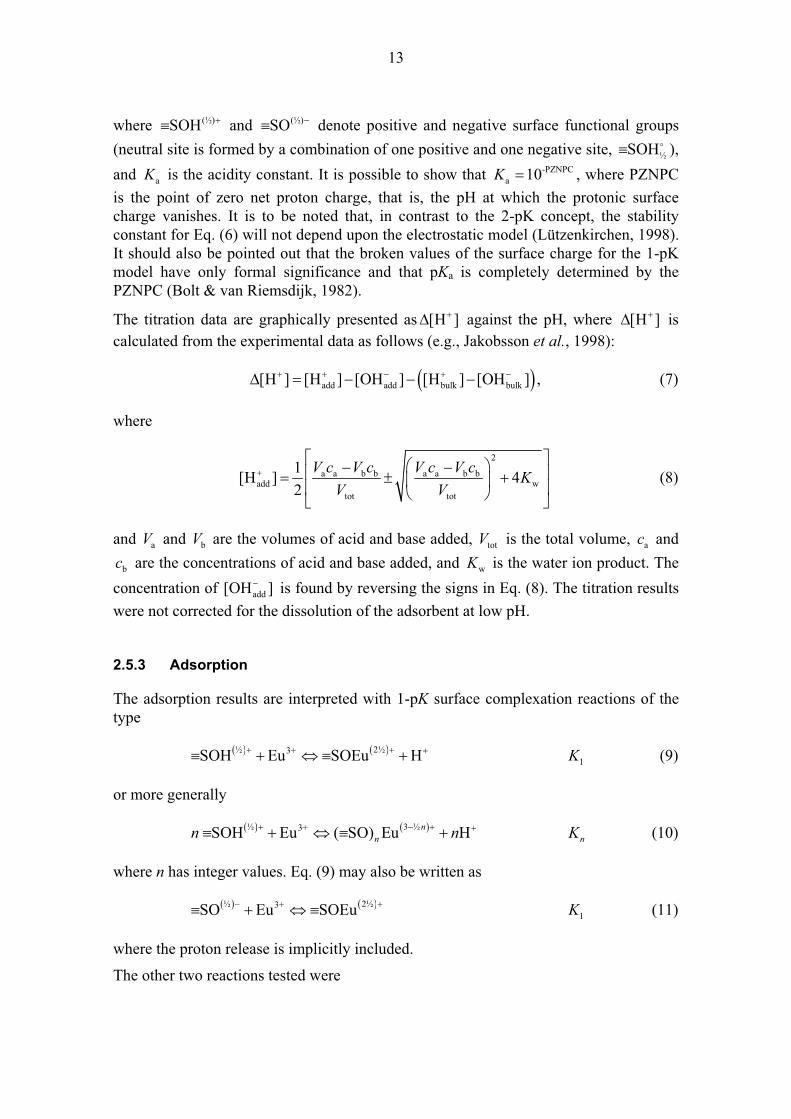
Most commonly, surface complexation models assume either one or two consecutive protonation steps – hereafter referred to as the 1-pK and 2-pK models, respectively. It has been concluded that, in most cases, the 1-pK model provides a sufficiently accurate description of the titration behaviour of the ionisable interface (Westall, 1987; Borkovec, 1997). In comparison to its 2-pK counterpart, the 1-pK model is simpler and invokes a smaller number of adjustable parameters. This usually improves the uniqueness (and thus meaningfulness) of the optimized parameters through their reduced correlation. In the 1-pK concept, the surface charging is based on the following reaction,
(½)+ (½)SOH SO H aK (6)
13
where (½)SOH and (½)SO denote positive and negative surface functional groups
(neutral site is formed by a combination of one positive and one negative site, ½SOH ),
and aK is the acidity constant. It is possible to show that -PZNPCa 10K , where PZNPC
is the point of zero net proton charge, that is, the pH at which the protonic surface charge vanishes. It is to be noted that, in contrast to the 2-pK concept, the stability constant for Eq. (6) will not depend upon the electrostatic model (Lützenkirchen, 1998). It should also be pointed out that the broken values of the surface charge for the 1-pK model have only formal significance and that pKa is completely determined by the PZNPC (Bolt & van Riemsdijk, 1982).
The titration data are graphically presented as [H ] against the pH, where [H ] is
calculated from the experimental data as follows (e.g., Jakobsson et al., 1998):
add add bulk bulk[H ] [H ] [OH ] [H ] [OH ] , (7)
where
2
a a b b a a b badd w
tot tot
1[H ] 4
2
V c V c V c V cK
V V(8)
and aV and bV are the volumes of acid and base added, totV is the total volume, ac and
bc are the concentrations of acid and base added, and wK is the water ion product. The
concentration of add[OH ] is found by reversing the signs in Eq. (8). The titration results
were not corrected for the dissolution of the adsorbent at low pH.
2.5.3 Adsorption
The adsorption results are interpreted with 1-pK surface complexation reactions of the type
½ 2½3+SOH Eu SOEu H 1K (9)
or more generally
½ 3 ½3+SOH Eu ( SO) Eu Hn
nn n nK (10)
where n has integer values. Eq. (9) may also be written as
½ 2½3+SO Eu SOEu 1K (11)
where the proton release is implicitly included.
The other two reactions tested were

14
½ 1½3+ +2SOH +Eu H O SOEuOH +2H H1K (12)
and
½ 3½ +3+SOH Eu SOEuOH 4K (13)
In addition to surface complexation, two cation-exchange (see also Appendix B) half-reactions were considered, one for the background electrolyte and one for Eu:
+X Na NaX NaXK (14)
and
3+33X Eu EuX
3EuXK (15)
where X– denotes one equivalent of the exchanger phase. The net cation-exchange reaction is then
3+ +33NaX Eu EuX 3Na Eu/NaK (16)
2.5.4 Software
The fitting of titration models to experimental data was carried out using the FITEQL 4.0 software (Herbelin & Westall, 1999). The surface complexation model applied was the diffuse-layer model; previously we have tested (and compared) the constant-capacitance model (CCM), the basic Stern model (BSM), the diffuse-layer model (DLM) and the triple-layer model (TLM) (Lehikoinen et al., 2002). Of these, the TLM is the only one being able to distinguish between inner- and outer-sphere surface complexation. All the rest consider specifically-adsorbed ions as model analogues of inner-sphere complexes.
The primary output monitored during the optimization was the goodness-of-fit indicator, SOS/DF (sum of squares divided by degrees of freedom), returned by FITEQL. A SOS/DF value of less than 20 is common for an acceptable fit (Herbelin & Westall, 1999).

15
3 RESULTS
3.1 Kaolinite characterisation
The occurrence of iron in the kaolinite crystal structure may cause charge imbalance, due to which kaolinite often displays cation-exchange properties. The cation-exchange capacity of KGa-1b determined by the silver thiourea method and by the sorption of cesium is 4 meq/100 g (Puukko & Hakanen, 2000).
The results of specific-surface-area determinations by the BET/N2 gas adsorption are presented in Table 3.
Table 3. The BET-N2 surface area of KGa-1b and HKGa kaolinites (Puukko et al.,
2001b).
SampleSurface area
(m2 g–1)KGa-1b 11.60 0.07HKGa 12.60 0.07KGa-1ba
10.05 0.02a van Olphen & Fripiat, 1979
Table 4. Extraction of iron from 1.0 g of KGa-1b kaolinite with 100.0 ml of solution:
percentage and quantity. The total quantity of iron was 1.35 mg Fe/g kaolinite (ICP-
MS, GSF).
Solution Extraction time(hours)
pHmeasured
Extracted Fe % of total Fe
Extracted Fe g/g kaolinite
Tamm's reagent 1 3.33 0.45 ± 0.03 6.0 ± 0.4 (amorphous iron) 3.23 0.35 ± 0.04 4.6 ± 0.5 Tamm's reagent 2 3.20 0.52 ± 0.03 6.8 ± 0.4 3.31 0.80 ± 0.03 10.6 ± 0.4 Tamm's reagent 5 3.30 1.37 ± 0.04 17.2 ± 0.5 3.32 1.04 ± 0.03 13.3 ± 0.4 Tamm's reagent 17 3.30 1.53 ± 0.05 20.6 ± 0.7 3.29 1.68 ± 0.05 22.3 ± 0.7 Tamm's reagent 18 3.32 1.37 ± 0.05 18.4 ± 0.7 1st extraction 3.31 2.02 ± 0.15 27.1 ± 2.0 Tamm's reagent 18 3.32 0.41 ± 0.04 5.5 ± 0.5 2nd extraction 3.32 0.85 ± 0.05 11.4 ± 0.7 Na-citrate + dithionate 0.5 7.10 5.5 ± 0.3 73 ± 4 (crystalline iron) 7.20 5.0 ± 0.3 67 ± 4 Oxalic acid 18 1.38 2.07 ± 0.05 27.6 ± 0.7 (total iron) 1.37 1.73 ± 0.05 23.0 ± 0.7 Oxalic acid (hot) 1 1.42 1.49 ± 0.05 19.8 ± 0.7 1.40 1.65 ± 0.08 21.4 ± 1.1 Oxalic acid (hot) 1 1.37 2,38 ± 0.08 30.9 ± 1.1 1st extraction 1.37 1.90 ± 0.11 25.1 ± 1.4 Oxalic acid (hot) 1 1.37 0.44 ± 0.15 6 ± 2 2nd extraction 1.37 0.44 ± 0.17 6 ± 2 0.1 M NaNO3 (pH 3) 1 3.02 2.17 ± 0.12 29 ± 2 1st extraction 3.08 1.71 ± 0.12 23 ± 2 0.1 M NaNO3 (pH 3) 1 3.07 0.37 ± 0.04 5.0 ± 0.5 2nd extraction 3.08 0.37 ± 0.04 5.0 ± 0.5 Tamm's reagent 2 3.30 1.52 ± 0.07 20.4 ± 1.5 1st extraction 3.31 1.04 ± 0.07 13.8 ± 1.5 Oxalic acid 18 1.37 1.14 ± 0.05 15.3 ± 1.4 2nd extraction 1.38 1.67 ± 0.05 22.2 ± 1.4

16
3.1.1 Iron in KGa-1b kaolinite
Both the percentage and content (µg Fe/g kaolinite) of extracted iron together with the pH of the extracted solutions are presented in Table 4. The results show that only a small quantity of iron in KGa-1b kaolinite is extractable. There is no difference between the extracted amorphous or crystalline iron. One reason for this was thought to be the presence of metallic iron, which could be contamination by the grinding of kaolinite. KGa-1b kaolinite was analyzed by scanning electron microscopy (SEM) at GSF for any metallic iron. No metallic iron or iron mineral was found.
In the literature, the local environment of iron in KGa-1b kaolinite has been studied by X-ray absorption spectroscopy. The X-ray absorption near-edge structure (XANES) contains information on the coordination of the absorbing atom, oxidation state and site symmetry. The results showed that KGa-1b kaolinite contained six-fold coordinated Fe3+, which was substituting Al3+ in the kaolinite structure. Also, it was possible that some iron is contained in amorphous and/or crystalline intercalated hydroxides (Gualteri et al., 2000). These results are in accordance with the results of the phase-selective extraction of iron in our study.
The above results indicate that most of the iron in KGa-1b kaolinite is structural.
3.1.2 Organic impurities
Kaolinite samples were studied for organics by XRD and by thermogravimetric DTA (Differential Thermal Analysis) method. By DTA the organic impurities should show loss of weight much earlier than the typical collapse of kaolinite structure at 550 ºC. The methods were not sensitive enough.
Infrared (IR) analysis showed weak absorption both at around 2 700 cm-1 and 1 700 - 1 600 cm-1 wave numbers, characteristic of the adsorption regions in the IR spectrum of humic acid. However, any conclusive results of the presence of humic acid in the kaolinite could not be made.
The analysis of gases released from heated KGa-1b kaolinite indicated that it contained organic matter. Reference samples were prepared from kaolinite and humic acid (Fluka 53680).
The release of gases (oxides of carbon, nitrogen and sulphur) from kaolinite started at around 300 °C. As the temperature was increased to 400 °C, most of the carbon oxides were released during the first 10 minutes. After 30 minutes, the release of oxides of nitrogen and sulphur also stopped.
The mass of organic carbon in the samples of kaolinite was calculated to be 29 ± 3 µg/g. Assuming that the kaolinite samples contained humic acid, an equation can be formulated for the mass of detected carbon as a function of humic acid concentration. The quantity of the organic matter calculated as humic acid was 0.54 ± 0.06 mg/g kaolinite (Puukko et al., 2003).

17
3.2 Results of the titrations
The results of the continuous titrations are presented in Appendices 1 to 7, and the results of batch titrations in Appendices 8 to 11 in Puukko et al. (2003). The cations, silica and lanthanides that were determined are presented in Figures 2–5.
3.2.1 Results of batch titrations
The lanthanides were detectable above 6·10-12 M in the acidic pH range 3–6. The sum of the concentrations of lanthanides in the solution at pH 3 was about the same as the added concentration of europium (10-8 M) used in the sorption experiments. The concentrations of the lanthanide ions determined from the solutions of batch titrations of KGa-1b are presented in Figure 1.
In the analysis of the batch titration solutions the main observed elements of kaolinite origin were calcium, magnesium, silicon, aluminium and zinc (Puukko et al., 2003). In the 0.05 M NaNO3 solution at pH 3 the concentration of Al was 9.5·10-6 M and the concentration of Zn was 1.4·10-6 M (Figure 2). Magnesium and calcium maintained the same concentrations over the pH range 3-11 (Figure 2). Concentrations of Ca and Mg suggest that some DIC most probably originate carbonate minerals in the KGa-1b. The dissolved amounts of Al and Si were small and dissolution of kaolinite was estimated to have no impact on titration and sorption results.
pH
2 3 4 5 6 7 8 9 10
Con
cen
tratio
n (
mol/L
)
10-12
10-11
10-10
10-9
10-8
10-7
La
Ce
Pr
Nd
Sm
Eu
Gd
Tb
Dy
Ho
Er
Tm
Yb
Lu
Total conc.
Lanthanides 0.05 M
pH
2 3 4 5 6 7 8 9 10
Con
cen
tratio
n (
mol/L
)
10-12
10-11
10-10
10-9
10-8
La
Ce
Pr
Nd
Sm
Eu
Gd
Tb
Dy
Ho
Er
Tm
Yb
Lu
Total conc.
Lanthanides 0.1 M
Figure 1. Concentrations and total concentration (solid line) of the lanthanide ions in
0.05 M and 0.1 M NaNO3 solution in the batch titration of KGa-1b kaolinite (Puukko et
al., 2003).

18
Al
pH
2 3 4 5 6 7 8 9 10 11
Con
cen
tratio
n (
mo
l/L)
10-7
10-6
10-5
10-4
0.05 M
0.1 MCa
pH
2 3 4 5 6 7 8 9 10 11
Con
cen
tratio
n (
mo
l/L)
10-7
10-6
10-5
10-4
0.05 M
0.1 M
Mg
pH
2 3 4 5 6 7 8 9 10 11
Con
cen
tratio
n (
mo
l/L)
10-7
10-6
10-5
10-4
0.05 M
0.1 M
Zn
pH
2 3 4 5 6 7 8 9 10 11
Con
cen
tratio
n (
mo
l/L)
10-7
10-6
10-5
10-4
0.05 M
0.1 M
Pb
pH
2 3 4 5 6 7 8 9 10 11
Conce
ntr
atio
n (
mol/L
)
10-10
10-9
10-8
10-7
0.05 M
0.1 MMn & Si
pH
2 3 4 5 6 7 8 9 10 11
Co
nce
ntr
atio
n (
mol/L
)
10-8
10-7
10-6
10-5
0.05 M Mn
0.1 M Si
Figure 2. Concentration of the metal ions in 0.05 M and 0.1 M NaNO3 solution in the
batch titration of KGa-1b kaolinite. Note: in the last figure, both Mn (not observed at
0.1 M) and Si are given (not observed at 0.05 M).

19
La
pH
2 3 4 5 6 7 8 9 10
Con
centr
atio
n (
mo
l/L)
10-12
10-11
10-10
10-9
10-8
0.05 M
0.1 MCe
pH
2 3 4 5 6 7 8 9 10
Con
centr
atio
n (
mo
l/L)
10-12
10-11
10-10
10-9
10-8
0.05 M
0.1 M
Pr
pH
2 3 4 5 6 7 8 9 10
Con
centr
atio
n (
mo
l/L)
10-12
10-11
10-10
10-9
10-8
0.05 M
0.1 M
Nd
pH
2 3 4 5 6 7 8 9 10
Con
centr
atio
n (
mo
l/L)
10-12
10-11
10-10
10-9
10-8
0.05 M
0.1 M
Sm
pH
2 3 4 5 6 7 8 9 10
Con
centr
atio
n (
mo
l/L)
10-12
10-11
10-10
10-9
10-8
0.05 M
0.1 M
Eu
pH
2 3 4 5 6 7 8 9 10
Co
nce
ntr
atio
n (
mo
l/L)
10-12
10-11
10-10
10-9
10-8
0.05 M
0.1 M
Figure 3. Concentration of the lanthanides, La, Ce, Pr, Nd, Sm and Eu, in 0.05 M and
0.1 M NaNO3 solution in the batch titration of KGa-1b kaolinite.

20
Gd
pH
2 3 4 5 6 7 8 9 10
Co
nce
ntr
atio
n (
mo
l/L)
10-12
10-11
10-10
10-9
10-8
0.05 M
0.1 MTb
pH
2 3 4 5 6 7 8 9 10
Co
nce
ntr
atio
n (
mo
l/L)
10-12
10-11
10-10
10-9
10-8
0.05 M
0.1 M
Dy
pH
2 3 4 5 6 7 8 9 10
Co
nce
ntr
atio
n (
mo
l/L)
10-12
10-11
10-10
10-9
10-8
0.05 M
0.1 M
Ho
pH
2 3 4 5 6 7 8 9 10
Co
nce
ntr
atio
n (
mo
l/L)
10-12
10-11
10-10
10-9
10-8
0.05 M
0.1 M
Er
pH
2 3 4 5 6 7 8 9 10
Co
nce
ntr
atio
n (
mo
l/L)
10-12
10-11
10-10
10-9
10-8
0.05 M
0.1 M
Tm
pH
2 3 4 5 6 7 8 9 10
Co
nce
ntr
atio
n (
mo
l/L)
10-13
10-12
10-11
10-10
10-9
10-8
0.05 M
0.1 M
Figure 4. Concentration of the lanthanides, Gd, Tb, Dy, Ho, Er and Tm, in 0.05 M and
0.1 M NaNO3 solution in the batch titration of KGa-1b kaolinite.

21
Yb
pH
2 3 4 5 6 7 8 9 10
Con
centr
atio
n (
mo
l/L)
10-12
10-11
10-10
10-9
10-8
0.05 M
0.1 M
Lu
pH
2 3 4 5 6 7 8 9 10
Con
centr
atio
n (
mo
l/L)
10-12
10-11
10-10
10-9
10-8
0.05 M
0.1 M
Figure 5. Concentration of the lanthanides, Yb and Lu, in 0.05 M and 0.1 M NaNO3
solution in the batch titration of KGa-1b kaolinite.
3.3 Sorption and desorption results
3.3.1 Sorption of europium on KGa-1b and HKGa kaolinites
The results of the sorption of europium on KGa-1b and HKGa kaolinites in 0.05, 0.1 and 0.5 M NaNO3 solutions are presented in Figures 6 and 7. The sorption of Eu on both kaolinite types in the acidic pH range (pH <5) decreased with the ionic strength. In the alkaline pH range (pH >8), the Rd values were high at all ionic strengths. As almost all of europium (>99.9%) was sorbed, the uncertainty in these dR values was
significant.
3.3.2 Desorption of europium
The pH of a sample solution for sorption, and of the same sample in desorption, experiment and the corresponding Rd values of europium sorbed on kaolinite and desorbed from kaolinite are presented in Puukko et al. (2004). From the amount of europium desorbed, an Rd value of desorption was calculated. In the fully reversible case, the Rd values for sorption and desorption at the same pH should be the same, because the total amount of Eu in the sorption and desorption were nearly the same owing to high sorption. The sorption and desorption Rd values for Eu on the kaolinites are presented in Figure 8.
At the lowest ionic strength, the desorption pH was 3.1–4.2 and the desorption Rd values are in fair agreement with the Rd measured for this pH range in sorption experiments. Only in the KGa-1b sample at a sorption pH 10.07, the desorption Rd value at pH 3.6 was higher than in a fully reversible case. In general, the sorption at ionic strength 0.05 M is reversible for both kaolinites (Appendix C).

22
Kga-1b: Rd
pH
2 3 4 5 6 7 8 9 10 11
Rd (
ml g
-1)
101
102
103
104
105
106
107
0.05 M
determination limit
HKGa: Rd
pH
2 3 4 5 6 7 8 9 10 11
Rd (
ml g
-1)
101
102
103
104
105
106
107
0.05 M
determination limit
Kga-1b: Rd
pH
2 3 4 5 6 7 8 9 10 11
Rd (
ml g
-1)
101
102
103
104
105
106
107
0.1 M
determination limit
HKga: Rd
pH
2 3 4 5 6 7 8 9 10 11
Rd (
ml g
-1)
101
102
103
104
105
106
107
0.1 M
determination limit
Kga-1b: Rd
pH
2 3 4 5 6 7 8 9 10 11
Rd (
ml g
-1)
101
102
103
104
105
106
107
0.5 M
determination limit
HKga: Rd
pH
2 3 4 5 6 7 8 9 10 11
Rd (
ml g
-1)
101
102
103
104
105
106
107
0.5 M
determination limit
Figure 6. Sorption of europium on KGa-1b kaolinite in 0.05, 0.1 and 0.5 M NaNO3
solutions. The maximum Rd level is based on the determination limit of the radioassay of
Eu-152. Experimental uncertainty estimates are shown as grey bars.

23
Kga-1b Eu adsorption
pH
2 3 4 5 6 7 8 9 10 11
Rd (
ml g
-1)
101
102
103
104
105
106
107
0.05 M
0.1 M
0.5 M
Det. limit
HKGa Eu adsorption
pH
2 3 4 5 6 7 8 9 10 11
Rd d
eso
rptio
n (
ml g
-1)
101
102
103
104
105
106
107
0.05 M
0.1 M
0.5 M
Figure 7. Sorption of europium on KGa-1b kaolinite in 0.05, 0.1 and 0.5 M NaNO3
solutions. The maximum Rd level is based on the determination limit of the radioassay of
Eu-152.
At the ionic strength of 0.1 M, partial irreversibility or slow desorption was found for samples with sorption pH higher than 6.4. The desorption Rd values at the pH range 4.2–4.6 were high (600–1 000 ml/g for KGa-1b and 1 000–12 000 ml/g for HKGa) compared to sorption Rd values (150 ml/g for KGa-1b and HKGa) for this pH range. The samples with pH lower than 5.25 indicated reversible sorption (Appendix C).
For the 0.5-M ionic strength, the sorption of Eu on both kaolinites had the same trends as at the 0.1 M ionic strength. For HKGa the desorption pH was 4.5–4.9. The Rd in the sorption experiments was about 50 ml/g for this pH range. The desorption indicated three different groups of samples. At the lowest sorption pH, the desorption indicated full reversibility. The samples in the pH range 7.45–8.95 for the sorption phase indicated sorption/desorption Rd values of 50 ml/g / 960–1 900 ml/g , those in the sorption pH range 6.1–6.4 had sorption/desorption Rd values of 50 ml/g/50–380 ml/g, which indicates that the sorption is not fully reversible in the 18-hours experimental time (Appendix C).

24
KGa-1b: desorption vs. sorption 0.05 M
Rd (ml g-1)
101 102 103 104 105 106 107
Rd d
eso
rptio
n (
ml g
-1)
100
101
102
103
104
105
First desorption
Square fit
HKGa: desorption vs. sorption 0.05 M
Rd (ml g-1)
101 102 103 104 105 106 107
Rd d
eso
rptio
n (
ml g
-1)
100
101
102
103
104
105
First desorption
Second desorption
Square fit
KGa-1b: desorption vs. sorption 0.1 M
Rd (ml g-1)
101 102 103 104 105 106 107
Rd d
eso
rptio
n (
ml g
-1)
100
101
102
103
104
105
First desorption
Second desorption
Square fit
HKGa: desorption vs. sorption 0.1 M
Rd (ml g-1)
101 102 103 104 105 106 107
Rd d
eso
rptio
n (
ml g
-1)
100
101
102
103
104
105
First desorption
Square fit
KGa-1b: desorption vs. sorption 0.5 M
Rd (ml g-1)
101 102 103 104 105 106 107
Rd d
eso
rptio
n (
ml g
-1)
100
101
102
103
104
105
Second desorption
Square fit
HKGa: desorption vs. sorption 0.5 M
Rd (ml g-1)
101 102 103 104 105 106 107
Rd d
eso
rptio
n (
ml g
-1)
100
101
102
103
104
105
First desorption
Square fit
Figure 8. Sorption of europium (Rd) and desorption of europium (Rd desorption) on
KGa-1b and HKGa kaolinites in 0.05, 0.1, and 0.5 M NaNO3 solution. Sum-of-least-
squares fits are shown only to guide the eye.

25
3.3.3 Sorption isotherms
Sorption isotherms of europium for KGa-1b kaolinite, where the total Eu concentration varied from 10-11 to 10-3 M, are given in Figure 9. A deviation from the constant-Rd
(linear) isotherms is observed for the highest Eu concentrations.
1.E-08
1.E-07
1.E-06
1.E-05
1.E-04
1.E-03
1.E-02
1.E-01
1.E+00
1.E-10 1.E-08 1.E-06 1.E-04 1.E-02 1.E+00
C (Eu) in solution (M)
C (
Eu
) o
n k
ao
linit
e (
mo
l/kg
)
pH 3 0.05 M
pH 6 0.05 M
pH 6 0.5 M
Figure 9. Eu sorption isotherms in 0.05 M (pH 3 and 6) and 0.5 M NaClO4 (pH 6)
solution.
3.4 Molecular-modelling results
In this work, we have utilized a modern molecular-modelling technique in order to study the surface properties of kaolinite. In particular, the aim of the study was to compare the properties of non-hydrated and hydrated kaolinite surfaces and to estimate the position of the adsorption sites.
3.4.1 The unit cell of kaolinite
The starting point for the surface studies was the triclinic unit cell of kaolinite (Accelrys, 2001). First, the structure of the unit cell was optimized (Figure 10). The optimized unit-cell parameters together with some experimental values are presented in Table 5.

26
Table 5. Unit cell parameters.
Exptl. Calcd.
a 5.15 Å 5.15 Å b 8.93 Å 8.94 Å c 7.38 Å 7.54 Å
91.9˚ 91.7˚ 105.0˚ 104.4˚ 89.8˚ 89.8˚
Figure 10. The unit cell of kaolinite. Blue
circles: Al atoms. Yellow circles: Si atoms.
Red circles: O atoms. Grey circles: H
atoms.
3.4.2 Kaolinite surfaces
Based on the literature data (Brady et al., 1996) and the computational method, the most interesting surfaces of kaolinite are the (010), (001) and (100) crystal faces. In Figure 11, the (010) surface without relaxation of surface atoms is represented by a ball-and-stick model and van der Waals spheres. The surface consists of four-coordinated aluminium atoms, oxygen atoms and hydrogen atoms. Figure 12 illustrates the tetrahedral coordination spheres of silicon atoms and the octahedral coordination spheres of aluminium atoms. The charge-density map of Figure 12 is presented more exactly in Figure 13.
Figure 11. (010) surface of kaolinite. Blue circles: Al atoms. Yellow circles: Si atoms.
Red circles: O atoms. Grey circles: H atoms.

27
Figure 12. (010) surface of kaolinite with the charge density map. Blue octahedrons: Al
atoms. Yellow tetrahedrons: Si atoms.
Figure 13. Charge densities of the kaolinite (010) surface.
In the red areas of Figure 13, the charge density is the highest, about 7 electrons in Å3,and in the black areas, it is below 0.1 electrons in Å3. The highest charge-density areas are situated around the oxygen atoms. The zero-charge density is achieved at a distance of 1.8 Å from the surface.
In order to get a more realistic description of the steric and electrostatic factors of the kaolinite (010) surface, reconstruction of the surface atoms was taken into account. In Figure 14, the charge-density map of the optimized (010) surface is presented. A comparison of Figures 13 and 14 shows only minor changes in the charge densities. The highest charge-density areas are situated around the oxygen atoms with the charge of 7.2 electrons in Å3. The zero-charge density is achieved at a distance of 1.4 Å from the surface.

28
Figure 14. Charge densities of the optimized kaolinite (010) surface.
On the ideal (010) surface of kaolinite, the coordination number of aluminium atoms is only four, and there exist oxygen atoms in oxide form. Therefore, it is important to consider the effect of hydrolysis to stabilize the crystal face. In Figure 15, the hydrated surface structure is represented by a ball-and-stick model and by van der Waals spheres. The surface structure was optimized in order to find an energetically favourable orientation for hydroxyl groups.
Figure 15. Hydrated (010) surface of kaolinite: side-view (up) and top-view (down).
Blue circles: Al atoms. Yellow circles: Si atoms. Red circles: O atoms. Grey circles: H
atoms.
29
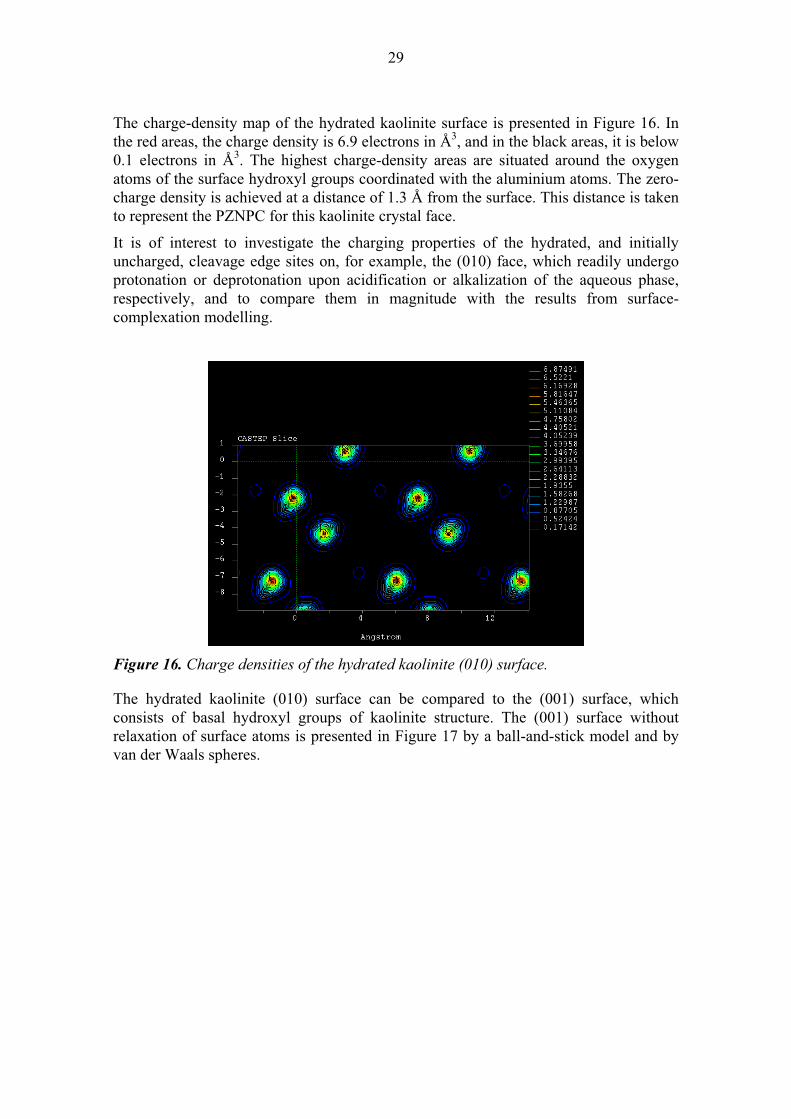
The charge-density map of the hydrated kaolinite surface is presented in Figure 16. In the red areas, the charge density is 6.9 electrons in Å3, and in the black areas, it is below 0.1 electrons in Å3. The highest charge-density areas are situated around the oxygen atoms of the surface hydroxyl groups coordinated with the aluminium atoms. The zero-charge density is achieved at a distance of 1.3 Å from the surface. This distance is taken to represent the PZNPC for this kaolinite crystal face.
It is of interest to investigate the charging properties of the hydrated, and initially uncharged, cleavage edge sites on, for example, the (010) face, which readily undergo protonation or deprotonation upon acidification or alkalization of the aqueous phase, respectively, and to compare them in magnitude with the results from surface-complexation modelling.
Figure 16. Charge densities of the hydrated kaolinite (010) surface.
The hydrated kaolinite (010) surface can be compared to the (001) surface, which consists of basal hydroxyl groups of kaolinite structure. The (001) surface without relaxation of surface atoms is presented in Figure 17 by a ball-and-stick model and by van der Waals spheres.

30
Figure 17. (001) surface of kaolinite. Blue circles: Al atoms. Yellow circles: Si atoms.
Red circles: O atoms. Grey circles: H atoms.
The charge-density map of the kaolinite (001) surface is presented in Figure 18. The charge density varies between 0.1 and 2.1 electrons in Å3, and the charge density spreads rather evenly over the surface, although the highest charges can be found around the hydrogen atoms. The zero-charge density is achieved at a distance of 1.0 Å from the surface.
A comparison of charge densities in Figures 16 and 18 indicates that the charge-density distribution for these two surfaces is clearly different. However, the zero-charge density area is received nearly at the same distance from the surface.
Figure 18. Charge densities of the kaolinite (001) surface.
3.4.3 Eu(H2O)93+ ion and its adsorption onto kaolinite surface
In order to estimate the adsorption position for an Eu(H2O)93+ ion on kaolinite surfaces,
the structure of the ion was optimized (Figure 19). The structure of the nine-coordinated

31
europium is a tricapped trigonal prism. It can be supposed that the Eu(H2O)93+ ion
complex adsorbs onto kaolinite surfaces via four water molecules located on the lower side of the ion in Figure 19. The estimated adsorption geometry on the hydrated (010) surface of kaolinite is presented in Figure 20. The geometry is consistent with the earlier study (Cygan et al., 1998) concerning the interaction of the solvated cesium ion with the kaolinite surfaces. Based on the study, the cesium ion prefers to adsorb on the Al octahedra in the (010) kaolinite surface instead of the tetrahedral coordination sphere of silicon atoms.
Figure 19. Structure of Eu(H2O)93+
with van der Waals spheres. Green circle: Eu atom.
Red circles: O atoms. Grey circles: H atoms.
Figure 20. Eu(H2O)93+
on the hydrated (010) surface of kaolinite (non-optimized
structure). Blue circles: Al atoms. Yellow circles: Si atoms. Red circles: O atoms. Grey
circles: H atoms. Green circle: Eu atom.
3.5 Aqueous speciation of Eu(III)
Based on the equilibrium reactions in Tables 1 and 2, the speciation diagrams of Eu(III), calculated with the FITEQL v. 4.0 software (Herbelin & Westall, 1999), are depicted in

32
Figure 21, where, on the left-hand side, are the lower total concentrations and, on the right-hand side, the total concentration increases from top to bottom. The main feature
in the europium speciation is the increase of the 23EuNO species at the expense of the
Eu3+ species with the solution ionic strength. At pH 6, europium starts to hydrolyze. The
higher the Eu concentration, the higher is the concentration of the 4
2 2Eu OH species.

33
pH
3 4 5 6 7 8 9 10 11
Co
nce
ntr
atio
n (
mol l
-1)
0
2x10⁻⁹
4x10⁻⁹
6x10⁻⁹
8x10⁻⁹
10x10-9
Eu3+
Eu(OH)2+
Eu(OH)2+
Eu(OH)3(aq)
Eu2(OH)24+
EuNO32+
Eu(III) species 0.05 M,[Eu]tot=10-8 M
pH
3 4 5 6 7 8 9 10 11
Co
nce
ntr
atio
n (
mol l
-1)
0
200x10-9
400x10-9
600x10-9
800x10-9
1x10⁻⁶
Eu3+
Eu(OH)2+
Eu(OH)2+
Eu(OH)3(aq)
Eu2(OH)24+
EuNO32+
Eu(III) species 0.05 M,[Eu]tot=10-6 M
pH
3 4 5 6 7 8 9 10 11
Co
nce
ntr
atio
n(m
oll
)
0
2x10⁻⁹
4x10⁻⁹
6x10⁻⁹
8x10⁻⁹
10x10-9
Eu3+
Eu(OH)2+
Eu(OH)2+
Eu(OH)3(aq)
Eu2(OH)24+
EuNO32+
Eu(III) species 0.1 M,[Eu]tot=10-8 M
pH
3 4 5 6 7 8 9 10 11
Co
nce
ntr
atio
n (
mol l
-1)
0
20x10-6
40x10-6
60x10-6
80x10-6
100x10-6
Eu3+
Eu(OH)2+
Eu(OH)2+
Eu(OH)3(aq)
Eu2(OH)24+
EuNO32+
Eu(III) species 0.1 M,[Eu]tot=10-4 M
pH
3 4 5 6 7 8 9 10 11
Co
nce
ntr
atio
n(m
oll
)
0
2x10⁻⁹
4x10⁻⁹
6x10⁻⁹
8x10⁻⁹
10x10-9
Eu3+
Eu(OH)2+
Eu(OH)2+
Eu(OH)3(aq)
Eu2(OH)24+
EuNO32+
Eu(III) species 0.5 M,[Eu]tot=10-8 M
pH
3 4 5 6 7 8 9 10 11
Co
nce
ntr
atio
n (
mol l
-1)
0
200x10-6
400x10-6
600x10-6
800x10-6
1x10⁻³
Eu3+
Eu(OH)2+
Eu(OH)2+
Eu(OH)3(aq)
Eu2(OH)24+
EuNO32+
Eu(III) species 0.5 M,[Eu]tot=10-3 M
Figure 21. Calculated speciation of europium for a total concentration of 10-8
M on the
left-hand side and 10-6
to 10-3
M on the right-hand side in 0.05, 0.1 and 0.5 M NaNO3
solutions.

34
3.6 Titrations
In a previous study (Lehikoinen et al., 2002), different surface-charging models for both 1-pK and 2-pK approaches were tested. Due to the simplicity of the 1-pK model approach, we limited ourselves to optimizing aK (1-pK) and the surface site density,
sN , by applying a diffuse-layer model (DLM) in all calculations. Two different surface
sites were assumed, the silanol and aluminol one.
In total, seven titration sets were available, but one of three sets in the 0.1 M solution differed very much from the others and caused serious convergence problems, and, consequently, was rejected. Therefore, two sets were available at each ionic strength. In principle, all data should be handled in a single FITEQL run, but this was not possible due to convergence problems. A systematic approach of separate calculation of each set was followed instead:
1. aK and sN were fitted for every set separately
2. Mean values for the parameters were calculated
3. From all parameters, the lowest and highest value was rejected
4. New mean values (excluding rejected values) were calculated
5. sN values were fixed at these corrected mean values
6. New aK values were fitted for each set
7. The mean value for aK was calculated
8. The lowest and highest values were rejected
9. Corrected mean values were calculated
The preliminary and final optimized values for different coefficients are given in Table 6 and the model curves calculated using the final values are compared to experimental data in Figure 21. For the full set of experimental titration data, consult Puukko & Hakanen (2004).
The optimized surface-site densities, 31.0 mol g–1 for the aluminol and 18.1 mol g–1
for the silanol sites for the 1-pK model are (together and divided by two) close to the value reported by Brady et al. (1996) for the untreated KGa-1 kaolinite, 37.5 mol g–1
(The fact that the site densities optimized for the 1-pK model are twice the values for the 2-pK model is a special feature of the former (Bolt & van Riemsdijk, 1982; Gunnarsson et al., 2000)). The optimized logarithmic acidity constants are 3.86 and 7.03 for the aluminol and silanol sites, respectively.
A comparison between model and measured titration curves is shown in Figure 22. There is no significant difference between the ionic strengths studied.

35
Table 6. Preliminary and final values for acidity constants and surface site densities.
The upper table is for optimising surface densities, which were fixed at the values typed
in bold, and the lower table for acidity constants.
I (M) set Alalog K Si
alog K AlsN (µmol g-1)
SisN (µmol g-1) SOS/DF
0.05 1 3.29 6.20 20.2 14.5 19.06 0.05 2 3.77 7.26 51.1 31.4 5.59 0.1 2 3.77 6.12 25.4 13.5 71.58 0.1 3 3.94 5.98 27.4 13.1 72.16 0.5 1 3.41 6.92 19.7 13.1 29.41 0.5 2 3.72 8.30 94.4 73.7 14.73
min 3.29 5.98 19.7 13.1 max 3.94 8.30 39.7 26.5 mean 3.65 6.79 94.4 73.7 corr.mean 3.67 6.62 31.0 18.1
I (M) set Alalog K Si
alog K SOS/DF
0.05 1 3.77 7.33 53.860.05 2 3.76 6.20 53.820.1 2 3.85 7.17 26.200.1 3 3.86 7.03 23.540.5 1 3.96 8.08 63.070.5 2 3.95 6.60 182.91
min 3.76 6.20 max 3.86 7.07 mean 3.96 8.08 corr.mean 3.86 7.03

36
pH
4 5 6 7 8 9 10 11 12
[H+
] (m
ol L
-1)
-0.0012
-0.0010
-0.0008
-0.0006
-0.0004
-0.0002
0.0000
0.0002
Model 1
Model 2
Experimental 1
Experimental 2
pH
4 5 6 7 8 9 10 11 12
[H+
] (m
ol L
-1)
-0.0014
-0.0012
-0.0010
-0.0008
-0.0006
-0.0004
-0.0002
0.0000
0.0002
Experimental 1
Experimental 2
Experimental 2
Model 2
Model 3
pH
4 5 6 7 8 9 10 11 12
[H+
] (m
ol L
-1)
-0.0012
-0.0010
-0.0008
-0.0006
-0.0004
-0.0002
0.0000
0.0002
Experimental 1
Experimental 2
Model 1
Model 2
pH
4 5 6 7 8 9 10 11 12
[H+
] (m
ol L
-1)
-0,0012
-0,0010
-0,0008
-0,0006
-0,0004
-0,0002
0,0000
0,0002
0.05 M exp 1
0.05 M exp 20.05 M Final model
0.1 M exp 1
0.1 M exp 20.1 M Final model
0.5 M exp 1
0.5 M exp 20.5 M Final model
Figure 22. Fitted and measured titration curves at 0.05 M, 0.1 M and 0.5 M ionic
strengths. The lower-right figure shows the final model results.
3.7 Adsorption
Every data set for KGa-1b and HKGa at the three ionic strengths was fitted separately for the reactions given in Table 7. All the parameter choices and results are given in Table 8. The logarithm of the selectivity coefficient for the half-reaction (14) was set at 10.0. The corrected cation-exchange selectivity for the reaction (14) was calculated according to the procedure in Appendix A. Only the surface-silanol site was allowed to adsorb Eu in addition to a cation-exchange reaction, for which the cation exchange capacity (CEC) was fixed at 1.3·10-5 M or 0.65 meq/100 g. First, the fitting was done separately for KGa-1b and HKGa for all the three ionic strengths. Both surface-complexation and cation-exchange constants were fitted. Finally, the model including one surface-complexation and one cation-exchange reaction was accepted for further calculations by first fixing the cation-exchange selectivity at 40.9, and, then, fitting all the data sets using this fixed value. The reaction chosen for surface complexation was the first one in Table 7, with log K = 4.3. The model fits for KGa-1b were poorest at the

37
highest ionic strength, but, even there, better than fits for HKGa for the lowest and highest ionic strength. The model results are shown in Figures 23 to 26 both as per cent sorbed and as Kd. In the first set of figures, the best fit is used, while in the second set, the final model (SC 6) is applied.
Table 7. Surface reactions (SC = Surface Complexation; CE = Cation Exchange).
Table 8. Iterations and values of fitted parameters. The ionic strength, I (M), is given in
the first column and q describes the relativity quality of a fit.
SC 1 & CE KGa-1b HKGa I
SC_1log K CElog K q I SC_1log K CElog K q
0.05 4.6 40.8 2.14 0.05 5.4 40.6 20.0 0.1 4.0 41.1 1.72 0.1 5.0 40.9 32.7 0.5 3.3 42.6 2.20 0.5 2.8 43.1 31.8
SC 2 & CE KGa-1b HKGa I
SC_2log K CElog K q I SC_2log K CElog K q
0.05 10.9 40.8 2.25 0.05 11.7 40.6 21.3 0.1 10.2 41.1 1.76 0.1 11.3 40.9 32.9 0.5 9.5 42.6 2.49 0.5 8.8 43.1 44.4
SC 3 & CE KGa-1b HKGa I
SC_3log K CElog K q I SC_3log K CElog K q
0.05 0.12 40.8 2.25 0.05 0.96 40.6 21.3 0.1 -0.53 41.1 1.76 0.1 0.53 40.9 32.9 0.5 -1.30 42.6 2.49 0.5 -2.02 43.1 44.5
SC 4 & CE KGa-1b HKGa I
SC_4log K CElog K q I SC_4log K CElog K q
0.05 9.1 40.8 2.11 0.05 9.9 40.6 18.7 0.1 8.5 41.1 1.70 0.1 9.4 40.9 32.4 0.5 9.0 42.2 256 0.5 7.7 43.0 27.1
SC 5 A KGa-1b HGa I
SC_1log K CElog K q I SC_1log K CElog K q
0.05 4.5 40.9 6.55 0.05 5.2 40.9 66.6 0.1 4.1 40.9 7.02 0.1 5.0 40.9 29.5 0.5 3.5 40.9 8.47 0.5 2.9 40.9 86.5
SC 6 B KGa-1b HKGa I
SC_1log K CElog K q ISC_1log K CElog K q
0.05 4.3 40.9 12.9 0.05 4.3 40.9 115.6 0.1 4.3 40.9 23.8 0.1 4.3 40.9 54.9 0.5 4.3 40.9 82.7 0.5 4.3 40.9 327.8
A Model SC 5 = SC 1 with CElog K fixed at 40.9. SC 1 was the best model.
B Model SC 6 = SC 1 with both SC_1log K and CElog K fixed at values 4.3 and 40.9, respectively.

38
pH
3 4 5 6 7 8 9 10 11
% s
orb
ed
0
20
40
60
80
100
Experimental
Model
KGa 0.05 M
pH
3 4 5 6 7 8 9 10 11
% s
orb
ed
0
20
40
60
80
100
Experimental
Model
HKGa 0.05 M
pH
3 4 5 6 7 8 9 10 11
% s
orb
ed
0
20
40
60
80
100
Experimental
Model
KGa 0.1 M
pH
3 4 5 6 7 8 9 10 11
% s
orb
ed
0
20
40
60
80
100
Experimental
Model
HKGa 0.1 M
pH
3 4 5 6 7 8 9 10 11
% s
orb
ed
0
20
40
60
80
100
Experimental
Model
KGa 0.5 M
pH
3 4 5 6 7 8 9 10 11
% s
orb
ed
0
20
40
60
80
100
Experimental
Model
HKGa 0.1 M
Figure 23. Fitted adsorption as per cent sorbed for both kaolinite types at three ionic
strengths, 0.05 M, 0.1 M and 0.5 M. Each curve is calculated using the individual,
sample specific, parameters (SC 5) in Table 8.

39
pH
3 4 5 6 7 8 9 10 11
% s
orb
ed
0
20
40
60
80
100
Experimental
Model 6
KGa 0.05 M
pH
3 4 5 6 7 8 9 10 11
% s
orb
ed
0
20
40
60
80
100
Experimental
Model 6
HKGa 0.05 M
pH
3 4 5 6 7 8 9 10 11
% s
orb
ed
0
20
40
60
80
100
Experimental
Model 6
KGa 0.1 M
pH
3 4 5 6 7 8 9 10 11
% s
orb
ed
0
20
40
60
80
100
Experimental
Model 6
HKGa 0.1 M
pH
3 4 5 6 7 8 9 10 11
% s
orb
ed
0
20
40
60
80
100
Experimental
Model 6
KGa 0.5 M
pH
3 4 5 6 7 8 9 10 11
% s
orb
ed
0
20
40
60
80
100
Experimental
Model 6
HKGa 0.1 M
Figure 24. Fitted adsorption as per cent sorbed for both kaolinite types at three ionic
strengths, 0.05 M, 0.1 M and 0.5 M. Each curve is calculated using a common
parameter set, SC 6 in Table 7. When compared to Figure 23, where the individual,
sample specific, parameters were used, the differences are not very large.

40
pH
3 4 5 6 7 8 9 10 11
Kd (
ml g
-1)
10-1
100
101
102
103
104
105
106
107
108
109
Measured 0.05 M
Measured 0.1 M
Measured 0.5 M
Model 0.05 M
Model 0.1 M
Model 0.5 M
KGa Kd
pH
3 4 5 6 7 8 9 10 11
Kd (
ml g
-1)
10-1
100
101
102
103
104
105
106
107
108
109
Measured 0.05 M
Measured 0.1 M
Measured 0.5 M
Model 0.05 M
Model 0.1 M
Model 0.5 M
HKGa Kd
Figure 25. Model Kd values for both kaolinite types at three ionic strengths, 0.05 M, 0.1
M and 0.5 M. Each curve is calculated using the same parameters as in Figure 23,
SC 5. The Kd curves differ from experimental values, especially at neutral pH.
pH
3 4 5 6 7 8 9 10 11
Kd (
ml g
-1)
10-1
100
101
102
103
104
105
106
107
108
109
Measured 0.05 M
Measured 0.1 M
Measured 0.5 M
Model 6: 0.05 M
Model 6: 0.1 M
Model 6: 0.5 M
KGa Kd
pH
3 4 5 6 7 8 9 10 11
Kd (
ml g
-1)
10-1
100
101
102
103
104
105
106
107
108
109
Measured 0.05 M
Measured 0.1 M
Measured 0.5 M
Model 6: 0.05 M
Model 6: 0.1 M
Model 6: 0.5 M
HKGa Kd
Figure 26. Model Kd values for both kaolinite types at three ionic strengths, 0.05 M, 0.1
M and 0.5 M. Each curve is calculated using the same parameters as in Figure 24,
SC 6. The Kd curves differ from experimental values quite much, especially at neutral
pH.
3.7.1 Desorption models
Desorption experiments were done either by adding 57 micromoles or 0.1 moles of HNO3 per litre of original solution in the adsorption system causing the change in final pH. The effect of adding of 57 micromoles is shown in Figure 27 and, therefore, in the pH value range 5–9, the final pH will be about 4.2, and at lower pH, the final pH will decrease slightly (no change at very low pH), while at higher pH, no effect is seen. It is then assumable that the desorption Rd measured in the pH range 5–9 should be almost equal to an Rd measured at pH 4.2. This behaviour is seen in Figure 28, where both the experimental and modelled desorption Rd and Kd curves are shown. The strange-looking

41
behaviour of the model curve in the last caption of Figure 28 is fully logical, because, at high pH, the modelled sorption is lower than at neutral pH and, therefore, a small decrease in pH may even increase the desorption. In other pictures, the modelled high Kd is outside the scale.
Acid addition: 57 M HNO3
pH initial
2 3 4 5 6 7 8 9 10 11 12
pH
fin
al
2
3
4
5
6
7
8
9
10
11
12
Model without surface
Final pH = 4.35
Figure 27. Final pH in a 0.1 M NaNO3 electrolyte solution, when 57 µM of HNO3 is
added, as a function of initial pH.

42
KGa-1b: desorption vs. sorption 0.05 M
Rd (ml g-1)
101 102 103 104 105 106 107
Rd d
eso
rptio
n (
ml g
-1)
100
101
102
103
104
105
First desorption
Model
HKGa: desorption vs. sorption 0.05 M
Rd (ml g-1)
101 102 103 104 105 106 107
Rd d
eso
rptio
n (
ml g
-1)
100
101
102
103
104
105
First desorption
Model
KGa-1b: desorption vs. sorption 0.1 M
Rd (ml g-1)
101 102 103 104 105 106 107
Rd d
eso
rptio
n (
ml g
-1)
100
101
102
103
104
105
First desorption
Model
HKGa: desorption vs. sorption 0.1 M
Rd (ml g-1)
101 102 103 104 105 106 107
Rd d
eso
rptio
n (
ml g
-1)
100
101
102
103
104
105
First desorption
Model
No experimental data for KGa-1b in 0.5 M solution
HKGa: desorption vs. sorption 0.5 M
Rd (ml g-1)
101 102 103 104 105 106 107 108
Rd d
eso
rptio
n (
ml g
-1)
100
101
102
103
104
105
106
107
First desorption
Model
Figure 28. Model desorption curves together with the experimental Rd values measured
in the pH range 5–9. The desorption Kd is given as a function of original Kd.

43
3.7.2 Isotherm models
The dependence on concentration was studied by applying the model, SC 6, by varying the total Eu concentration (10-11–10-3 M) at the two experimentally studied ionic strengths (0.05 M and 0.5 M) and at one or two pH values (3 and 6). At the lower ionic strength, the model was not converging for a total concentration of about 10-5 M. The experimental and model curves for both ionic strengths and each pH value are shown in Figure 29.
ctot (M)
10-11 10-10 10-9 10-8 10-7 10-6 10-5 10-4 10-3
Kd (
ml g
-1)
10-1
100
101
102
103
104
105
exp pH = 3
exp pH = 6
model pH = 3
model pH = 6
Kd isotherm 0.05 M
ctot (M)
10-11 10-10 10-9 10-8 10-7 10-6 10-5 10-4 10-3
Kd (
ml g
-1)
10-1
100
101
102
103
104
105
exp pH = 6
model pH = 3
model pH = 6
Kd isotherm 0.5 M
Figure 29. Kd values for Eu on kaolinite as a function of total concentration of Eu at
two ionic strengths and at one or two pH values. There is a clear upward shift in model
values compared to the experimental ones.

44

45
4 DISCUSSION
4.1 Adsorption of Eu
In the acidic pH range, the sorption of europium was clear and affected by the ionic strength of the solution. The speciation of europium may have an effect on the sorption. The main species in acidic solutions are Eu3+ and the mono-nitrate complex, EuNO3
2+.In 0.05 M NaNO3 solution, the concentration of Eu3+ was clearly greater than the concentration of the complexed ion, Eu(NO3)
2+, as illustrated in Figure 21. In the 0.5 M NaNO3 solution, the concentrations of the bare ion and the complex were almost equal (Figure 21).
In the alkaline pH range, the removal of Eu from solution was nearly complete. The predominant species in this pH region was the neutral Eu(OH)3(aq) complex, which has the same chemical composition as the solubility-limiting solid, Eu(OH)3. The solubility of Eu(OH)3 in 0.05 M and 0.5 M NaNO3 solutions was calculated with the HYDRAQL program, using solubility-product data from two sources: Baes & Mesmer (1976) and Yun et al. (2001). Changing the carbonate level from 1·10-6 M to 1·10-5 M did not affect the solubility of Eu(OH)3 significantly.
The initial concentration of europium in NaNO3 solution was 1·10-8 M. According to the calculations based on the values of Baes & Mesmer (1976), the solubility limit of europium was not exceeded. In some of the isotherm experiments, the solution may have been oversaturated. So, it is possible that the sorption of europium in the alkaline pH range was partly due to the precipitation of europium and partly due to the sorption of europium on kaolinite and on the Eu precipitate.
The possibility of surface precipitation cannot be ruled out even though, in the experimental conditions presented here, the concentration of silanol and aluminol sorption sites was much higher than the number of Eu atoms. Elucidation of this issue requires further experiments under different conditions.
4.2 Reversibility of sorption
The desorption of europium showed two features: dependence on solution pH and ionic strength. In the 0.05 M NaNO3 solution, sorption was reversible for the whole pH range. Sorption in the acidic pH region, assumed to occur via cation exchange, was to a large extent reversible for the three ionic strengths. Sorption at the basic pH region was, to some extent, not completely reversible during the experimental time in the present study. The irreversibility increased with the ionic strength. In the future, the irreversibility and the effect of experimental time on the desorption of europium from kaolinite require further investigation. The findings suggest that irreversibility in the sorption of europium on kaolinite increases with sorption by inner-sphere surface complexation, whereby the nature of bonding with the surface is not electrostatic but mostly covalent. This is in good agreement with the very slow isotopic exchange in the sorption of samarium and ytterbium on kaolinite at pH 5–7, as reported by Coppin et al.
(2002). From the point of view of sorption modelling, this suggests that the law of mass action is not obeyed in the sorption of Eu and other lanthanides on kaolinite in alkaline pH conditions.

46
47
5 CONCLUSIONS
The two kaolinites in this study, the natural KGa-1b kaolinite from the Clay Minerals Society, USA, and its acid-conditioned form, HKGa, had nearly identical sorption properties. This indicates that iron in both kaolinites was structurally bound and that the amount of organic impurities had no influence on the sorption.
To enable the interpretation of adsorption results with surface-complexation modelling, an adequate characterization of the surface charging of the adsorbent is needed. In practice, titration experiments are capable of providing this information for ionisable interfaces, such as the ones considered here. The surface acidity of kaolinite was successfully explained by FITEQL, which yielded model curves in good agreement with experimental results. Further, the optimized concentration of surface sites was close to a value reported for KGa-1 kaolinite, which is highly encouraging.
In the analysis of the solutions of the batch titration of KGa-1b kaolinite, the main observed elements were Ca, Mg, Si, Al and Zn. The concentration of Al and Zn decreased with the pH. The lanthanides were detectable only in the acidic pH range 3–6 and showed decreasing concentrations with pH.
In the acidic pH range, sorption of europium decreased with the ionic strength of the NaNO3 solution. At the lowest ionic strength, the sorption was also reversible. In the 0.1 M and 0.5 M NaNO3 solutions, the sorption of europium in the basic pH range was partly irreversible during the experiments. The degree of irreversibility increased with pH and ionic strength. The observed desorption behaviour of europium requires further study.
The modelling of speciation of europium in the 0.5 M NaNO3 solution showed that europium formed a cationic nitrate complex in the acidic pH range. The concentration of this nitrate complex was equal to that of the free europium ion (Eu3+). The effect of the nitrate complex on the sorption behaviour of europium on kaolinite could be studied by performing experiments in a NaClO4 solution, as europium does not form complexes with perchlorate ions.
The adsorption modelling was successful by assuming one surface-complexation and one cation-exchange reaction of europium. The model was easily fitted on a per-cent-sorbed scale (default in FITEQL), but the results were not as good on a Kd scale, especially at circumneutral pH values.
The molecular-level modelling produced invaluable background information for the development of surface-complexation models for the surface charging of kaolinite and the adsorption of europium.

48
49
REFERENCES
Accelrys. 2001. Cerius2. Release 4.6. San Diego: Accelrys Software Inc.
Baes C.F. & Mesmer R.E. 1976. The Hydrolysis of Cations. Wiley, New York.
Bolt, G.H. & van Riemsdijk, W.H. 1982. Ion adsorption on inorganic variable charge constituents. In: Bolt, G.H. (ed.), Soil Chemistry, B. Physico-Chemical Models, Elsevier, Amsterdam. Pp. 459–504.
Borden, D. & Giese, R.F. 2001. Baseline studies of the clay minerals society source clays: Cation exchange capacity measurements by the ammonia-electrode method. Clays Clay Miner., 49, 444–445.
Borkovec, M. 1997. Origin of 1-pK and 2-pK models for ionizable water-solid interfaces, Langmuir, 13, 2608–2613.
Bradbury, M.H. & Baeyens, B. 1997. A mechanistic description of Ni and Zn sorption on Na-montmorillonite Part II: modelling. J. Contam. Hydrol., 27, 223–248.
Brady, P.V., Cygan, R.T. & Nagy, K.L. 1996. Molecular controls on kaolinite surface charge. J. Colloid Interface Sci., 183, 356–364.
Chipera, S.J. & Bish D.L. 2001. Baseline studies of the clay minerals society source clays: Powder X-ray diffraction analyses. Clays Clay Miner., 49, 398–409.
Coppin, F., Gilles, B., Bauer, A., Castet, S. & Loubet, M. 2002. Sorption of lanthanides on smectite and kaolinite. Chem. Geol., 182, 57–68.
Currie, L.A. 1968. Limits for qualitative detection and quantitative determination. Anal. Chem., 40. Pp. 586–593.
Cygan, R.T., Nagy, K.L. & Brady, P.V. 1998. Molecular models of cesium sorption on kaolinite. In: Jenne, E.A. (ed.), Adsorption of Metals by Geomedia, Academic Press, San Diego.
Giese, R.F.Jr. 1991. Kaolin minerals: Structures and stabilities. Rev. Mineral., 19, 29–66.
Gualteri, A.F., Moen A. & Nicholson D.G. 2000. XANES study of the local environment of iron in natural kaolinites. Eur. J. Mineral., 12, 17–23.
Gunnarsson, M., Jakobsson, A.-M., Ekberg, S., Albinsson, Y. & Ahlberg, E. 2000. Sorption studies of cobalt(II) on colloidal hematite using potentiometry and radioactive tracer technique. J. Colloid Interface Sci., 231, 326–336.
Herbelin, A.L. & Westall, J.C. 1999. FITEQL – A computer program for determination of chemical equilibrium constants from experimental data, Version 4.0, Dept. of Chemistry, Oregon State University, Corvallis, OR, Report 99-01.
Jakobsson, A.-M., Albinsson, Y. & Rundberg, R.S. 1998. Studies of surface complexation of H+, NpO2
+, Co2+, Th4+ onto TiO2 and H+, UO22+ onto alumina. SKB
TR-98-15, 52 p. + app. 2 p.

50
Kogel, J.E. & Lewis, S.A. 2001. Baseline studies of the clay minerals society source clays: Chemical analysis by inductively coupled plasma-mass spectroscopy (ICP-MS). Clays Clay Miner., 49, 387 - 391.
Lehikoinen, J., Olin, M., Puukko, E. & Hakanen, M. 1999. Application of surface complexation modelling: Adsorption of nickel on KGa-1b kaolinite. Posiva Working Report 99-36. 50 p. + app. 1 p.
Lehikoinen, J., Olin, M., Puukko, E. & Hakanen, M. 2002. Adsorption of europium and americium on kaolinite; Adsorption of europium on alumina and quartz. Posiva Working Report 2002-27.
Lützenkirchen, J. 1998. Comparison of 1-pK and 2-pK versions of surface complexation theory by the goodness of fit in describing surface charge data of (hydr)oxides. Environ. Sci. Technol., 32, 3149–3154.
Moll W.F.Jr. 2001. Baseline studies of the clay minerals society source clays: Geological origin. Clays Clay Miner., 49, 374–380.
Olphen Van, H. & Fripiat, J.J. 1979. Data Handbook for Clay Minerals. Pergamon Press, New York. 128 p.
Papelis C., Hayes K.F. & Leckie J.O. 1988. HYDRAQL: A program for the computation of chemical equilibrium composition of aqueous batch systems including surface-complexation modeling of ion adsorption at the oxide/solution interface. California, Stanford University, Department of Civil Engineering, Technical report number 306. 130p.
Puukko, E. & Hakanen, M. 1995. Surface complexation modelling: Experiments on the sorption of nickel on quartz. Report YJT-95-12. 20 p. + app. 6 p.
Puukko, E. & Hakanen, M. 1998. Characterisation of kaolinite and the sorption of nickel on kaolinite. Posiva Working Report 98-60. 17 p. + app. 8 p. (in Finnish with an English abstract)
Puukko, E. & Hakanen, M. 2000. Sorption of nickel on kaolinite: Completing the parameters, cation exchange capacity of kaolinite, potentiometric titration of kaolinite; sorption of europium on kaolinite. Posiva Working Report 2000-11.
Puukko, E. & Hakanen, M. 2001a. Sorption of europium on kaolinite, aluminium oxide and quartz. Sorption of europium and americium on kaolinite. Posiva Working Report 2001-25. 15 p. + app. 26 p.
Puukko, E. & Hakanen, M. 2001b. Titration of kaolinite, quartz and aluminium oxide. Sorption of europium and americium on kaolinite. Posiva Working Report 2001-37. 22 p. + app. 14 p.
Puukko, E., Hakanen, M. & Lindberg A. 2003. Characterization of the natural kaolinite KGa-1b. Posiva Working Report 2003-17.
Puukko, E. & Hakanen, M. 2004. Sorption of europium on kaolinite KGa-1b. Posiva Working Report 2004-59.
Rossotti, H.S. 1974. Design and publication of work on stability constants. Talanta, 21,809–829.

51
Westall, J.C. 1987. Adsorption mechanisms in aquatic surface chemistry, In: Stumm, W. (ed.), Aquatic Surface Chemistry, John Wiley & Sons, Inc., NY. Pp. 3–32.
Wolery, T. 1992. EQ3/6, A software package for geochemical modeling of aqueous systems: Package overview and installation guide (Version 7.0). California, LLNL, Report UCRL-MA-110662 PT I. 66 p.
Yun, J., Bundschuh, T., Neck, V. & Kim, J. 2001. Selective determination of europium(III) oxide hydroxide colloids in aqueous solution by laser-induced breakdown spectroscopy. Appl. Spectrosc., 55, 273–278

52

53
APPENDICES
Appendix A: Appendix A: Composition of kaolinite by Clay Mineral Society
Appendix B: Gaines-Thomas cation exchange
Appendix C: Experimental results

54

55 APPENDIX A: 1(1)
Appendix A: Composition of kaolinite by Clay Mineral Society TITLE: Kaolinite KGa-1
MINERAL_TYPE: Phyllosilicate MINERAL: Kaolinite (Kaolinite-Serpentine group) FORMULA: Al2Si2O5(OH)4 FORMULA_NROFF: Al2Si2O5(OH)4 COLLECTION_LOCALITY: Washington County, GA ORIGINAL_DONOR: Clay Mineral Society SAMPLE_DESCRIPTION:Polymorphous with Dickite, Halloysite, and Nacrite. A spectrum for this sample was published by Clark, R.N., King, T.V.V., Klejwa, M., Swayze, G.A., and Vergo, N., 1990, High spectral resolution reflectance spectroscopy of minerals: Journal of Geophysical Research, v. 95, no. 8B, p12,653-12,680.who noted that it was spectrally pure. The spectrum from 2.5-25 M_m was published in: Salisbury, J. W., Walter, L. W., and Vergo, N., 1987, Mid-Infrared (2.1-25 M_m) Spectra of Minerals: First Edition, U.S. Geological Survey Open File Report 87-263. XRD_ANALYSIS:Analysis by Norma Vergo indicates the sample is kaolinite + trace anatase,the <2 M_m cut was pure kaolinite. COMPOSITIONAL_ANALYSIS_TYPE: EM # XRF, EM(WDS), ICP(Trace), WChemCOMPOSITION: SiO2: 45.0 wt% NROFF: SiO2 COMPOSITION: TiO2: 1.58 wt% NROFF: TiO2 COMPOSITION: Al2O3: 38.0 wt% NROFF:: Al2O3 COMPOSITION: Fe2O3: 0.26 wt% NROFF: Fe2O3 COMPOSITION: FeO: 0.02 wt% NROFF: FeO COMPOSITION: MnO: 0.00 wt% NROFF: MnO COMPOSITION: MgO: 0.02 wt% NROFF: MgO COMPOSITION: CaO: 0.02 wt% NROFF: CaO COMPOSITION: Na2O: 0.01 wt% NROFF: Na2O COMPOSITION: K2O: 0.04 wt% NROFF: K2O COMPOSITION: P2O5: 0.05 wt% NROFF: P2O5 COMPOSITION: F: 0.013wt% NROFF: F COMPOSITION: LOI: 14.31 wt% NROFF: LOI COMPOSITION: ---------------------- COMPOSITION: Total: 99.38 wt% COMPOSITION: O=Cl,F,S: wt% #correction for Cl, F, S COMPOSITION: New Total: wt% COMPOSITION_DISCUSSION:Analysis by C.V.Clemency, Dept. of Geological Sciences, SUNY at Buffalo, Buffalo N.Y. for the Clay Minerals Society. Fluorine analysis by J. Thomas Jr., Illinois State Geological Survey, Urbana, Ill, and is not included in the total. Published in: van Olphen, H. and J.J. Fripiat, eds., 1979, Data handbook for clay materials and other non-metallic minerals,
Pergamon Press, New York, p128.

56

57 APPENDIX B: 1(2)
Appendix B: Gaines-Thomas cation exchange
For binary exchange between cation Mz+ in the aqueous solution and Na+ bound on the exchanger phase, the thermodynamic mass action equilibrium reads,
where X– is a hypothetical aqueous species representing one equivalent of intrinsic negative charge of the exchanger.
The cation-exchange selectivity of Eqn. A1 that conforms to the Gaines-Thomas exchange convention is defined by
MM/Na
Na
E {Na }
E {M }
z
z zK (A2)
where the brackets denote activities. In Eqn. A2, the exchanger-phase activities have been approximated by equivalent fractions,
Na
[NaX]E
CEC (A3a)
M
[MX ]E
CECz (A3b)
where the square brackets denote molar concentrations and CEC is the cation- exchange capacity in units of eq/l,
CEC [NaX] [MX ]zz (A4)
To introduce cation exchange into geochemical codes, it is necessary to split Eqn. A1 into two “half-reactions” according to,
These equations are identical to those describing the formation of aqueous complexes from hydrated aqueous ions and have similarly defined equilibrium constants,
NaX
[NaX]
[X ]{Na }K (A6a)
MX
[MX ]
[X ] {M }z
z
z zK (A6b)
M NaX MX Naz
zz z (A1)
Na X NaX (A5a)
M X MXz
zz (A5b)

58 APPENDIX B: 2(2)
There is one particular problem to be resolved when cation exchange is modelled this way, namely that “free” X– does not exist in a pure exchanger model, since all X– is neutralized by cations. This problem can be circumvented when the association constants are high, since the concentration of fictive aqueous species X– then becomes negligible; this is realized with, say, KNaX 1010.
Upon combining Eqns. A2 to A6 and taking logarithms, we arrive at,
M/Na MX NaXlog log log ( 1) log CEC logz
K K z K z z (A7)
Consequently, for Eqn. A7 with Mz+ = Eu3+, KMXz = KCE, CEC = 1.3 10–5 eq/l, and log KNaX = 10, we have,
Eu/Na CElog log 39.3K K (A8)
As an example, we take the case “SC 1 & CE” for KGa-1b kaolinite in 0.05-M NaNO3
in Table 8, for which we have,
Eu/Nalog 40.8 39.3 1.5K (A9)

59 APPENDIX C: 1(4)
Appendix C: Experimental results
Below are experimental results reported earlier by Puukko & Hakanen (2004)
Table C1. The pH and Rd values of sorption (sor) and desorption (des) of europium in
0.05 M NaNO3 solution for KGa-1b kaolinite.
pHsorRd (sor)
ml/gpHdes
Rd (des) ml/g
4.02 480 - -
3.95 520 3.08 400
3.93 480 3.16 200
5.17 1 200 4.21 190
5.26 1 300 - -
5.20 1 100 3.10 540
7.16 250 000 3.59 620
7.07 240 000 - -
10.12 3 200 000 - -
10.11 9 300 000 - -
10.07 1 100 000 3.64 800
Table C2. The pH of sorption (sor) and desorption (des) and the Rd values of europium
desorbed with 0.05 M NaNO3 and 0.1 M HCl from HKGa kaolinite
Rd (sor) ml/g
Rd (des) ml/g
pHsor pHdes
NaNO3 HCl (pH 1)
3.11 270 2.66 620 250
2.96 260 2.61 540 220
4.86 970 3.94 300 400
4.84 990 3.93 290 380
5.07 1 400 3.94 280 380
5.09 1 500 3.97 280 380
6.49 81 000 4.00 220 370
6.35 40 000 3.98 220 390
7.37 360 000 4.03 230 380
7.53 2 400 000 4.01 210 340
8.81 2 200 000 4.08 280 370
8.76 730 000 4.07 290 360

60 APPENDIX C: 2(4)
Table C3. The pH and Rd values of sorption (sor) and desorption (des) of europium in
0.1 M NaNO3 and 0.1 M HCl solutions for KGa-1b kaolinite.
Rd (des) ml/g
Rd (des) ml/gpHsor
Rd (sor) ml/g
pHdes
NaNO3 HCl (pH 1)
3.06 104 2.94 70 843.04 104 2.94 72 755.23 270 4.79 110 1505.25 240 4.85 100 1307.12 64 000 4.64 600 1507.14 55 000 4.61 650 1308.29 1 400 000 4.44 800 1208.26 580 000 4.40 590 869.17 3 400 000 4.29 1 070 969.00 200 000 4.26 1 020 1109.38 1 100 000 4.15 1 190 929.50 760 000 4.12 1 070 92
Table C4. The pH of sorption (sor) and desorption (des) and the Rd values of europium
desorbed with 0.1 M NaNO3 from HKGa kaolinite.
pHsorRd (sor)
ml/gpHdes
Rd (des) ml/g
3.09 63 3.15 90
3.03 65 3.21 80
4.87 200 4.32 200
4.85 190 4.21 170
6.42 8 500 4.35 5 400
6.06 2 300 4.35 1 000
7.35 870 000 4.39 -
6.84 45 000 4.35 2100
9.09 1 500 000 4.51 -
9.66 2 100 000 4.41 12 000
9.65 2 100 000 4.48 -

61 APPENDIX C: 3(4)
Table C5. The pH and Rd values of sorption (sor) (0.5 M NaNO3) and desorption (des)
(0.1 M HCl) of europium for KGa-1b kaolinite.
Rd (sor) Rd (des) pHsor
ml/gpHdes
ml/g
2.40 16 1 410
2.73 19 1 50
3.14 21 1 53
3.28 21 1 60
4.10 23 1 110
5.38 53 1 290
7.09 9 500 1 1 200
8.10 380 000 1 1 200
9.04 800 000 1 1 200
9.42 610 000 1 1 300
9.90 620 000 1 1 400
10.09 670 000 1 1 300
Table C6. The pH of sorption (pHSOR) and desorption (pHDES) and the Rd values of
europium desorbed with 0.5 M NaNO3 from kaolinite HKGa.
pHsorRd (sor)
ml/gpHdes
Rd (des) ml/g
3.06 22 3.13 1
3.07 20 3.14 1
4.89 56 4.64 20
4.87 51 4.60 10
5.37 119 4.67 50
5.47 110 4.50 30
6.11 740 4.70 240
6.41 1 370 4.63 380
7.45 110 000 4.79 1 900
7.47 105 000 4.74 1 100
8.97 2 700 000 4.86 960

62 APPENDIX C: 4(4)
1
10
100
1000
10000
100000
1 2 3 4 5 6 7 8
pH
Rd
(ml/
g)
0.5 M NaClO4 (KGa-1b 2 g/L)
0.5 M NaNO3 (KGa-1b 2 g/L)
Maximum Rd
0.5 M NaClO4 (KGa-1b 20 g/L)
0.5 M NaClO4
Figure C1. Sorption of europium on kaolinite KGa-1b in 0.5 M NaClO4 and 0.5 M
NaNO3 solutions. The maximum Rd level is based on the determination limit of the
radioassay of Eu-152.


![Characterisation of kaolinite colloidal and flow behaviour ...341983/UQ341983_OA.pdf · the effect of factors such as pH, electrolyte type and ionic concentration [5-7]. The importance](https://static.fdocuments.us/doc/165x107/5fbda0b5b84f8157fa71faf8/characterisation-of-kaolinite-colloidal-and-flow-behaviour-341983uq341983oapdf.jpg)