Soil nitrogen dynamics under simulated global changes in a ...
40
Soil nitrogen dynamics under simulated global changes in a California annual grassland by Amber C. Kerr Submitted to the Earth Systems Program, Stanford University, in Partial Fulfillment of the Requirements of Master of Science September 22, 2002 Advisor: Christopher B. Field Carnegie Institution of Washington
Transcript of Soil nitrogen dynamics under simulated global changes in a ...

Soil nitrogen dynamics under simulated global changes in a California annual grassland
by Amber C. Kerr
Submitted to the Earth Systems Program, Stanford University, in Partial Fulfillment of
the Requirements of Master of Science
September 22, 2002
Advisor: Christopher B. Field Carnegie Institution of Washington

ii
Dedication
To my grandfather
Clark Kerr
for teaching me the value
of education and hard work,
and for setting an unforgettable example of
a life lived for the benefit of humankind.

iii
Abstract
Soil nutrient availability plays a key role in ecosystem ecology and may
be directly impacted by global change. This study used ion exchange
resin bags to measure nitrate (NO3-) and ammonium (NH4
+) availability
in a California annual grassland under four global change treatments:
warming, elevated CO2, increased precipitation, and nitrogen
deposition. The only significant treatment effect averaged across the
entire growing season was nitrogen deposition, which increased both
nitrate and ammonium availability by approximately 50%. However,
many treatment effects showed seasonal variation. At the end of the
growing season, increased precipitation significantly increased
availability of both nitrate and ammonium. Warming had a positive
effect on ammonium availability at the end of the growing season, with
a significant interaction between warming and CO2. Elevated CO2
alone had no effect on ammonium availability and caused a slight
decrease in nitrate availability. Our results suggest that the overall
consequence of anthropogenic global change will be to increase soil
nitrogen availability in this ecosystem, at least temporarily, but with
complex seasonal and treatment interactions.

iv
Table of Contents
Abstract iii
Table of Contents iv
List of Figures vi
List of Tables vii
List of Abbreviations vii
Introduction 1
Principles of soil nitrogen availability 1
Measuring nitrogen availability with ion exchange resin bags 3
Global change factors and their effect on soil nitrogen 4
Nitrogen deposition 4
Elevated carbon dioxide 5
Warming 6
Increased precipitation 6
Objectives and hypotheses 7
Methods 8
The Jasper Ridge Global Change Experiment 8
Resin bag use and extraction 10
Units and correction factors 12
Statistics 14
Results 14
Background variability in nitrogen flux 14
Seasonal patterns and effects of environmental variables 16
Global change effects 18
Yearly averages 18
Seasonal effects 18
Interactions between global change factors 20
A closer look at CO2 and warming 21
Discussion 21
Single-factor effects 21
Interaction effects 23
Future research 23
Conclusions 25
Acknowledgements 26

v
References 28
Appendices A1
Appendix 1: Research on global change and soil nitrogen A1
Appendix 2: Layout of the Jasper Ridge Global Change Experiment A3
Appendix 3: Ion exchange resin specifications A4
Appendix 4: Example of raw data A7
Appendix 5: ANOVA results A8
Appendix 6: Phosphate results A10

vi
List of Figures
Figure Page
1. Model of soil nitrogen transformations . . . . . . . . . . . . . . . . . . . . . . . . . 2
2. The Jasper Ridge Global Change Experiment . . . . . . . . . . . . . . . . . . . . . . 8
3. Close-up of experimental plot . . . . . . . . . . . . . . . . . . . . . . . . . . . . . . 9
4. Diagram of early-season resin bag placement . . . . . . . . . . . . . . . . . . . . . . 11
5. Diagram of late-season resin bag placement . . . . . . . . . . . . . . . . . . . . . . . 11
6. Comparison between weight correction and surface area correction for nitrate flux over the growing season . . . . . . . . . . . . . . . . . . . . . . . . . . . . . . . . . 13
7. Correlation between nitrate in individual resin bags on two consecutive measurement dates . . . . . . . . . . . . . . . . . . . . . . . . . . . . . . . . . . . . . . . . . . . 15
8. Correlation between nitrate and ammonium by resin bag, yearly averages . . . . . . . 15
9. Seasonal trends in nitrate flux and ammonium flux . . . . . . . . . . . . . . . . . . . 16
10. Seasonal trends in rainfall over the 2001-2002 growing season . . . . . . . . . . . . . 17
11. Seasonal trends in air temperature over the 2001 - 2002 growing season . . . . . . . . 17
12. Relationship between net primary production and nitrogen availability throughout the season . . . . . . . . . . . . . . . . . . . . . . . . . . . . . . . . . . . . . . . . . . . 18
13. Effect of N deposition on nitrate and ammonium availability . . . . . . . . . . . . . . 18
14. Effects of global change treatments on nitrate availability (yearly averages) . . . . . . 19
15. Effects of global change treatments on ammonium availability (yearly averages) . . . . 19
16. Effect of increased precipitation on nitrate availability throughout the growing season 20
17. Effect of increased precipitation on ammonium availability throughout the growing season . . . . . . . . . . . . . . . . . . . . . . . . . . . . . . . . . . . . . . . . . . . 20
18. Effects of warming and CO2 treatments on nitrogen availability (yearly averages) . . . 22
A1. GIS map of the Jasper Ridge Global Change Experiment . . . . . . . . . . . . . . . A3
A2. Diagram of an individual plot . . . . . . . . . . . . . . . . . . . . . . . . . . . . . . . A3
A3. Phosphate availability by treatment . . . . . . . . . . . . . . . . . . . . . . . . . . . A10

vii
List of Tables
Table Page
1. Soil characteristics of the Jasper Ridge Global Change Experiment . . . . . . . . . . . 10
A1. Summary of previous research on global change and nitrogen availability A1
A2. Relative selectivity of AG-1-X8 anion exchange resin for different anions . . . . . . . A4
A3. Physical characteristics of AG-1-X8 anion exchange resin . . . . . . . . . . . . . . . A4
A4. Selectivity coefficients of various cations (compared with H+) on sulfonated polystyrene Dowex cation exchange resins . . . . . . . . . . . . . . . . . . . . . . . A6
A5. Raw data output from Alpkem RF/2 continuous flow analyzer . . . . . . . . . . . . A7
A6. Nitrogen availability ANOVA results, year-long and seasonal . . . . . . . . . . . . . . A8
A7. ANOVA results for CO2 and warming treatments . . . . . . . . . . . . . . . . . . . A9
A8. Effects of global change factors on phosphate availability . . . . . . . . . . . . . . . A11 List of Abbreviations
ANOVA analysis of variance
CO2 elevated carbon dioxide (abbreviation in ANOVA table)
FACE free-air carbon dioxide enrichment
HEAT elevated temperature (abbreviation in ANOVA table)
IER ion exchange resin
JRGCE Jasper Ridge Global Change Experiment
N nitrogen deposition (abbreviation in ANOVA table)
PVC polyvinyl chloride
SEM standard error of the mean
WATER increased precipitation (abbreviation in ANOVA table)

1
Introduction
Soil nutrients, more often than any other environmental factor, limit the growth of plants and
soil microorganisms. As a result, soil nutrients have wide-ranging and often surprising effects
on ecosystem function – for example, by changing plant community composition (Vitousek et
al., 1997) or by limiting the response of an ecosystem to elevated CO2 (Zak et al., 2000a).
Human-induced global change is likely to affect soil nutrient availability, but much remains to
be learned about the magnitude and even the direction of these effects.
Nitrogen deserves particular attention. An essential component of all living cells, and the
nutrient required in greatest amount by plants (Taiz and Zeiger, 1998), nitrogen is also the
most commonly limiting nutrient in terrestrial ecosystems (Stark, 2000). Nitrogen has been
affected by human activity, both directly and indirectly, more than any other major nutrient.
Although the nitrogen cycle has been studied for many decades, we have only begun to
investigate how it will be impacted by global change.
Principles of soil nitrogen availability A variety of biotic and abiotic factors affect soil nutrient availability, including nutrient input,
soil particle size, soil moisture, acidity, salinity, and the activity of roots and microbes (Mengel
and Kirkby, 2001; Binkley and Vitousek, 1989). Although availability of most nutrients is
determined by inorganic equilibria (Fitter and Hay, 2002), nitrogen availability is largely under
biological control1.
The dominant N pool in the soil nitrogen cycle (represented in Figure 1) is organic N. Plants,
however, cannot easily take up organic N, and therefore depend on inorganic N for most of
their nitrogen supply (Kaye and Hart, 1997). Inorganic N is supplied primarily by microbes
through the process of mineralization (Williams et al., 2001). Between 50 and 99% of
mineralized N is immediately taken up again by microbes in a process called immobilization
(Binkley and Vitousek, 1989). The remainder (net mineralization) is generally considered to be
available to plants. Since mineralization and immobilization occur simultaneously, plants may
1 Nitrogen has both important similarities to and important differences from other nutrients. The phrase “nutrient availability” will be used whenever a generalization is appropriate; otherwise, “nitrogen availability” will be used (in reference to inorganic nitrogen unless otherwise specified).

2
have an adequate N supply if the microbial turnover rate is high enough, even if there is little
N available at a given instant (Hu et al., 1999).
Inorganic N occurs in two main forms: ammonium (NH4+) and nitrate (NO3
-) (Mulvaney,
1996). Since plants must convert nitrate to ammonium before assimilating it (Taiz and Zeiger,
1998), plants are thought to use ammonium preferentially to nitrate, though this is still
debated (Foth and Ellis, 1997). However, ammonium binds to the cation exchange sites on
clay particles (Brady and Weil, 2001), making it much less mobile than nitrate and therefore
more difficult to acquire. The relative importance of each of these ions varies considerably
from ecosystem to ecosystem.
Nitrate and ammonium are transported through the soil by two major processes: mass flow
(water movement), and diffusion. Mass flow dominates when soil moisture and transpiration
are high, and when nutrients are abundant; diffusion dominates under dry or nutrient-limited
conditions. Both mass flow (Foth and Ellis, 1997) and diffusion (Fitter and Hay, 2002) have
been shown to be important for nitrate; diffusion is usually more important for ammonium.
Rather than simply waiting for nutrient transport to take place, soil organisms can play an
active role in nutrient uptake. For example, plants can alter fine root production, mycorrhizal
colonization, and rhizosphere chemistry
in order to obtain more nutrients
(Binkley and Vitousek, 1989). Fine root
production and root nutrient uptake
kinetics can also be controlled in
response to changing environmental
conditions, but little is known about
these processes (Zak et al., 2000b ;
BassiriRad, 2000).
Soil organisms can compete directly with
each other for nutrients. For example,
plants and microbes compete for
inorganic nitrogen, though the outcome
Plants
OrganicN
NO3-
Microbialbiomass
NH4+
denitrification
leachingimmobilization
plant uptake
ammonification(mineralization)
organic matterfrom leaves
and roots.
nitrification
(mineralization)( m i n e r a l iz a t i o n )
Figure 1. Model of soil nitrogen transformations. Each step in the soil nitrogen cycle may be affected by global change. Adapted from Kaye and Hart (1997) and Brady and Weil (2001).

3
of the competition can be hard to predict (Kaye and Hart, 1997). Microbes are usually C-
limited, but when the C:N ratio in litter exceeds 20:1, they are likely to become N-limited and
remove most of the available inorganic N (Fitter and Hay, 2002), reducing the amount
available to plants. The balance of competition may depend on the ratio of plant to microbial
biomass (Zak et al., 2000a). On the other hand, soil microbes can also increase N availability,
not only through mineralization, but also by fixation and mycorrhizal association.
The complex physical and biological processes which determine soil nitrogen availability can
also make it difficult to measure in a realistic way. Total soil N content, as well as net and
gross mineralization, can be measured in laboratory assays; however, these measures do not
always accurately reflect N availability in the field (Binkley and Vitousek, 1989). For this
study, we chose to use ion exchange resin bags, because they can overcome some of the
limitations of other techniques.
Measuring nitrogen availability with ion exchange resin bags Binkley and Matson (1983) pioneered the technique of using ion exchange resin (IER) bags to
measure nutrient availability. There are a great diversity of IER techniques, and some
confusion about how to compare their results (Skogley and Dobermann, 1996), but they all
work on the same basic principle.
Ion exchange resins are solid polymer beads with a large internal surface area which is
permanently charged (see Appendix 3 for more information). Their numerous ion exchange
sites allow them to readily take up any free ions in the soil, making them useful in soil nutrient
availability studies. IER bags have several advantages over other soil nutrient assays: they are
exposed to ambient conditions, are in intimate contact with the rhizosphere, and cause
minimal disturbance to the soil (Arnone, 1997).
In many ways, ion exchange resins work similarly to plant roots. The amount of inorganic
nitrogen they capture depends on a variety of factors, including mineralization and
immobilization, water flow, and diffusion rates (Binkley and Vitousek, 1989; Skogley and
Dobermann, 1996). However, there are some important differences: unlike soil organisms,
resin bags have no active uptake mechanisms, so nutrient transport processes are relatively

4
more important to resin bags than to plants or microbes (Stark, 2000). Furthermore, water
may flow differently through resin bags than through bulk soil (Torbert and Elkins, 1992).
Also, it is not known how effectively IER bags compete with plants and microbes for
nutrients (Stark, 2000). IER is thought to capture N that has been mineralized but not
immediately taken up by soil organisms (Gloser et al., 2000) – meaning that although high
levels of captured N indicate high availability, low levels do not necessarily indicate low
availability (Binkley and Vitousek, 1989). Previous work at our field site showed that resin
bags collected much less inorganic N in vegetated plots than in bare plots, indicating that
plants competed with resin bags for N (S. Thayer, unpublished data). However, plants and
microbes also experience the effects of nutrient competition, so resin bag data may still
provide an accurate measure of the soil nutrient environment.
The validity of data from resin bags may partly depend on their depth in the soil. Resin bags
at the same depth as the majority of root biomass are likely to experience a nutrient
environment similar to that of the plants. However, resin bags located below most root
biomass may only receive nutrients that have been lost by leaching (Niklaus et al., 2001).
Despite these drawbacks, resin bags at the right depth should still provide a fairly accurate
measure of relative nutrient availability, which was the main purpose of this experiment.
Global change factors and their effect on soil nitrogen The nitrogen cycle is complex and largely controlled by biological processes, making it
especially susceptible to the effects of global change. Since most soil N transformations are
controlled by a distinct community of microbes, the effects of global change on N availability
partly depend on which microbial communities are affected (Hu et al., 1999). Also, in some
cases, such as anthropogenic nitrogen deposition, global change can affect nitrogen availability
directly. The effects of four major global change factors on nitrogen availability are outlined
below; for a more complete literature review, see Appendix 1.
Nitrogen depos i ti on
Human activities (including N fertilization, fossil fuel combustion, N-fixing crops, and land
use change) have approximately doubled the rate of N input into the terrestrial N cycle

5
(Vitousek et al., 1997), and rates are expected to increase. The straightforward effect of N
deposition is to increase soil nitrogen availability, as multiple studies have confirmed (e.g.
Hungate et al., 1997a; Mikan et al., 2000).
However, N addition can also have indirect effects on nitrogen availability: for example,
differences have been detected in microbial community composition between high-N and low
N soil (e.g. Zak et al., 2000a). Thayer et al. (2002) found that N deposition in an annual
grassland actually caused a decline in the total N content of plant biomass, due to the decrease
in abundance of a nitrogen-fixing forb (Lotus purshianus). Also, N deposition usually causes
downregulation in plant N uptake (BassiriRad, 2000), though little is known about interactions
with other global change factors.
Elevated carbon dioxide
Atmospheric carbon dioxide (CO2) is expected to approximately double (to 700 ppm) by the
year 2100 (IPCC, 2001). Plant responses to elevated CO2 have been extensively studied over
the last two decades, but many plant parameters have shown highly variable responses (Luo et
al., 1999). Microbial responses are even less well understood, making it difficult to predict the
effects of CO2 on soil nitrogen availability.
Initially, two hypotheses were proposed. Diaz et al. (1993) found that elevated CO2 led to an
increase in microbial N and a nitrogen deficiency in plants, even on fertile soil. They
concluded that elevated CO2 led to an increase in root exudates, thereby enhancing microbial
growth and N immobilization. However, Zak et al. (1993) found significantly greater soil N
availability under elevated CO2, apparently because additional soil carbon stimulated the
microbes that carry out mineralization.
It now appears that both responses can occur under natural conditions, but what determines
the direction of the response is not fully understood. Furthermore, there is disagreement on
which response is more common: Hu et al. (1999) state that soil nitrogen availability generally
decreases under elevated CO2, whereas Finzi (2002) states that CO2 usually has no effect on
soil nitrogen. According to Zak et al. (2000b) and Niklaus et al. (2001), results are currently
too inconsistent to draw any conclusions.

6
The mechanisms by which CO2 affects nitrogen availability are still unclear, but may include
fine root production, chemistry of root exudates, and litter C:N ratio (Zak et al., 2000b).
Hungate et al. (1997b) found that elevated CO2 increased N mineralization indirectly by
increasing soil moisture. There are also indications that elevated CO2 can affect mycorrhizal
colonization (Rillig et al., 1997), root distribution and root longevity (Arnone et al., 2000), and
kinetics of root nutrient uptake (BassiriRad, 2000). More research is needed to determine the
relative importance of these effects.
Warming
Average global temperatures are expected to continue to rise due to human-induced global
warming. In the western United States, where our study site is located, average air
temperature is predicted to increase by 3 - 5° C over the next 100 years (IPCC, 2001), with
corresponding increases expected in the length of the growing season.
The most straightforward effect of warming is to increase N mineralization and diffusion
(Foth and Ellis, 1997). However, more complex effects are also likely. Decomposition rates
may increase, causing faster nutrient release, but increased rates of microbial immobilization
may cancel out this effect. In addition, warming has been shown to affect species
composition of plant communities (Harte and Shaw, 1995) which in turn can lead to changes
in litter quality and decomposition rates. Another unknown factor is the effect of temperature
on kinetics of root nutrient uptake, which may depend on nutrient supply (BassiriRad, 2000).
Finally, interactions between warming and precipitation can affect nutrient availability (Shaw,
1995), underscoring the need to examine global change factors in combination.
Increased pre c ipi tat ion
Global climate change is expected to increase precipitation in some areas and decrease it in
others. In the Western US, precipitation is predicted to increase in the winter months by 5 -
20% over the next 100 years (IPCC, 2001). Soil moisture has also been shown to increase as
an indirect effect of elevated CO2, and (in at least one instance) as a result of increased
temperature (Zavaleta, 2002).
It is unclear what effect this will have on soil nitrogen availability. Water plays a crucial role in
mass transport and diffusion of nutrients (Mengel and Kirkby, 2001), but excess water flow

7
can cause leaching (especially of nitrate). Soil moisture also has the indirect effect of
facilitating microbial growth, but it is unknown whether mineralization (Hungate et al., 1997b)
or immobilization will be the dominant effect. Effects may vary from region to region,
depending on the extent to which water is a limiting resource.
* * *
In summary, each of the four global change factors outlined above has been shown to have a
measurable effect on soil nitrogen availability, but the magnitude and even the direction of the
effect is often difficult to predict. Additional complexity is introduced when global change
factors occur in combination. Furthermore, most studies to date have focused on artificial
ecosystems (single species; microcosms or mesocosms with disturbed soil; greenhouses or
growth chambers; etc.). Although such experiments have been extremely valuable in
advancing understanding, some of their results may not be applicable in field conditions (Zak
et al., 2000b). For this reason, we chose to examine the effects of global change on nitrogen
availability in a natural ecosystem.
Objectives and hypotheses The aim of this study was to examine the effects of global change factors, singly and in
combination, on soil nitrogen availability in a natural ecosystem over the course of a growing
season. Our study site was the Jasper Ridge Global Change Experiment (JRGCE), an annual
grassland in northern California. The four global change treatments we chose to apply were
elevated CO2, warming, increased precipitation, and nitrogen deposition.
We expected nitrogen deposition to be the dominant effect. Previous resin bag work at the
JRGCE demonstrated an overwhelming effect of N deposition, with resin bags in N-treated
plots showing nitrate and ammonium concentrations hundreds of times higher than those
untreated plots (S. Thayer, unpublished data). We also expected increased precipitation to
have a positive effect on nitrogen availability, both because of the role of soil moisture in ion
transport and decomposition, and because our field site is thought to be water-limited for
much of the year (Thayer et al., 2002). We expected a similar positive effect for warming,
especially because it has been shown to increase soil moisture at the JRGCE through the
mechanism of early senescence (Zavaleta, 2002).

8
Previous experiments at Jasper Ridge have shown elevated CO2 to have a variety of effects on
soil nitrogen. Hungate et al. (1997a, b) observed both increases and decreases in net N
mineralization. Thayer et al. (2002) found an increase in the C:N ratio of plant tissue under
elevated CO2, which would be likely to suppress decomposition and thus nitrogen supply.
Furthermore, a microcosm experiment at Jasper Ridge (Hu et al., 2001) showed that elevated
CO2 increased plant N uptake, reducing soil-available N. If plants or microbes, or both,
experience increased growth under elevated CO2, resin bags are likely to encounter fewer free
nutrients. However, recent data from the JRGCE indicates that elevated CO2 reduces total
plant biomass (J. Dukes, pers. comm.). Given these varied results, we were unsure what effect
to expect from elevated CO2.
Methods The Jasper Ridge Global Change Experiment The Jasper Ridge Global Change Experiment (Figure 2) is located in the eastern foothills of
the Santa Cruz Mountains near Stanford, California (elevation 120 m; latitude 37° 24' 11" N,
longitude 122° 14' 29" W). The climate is Mediterranean, with cool, wet winters and warm,
dry summers. Nearly all the annual precipitation (60 cm) occurs between November and
April, which is the growing season for annual plants. Peak aboveground biomass is usually
reached in late April, and most annuals have senesced by the end of May.
The Jasper Ridge Global Change Experiment (JRGCE) was established in 1998 to examine
the long-term effects of human-induced global
change on a natural ecosystem. The site is two
acres of annual grassland on a gently sloping
hillside, undisturbed for 25 years previously.
The community is maintained as close to its
natural state as possible, with the exception of
several manipulations necessary to protect the
equipment and keep the environment
consistent between plots. These manipulations
Figure 2. The Jasper Ridge Global Change Experiment.

9
include deer fencing, gopher trapping,
and removal of large perennial plants.
The 32 field plots (Figure 3) are circles
2 m in diameter, each divided into four
quadrants to make a total of 128
experimental units. Each plot is
unenclosed above ground and has a 50
cm barrier below ground. The
following four global change factors are
manipulated, each at two different levels:
• Atmospheric carbon dioxide (ambient, 680 ppm)
• Temperature (ambient, ambient + 80 W · m-2 ) 2
• Precipitation (ambient, 1.5 × ambient) 3
• Nitrogen deposition (ambient, ambient + 7 g · m-2 · year)
These four factors are applied in a full factorial design (for a total of 16 treatments, with 8
replicates each), allowing investigation of every possible interaction between the factors. CO2
is applied with a free-air carbon dioxide enrichment system; warming with an overhead heat
lamp; precipitation with a sprinkler system, and nitrogen in the form of liquid and solid
fertilizer4. This is achieved with a split-plot design: carbon dioxide and warming are applied at
the plot level, and increased precipitation and nitrogen deposition are applied at the quadrant
level. Thus, each of the 128 quadrants receives a particular combination of global change
treatments that stays consistent throughout the experiment. (See Appendix 2 for a diagram of
the experimental layout.)
A mixture of native and introduced species populate the site. As in most California grassland
communities, introduced species dominate. Common introduced species include Avena
2 The warming treatment results in a temperature increase of approximately 2° C in the canopy and approximately 1° C at the soil surface. 3 The precipitation treatment is extended 2 weeks beyond the last natural rain of the season.
Figure 3. Close-up of experimental plot (dominated by Avena and Sisyrinchium). The heat lamp hangs overhead, and CO2 supply tubes ring the outer edge.

10
barbata and A. fatua (wild oat), Bromus hordeaceus (soft chess), Geranium dissectum (cut-leaved
cranesbill), Erodium botrys (long-beaked storksbill), Crepis vesicaria (beaked hawk's-beard),
Plantago lanceolata (ribwort plantain), and Convolvulus arvensis (field bindweed). Native species
include Briza minor (little quaking grass) and Danthonia californica (California oatgrass). Nearly
all the species are annual, though there are a few perennials (including Sisyrinchium bellum, blue-
eyed grass). Several are nitrogen fixers (such as Vicia sativa, common vetch). The community
is composed exclusively of C3 plants.
The soil at the site is derived from
sandstone formed 30 - 50 million years ago
(E. Miller, pers. comm.). The soil is only
moderately fertile and is thought to be
nutrient-limited, probably by nitrogen (Joel
et al., 2001) and possibly also by
phosphorus (C. Field, pers. comm). Water
is also thought to be an important limiting
factor during the dry season (Thayer et al.,
2002). A summary of soil characteristics is
presented in Table 1.
Resin bag use and extraction Our methods closely follow those described by Stark (2000). Resin bags were made from a
mixture of cation exchange resin (Dowex HCR-W2 Na+ form) and anion exchange resin
(Bio-Rad AG-1-X8), blended to give a mixture with a 1-to-1 cation to anion exchange
capacity. (See Appendix 3 for ion exchange resin specifications). Approximately 1.5 g of resin
was placed in a piece of fine nylon mesh (pantyhose material), and the top was closed with a
cable tie. Each bag was then tagged with a small metal ID tag. Finally, a string (cotton or
synthetic) was attached to the top of each bag.
4 Nitrogen is applied in two separate treatments: 2 g · m-2 in the form of calcium nitrate (liquid) after the first rains in November, followed in January by 5 g · m-2 in the form of slow-release nitrate fertilizer.
Table 1. Soil characteristics of the JRGCE.
Soil type Silty clay loam
Depth Unknown (>180 cm)
Percent clay 40 – 50% in top 30 cm
Classification Clayey, mixed, thermic Typic Haploxeralf
Soil series Francisquito (Kashiwagi, 1985)
Cation exchange capacity 3.5 – 4.0 cmol / kg
Base saturation ~100%
pH Neutral (6.5- 7.0)

11
Before placing the resin bags in the field, we charged the ion exchange sites by soaking the
bags in 5 M NaCl for 24 hours5, followed by soaking in deionized water for 24 hours. We
then spun the resin bags to remove excess water and placed each resin bag in an individual
plastic bag for transport to the field. In the field we placed each resin bag (n = 128) in the
plot and quadrant corresponding to the number on its ID tag (i.e., each individual bag was
placed in the same quadrant every time, throughout the year).
Resin bags were buried for 7 days at a time, with 11
measurements throughout the season. For our first three
measurements, during the early growing season
(November – December), we buried the bags near the
soil surface (1 - 2 cm deep) in order to measure the zone
in which the roots were actively growing. We pushed a
small amount of soil aside to make a hole, placed the
resin bag in the hole, and replaced the soil, leaving the
resin bag surrounded by soil on all sides (Figure 4).
For the remaining eight measurements, during the
middle to late growing season (January – May), we
modified this technique in order to keep the resin bags
near the middle of the rooting zone. We placed the resin
bags in PVC tubes (interior diameter 15 mm) that
extended approximately 16 cm below the soil surface at a
slight angle (Figure 5). The tubes were open at the end, allowing only the bottom of the resin
bag to come into contact with the soil. This resulted in a smaller, but more consistent,
exposed surface area. The top of the tube was capped to prevent downward water flow.
After removing the resin bags from the ground, we washed them with deionized water to
remove any soil contamination. Collected ions were then extracted from the resin bags by
placing each bag in 15 mL of 2 M KCl solution and placing on a shaker table for 30 minutes.
5 We chose to use Na+ and Cl- as counterions for our resin bags for the following reason: In natural systems, it is desirable to avoid using H+ and OH- as counterions in order to avoid changing the pH during the process of ion exchange, and thereby affecting the solubility of certain elements (Skogley 1996).
Figure 4. Diagram of early-season resin bag placement.
Figure 5. Diagram of late-season resin bag placement.

12
(Strings were removed from the bags before this step was carried out.) Extraction efficiency
was not taken into account (see Appendix 3 for details). Samples of the solution were
transferred to 5 mL autoanalyzer vials, and stored at either 2° C or -6° C until analysis.
We measured the concentration of nitrate and ammonium in the samples by means of a
continuous flow analyzer (Alpkem RFA/2, manufactured by O.I. Corporation, College
Station, TX, USA). We attempted to measure phosphate by the same method, but the
phosphate concentration of most samples was below the detection limit (see Appendix 6).
Units and correction factors Ion flux could not be calculated per weight (or volume) of soil, because the ions that were
transported into the resin bag originated from an unknown volume of soil (Stark, 2000). We
investigated both the possibility of calculating flux per exposed surface area of the resin bag,
and per gram of resin. (To achieve the latter calculation, we removed and weighed the resin
from each resin bag at the end of the experiment. Bags varied slightly in weight, with a mean
of 1.4 g and a standard deviation of 0.16 g.)
Resin bag weight showed a slight correlation with nitrate collected at the surface (r2 = 0.23),
but no correlation with NO3- collected at depth (r2 = 0.002). Ammonium showed no
correlation with resin bag weight at either depth (r2 = 0.07 at surface, r2 = 0.003 at depth).
This indicated that resin bag weight was somewhat important for nitrate capture when the
bags were surrounded by soil and experiencing direct water flow, but not important when the
bags were placed in the tubes.6
It was not possible to calculate a similar correlation for surface area, because we could not
accurately determine surface areas of individual resin bags. We estimated that the shallow
resin bags (surrounded on all sides by soil) had an exposed surface area approximately 7.5
6 Weight would have played a greater role in determining number of ions collected if all the exchange sites on the resin were becoming saturated, but we do not believe this was the case. Values varied greatly between individual resin bags (see Appendix 4 for an example of raw data), indicating that most of the bags were not reaching their full capacity. Previous work supports the assumption that it takes much more than one week for 1.5 g resin bags to reach saturation in this ecosystem (S. Thayer, unpublished data).

13
times greater than the
deep resin bags. The
shallow bags did collect
more ions (on average,
6.5 times more nitrate,
and 3.9 times more
ammonium).
However, it is unclear to
what extent this was a
result of surface area, and
to what extent it reflected
greater nitrogen availability at a shallower depth and at the beginning of the growing season.
Correcting values for exposed surface area greatly affected the relationship between the first
three measurements and all subsequent measurements. The correction led to a seasonal trend
which appeared unrealistic, with nitrogen flux showing an abrupt jump with the change in
method (Figure 6).
Based on this information, we decided to express ion flux relative to resin weight (nmol · g
resin-1 · day-1). Surface area is also known to play an important role in ion capture by IER
devices (Skogley and Dobermann, 1996), but we had no way of separating the effects of
surface area from the other conditions experienced by the shallow resin bags.
Although the change in methods partway through the growing season does make it more
difficult to interpret overall seasonal trends in nitrogen flux, there is no reason to believe that
the global change treatment effects would be influenced by a change in resin bag depth7. The
focus of this study was responses to global change, rather than seasonal dynamics, and we
7 Data collected at the end of the 2001 – 2002 growing season indicated that our 16-cm-deep resin bags were below about 80% of the final root biomass (L. Moore, unpublished data). Had this information been available earlier, it would have been preferable to place the resin bags nearer the middle of the rooting profile.
0
2
4
6
8
10
12
14
16
18
20
11/0
1/0
1
11/1
4/0
1
12/0
4/0
1
12/2
4/0
1
01/2
6/0
2
02/0
3/0
2
02/2
4/0
2
03/1
0/0
2
03/2
4/0
2
04/1
0/0
2
05/1
0/0
2
NO
3- f
lux (
nm
ol /
cm
2 /
da
y)
0
20
40
60
80
100
120
140
NO
3- f
lux (
nm
ol /
g r
esin
/ d
ay)
Area
Weight
Deep
resin
bags
Surface
resin
bags
Figure 6. Comparison between weight correction and surface area correction for nitrate flux over the growing season.

14
believe that our methods provided a valid relative measure of biologically available nitrate and
ammonium.8
Statistics Values of nitrate flux and ammonium flux were calculated for each resin bag (corresponding
to each of the 128 quadrants in the JRGCE). These values were averaged over the whole year
(11 measurements), as well as over the early growing season (November – December 2001; 3
measurements), the middle growing season (December 2001 – February 2002; 4
measurements), and the late growing season (March – May 2002; 4 measurements).
The averages were natural-log-transformed and analyzed with an analysis of variance
(ANOVA) model, specifically created by Erika Zavaleta and others for the split-plot
randomized complete block design of the Jasper Ridge Global Change Experiment. (See
Appendix 5 for complete ANOVA results.) We ran another set of analyses using raw data
with resin bag weight as a covariate, but those results are not reported here as they were nearly
identical to the results for the corrected data. Based on the full ANOVA results, we also
performed a two-factor ANOVA on treatments which contained only CO2 and warming.
All ANOVAs were performed with Systat 10 (standard version; copyright 2000 by SPSS);
basic statistics and correlations were calculated with Microsoft Excel 97 (copyright 1996 by
Microsoft Corporation). We defined p < 0.05 as significant and p < 0.1 as marginally
significant.
Results Background variability in nitrogen flux The level of background variability in nitrogen flux was considerable, as is frequently the case
(Mulvaney, 1996). Correlations were often weak even for the same ion in the same location
on consecutive sampling dates, ranging from r2 = 0.1 to r2 = 0.7 (see Figure 7). It appears that
both nitrate and ammonium experience large temporal fluctuations, and possibly also that our
8 In this paper, the words “flux” and “availability” are used interchangeably, as they have comparable meanings in the context of ion exchange resin bags (though not necessarily in the context of soil organisms).
15
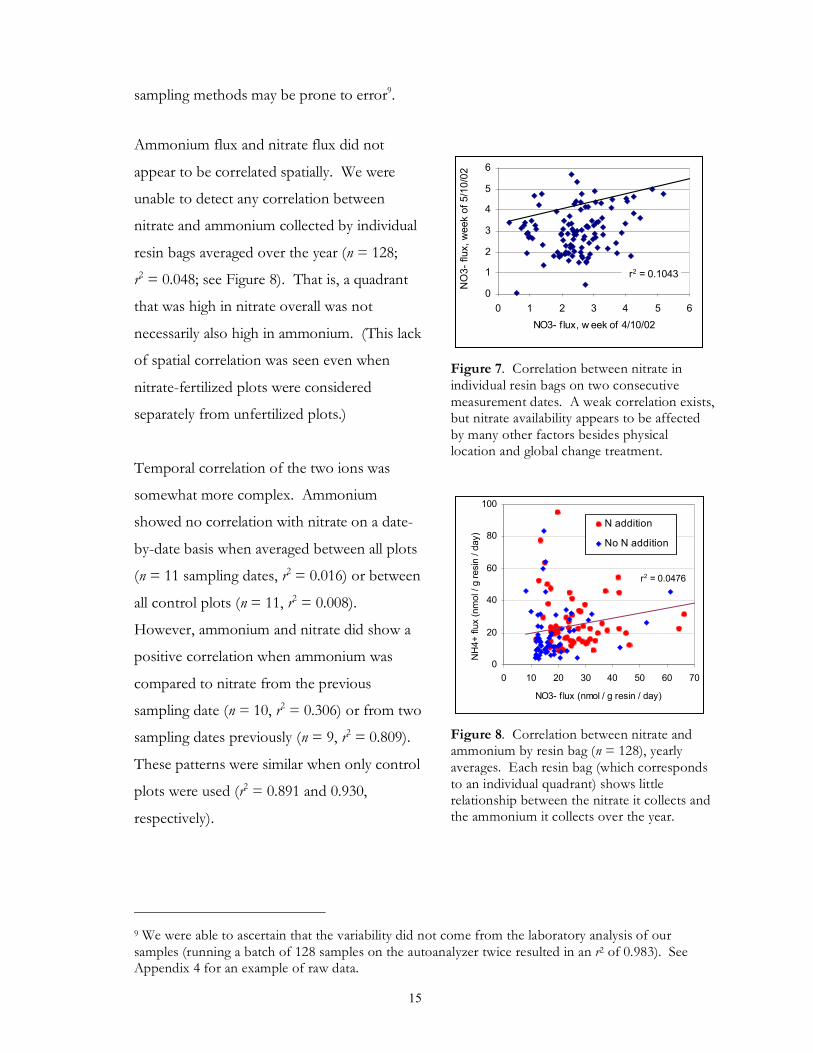
sampling methods may be prone to error9.
Ammonium flux and nitrate flux did not
appear to be correlated spatially. We were
unable to detect any correlation between
nitrate and ammonium collected by individual
resin bags averaged over the year (n = 128;
r2 = 0.048; see Figure 8). That is, a quadrant
that was high in nitrate overall was not
necessarily also high in ammonium. (This lack
of spatial correlation was seen even when
nitrate-fertilized plots were considered
separately from unfertilized plots.)
Temporal correlation of the two ions was
somewhat more complex. Ammonium
showed no correlation with nitrate on a date-
by-date basis when averaged between all plots
(n = 11 sampling dates, r2 = 0.016) or between
all control plots (n = 11, r2 = 0.008).
However, ammonium and nitrate did show a
positive correlation when ammonium was
compared to nitrate from the previous
sampling date (n = 10, r2 = 0.306) or from two
sampling dates previously (n = 9, r2 = 0.809).
These patterns were similar when only control
plots were used (r2 = 0.891 and 0.930,
respectively).
9 We were able to ascertain that the variability did not come from the laboratory analysis of our samples (running a batch of 128 samples on the autoanalyzer twice resulted in an r2 of 0.983). See Appendix 4 for an example of raw data.
r2 = 0.1043
0
1
2
3
4
5
6
0 1 2 3 4 5 6
NO3- f lux, w eek of 4/10/02
NO
3-
flu
x,
we
ek o
f 5
/10
/02
Figure 7. Correlation between nitrate in individual resin bags on two consecutive measurement dates. A weak correlation exists, but nitrate availability appears to be affected by many other factors besides physical location and global change treatment.
r2 = 0.0476
0
20
40
60
80
100
0 10 20 30 40 50 60 70
NO3- f lux (nmol / g resin / day)
NH
4+
flu
x (
nm
ol / g r
esin
/ d
ay)
N addition
No N addition
Figure 8. Correlation between nitrate and ammonium by resin bag (n = 128), yearly averages. Each resin bag (which corresponds to an individual quadrant) shows little relationship between the nitrate it collects and the ammonium it collects over the year.

16
This indicates the presence of a process in the soil which converts nitrate to ammonium over
a period of weeks, most likely nitrate immobilization and subsequent ammonification by
microbes (Brady and Weil, 2001). However, if the date of peak availability for each ion (early
in the growing season) was not included in the correlations, the relationships became much
weaker (r2 ≈ 0.1). Microbial conversion of nitrate to ammonium may only be important
during the pulse of nutrients at the beginning of the growing season.
Seasonal patterns and effects of environmental variables 10 Nitrogen availability decreased markedly as the growing season went on (Figure 9). Peak
availability for nitrate occurred at the first measurement date (11/01/01), and peak availability
of ammonium occurred at the second measurement date (11/14/01). Availability of both ions
stayed low from December onward, with nitrate continuing to decrease throughout the
growing season but ammonium increasing slightly toward the end of the growing season.
Rainfall may explain some of the
variation in nitrogen availability
throughout the growing season, because
soil moisture facilitates the transport
and uptake of mineral nutrients, and
because wetting of soils after a dry
period often causes a peak in
mineralization rates (Hungate et al.,
1997a). Indeed, rainfall was high at the
beginning of the growing season when
nitrogen availability was also high
(Figure 10). However, it may not be a
causal relationship (the peak for nitrate
occurs some time before the peak rainfall period, and both ions begin dropping off well
before the rainfall disappears). The correlation between rainfall and nitrogen availability over
the whole growing season is very weak (r2 = 0.04 for nitrate and 0.19 for ammonium).
0
25
50
75
100
125
11/0
1/0
1
11/1
4/0
1
12/0
4/0
1
12/2
4/0
1
01/2
6/0
2
02/0
3/0
2
02/2
4/0
2
03/1
0/0
2
03/2
5/0
2
04/1
0/0
2
05/1
0/0
2
Flu
x (
nm
ol / g r
esin
/ d
ay)
NO3-
NH4+
Surface
bags
Deep
bags
Figure 9. Seasonal trends in nitrate flux and ammonium flux, control plots only (treatment plots show a similar pattern).

17
Temperature is known to have an effect on the diffusion of ions (Foth and Ellis, 1997), but
there was no clear relationship between average air temperature and nitrogen flux (Figure 11).
The slight increase in ammonium availability at the end of the growing season may be partly
related to the increase in temperature, but correlations between temperature and nitrogen flux
over the growing season were very low (r2 = 0.014 for nitrate and 0.076 for ammonium).
Finally, we looked at the relationship between end-of-year biomass and nitrogen availability
(Figure 12). No correlation was apparent between nitrogen flux and above-ground biomass
(r2 = 0.001 for nitrate and 0.023 for ammonium); below-ground biomass (r2 = 0.012 and
0.001), or total biomass (r2 = 0.005 and 0.003). There was also no relationship between
nitrogen availability and root/shoot ratio (r2 = 0.022 for nitrate and 0.006 for ammonium). It
is possible that biomass at different times in the growing season would have shown different
patterns, but seasonal biomass data was not available.
10 In correlations of nutrient flux with environmental variables (temperature, rainfall, and total biomass), only control samples were used, in an attempt to accurately characterize the natural dynamics of the ecosystem.
0
25
50
75
100
125
300
320
340
360
15
35
55
75
95
115
135
Day of year
Rain
(m
m)
and n
utr
ient flu
x
(nm
ol/g
resi
n/d
ay)
Rain (mm)
NO3-
NH4+
Figure 10. Seasonal trends in rainfall over the 2001-2002 growing season. Though both rainfall and nutrient availability peak early in the growing season, nutrient availability begins to decline while rainfall is still high, making it unlikely that the relationship is directly causal.
0
5
10
15
20
25
30
35
40
45
50
300
320
340
360
15
35
55
75
95
115
135
Day of year
Rain
(m
m)
and n
utr
ient flux
(nm
ol/cm
2/d
ay)
0
2
4
6
8
10
12
14
16
18
20
Avg a
ir T
(deg C
)
Avg T (C)
NO3-
NH4+
Figure 11. Seasonal trends in air temperature over the 2001 - 2002 growing season. There appears to be no correlation between temperature and nutrient availability, with the exception of a slight peak in ammonium late in the growing season that may be partly due to warmer temperatures.

18
Global change effects
Yearly averages
Analysis of variance on averages of all
treatments (Figures 14 and 15) showed
that nitrogen deposition was the only
global change effect that significantly
altered soil nitrogen availability. Under
addition of nitrate fertilizer, nitrate
availability increased by an average of
50.0% and ammonium availability
increased by an average of 44.0%
(Figure 13).
Nitrate availability showed no response to elevated CO2 or warming, and a slight positive
response to increased precipitation (p = 0.61). Ammonium availability showed a small
increase in response to warming and increased precipitation (p = 0.41 and 0.62) and no
response to elevated CO2. (See Appendix 5 for complete ANOVA results.)
Seasonal e f f e c t s
The seasonal results revealed a more complex story. N deposition still dominated the global
change effects, but warming and increased
precipitation showed significant effects.
Increased precipitation showed opposite
effects at the beginning and at the end of the
growing season (Figures 16 and 17): in the
early growing season, it slightly decreased
availability of both nitrate and ammonium
(p = 0.28 for nitrate and 0.66 for
ammonium), whereas at the end of the
growing season, it increased the availability
of both ions (p = 0.01 for nitrate and 0.03
for ammonium). Warming increased
r2 = 0.003
r2 = 0.005
0
10
20
30
40
50
60
70
0 250 500 750 1000 1250 1500 1750 2000
Total biomass (g / m2)
Nu
trie
nt
flu
x (
nm
ol /
g r
esin
/ d
ay)
NO3-
NH4+
Figure 12. Relationship between net primary production and nitrogen availability throughout the season. (Above-ground biomass and below-ground biomass, examined separately, also failed to show a correlation with nitrogen availability.)
0
5
10
15
20
25
30
control N added
Nutr
ient flux (
nm
ol / g r
esin
/ d
ay)
NO3-
NH4+
Error bars = 1 SEM
Figure 13. Effect of N deposition on nitrate and ammonium availability. As expected, N addition causes a large increase in availability (p < 0.001), of nearly equal magnitude for both ions.

19
0
5
10
15
20
25
30
35
40
1 2 3 4 5 6 7 8 9 10 11 12 13 14 15 16
NO
3-
flu
x (
nm
ol /
g r
esin
/ d
ay)
CO2
Heat
Water
Nitrate
Error bars = 1 SEM Nitrate
Figure 14. Effects of global change treatments on nitrate availability (yearly averages). The dominant effect is a “zigzag” pattern due to N deposition (treatments 2, 4, 6, 8, 10, 12, 14 and 16). Elevated CO2, warming, and increased precipitation do not appear to have a strong effect on nitrate availability averaged over the growing season.
0
5
10
15
20
25
30
35
40
45
1 2 3 4 5 6 7 8 9 10 11 12 13 14 15 16
NH
4+
flu
x (
nm
ol /
g r
esin
/ d
ay)
CO2
Heat
Water
Nitrate
Error bars = 1 SEM Ammonium
Figure 15. Effects of global change treatments on ammonium availability (yearly averages). As with nitrate, a zigzag pattern due to N deposition can be seen. Effects of the other three global change factors cannot be easily detected at this level of detail.

20
ammonium availability at the end of the growing season (p < 0.01) but had no effect on nitrate
availability. Elevated carbon dioxide had no effect on either ammonium or nitrate at any
stage of the growing season.
Interac t ion e f f e ct s
Although CO2 and warming did not cause significant effects on their own, their interaction
approached significance for ammonium (p < 0.07 for yearly average, p = 0.05 for late growing
season). The interaction of warming and elevated CO2 increased the availability of
ammonium more than would be expected from the additive effects of the two factors.
However, the availability of nitrate was not affected by this interaction.
Nitrate showed a significant CO2 × water interaction (p < 0.09 for middle growing season, p <
0.04 for late growing season. CO2 tended to suppress nitrate availability in the absence of
water and increase nitrate availability in the presence of water. Nitrate also showed a CO2 ×
water × N interaction during the early growing season (p < 0.05), but this effect was not
repeated at any other time (though the direction of the effect was consistent throughout the
year).
0
5
10
15
20
25
30
35
40
45
50
55
60
65
early middle late
NO
3-
flux (
nm
ol / g r
esin
/ d
ay)
control
water
Nitrate
Figure 16. Effect of increased precipitation on nitrate availability throughout the growing season. In the early growing season, water addition slightly decreases nitrate availability, but the effect reverses direction in the middle and late growing season. (Error bars = ± 1 SEM.)
0
5
10
15
20
25
30
35
40
45
50
55
60
65
early middle late
NH
4+
flux (
nm
ol / g r
esin
/ d
ay)
control
water
Ammonium
Figure 17. Effect of increased precipitation on ammonium availability throughout the growing season. The same pattern can be seen as for nitrate: water addition decreases availability in the early growing season, but increases availability in the late growing season. (Error bars = ± 1 SEM.)

21
Finally, ammonium availability was affected by a CO2 × heat × N interaction, both averaged
over the whole year (p = 0.05) and during the early and middle growing season (p < 0.06 and
0.10, respectively). However, the direction of this interaction was not consistent between the
early and the middle growing season.
A closer look at CO2 and warming
Effects of warming and CO2 on nitrogen availability were, for the most part, too subtle to be
detected in the 4-factor ANOVA, so we ran a 2-factor ANOVA on treatments only including
CO2 and warming (Figure 18). Complete results are included in Appendix 5. Averaged over
the year, both CO2 and warming slightly increased ammonium availability but decreased
nitrate availability (no effects significant; p < 0.07 for effect of CO2 on nitrate). The
interaction of CO2 and warming increased ammonium availability more than would be
expected from their additive effects (p < 0.07), and decreased nitrate availability more than
would be expected (p < 0.05). The CO2 × warming effect for nitrate only occurred in the early
growing season (p < 0.01), not in the middle growing season or the late growing season (p >
0.9). This was the only prominent seasonal effect.
Discussion Single-factor effects Nitrogen deposition strongly increased availability of both nitrate and ammonium throughout
the growing season11. This effect occurred regardless of the presence of other global change
factors: there was no factor or combination of factors that could negate the effects of N
deposition. It is not surprising that the effect of nitrogen deposition overwhelmed the effects
of the other global change treatments, though the magnitude of the effect was less than in a
previous study at this site (S. Thayer, unpublished data). It will be some time before
anthropogenic nitrogen deposition could equal the level of deposition in this experiment at a
widespread scale, but should that occur, soil nitrogen availability will be dramatically affected.
11 The exception to this is the response of ammonium availability to N addition in the middle of the growing season, which was positive but not significant (p < 0.3). However, this lack of a clear response is probably due to the fact that ammonium levels were near the detection limit in the middle of the growing season, making the data from that period less meaningful.
0
5
10
15
20
25
30
control heat CO2 heat + CO2
N flu
x (
nm
ol / g r
esin
/ d
ay) NO3-
NH4+
Error bars = 1 SEM
Figure 18. Effects of warming and CO2 treatments on

22
It appears that water is in excess at the beginning of the growing season, so that additional
water contributes to nitrogen leaching and therefore lower nitrogen availability. However,
were this the case, it would be expected to have a greater negative effect on nitrate than on
ammonium, which was not observed. In any case, it seems clear that water is limiting at the
end of the growing season, thus additional water makes nitrogen more available. It is possible
that the late-season water effect is more important for resin bags than for plants or microbes
(because resin bags depend more on mass transport to pick up ions).
Warming had no effect on nitrate, but had a substantial impact on ammonium at the end of
the growing season. Why might the two ions respond differently to this global change
treatment? One possibility is that ammonium transport depends mostly on diffusion, which is
temperature-sensitive, whereas nitrate moves largely by mass transport. There may also be a
biological effect at work: it is possible that warmer temperatures enhance the activity of
ammonifying bacteria, or suppress the activity of nitrifying bacteria.
Neither ion showed a strong response to elevated CO2, which is not surprising given the
variety of previous results reported in this ecosystem. No response whatsoever could be
detected in ammonium, either in the ANOVA including all factors or the two-factor ANOVA
including only CO2 and warming responses. According to the two-factor ANOVA, nitrate
may have declined slightly in response to elevated CO2. If true, this could support the
microbial immobilization hypothesis proposed by Diaz et al. (1993), but it is not clear why the
same effect would not be seen for ammonium.
The same decline in nitrate availability might also be seen if elevated CO2 promoted plant
growth (and therefore plant N uptake), rather than promoting microbial growth. In either
case, less N would be accessible to the resin bags. There is little support for this idea,
however, because elevated CO2 did not have a strong effect on plant biomass during the
2001 - 2002 growing season (J. Dukes, unpublished data).
If nitrate and ammonium actually did respond differently to elevated CO2, one possible
explanation is that nitrifying bacteria are more sensitive to environmental changes than are
ammonifying bacteria (Foth and Ellis, 1997). Nitrification in this ecosystem may have

23
decreased slightly under elevated CO2, while ammonification and other microbial processes
remained constant.
Interaction effects The strongest interaction effect was the interaction between elevated CO2 and warming, which
served to increase ammonium availability and decrease nitrate availability. It is not clear why
this should be the case. Perhaps in this ecosystem, both ammonification and denitrification
are stimulated by elevated CO2 (or perhaps nitrification is decreased), and this effect is
accentuated by warming. This would explain both the increase in ammonium and the
decrease in nitrate.
Harder to explain are the three-way interactions between CO2, increased precipitation and N
deposition (significant for nitrate in the early growing season) and between CO2, warming, and
N deposition (significant for ammonium averaged over the year). The latter interaction seems
to have changed direction during the growing season, so even if the effect is meaningful and
repeatable, it is probably very complex. It remains to be seen if these patterns repeat in
subsequent years.
Future research
A major methodological improvement for future studies would be to use resin bags with a
consistent depth and consistent surface area throughout the growing season. It may be best
to bury bags at an intermediate depth, such as 8 cm (approximately in the middle of the
rooting profile) and leave the bags at that depth throughout the year. Alternatively, if time
and resources permit, both a shallow and a deep set of resin bags could be used concurrently.
The resin bags in tubes were often ineffective at picking up ions, especially during the dry
season. A better measure of availability might be possible if the bags could be buried in a way
that left them more fully in contact with the soil (for example, positioning the end of the tube
1 cm above the bottom of the hole). Although the exposed surface area of the resin bags
would be less consistent, collecting measurable numbers of ions is probably a more important
consideration. Another solution to this problem would be to leave the resin bags in the
ground for several weeks at a time, as is more typical (Stark, 2000).

24
It would be ideal to measure nutrient availability continuously throughout the year, rather than
leaving gaps in the data of several weeks at a time. This would require the use of two sets of
resin bags (so that one set could be installed when the other was removed). However,
increased temporal resolution should not necessarily take precedence over more replicates for
each treatment. Regardless of measurement frequency, it would be advisable to start
measurements earlier in the growing season, preferably before the first rains. This would
allow better characterization of the nutrient pulse at the beginning of the growing season.
Nutrient availability data could be made more meaningful in combination with other data sets,
such as soil moisture, microbial biomass, mycorrhizal colonization, and mineral content of
plant tissue (for example, C:N ratio). Also, it is important to consider nutrients beyond nitrate
and ammonium, most notably phosphate (see Appendix 6). Because of the low mobility of
phosphate, measurement of phosphate in this ecosystem will require either a different kind of
ion exchange resin, or a longer time period for which the resin bags are buried.
Before placing too much emphasis on any of the results presented here, it would be highly
advisable to repeat this study in a subsequent year and see if similar patterns emerge. Previous
results from the Jasper Ridge Global Change Experiment have varied considerably from year
to year. This may be partly because the ecosystem is still adjusting to the global change
treatments, and may also be due to the considerable year-to-year variation in environmental
conditions. It remains to be seen if nitrogen availability in this ecosystem has reached a steady
state in response to global change effects.
Conclusions Our results suggest that the overall effect of the four global change factors we examined
(elevated CO2, warming, increased precipitation and N deposition) was to increase nitrogen
availability in the annual grassland at the Jasper Ridge Global Change Experiment. It is
misleading, however, to simply say that global change increases nitrogen availability in this
ecosystem. We found evidence for interaction between pairs of global change factors (for
example, CO2 and warming) and even tentative evidence for three-way interactions (for

25
example, CO2 × warming × N). Furthermore, the effects of global change treatments varied
considerably over the course of the growing season, and frequently the two ions under
consideration were affected in opposite ways.
It remains to be seen whether these patterns will stay consistent in subsequent years. This
study provides only a snapshot of an ecosystem which is probably still out of equilibrium. As
plant and microbial communities alter in composition, patterns in nitrogen availability could
change considerably or even reverse.
The complexity of these results underscores the need for continuing research into the effects
of global change on nutrient availability. Because soil nutrients are a growth-limiting factor
for most terrestrial ecosystems, they represent an important mechanism by which global
change can affect ecosystem function. Better understanding of soil nutrient dynamics will
make it easier to understand, predict, and manage the effects of human-induced global change
on natural systems.

26
Acknowledgements People
Elsa Cleland invested a great deal of time in this study and should be considered a co-
author. She played an integral role every step of the way, from making the resin bags to
interpreting the statistics. The project would not have happened without her initiative and
hard work.
Chris Field, the author’s thesis advisor and one of the Global Change Experiment principal
investigators, was instrumental in providing ongoing guidance for questions both great and
small.
Rebecca Shaw shared her extensive knowledge of the Global Change Experiment to help
us develop our experimental methods and place this project in a broader context.
Sue Thayer laid the groundwork for this project by doing a similar study two years
previously. We are indebted to her for access to her data and for contributions to the
experimental design.
Doug Turner, along with the facilities of the Vitousek Lab, made the laboratory-based
part of this study possible. Doug spent many hours running samples and coaxing the aged
Alpkem to behave itself.
Lisa Moore provided the below-ground biomass data, and Jeff Dukes provided the above-
ground biomass data. The whole Field Lab worked to collect both data sets.
Erika Zavaleta and others developed a split-plot ANOVA model specifically for the
Global Change Experiment, which we used extensively for data analysis.
Nona Chiariello, scientific coordinator of the Global Change Experiment, provided
logistical support, meteorological data, and maps and digital photos of the site.

27
David Vernon earned considerable gratitude from the author for providing volunteer labor,
ongoing encouragement, and design of a more efficient way to spin water out of resin bags.
Jodie Kerr, the author’s laptop computer, worked diligently at analyzing data and making
graphs, as well as formatting the document you are reading right now.
Finally, the author would like to thank her family for moral support and frequent good-
natured queries of “Isn’t your thesis done yet?” Thanks especially to Al and Wenetta
Childs and Carol Childs for financial assistance, and Rex Kerr for technical advice.
Institutions
The Carnegie Institution of Washington (Department of Global Ecology), Jasper Ridge
Biological Preserve, and the Earth Systems Program at Stanford University provided
resources and connections to make this research possible.
We would also like to extend special appreciation to the National Science Foundation,
the Packard Foundation and the Morgan Family for their generous and ongoing financial
support of the Jasper Ridge Global Change Experiment.

28
References
Arnone, J. A. III (1997). “Indices of plant N availability in an alpine grassland under elevated
atmospheric CO2.” Plant and Soil 190: 61-66.
Arnone, J. A. III, Zaller, J.G., Spehn, E.M., Niklaus, P.A., Wells, C.E., and Körner, C. (2000).
“Dynamics of root systems in native grasslands: effects of elevated atmospheric CO2.” New
Phytologist 147: 73-85.
BassiriRad, H. (2000). “Kinetics of nutrient uptake by roots: responses to global change.”
New Phytologist 147: 155-169.
Binkley, D., and Matson, P. (1983). “Ion exchange resin bag method for assessing forest soil
nitrogen availability.” Soil Science Society of America Journal 47: 1050 - 1052.
Binkley, D., and Vitousek, P. (1989). “Soil nutrient availability. ” Pages 75 - 96 in Plant
Physiological Ecology: Field Methods and Instrumentation, edited by R. W. Pearcy,
Ehleringer, J.R., Mooney, H.A., and Rundel, P.W. New York: Chapman & Hall.
Brady, N. C., and Weil, R.R. (2001). The Nature and Properties of Soils. Upper Saddle River,
NJ: Prentice Hall.
Diaz, S., Grime, J.P., Harris, J., and McPerson, E. (1993). “Evidence of a feedback mechanism
limiting plant response to elevated carbon dioxide.” Nature 364: 616-617.
Finzi, A. C. (2002). Models and mechanisms linking carbon, water and nutrient cycles under
elevated CO2. Presentation at Ecological Society of America 87th Annual Meeting, Tuscon,
AZ.
Fitter, A. H., and Hay, R.K.M. (2002). Environmental Physiology of Plants. London:
Academic Press.

29
Foth, H. D., and Ellis, B.G. (1997). Soil Fertility. Boca Raton, FL: CRC Press.
Gloser, V., Jezikova, M., Luscher, A., Frehner, M., Blum, H., Nosberger, J., and Hartwig, U.A.
(2000). “Soil mineral nitrogen availability was unaffected by elevated atmospheric CO2 (Swiss
FACE).” Plant and Soil 227: 291-299.
Gorrisen, A., and Cotrufo, M.F. (1999). “Elevated carbon dioxide effects on nitrogen
dynamics in grasses, with emphasis on rhizosphere processes.” Soil Science Society of
America Journal 63: 1695-1702.
Hagedorn, F., Landolt, W., Tarjan, D., Egli, P., and Bucher, J. (2002). “Elevated CO2
influences nutrient availability in young beech-spruce communities on two soil types.”
Oecologia 132: 109-117.
Harte, J., and Shaw, R. (1995). “Shifting dominance within a montane vegetation community:
results of a climate-warming experiment.” Science 267: 876-880.
Hu, S., Firestone, M.K., and Chapin, F.S. III (1999). “Soil microbial feedbacks to atmospheric
CO2 enrichment.” Trends in Ecology and Evolution 14(11): 433-437.
Hu, S., Chapin, F.S. III, Firestone, M.K., Field, C.B., and Chiariello, N.R. (2001). “Nitrogen
limitation of microbial decomposition in a grassland under elevated CO2.” Nature 409: 188-
191.
Hungate, B. A., Lund, C.P., Pearson, H.L., and Chapin, F.S. III (1997a). “Elevated CO2 and
nutrient addition alter soil N cycling and N trace gas fluxes with early season wet-up in a
California annual grassland.” Biogeochemistry 37: 89-109.
Hungate, B. A., Chapin, F.S. III, Zhong, H., Holland, E.A., and Field, C.B. (1997b).
“Stimulation of grassland nitrogen cycling under carbon dioxide enrichment.” Oecologia 109:
149-153.

30
Hungate, B. A., Dijkstra, P., Johnson, D.W., Hinkle, C.R., and Drake, B.G. (1999). “Elevated
CO2 increases nitrogen fixation and decreases soil nitrogen mineralization in Florida scrub
oak.” Global Change Biology 5: 781-798.
Intergovernmental Panel on Climate Change (IPCC) (2001). Climate Change 2001: The
Scientific Basis. New York: Cambridge University Press.
Joel, G., Chapin, F.S. III, Chiariello, N.R., Thayer, S.S., and Field, C.B. (2001). “Species-
specific responses of plant communities to altered carbon and nutrient availability.” Global
Change Biology 7: 435-450.
Kashiwagi, J. (1985). Soils map of the Jasper Ridge Biological Preserve. Soil Conservation
Service Map - Jasper Ridge Biological Preserve Publication, Stanford, CA.
Kaye, J. P., and Hart, S.C. (1997). “Competition for nitrogen between plants and soil
microorganisms.” Trends in Ecology and Evolution 12(4): 139-143.
Loiseau, P., and Soussana, J.F. (2000). “Effects of elevated CO2, temperature and N
fertilization on nitrogen fluxes in a temperate grassland ecosystem.” Global Change Biology
6: 953-965.
Luo, Y., Reynolds, J., Wang, Y., and Wolfe, D. (1999). “A search for predictive understanding
of plant responses to elevated [CO2].” Global Change Biology 5: 143 - 156.
Martin-Olmedo, P., Rees, R.M., and Grace, J. (2002). “The influence of plants grown under
elevated CO2 and N fertilization on soil nitrogen dynamics.” Global Change Biology 8: 643-
657.
Mengel, K., and Kirkby, E.A. (2001). Principles of Plant Nutrition. Dordrecht, The
Netherlands: Kluwer Academic Publishers.

31
Mikan, C. J., Zak, D.R., Kubiske, M.E., and Pregitzer, K.S. (2000). “Combined effects of
atmospheric CO2 and N availability on the belowground carbon and nitrogen dynamics of
aspen mesocosms.” Oecologia 124: 432-445.
Mulvaney, R. L. (1996). “Nitrogen - inorganic forms.” Pages 1123 - 1180 in Methods of Soil
Analysis: Part 3, Chemical Methods, edited by J. M. Bartels. Madison, Wisconsin: Soil Science
Society of America.
Niklaus, P. A., Leadley, P.W., Stocklin, J., and Korner, C. (1998). “Nutrient relations in
calcareous grassland under elevated CO2.” Oecologia 116: 67-75.
Niklaus, P. A., Kandeler, E., Leadley, P.W., Schmid, B., Tscherko, D., and Korner, C. (2001).
“A link between plant diversity, elevated CO2 and soil nitrate.” Oecologia 127: 540-548.
Reich, P. B., Knops, J., Tilman, D., Craine, J., Ellsworth, D., Tjoelker, M., Lee, T., Wedin, D.,
Naeem, S., Bahauddin, D., Hendrey, G., Jose, S., Wrage, K., Goth, J., and Bengston, J. (2001).
“Plant diversity enhances ecosystem responses to elevated CO2 and nitrogen deposition.”
Nature 410: 809-812.
Rillig, M. C., Field, C.B., and Allen, M.F. (1997). “Soil fungal responses to elevated
atmospheric CO2 in a California grassland.” Bulletin of the Ecological Society of America
78(4, Supplement): 303.
Shaw, R. (1995). “The role of nitrogen dynamics in the shifting dominance within a montane
vegetation community: Results from a climate-warming experiment.” Bulletin of the
Ecological Society of America 76(3, Supplement): 387.
Skogley, E. O., and Dobermann, A. (1996). “Synthetic ion-exchange resins: soil and
environmental studies.” Journal of Environmental Quality 25: 13-24.

32
Stark, J. M. (2000). “Nutrient transformations.” Pages 215 - 234 in Methods in Ecosystem
Science, edited by O. E. Sala, Jackson, R.B., Mooney, H.A., and Howarth, R.W. New York:
Springer-Verlag.
Taiz, L., and Zeiger, E. (1998). Plant Physiology. Sunderland, MA: Sinauer Associates.
Thayer, S. S., Chiariello, N.R., Joel, G., Whitted, W.H., Nelson, E.N., Chapin, F.S. III,
Mooney, H.A., and Field, C.B. (2002). “Interactive effects of elevated CO2, water and nutrient
availability on species composition, production and N status in two grassland communities.”
In preparation.
Torbert, H. A., and Elkins, C.B. (1992). “Determining differential water movement through
ion exchange resin for nitrate leaching measurements.” Communications in Soil Science and
Plant Analysis 23: 1043-1052.
Treseder, K. K., and Vitousek, P.M. (2001). “Effects of soil nutrient availability on investment
in acquisition of N and P in Hawaiian rain forests.” Ecology 82(4): 946-954.
Tscherko, E., Kandeler, E., and Jones, T.H. (2001). “Effect of temperature on below-ground
N-dynamics in a weedy model ecosystem at ambient and elevated atmospheric CO2 levels.”
Soil Biology and Biochemistry 33: 491-501.
Vitousek, P. M., Aber, J.D., Howarth, R.W., Likens, G.E., Matson, P.A., Schindler, D.W.,
Schlesinger, W.H., and Tilman, D.G. (1997). “Human alteration of the global nitrogen cycle:
sources and consequences.” Ecological Applications 7(3): 737 - 750.
Williams, M. A., Rice, C.W., and Owensby, C.E. (2001). “Nitrogen competition in a tallgrass
prairie ecosystem exposed to elevated carbon dioxide.” Soil Science Society of America
Journal 65: 340-346.

33
Zak, D. R., Pregitzer, K.S., Curtis, P.S., Teeri, J.A., Fogel, R.F., and Randlett, D.L. (1993).
“Elevated atmospheric CO2 and feedback between carbon and nitrogen cycles.” Plant and
Soil 151: 105-117.
Zak, D. R., Pregitzer, K.S., Curtis, P.S., and Holmes, W.E. (2000a). “Atmospheric CO2 and
the composition and function of soil microbial communities.” Ecological Applications 10(1):
47-59.
Zak, D. R., Pregitzer, K.S., King, J.S., and Holmes, W.E. (2000b). “Elevated atmospheric
CO2, fine roots and the response of soil microorganisms: a review and hypothesis.” New
Phytologist 147: 201-222.
Zavaleta, E. S., Thomas, B.D., Chiariello, N.R., Asner, G.A., Shaw, R., and Field, C.B. (2002).
Plants reverse warming effect on ecosystem water balance in a California grassland.
Presentation at Ecological Society of America 87th Annual Meeting, Tuscon, AZ.