Soil Tillage Influences on Soil Mineral Nitrogen and ...
74
Soil Tillage Influences on Soil Mineral Nitrogen and Nitrate Leaching in Swedish Arable Soils Åsa Myrbeck Faculty of Natural Resources and Agricultural Sciences Department of Soil and Environment Uppsala Doctoral Thesis Swedish University of Agricultural Sciences Uppsala 2014
Transcript of Soil Tillage Influences on Soil Mineral Nitrogen and ...
Soil Tillage Influences on Soil Mineral Nitrogen and Nitrate Leaching in
Swedish Arable Soils
Åsa Myrbeck Faculty of Natural Resources and Agricultural Sciences
Department of Soil and Environment
Uppsala
Doctoral Thesis
Swedish University of Agricultural Sciences
Uppsala 2014
Acta Universitatis agriculturae Sueciae
2014:71
ISSN 1652-6880
ISBN (print version) 978-91-576-8090-7
ISBN (electronic version) 978-91-576-8091-4
© 2014 Åsa Myrbeck, Uppsala
Print: SLU Service/Repro, Uppsala 2014
Cover: The Ultuna field experiment, Paper III.
(photo: J. Arvidsson)
Soil Tillage Influences on Soil Mineral Nitrogen and Nitrate Leaching in Swedish Arable Soils.
Abstract
Leaching of nitrogen (N) is an unwanted effect of agriculture practices which
contributes to eutrophication of surface waters. This thesis examined how soil tillage
practices affect leaching losses of N from arable fields. This was done directly by
measuring N in drainage water and indirectly by studying the dynamics of soil mineral
N (SMN) within the soil profile and involved long-term and short-term studies of
tillage of different timing and intensity. The impact of time of tillage in autumn on soil
structure and crop yield was also examined.
It was found that adapting soil management and tillage to crop rotation in order to
synchronise SMN with crop demand could substantially decrease leaching losses of N.
Tillage effects on SMN were mainly attributable to interruption of N uptake in crops
and weeds, rather than stimulation of N mineralisation. Timing of tillage proved to be
important in this regard. In clay soils, however, delayed tillage in autumn (previously
shown to reduce N leaching losses in coarse-textured soils) resulted in operations being
performed when soil water content was higher than optimal, causing a poor tillage
outcome and decreased yield. From the results it can be concluded that a reduction in N
leaching by delaying autumn tillage may be achieved on lighter clay soils in warmer
and moister areas of Sweden whereas the effects may be small on heavier clay soils.
The results indicated potential for further reductions in N leaching, especially in
autumn-sown crops, by early sowing, a short time interval between tillage and sowing
and undersowing of a catch crop in spring. SMN accumulation in winter wheat during
autumn and winter was not influenced by tillage method. Therefore changing from
conventional to reduced tillage or direct drilling of winter crops is unlikely to reduce
overall N leaching losses. The importance of high biomass production during autumn
and winter was identified and should be the main focus in strategies for mitigating N
leaching losses from arable fields.
Keywords: Soil tillage, nitrogen leaching, soil mineral nitrogen, SMN dynamics, tillage
timing, reduced tillage, catch crops, straw treatment
Author’s address: Åsa Myrbeck, SLU, Department of Soil and Environment,
P.O. Box 7014, 750 07 Uppsala, Sweden
E-mail: Asa.Myrbeck@ slu.se

Dedication
To my sister Hanna
Contents
List of Publications 7
Abbreviations 9
1 Introduction 11
2 Aim 13
3 Background 15 3.1 Nitrogen leaching 15 3.2 Soil tillage – for optimal crop growth 16 3.3 Soil tillage and SMN 16 3.4 Incorporation or removal of crop residues? 17 3.5 Time of tillage for spring crops 18 3.6 Timing effects on soil structure and tillage outcome 18 3.7 Soil tillage to winter crops 19 3.8 Tillage intensity 19 3.9 Catch crops 20
4 Tillage definitions used 21
5 Materials and methods 23 5.1 Site location and description 23 5.2 Study design 25
5.2.1 Paper I - Timing of tillage on clay soil 26 5.2.2 Paper II - Establishment techniques for winter wheat 27 5.2.3 Paper III – Tillage of clay soils at different soil water contents 27 5.2.4 Paper IV – N use efficient management within a crop rotation 28 5.2.5 General information 28
5.3 Measurements 28 5.3.1 An overview of crop and soil sampling and measurements 28 5.3.2 Crop analyses 29 5.3.3 Nitrogen in drainage water 30 5.3.4 Soil N 31 5.3.5 Soil physical properties 32
5.4 Calculations 34 5.4.1 Net soil N mineralisation during the growing season 34
5.4.2 Total crop uptake of N 34 5.4.3 SMN 34
5.5 Statistical analyses 34
6 Aspects of soil N sampling 37 6.1 Concentration and mass per unit area 37 6.2 Correction for changes in soil surface height 39
7 Main results and discussion 41 7.1 Incorporation or removal of crop residues? 41 7.2 Timing of tillage for spring crops 42 7.3 Delayed autumn tillage – effects on soil structure and yield 45 7.4 Time of tillage and date of sowing of winter wheat 49 7.5 Tillage intensity 53 7.6 Long-term and short-term effects within a crop sequence 54 7.7 Tillage – Mineralisation – N leaching 58 7.8 Results in relation to government regulations 59
8 Implications for future research 61
9 Conclusions 63
References 65
Acknowledgement 73
7
List of Publications
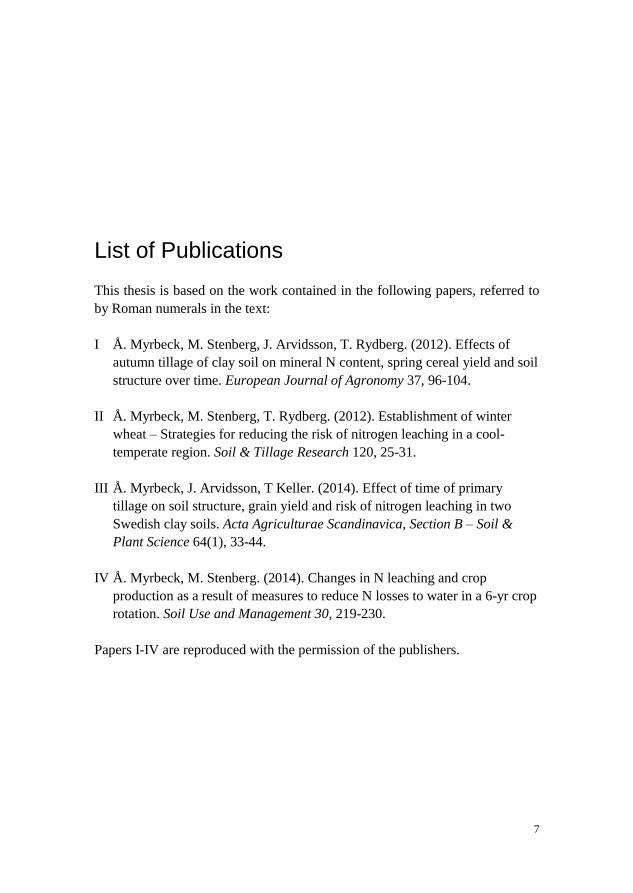
This thesis is based on the work contained in the following papers, referred to
by Roman numerals in the text:
I Å. Myrbeck, M. Stenberg, J. Arvidsson, T. Rydberg. (2012). Effects of
autumn tillage of clay soil on mineral N content, spring cereal yield and soil
structure over time. European Journal of Agronomy 37, 96-104.
II Å. Myrbeck, M. Stenberg, T. Rydberg. (2012). Establishment of winter
wheat – Strategies for reducing the risk of nitrogen leaching in a cool-
temperate region. Soil & Tillage Research 120, 25-31.
III Å. Myrbeck, J. Arvidsson, T Keller. (2014). Effect of time of primary
tillage on soil structure, grain yield and risk of nitrogen leaching in two
Swedish clay soils. Acta Agriculturae Scandinavica, Section B – Soil &
Plant Science 64(1), 33-44.
IV Å. Myrbeck, M. Stenberg. (2014). Changes in N leaching and crop
production as a result of measures to reduce N losses to water in a 6-yr crop
rotation. Soil Use and Management 30, 219-230.
Papers I-IV are reproduced with the permission of the publishers.

8
The contribution of Åsa Myrbeck to the papers included in this thesis was as
follows:
I Main author. Planned the analyses together with co-authors. Performed
parts of the soil sampling, field analyses and laboratory analyses.
Performed data analysis. Carried out the writing with the assistance of the
co-authors.
II Main author. Planned the study together with co-authors. Planned the field
experiments and the sampling and analyses. Performed minor parts of the
sampling. Performed data analysis. Carried out the writing with the
assistance of the co-authors.
III Main author. Performed soil sampling and soil physical analyses with some
assistance. Performed data analysis. Carried out the writing with the
assistance of the co-authors.
IV Main author. Was responsible for planning the field experiments and for the
sampling and analyses. Performed data analysis. Carried out the writing
with the assistance of the co-authors.
9
Abbreviations
CON Conventional
N Nitrogen
NH4-N Ammonium-N
NO3-N Nitrate-N
NTU Nephelometric turbidity units
NUE Nutrient use efficiency
OM Organic material
PL Lower plastic limit
SBD Soil bulk density
SMN Soil mineral nitrogen
SOM Soil organic material

10
11
1 Introduction
Of all the nutrients used within food production, nitrogen (N) has the single
largest effect on crop yields and also contributes most to environmental
concerns and discussions (Roy et al., 2006). Contribution to eutrophication of
surface waters is an unwanted effect of agriculture practices. This is following
on N, together with phosphorus (P), being transported through the soil profile
or over the soil surface to ditches and rivers and further into lakes and seas.
The problem is especially troublesome in cold and humid regions, where large
amounts of water percolate through the soil (Morecroft et al., 2000). In some
areas, leaching losses of N also cause high levels of N in groundwater, which
can result in unhealthy levels of nitrate (NO3) in drinking water.
Research to identify measures to reduce agricultural non-point source
pollution of N has been underway for some decades. However, in Sweden, as
in the rest of Europe, agriculture is still reported to be one of the main
contributors to excess N in surface waters (EU, 2006; Brandt et al., 2009). In
Sweden, more than 40% of estimated anthropogenic loads of N to coastal
waters originate from agricultural land (SEPA, 2006). In accordance with
targets adopted by the Baltic Sea Action Plan (HELCOM, 2007) and OSPAR
(OSPAR, 1992), aiming at improving the environmental status of the Baltic
Sea and the north-east Atlantic, respectively, Sweden has reduced its estimated
total N inputs to coastal waters (Blombäck et al., 2011; Stålnacke et al., 2014).
However, the latest revision within the Helsinki Commission (HELCOM,
2013) involves a further reduction in Swedish contributions of 9240 ton N to
the Baltic Sea from today to 2021, putting the agriculture sector under further
pressure to achieve reductions.
Water quality management within the European Union (EU) is regulated by
the EU Water Framework Directive (EU, 2006) and for the agriculture sector
also by the EU Nitrate Directive (91/676/EEC). According to these regulations,
Sweden has classified areas vulnerable to eutrophication. Extensive parts of the
coast along southern Sweden, together with three large inland lakes, are
12
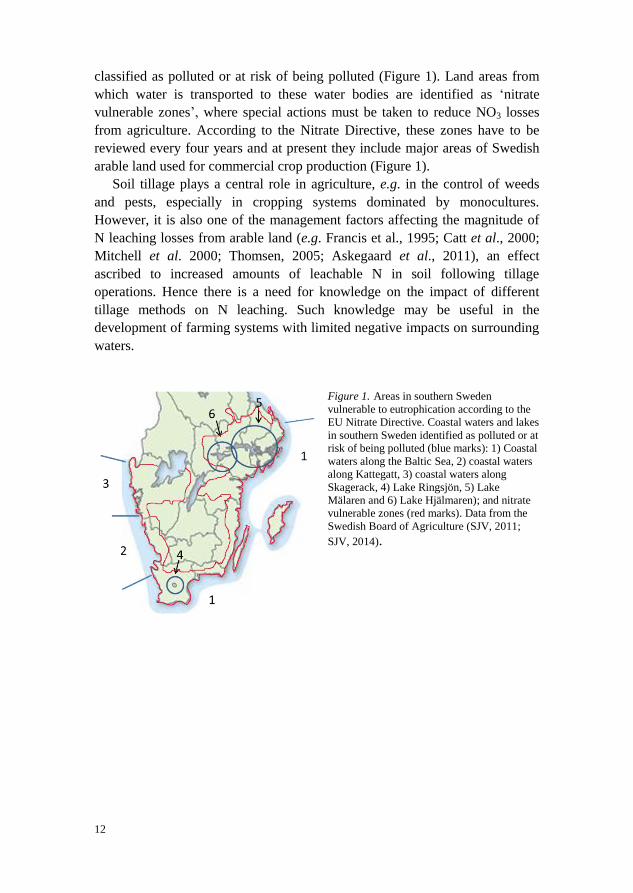
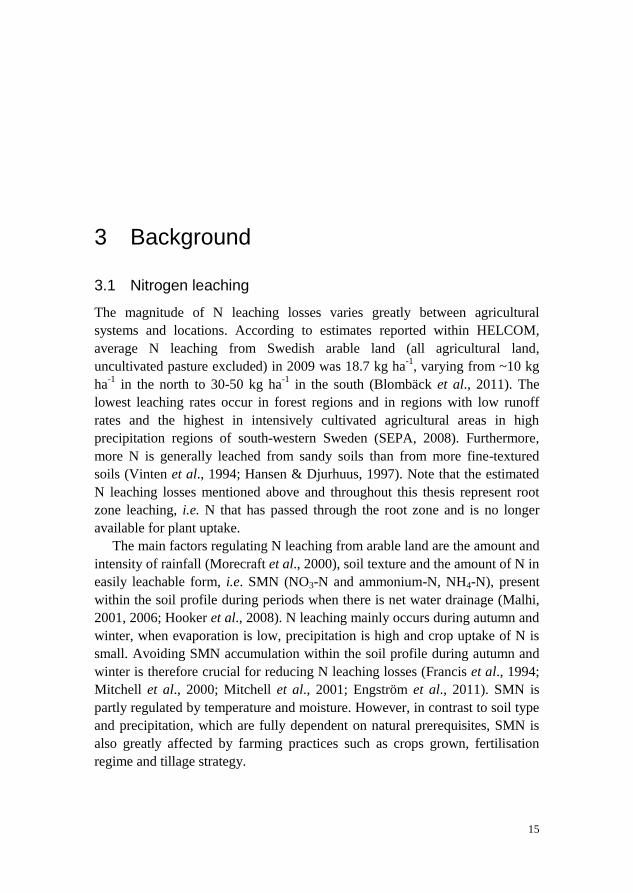
classified as polluted or at risk of being polluted (Figure 1). Land areas from
which water is transported to these water bodies are identified as ‘nitrate
vulnerable zones’, where special actions must be taken to reduce NO3 losses
from agriculture. According to the Nitrate Directive, these zones have to be
reviewed every four years and at present they include major areas of Swedish
arable land used for commercial crop production (Figure 1).
Soil tillage plays a central role in agriculture, e.g. in the control of weeds
and pests, especially in cropping systems dominated by monocultures.
However, it is also one of the management factors affecting the magnitude of
N leaching losses from arable land (e.g. Francis et al., 1995; Catt et al., 2000;
Mitchell et al. 2000; Thomsen, 2005; Askegaard et al., 2011), an effect
ascribed to increased amounts of leachable N in soil following tillage
operations. Hence there is a need for knowledge on the impact of different
tillage methods on N leaching. Such knowledge may be useful in the
development of farming systems with limited negative impacts on surrounding
waters.
Figure 1. Areas in southern Sweden
vulnerable to eutrophication according to the
EU Nitrate Directive. Coastal waters and lakes
in southern Sweden identified as polluted or at
risk of being polluted (blue marks): 1) Coastal
waters along the Baltic Sea, 2) coastal waters
along Kattegatt, 3) coastal waters along
Skagerack, 4) Lake Ringsjön, 5) Lake
Mälaren and 6) Lake Hjälmaren); and nitrate
vulnerable zones (red marks). Data from the
Swedish Board of Agriculture (SJV, 2011;
SJV, 2014).
13
2 Aim
The overall aim of this thesis was to improve our understanding of how soil
tillage practices affect leaching losses of N from arable fields, directly by
measuring N in drainage water and indirectly by studying the dynamics of soil
mineral N (SMN) within the soil profile. The work included long-term and
short-term studies of tillage at different timing and intensity. An additional aim
was to obtain information about the impact of time of tillage in autumn on soil
structure and fertility.
Specific objectives, in the context of N leaching and SMN dynamics, were:
To study the effects of shallow cultivation and/or direct drilling in
relation to deeper mouldboard ploughing (Papers I, II, III and IV).
To study the effect of timing of tillage for spring-sown and winter-
sown crops (Papers I, II, III and IV).
To quantify the effects of straw incorporation compared with removal
(Paper I).
To quantify the influence of sowing date on N uptake in winter wheat
and thereby its capacity for reducing the amounts of SMN during
autumn (Papers II and IV).
To investigate the effects of combining several measures aimed at
reducing N leaching within a cropping sequence (Paper IV).
To study the long-term and short-term consequences of delayed
tillage, as a measure for reducing N leaching, on soil structure and
crop yield in clay soils (Papers I and III).
The main hypothesis was that leaching of N from arable fields can be reduced
by choice of suitable tillage strategies. The results presented are mainly
summarised from Papers I-IV, but some novel findings are also presented in
the following chapters.

14
15
3 Background
3.1 Nitrogen leaching
The magnitude of N leaching losses varies greatly between agricultural
systems and locations. According to estimates reported within HELCOM,
average N leaching from Swedish arable land (all agricultural land,
uncultivated pasture excluded) in 2009 was 18.7 kg ha-1
, varying from ~10 kg
ha-1
in the north to 30-50 kg ha-1
in the south (Blombäck et al., 2011). The
lowest leaching rates occur in forest regions and in regions with low runoff
rates and the highest in intensively cultivated agricultural areas in high
precipitation regions of south-western Sweden (SEPA, 2008). Furthermore,
more N is generally leached from sandy soils than from more fine-textured
soils (Vinten et al., 1994; Hansen & Djurhuus, 1997). Note that the estimated
N leaching losses mentioned above and throughout this thesis represent root
zone leaching, i.e. N that has passed through the root zone and is no longer
available for plant uptake.
The main factors regulating N leaching from arable land are the amount and
intensity of rainfall (Morecraft et al., 2000), soil texture and the amount of N in
easily leachable form, i.e. SMN (NO3-N and ammonium-N, NH4-N), present
within the soil profile during periods when there is net water drainage (Malhi,
2001, 2006; Hooker et al., 2008). N leaching mainly occurs during autumn and
winter, when evaporation is low, precipitation is high and crop uptake of N is
small. Avoiding SMN accumulation within the soil profile during autumn and
winter is therefore crucial for reducing N leaching losses (Francis et al., 1994;
Mitchell et al., 2000; Mitchell et al., 2001; Engström et al., 2011). SMN is
partly regulated by temperature and moisture. However, in contrast to soil type
and precipitation, which are fully dependent on natural prerequisites, SMN is
also greatly affected by farming practices such as crops grown, fertilisation
regime and tillage strategy.
16
3.2 Soil tillage – for optimal crop growth
Tillage can be divided into primary and secondary practices, where the former
are considered to be deeper and heavier than the latter. The main objective of
primary tillage, which in Sweden is often carried out to a depth of approx.
0.10-0.25 m, is to obtain fine soil with varying clod sizes, to kill weeds by
burying or cutting and exposure of roots, and to chop and incorporate crop
residues, mainly to control diseases. Secondary tillage is undertaken after
primary tillage and the main objectives are to reduce clod size for preparation
of a seedbed and to control weeds.
For spring crops, primary tillage is carried out either in autumn or in spring.
Based on common practice and due to their structure and physical properties,
clay soils are tilled in autumn under Nordic conditions. Mouldboard ploughing
to a depth of 0.20-0.25 m is the most common primary tillage practice.
However, shallower non-inversion tillage and direct drilling, often referred to
as reduced tillage, are attracting increased interest in Sweden and
internationally, mainly due to the lower workload and fuel costs.
3.3 Soil tillage and SMN
SMN comprises at most a few per cent of total soil N (Tate, 1995), which in
Swedish soils is around 5-10 ton. Nevertheless, the mineral N content is the
determining factor for processes in soil such as N uptake in plants, N leaching
and gaseous losses of N by emissions to the atmosphere. Mineralisation of N
from plant residues or soil organic matter (SOM) is a continuous aerobic
microbial process at temperatures >0º C and this naturally produced mineral N
usually comprises a larger proportion of the N leached from the soil than the N
from fertilisers applied to growing crops (Addiscott, 1988; Goss et al., 1993).
The rate of mineralisation increases with temperature and with soil water
content, usually up to either field capacity or just beyond the soil plastic limit
(Watts et al., 2000).
Many studies have shown increased amounts of SMN after a tillage
operation (e.g. Hansen & Djurhuus, 1997; Catt et al., 2000; Mitchell et al.
2000; Thomsen, 2005; Askegaard et al., 2011). This has often been ascribed to
stimulation of organic matter (OM) mineralisation by incorporation of crop
residues and by disruption of aggregates, making previously protected organic
material accessible to microorganisms (Adu & Oades, 1978; Six et al., 2004),
although the mechanisms behind this are not very well known. Tillage may
affect mineralisation rate e.g. by alteration of soil geometry (Young & Ritz,
2000; Morris et al., 2010; Silva et al., 2014), soil aeration (Khan, 1996; Morris
et al., 2010), soil temperature (Malhi et al., 2001), soil moisture content and
17
placement of crop residues (Balesdent et al., 2000). However as the influence
of soil tillage on OM mineralisation is complex, the net effect may change with
time and place, which also makes the results of studies within this area very
variable. For example, incorporation of aboveground crop residues may speed
up decomposition of these residues, provided the conditions (e.g. temperature
and moisture content) are more favourable within the soil than on the soil
surface (Malhi et al., 2001; Coppens et al., 2007). In contrast, deep
incorporation by mouldboard ploughing might slow down decomposition
compared with shallower incorporation due to lower temperatures and water
contents with deeper tillage (Kainiemi, 2014). Tillage effects on SMN also
include regulation of SMN depletion by uptake in plants.
In addition to influencing N losses from soil by encouraging SMN
accumulation, tillage practices may alter the flow pathways through which
water carries SMN from the soil. For example, long-term use of reduced tillage
has been shown to encourage preferential flow of water by allowing flow-
active macropores made by soil fauna or by roots to develop within the soil
(Shipitalo et al., 2000).
3.4 Incorporation or removal of crop residues?
Residues of arable crops can have large effects on SMN and subsequent N
leaching losses. However, crop residues may be either a source or a sink of
mineral N depending on their C/N ratio (Jensen et al., 1997). Incorporation of
cereal straw residues, which often have a high C/N ratio, has been suggested as
a measure to control N leaching due to immobilisation of soil N in microbial
biomass during the decomposition process in autumn (e.g. Bhogal et al., 1997;
Jensen, 1997). In laboratory incubations with non-limiting inorganic N
concentrations and milled cereal straw, net immobilisation is reported to be 12-
16 kg N per ton straw (Smith et al., 1993; Mary et al., 1996; Bhogal et al.,
1997), which would amount to approximately 50-60 kg N ha-1
for barley
yielding 6 ton ha-1
. Many studies show net immobilisation of N also after
incorporation of chopped straw into small field plots (e.g. Jensen, 1997; Lindén
& Engström, 2006), although at a much lower rate than under incubation,
around 2-4 kg N per ton straw (Mary et al., 1996). However, there are few full-
scale field studies comparing SMN after incorporation of full length straw.
Moreover, the reaction to addition of plant residues seems to vary with climate
and also soil type (Nyborg & Malhi, 1989).
18
3.5 Time of tillage for spring crops
It is well known that delaying tillage for spring cereals to late autumn or spring
in cold-temperate regions decreases the levels of SMN and N leaching during
autumn and winter, especially in sandy and loamy soils, compared with tillage
in early autumn (Francis et al., 1995; Känkänen et al., 1998; Stenberg et al.,
1999; Mitchell et al., 2000). This has often been ascribed to less mineralisation
of organic material when the soil is left undisturbed at a time during autumn
when the soil temperature still allows high microbial activities. In southern
Sweden, as much as half of annual mineralisation may take place during the
autumn (Wallgren & Lindén, 1994). Delaying tillage in autumn is therefore
regarded as a means of limiting N leaching. In the same way, delaying
incorporation of ley until late autumn has been found to cause less build-up of
mineralised organic N (Wallgren & Lindén, 1994) and lower NO3-N
concentrations in drainage water (Neumann et al., 2011). However, the
majority of previous studies describing the effects of autumn soil tillage on
SMN accumulation have been carried out on sandy soils, while knowledge
about reactions in clay soils, which are less prone to leaching, is somewhat
more limited.
3.6 Timing effects on soil structure and tillage outcome
A possible drawback from delaying tillage to late autumn in order to decrease
N leaching is that tillage is then not performed in optimal soil conditions. In
temperate climates, clay soils often have high soil water content during late
autumn and traffic at high water contents induces plastic deformation and
shearing (Lipiec et al., 1991; Horn et al., 1995). This may result in soil
compaction, characterised by a more dense soil with higher soil bulk density
and poorer aeration (McAfee et al., 1989), reduced root growth and thereby
lower nutrient and water uptake efficiency in the crop.
The soil water content during tillage is also very important for the tillage
outcome (Watts & Dexter, 1994; Keller et al., 2007). The optimal water
content for tillage has been defined as ‘the water content where tillage
produces the largest proportion of small aggregates’ (Dexter, 1988), and is
generally found at intermediate water contents. One way of defining the
optimal water content for tillage is to relate it to the soil lower plastic limit
(PL), as defined by Atterberg (1912). The optimum water content for tillage is
frequently reported to be equal to the gravimetric water content at ~0.7-0.9 PL
(Dexter & Bird, 2001; Keller et al., 2007). Moreover, Arvidsson & Håkansson
(1996; 2014) found that compaction of clay soils resulted in poorer topsoil
structure, with a decrease in the proportion of fine aggregates in the seedbed
19
and decreased yield of all the most common crops in Sweden except for winter
wheat. With a predicted future increase in autumn precipitation (Christensen et
al., 2007), this issue is likely to become very important.
3.7 Soil tillage to winter crops
The proportion of autumn-sown crops is increasing in many areas of north-
west Europe (EuroStat, http://epp.eurostat.ec.europa.eu, data
APRO_CP_CROP), with e.g. increasing acreage of autumn-sown cereals
(mainly winter wheat) in Sweden from 1981 to 2009 (Svensson, 2010). In
these crops, where delaying tillage to late autumn is not possible, it is relevant
to find alternative ways of reducing N leaching. In Sweden, winter wheat is
one of the crops eligible for winter subsidies for covering soil (SJVFS
2011:25), but different establishment strategies may differ in how effectively
they close the N cycle.
Since the recommended sowing date for winter wheat in Sweden is in
September, tillage has to be performed during August and September. These
months normally have high temperatures and often humid conditions,
favouring N mineralisation and consequently causing an early increase in SMN
(Torstensson & Aronsson, 2000; Engström et al., 2011). Winter wheat N
uptake during autumn, from establishment until growth ceases owing to low
temperatures, has been reported to amount to about 20 kg N ha-1
or less
(Lindén et al., 2000). This is generally much lower than reported soil N content
(Stenberg et al., 1999; Engström et al., 2011), so excess N is at risk of being
lost by leaching.
3.8 Tillage intensity
Different tillage systems disturb the physical framework of the soil to different
degrees and place incorporated crop residues in different ways (Gantzer &
Blake, 1978). Thus, they can also be expected to have different effects on soil
microorganisms and N mineralisation rate (Doran, 1987). Under controlled
laboratory conditions, it has been found that increasing levels of mechanical
energy applied to soil aggregates increase the rate of respiration (Dexter et al.,
2000; Watts et al., 2000; Kainiemi, 2014). However, when comparing different
intensities of tillage in the field, the effects seem rather short-lived and the
overall results are variable.
Some studies have shown that N mineralisation (Reicosky & Archer, 2007;
Chatskikh et al., 2008) and N leaching (Catt et al., 2000; Askegaard et al.,
2011) increase with increasing intensity of soil tillage (Nyborg & Malhi, 1989;
20
Goss et al., 1993; Hansen & Djurhuus, 1997; Power & Peterson, 1998;
Stenberg et al., 1999). Reduced tillage has therefore been suggested as a
potential measure to mitigate N leaching losses. For example, Stenberg et al.
(1999) showed that omitting stubble cultivation after harvest, before
mouldboard ploughing, reduced N losses, while Catt et al. (2000) reported
lower N losses under shallow tine cultivation than with mouldboard ploughing.
However, other studies have shown no or inconsistent effects of tillage
intensity (Hooker et al., 2008; Regina & Alakukku, 2010; Hansen et al., 2010).
3.9 Catch crops
Keeping the soil covered by growing a catch crop between two main crops,
taking up mineralised N during autumn, helps keep SMN low and is an
effective measure to reduce N leaching (Askegaard & Eriksen, 2008;
Constantin et al., 2010). Time of incorporation can be an important
management tool for N (Thorup-Kristensen et al., 2003).
The most common practice in Sweden is to establish the catch crop by
undersowing in spring barley and to incorporate it into the soil in late autumn
or spring. Under Scandinavian conditions, somewhat varying results have been
found regarding the influence of incorporation time on N leaching and N
availability in the soil for the next crop (Hansen & Djurhuus, 1997;
Torstensson & Aronsson, 2000; Thorup-Kristensen & Dresbøll, 2010).
However, in general delaying incorporation seems to decrease N leaching,
whereas incorporation too late in spring may have negative effects on N
availability for the main crop (Thorup-Kristensen et al., 2003). The actual
dates for incorporation of different catch crop species in Sweden are
determined by government regulations and vary between locations. Of interest
for the work in this thesis are the dates 10 and 20 October, when a grass catch
crop may be incorporated at the earliest in Västergötland and Halland county,
respectively (SJVFS, 2011:25).
21
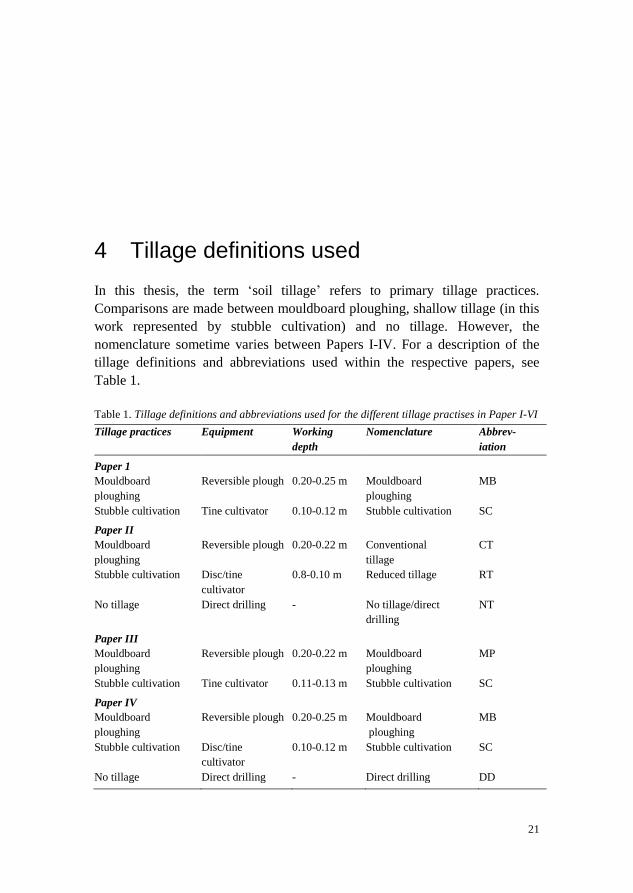
4 Tillage definitions used
In this thesis, the term ‘soil tillage’ refers to primary tillage practices.
Comparisons are made between mouldboard ploughing, shallow tillage (in this
work represented by stubble cultivation) and no tillage. However, the
nomenclature sometime varies between Papers I-IV. For a description of the
tillage definitions and abbreviations used within the respective papers, see
Table 1.
Table 1. Tillage definitions and abbreviations used for the different tillage practises in Paper I-VI
Tillage practices Equipment Working
depth
Nomenclature Abbrev-
iation
Paper 1
Mouldboard
ploughing
Reversible plough 0.20-0.25 m Mouldboard
ploughing
MB
Stubble cultivation Tine cultivator 0.10-0.12 m Stubble cultivation SC
Paper II
Mouldboard
ploughing
Reversible plough 0.20-0.22 m Conventional
tillage
CT
Stubble cultivation Disc/tine
cultivator
0.8-0.10 m Reduced tillage RT
No tillage Direct drilling - No tillage/direct
drilling
NT
Paper III
Mouldboard
ploughing
Reversible plough 0.20-0.22 m Mouldboard
ploughing
MP
Stubble cultivation Tine cultivator 0.11-0.13 m Stubble cultivation SC
Paper IV
Mouldboard
ploughing
Reversible plough 0.20-0.25 m Mouldboard
ploughing
MB
Stubble cultivation Disc/tine
cultivator
0.10-0.12 m Stubble cultivation SC
No tillage Direct drilling - Direct drilling DD

22
23
5 Materials and methods
The studies presented in Papers I-IV were restricted to mineral soils and to
agricultural systems without animal manure.
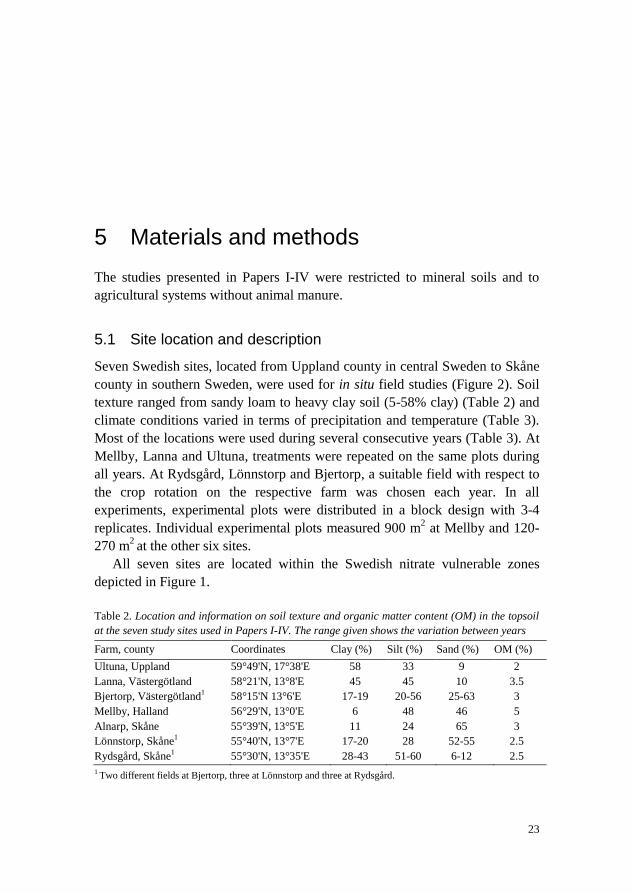
5.1 Site location and description
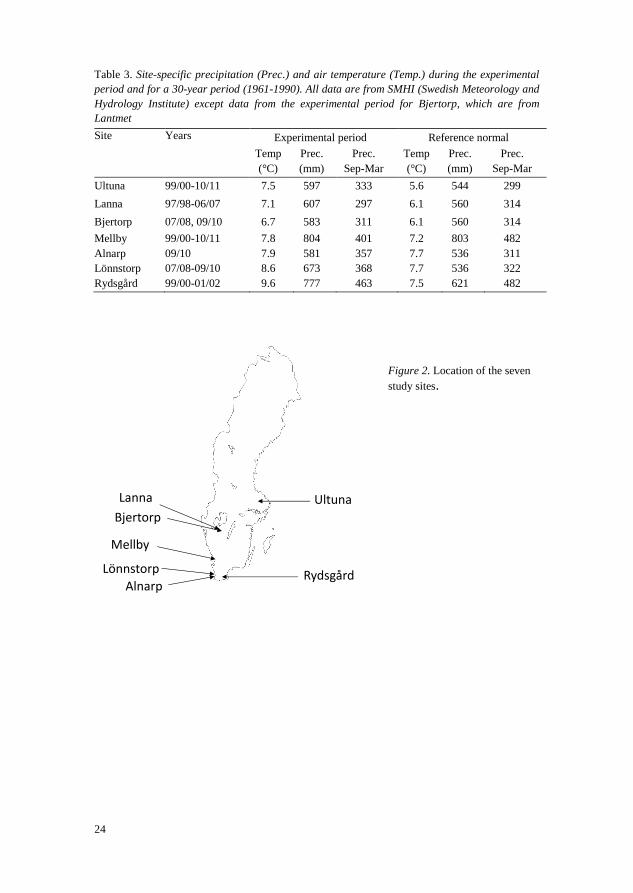
Seven Swedish sites, located from Uppland county in central Sweden to Skåne
county in southern Sweden, were used for in situ field studies (Figure 2). Soil
texture ranged from sandy loam to heavy clay soil (5-58% clay) (Table 2) and
climate conditions varied in terms of precipitation and temperature (Table 3).
Most of the locations were used during several consecutive years (Table 3). At
Mellby, Lanna and Ultuna, treatments were repeated on the same plots during
all years. At Rydsgård, Lönnstorp and Bjertorp, a suitable field with respect to
the crop rotation on the respective farm was chosen each year. In all
experiments, experimental plots were distributed in a block design with 3-4
replicates. Individual experimental plots measured 900 m2 at Mellby and 120-
270 m2 at the other six sites.
All seven sites are located within the Swedish nitrate vulnerable zones
depicted in Figure 1.
Table 2. Location and information on soil texture and organic matter content (OM) in the topsoil
at the seven study sites used in Papers I-IV. The range given shows the variation between years
Farm, county Coordinates Clay (%) Silt (%) Sand (%) OM (%)
Ultuna, Uppland 59°49'N, 17°38'E 58 33 9 2
Lanna, Västergötland 58°21'N, 13°8'E 45 45 10 3.5
Bjertorp, Västergötland1 58°15'N 13°6'E 17-19 20-56 25-63 3
Mellby, Halland 56°29'N, 13°0'E 6 48 46 5
Alnarp, Skåne 55°39'N, 13°5'E 11 24 65 3
Lönnstorp, Skåne1 55°40'N, 13°7'E 17-20 28 52-55 2.5
Rydsgård, Skåne1 55°30'N, 13°35'E 28-43 51-60 6-12 2.5
1 Two different fields at Bjertorp, three at Lönnstorp and three at Rydsgård.
24
Table 3. Site-specific precipitation (Prec.) and air temperature (Temp.) during the experimental
period and for a 30-year period (1961-1990). All data are from SMHI (Swedish Meteorology and
Hydrology Institute) except data from the experimental period for Bjertorp, which are from
Lantmet
Site Years Experimental period Reference normal
Temp
(°C)
Prec.
(mm)
Prec.
Sep-Mar
Temp
(°C)
Prec.
(mm)
Prec.
Sep-Mar
Ultuna 99/00-10/11 7.5 597 333 5.6 544 299
Lanna 97/98-06/07 7.1 607 297 6.1 560 314
Bjertorp 07/08, 09/10 6.7 583 311 6.1 560 314
Mellby 99/00-10/11 7.8 804 401 7.2 803 482
Alnarp 09/10 7.9 581 357 7.7 536 311
Lönnstorp 07/08-09/10 8.6 673 368 7.7 536 322
Rydsgård 99/00-01/02 9.6 777 463 7.5 621 482
Figure 2. Location of the seven
study sites.
Ultuna
Rydsgård
Bjertorp
Lanna
Lönnstorp
Alnarp
Mellby
25
5.2 Study design
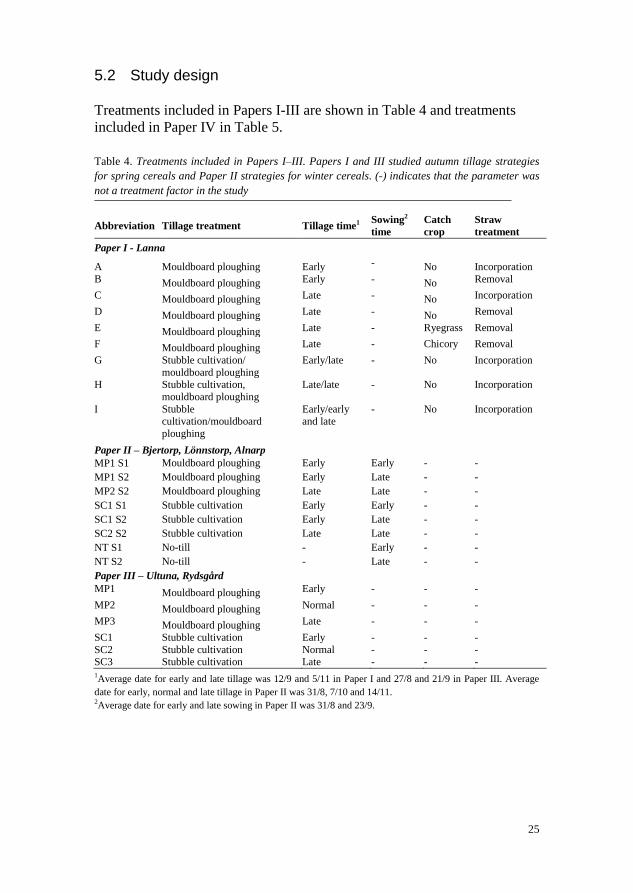
Treatments included in Papers I-III are shown in Table 4 and treatments
included in Paper IV in Table 5.
Table 4. Treatments included in Papers I–III. Papers I and III studied autumn tillage strategies
for spring cereals and Paper II strategies for winter cereals. (-) indicates that the parameter was
not a treatment factor in the study
Abbreviation Tillage treatment Tillage time1 Sowing2
time
Catch
crop
Straw
treatment
Paper I - Lanna
A Mouldboard ploughing Early - No Incorporation
B Mouldboard ploughing Early - No Removal
C Mouldboard ploughing Late - No Incorporation
D Mouldboard ploughing Late - No Removal
E Mouldboard ploughing Late - Ryegrass Removal
F Mouldboard ploughing Late - Chicory Removal
G Stubble cultivation/
mouldboard ploughing
Early/late - No Incorporation
H Stubble cultivation,
mouldboard ploughing
Late/late - No Incorporation
I Stubble
cultivation/mouldboard
ploughing
Early/early
and late
- No Incorporation
Paper II – Bjertorp, Lönnstorp, Alnarp
MP1 S1 Mouldboard ploughing Early Early - -
MP1 S2 Mouldboard ploughing Early Late - -
MP2 S2 Mouldboard ploughing Late Late - -
SC1 S1 Stubble cultivation Early Early - -
SC1 S2 Stubble cultivation Early Late - -
SC2 S2 Stubble cultivation Late Late - -
NT S1 No-till - Early - -
NT S2 No-till - Late - -
Paper III – Ultuna, Rydsgård
MP1 Mouldboard ploughing Early - - -
MP2 Mouldboard ploughing Normal - - -
MP3 Mouldboard ploughing Late - - -
SC1 Stubble cultivation Early - - -
SC2 Stubble cultivation Normal - - - SC3 Stubble cultivation Late - - - 1Average date for early and late tillage was 12/9 and 5/11 in Paper I and 27/8 and 21/9 in Paper III. Average
date for early, normal and late tillage in Paper II was 31/8, 7/10 and 14/11. 2Average date for early and late sowing in Paper II was 31/8 and 23/9.
26
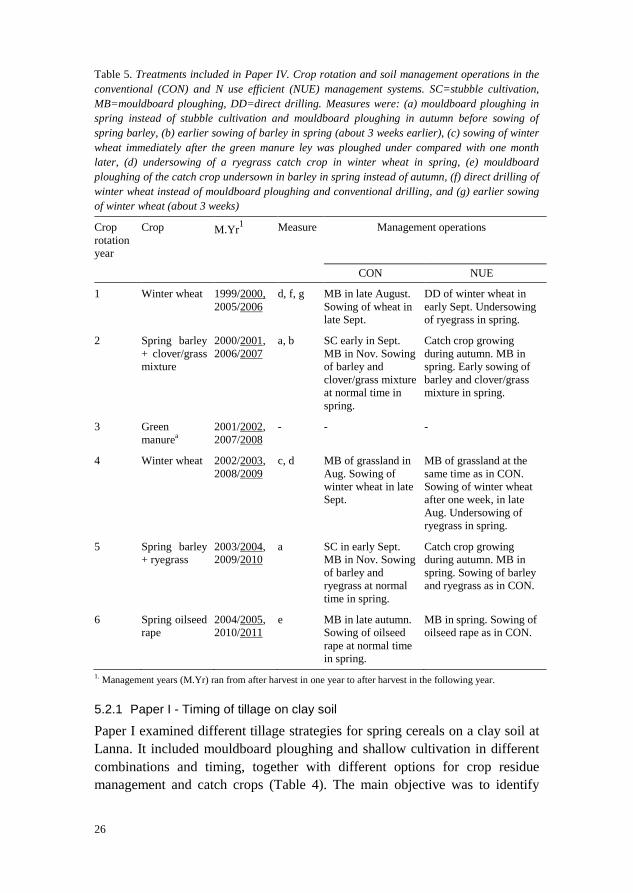
Table 5. Treatments included in Paper IV. Crop rotation and soil management operations in the
conventional (CON) and N use efficient (NUE) management systems. SC=stubble cultivation,
MB=mouldboard ploughing, DD=direct drilling. Measures were: (a) mouldboard ploughing in
spring instead of stubble cultivation and mouldboard ploughing in autumn before sowing of
spring barley, (b) earlier sowing of barley in spring (about 3 weeks earlier), (c) sowing of winter
wheat immediately after the green manure ley was ploughed under compared with one month
later, (d) undersowing of a ryegrass catch crop in winter wheat in spring, (e) mouldboard
ploughing of the catch crop undersown in barley in spring instead of autumn, (f) direct drilling of
winter wheat instead of mouldboard ploughing and conventional drilling, and (g) earlier sowing
of winter wheat (about 3 weeks)
Crop
rotation
year
Crop M.Yr1 Measure Management operations
CON NUE
1 Winter wheat 1999/2000,
2005/2006
d, f, g MB in late August.
Sowing of wheat in
late Sept.
DD of winter wheat in
early Sept. Undersowing
of ryegrass in spring.
2 Spring barley
+ clover/grass
mixture
2000/2001,
2006/2007
a, b SC early in Sept.
MB in Nov. Sowing
of barley and
clover/grass mixture
at normal time in
spring.
Catch crop growing
during autumn. MB in
spring. Early sowing of
barley and clover/grass
mixture in spring.
3 Green
manurea
2001/2002,
2007/2008
- - -
4 Winter wheat 2002/2003,
2008/2009
c, d MB of grassland in
Aug. Sowing of
winter wheat in late
Sept.
MB of grassland at the
same time as in CON.
Sowing of winter wheat
after one week, in late
Aug. Undersowing of
ryegrass in spring.
5 Spring barley
+ ryegrass
2003/2004,
2009/2010
a SC in early Sept.
MB in Nov. Sowing
of barley and
ryegrass at normal
time in spring.
Catch crop growing
during autumn. MB in
spring. Sowing of barley
and ryegrass as in CON.
6 Spring oilseed
rape
2004/2005,
2010/2011
e MB in late autumn.
Sowing of oilseed
rape at normal time
in spring.
MB in spring. Sowing of
oilseed rape as in CON.
1. Management years (M.Yr) ran from after harvest in one year to after harvest in the following year.
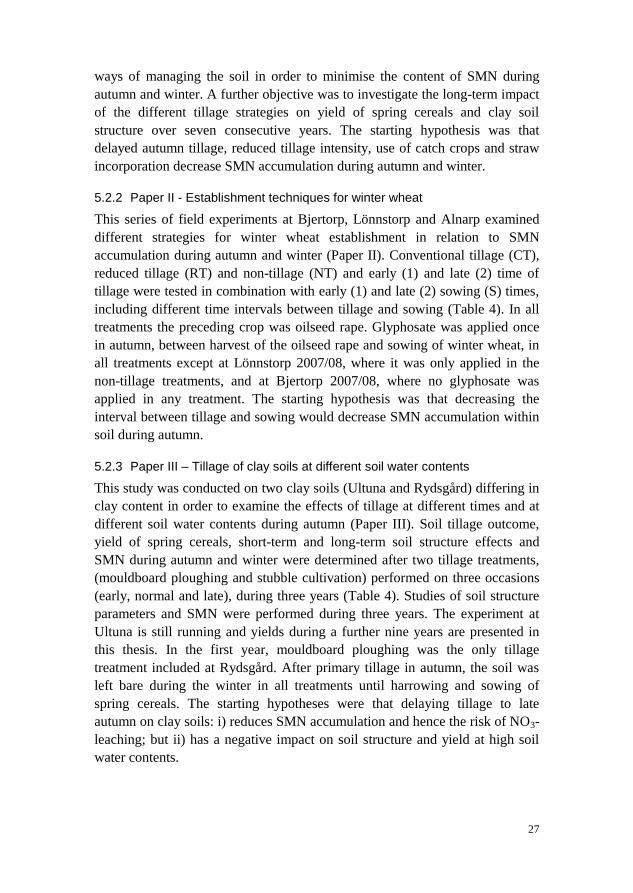
5.2.1 Paper I - Timing of tillage on clay soil
Paper I examined different tillage strategies for spring cereals on a clay soil at
Lanna. It included mouldboard ploughing and shallow cultivation in different
combinations and timing, together with different options for crop residue
management and catch crops (Table 4). The main objective was to identify
27
ways of managing the soil in order to minimise the content of SMN during
autumn and winter. A further objective was to investigate the long-term impact
of the different tillage strategies on yield of spring cereals and clay soil
structure over seven consecutive years. The starting hypothesis was that
delayed autumn tillage, reduced tillage intensity, use of catch crops and straw
incorporation decrease SMN accumulation during autumn and winter.
5.2.2 Paper II - Establishment techniques for winter wheat
This series of field experiments at Bjertorp, Lönnstorp and Alnarp examined
different strategies for winter wheat establishment in relation to SMN
accumulation during autumn and winter (Paper II). Conventional tillage (CT),
reduced tillage (RT) and non-tillage (NT) and early (1) and late (2) time of
tillage were tested in combination with early (1) and late (2) sowing (S) times,
including different time intervals between tillage and sowing (Table 4). In all
treatments the preceding crop was oilseed rape. Glyphosate was applied once
in autumn, between harvest of the oilseed rape and sowing of winter wheat, in
all treatments except at Lönnstorp 2007/08, where it was only applied in the
non-tillage treatments, and at Bjertorp 2007/08, where no glyphosate was
applied in any treatment. The starting hypothesis was that decreasing the
interval between tillage and sowing would decrease SMN accumulation within
soil during autumn.
5.2.3 Paper III – Tillage of clay soils at different soil water contents
This study was conducted on two clay soils (Ultuna and Rydsgård) differing in
clay content in order to examine the effects of tillage at different times and at
different soil water contents during autumn (Paper III). Soil tillage outcome,
yield of spring cereals, short-term and long-term soil structure effects and
SMN during autumn and winter were determined after two tillage treatments,
(mouldboard ploughing and stubble cultivation) performed on three occasions
(early, normal and late), during three years (Table 4). Studies of soil structure
parameters and SMN were performed during three years. The experiment at
Ultuna is still running and yields during a further nine years are presented in
this thesis. In the first year, mouldboard ploughing was the only tillage
treatment included at Rydsgård. After primary tillage in autumn, the soil was
left bare during the winter in all treatments until harrowing and sowing of
spring cereals. The starting hypotheses were that delaying tillage to late
autumn on clay soils: i) reduces SMN accumulation and hence the risk of NO3-
leaching; but ii) has a negative impact on soil structure and yield at high soil
water contents.
28
5.2.4 Paper IV – N use efficient management within a crop rotation
Paper IV examined the effects of introducing several measures (relating to soil
tillage and crop management) aimed at reducing N losses to water in a crop
rotation with respect to SMN accumulation, N leaching and crop production. A
conventional farming system, using conventional methods for the region at the
time when the project started, (CON), was compared with an N use efficient
system (NUE) where measures for reduced N leaching were combined based
on achieving good synchrony between mineralisation of crop residues and
SMN and crop demand for N (Table 5). The study was conducted in a six-year
crop rotation running for two cycles (12 years in total) in a field with
separately tile-drained plots at Mellby in south-west Sweden. The same six-
year crop rotation was used in the two systems compared, while times and
methods of soil tillage, sowing and use of catch crops differed (Table 5).
5.2.5 General information
The crops grown were spring wheat (Triticum aestivum L.), oats (Avena sativa
L.) and barley (Hordeum vulgare L.) in Papers I and III, winter wheat
(Triticum aestivum L.) in Paper II and winter spring barley, oilseed rape and
green manure ley in Paper IV. Fertiliser was applied in all experiments based
on expected yields and with no differences between treatments. Pesticides were
applied according to requirements and local recommendations. No herbicide
was used between harvest and the first soil tillage operation in autumn except
in Paper II, where glyphosate was used before sowing of winter wheat
throughout the study except at Bjertorp 2007/08 and the no-till treatment at
Lönnstorp 2007/08. This proved to be of major importance for the results. For
exact dates of tillage operations, sowing dates and fertilisation, see Papers I-IV.
5.3 Measurements
5.3.1 An overview of crop and soil sampling and measurements
A number of measurements of the plant material were made. As production is
the ultimate objective in managing agricultural soils, yield levels were recorded
in all experiments. Total N content in plant material (main crops, catch crops
and weeds) was determined in several of the studies to obtain knowledge about
the proportion of N moving from the soil and into the plants.
For a given soil, N leaching is related to the amount of SMN accumulated
within the soil profile during periods with a precipitation surplus. Measuring
the amount of SMN during autumn and winter then gives an indication of the
risk of N being leached. Measurements of SMN on several occasions during
autumn, winter and spring were therefore made in all studies included in
29
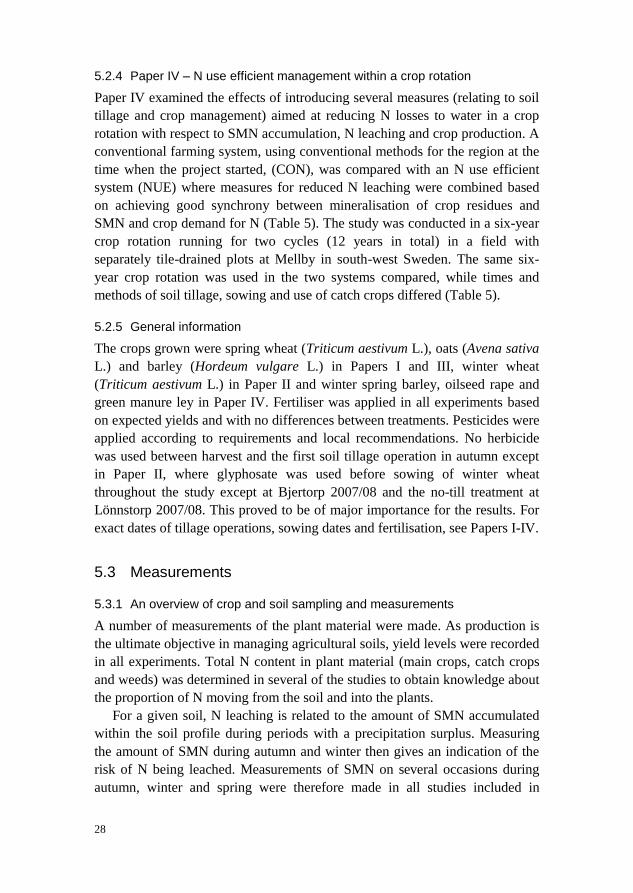
Papers I-IV. When comparing different treatments, quantifying SMN provides
a good relative estimate of the N leaching risk and facilitates studies in many
different locations, as it does not require permanent installations in field as do
sampling of drainage water and to some extent the use of suction cups. At the
sandy loam soil at Mellby, differences in SMN between the treatments were
correlated with differences in leaching losses of NO3-N (R2=0.87; Figure 3).
A more direct indication of the amount of N lost from a field by leaching
can obviously be obtained by measuring the N concentration in drainage water
together with quantification of drainage amount. This was done in Paper IV.
In order to quantify any possible effects on clay soil structure from tillage
late in autumn at high soil water contents, a number of soil physical
measurements were made in the clay soils in Papers I (Lanna) and III
(Rydsgård and Ultuna). Properties determined were soil bulk density (SBD),
aggregate size distribution after tillage in autumn and in the seedbed in spring,
water infiltration rate, water-holding capacity, water content in the seedbed in
spring and aggregate strength of wet and dry aggregates.
5.3.2 Crop analyses
Grain yield was determined by plot-wise sampling with a combine harvester at
harvest in each year. The grain was analysed for N by near infrared
transmission spectroscopy (InfratecTM1241 GrainAnalyzer).
For determination of the N content in aboveground biomass during autumn,
green material (catch crops, weeds and winter wheat) was sampled once or
several times during autumn. The plant material was sampled by cutting at the
soil surface in 3-4 randomly located frames, 0.5 m by 0.5 m, in each plot. The
Figure 3. Relative difference
between two tillage systems
(NUE/CON) in SMN (annual mean
from measured values) plotted
against relative difference between
the same systems in annual amount
of leached NO3-N during the
corresponding 12 years.
30
samples from the frames were pooled and analysed plot-wise. The plant
material was dried at 55°C, weighed and milled. Total N content was
determined with a LECO® CNS-2000 element analyser. (Papers I and IV)
For determination of the grain/straw ratio in the main crop, grain and straw
were sampled and analysed separately for N content at harvest. The ratio was
then used together with grain yield measured by combine harvester for
calculations of the N uptake in aboveground parts of the main crop. Sampling
and analysis techniques were as described above (Paper I).
In order to quantify mineralisation of N from soil organic matter, non-
fertilised (0N) subplots were used. For determination of the plant uptake of N
during the growing season in the non-fertilised (0N) subplots, the main crop
(grain and straw) together with all green material such as weeds and volunteer
plants were sampled in August at late milk/early dough ripening stage, BBCH
80 (Lancashire et al., 1991). Sampling and analysis techniques were as
described above (Paper I).
5.3.3 Nitrogen in drainage water
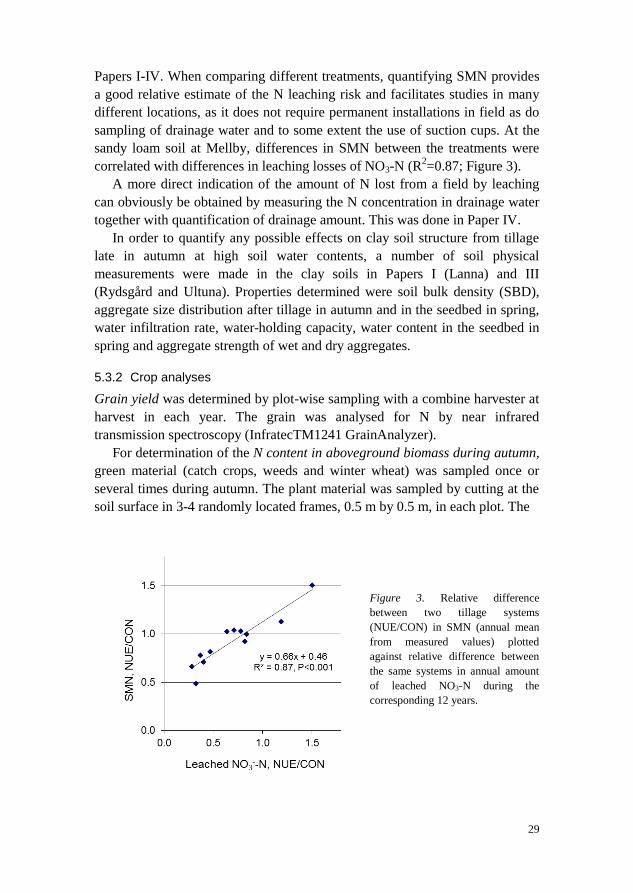
At Mellby in Halland, six experimental plots measuring 30 m x 30 m were
separately tile-drained, each plot with five drainage pipes at 6.8 m spacing and
0.9 m depth (Figure 4). To prevent lateral flow of water into and out of the
plots, they were surrounded by drainage pipes located 1.5 m from the border
and at a depth of 0.9 m. Drainage water collected from the plots through the
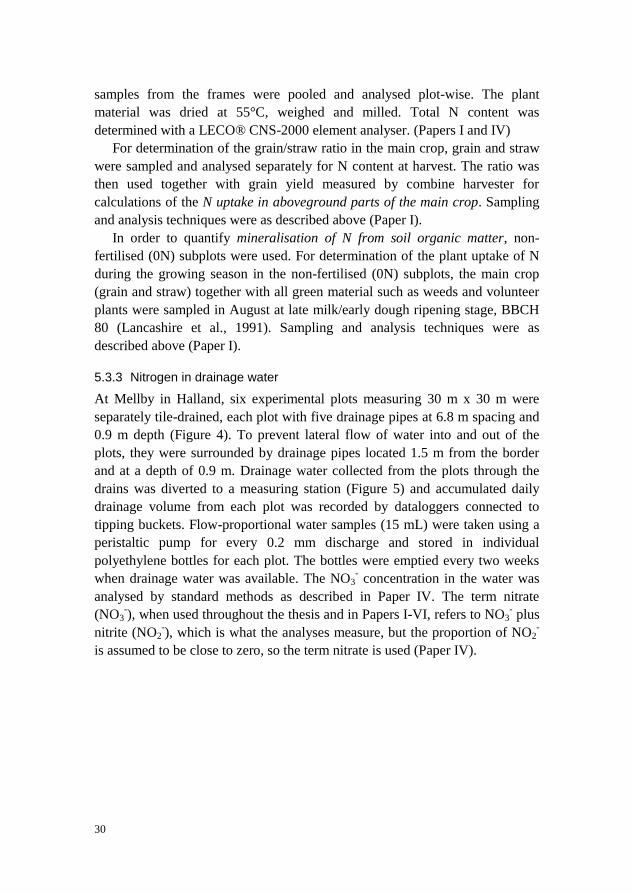
drains was diverted to a measuring station (Figure 5) and accumulated daily
drainage volume from each plot was recorded by dataloggers connected to
tipping buckets. Flow-proportional water samples (15 mL) were taken using a
peristaltic pump for every 0.2 mm discharge and stored in individual
polyethylene bottles for each plot. The bottles were emptied every two weeks
when drainage water was available. The NO3- concentration in the water was
analysed by standard methods as described in Paper IV. The term nitrate
(NO3-), when used throughout the thesis and in Papers I-VI, refers to NO3
- plus
nitrite (NO2-), which is what the analyses measure, but the proportion of NO2
-
is assumed to be close to zero, so the term nitrate is used (Paper IV).
31
Figure 4. Mellby farm in Halland. Left: The crop sequence field trial (Paper IV) was located
within the six experimental plots marked in red. The black arrow indicates the measuring station
for drainage water. Photo: Rural Economy and Agricultural Society of Halland. Right: Drainage
layout within the experimental plots.
Figure 5. Measuring station for drainage water from the experimental field at Mellby in Halland,
with tipping buckets for measurement of draining volumes (middle) and pumps and plastic flasks
for collection of flow-proportional water samples (right). Photo: Åsa Myrbeck.
5.3.4 Soil N
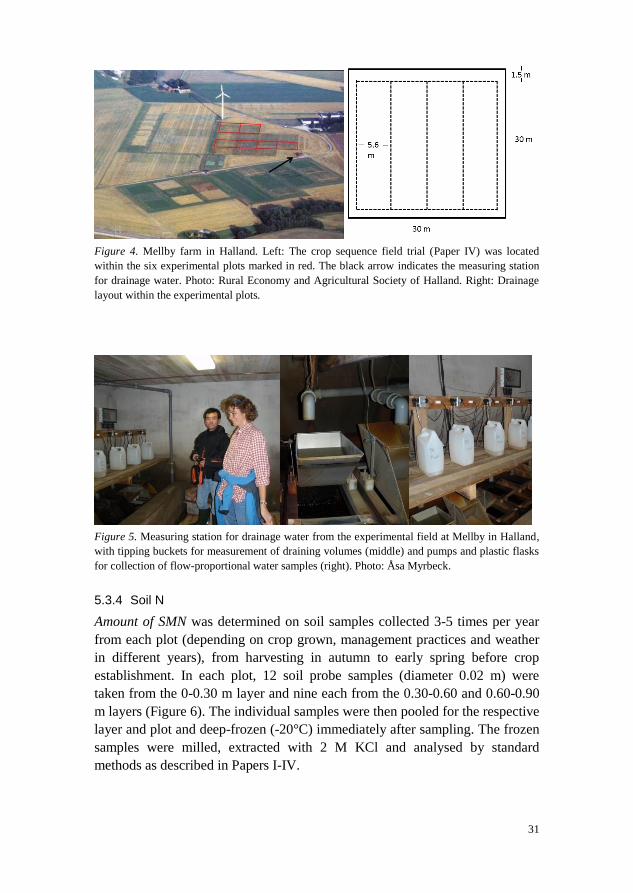
Amount of SMN was determined on soil samples collected 3-5 times per year
from each plot (depending on crop grown, management practices and weather
in different years), from harvesting in autumn to early spring before crop
establishment. In each plot, 12 soil probe samples (diameter 0.02 m) were
taken from the 0-0.30 m layer and nine each from the 0.30-0.60 and 0.60-0.90
m layers (Figure 6). The individual samples were then pooled for the respective
layer and plot and deep-frozen (-20°C) immediately after sampling. The frozen
samples were milled, extracted with 2 M KCl and analysed by standard
methods as described in Papers I-IV.
32
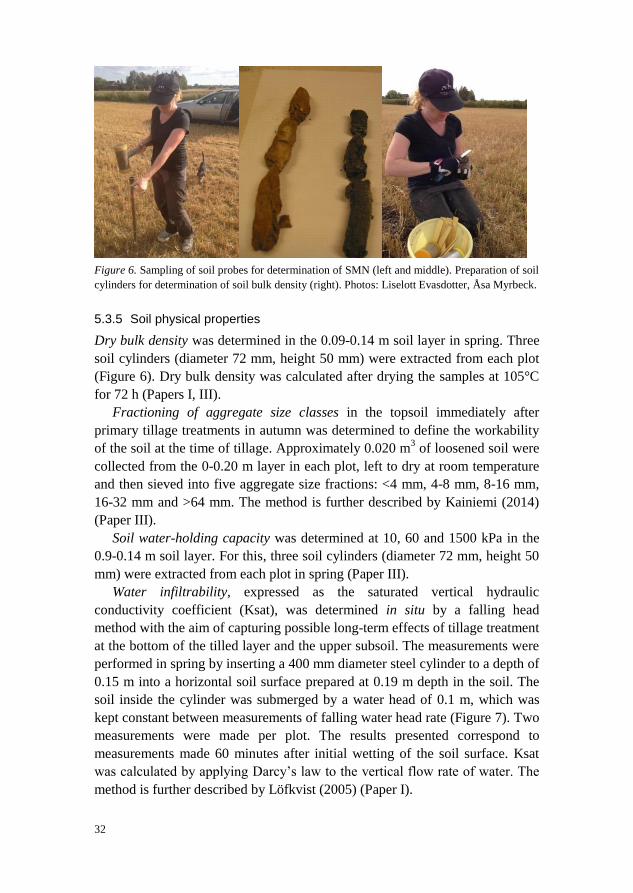
Figure 6. Sampling of soil probes for determination of SMN (left and middle). Preparation of soil
cylinders for determination of soil bulk density (right). Photos: Liselott Evasdotter, Åsa Myrbeck.
5.3.5 Soil physical properties
Dry bulk density was determined in the 0.09-0.14 m soil layer in spring. Three
soil cylinders (diameter 72 mm, height 50 mm) were extracted from each plot
(Figure 6). Dry bulk density was calculated after drying the samples at 105°C
for 72 h (Papers I, III).
Fractioning of aggregate size classes in the topsoil immediately after
primary tillage treatments in autumn was determined to define the workability
of the soil at the time of tillage. Approximately 0.020 m3 of loosened soil were
collected from the 0-0.20 m layer in each plot, left to dry at room temperature
and then sieved into five aggregate size fractions: <4 mm, 4-8 mm, 8-16 mm,
16-32 mm and >64 mm. The method is further described by Kainiemi (2014)
(Paper III).
Soil water-holding capacity was determined at 10, 60 and 1500 kPa in the
0.9-0.14 m soil layer. For this, three soil cylinders (diameter 72 mm, height 50
mm) were extracted from each plot in spring (Paper III).
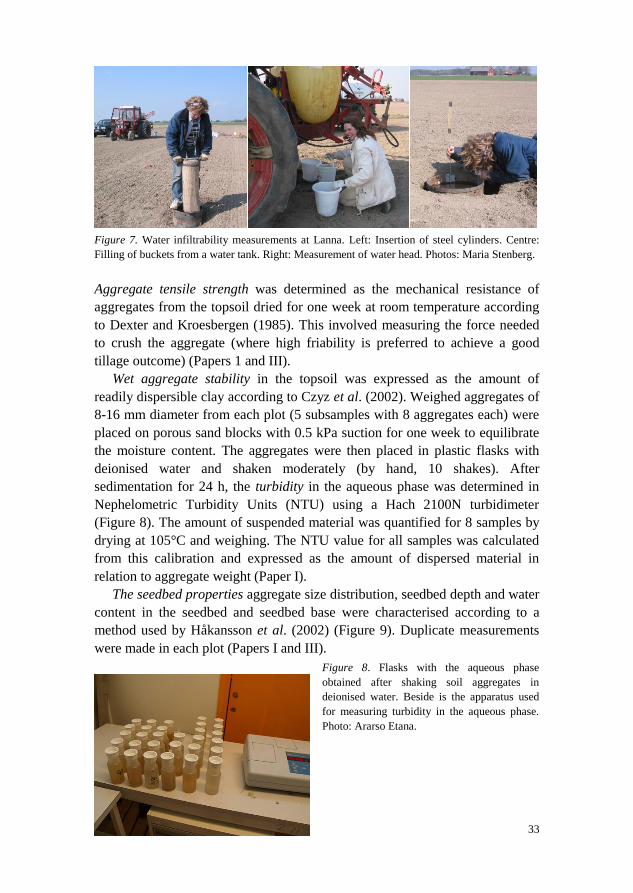
Water infiltrability, expressed as the saturated vertical hydraulic
conductivity coefficient (Ksat), was determined in situ by a falling head
method with the aim of capturing possible long-term effects of tillage treatment
at the bottom of the tilled layer and the upper subsoil. The measurements were
performed in spring by inserting a 400 mm diameter steel cylinder to a depth of
0.15 m into a horizontal soil surface prepared at 0.19 m depth in the soil. The
soil inside the cylinder was submerged by a water head of 0.1 m, which was
kept constant between measurements of falling water head rate (Figure 7). Two
measurements were made per plot. The results presented correspond to
measurements made 60 minutes after initial wetting of the soil surface. Ksat
was calculated by applying Darcy’s law to the vertical flow rate of water. The
method is further described by Löfkvist (2005) (Paper I).
33
Figure 7. Water infiltrability measurements at Lanna. Left: Insertion of steel cylinders. Centre:
Filling of buckets from a water tank. Right: Measurement of water head. Photos: Maria Stenberg.
Aggregate tensile strength was determined as the mechanical resistance of
aggregates from the topsoil dried for one week at room temperature according
to Dexter and Kroesbergen (1985). This involved measuring the force needed
to crush the aggregate (where high friability is preferred to achieve a good
tillage outcome) (Papers 1 and III).
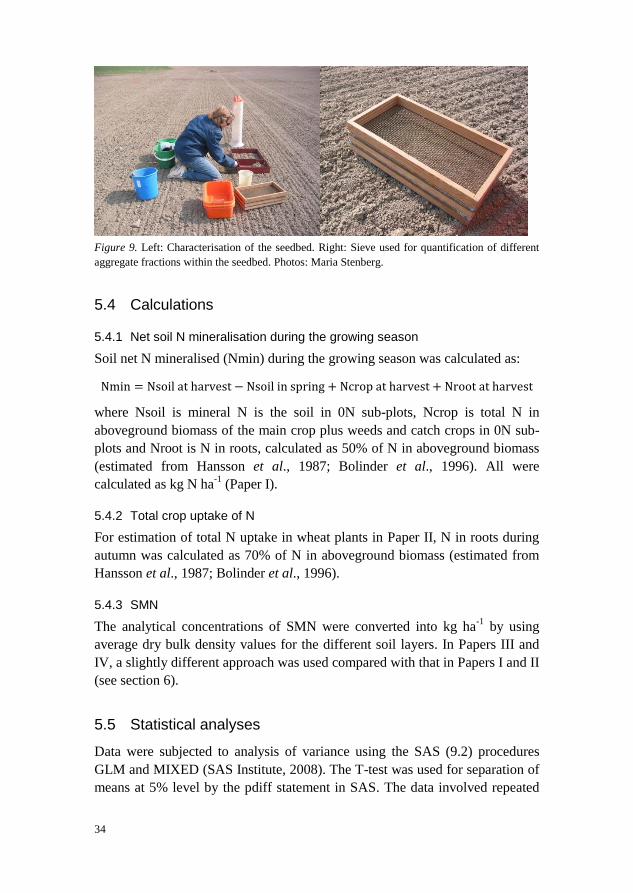
Wet aggregate stability in the topsoil was expressed as the amount of
readily dispersible clay according to Czyz et al. (2002). Weighed aggregates of
8-16 mm diameter from each plot (5 subsamples with 8 aggregates each) were
placed on porous sand blocks with 0.5 kPa suction for one week to equilibrate
the moisture content. The aggregates were then placed in plastic flasks with
deionised water and shaken moderately (by hand, 10 shakes). After
sedimentation for 24 h, the turbidity in the aqueous phase was determined in
Nephelometric Turbidity Units (NTU) using a Hach 2100N turbidimeter
(Figure 8). The amount of suspended material was quantified for 8 samples by
drying at 105°C and weighing. The NTU value for all samples was calculated
from this calibration and expressed as the amount of dispersed material in
relation to aggregate weight (Paper I).
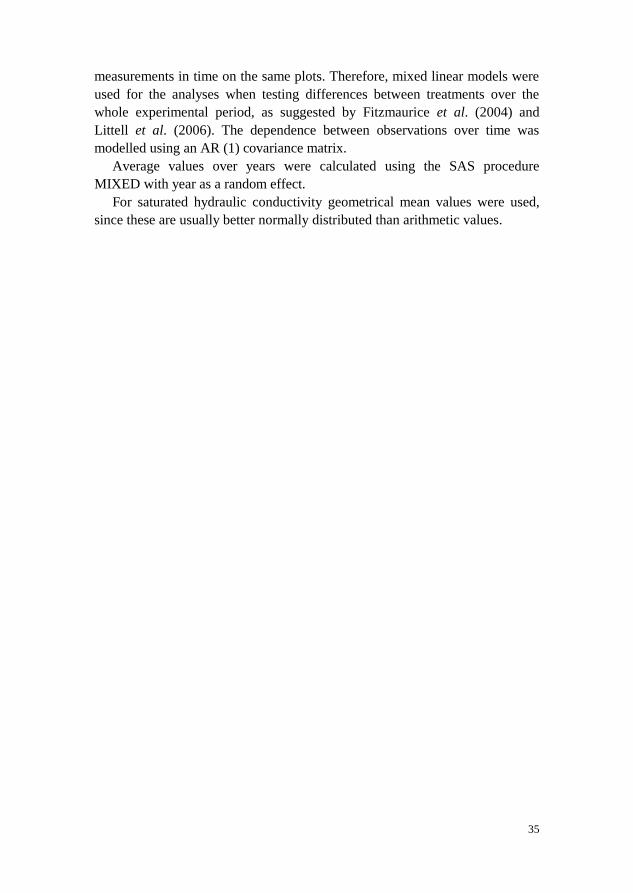
The seedbed properties aggregate size distribution, seedbed depth and water
content in the seedbed and seedbed base were characterised according to a
method used by Håkansson et al. (2002) (Figure 9). Duplicate measurements
were made in each plot (Papers I and III).
Figure 8. Flasks with the aqueous phase
obtained after shaking soil aggregates in
deionised water. Beside is the apparatus used
for measuring turbidity in the aqueous phase.
Photo: Ararso Etana.
34
Figure 9. Left: Characterisation of the seedbed. Right: Sieve used for quantification of different
aggregate fractions within the seedbed. Photos: Maria Stenberg.
5.4 Calculations
5.4.1 Net soil N mineralisation during the growing season
Soil net N mineralised (Nmin) during the growing season was calculated as:
where Nsoil is mineral N is the soil in 0N sub-plots, Ncrop is total N in
aboveground biomass of the main crop plus weeds and catch crops in 0N sub-
plots and Nroot is N in roots, calculated as 50% of N in aboveground biomass
(estimated from Hansson et al., 1987; Bolinder et al., 1996). All were
calculated as kg N ha-1
(Paper I).
5.4.2 Total crop uptake of N
For estimation of total N uptake in wheat plants in Paper II, N in roots during
autumn was calculated as 70% of N in aboveground biomass (estimated from
Hansson et al., 1987; Bolinder et al., 1996).
5.4.3 SMN
The analytical concentrations of SMN were converted into kg ha-1
by using
average dry bulk density values for the different soil layers. In Papers III and
IV, a slightly different approach was used compared with that in Papers I and II
(see section 6).
5.5 Statistical analyses
Data were subjected to analysis of variance using the SAS (9.2) procedures
GLM and MIXED (SAS Institute, 2008). The T-test was used for separation of
means at 5% level by the pdiff statement in SAS. The data involved repeated
35
measurements in time on the same plots. Therefore, mixed linear models were
used for the analyses when testing differences between treatments over the
whole experimental period, as suggested by Fitzmaurice et al. (2004) and
Littell et al. (2006). The dependence between observations over time was
modelled using an AR (1) covariance matrix.
Average values over years were calculated using the SAS procedure
MIXED with year as a random effect.
For saturated hydraulic conductivity geometrical mean values were used,
since these are usually better normally distributed than arithmetic values.

36
37
6 Aspects of soil N sampling
6.1 Concentration and mass per unit area
The concentration of e.g. C or N can easily be determined from a soil sample in
the laboratory. However, comparing concentrations and transforming
concentrations into mass per unit area is a problem in research involving
different tillage methods, since tillage loosens the soil, hence altering the SBD
(Stockfisch, 1999). In this thesis, soil was sampled before tillage from three
layers, 0-0.30 m, 0.30-0.60 m and 0.60-0.90 m. After tillage, the same plots
were sampled again to the same depths. As the topsoil was loosened, the
surface height was increased and the sampling cone did not reach the same soil
layer as before tillage (Figure 10). Hence concentrations were not measured on
exactly the same soil layers as before tillage. When estimating mass per unit
area, using an uncorrected value for SBD in the sampled layers and not
adjusting for changes in depth will in most cases both lead to overestimation of
SMN in tilled compared with untilled soil, as SMN concentration usually
increases towards the soil surface.
To correctly compensate for this increase in soil height created by tillage
and adjust the depth from the soil surface to which sampling is made,
knowledge of the average increase is needed. Changes in soil height can be
estimated by sampling SBD in the tilled layer before and after tillage. New
SBD values then have to be determined for each sampling occasion, as the soil
tends to settle with time. The conventional way of determining SBD is by
extracting and weighing cylinders of known volume. Due to the generally great
spatial variation in SBD, a substantial number of soil samples needs to be
collected, which is very time consuming. It is also a destructive method and
only a limited amount of cylinders can be sampled within a field experiment.
An alternative to sampling of SBD is to use general values on changes in soil
height by tillage from the somewhat limited literature on the subject.
38
Andersson and Håkansson (1996) and Arvidsson and Bölenius (2006)
determined the average increase in soil height created by different tillage
practices in Swedish soils by burying steel plates below ploughing depth as a
depth reference from which average soil height was measured mechanically
and by laser, respectively, in the two studies. Measurements showed that part
of the initial loosening created by tillage generally remained for only quite a
short period. Already about two weeks after tillage, less than half the initial soil
height increase remained. Thereafter the soil surface sank slowly for a further
couple of weeks, after which it remained more or less unchanged, for autumn
tillage throughout winter until seedbed preparation in spring. Values of
changes in soil surface height adapted from the abovementioned studies and
provided by Håkansson1
are presented in Table 6.
However, adjusting the sampling depth in the field may be complicated,
especially if many different types of tillage equipment are used. One option is
to make the adjustments after sampling by calculations, using general values
on changes in soil height. This may also be done on old data sampled without
corrections.
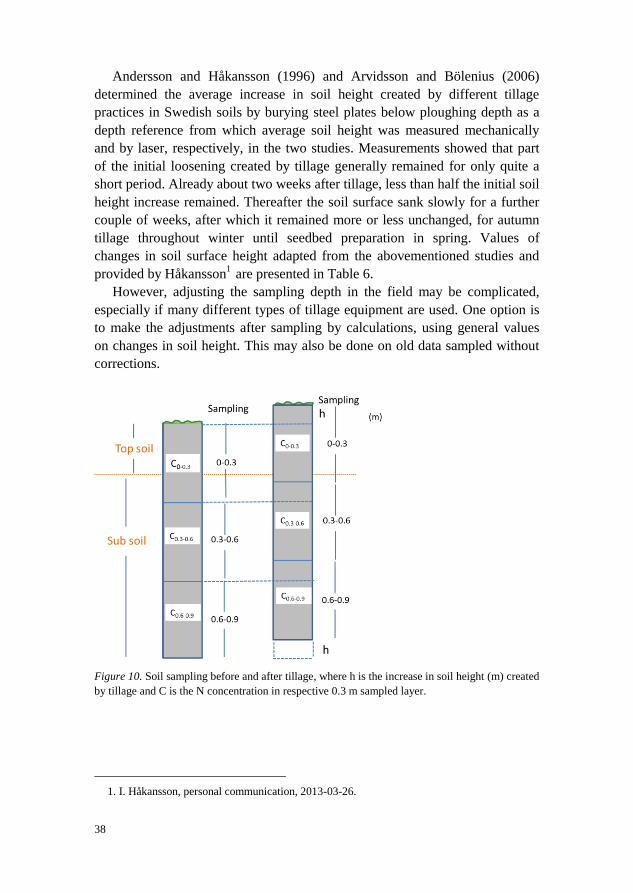
Figure 10. Soil sampling before and after tillage, where h is the increase in soil height (m) created
by tillage and C is the N concentration in respective 0.3 m sampled layer.
1. I. Håkansson, personal communication, 2013-03-26.
39
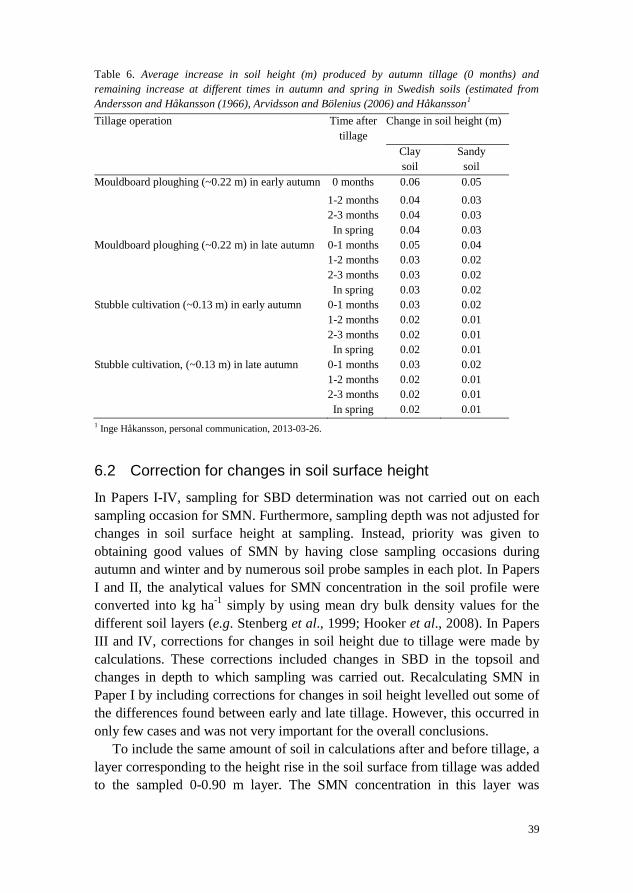
Table 6. Average increase in soil height (m) produced by autumn tillage (0 months) and
remaining increase at different times in autumn and spring in Swedish soils (estimated from
Andersson and Håkansson (1966), Arvidsson and Bölenius (2006) and Håkansson1
Tillage operation Time after
tillage
Change in soil height (m)
Clay
soil
Sandy
soil
Mouldboard ploughing (~0.22 m) in early autumn 0 months 0.06 0.05
1-2 months 0.04 0.03
2-3 months 0.04 0.03
In spring 0.04 0.03
Mouldboard ploughing (~0.22 m) in late autumn 0-1 months 0.05 0.04
1-2 months 0.03 0.02
2-3 months 0.03 0.02
In spring 0.03 0.02
Stubble cultivation (~0.13 m) in early autumn 0-1 months 0.03 0.02
1-2 months 0.02 0.01
2-3 months 0.02 0.01
In spring 0.02 0.01
Stubble cultivation, (~0.13 m) in late autumn 0-1 months 0.03 0.02
1-2 months 0.02 0.01
2-3 months 0.02 0.01
In spring 0.02 0.01
1 Inge Håkansson, personal communication, 2013-03-26.
6.2 Correction for changes in soil surface height
In Papers I-IV, sampling for SBD determination was not carried out on each
sampling occasion for SMN. Furthermore, sampling depth was not adjusted for
changes in soil surface height at sampling. Instead, priority was given to
obtaining good values of SMN by having close sampling occasions during
autumn and winter and by numerous soil probe samples in each plot. In Papers
I and II, the analytical values for SMN concentration in the soil profile were
converted into kg ha-1
simply by using mean dry bulk density values for the
different soil layers (e.g. Stenberg et al., 1999; Hooker et al., 2008). In Papers
III and IV, corrections for changes in soil height due to tillage were made by
calculations. These corrections included changes in SBD in the topsoil and
changes in depth to which sampling was carried out. Recalculating SMN in
Paper I by including corrections for changes in soil height levelled out some of
the differences found between early and late tillage. However, this occurred in
only few cases and was not very important for the overall conclusions.
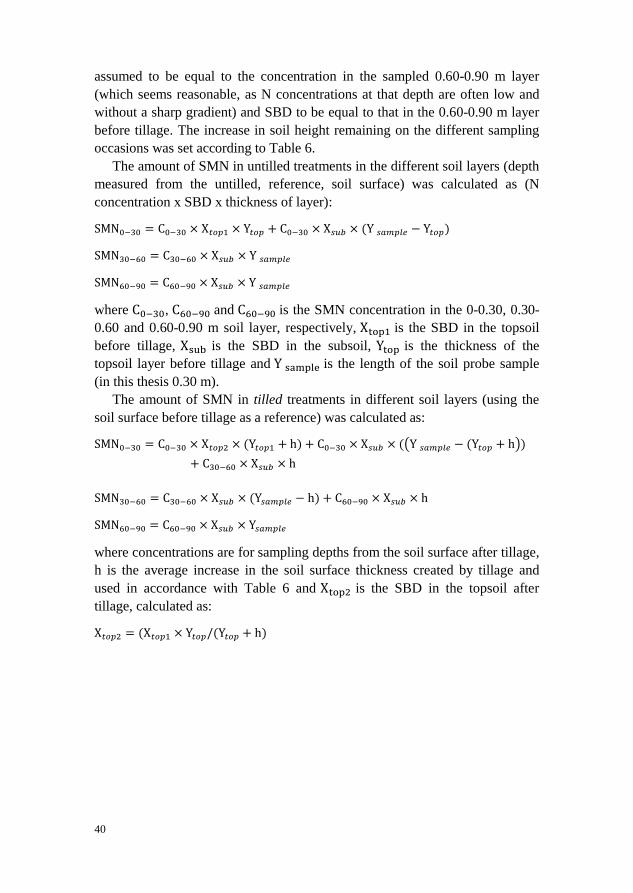
To include the same amount of soil in calculations after and before tillage, a
layer corresponding to the height rise in the soil surface from tillage was added
to the sampled 0-0.90 m layer. The SMN concentration in this layer was
40
assumed to be equal to the concentration in the sampled 0.60-0.90 m layer
(which seems reasonable, as N concentrations at that depth are often low and
without a sharp gradient) and SBD to be equal to that in the 0.60-0.90 m layer
before tillage. The increase in soil height remaining on the different sampling
occasions was set according to Table 6.
The amount of SMN in untilled treatments in the different soil layers (depth
measured from the untilled, reference, soil surface) was calculated as (N
concentration x SBD x thickness of layer):
where , and is the SMN concentration in the 0-0.30, 0.30-
0.60 and 0.60-0.90 m soil layer, respectively, is the SBD in the topsoil
before tillage, is the SBD in the subsoil, is the thickness of the
topsoil layer before tillage and is the length of the soil probe sample
(in this thesis 0.30 m).
The amount of SMN in tilled treatments in different soil layers (using the
soil surface before tillage as a reference) was calculated as:
( )
where concentrations are for sampling depths from the soil surface after tillage,
h is the average increase in the soil surface thickness created by tillage and
used in accordance with Table 6 and is the SBD in the topsoil after
tillage, calculated as:
41
7 Main results and discussion
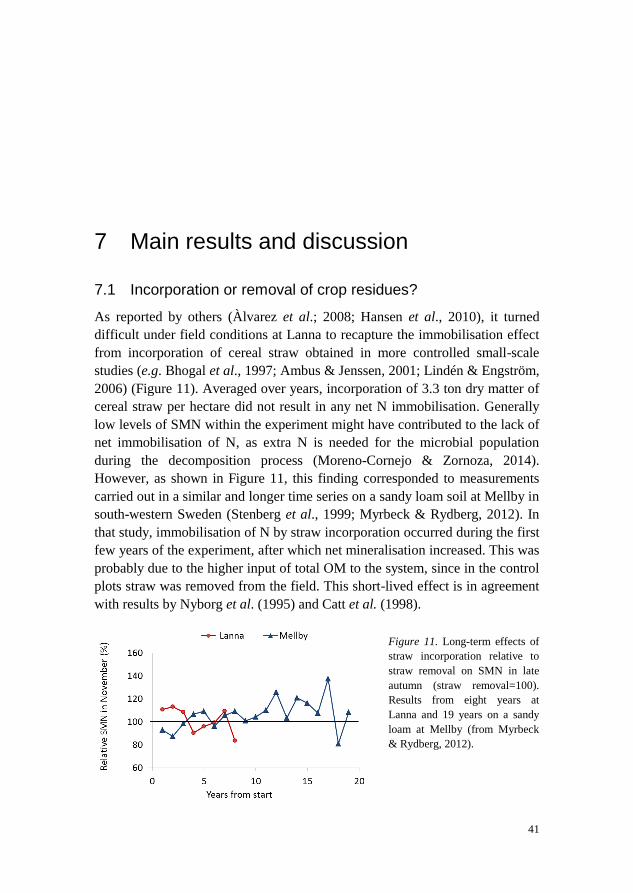
7.1 Incorporation or removal of crop residues?
As reported by others (Àlvarez et al.; 2008; Hansen et al., 2010), it turned
difficult under field conditions at Lanna to recapture the immobilisation effect
from incorporation of cereal straw obtained in more controlled small-scale
studies (e.g. Bhogal et al., 1997; Ambus & Jenssen, 2001; Lindén & Engström,
2006) (Figure 11). Averaged over years, incorporation of 3.3 ton dry matter of
cereal straw per hectare did not result in any net N immobilisation. Generally
low levels of SMN within the experiment might have contributed to the lack of
net immobilisation of N, as extra N is needed for the microbial population
during the decomposition process (Moreno-Cornejo & Zornoza, 2014).
However, as shown in Figure 11, this finding corresponded to measurements
carried out in a similar and longer time series on a sandy loam soil at Mellby in
south-western Sweden (Stenberg et al., 1999; Myrbeck & Rydberg, 2012). In
that study, immobilisation of N by straw incorporation occurred during the first
few years of the experiment, after which net mineralisation increased. This was
probably due to the higher input of total OM to the system, since in the control
plots straw was removed from the field. This short-lived effect is in agreement
with results by Nyborg et al. (1995) and Catt et al. (1998).
Figure 11. Long-term effects of
straw incorporation relative to
straw removal on SMN in late
autumn (straw removal=100).
Results from eight years at
Lanna and 19 years on a sandy
loam at Mellby (from Myrbeck
& Rydberg, 2012).
42
The inconsistency between results from field and laboratory experiments may
be explained by the typically larger straw particles in the field than in
laboratory experiments, as crop residue particle size has been shown to be of
great importance for the immobilisation process (Ambus & Jensen, 2001). In
addition, field conditions provide a less even distribution of the residues and
less soil-residue contact (Jin et al., 2008).
The possibility of achieving the desired effect might be better in soils high
in SMN and perhaps also in areas with higher temperatures than those in
Scandinavia (Wang et al., 2014).
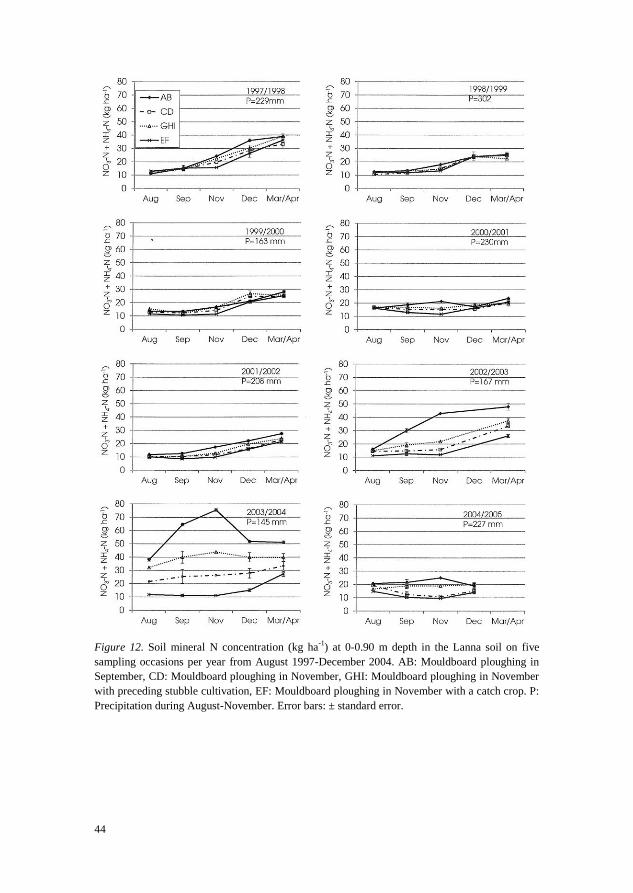
7.2 Timing of tillage for spring crops
Delaying primary tillage operations for spring cereals on the clay soils used in
this thesis (Ultuna, Lanna and Rydsgård) did not show the consistent reduction
in SMN expected from previous studies of SMN and/or N leaching on coarse-
textured soils (Hansen & Djurhuus, 1997; Känkänen et al., 1998; Stenberg et
al., 1999; Mitchell et al., 2000). In general, the soil profile contained somewhat
more SMN during autumn when tillage was carried out early rather than late in
autumn. However, the results varied between sites and between years at the
same site (Figures 12 and 13). The average difference at Lanna in November
and December was 14 and 6 kg ha-1
, respectively (Figure 12), mainly due to
large differences in 2002/2003, with crop failure. At Ultuna the effects on
SMN of different times of tillage were even smaller (Figure 13), while results
from the lighter clay soil at Rydsgård in one year showed increased levels of
SMN from early compared with late mouldboard ploughing (55 and 20 kg ha-1
respectively). This increase was of the same magnitude as previously measured
in light-textured soils in south-western Sweden (Stenberg et al., 1999;
Myrbeck & Rydberg, 2012). At Lanna, considering plant N uptake was similar
in both treatments during autumn (Paper I), more N seems to have been
mineralised with early rather than late tillage.
There are several possible explanations for the generally rather limited
effects of time of tillage on the two heavy clay soils Ultuna and Lanna. The
rate of SOM decomposition may be lower in clay soils than in more coarse-
textured soils, since biomass may adhere to the clay fraction, forming
complexes and microaggregates that protect SOM from degradation (Rovira &
Greacen, 1957; McInerney & Bolger, 1999). A likely contributing factor is
losses of N by anaerobic denitrification, which also explain some of the yearly
variations, as the denitrification process is very dynamic and highly dependent
on soil moisture content (Beare et al., 2009). The extent to which SMN reacted
to the different times of tillage at Lanna seemed to vary with precipitation
43
(Figure 12), with the most pronounced differences occurring during dry
autumns, when denitrification losses were probably small. For the Lanna soil,
the latter is also supported by a positive N balance in this experiment (as well
as in earlier studies in nearby fields at Lanna research station; Lindén et al.,
2006; Aronsson & Stenberg, 2010). This indicates that gaseous losses of N
may be an important pathway for N losses from this soil, and according to van
deer Salm et al. (2006) they can be greater than losses of N through leaching.
A comparison of SMN within the different soil layers at Lanna (Paper I)
showed very limited movement of SMN to deeper soil layers. Furthermore, in
the Lanna and Ultuna soils, the increase in SMN from late autumn/winter to
spring indicated that SMN accumulated during autumn was retained within the
profile during winter and was available for plant uptake during the following
growing season. Accordingly, the amounts of SMN reaching the drainage
system could be assumed to be relatively small. Several previous studies (e.g.
Koskiaho, 2002; Aronsson et al., 2007; Aronsson & Stenberg, 2010; Neumann
et al., 2011) have also reported generally low losses of N (2-15 kg N ha-1
depending on crop grown) through the drainage system in clay soils under
Nordic conditions. In contrast, at Rydsgård, where some of the SMN
accumulated throughout autumn was not recovered in spring, N must have
been lost by leaching and/or denitrification (Figure 13).
44
Figure 12. Soil mineral N concentration (kg ha
-1) at 0-0.90 m depth in the Lanna soil on five
sampling occasions per year from August 1997-December 2004. AB: Mouldboard ploughing in
September, CD: Mouldboard ploughing in November, GHI: Mouldboard ploughing in November
with preceding stubble cultivation, EF: Mouldboard ploughing in November with a catch crop. P:
Precipitation during August-November. Error bars: ± standard error.
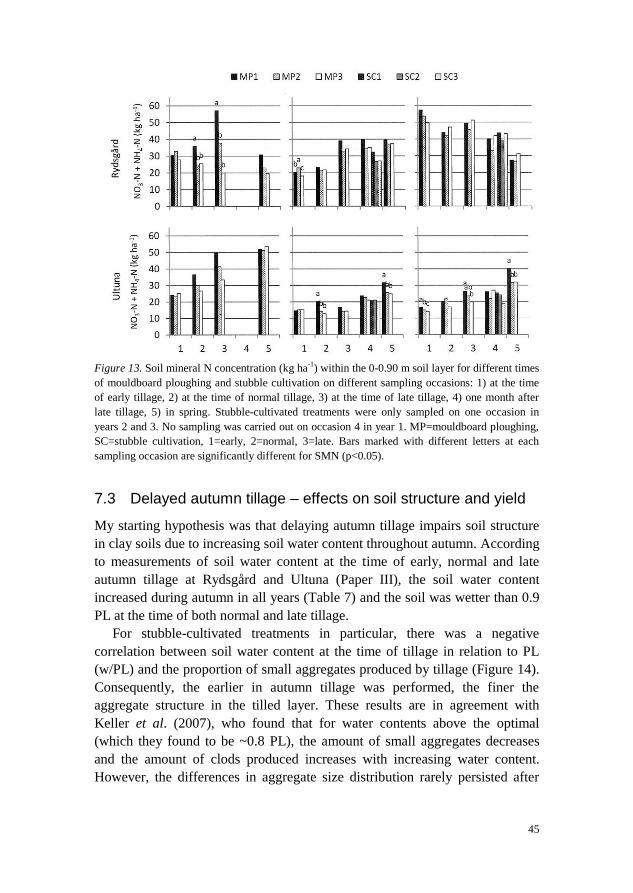
45
Figure 13. Soil mineral N concentration (kg ha
-1) within the 0-0.90 m soil layer for different times
of mouldboard ploughing and stubble cultivation on different sampling occasions: 1) at the time
of early tillage, 2) at the time of normal tillage, 3) at the time of late tillage, 4) one month after
late tillage, 5) in spring. Stubble-cultivated treatments were only sampled on one occasion in
years 2 and 3. No sampling was carried out on occasion 4 in year 1. MP=mouldboard ploughing,
SC=stubble cultivation, 1=early, 2=normal, 3=late. Bars marked with different letters at each
sampling occasion are significantly different for SMN (p<0.05).
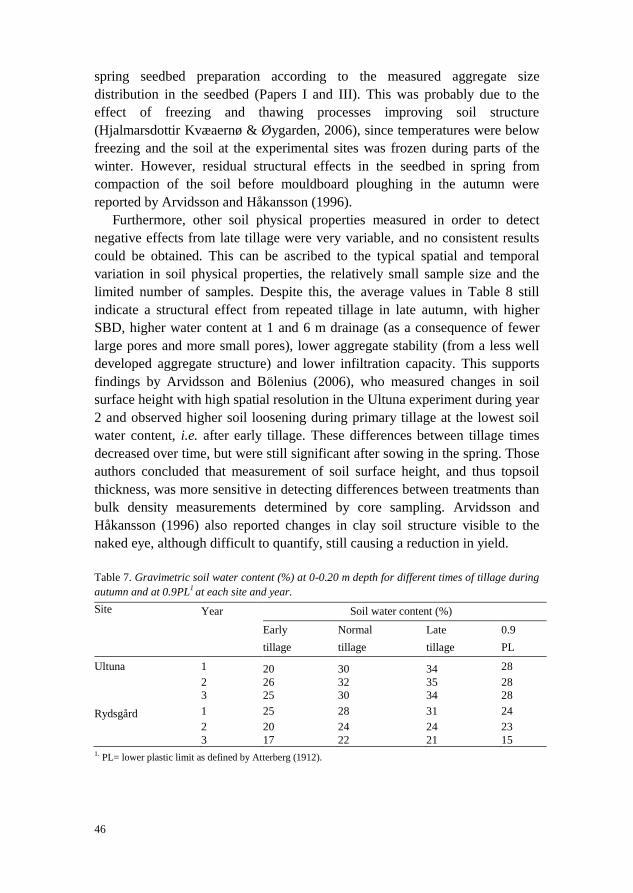
7.3 Delayed autumn tillage – effects on soil structure and yield
My starting hypothesis was that delaying autumn tillage impairs soil structure
in clay soils due to increasing soil water content throughout autumn. According
to measurements of soil water content at the time of early, normal and late
autumn tillage at Rydsgård and Ultuna (Paper III), the soil water content
increased during autumn in all years (Table 7) and the soil was wetter than 0.9
PL at the time of both normal and late tillage.
For stubble-cultivated treatments in particular, there was a negative
correlation between soil water content at the time of tillage in relation to PL
(w/PL) and the proportion of small aggregates produced by tillage (Figure 14).
Consequently, the earlier in autumn tillage was performed, the finer the
aggregate structure in the tilled layer. These results are in agreement with
Keller et al. (2007), who found that for water contents above the optimal
(which they found to be ~0.8 PL), the amount of small aggregates decreases
and the amount of clods produced increases with increasing water content.
However, the differences in aggregate size distribution rarely persisted after
46
spring seedbed preparation according to the measured aggregate size
distribution in the seedbed (Papers I and III). This was probably due to the
effect of freezing and thawing processes improving soil structure
(Hjalmarsdottir Kvæaernø & Øygarden, 2006), since temperatures were below
freezing and the soil at the experimental sites was frozen during parts of the
winter. However, residual structural effects in the seedbed in spring from
compaction of the soil before mouldboard ploughing in the autumn were
reported by Arvidsson and Håkansson (1996).
Furthermore, other soil physical properties measured in order to detect
negative effects from late tillage were very variable, and no consistent results
could be obtained. This can be ascribed to the typical spatial and temporal
variation in soil physical properties, the relatively small sample size and the
limited number of samples. Despite this, the average values in Table 8 still
indicate a structural effect from repeated tillage in late autumn, with higher
SBD, higher water content at 1 and 6 m drainage (as a consequence of fewer
large pores and more small pores), lower aggregate stability (from a less well
developed aggregate structure) and lower infiltration capacity. This supports
findings by Arvidsson and Bölenius (2006), who measured changes in soil
surface height with high spatial resolution in the Ultuna experiment during year
2 and observed higher soil loosening during primary tillage at the lowest soil
water content, i.e. after early tillage. These differences between tillage times
decreased over time, but were still significant after sowing in the spring. Those
authors concluded that measurement of soil surface height, and thus topsoil
thickness, was more sensitive in detecting differences between treatments than
bulk density measurements determined by core sampling. Arvidsson and
Håkansson (1996) also reported changes in clay soil structure visible to the
naked eye, although difficult to quantify, still causing a reduction in yield.
Table 7. Gravimetric soil water content (%) at 0-0.20 m depth for different times of tillage during
autumn and at 0.9PL1 at each site and year.
Site Year Soil water content (%)
Early
tillage
Normal
tillage
Late
tillage
0.9
PL
Ultuna 1 20 30 34 28
2 26 32 35 28
3 25 30 34 28
Rydsgård 1 25 28 31 24
2 20 24 24 23
3 17 22 21 15 1.
PL= lower plastic limit as defined by Atterberg (1912).
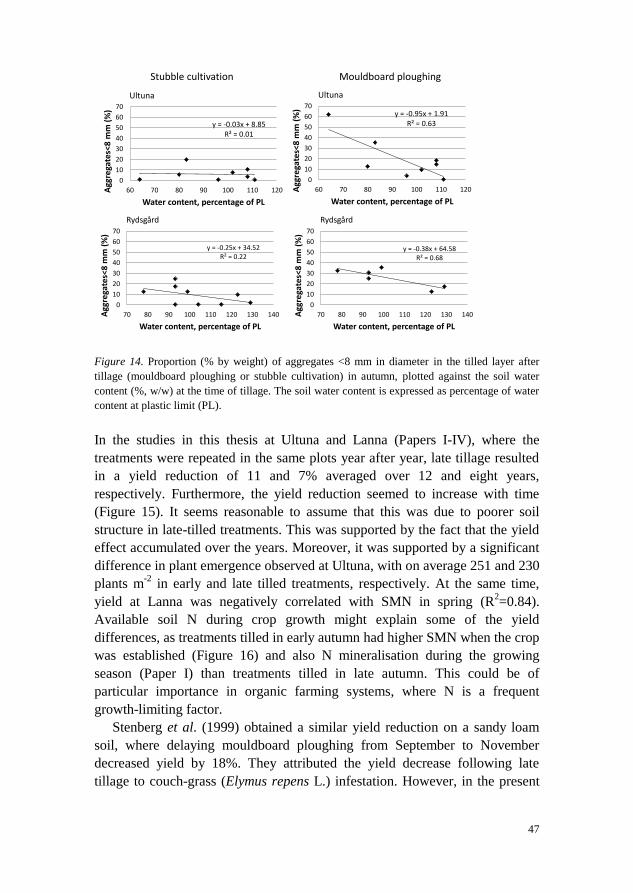
47
Figure 14. Proportion (% by weight) of aggregates <8 mm in diameter in the tilled layer after
tillage (mouldboard ploughing or stubble cultivation) in autumn, plotted against the soil water
content (%, w/w) at the time of tillage. The soil water content is expressed as percentage of water
content at plastic limit (PL).
In the studies in this thesis at Ultuna and Lanna (Papers I-IV), where the
treatments were repeated in the same plots year after year, late tillage resulted
in a yield reduction of 11 and 7% averaged over 12 and eight years,
respectively. Furthermore, the yield reduction seemed to increase with time
(Figure 15). It seems reasonable to assume that this was due to poorer soil
structure in late-tilled treatments. This was supported by the fact that the yield
effect accumulated over the years. Moreover, it was supported by a significant
difference in plant emergence observed at Ultuna, with on average 251 and 230
plants m-2
in early and late tilled treatments, respectively. At the same time,
yield at Lanna was negatively correlated with SMN in spring (R2=0.84).
Available soil N during crop growth might explain some of the yield
differences, as treatments tilled in early autumn had higher SMN when the crop
was established (Figure 16) and also N mineralisation during the growing
season (Paper I) than treatments tilled in late autumn. This could be of
particular importance in organic farming systems, where N is a frequent
growth-limiting factor.
Stenberg et al. (1999) obtained a similar yield reduction on a sandy loam
soil, where delaying mouldboard ploughing from September to November
decreased yield by 18%. They attributed the yield decrease following late
tillage to couch-grass (Elymus repens L.) infestation. However, in the present
y = -0.03x + 8.85R² = 0.01
0
10
20
30
40
50
60
70
60 70 80 90 100 110 120Agg
rega
tes<
8 m
m (
%)
Water content, percentage of PL
Ultuna
y = -0.95x + 1.91R² = 0.63
0
10
20
30
40
50
60
70
60 70 80 90 100 110 120Agg
rega
tes<
8 m
m (
%)
Water content, percentage of PL
Ultuna
y = -0.25x + 34.52R² = 0.22
0
10
20
30
40
50
60
70
70 80 90 100 110 120 130 140Agg
rega
tes<
8 m
m (
%)
Water content, percentage of PL
Rydsgård
y = -0.38x + 64.58R² = 0.68
0
10
20
30
40
50
60
70
70 80 90 100 110 120 130 140Agg
rega
tes<
8 m
m (
%)
Water content, percentage of PL
Rydsgård
Mouldboard ploughingStubble cultivation
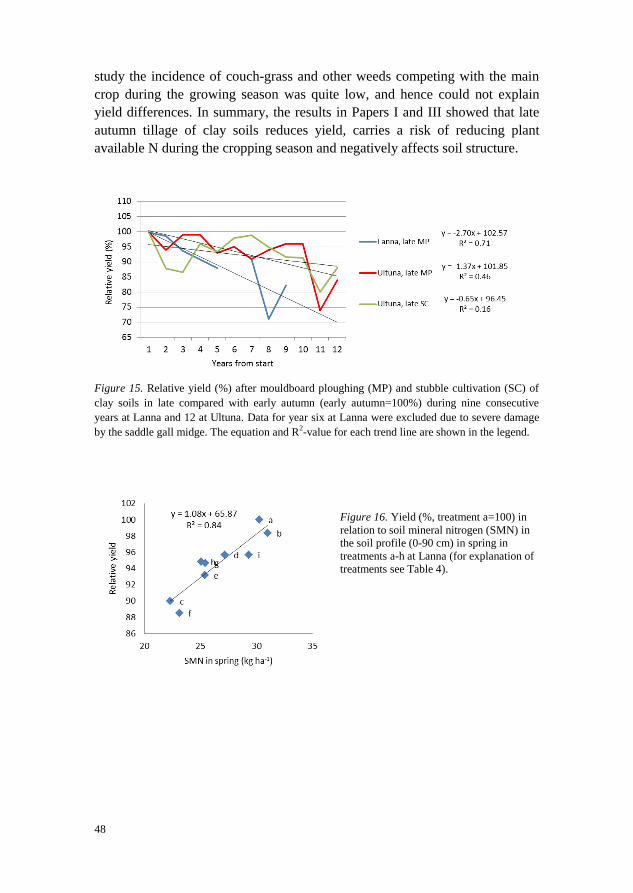
48
study the incidence of couch-grass and other weeds competing with the main
crop during the growing season was quite low, and hence could not explain
yield differences. In summary, the results in Papers I and III showed that late
autumn tillage of clay soils reduces yield, carries a risk of reducing plant
available N during the cropping season and negatively affects soil structure.
Figure 15. Relative yield (%) after mouldboard ploughing (MP) and stubble cultivation (SC) of
clay soils in late compared with early autumn (early autumn=100%) during nine consecutive
years at Lanna and 12 at Ultuna. Data for year six at Lanna were excluded due to severe damage
by the saddle gall midge. The equation and R2-value for each trend line are shown in the legend.
Figure 16. Yield (%, treatment a=100) in
relation to soil mineral nitrogen (SMN) in
the soil profile (0-90 cm) in spring in
treatments a-h at Lanna (for explanation of
treatments see Table 4).
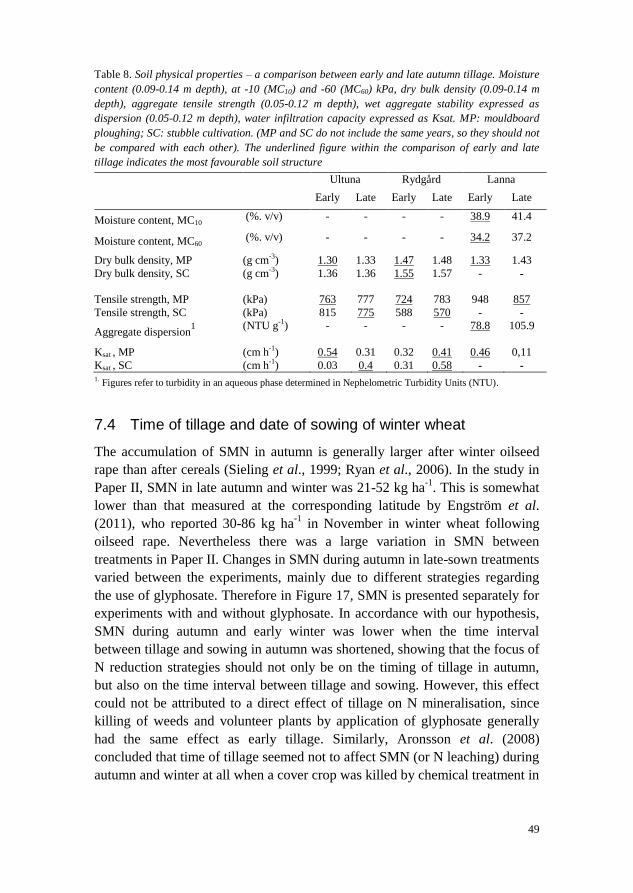
49
Table 8. Soil physical properties – a comparison between early and late autumn tillage. Moisture
content (0.09-0.14 m depth), at -10 (MC10) and -60 (MC60) kPa, dry bulk density (0.09-0.14 m
depth), aggregate tensile strength (0.05-0.12 m depth), wet aggregate stability expressed as
dispersion (0.05-0.12 m depth), water infiltration capacity expressed as Ksat. MP: mouldboard
ploughing; SC: stubble cultivation. (MP and SC do not include the same years, so they should not
be compared with each other). The underlined figure within the comparison of early and late
tillage indicates the most favourable soil structure
Ultuna Rydgård Lanna
Early Late Early Late Early Late
Moisture content, MC10 (%. v/v) - - - - 38.9 41.4
Moisture content, MC60 (%. v/v) - - - - 34.2 37.2
Dry bulk density, MP (g cm-3
) 1.30 1.33 1.47 1.48 1.33 1.43
Dry bulk density, SC (g cm-3
) 1.36 1.36 1.55 1.57 -
-
Tensile strength, MP (kPa) 763 777 724 783 948 857
Tensile strength, SC (kPa) 815 775 588 570 - -
Aggregate dispersion1
(NTU g-1
) - - - - 78.8 105.9
Ksat , MP (cm h-1
) 0.54 0.31 0.32 0.41 0.46 0,11
Ksat , SC (cm h-1
) 0.03 0.4 0.31 0.58 - - 1.
Figures refer to turbidity in an aqueous phase determined in Nephelometric Turbidity Units (NTU).
7.4 Time of tillage and date of sowing of winter wheat
The accumulation of SMN in autumn is generally larger after winter oilseed
rape than after cereals (Sieling et al., 1999; Ryan et al., 2006). In the study in
Paper II, SMN in late autumn and winter was 21-52 kg ha-1
. This is somewhat
lower than that measured at the corresponding latitude by Engström et al.
(2011), who reported 30-86 kg ha-1
in November in winter wheat following
oilseed rape. Nevertheless there was a large variation in SMN between
treatments in Paper II. Changes in SMN during autumn in late-sown treatments
varied between the experiments, mainly due to different strategies regarding
the use of glyphosate. Therefore in Figure 17, SMN is presented separately for
experiments with and without glyphosate. In accordance with our hypothesis,
SMN during autumn and early winter was lower when the time interval
between tillage and sowing in autumn was shortened, showing that the focus of
N reduction strategies should not only be on the timing of tillage in autumn,
but also on the time interval between tillage and sowing. However, this effect
could not be attributed to a direct effect of tillage on N mineralisation, since
killing of weeds and volunteer plants by application of glyphosate generally
had the same effect as early tillage. Similarly, Aronsson et al. (2008)
concluded that time of tillage seemed not to affect SMN (or N leaching) during
autumn and winter at all when a cover crop was killed by chemical treatment in
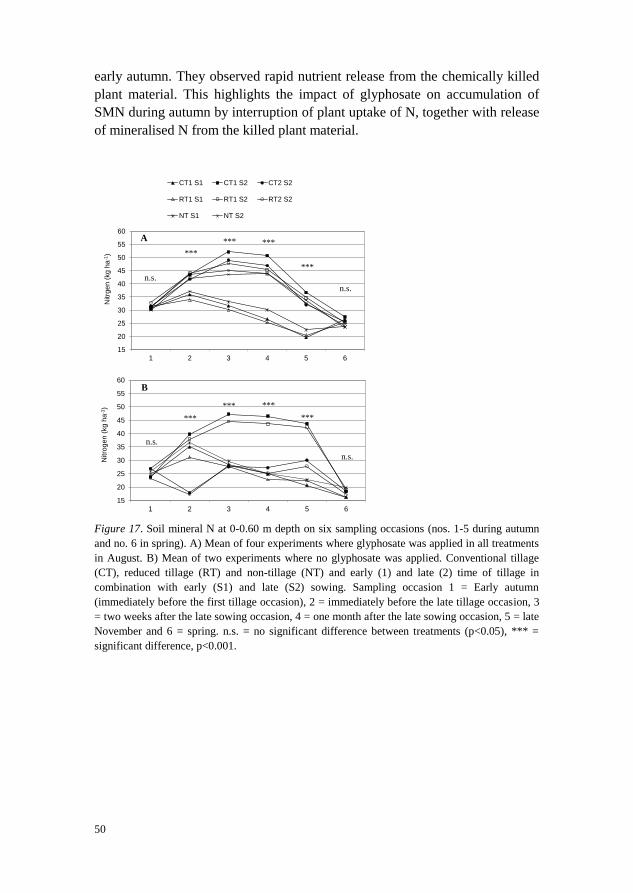
50
early autumn. They observed rapid nutrient release from the chemically killed
plant material. This highlights the impact of glyphosate on accumulation of
SMN during autumn by interruption of plant uptake of N, together with release
of mineralised N from the killed plant material.
Figure 17. Soil mineral N at 0-0.60 m depth on six sampling occasions (nos. 1-5 during autumn
and no. 6 in spring). A) Mean of four experiments where glyphosate was applied in all treatments
in August. B) Mean of two experiments where no glyphosate was applied. Conventional tillage
(CT), reduced tillage (RT) and non-tillage (NT) and early (1) and late (2) time of tillage in
combination with early (S1) and late (S2) sowing. Sampling occasion 1 = Early autumn
(immediately before the first tillage occasion), 2 = immediately before the late tillage occasion, 3
= two weeks after the late sowing occasion, 4 = one month after the late sowing occasion, 5 = late
November and 6 = spring. n.s. = no significant difference between treatments (p<0.05), *** =
significant difference, p<0.001.
15
20
25
30
35
40
45
50
55
60
1 2 3 4 5 6
Nitro
gen (
kg h
a-1
)
B
15
20
25
30
35
40
45
50
55
60
1 2 3 4 5 6
Nitrg
en (
kg
ha
-1)
CT1 S1 CT1 S2 CT2 S2
RT1 S1 RT1 S2 RT2 S2
NT S1 NT S2
n.s.
n.s.
n.s.
n.s.
***
***
***
***
***
***
***
***
A
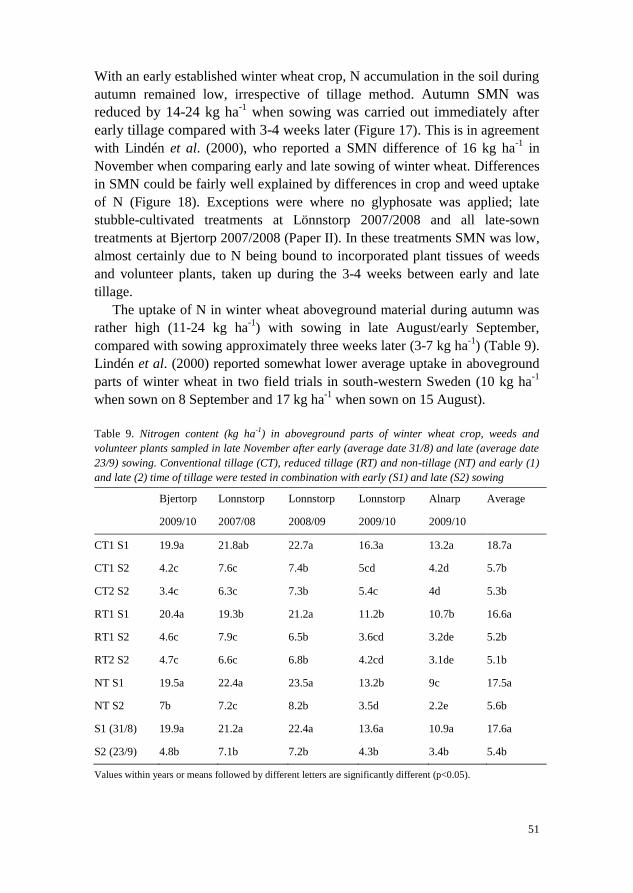
51
With an early established winter wheat crop, N accumulation in the soil during
autumn remained low, irrespective of tillage method. Autumn SMN was
reduced by 14-24 kg ha-1
when sowing was carried out immediately after
early tillage compared with 3-4 weeks later (Figure 17). This is in agreement
with Lindén et al. (2000), who reported a SMN difference of 16 kg ha-1
in
November when comparing early and late sowing of winter wheat. Differences
in SMN could be fairly well explained by differences in crop and weed uptake
of N (Figure 18). Exceptions were where no glyphosate was applied; late
stubble-cultivated treatments at Lönnstorp 2007/2008 and all late-sown
treatments at Bjertorp 2007/2008 (Paper II). In these treatments SMN was low,
almost certainly due to N being bound to incorporated plant tissues of weeds
and volunteer plants, taken up during the 3-4 weeks between early and late
tillage.
The uptake of N in winter wheat aboveground material during autumn was
rather high (11-24 kg ha-1
) with sowing in late August/early September,
compared with sowing approximately three weeks later (3-7 kg ha-1
) (Table 9).
Lindén et al. (2000) reported somewhat lower average uptake in aboveground
parts of winter wheat in two field trials in south-western Sweden (10 kg ha-1
when sown on 8 September and 17 kg ha-1
when sown on 15 August).
Table 9. Nitrogen content (kg ha-1
) in aboveground parts of winter wheat crop, weeds and
volunteer plants sampled in late November after early (average date 31/8) and late (average date
23/9) sowing. Conventional tillage (CT), reduced tillage (RT) and non-tillage (NT) and early (1)
and late (2) time of tillage were tested in combination with early (S1) and late (S2) sowing
Bjertorp Lonnstorp Lonnstorp Lonnstorp Alnarp Average
2009/10 2007/08 2008/09 2009/10 2009/10
CT1 S1 19.9a 21.8ab 22.7a 16.3a 13.2a 18.7a
CT1 S2 4.2c 7.6c 7.4b 5cd 4.2d 5.7b
CT2 S2 3.4c 6.3c 7.3b 5.4c 4d 5.3b
RT1 S1 20.4a 19.3b 21.2a 11.2b 10.7b 16.6a
RT1 S2 4.6c 7.9c 6.5b 3.6cd 3.2de 5.2b
RT2 S2 4.7c 6.6c 6.8b 4.2cd 3.1de 5.1b
NT S1 19.5a 22.4a 23.5a 13.2b 9c 17.5a
NT S2 7b 7.2c 8.2b 3.5d 2.2e 5.6b
S1 (31/8) 19.9a 21.2a 22.4a 13.6a 10.9a 17.6a
S2 (23/9) 4.8b 7.1b 7.2b 4.3b 3.4b 5.4b
Values within years or means followed by different letters are significantly different (p<0.05).
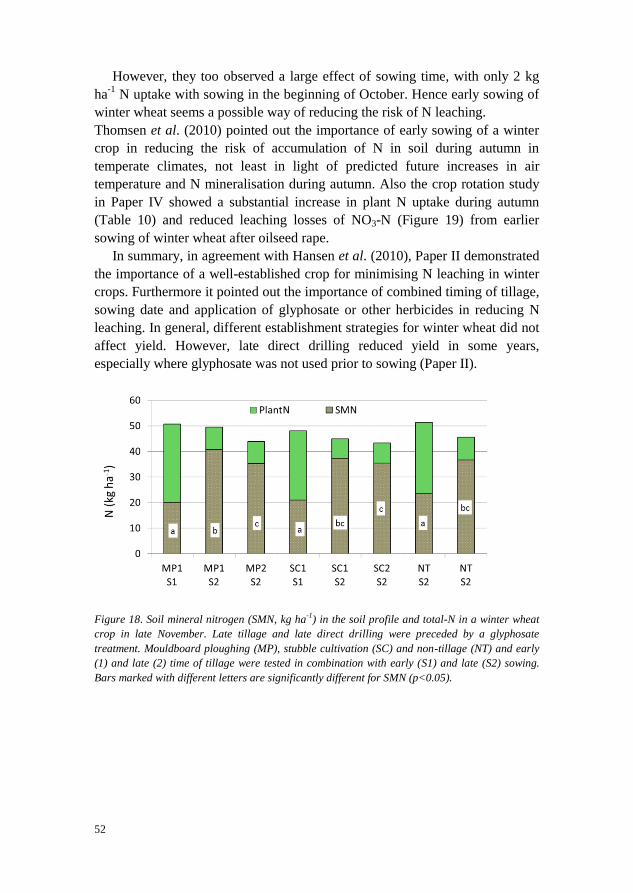
52
However, they too observed a large effect of sowing time, with only 2 kg
ha-1
N uptake with sowing in the beginning of October. Hence early sowing of
winter wheat seems a possible way of reducing the risk of N leaching.
Thomsen et al. (2010) pointed out the importance of early sowing of a winter
crop in reducing the risk of accumulation of N in soil during autumn in
temperate climates, not least in light of predicted future increases in air
temperature and N mineralisation during autumn. Also the crop rotation study
in Paper IV showed a substantial increase in plant N uptake during autumn
(Table 10) and reduced leaching losses of NO3-N (Figure 19) from earlier
sowing of winter wheat after oilseed rape.
In summary, in agreement with Hansen et al. (2010), Paper II demonstrated
the importance of a well-established crop for minimising N leaching in winter
crops. Furthermore it pointed out the importance of combined timing of tillage,
sowing date and application of glyphosate or other herbicides in reducing N
leaching. In general, different establishment strategies for winter wheat did not
affect yield. However, late direct drilling reduced yield in some years,
especially where glyphosate was not used prior to sowing (Paper II).
Figure 18. Soil mineral nitrogen (SMN, kg ha-1
) in the soil profile and total-N in a winter wheat
crop in late November. Late tillage and late direct drilling were preceded by a glyphosate
treatment. Mouldboard ploughing (MP), stubble cultivation (SC) and non-tillage (NT) and early
(1) and late (2) time of tillage were tested in combination with early (S1) and late (S2) sowing.
Bars marked with different letters are significantly different for SMN (p<0.05).

53
7.5 Tillage intensity
Contrasting results have been found when comparing different intensities of
tillage on mineral soils. Studies reporting less accumulation of SMN and/or N
leaching with reduced tillage practices most often include a comparison
between a no tillage (direct drilling) system and a conventional tillage system
(e.g. Nyborg & Malhi, 1989; Goss et al., 1993; Hansen & Djurhuus, 1997;
Power & Peterson, 1998), while there have been rather few studies on the
effect of tillage depth. Stenberg et al. (1999), Catt et al. (2000) and Chatskikh
et al. (2008) suggest a lower rate of turnover and/or N leaching after stubble
cultivation compared with mouldboard ploughing. However, other studies
show the opposite, with no or inconsistent effects of tillage depth (Hooker et
al., 2008; Hansen et al., 2010; Regina & Alakukku, 2010). Catt et al. (2000)
reported 20% lower mineral N content in soil and 25% lower mean annual
NO3-N losses per 100 mm drain flow during autumn and winter with shallow
tine cultivation (0.07 m depth) than with mouldboard ploughing (0.20 m depth)
in winter cereals on a heavy clay (55%) soil in the UK. They attributed this to
limited mineralisation of OM in the soil compared with after ploughing.
Somewhat contradictory results were also obtained in this thesis. At Lanna,
SMN during late autumn (November) was on average 9 kg ha-1
lower in
stubble-cultivated plots than in plots mouldboard ploughed in early autumn
(Paper I). Considering that plant N uptake was similar in both treatments
during autumn (Paper I), this appears to be due to lower net N mineralisation
after stubble cultivation compared with mouldboard ploughing. For the clay
soils at Ultuna and Rydsgård no corresponding difference was detected.
Furthermore, results from nine experiments in winter wheat at Bjertorp,
Lönnstorp and Alnarp (Paper II) showed that with the same time interval
between tillage and sowing, in general there were no differences in SMN
between tillage methods (Figure 17).
To winter wheat, the NT treatment generally resulted in high levels of SMN
(Figure 17). This confirms previous work under Mediterranean climate by
Lotfollahi (2006) and under Scandinavian climate by Hansen et al. (2010) and
Engström et al. (2011). Occasionally higher levels of NO3 leaching after no-till
compared with ploughing were reported by Lotfollahi (2006) and Hansen et al.
(2010). They attributed this to lower plant uptake of N in no-till caused by poor
establishment in too dry soil and reduced root growth compared with in
ploughed soil, as shown by Munkholm et al. (2008). However, in this thesis
crop uptake in winter wheat generally did not differ between establishment
methods. Instead, the results obtained were mainly explained by effects on
SMN being similar from a glyphosate application prior to direct drilling as
from mouldboard ploughing or stubble cultivation, indicating the increase in

54
SMN was due to interrupted N uptake in weeds and volunteer plants rather
than to increased net N mineralisation due to tillage. Any possible effects of
tillage on N mineralisation were masked by differences in crop and weed
uptake of N. In summary, reduced tillage in autumn for spring cereals might
reduce SMN accumulation and N leaching, although in this thesis effects from
reduced tillage on SMN were detected at only one of three experimental sites.
However, reduced tillage in terms of direct drilling for spring crops might
reduce N leaching in clay soils, where delayed autumn tillage and spring tillage
are not suitable practices. For winter cereals, there are unlikely to be water
quality benefits accruing from a change from conventional to reduced tillage
and instead, early sowing and a short time interval between tillage and sowing
seem to be important factors.
7.6 Long-term and short-term effects within a crop sequence
Methods for measuring N leaching all have their drawbacks. In the tile-drain
study in Paper IV, discharge varied between plots. That experimental field is
almost flat, so surface transport of water between experimental plots can be
expected to be very limited. Obviously water infiltration occurred in between
the drainage pipes. However, average drainage values from the three plots
within each treatment were approximately the same for the CON and NUE
systems (Paper IV). Total discharge from the drainage systems during the
experimental period (1999/00-2010/11) was 3220 mm and 3335 mm for the
CON and NUE system, respectively. Several previous studies conducted in
nearby fields have used a simulation model (SOILN; Blombäck et al., 2003)
which describes water flow and N transformation and transport in soil, in
addition to field measurements (mostly separately tile-drained plots but in
some cases ceramic cups), to interpret data and to calculate N budgets and N
mineralisation in the soil (e.g. Blombäck et al., 2003; Torstensson et al., 2006).
The results show that there is generally limited interference by groundwater
flowing into the drains and affecting N concentrations. The underlying
glacifluvial clay at the site can be expected to function as a barrier under the
drainage depth, slowing down both upward and downward transport of water.
The water sampled in the drains can hence be assumed to be fairly
representative and we do believe that sampling of water in tile drains is the
most appropriate approach at this site. As previously mentioned, losses of N
were also well reflected by measured SMN content in the soil profile during
autumn and winter (Figure 3).
In Paper IV, production of winter wheat, spring barley and spring oilseed
rape in one conventional (CON) and one N use efficient (NUE) system resulted
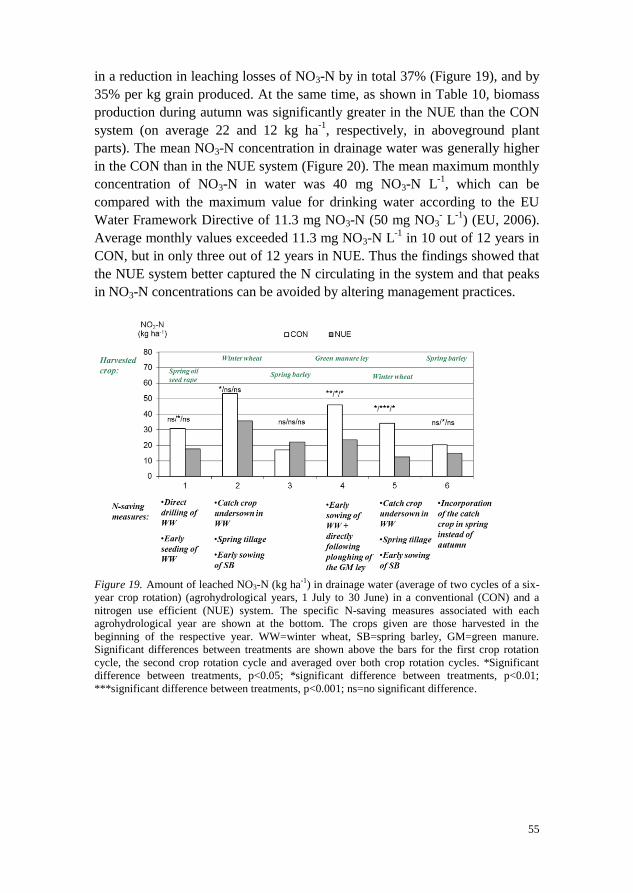
55
in a reduction in leaching losses of NO3-N by in total 37% (Figure 19), and by
35% per kg grain produced. At the same time, as shown in Table 10, biomass
production during autumn was significantly greater in the NUE than the CON
system (on average 22 and 12 kg ha-1
, respectively, in aboveground plant
parts). The mean NO3-N concentration in drainage water was generally higher
in the CON than in the NUE system (Figure 20). The mean maximum monthly
concentration of NO3-N in water was 40 mg NO3-N L-1
, which can be
compared with the maximum value for drinking water according to the EU
Water Framework Directive of 11.3 mg NO3-N (50 mg NO3- L
-1) (EU, 2006).
Average monthly values exceeded 11.3 mg NO3-N L-1
in 10 out of 12 years in
CON, but in only three out of 12 years in NUE. Thus the findings showed that
the NUE system better captured the N circulating in the system and that peaks
in NO3-N concentrations can be avoided by altering management practices.
Figure 19. Amount of leached NO3-N (kg ha
-1) in drainage water (average of two cycles of a six-
year crop rotation) (agrohydrological years, 1 July to 30 June) in a conventional (CON) and a
nitrogen use efficient (NUE) system. The specific N-saving measures associated with each
agrohydrological year are shown at the bottom. The crops given are those harvested in the
beginning of the respective year. WW=winter wheat, SB=spring barley, GM=green manure.
Significant differences between treatments are shown above the bars for the first crop rotation
cycle, the second crop rotation cycle and averaged over both crop rotation cycles. *Significant
difference between treatments, p<0.05; *significant difference between treatments, p<0.01;
***significant difference between treatments, p<0.001; ns=no significant difference.
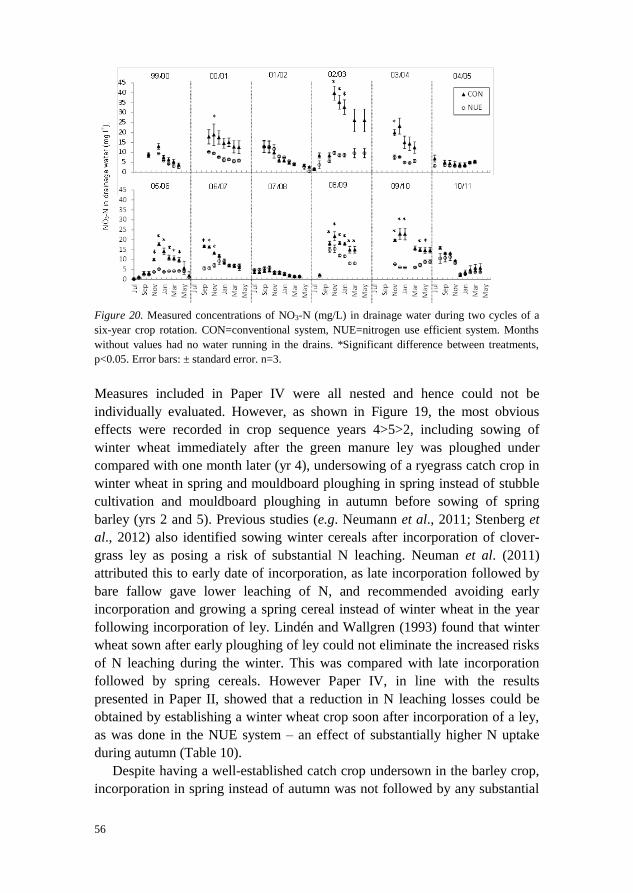
56
Figure 20. Measured concentrations of NO3-N (mg/L) in drainage water during two cycles of a
six-year crop rotation. CON=conventional system, NUE=nitrogen use efficient system. Months
without values had no water running in the drains. *Significant difference between treatments,
p<0.05. Error bars: ± standard error. n=3.
Measures included in Paper IV were all nested and hence could not be
individually evaluated. However, as shown in Figure 19, the most obvious
effects were recorded in crop sequence years 4>5>2, including sowing of
winter wheat immediately after the green manure ley was ploughed under
compared with one month later (yr 4), undersowing of a ryegrass catch crop in
winter wheat in spring and mouldboard ploughing in spring instead of stubble
cultivation and mouldboard ploughing in autumn before sowing of spring
barley (yrs 2 and 5). Previous studies (e.g. Neumann et al., 2011; Stenberg et
al., 2012) also identified sowing winter cereals after incorporation of clover-
grass ley as posing a risk of substantial N leaching. Neuman et al. (2011)
attributed this to early date of incorporation, as late incorporation followed by
bare fallow gave lower leaching of N, and recommended avoiding early
incorporation and growing a spring cereal instead of winter wheat in the year
following incorporation of ley. Lindén and Wallgren (1993) found that winter
wheat sown after early ploughing of ley could not eliminate the increased risks
of N leaching during the winter. This was compared with late incorporation
followed by spring cereals. However Paper IV, in line with the results
presented in Paper II, showed that a reduction in N leaching losses could be
obtained by establishing a winter wheat crop soon after incorporation of a ley,
as was done in the NUE system – an effect of substantially higher N uptake
during autumn (Table 10).
Despite having a well-established catch crop undersown in the barley crop,
incorporation in spring instead of autumn was not followed by any substantial
57
reduction in NO3-N leaching losses (3 kg ha-1
). This lack of a pronounced
difference between the CON and NUE systems could be due to increased
mineralisation in NUE from incorporating the catch crop undersown in winter
wheat in the preceding year. Increased net mineralisation from the incorporated
catch crop undersown in winter wheat in the NUE system was also observed in
2001/02 and 2007/08, when leaching was higher than in the CON system.
Enhanced net mineralisation through growing a catch crop has been reported
previously by e.g. Constantin et al. (2011).
Increased N mineralisation from catch crops should be evaluated in a long
time scale (Berntsen et al., 2006). This is also true for other measures used in
our crop rotation study. A somewhat smaller average difference between the
two systems in terms of N leaching during the second crop rotation cycle
(33%) compared with the first (46%) could be an indication of increased N
delivery of previously recovered N in the NUE system during the second cycle.
A residual effect of previous long-term use (24 years) of a ryegrass catch crop
facilitated a reduction in N fertilisation to spring wheat by as much as 20-25%
at fertilisation rates of 60-120 kg ha-1
in a study by Hansen et al. (2000).
Constantin et al. (2011) reported an extra mineralisation rate from
incorporation of catch crops, which increased over time at a rate of 2 kg N ha-1
yr-1
. However, in Paper IV this presumed increase in mineralisation from
incorporated catch crop material seemed small in relation to the benefit in
terms of reduced N leaching during growth of the catch crop, although this
might have changed if the experiment had continued for a longer period.
Nevertheless, eight years of continuous use of catch crops at Lanna gave no
signs of reduced effectiveness in decreasing leachable N during autumn and
winter, where the outcome was reduced SMN accumulation during autumn and
winter (Figure 12), increased mineralisation during the growing season and no
yield reduction (Paper I).
Nevertheless, probably due to the frequent use of spring ploughing and
direct drilling, there was substantial growth of weeds in the NUE system which
in some years caused a reduction in yield. Previous studies have shown that
when tillage for spring cereals is delayed (Stenberg et al., 1999) or reduced
(Børressen, 1993) under Scandinavian conditions, there may be substantial
autumn growth of weeds, particularly couch-grass. However, average grain
yield (12 yr) did not differ between the CON and NUE systems (Paper IV).
In summary, Paper IV, in line with a previous study by Hansen et al.
(2010), showed that management practices that improve biomass production
throughout the year are crucial in order to close the N cycle and thereby reduce
N leaching.

58
Table 10. Nitrogen content (kg/ha-1
) in aboveground parts of green material (weeds, W; volunteer
plants, Vp; green manure crop Gm; winter wheat crop, Ww) during autumn. CON=conventional
system, NUE=nitrogen use efficient system. (-)=close to zero, too little green material to be
sampled.
Crop Date of Green material N (kg ha-1
)
rotation yr sampling CON NUE CON NUE
1 30 Aug W, Vp W, Vp 3.5 7.8
20 Oct W, Vp, Ww W, Vp, Ww 2.4a 12.0b
2 30 Aug W, Vp W, Vp, Cc 1.3a 3.5b
8 Nov W, Vp W, Vp, Cc 8.9 18.2
3 20 Aug W, Vp, Gm W, Vp, Gm 12.4a 5.6b
30 Oct W, Vp, Gm W, Vp, Gm 44.8 31.7
4 15 Nov W, Vp, Ww W, Vp, Ww 3.8a 22.8b
4 Dec W, Vp, Ww W, Vp, Ww 3.6a 31.5b
5 4 Nov W, Vp W, Vp, Cc - 28.9
3 Dec W, Vp W, Vp, Cc - 23.6
6 2 Sept W, Vp, Cc W, Vp, Cc 12.1 12.1
Values within sampling dates followed by different letters are significantly different (p<0.05).
7.7 Tillage – Mineralisation – N leaching
Soil tillage has been shown to induce increased biodegradation rates in native
soils. Tillage of native soils or old grasslands seems to cause a drop in SOM
(Doran et al., 1987; Addiscott, 1988; Gupta & Germida, 1988) that cannot
fully be explained by changes in e.g. C input and outputs or losses of topsoil by
erosion (Balesdent et al., 2000). The quantity of OM retained in a soil is the
result of achieving a balance between inputs and mineralisation, as affected by
the physical and chemical properties of the site (Tate, 1995). Thus all
disturbance of a soil, for example by cultivation, can be expected to result in
the establishment of a new equilibrium. Although tillage is generally said to
stimulate mineralisation of SOM, its impact in frequently cropped soils
remains somewhat unclear. Frequently cultivated soils may be so close to
equilibrium that tillage in general has only limited effects on net mineralisation
rates of SOM under cold humid conditions. This is supported by studies of
short-term effects showing very inconsistent results for mineralisation rates
after tillage (see section 7.5). Furthermore, it is supported by a lack of
consistent results on the long-term effects on total C and N in soil in studies
comparing conventional tillage and reduced or no tillage. Several studies have
reported that reduced tillage appears to have no significant effect on the
sequestration of C and N and the global C cycle (e.g. Etana et al., 1999; Puget
et al., 2005).

59
The majority of the experiments reported in this thesis indicated no or very
limited influence of tillage on N mineralisation rates, as changes in SMN were
mainly explained by plant uptake of N. However, increases in SMN that were
not fully explained by differences in plant uptake were detected after early
compared with late tillage and after mouldboard ploughing compared with
stubble cultivation during mainly two years at Lanna (Figure 12) and one year
at Rydsgård (Figure 13). This indicates that mineralisation was enhanced by
tillage.
Although a change from mouldboard ploughing to reduced tillage may have
limited effects on SMN, long-term use of non-inversion shallow tillage can
possibly reduce N leaching by increased macropore flow. Macropore flow can
protect NO3- within the soil matrix from being washed downwards in the
profile compared with when the entire soil volume is involved in the flow
process (Shipitalo et al., 2000). Goss et al. (1993) observed lower NO3-N
concentrations in drainage water after direct drilling than after mouldboard
ploughing on a clayey soil in England, which they attributed partly to more
bypass flow in direct-drilled plots.
7.8 Results in relation to government regulations
Subsidies have been used by the authorities in Sweden to encourage farmers to
grow catch crops and postpone tillage for spring cereals until spring. For spring
tillage, no herbicides are allowed during autumn. These actions are highly
supported by the results in this thesis.
Furthermore, all farms >5 ha within the main areas classified as nitrate
vulnerable zones in Sweden (Figure 1) are affected by regulations on autumn
and winter covering of the soil (SJVFS, 2011:25). At a minimum, 50-60% of
arable land has to be covered during autumn. Winter wheat is one of the crops
eligible, stubble and catch crops are others. The winter wheat crop has to be
sown by 5 October at the latest in counties in the very south of Sweden and by
15 October in the remaining counties. According to Paper II, N uptake in
winter wheat during autumn is significantly lower when sowing is carried out
in late September instead of in late August. The N content in aboveground crop
parts in the former was 17 kg ha-1
, while in the latter it was only 5 kg ha-1
.
Hence, the N uptake in a wheat crop established as late as 5 or 15 October can
be expected to be very low. It is possible that drainage water quality from
winter wheat fields would greatly benefit from these dates being brought
forward (to earlier in autumn).
Within the regulations on autumn and winter covering of soil, tillage or
chemical treatments are not allowed earlier than 10 or 20 October depending

60
on area. At this time in autumn, the clay soils studied in this thesis (Paper III)
already had soil water contents higher than were optimal for tillage. The
somewhat heavier clay soils in this thesis, like clay soils in other studies, were
not very prone to N leaching, so this regulation runs the risk of having more
negative than positive effects, with poor soil structure and yield decreases as
consequences.
61
8 Implications for future research
The results presented in this thesis indicate potential for further reductions in N
leaching, especially in autumn-sown crops which, despite a current increase in
acreage, are much less discussed in this context in Sweden than spring crops.
The most obvious mitigating effect in winter wheat cropping was obtained with
early sowing. Despite the absence of negative effects on yield in this thesis,
however, too early sowing can be a risk factor for the spread of wheat dwarf
virus and snow mould (Microdochium nivale). Increased knowledge and
quantification of these risks under modern crop varieties and establishment
techniques would be valuable in light of predicted future warmer and moister
autumns.
Considering that the measures identified as effective in reducing N leaching
losses were all related to higher soil coverage by crops, new methods are
needed to prevent weeds from increasing in systems with e.g. frequent spring
ploughing, delayed autumn tillage and the use of catch crops. With current
methods, it may be necessary to accept a crop-free autumn every four or five
years so that weeds can be controlled either chemically or mechanically.
There was a seemingly fast release of N from chemically killed plant
material in this study, as previously shown by Aronsson et al. (2008). Thus a
more rapid release than from deeply incorporated fresh plant material using
mouldboard ploughing is possible. However, this was not investigated and
further research is needed. Such knowledge is important in the context of e.g.
direct drilling and N dynamics, as direct drilling in autumn often requires
preceding chemical treatment.
The studies within this work were limited to systems with mineral fertiliser
use. On soils high in SOM and with animal manure supplied, tillage may have
had a more pronounced effect on N mineralisation. Tillage effects on N
leaching in systems with organic fertilisers including various waste products
are of interest.

62
63
9 Conclusions
It is possible to substantially reduce leaching losses of N from arable
land by choice of soil tillage strategies.
Tillage effects on SMN can mainly be attributed to interruption of N
uptake in crops and weeds rather than stimulated N mineralisation.
Therefore, a high degree of soil coverage by living plants during
autumn and winter should be the main focus in mitigation of N
leaching losses from arable fields. Timing of tillage is an important
tool in this aspect.
SMN accumulation in winter wheat during autumn and winter was not
influenced by tillage method and hence there are unlikely to be water
quality benefits accruing from a change from conventional to reduced
tillage or direct drilling to winter crops.
There is potential for further reductions in leaching losses of N in
winter wheat production by early sowing, a short time interval
between tillage and sowing and undersowing of a catch crop in spring.
The suitability of delayed autumn tillage as a means to reduce loads of
N from agriculture to surrounding waters (as earlier shown on sandy
soils) varies between Swedish clay soils and sites. A reduction in
accumulation of leachable SMN can be achieved on lighter clay soils.
However, the effects may be small on heavier clay soils, as repeated
late tillage was shown to cause yield reductions, possibly due to
poorer soil structure.
64
Incorporation of cereal straw with a high C/N-ratio did not reduce
SMN during autumn and winter and hence cannot be considered a
measure against N leaching.
The reduction in NO3- concentrations in drainage water and 37%
reduction in leaching of NO3- obtained within a 6-year crop rotation,
without severe effects on yield, show the potential of adapting soil
management and tillage to the crop rotation in order to synchronise
SMN with crop demand.
65
References
Addiscott, T.M. 1988. Long-term leakage of nitrate from bare unmanured soil. Soil Use Manage.
4, 91-95.
Adu, J.K. & Oades, J.M. 1978. Physical factors influencing decomposition of organic materials in
soil aggregates. Soil Biol. Biochem. 10, 109-115.
Álvarez, C.R., Álvarez, R. & Sarquis, A. 2008. Residue decomposition and fate ofnitrogen-15 in a
wheat crop under different previous crops and tillage systems. Commun. Soil Sci. Plant Anal.
39, 574–586.
Ambus, P. & Jensen, E.S. 2001. Crop residue management strategies to reduce N losses—
interaction with crop N supply. Commun. Soil Sci. Plant Anal. 32, 981–996
Andersson, S. & Håkansson, I. 1966. Structure dynamics in the top soil. A field study. (In
Swedish with English summary.) Grundförbättring 1966:3. Swedish University of
Agricultural Sciences, Uppsala, Sweden.
Aronsson, H., Torstensson, G. & , Bergström L. 2007. Leaching and crop uptake of N, P and K
from organic and conventional cropping systems on a clay soil. Soil Use Manage. 23:71-81.
Aronsson, H., Ulén, B. & Stenberg, M., 2008. Chemical treatment of cover crops – effects on
leaching of N, P and glyphosate. In: Phosphorous management in Nordic-Baltic agriculture –
reconciling productivity and environmental protection. NJF Report, 4 (Ed. Rubæk G.H.), pp
107-111.
Aronsson, H. & Stenberg, M. 2010. Leaching of nitrogen from a 3-yr grain crop rotation on a clay
soil. Soil Use Manage. 26, 274–285.
Arvidsson J, Håkansson I. 1996. Does soil compaction persist after ploughing - results from 21
long-term field experiments. Soil Till. Res. 39:175-198.
Arvidsson, J. & Bölenius, E. 2006. Effect of soil water content during primary tillage – laser
measurements of soil surface changes. Soil Till. Res. 90:222-229.
Arvidsson. J, & Håkansson, I. 2014. Response of different crops to soil compaction Short-term
effects in Swedish field experiments. Soil Till. Res. 138, 56-63.
Askegaard, M. & Eriksen, J. 2008. Residual effect and leaching of N and K in cropping systems
with clover and ryegrass catch crops on a coarse sand. Agric. Ecosyst. Environ. 123, 99-108.
Askegaard, M., Olesen, J.E., Rasmussen, I.A. & Kristensen, K. 2011. Nitrate leaching from
organic arable crop rotations is mostly determined by autumn field management. Agric.
Ecosyst. Environ. 142, 149-160.
66
Atterberg, A. 1912. Die Konsistenz und die Bindigkeit der Böden. Int. Mitt. Bodenkunde 2, 148-
189. Germany.
Balesdent, J., Chenu, C. & Balabane, M. 2000. Relationship of soil organic matter dynamics to
physical protection and tillage. Soil Till. Res. 53, 215-230.
Beare, M.H., Gregorich, E.G. & St-Georges, P. 2009. Compaction effects on CO2 and N2O
production during drying and rewetting of soil. Soil Biol. Biochem. 41, 611-621.
Berntsen, J., Olesen, J.E., Petersen, B.M. & Hansen, E.M. 2006. Long-term fate of nitrogen
uptake in catch crops. Eur. J. Agron. 25, 383-390.
Bhogal, A., Young, S.D. & Sylvester-Bradley, R. 1997. Straw incorporation and immobilization
of spring-applied nitrogen. Soil Use Manage. 13, 111-116.
Blombäck, K., Eckersten, H., Lewan, E. & Aronsson, H. 2003. Simulations of soil carbon and
nitrogen dynamics during seven years in a catch crop experiment. Agric. Syst. 76:1, 95-114.
Blombäck, K., Johnsson, H., Lindsjö, A., Mårtensson, K., Persson, K. & Schmeider, F. 2011.
Läckage av näringsämnen från svensk åkermark för år 2009 beräknad med PLC5-metodik.
SMED. Rapport nr 57.
Bolinder, M.A., Angers, D.A. & Dubuc, J.P. 1996. Estimating shoot to root ratios and annual
carbon inputs in soils for cereal crops. Agric. Ecosyst. Environ. 63, 61-66.
Brandt M, Ejhed H, Rapp L. 2009. Nutrient loads to the Swedish marine environment in 2006.
Swedish environmental protection agency, Report 5995, Naturvårdsverket, SE 106 48
Stockholm.
Børresen, T. 1993. Ploughing and rotary cultivation for cereal production in a long-term
experiment on a clay soil in southeastern Norway, 2. Yields and weed infestation. Soil Till.
Res. 28, 109-121
Catt, J.A., Howse, K.R., Christian, D.G., Lane, P.W., Harris, G.L. & Goss, M.J. 1998. Strategies
to decrease nitrate leaching in the Brimstone Farm Experiment, Oxfordshire, UK, 1988–93:
the effect of straw incorporation. J. Agric. Sci., Camb.131, 309–319.
Catt, J.A., Howse, K.R., Christian, D.G., Lane, G.L. & Goss, M.J. 2000. Assessment of tillage
strategies to decrease nitrate leaching in the Brimstone Farm Experiment, Oxfordshire, UK.
Soil Till. Res. 53, 185-200.
Chatskikh, D., Olesen, J.E., Hansen, E.M., Elsgaard, L., Petersen, B.M. 2008. Effects of reduced
tillage on net greenhouse gas fluxes from loamy sand soil under winter crops in Denmark.
Agric. Ecosyst. Environ. 128, 117-126.
Christensen, J.H. et al. 2007. Regional Climate Projections. In: S. Solomon et al., eds. Climate
Change 2007: The Physical Science Basis. Contribution of Working Group I to Fourth
Assessment Report of the Intergovernmental Panel on Climate Change. Cambridge
University Press, Cambridge, United Kingdom and New York, NY, USA.
Constantin, J., Mary, B., Laurent, F., Aubrion, G., Fontaine, A., Kerveillant, P. & Beaudoin, N.
2010. Effects of catch crops, no till and reduced nitrogen fertilization on nitrogen leaching and
balance in three long-term experiments. Agric. Ecosyst. Environ. 135. 268-278.
Constantin, J., Beaudoin, N., Laurent, F., Cohan, J-P., Duyme, F. & Mary, B. 2011. Cumulative
effects of catch crops on nitrogen uptake, leaching and net mineralization. Plant Soil 341,
137-154.
67
Coppens, F., Garnier, P., Findeling, A., Merckx, R. & Recous, S. 2007. Decomposition of
mulched versus incorporated crop residues: Modelling with PASTIS clarifies interactions
between residue quality and location. Soil Biol. Biochem. 39, 2339-2350.
Czyz, E.A., Dexter A.R. & Terelak, H. 2002. Content of readily-dispersed clay in the arable layer
of some Polish soils. In: Pagliai, M. and Jones, R. (editors). Sustainable land management-
environmental protection: a soil physical approach. Adv. GeoEcol. 35, 115-123. Catena
verlag. Germany.
Dexter, A.R., Kroesbergen, B., 1985. Methodology for determination of tensile strength of soil
aggregates. J. Agric. Eng. Res. 31, 139-147.
Dexter, A.R. 1988. Advances in characterization of soil structure. Soil Till. Res. 11, 199-238.
Dexter, A.R., Arvidsson, J., Czyz, E.A., Trautner, A. & Stenberg, M. 2000. Respiration rates of
soil aggregates in relation to tillage and straw-management practices in the field. Acta Agric.
Scand., Sect. B, Soil and Plant Sci. 49, 193-200.
Dexter, A.R., Bird, N.R.A. 2001. Methods for predicting the optimal and the range of water
contents for tillage based on the water retention curve. Soil Till. Res. 57: 203-212.
Doran, J.W. 1987. Microbial biomass and mineralizable nitrogen distributions in no-tillage and
ploughed soils. Biol. Fertil. Soils, 5, 68-75.
Doran, J.W., Nielke, L.N. & Power, J.F. 1987. Tillage/Residue management interactions with the
soil environment, organic matter and nutrient cycling. Intecol Bulletin 15, 33-39.
Engström, L., Stenberg, M.; Aronsson, H. & Lindén, B. 2011. Reducing nitrate leaching after
winter oilseed rape and peas by optimising crop management. Agron. Sustain. Dev. 31, 337–
347.
Etana, A., Håkansson, I., Zagal, E. & Bucas, S. 1999. Effects of tillage depth on organic carbon
content and physical properties in five Swedish soils. Soil Till. Res. 2, 129-139.
EU Water Framework Directive (2006/118/EG).
Fitzmaurice, G.M., Laird, N.M. & Ware, J.H. 2004. Applied longitudinal analysis. Wiley, New
York.
Francis, G.S., Haynes, R.J. & Williams, P.H. 1994. Nitrogen mineralization, nitrate leaching and
crop growth after ploughing-in leguminous and non-leguminous grain crop residues. J. Agric.
Sci. 123, 81-87.
Francis, G.S. 1995. Management practices for minimizing nitrate leaching after ploughing
temporary leguminous pastures in Canterbury, New Zealand. J. Contam. Hydrol. 20, 313-327.
Gantzer. C.J. & Blake, G.R. 1978. Physical characteristics of Le Seur clay loam soil following
no-till and conventional tillage. Am. J. 70:5, 853-857.
Goss, M.J., Howse, K.R., Lane, P.W., Christian, D.G. & Harris, G.L. 1993. Losses of nitrate-
nitrogen in water draining from under autumn-sown crops established by direct drilling or
mouldboard ploughing. J. Soil Sci. 44, 35-48.
Gupta, V.V.S.R. & Germida, J.J. 1988. Distribution of microbial biomass and its activity in
different soil aggregate size classes as affected by cultivation. Soil Biol. Biochem. 20, 777-
786.
Hansen, E.M. & Djurhuus, J. 1997. Nitrate leaching as influenced by soil tillage and catch crop.
Soil Till. Res. 41, 203-219.
68
Hansen, E.M., Kristensen, K. & Djurhuus, J. 2000. Yield parameters as affected by introduction
or discontinuation of catch crop use. Agric. J. 92, 909-614.
Hansen, E.M., Munkholm, L.J., Melander, B. & Olesen, J.E. 2010. Can non-inversion tillage and
straw retainment reduce N leaching in cereal-based crop rotations? Soil Till. Res. 109, 1-8.
Hansson, A.-C., Pettersson, R. & Paustian, K. 1987. Shoot and root production and nitrogen
uptake in barley with and without nitrogen fertilization. J. Agron. Crop Sci. 158, 163-171.
HELCOM, 2007. Baltic Sea Action Plan. HELCOM Ministerial Meeting, Krakow,Poland, 2007,
101 pp. http://www.helcom.fi/stc/files/BSAP/BSAP_Final.pdf
HELCOM, 2013. Summary report on the development of revised Maximum Allowable Inputs
(MAI) and updated Country Allocated Reduction Targets (CART) of the Baltic Sea Action
Plan. HELCOM.
Hjalmarsdottir Kværnø, S. & Øygarden, L. 2006. The influence of freeze–thaw cycles and soil
moisture on aggregate stability of three soils in Norway. Catena, 175 – 182.
Hooker, K.V., Coxon, C.E., Hackett, R., Kirwan, L.E., O´Keeffe, E. & Richards, K.G. 2008.
Evaluation of cover crop and reduced cultivation for reducing nitrate leaching in Ireland. J.
Environ. Qual. 37:138-145.
Horn, R., Domzal, H., Slowinska-Jurkiewicz, A., van Ouwerkerk, C. 1995. Soil compaction
processes and their effects on the structure of arable soils and the environment. Soil Till. Res.
35, 23-36.
Håkansson, I., Myrbeck, Å. & Etana, A. 2002. A review of research on seedbed preparation for
small grains in Sweden. Soil Till. Res. 64, 23-40.
Jensen, E.S., 1997. Nitrogen immobilization and mineralization during initial decomposition of
15N-labbelled pea and barley residues. Biol. Fertil. Soils 24, 39-44.
Jin, K., Sleutel, S., De Neve, S., Gabriels, D., Cai, D. & Jin, J., Hofman, G. 2008. Nitrogen and
carbon mineralization of surface-applied and incorporated winter wheat and peanut residues.
Biol. Fertil. Soils 44, 661–665.
Kainiemi, V. 2014. Tillage effects on soil respiration in Swedish arable soils. Doctoral thesis.
Acta Universitatis Agriculturae Sueciae, 2014:2. Faculty of Natural Resources and
Agricultural Sciences, Swedish University of Agricultural Sciences, Uppsala.
Keller, T. Arvidsson, J. & Dexter, A.R. 2007. Soil structures produced by tillage as affected by
soil water content and the physical quality of soil. Soil Till. Res. 92:45-52.
Khan, A.R. 1996. Influence of tillage on soil aeration. J. Agron.Crop Sci. 177, 253-259.
Koskiaho, J. 2002. Reduced tillage: Influence on erosion and nutrient losses in a clayey field in
southern Finland. Agric. food sci. in Finland. 11:37-50.
Känkänen, H., Kangas, A:, Mela,T., Nikunen, U., Tuuri, H. & Vuorinen, M. 1998. Timing
incorporation of different green manure crops to minimize the risk of nitrogen leaching. Agric.
Food. Sci. Finland. 7, 553-567.
Lancashire, P.D., Bleiholder, H., van den Boom, T., Langelüddeke, P. Strauss, R., Weber, E. &
Witzenberger, A. 1991. A uniform decimal code for growth stages of crops and weeds. Ann.
Appl. Biol. 119, 561–601.
Lindén, B. & Wallgren, B. 1993. Nitrogen mineralization after leys ploughed in early or late
autumn. Swedish J. agric. Res. 23, 77-89.
69
Lindén, B., Roland, J. & Tunared, R. 2000. Höstsäds kväveupptag under hösten (Nitrogen uptake
of winter cereals during autumn). Swedish university of agricultural sciences. Department of
Agricultural research Skara, Series B Crops and soils, Report 5, 23 pp (English summary).
Lindén, B. & Engström, L. 2006. Winter oilseed rape, oats and field peas as crops preceding
winter wheat – effect on nitrogen dynamics in the soil and on wheat yields. Division of
precision agriculture, Rapport 4. Swedish University of Agricultural Sciences.
Lindén, B., Aronsson, H., Engström, L., Torstensson, G. & Rydberg, T. 2006.
Kvävemineralisering och utlakning av kväve och fosfor på en lerjord vid Lanna i
Västergötland. SLU, Uppsala, Sweden. Ekohydrologi, 91 (In Swedish).
Lipiec, J., Håkansson, I., Tarkiewicz, S. & Kossowski, J. 1991. Soil physical properties and
growth of spring barley as related to the degree of compactness of two soils. Soil Till. Res., 19,
307-317.
Littell, R.C., Milliken, G.A., Stroup, W.W., Wolfinger, R.D. & Schabenberger, O. 2006. SAS for
mixed models, second ed., SAS Institute Inc. Cary NC.
Lotfollahi, M. 2006. Distribution of mineral nitrogen in the soil and its uptake by winter wheat as
affected by cultivation. Proceedings of ISTRO 17, “Sustainability – its Impact on Soil
Management and Environment. 28 August – 3 September, Kiel. Germany. On CD-Rom ISBN
no: 3-9811134-0-3.
Löfkvist, J. 2005. Modifying soil structure using plant roots. Doctoral thesis, Acta Universitatis
Agriculturae Sueciae 2005:60. Faculty of Natural Resources and Agricultural Sciences,
SLU, Sweden.
Malhi, S.S., Grant, C.A., Johnston, A.M. & Gill, K.S. 2001. Nitrogen fertilization management
for no-till cereal production in the Canadian Great Plains: a review. Soil Till. Res. 60, 101-
122.
Mary, B., Reccous, S., Darwis, D. & Robin, D. 1996. Interaction between decomposition of plant
residues and nitrogen cycling in soil. Plant Soil 181, 71-82.
Mc Affee, M., Lindström, J. & Johansson, W. 1989. Effects of pre-sowing compaction onsoil
physical properties, soil atmosphere and growth of oats on a clay soil. J. Soil Sci. 40, 707-717.
McInerney, M. & Bolger, T. 1999. Temperature, wetting cycles and soil texture effects on carbon
and nitrogen dynamics in stabilized earthworm casts. Soil Biol. Biochem. 32:3, 335-349.
Mitchell, R., Harrison, R., Russell K.J. & Webb, J. 2000. The effect of crop residue incorporation
date on soil inorganic nitrogen, nitrate leaching and nitrogen mineralization. Biol. Fertil. Soils
32, 294-301.
Mitchell, R., Webb, J. & Harrison, R. 2001. Crop residue can affect N leaching over at least two
winters. Eur. J. Agron. 15, 17-29.
Morecroft, M.D., Burt T.P., Taylor, M.E. & Rowland, A.P. 2000. Effects of the 1995-1997
drought on nitrate leaching in lowland England. Soil Use Manage. 16, 117-123.
Moreno-Cornejo, J., Zornoza, R. & Faz, A. 2014. Carbon and nitrogen mineralization during
decomposition of crop residues in a calcareous soil. Geoderma 230-231, 58-63.
Morris, N.L., Miller, P.C.H., Orson, J.H. & Froud-Williams, R.J. 2010. The adoption of non-
inversion tillage systems in the United Kingdom and the agronomic impact on soil, crops and
the environment. Soil. Till Res. 108, 1-15.
Munkholm, L.J., Hansen, E.M. & Olesen, J.E. 2008. The effect of tillage intensity on soil
structure and winter wheat root/shoot growth. Soil Use Manage. 24, 392–400.

70
Myrbeck, Å. & Rydberg, T. 2012. Utlakningsbart kväve i åkermark vid höst- respektive
vårbearbetning i system med och utan fånggröda samt vid långvarig halmnedbrukning och
fånggrödeodling. Rapporter från Jordbearbetningen, 123, 31pp (In Swedish with English
summary). Swedish University of Agricultural Sciences, Uppsala.
Neumann, A., Torstensson, G. & Aronsson, H. 2011. Losses of nitrogen and phosphorus via the
drainage system from organic crop rotations with and without livestock on a clay soil in
southwest Sweden. Org. Agric. 1, 217-229.
Nitrates Directive, 1991, EC Environment, http://ec.europa.eu/environment/water/water-
nitrates/index_en.html
Nyborg, M. & Malhi, S.S. 1989. Effects of zero and conventional tillage on barley yield and
nitrate nitrogen content, moisture and temperature of soil in North-Central Alberta. Soil Till.
Res. 15, 1-9.
Nyborg, M., Solberg, E.D., Izaurralde, R.C., Malhi, S.S. & Molina-Ayala, M. 1995. Influence of
long-term tillage, straw and N fertilizer on barley yield, plant-N uptake and soil-N balance.
Soil Till. Res. 36, 165-174.
OSPAR, 1992. Convention for the Protection of the Marine Environment of the North-east
Atlantic,
http://www.ospar.org/html_documents/ospar/html/ospar_convention_e_updated_text_2007.pd
f
Power, J.F. & Peterson, G.A. 1998. Nitrogen transformation, utilization, and conservation as
affected by fallow tillage method. Soil Till. Res. 49, 37-47.
Puget, P. & Lal, R. 2005. Soil organic carbon and nitrogen in a Mollisol in central Ohio as
affected by tillage and land use. Soil Till. Res. 80, 201-213.
Reicosky, D.C. & Archer, D.W. 2007. Moldboard plow tillage depth and short-term carbon
dioxide release. Soil Till. Res. 94, 109-121.
Regina, K. & Alakukku, L. 2010. Greenhouse gas fluxes in varying soil types under conventional
and no-till practices. Soil Till. Res. 109, 144-152.
Rovira, A.D. & Greacen, E.L. 1957. The effect of aggregate disruption on the activity of
microorganisms in the soil. Austr. J. Agric. Res. 8, 659–673.
Roy, R.N., Finck, A., Blair, G.J. & Tandon, H.L.S. 2006. Plant nutrition for food security – A
guide for integrated nutrient management. FAO, Fertilizer and plant nutrition bulletin 16.
Food and agriculture organization of the United Nations. Rome 2006.
Ryan, M.H., Kirkegaard, J.A., Angus, J.F. 2006. Brassica crops stimulate soil mineral N
accumulation, Austr. J. Soil Res. 44, 367-377..
SAS Institute Inc., 2008. SAS/STAT® 9.2 Users´s Guide. Cary, NC: SAS Institute Inc .
SEPA, 2006. Näringsbelastning på Östersjön och Västerhavet. Swedish environmental protection
agency, Report 5815, Naturvårdsverket, SE 106 48 Stockholm.
SEPA, 2008. Näringsbelastning på Östersjön och Västerhavet 2008. Swedish environmental
protection agency, Report 5823, Naturvårdsverket, SE 106 48 Stockholm.
Shipitalo, M.J., Dick, W.A. & Edwards, W.M. 2000. Conservation tillage and macropore factors
that affect water movement and the fate of chemicals. Soil Till. Res. 53, 167-183.
71
Sieling, K., Gunther-Borstel, O., Teebken, T. & Hanus, H. 1999. Soil mineral N and N net
mineralization during autumn and winter under an oilseed rape – winter wheat – winter barley
rotation in different crop managements systems. J. Agri. Sci. 132, 127-137.
Silva, A.P., Babujia, L.C., Franchini, J.C., Ralisch, R., Hungria, M. & Fátima Guimaraes, M.
2014. Soil structure and its influence on microbial biomass in different soil and crop
management systems. Soil Till. Res. 142, 42-53.
Six, J., Bossuyt, H., Degryze, S. & Denef, K.A. 2004. History of research on the link between
(micro) aggregates, soil biota, and soil organic matter dynamics. Soil . Till. Res. 79,7-31.
SJV, 2011. Översyn år 2010 av känsliga områden enligt Nitratdirektivet. (Review 2010 of the
nitrate vulnerable zones according to the EU-nitrates directive. (In Swedish with English
summary) Rapport 2011:01. Swedish board of agriculture. Stockolm.
SJV, 2014,
http://www.jordbruksverket.se/amnesomraden/miljoklimat/ingenovergodning/omradenkanslig
aforvaxtnaringslackage.4.4b00b7db11efe58e66b8000929.html [2014-04-28].
SJVFS 2011. SJVFS 2011:25. Föreskrifter om ändring i Statens jordbruksverks föreskrifter och
allmänna råd (SJVFS 2004:62) om miljöhänsyn i jordbruket vad avser växtnäring. Swedish
Board of Agriculture, Stockholm (Sweden). In Swedish.
Smith, S.J. & Sharpley, A.N. 1993. Nitrogen availability from surface-applied and soil-
incorporated crop residues. Agron. J. 8, 776-778.
Stenberg, M., Aronsson, H., Lindén, B., Rydberg, T. & Gustafson, A. 1999. Soil mineral nitrogen
and nitrate leaching losses in soil tillage systems combined with a catch crop. Soil Till. Res.
50, 115-125.
Stenberg, M., Ulén, B., Söderström, M., Roland, B., Delin, K. & Helander, C-A. 2012. Tile drain
losses of nitrogen and phosphorus from fields under integrated and organic crop rotations. A
four-year study on a clay soil in southwest Sweden. Sc. Tot. Env. 434, 79-89.
Stockfisch, 1999. Ploughing effects on soil organic matter after twenty years of conservation
tillage in Lower Saxony, Germany. Soil Till. Res.52, 91-101.
Stålnacke et al., 2014. Temporal trends in nitrogen concentrations and losses from agricultural
catchments in the Nordic and Baltic countries. Agric. Ecosyst. Environ. In press: DOI:
10.1016/j.agee.2014.03.028.
Svensson, H., 2010. The effects on climate change in agriculture – an overview. In: Climate
change and Agricultural production in the Baltic Sea region. Focus on effects, vulnerability
and adaptation. Nordic Association of Agricultural Scientists (NJF), ISSN 1653–2015, pp. 23–
24.
Tate, R.L. Soil Microbiology. 1995. John Wiley & Sons, Inc. New York.
Thomsen, I.K. 2005. Crop N utilization and leaching losses as affected by time and method of
application of farmyard manure. Eur. J. Agron. 22, 1-9.
Thomsen, I.K., Lægdsman, M. & Olesen, J. 2010. Crop growth and nitrogen turnover under
increased temperatures and low autumn and winter light intensity. Agric. Ecosyst. Environ.
139, 187-194.
Thorup-Kristensen, K. & Dresbøll, D. B. 2010. Incorporation time of nitrogen catch crops
influences the N effect for the succeeding crop. Soil Use Manage. 26, 27-35.
72
Thorup-Kristensen, K., Magid, J. & Jensen, L.S. 2003. Catch crops and green manures as
biological tools in nitrogen management in temperate zones. Adv. Agron. 79, 227-302.
Torstensson, G. & Aronsson, H. 2000. Nitrogen leaching and crop availability in manured catch
crop systems in Sweden. Nutr. Cycl. Agroecosys. 56, 139-152.
Torstensson, G., Aronsson, H. & Bergström, L. 2006. Nutrient use efficiencies and leaching of
organic and conventional cropping systems in Sweden. Soil Use Manage. 98, 603-615.
Wallgren, B. & Lindén, B. 1994. Effects of catch crops and ploughing times on soil mineral
nitrogen. Swedish J. Agric. Res. 24:2, 67-75.
van deer Salm, C., Dolfing, M. & Velthof, G.L. 2006. Estimation of nitrogen losses via
deniftrification from a heavy clay soil under grass. Agric. Ecosyst. Environ. 119, 311-319.
Wang, J., Wang, D., Zhang, G., Wang, Y., Wang, C., Teng, Y. & Christie, P. 2014. Nitrogen and
phosphorus leaching losses from intensively managed paddy fields with straw retention.
Agric. Water Manage. 141, 66-73.
Watts, C.W, Eich, S. & Dexter, A.R. 2000. Effects of mechanical energy inputs on soil respiration
at the aggregate and field scales. Soil Till. Res. 53, 231-243.
Vinten, A.J.A., Vivian, B.J., Wright, F. & Howard, R.S. 1994. A comparative study of nitrate
leaching from soils of different textures under similar climatic cropping conditions. J. Hydrol.
159, 197-213.
Young, I.M. & Ritz, K. 2000. Tillage, habitat space and function of soil microbes. Soil Till. Res.
53, 201-213.

73
Acknowledgement
Financial support for this study was provided by the Swedish Farmers’
Foundation for Agricultural Research and the Swedish Board of Agriculture.
So many of you have contributed to this thesis in one way or another and you
are not all mentioned here. I am grateful for all the wonderful people I have
got to know thanks to this work.
Special thanks to:
My main supervisor and ‘boss’ Tomas Rydberg, who always believed in me,
encouraged me, taught me how to apply for research money and shared a lot of
his wisdom on life. Your passion for soils and soil tillage inspired me already
as a student.
Maria Stenberg, for supervision, for not letting me forget the practical aspect of
the research, for always being available and for hospitality during my stays in
Skara, but also for travelling, friendship and deliberating talks on dogs and
horses. Never stop laughing!
Johan, for supervision, revising and improving my writing with a sharp eye and
for good advice about a lot of things – and for your sense of humour.
Mulle, for helping out in the field and for showing me the brilliance in working
in a well-planned, well-structured, careful way and not being short of
manpower. And also for being the brightest star in the sky when coming to
make me feel good no matter what. For the hospitality you and Pia showed, all
nice dinners, hot baths and fun. It is possible this work would never have been
finished without you.
74
Bibbi, for help with all sorts of administrative tasks but also for friendship.
Gunnar Torstensson, for all technical support with the arrangements for soil
water sampling at Mellby, help with evaluation of drainage data and for
inspiring and instructive discussions on N-leaching.
The staff at the Rural Economy and Agricultural Society of Halland: Erik,
Magnus and Elisabeth for running the field experiment at Mellby and
managing the sampling at this site, the staff at Lönnstorp and Lanna research
station and the people in the laboratory: Allan, Rose-Marie, Christina, Annika
for friendly support and numerous analyses of soil and plants. I am convinced
that having the analyses performed within the department, facilitating good
communication, was of great value for the quality of the results.
Sixten for managing the field trial database, always willing to help. Johannes
Forkman and Ulf Olsson, for excellent help with the statistics and for patiently
handling a person trying to manoeuvre in an area in which she was more or less
lost. Dr Mary Mc Afee for improving the language of the manuscripts – and for
always being there on the other side of the North Sea no matter what time of
the day, it felt very secure during times of stress and worry.
All the staff at the Division of Soil and Water Management and my coffee,
party and everyday mates: Ararso, Elisabeth, Örjan, Lisbeth, Ragnar, Håkan,
Mats, Kerstin. And all previous co-workers and ‘soil tillers’ Sven Erik, Inge,
John, Urban, Thomas and many more for creating such a friendly working
atmosphere. Stefan for movies, music and other cultural events after work.
My beloved friends Maria, Anne, Miia, Christina, Jessica and Björn who have
been with me during all these years, and my fantastic neighbours in Hacksta
village, with special thanks to Heidi for nice ‘everyday chats’ - so valuable.
Also to all of my ‘stable-mates’: thanks for everyday life and training
company, making even the darkest November evening a happening.
Anna, Örjan and Elisabeth, for violin lessons and wonderful dinners during the
last year of writing. I really appreciate you sharing your musical world with me
and believing it is possible, and really trying, to teach me to play the violin.
My family, for love and support.


![Practical Conservation TillageThe Organic Farmer’s Dilemma: Tillage, Weeds, and Soil Health “The [organic] producer must select and implement tillage and cultivation practices](https://static.fdocuments.us/doc/165x107/5ed68d455cd0d56eef02e4d1/practical-conservation-tillage-the-organic-farmeras-dilemma-tillage-weeds-and.jpg)