Stocks and Distribution of Soil Carbon, Nitrogen ...
14
Vol.63 no.spe: e20190520, 2020 http://dx.doi.org/10.1590/1678-4324-solo-2020190520 ISSN 1678-4324 Online Edition Brazilian Archives of Biology and Technology. Vol.63 no.spe: e20190520, 2020 www.scielo.br/babt Article - Agronomy/Soil Science Stocks and Distribution of Soil Carbon, Nitrogen, Phosphorus and Sulfur in an Integrated Crop-Livestock System Treated with Phosphates Keli Cristina Silva Guera 1* https://orcid.org/0000-0003-3124-5628 Adriel Ferreira da Fonseca 2 https://orcid.org/0000-0002-2773-3250 Fernanda Ribeiro 3 https://orcid.org/0000-0001-6970-8814 1 State University of Ponta Grossa, Graduate Student of Program in Agronomy, Ponta Grossa, Paraná, Brazil; 2 State University of Ponta Grossa, Department of Soil Science and Agricultural Engineering, Ponta Grossa, Paraná, Brazil; 3 State University of Ponta Grossa, Undergraduate of Agronomy, Ponta Grossa, Paraná, Brazil Received: 2019.08.30; Accepted: 2020.03.02. *Correspondence: [email protected]; Tel.: +55-42-32203083 Abstract: Conservation agriculture practices can contribute to changes in soil nutrient dynamics over time. This experiment evaluated the changes in total stocks and distribution of carbon, nitrogen, phosphorus and sulfur concentrations in soil, during 60 months, in an integrated crop-livestock system (ICLS) due to anticipated fertilization of sources and doses phosphates applied in soil surface. The experiment was conducted over a period of five years, under Typic Dystrudept, using a randomized block design, in an incomplete factorial scheme (3×3+1), with four replications. Treatments consisted of three sources of P [triple superphosphate (TSP), rock phosphate – Arad (RP) and magnesium thermophosphate (MTP)], along with four doses of P (0, 60, 120 and 180 kg ha -1 P2O5 total). Samples of soil were collected in 0-5, 5-10, 10-15, 15-20 and 20-30 cm layers at 24, 36, 48 and 60 months after beggining of experiment where the following chemical attributes were evaluated: (i) total organic carbon (TOC); (ii) total nitrogen Kjeldahl (TNK); (iii) available P by ion exchange resin method (P-IER); and (iv) available S-SO4 2- . The ICLS conditions provided increased total stocks and concentrations of TOC, TNK, P-IER and S-SO4 2- over time. The applications of different phosphates had no influence on soil TOC concentrations during the five years of experimentation. HIGHLIGHTS Conservation agriculture practices under Typic Dystrudept increase stocks of C, N, P and S over time of five years. The annual applications of soluble phosphates to soil surface changes concentrations of phosphate and sulfate in the soil under no-tillage, in an integrated crop-livestock system. In situation of phosphorus-fixing soils, anticipated fertilization of sources and doses phosphates applied in the soil surface supply this nutrient for forage and grain crop production systems over time.
Transcript of Stocks and Distribution of Soil Carbon, Nitrogen ...

Vol.63 no.spe: e20190520, 2020 http://dx.doi.org/10.1590/1678-4324-solo-2020190520
ISSN 1678-4324 Online Edition
Brazilian Archives of Biology and Technology. Vol.63 no.spe: e20190520, 2020 www.scielo.br/babt
Article - Agronomy/Soil Science
Stocks and Distribution of Soil Carbon, Nitrogen, Phosphorus and Sulfur in an Integrated Crop-Livestock System Treated with Phosphates
Keli Cristina Silva Guera1* https://orcid.org/0000-0003-3124-5628
Adriel Ferreira da Fonseca2 https://orcid.org/0000-0002-2773-3250
Fernanda Ribeiro3
https://orcid.org/0000-0001-6970-8814
1State University of Ponta Grossa, Graduate Student of Program in Agronomy, Ponta Grossa, Paraná, Brazil; 2State University of Ponta Grossa, Department of Soil Science and Agricultural Engineering, Ponta Grossa, Paraná, Brazil; 3State University of Ponta Grossa, Undergraduate of Agronomy, Ponta Grossa, Paraná, Brazil
Received: 2019.08.30; Accepted: 2020.03.02.
*Correspondence: [email protected]; Tel.: +55-42-32203083
Abstract: Conservation agriculture practices can contribute to changes in soil nutrient dynamics over time.
This experiment evaluated the changes in total stocks and distribution of carbon, nitrogen, phosphorus and
sulfur concentrations in soil, during 60 months, in an integrated crop-livestock system (ICLS) due to
anticipated fertilization of sources and doses phosphates applied in soil surface. The experiment was
conducted over a period of five years, under Typic Dystrudept, using a randomized block design, in an
incomplete factorial scheme (3×3+1), with four replications. Treatments consisted of three sources of P [triple
superphosphate (TSP), rock phosphate – Arad (RP) and magnesium thermophosphate (MTP)], along with
four doses of P (0, 60, 120 and 180 kg ha-1 P2O5 total). Samples of soil were collected in 0-5, 5-10, 10-15,
15-20 and 20-30 cm layers at 24, 36, 48 and 60 months after beggining of experiment where the following
chemical attributes were evaluated: (i) total organic carbon (TOC); (ii) total nitrogen Kjeldahl (TNK); (iii)
available P by ion exchange resin method (P-IER); and (iv) available S-SO42-. The ICLS conditions provided
increased total stocks and concentrations of TOC, TNK, P-IER and S-SO42- over time. The applications of
different phosphates had no influence on soil TOC concentrations during the five years of experimentation.
HIGHLIGHTS
Conservation agriculture practices under Typic Dystrudept increase stocks of C, N, P and S over
time of five years.
The annual applications of soluble phosphates to soil surface changes concentrations of phosphate
and sulfate in the soil under no-tillage, in an integrated crop-livestock system.
In situation of phosphorus-fixing soils, anticipated fertilization of sources and doses phosphates
applied in the soil surface supply this nutrient for forage and grain crop production systems over
time.

2 Guera, K.C.S; et al.
Brazilian Archives of Biology and Technology. Vol.63 no.spe: e20190520, 2020 www.scielo.br/babt
The concentrations of TNK, P-IER and S-SO42- showed an increase in different layers of soil, with the
application of sources and doses of P. The P fertilization practice that was anticipated can consist of an
efficient management of soil fertility, using properly managed conservation systems.
Keywords: anticipated fertilization; soluble and insoluble phosphates in water; sustainable intensification;
nutrient cycling; conservation agriculture practices.
INTRODUCTION
Conservation agriculture practices can effectively contribute to enrichment of soil fertility, as well as
ensuring the sustainability of the agroecosystem. Thus, an integrated crop-livestock system (ICLS) is a
practice of soil conservationist management that, owing to its benefits (e.g., deposition of residues in the soil
(animals + plants) [1]; high nutrient cycling rate [2]; and the increase in the soil organic matter [3]), promotes
biotic and abiotic modifications in the soil-plant-atmosphere system, which alters the biogeochemical process
of soil nutrients [1,4].
The ICLS was widely evaluated in relation to carbon (C) gains in the soil [3-8] over several decades. On
the other hand, little is studied considering levels of nitrogen (N) and phosphorus (P) [7], and rare are those
that consider sulfur (S) [8], in ICLS. In these systems, cattle grazing alters direction, magnitude and
composition of nutrient fluxes, affecting residues decomposition and nutrient release rates. Thus, deposition
of organic residues in the soil, accumulation of carbon in the soil and maximization of above- and below-
ground plant development will promote higher nitrogen, phosphorus and sulphur levels in the soil. Moreover,
increase in the soil organic matter resulting from this production system, helps to reduce adsorption of anions
on the surfaces of colloids, such as phosphates and sulfates, over time, and can maximize efficient use of
phosphorus [9].
Among the most commonly used phosphate sources in Brazil are phosphates water-soluble, citrate
soluble and with low solubility in both water and citrate. The P sources that provide higher solubility, such as
triple superphosphate (TSP) and magnesium thermophosphate (MTP), present better performance in relation
to sources of lower solubility, such as rock phosphate (RP), since the latter phosphate guarantees release of
P [10]. In addition, the definition of phosphate fertilizer dose to be added to soil depends on the fertilization
practice adopted. Corrective fertilization followed by maintenance and the gradual construction of soil fertility
is basically the practices in use in Brazil. However, according to soil content, the dose should be adjusted to
recompose export by crop and achieve or maintain optimal soil content [11].
Anticipated fertilization is a practice that provides for total or partial application of recommended doses
of fertilizer to the summer crop at the time of sowing of the previous crop, in an incorporated form or at soil
surface [12]. Thus the application of soil surface P to winter crops is an interesting practice in production
systems such as ICLS, because it would improve P recycling, especially in the medium and/or long-term and
ensure a better time and operational efficiency in sowing summer crop [13]. However, scientific information
on practice of anticipated fertilization with different sources and doses of phosphates is still scarce, especially
in the medium and/or long-term in ICLS.
The aim was to evaluate the changes in total stocks and distribution of carbon, nitrogen, phosphorus and
sulfur concentrations in the soil, during 60 months, in an integrated crop-livestock system (ICLS) due to
anticipated fertilization of sources and doses phosphates applied in soil surface.
MATERIAL AND METHODS
Experimental site, design and management
The experiment was conducted over a period of five years (April 2009 to April 2014), in the municipality
of Castro - PR (24°51'49"S, 49°56'61"W, 1020 m asl), with the predominant climate being of Cfb type,
according to the Köppen classification, with a temperature of 16ºC, and an average annual precipitation of
1087 mm. The area was cultivated eight years ago under the no-tillage system. The soil is Typic Dystrudept
[14] (605, 225 and 170 g kg-¹ of clay, silt and sand, respectively). Quartz, kaolinite and gibbsite are the
predominant minerals in a clay fraction. The 0-20 cm soil layer at the beginning of the experiment had the
following attributes: pH (CaCl2) 4.8; total acidity (H + Al) 9.2 cmolc dm-3; base saturation 38%; Al3+, Ca2+, Mg2+
and K+ of 0.04; 3.1; 2.3 and 0.35 cmolc dm-3, respectively; P available [ion exchange resin (IER)] (P-IER) and

Stocks and distribution of nutrients in soil 3
Brazilian Archives of Biology and Technology. Vol.63 no.spe: e20190520, 2020 www.scielo.br/babt
available S-SO42- of 18 and 12.8 mg dm-3, respectively; total organic carbon (TOC) (Walkley-Black) and total
nitrogen Kjeldahl (TNK) [semi-micro-Kjeldahl]; of 29.6 and 2.0 g dm-3, respectively.
The experimental design was a randomized complete block design in an incomplete factorial scheme
(3×3+1), with four replications. Treatments consisted of different sources [triple superphosphate (TSP), rock
phosphate – Arad (RP) and magnesium thermophosphate (MTP)] and doses [absolute control (0 kg ha-1 of
total P2O5), 60, 120 and 180 kg ha-1 of total P2O5] of P. Quantities utilized from each source were calculated
based on total P2O5 content of fertilizers and applied annually at soil surface at the time of winter forage
sowing (anticipated fertilization). Chemical composition of different phosphate sources used is shown in Table
1.
Crops rotation that was followed during the experimental period of 60 months in ICLS were as follows:
(i) black oat (Avena strigosa Schreb.) (2009, 2011 and 2013); (ii) maize (Zea mays L.) (2009/10, 2011/12 and
2013/14); (iii) ryegrass (Lolium multiflorum L.) (2010 and 2012) and (iv) soybean (Glycine max L.) (2010/11
and 2012/13). Grain crops growth in plots measuring 273 m². Rotational grazing system was adopted,
separated into each block with 5525 m² each. Cattle used during the grazing period corresponded to 21
heifers of Dutch dairy cattle, with an average weight of 250 kg, equivalent to 5.2 animal units (U.A.). These
remained in each paddock for 4-7 days depending on forage species, also taking into account heights of
entrances (20 cm) and exits (10 cm) for cattle.
Table 1. Chemical composition of phosphate sources used during 60 months of evaluation experimental
Sources of phosphates
Chemical composition
Total P2O5 Water-
soluble P2O5
Citric acid-
soluble P2O5 CaO MgO SiO2
------------------------------------g kg-1-------------------------------
Triple superphosphate 460 380 - 130 - -
Rock phosphate - Arad 330 - 101 370 - -
Magnesium thermophosphate 180 - 165 180 70 100
The soil acidity control was carried out in 2008. After the beginning of the experiment (April 2009), no
liming was applied. However, except for P, all other nutrients were being applied at recommended doses,
according to results of soil chemical analysis and crop requirements, during the experimental period.
Potassium chloride (KCl) and urea [CO(NH2)2] fertilizers were used for the plants as sources of K and N,
respectively, and distributed at soil surface. Soybean seeds were inoculated with strains selected from
Bradyrhizobium japonicum and treated with cobalt and molybdenum at doses commonly used in that region
[15]. When necessary, other agronomic practices (e.g., seed treatment, weed control, pests and diseases)
were carried out in order to facilitate adequate growth and development of crops.
Soil sampling and chemical determination
In April, at 24, 36, 48 and 60 months after the beggining of the experiment, soil samples were collected
at the following depths: 0-5, 5-10, 10-15, 15-20 and 20-30 cm. Samples for analysis were composed of these
12 simple randomized samples to form a composite sample. After sampling, the soil was taken to the
laboratory in plastic bags, air dried at 40 °C, ground and sieved in a 2.0 mm mesh sieve for later analysis
[16]. Samples were analyzed to determine: (i) total organic carbon (TOC) by the Walkley-Black method and
factor-corrected for no-till managed soils [17]; (ii) total nitrogen by the semi-micro-Kjeldahl method (TNK); (iii)
available P by the IER method (Amberlite IRA-410 and Amberlite IRA-120) (P-IER) and; (iv) available S-SO42-
extract by ammonium acetate (0.5 mol L-1) in acetic acid (0.25 mol L-1) solution, and measure by turbidimetric
method. Total stocks were estimated to be 0-30 cm based on weighted average of soil layers analyzed.
Statistical analysis
The results of stock and distribution of TOC, TNK, P-IER and S-SO42- in the soil were submitted to
univariate statistical analysis according to the experimental model in a randomized complete block design.
In cases where significant F (p<0.05), Tukey test (α = 0.05) was applied. Equation (1) shows the statistical
model used for analysis of variance (ANOVA) for each soil layer evaluated (for stocks, 0-30 cm and, for

4 Guera, K.C.S; et al.
Brazilian Archives of Biology and Technology. Vol.63 no.spe: e20190520, 2020 www.scielo.br/babt
distribuition in the soil, 0-5, 5-10, 10-15, 15-20 e 20-30 cm). All statistical analyses were performed using
SAS Version 9.2 program (SAS Institute Inc. 9.1.2).
Yijkl = µ + Bi + Sj + Dk + Pl + (SD)jk + (SP)jl + (DP)kl + (SDP)jkl + Ɛijkl (1)
Where: μ = overall mean of experiment; B = blocks (i = 1, 2, 3, 4); S = phosphate sources (j = 1, 2, 3);
D = total P2O5 doses (k = 1, 2, 3, 4); P = experimentation periods (l = 1, 2, 3, 4) and; Ɛ = experimental error.
RESULTS
Stocks of soil carbon, nitrogen, phosphorus and sulfur in integrated crop-livestock system
The total stocks of TOC, TNK, P-IER and S-SO42- were strongly influenced by the experimentation period
(Table 2). The greater deposition of residues (vegetable + animal) in ICLS may have led to an increase in
stocks over time. There was a progressive annual addition in TOC stock (on average, 4.3 Mg ha-1 year-1) in
the 0-30 cm layer (Figure 1A). For TNK, a small annual increase (approximately 0.81 Mg ha-1 year-1) was
observed (Figure 1B). However, the sources and doses of total P2O5, did not change the total stocks for these
elements (Table 2).
The P-IER and S-SO42- stocks increased at 36 and 48 months (Figure 1C and 1D), where doses of total
P2O5 were applied. The P-IER stock in the soil was superior when applying 120 kg ha-1 of total P2O5. Higher
stocks of S-SO42- were observed in the absence of phosphate application (0 kg ha-1 of total P2O5). In this
case, plants showed a reduction in growth as a result of the absence of P, and consequently, they uptake
smaller amounts of nutrients, particularly S-SO42-.

Stocks and distribution of nutrients in soil 5
Brazilian Archives of Biology and Technology. Vol.63 no.spe: e20190520, 2020 www.scielo.br/babt
Table 2. F values for stocks and distribution of total organic carbon (TOC), total nitrogen Kjeldahl (TNK), available P (P-RTI) and S-SO4
2- in the different soil layers.
Sources of variation DF
Layers (cm)
0-30† 0-5 5-10 10-15 15-20 20-30
TOC
Sources1 2 1.32 ns 0.26 ns 1.11 ns 1.84 ns 0.42 ns 0.66 ns Doses2 3 1.31 ns 1.62 ns 0.35 ns 1.12 ns 0.70 ns 2.11 ns
Sources x Doses 6 1.73 ns 0.79 ns 2.23 ns 1.53 ns 1.17 ns 1.18 ns Periods3 3 27.97** 67.10** 19.56** 31.72** 46.63** 5.63**
Sources x Periods 6 0.02 ns 1.37 ns 0.49 ns 0.14 ns 0.10 ns 0.27 ns Doses x Periods 9 0.24 ns 0.69 ns 2.37* 0.77 ns 1.17 ns 0.47 ns
Sources x Doses x Periods 17 0.24 ns 0.72 ns 0.50 ns 0.23 ns 0.33 ns 0.61 ns
TNK
Sources 2 1.36 ns 0.23 ns 0.42 ns 3.55* 0.32 ns 0.48 ns Doses 3 1.71 ns 3.48* 5.39** 6.03** 1.23 ns 3.16*
Sources x Doses 6 0.66 ns 0.32 ns 0.27 ns 1.33 ns 0.39 ns 2.21 ns Periods 3 43.03** 3.59* 34.58** 53.72** 9.92** 20.91**
Sources x Periods 6 0.53 ns 0.20 ns 0.37 ns 3.60* 0.01 ns 0.26 ns Doses x Periods 9 1.20 ns 3.49** 2.05* 7.31** 0.62 ns 2.44*
Sources x Doses x Periods 17 0.35 ns 0.18 ns 0.31ns 0.74 ns 0.14 ns 0.99 ns
P-IER
Sources 2 2.67 ns 0.37 ns 3.46* 2.94 * 5.57* 0.06 ns Doses 3 42.09** 50.20** 14.66** 5.08** 4.89* 0.72 ns
Sources x Doses 6 1.45 ns 0.58 ns 1.67 ns 3.63 ns 4.10 ns 1.16 ns Periods 3 4.20** 4.68** 13.20** 31.52** 12.28** 23.16**
Sources x Periods 6 1.41 ns 0.76 ns 4.10** 3.28** 6.70** 1.38 ns Doses x Periods 9 1.24 ns 2.57* 4.10** 1.27 ns 3.46** 4.04**
Sources x Doses x Periods 17 0.99 ns 0.73 ns 1.75* 2.18** 1.83* 0.89 ns
S-SO42-
Sources 2 2.24 ns 0.25 ns 4.70* 4.25* 0.66 ns 1.80 ns Doses 3 4.26** 0.42 ns 0.18 ns 4.49** 9.88** 2.92*
Sources x Doses 6 0.97 ns 1.40 ns 1.36 ns 2.57 ns 0.48 ns 0.28 ns Periods 3 5.98** 12.61** 5.37** 15.32** 3.02* 15.73**
Sources x Periods 6 1.10 ns 1.59 ns 2.36* 1.42 ns 0.50 ns 3.06** Doses x Periods 9 0.62 ns 1.23 ns 2.29* 4.87** 2.87** 3.05**
Sources x Doses x Periods 17 1.15 ns 1.59 ns 0.71 ns 2.32** 1.51 ns 1.72 ns †Estimated layer, based on the weighted average of the analyzed soil layers, to evaluate total stocks. 1Source: three phosphate sources (triple superphosphate, rock phosphate and magnesium thermophosphate); 2Dose: four doses of P (0, 60, 120 and 180 kg ha-1 total P2O5); 3Periods of soil attribute evaluation: 24, 36, 48 and 60 months after the beginning of the experiment. *P <0.05. **P <0.01. ns: not significant.
Distribution of carbon, nitrogen, phosphorus and sulfur in the soil
The experimentation period explained (Table 2), on average, 33%, 34%, 15% and 20% of total data
variability, in different soil layers, for TOC, TNK, P-IER and S-SO42-, respectively. This shows that, over time,
conservation agriculture practices in an production system, such as ICLS, can influence on changes in the
distribution of TOC, TNK, P and S-SO42- in the soil. Higher concentrations of TOC in the soil were observed
at 48 and 60 months of experimentation, except for the 20-30 cm soil layer that presented higher
concentrations at 24 months (Figure 2).
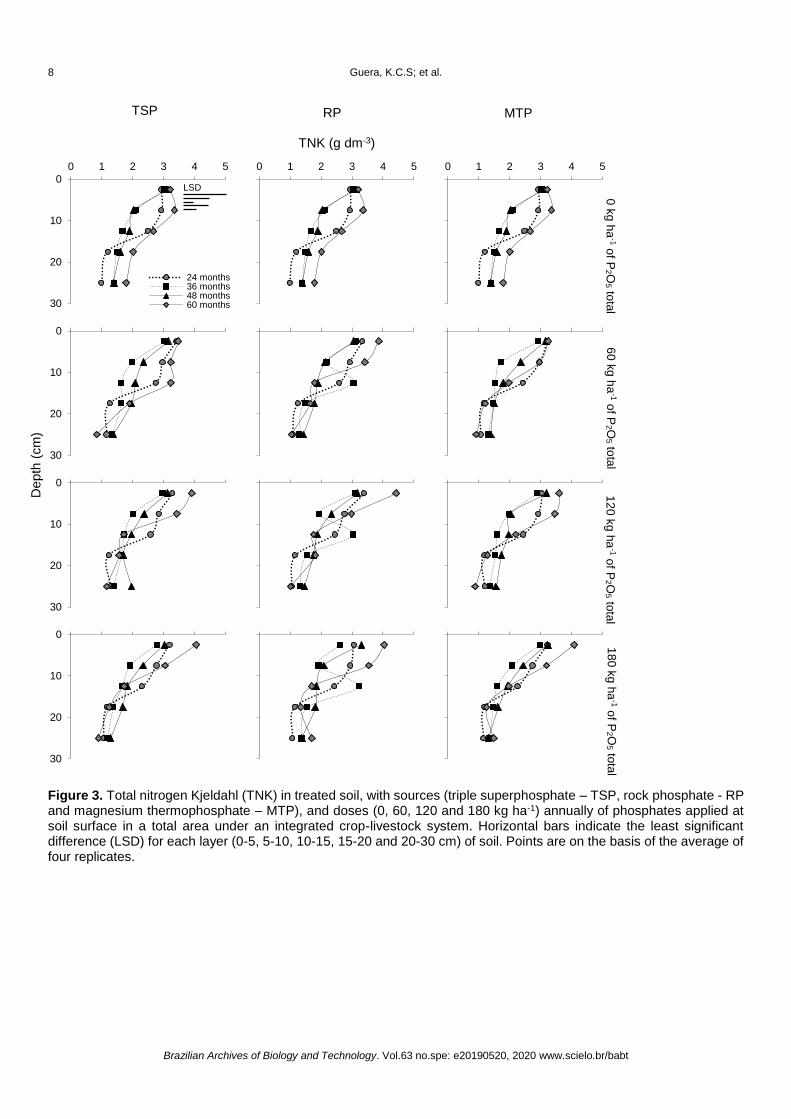
There was an increase of 83% (1.75 to 3.22 g dm-3) in TNK concentrations in the soil 10-15 cm layer,
with application of 180 kg ha-1 of total P2O5 as RP at 36 months of treatment as compared to other treatments
during the same period (Figure 3). For other layers of soil, TNK concentrations did not undergo any change
due to P fertilizers; however, the greatest values were observed at 48 and 60 months of experimentation.
The concentrations of P-IER and S-SO42-, in the 0-5 cm soil layer, were not influenced due to P fertilizers,
during five years of experimentation (Table 2). However, higher concentrations of P-IER (Figure 4) and S-
SO42- (Figure 5), in the 0-5 cm soil layer, was observed at 36 months. In the same conditions was also
observed the increase of 34% of P-IER (35.1 to 46.9 mg dm-3) as a result from the application of 120 kg ha-1
6 Guera, K.C.S; et al.
Brazilian Archives of Biology and Technology. Vol.63 no.spe: e20190520, 2020 www.scielo.br/babt
of total P2O5. For the 5-10, 10-15, 15-20 and 20-30 cm soil layers, higher concentrations of P-IER at 48
months due to the application of 180 kg ha-1 of total P2O5 as TSP.
Only the experimentation period changed the concentrations of S-SO42- in the 5-10 (48 and 60 months)
and 15-20 cm layer (36 months). An increase in concentrations was observed in the 10-15 cm layer of soil
with annual application of 180 kg ha-1 of total P2O5 in the form of TSP at 48 and 60 months of experimentation.
Also, in the 20-30 cm soil layer, the use of the same dose of total P2O5 increased the concentrations of S-
SO42-, but without any influence of different phosphate sources (Figure 5).
Figure 1. Stocks of (A) total organic carbon (TOC) (C.V.= 8.2%) and total (B) nitrogen Kjeldahl (TNK) (C.V.= 11.7%); and (B) available P by ion exchange resin (P-IER) (C.V.= 9.7%) and (C) available sulfate (S-SO4
2-) (C.V.= 8.8%) in the 0-30 cm layer of soil treated with soluble and insoluble in water phosphates, applied annually on soil surface in integrated crop-livestock system. Means followed by the same letters do not differ from each other according to Tukey’s test (P<0.05).
6.81
82.62
0
20
40
60
80
100
TOC
Mg
ha
-1
24 months 36 months
48 months 60 months
(A)
cb
a a
0
4
8
12
Mg
ha
-1
(A)
0
4
8
12
TNK
Mg
ha
-1
(B)
bc
b
a
43.70
g
0
20
40
60
P-IER
kg h
a-'
(C)
b
a aab
0
6
12
18
24
kg h
a-1
(C)
0
6
12
18
24
S-SO4²-
kg h
a-1
S-SO42-
bc
aab
c
(D)

Stocks and distribution of nutrients in soil 7
Brazilian Archives of Biology and Technology. Vol.63 no.spe: e20190520, 2020 www.scielo.br/babt
Figure 2. Total organic carbon (TOC) in treated soil, with sources (triple superphosphate – TSP, rock phosphate - RP and magnesium thermophosphate – MTP), and doses (0, 60, 120 and 180 kg ha-1) annually of phosphates applied at soil surface in a total area under an integrated crop-livestock system. Horizontal bars indicate the least significant difference (LSD) for each layer (0-5, 5-10, 10-15, 15-20 and 20-30 cm) of soil. Points are on the basis of the average of four replicates.
0
10
20
30
0 10 20 30 40
24 months36 months48 months60 months
0
10
20
30
0 10 20 30 40 0 10 20 30 40
0
10
20
30
0
10
20
30
0
10
20
30
TSP
TOC (g dm-3)
RP
MTP
0 k
g h
a-1 o
f P2 O
5 tota
l
Depth
(cm
)
60
kg
ha
-1 of P
2 O5 to
tal
12
0 k
g h
a-1 o
f P2 O
5 tota
l 1
80
kg
ha
-1 of P
2 O5 to
tal
LSD
8 Guera, K.C.S; et al.
Brazilian Archives of Biology and Technology. Vol.63 no.spe: e20190520, 2020 www.scielo.br/babt
Figure 3. Total nitrogen Kjeldahl (TNK) in treated soil, with sources (triple superphosphate – TSP, rock phosphate - RP and magnesium thermophosphate – MTP), and doses (0, 60, 120 and 180 kg ha-1) annually of phosphates applied at soil surface in a total area under an integrated crop-livestock system. Horizontal bars indicate the least significant difference (LSD) for each layer (0-5, 5-10, 10-15, 15-20 and 20-30 cm) of soil. Points are on the basis of the average of four replicates.
0
10
20
30
0 1 2 3 4 5
24 months36 months48 months60 months
0 1 2 3 4 5 0 1 2 3 4 5
0
10
20
30
0
10
20
30
0
10
20
30
TSP
RP
TNK (g dm-3)
0 k
g h
a-1 o
f P2 O
5 tota
l
Depth
(cm
)
MTP
60
kg
ha
-1 of P
2 O5 to
tal
12
0 k
g h
a-1 o
f P2 O
5 tota
l 1
80
kg
ha
-1 of P
2 O5 to
tal
LSD

Stocks and distribution of nutrients in soil 9
Brazilian Archives of Biology and Technology. Vol.63 no.spe: e20190520, 2020 www.scielo.br/babt
Figure 4. Available phosphorus by ion exchange resin method in treated soil, with sources (triple superphosphate – TSP, rock phosphate - RP and magnesium thermophosphate – MTP), and doses (0, 60, 120 and 180 kg ha-1) annually of phosphates applied at soil surface in a total area under an integrated crop-livestock system. Horizontal bars indicate the least significant difference (LSD) for each layer (0-5, 5-10, 10-15, 15-20 and 20-30 cm) of soil. Points are on the basis of the average of four replicates.
0
10
20
30
0 1 0 2 0 3 0 4 0 5 0
24 months36 months48 months60 months
0 1 0 2 0 3 0 4 0 5 0 0 1 0 2 0 3 0 4 0 5 0
0
10
20
30
0
10
20
30
0 1 0 2 0 3 0 4 0 5 0
0
10
20
30
0 1 0 2 0 3 0 4 0 5 0
0
10
20
30
0
10
20
30
0 1 0 2 0 3 0 4 0 5 0
0
10
20
30
0 1 0 2 0 3 0 4 0 5 0
0
10
20
30
0
10
20
30
0 1 0 2 0 3 0 4 0 5 0
0
10
20
30
0 1 0 2 0 3 0 4 0 5 0
TSP
P-IER (mg dm-3)
Depth
(cm
)
18
0 k
g h
a-1 o
f P2 O
5 tota
l
RP
MTP
12
0 k
g h
a-1 o
f P2 O
5 tota
l 6
0 k
g h
a-1 o
f P2 O
5 tota
l 0
kg
ha
-1 of P
2 O5 to
tal
LSD

10 Guera, K.C.S; et al.
Brazilian Archives of Biology and Technology. Vol.63 no.spe: e20190520, 2020 www.scielo.br/babt
Figure 5. Available sulfur (S-SO4
2-) in treated soil with sources (triple superphosphate – TSP, rock phosphate - RP and magnesium thermophosphate – MTP), and doses (0, 60, 120 and 180 kg ha-1) annually of phosphates applied at soil surface in a total area under an integrated crop-livestock system. Horizontal bars indicate the least significant difference (LSD) for each layer (0-5, 5-10, 10-15, 15-20 and 20-30 cm) of soil. Points are on the basis of the average of four replicates.
DISCUSSION
Impact of soil management system on carbon, nitrogen, phosphorus and sulfur stocks over time
Conservation agriculture (CA) practices, such as ICLS, results in higher deposition and quality of organic
residues, and an increase in the C, N, P and S stocks [1,3,18,19]. It has been observed when using global
meta-analysis, that CA practices can be increased to 3.3 Mg ha-1 of organic C in 0-30 cm layer of soil [8].
Increases in N and P stocks were also related in different regions of Brazil under ICLS. For these systems,
the 0-30 cm soil layer presented, on average, 3.94 Mg ha-1 of N and 49.5 kg ha-1 of P [7]. In our work, N
0
10
20
30
0 5 10 15
24 months36 months48 months60 months
0 5 10 15 0 5 10 15
0
10
20
30
0
10
20
30
0
10
20
30
S-SO42- (mg dm-3)
TSP
RP
MTP
Depth
(cm
)
0 k
g h
a-1 o
f P2 O
5 tota
l 6
0 k
g h
a-1 o
f P2 O
5 tota
l 1
20
kg
ha
-1 of P
2 O5 to
tal
18
0 k
g h
a-1 o
f P2 O
5 tota
l
LSD

Stocks and distribution of nutrients in soil 11
Brazilian Archives of Biology and Technology. Vol.63 no.spe: e20190520, 2020 www.scielo.br/babt
stocks were 6.81 Mg ha-1 of N, on average, during the five years of the experiment, and P stocks (43.7 kg
ha-1 of P) had similar results, compared to data found in other regions [7].
The fluxes between the soil-plant-atmosphere compartments are modified by introduction of animals into
production systems, through ingestion, consumption and return of nutrients to the soil (nutrient cycling)
[20,21]. Thus, the cycle of plant and animal residues becomes an important source of maintaining the
equilibrium of the agroecosystem, as it contributes to the supply of nutrients to the crops [22], and C
sequestration in the soil management systems [23]. In addition, defoliation process imposed by animals
allows greater activity in the roots and, consequently, increases release of organic compounds in the soil. In
this way, it favors storage of C in the soil, and ameliorates physical, chemical and biological soil attributes,
maximizing the release of nutrients through rhizodeposites [1,23].
Small C inputs from release of exudates and root renewal, boost P and S cycling [24]. Soil P stocks
increase considerably in ICLS. Compared to native vegetation (21.74 kg ha-1 of P), in ICLS, P stocks in the
0-30 cm soil layer more than doubled (49.50 kg ha-1 P) with the conversion to these systems [7]. This can be
explained by the addition of phosphate fertilizers to cultivated areas [9] and/or deposition of organic residues
in the soil [1,9].
However, the dynamics of P, after addition of a source in the soil, vary considerably depending on how
it is added (organic waste and/or fertilizer) [24], and this fact may interfere in the dynamics of other anions
present in the soil. In our work, phosphate sources did not interfere with changes in P and S stocks in the
soil. Nevertheless, the total P2O5 doses created a response gradient, where the presence of P in the soil led
to the displacement of S. Anions, such as phosphates, have a high affinity for oxides and hydroxides of iron
and aluminum. In this case, it has been observed that a decrease of inorganic anions adsorption with equal
or lesser affinity, such as sulfate, takes place over a wide pH range. The orthophosphate being present in
the soil solution in greater quantity can displace sulfate, due to higher adsorption affinity on colloid surface
and increased P in the presence of available S in the soil [25].
Studies on soil P and S stocks and their interactions are scarce, especially in ICLS [8]. P nutrition is
highly important, with global crop production restricted by phosphorus-fixing soils. In fact, it is estimated that
by the year 2050, a total of 169 to 365 million hectares of land will contain low levels of available P in world
[26]. In fact, agriculture places a high demand for phosphate fertilizers. Of the 14 essential nutrients to plants,
global reserves of P are the smallest [26-28]. Finally, nutrition S is of increasing importance due to reduction
of atmospheric inputs and decrease of additions of S into fertilizers or coated [8]. Thus, studies aimed at
elucidating storage and availability processes of P and S for plants are extremely important from the point of
view of the sustainability of cropping systems.
Carbon, nitrogen, phosphorus and sulfur soil distribution over time
In general, distribution of TOC, TNK, P-IER and S-SO42- in the soil was higher in the upper soil layer (0-
15 cm of soil) compared to deep soil layers. Studies have shown that soil C, N and P content decreases with
increasing soil depth [4,7]. However, CA practices, such as ICLS, concentrations of C and nutrients increase
over time [18,19]. Higher root yield of plants under grazing conditions [1,29] allows a greater accumulation of
C in the soil, thus becoming an important pool of C, and also promotes formation of biopores, leading to
migration of nutrients to deeper layers of the soil [9]. However, information about distribution of S in the soil
under ICLS, are still inconsistent. The applications of different phosphate sources had no influence on soil
TOC concentrations (Figure 2), and TNK, P-IER and S-SO42- concentrations in the soil surface layer of 0-5
cm. This is due to microbial activity, fed by high levels of C in a superficial layer, which has its mineralization
potentiated, releasing organic and inorganic forms in the soil solution [30,31]. Thus, this contributes
significantly to maintenance of high concentrations of elements in these layers of soil, not being changed by
use of different sources of P applied to the soil. In addition, a higher concentration of P is observed at the soil
surface due to low mobility, especially in no-tillage systems [32,33].
In the soil, in the 10-15 cm layer, TNK concentrations increased 83% due to RP treatment up to a
maximum dose (180 kg ha-1 of total P2O5) (Figure 3), at 36 months of experimentation. Under these conditions,
there was an increase in production of 1781 kg ha-1 of total dry matter in the soybean crop (crop grown in the
referred period) compared to other treatments in the same period. Nitrogen is one of the most important
ecosystemic nutrients, and its availability is directly linked to primary net production, as well as stabilization
12 Guera, K.C.S; et al.
Brazilian Archives of Biology and Technology. Vol.63 no.spe: e20190520, 2020 www.scielo.br/babt
of soil organic matter. The long-term storage of nitrogen-containing organic matter in the soil is attributed to
chemical complexity of nitrogen-rich plant residues and soil microbial activity [34].
The distribution of P-IER (below 5 cm soil layer) and S-SO42- (10-15 cm soil layer) changed due to
application of TSP at a dose of 180 kg ha-1 of total P2O5. The major water soluble fertilizers include simple
superphosphate (SSP), monoammonium phosphates (MAP), diammonium phosphates (DAP) and TSP. All
these compounds are readily soluble in the soil and readily release phosphates in the soil solution for plant
uptake [10]. Thus, P concentration increases in the soil, favored by migration of nutrients by formation of
bioporosity in ICLS.
For concentrations of S-SO42-, there are many factors that control sulfate adsorption and leaching. Some
of these factors are: (i) soil pH [35]; (ii) the presence of other anions, such as phosphate [35]; and (iii) organic
matter content [8]. The superficial layer of no-tillage soil presents unfavorable conditions to sulfate adsorption
due to additions of phosphate fertilizers, superficial application of limestone and practices that increase
organic matter content of soil. This conditions can lead to displacement of S from superficial layers, for deeper
layers of soil, over the long term [36].
In the 0-20 cm layer, P (on average, 17.8 mg dm-3) and S (on average, 5.1 mg dm-3) concentrations were
above critical levels, in addition to a high level of organic C (on average 29 g dm-3) [15,37] after 60 months
of experimentation. This shows that anticipated fertilization of P is an efficient practice using properly
managed conservation systems with no detriment to productivity [4762.8 and 10559.8 kg ha-1 in soybean
(2012/2013) and maize (2013/2014), respectively]. In addition, this practice provides greater efficiency in
sowing operation, resulting in a reduction of operational and total costs, when compared to the traditional
practice (sedding furrow application) [12,38].
During the 60 months of experimentation, experimental conditions favored high concentrations of carbon,
nitrogen, phosphorus and sulphur due to: (i) high clay content [11]; (ii) high organic matter content [3]; (iii)
high nutrient recycling [2]; (iv) no-tillage and no erosion [39]; (v) correct pasture management [1]; (vi) doses
used in response intervals of regional indications [15] resulting in maintenance of soil fertility, productivity and
sustainability of the production system.
CONCLUSIONS
Conservation agriculture practices, in an integrated crop-livestock system under Typic Dystrudept,
resulted in an increase in total stocks of organic carbon, nitrogen, phosphorus and sulfur available, over five
years, regardless of the phosphate source used. The concentrations of phosphorus and sulfur available in
the soil were changed with the annual applications of water-soluble phosphate on the soil surface, under no-
tillage in an integrated grain crops and forage system. The anticipated fertilization of sources and doses of
phosphates applied annually to the soil surface proved to be an efficient practice, guaranteeing supply of P
to crops over time and increasing soil fertility, without losses in productivity.
Funding: This research was funded by the National Council for Scientific and Technological Development (CNPq), Grant Numbers 484291/2011-4 and 310903/2018-1; and Araucaria Foundation, Grant Number 405/2009. Acknowledgments: The authors would like to thank the staff of the ABC Foundation for their valuable contribution to this study. Also, the International Plant Nutrition Institute (IPNI), Mineração Curimbaba, Coordination for the Improvement of Higher Education Personnel (CAPES), and National Council for Scientific and Technological Development (CNPq) for funding Conflicts of Interest: The authors declare no conflict of interest. The funders had no role in the design of the study; in the collection, analyses, or interpretation of data; in the writing of the manuscript, or in the decision to publish the results.
REFERENCES
1. Carvalho PCF, Anghinoni I, Moraes A, Souza ED, Sulc RM, Lang CR, Flores JPC, Lopes MLT, Silva JLS, Conte
O, Wesp CL, Levien R, Fontanelli RS, Bayer C. Managing grazing animals to achieve nutrient cycling and soil
improvement in no-till integrated systems. Nutr Cycl Agroecosyst. 2010 Apr; 88(2): 259-73.
2. Assmann JM, Martins AP, Anghinoni I, Denardin LGO, Nichel GH, Costa SEVGA, Silva RAP, Balerini F, Carvalho
PCF, Franzluebbers AJ. Phosphorus and potassium cycling in a long-term no-till integrated soybean-beef cattle
production system under different grazing intensities in subtropics. Nutr Cycl Agroecosyst. 2017 Jan; 108(1):21-
33.

Stocks and distribution of nutrients in soil 13
Brazilian Archives of Biology and Technology. Vol.63 no.spe: e20190520, 2020 www.scielo.br/babt
3. Hendrickson J, Colazo JC. Using crop diversity and conservation cropping to develop more sustanaible arable
cropping systems. In: Lemaire G, Carvalho PCF, Kronberg S, Recous S, editors. Agroecosystem diversity:
Reconciling contemporary agriculture and environmental quality. London: Academic Press; 2019. p. 93-108.
4. Assmann JM, Anghinoni I, Martins AP, Costa SEVGA, Cecagno D, Carlos FS, Carvalho PCF. Soil carbon and
nitrogen stocks and fractions in a long-term integrated crop–livestock system under no-tillage in southern Brazil.
Agric Ecosyst Environ. 2014 Dec;190:52-9.
5. Sá JCM., Cerri CC, Dick WA, Lal R, Venske Filho SP, Piccolo MP, Feigl BE. Organic matter dynamics and carbon
sequestration rates for a tillage chronosequence in a Brazilian oxisol. Soil Sci. Soc. Am. J. 2001 Sept-Oct;
65(5):1486–99.
6. Baker JM, Ochsner TE, Ventera RT, Giffis TJ. Tillage and soil carbon sequestration: What do we really know?, Agr.
Ecosys. Environ. 2007 Jan; 118(1-4):1–5.
7. Groppo JD, Lins SR, Camargo MPB, Assad ED, Pinto HS, Martins SC, Salgado PR, Evangelista B, Vasconcellos
E, Sano EE, Pavão E, Luna R, Martinelli LA. Changes in soil carbon, nitrogen, and phosphorus due to land-use
changes in Brazil, Biogeoscience. 2015 Aug; 12(15):4765–80.
8. Kopittke PM, Dalal RC, Finn D, Menzies NW. Global changes in soil stocks of carbon, nitrogen, phosphorus, and
sulphur as influenced by long‐term agricultural production. Global Change Biol. 2017 Sept; 23(6):2509-19.
9. Costa SEVGA, Souza ED, Anghinoni I, Carvalho PCF, Martins AP, Kunrath TR, Cecagno D, Balerini F. Impact of
an integrated no-till crop–livestock system on phosphorus distribution, availability and stock. Agr Ecosyst Environ.
2014 Dec;190:43-51.
10. Chien SH, Prochnow LI, Tu S, Snyder CS. Agronomic and environmental aspects of phosphate fertilizers varying
in source and solubility: an update review. Nutr Cycl Agroecosyst. 2011 July; 89(2):229-55.
11. Santos DR, Gatiboni LC, Kaminski J. Factors affecting the phosphorus availability and the fertilization management
in no-tillage system. Cienc Rural. 2008 Mar-Apr; 38(2):576-86
12. Francisco EAB, de Sousa Câmara GM, Segatelli CR. Nutritional status and production of goosegrass and soybean
cultivated in succession in anticipated fertilization system. Bragantia. 2007 Oct; 66(2):259-66.
13. Galetto, S.L., Fonseca, A.F., Harkatin, S., Auler, A.C., Carvalho, I.Q. Availability of phosphorus for maize in crop-
livestock integration system. Rev Cienc Agron. 2014 Aug; 45(5):956-67
14. Staff SS. Soil taxonomy: a basic system of soil classification for making and interpreting soul surveys. 2nd. USDA.
Natural Resources Conservation Service, Washington: Agricultural Handbook,United State of America; 1999.436
p.
15. Brazilian Society of Soil Science. Paraná State Nucleus. Manual of fertilization and liming for the state of Paraná,
SBCS/NEPAR. Brazilian Society of Soil Science. Curitiba: Paraná State Nucleus; 2017. 482p.
16. Pavan MA, Bloch MFM, Zempulski HC, Miyazawa M, Zocoler DC. Manual of soil chemical analysis and quality
control. IAPAR. Londrina: Agronomic Institute of Paraná, 1992; p. 38.
17. Ferreira AO, Sá JCM, Santos JB, Briedis C, Inagaki TM. Correction equations for wet combustion carbon
determination at different depths and management systems of a Rhodic Hapludox. J Agron Crop. 2015 July;
1(6):75-82.
18. Moraes A, Carvalho PCF, Anghinoni I, Lustosa SBC, Costa SEVGA, Kunrath TR. Integrated crop–livestock
systems in the Brazilian subtropics. Eur J Agron. 2014 Nov; 57:4–9.
19. Lemaire G, Franzluebbers A, Carvalho PCF, Dedieu B. Integrated crop–livestock systems: strategies to achieve
synergy between agricultural production and environmental quality. Agric Ecosyst Environ. 2014 Sep; 190:4–8.
20. Anghinoni I, Carvalho PCF, Costa SEVGA. Systemic approach to soil in integrated agricultural and livestock
production systems in the Brazilian subtropic. In: Araújo, AP, Alves BJR, editors. Topics in soil science. Viçosa:
Brazilian Society of Soil Science; 2013. p. 325-80.
21. Assmann JM, Anghinoni I, Martins AP, Costa SEVGA, Kunrath TR, Bayer C, Carvalho PCF, Franzluebbers AJ.
Carbon and nitrogen cycling in an integrated soybean-beef cattle production system under different grazing
intensities. Pesq. Agropec. Bras. 2015 Oct; 50(10):967-78.
22. Dubeux JCB, Sollenberger LE, Mathews BW, Scholberg JM, Santos HQ. Nutrient cycling in warm-climate
grasslands. Crop Science. 2007 Mar; 47(3):915-28.
23. Soussana JF, Lemaire G. Coupling carbon and nitrogen cycles for environmentally sustainable intensification of
grasslands and crop-livestock systems. Agric, Ecosyst. Environ. 2014 Dec; 190:9-17.
24. Bünemann EK, Condron LM. Phosphorus and sulphur cycling in terrestrial ecosystems. In: Marschner P, Rengel
Z, editors. Nutrient cycling in terrestrial ecosystems, Berlim: Springer; 2007. p. 65-92.

14 Guera, K.C.S; et al.
Brazilian Archives of Biology and Technology. Vol.63 no.spe: e20190520, 2020 www.scielo.br/babt
25. Geelhoed JS, Hiemstra T, Riemsdijk WHV. Phosphate and sulfate adsorption on goethite: Single anion and
competitive adsorption. Geochim Cosmochim Ac. 1997 Feb; 61(12):2389-96.
26. Roy ED, Richards PD, Martinelli LA, Della Coletta L, Lins SRM, Vazquez FF, Willig E, Spera SA, VanWey LK,
Porder S. The phosphorus cost of agricultural intensification in the tropics. Nat plants. 2016 Apr; 2(5):16043-9.
27. Rodrigues M, Pavinato PS, Withers PJA, Teles APB, Herrera WFB. Legacy phosphorus and no tillage agriculture
in tropical oxisols of the Brazilian savanna. Sci Total Environ. 2016 Sep; 542:1050-61.
28. Withers PJ, Rodrigues M, Soltangheisi A, de Carvalho TS, Guilherme LR, Benites VM, Gatiboni L, Sousa DMG,
Nunes RS, Rosolem CA, Andreote FD, Oliveira Jr A, Coutinho ELM, Pavinato PS. Transitions to sustainable
management of phosphorus in Brazilian agriculture. Sci. Rep. 2018 Feb; 8(1): 2537.
29. Martins AP, Cecagno D, Borin JBM, Arnuti F, Lochmann SH, Anghinoni I, Bissani CA, Bayer C, Carvalho PCF.
Long-, medium- and short-term dynamics of soil acidity in an integrated crop-livestock system under different
grazing intensities. Nutr Cycl Agroecosyst. 2016 Jan; 104(1):67-77.
30. Boitt G, Simpson ZP, Tian J, Black A, Wakelin SA, Condron LM. Plant biomass management impacts on short-
term soil phosphorus dynamics in a temperate grassland. Biol. Fert. Soils. 2018 Feb; 54(3):397-409.
31. Liang Z, Elsgaard L, Nicolaisen MH, Lyhne-Kjærbye A, Olesen JE. Carbon mineralization and microbial activity in
agricultural topsoil and subsoil as regulated by root nitrogen and recalcitrant carbon concentrations. Plant Soil.
2018 Sep; 433(1-2):65-82.
32. Pavinato PS, Merlin A, Rosolem CA. Phosphorus fractions in Brazilian Cerrado soils as affected by tillage, Soil Till.
Res. 2009 Out; 105(10):149–55.
33. Messiga AJ, Ziadi N, Bélanger G, Morel C. Soil nutrients and other major properties in grassland fertilized with
nitrogen and phosphurus, Soil Sci. Soc. of Am. 2013 June; 18(2):643–52.
34. Bingham AH, Cotrufo MF. Organic nitrogen storage in mineral soil: implications for policy and management. Sci
Total Environ. 2016 Feb; 551(1):116-26.
35. Barrow NJ, Debnath A. Effect of phosphate status and pH on sulphate sorption and desorption. Eur. J. Soil Sci.
2015 Mar; 66(2):286-97.
36. Churka Blum S, Caires EF, Alleoni LR. Lime and phosphogypsum application and sulfate retention in subtropical
soils under no-till system. J Soil Sci Plant Nutr. 2013 Sep; 13(2):279-300.
37. Raij BV, Cantarella H, Quaggio JA, Furlani AMC. Fertilizer and liming recommendations for the state of São Paulo,
2nd. IAC. Campinas: Agronomic Institute of Campinas;1997. 285 p.
38. Guareschi RF, Gazolla PR, Souchie EL, Rocha AC. Phosphate and potassium at sowing and anticipated on
soybean grown in soil from Cerrado. Semina: Cienc Agrar. 2008 Oct-Dec; 29(4):769-74.
39. Zibilske LM, Bradford JM, Smart JR. Conservation tillage induced changes in organic carbon, total nitrogen and
available phosphorus in a semi-arid alkaline subtropical soil. Soil Till Res. 2002 July; 66(2):153-63.
© 2020 by the authors. Submitted for possible open access publication under the terms and conditions of the Creative Commons Attribution (CC BY NC) license (https://creativecommons.org/licenses/by-nc/4.0/).