„Socio -Economic Assessment of the Danube Region: State … · 2 Progress on Competitiveness of...
96
Contact Dr. Marcus Kappler L 7, 1 68161 Mannheim P.O. Box10 34 43 68034 Mannheim E-Mail [email protected] Tel: +49 621-1235-157 Fax: +49 621-1235-223 „Socio-Economic Assessment of the Danube Region: State of the Region, Challenges and Strategy Development” First Progress Report September 2013 Centre for European Economic Research GmbH (ZEW) Mannheim Institute for Applied Economic Research (IAW) Tübingen The Vienna Institute for International Economic Studies (wiiw)
Transcript of „Socio -Economic Assessment of the Danube Region: State … · 2 Progress on Competitiveness of...

Contact
Dr. Marcus Kappler
L 7, 1 68161 Mannheim
P.O. Box10 34 43 68034 Mannheim
E-Mail [email protected] Tel: +49 621-1235-157 Fax: +49 621-1235-223
„Socio-Economic Assessment of the Danube Region: State of the Region, Challenges and Strategy Development”
First Progress Report
September 2013
Centre for European Economic Research GmbH (ZEW) Mannheim
Institute for Applied Economic Research (IAW) Tübingen
The Vienna Institute for International Economic Studies (wiiw)
Content
1
Content
0 Progress Summary .................................................................................. 2
1 The Socio-Economic Study of the Danube Region: Aim and Concept .... 5
1.1 Part I of the Project ................................................................................. 6
2 Progress on Competitiveness of the Danube Region: Potentials, Needs and Challenges ........................................................................... 11
2.1 Prosperity and Competitiveness ........................................................... 11
2.2 Entrepreneurship and SMEs ................................................................. 50
3 Progress on Cooperation and Networks to Increase Competitiveness in the Danube Region ............................................... 62
3.1 Networks and Initiatives in the Danube Region: International Cooperation of Administrative Bodies within the Region to Increase Competitiveness ................................................................................... 62
3.2 EU Development Policy towards Danube Region Countries at Various Stages of Alignment ................................................................. 66
3.3 Business Networks and Competitiveness Initiatives, Clusters and their International Networking ............................................................. 66
3.4 Networks and Initiatives of the Danube Region with Neighbouring Regions, International Cooperation of Administrative Bodies beyond the Danube Region .................................................................. 74
4 Annex .................................................................................................... 76
Progress Summary
2
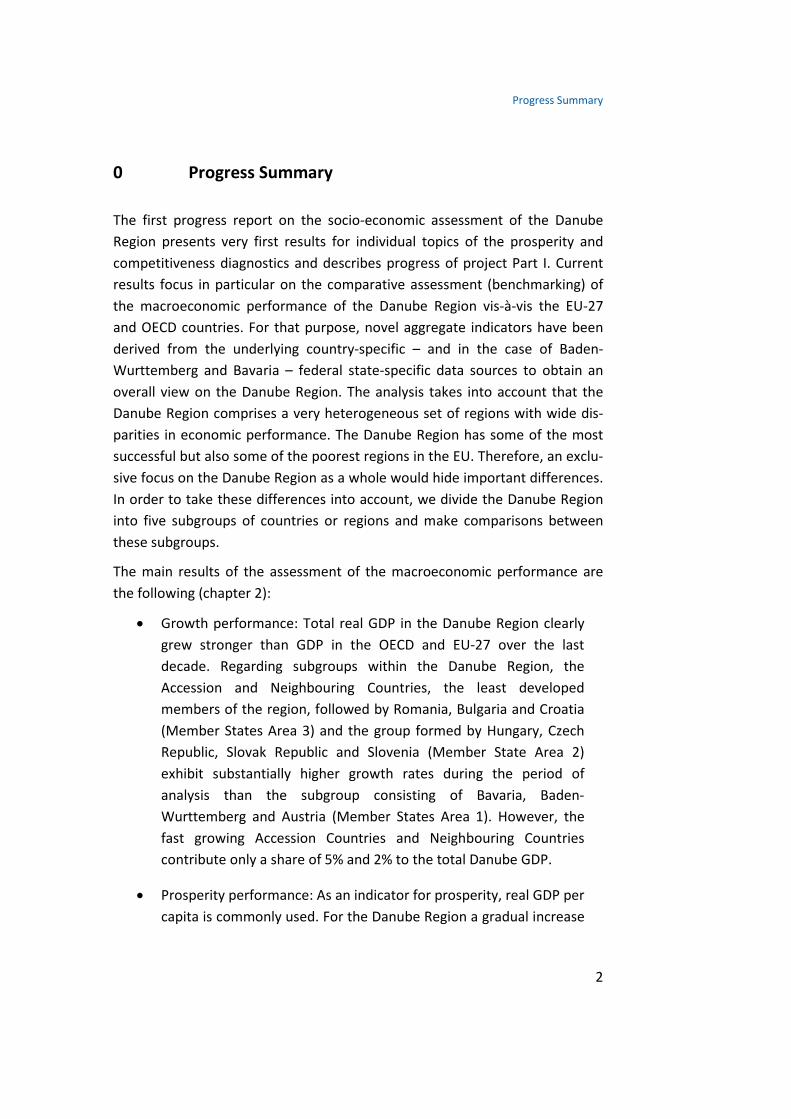
0 Progress Summary
The first progress report on the socio-economic assessment of the Danube Region presents very first results for individual topics of the prosperity and competitiveness diagnostics and describes progress of project Part I. Current results focus in particular on the comparative assessment (benchmarking) of the macroeconomic performance of the Danube Region vis-à-vis the EU-27 and OECD countries. For that purpose, novel aggregate indicators have been derived from the underlying country-specific – and in the case of Baden-Wurttemberg and Bavaria – federal state-specific data sources to obtain an overall view on the Danube Region. The analysis takes into account that the Danube Region comprises a very heterogeneous set of regions with wide dis-parities in economic performance. The Danube Region has some of the most successful but also some of the poorest regions in the EU. Therefore, an exclu-sive focus on the Danube Region as a whole would hide important differences. In order to take these differences into account, we divide the Danube Region into five subgroups of countries or regions and make comparisons between these subgroups.
The main results of the assessment of the macroeconomic performance are the following (chapter 2):
• Growth performance: Total real GDP in the Danube Region clearly grew stronger than GDP in the OECD and EU-27 over the last decade. Regarding subgroups within the Danube Region, the Accession and Neighbouring Countries, the least developed members of the region, followed by Romania, Bulgaria and Croatia (Member States Area 3) and the group formed by Hungary, Czech Republic, Slovak Republic and Slovenia (Member State Area 2) exhibit substantially higher growth rates during the period of analysis than the subgroup consisting of Bavaria, Baden-Wurttemberg and Austria (Member States Area 1). However, the fast growing Accession Countries and Neighbouring Countries contribute only a share of 5% and 2% to the total Danube GDP.
• Prosperity performance: As an indicator for prosperity, real GDP per capita is commonly used. For the Danube Region a gradual increase
Progress Summary
3
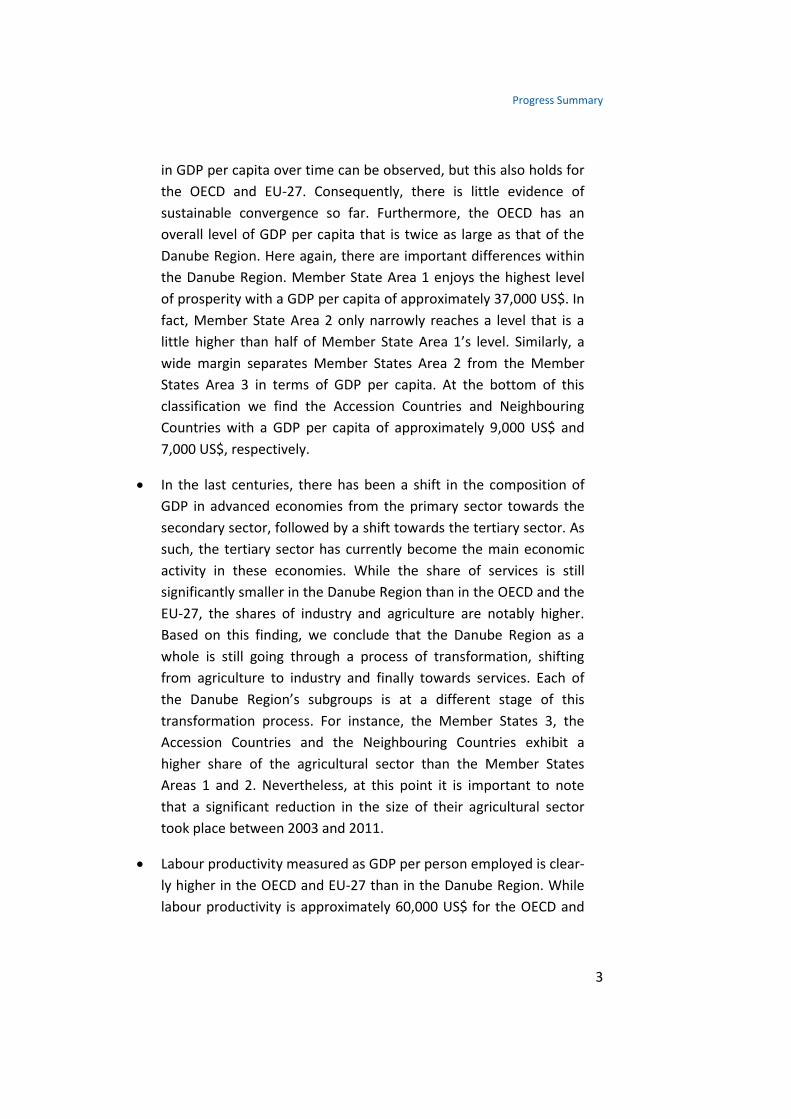
in GDP per capita over time can be observed, but this also holds for the OECD and EU-27. Consequently, there is little evidence of sustainable convergence so far. Furthermore, the OECD has an overall level of GDP per capita that is twice as large as that of the Danube Region. Here again, there are important differences within the Danube Region. Member State Area 1 enjoys the highest level of prosperity with a GDP per capita of approximately 37,000 US$. In fact, Member State Area 2 only narrowly reaches a level that is a little higher than half of Member State Area 1’s level. Similarly, a wide margin separates Member States Area 2 from the Member States Area 3 in terms of GDP per capita. At the bottom of this classification we find the Accession Countries and Neighbouring Countries with a GDP per capita of approximately 9,000 US$ and 7,000 US$, respectively.
• In the last centuries, there has been a shift in the composition of GDP in advanced economies from the primary sector towards the secondary sector, followed by a shift towards the tertiary sector. As such, the tertiary sector has currently become the main economic activity in these economies. While the share of services is still significantly smaller in the Danube Region than in the OECD and the EU-27, the shares of industry and agriculture are notably higher. Based on this finding, we conclude that the Danube Region as a whole is still going through a process of transformation, shifting from agriculture to industry and finally towards services. Each of the Danube Region’s subgroups is at a different stage of this transformation process. For instance, the Member States 3, the Accession Countries and the Neighbouring Countries exhibit a higher share of the agricultural sector than the Member States Areas 1 and 2. Nevertheless, at this point it is important to note that a significant reduction in the size of their agricultural sector took place between 2003 and 2011.
• Labour productivity measured as GDP per person employed is clear-ly higher in the OECD and EU-27 than in the Danube Region. While labour productivity is approximately 60,000 US$ for the OECD and

Progress Summary
4
the EU-27, the Danube Region exhibits a GDP per person employed of approximately 40,000 US$. The differences within the Danube Region are, again, conspicuous.
The preliminary conclusions on the assessment of cooperation and networks to increase competitiveness in the Danube Region are as follows (chapter 3):
• Cooperation in the Danube Region with the aim of increasing com-petitiveness is at its inception while some long-standing organiza-tions/initiatives at sub-regional and at EU level have been active for a longer period of time. Several initiatives set up specifically for the Danube Region are either projects with a limited number of partici-pants from several countries in the region, or initiatives of one or-ganization/country looking for partners. At this point of research it seems inconclusive to assess the potential of such initiatives.
• As a next step, cluster associations in the Danube Region have been targeted with a questionnaire to find out if they have activities or plan activities across borders within the Danube Region. Based on the first answers it is obvious that the definition of the Danube Re-gion in some border countries is more restrictive than the border of the country. In Bulgaria only the Northern regions consider them-selves part of the Danube Region. In Serbia only the DCCA members along the Danube consider themselves part of the Danube Region. Thus, for instance, the manager of the Chamber of Commerce and Cluster House in the town of Niš opines that they are not eligible for participating in Danube Region activities. A clarification in this re-spect would help mobilizing business networks in the Danube Re-gion.
The remainder of the progress report proceeds as follows. The first chapter sets forth aims and concepts of the first part of the project. The second chap-ter reports the current progress on the indicator-based competitiveness analy-sis of the Danube Region. The third chapter describes the progress of the as-sessment on existing cooperation and networks in the Danube Region.

The Socio-Economic Study of the Danube Region: Aim and Concept
5
1 The Socio-Economic Study of the Danube Region: Aim and Concept
The aim of the project is an indicator-based analysis of potential opportunities, needs, challenges, and recommendations, in order to enhance the competi-tiveness, the innovative strength, the attractiveness, and the prosperity of the entire region of the Danube riparian countries and regions, and to develop a strategic orientation with regard to transnational and interregional coopera-tion for the period from 2014 to 2020. From this overall aim we derive the following concept of the project:
• First, to assess the levels of prosperity and competitiveness in the region from a broad, socio-economic perspective by means of mac-ro- and microeconomic analyses drawing on a comprehensive set of outcome-based and input-based indicators. A further aim of the analysis is to take stock of the degree of economic integration with-in and across the Danube Region (DR). The outcome will be an indi-cator database for the DR and relevant benchmark countries and regions outside the DR.
• Second, to summarize the assessment in SWOT-styled, country- and region-specific tableaus in order to derive tentative suggestions for future pathways of political support. The outcomes are country- and region-specific scoreboards and tables with a set of preliminary recommendations for priority fields of action.
• Third, to assess the level and quality of network activities, the strength of current regional and interregional cooperation, and to identify potentials to stimulate cooperation since these are the means to enhance prosperity and competitiveness within the EU Strategy for the Danube Region (EUSDR). The outcome is a set of preliminary recommendations on cooperation potentials with which we enter the second stage of the project and continuously shape a vision for the implementation of the EUSDR in an on-going dialogue with the relevant stakeholders of the region. This vision should deliver strategies for fostering cooperation and identify pro-

The Socio-Economic Study of the Danube Region: Aim and Concept
6
jects that promote sustainable development and cover several re-gions and countries.
1.1 Part I of the Project
Competitiveness is defined and measured in very different ways and there is no unanimous definition of the concept.1 Regarding the level of analysis, com-petitiveness may be captured on different levels ranging from the supra-national to the national and regional level, down to the sector and firm level.2 Concerning substance and content, the factors that are believed to reflect competitiveness are equally varied and they are used and combined in a num-ber of different ways.
The measurement of competitiveness is thus performed in as many ways as the concept is defined: whereas some scholars deny that competitiveness as such even exists, others construct sophisticated indicators including a large number of parameters from the economic, social, environmental and political context. Important groups of indicators can be allocated, for instance, to the fields of market performance, price and quality, the ability to innovate, the structure of the labour market, the level of markets’ international integration, but even to the qualitative conditions of countries’ business environments.
As the present project aims at the comparative analysis of the competitiveness of nations (and, in the case of Baden-Wurttemberg and Bavaria, federal states) from which the competitiveness of the DR as a whole will be derived, im-portant sources relevant for the present study are the European Unions’ (DG Enterprise and Industry) yearly European Competitiveness Reports3 as well as the Global Competitiveness Report provided by the World Economic Forum
1 European Commission (2009), 'Special Report: Competitiveness Developments within the Euro Area. Brussels', Quarterly Report on the Euro Area 8(1), 18-49. 2 With regards to the underlying data, competitiveness indicators can be measured on the macro level (e.g. aggregate data on GNP) and on the micro level (e.g. firm-level data on productivity). 3 Most recent report: European Commission (2012) Reaping the Benefits of Globalization. European Competitiveness Report 2012. Commission Staff Working Document SWD (2012) 299 final. Luxembourg.

The Socio-Economic Study of the Danube Region: Aim and Concept
7
(WEF).4 Both reports include wide ranges of basic and composite indicators from the economic, societal and political spheres and they allow for detailed comparisons between countries. For our analyses in the present project, we will use readily available indicators of these and further reports as far as pos-sible and reasonable, and we will complement them by additional indicators that will be specially compiled for the countries of the DR. In addition, our local experts will provide qualitative information, in particular in fields such as entrepreneurship and SMEs that are covered only sparsely by available sources.
Figure 1: The concept of prosperity and competitiveness measurement
The present study defines competitiveness as the set of factors, institutions and policies that affects the level of macroeconomic and microeconomic productivity which enables a country to achieve a high and sustainable path of income and prosperity. It thus builds on a broad understanding of competi-
4 Most recent report: Word Economic Forum (2012) The Global Competitiveness Report 2012-2013. Geneva.

The Socio-Economic Study of the Danube Region: Aim and Concept
8
tiveness by including the relevant factors that make a country or region attrac-tive for doing business and a place for generating job and employment oppor-tunities. Fundamental requirements are the mobilisation of production factors (labour and capital), institutional, organizational and local conditions that en-hance the efficiency of factor inputs, and factors that drive business and inno-vation.
We thereby distinguish between a macro dimension (mainly referring to framework conditions at the national level) and a micro dimension, which re-lates to factors driving business operation and success (see Figure 1). Im-portant factors at the macro level are different types of institutions, e.g. regu-latory frameworks, the educational system or openness to trade, countries’ endowments with infrastructure and characteristics of the labour market. At the micro-level, we focus on business dynamics, particularly with regards to SMEs, on innovation activities, as well as on the structure and development of sector and regional clusters.
Figure 2: The pillars to assess the state of the Danube Region
At the operational level, we break down the work load of Part I along three work packages, each of which constitutes a pillar of the socio-economic and competitiveness assessment of the DR (Figure 2). The following leaders and scientific contacts have been assigned:

The Socio-Economic Study of the Danube Region: Aim and Concept
9
• Prosperity and Competitiveness (Work Package 1): lead by IAW, scientific contact: Günther Klee, [email protected]
• Entrepreneurship and SMEs (Work Package 2): lead by ZEW, scien-tific contact: Jürgen Egeln, [email protected]
• Cooperation and Networks (Work Package 3): lead by wiiw, scien-tific contact: Gabor Hunya, [email protected]
The implementation of the socio-economic and competiveness assessment rests on three layers (Figure 3):
• A database of quantitative and qualitative indicators that will be compiled from various sources according to the project’s topics and objectives. This annual database will cover indicators for each indi-vidual country of the DR, and in particular for the DR at the aggre-gate level since a central aim of the project is to assess and upgrade the competitiveness of the macro-region. Also relevant benchmark regions such as the Eurozone, the EU 27, EU 15, the USA and the OECD region will be considered. The data base has a temporal di-mension showing indicators for the past years up to the most re-cent available year in order to assess changes over the recent past. In addition, if available, the database will include forecasts for se-lected headline indicators.
• Scoreboards that are meant to condense the information from the database in order to provide clearly arranged region and country profiles. The scoreboards will contain selected headline indicators for each pillar and topic. Comparisons with analogue scoreboards for benchmarking regions or adjacent countries will help to identify country and DR specific strengths and potentials with regard to so-cio-economic development and competitiveness. The exact decom-position of the indicators will be elaborated over the course of the implementation of project Part I.
• Region and country profiles in SWOT-style overview tables which are the main outcome of the analytical assessment. These profiles will summarize the potentials, needs and challenges for each DR country and for the DR as a whole. They will include a set of prelim-

The Socio-Economic Study of the Danube Region: Aim and Concept
10
inary recommendations to enhance the competitiveness, the inno-vative strength, the attractiveness, and the prosperity of the entire region through better cooperation and deeper networks. The rec-ommendations will also identify funding resources, e.g. by national or international funding agencies.
Figure 3: The implementation and outcomes of Part I

Progress on Competitiveness of the Danube Region: Potentials, Needs and Challenges
11
2 Progress on Competitiveness of the Danube Region: Potentials, Needs and Challenges
2.1 Prosperity and Competitiveness
2.1.1 Introduction
The Danube Region is largely a European Union (EU) territory, especially after the EU enlargements from 2004 and 2007, hence, the need of a European Un-ion Strategy for the Danube Region whose main objective is to reinforce the integration of the Region in the EU.5
Since the end of the Cold War (1989), most countries sharing a border with the EU have gone through change on an unprecedented scale. In many ways the European Union has been an important factor behind this change: succes-sive waves of EU enlargement have extended its external borders outwards from the borders of the founding Member States, turning former neighbours into current Member States while creating new neighbours along its new ex-ternal borders.
Since the foundation of the EU, the number of Member States has more than quadrupled, the EU population has risen to half a billion citizens, and many of the 15 countries that surrounded the European Economic Community (EEC) in 1970 have become Member States. In terms of output, however, the com-bined GDP of countries surrounding the EU today is just a fraction of the lat-ter’s GDP. This is a reflection not only of the economic success of the EU, but mainly the fact that many of the countries surrounding it today are relatively poor and still in a developing stage (whereas many of the countries surround-ing it in 1970 were at an economic level comparable to that of the founding Member States).6
The Danube Region
The EUSDR deals primarily, but not exclusively, with: Germany (Baden-Wurttemberg and Bavaria), Austria, the Slovak Republic, the Czech Republic, Hungary, Slovenia, Romania, Bulgaria and (since July 2013) Croatia within the
5 EUSDR: Communication from the Commission to the European Parliament, the Council, the European Economic and Social Committee and the Committee of the Regions. 6 European Competitiveness Report 2012: Reaping the benefits of globalization.

Progress on Competitiveness of the Danube Region: Potentials, Needs and Challenges
12
EU, and Serbia, Bosnia and Herzegovina, Montenegro, the Republic of Moldo-va and Ukraine.7
The region exhibits very wide disparities. It has some of the most successful but also some of the poorest regions in the EU.8
The current level of integration and comprehensive interdependency of the region as a whole is quite unprecedented. This opens up prospects for sustain-able development and faster convergence based on a closer cooperation and well-designed regional policies.
An important feature of the region is its relatively high (yet varying) degree of trade integration. In most Danube Region countries, the share of German ex-ports is overwhelming. For instance, more than 20% of total Austrian, Czech, Slovakian, Slovenian and Hungarian exports go to Germany. On the other hand, Bulgaria, Romania, Serbia, Bosnia and Herzegovina, Montenegro as well as Ukraine and Moldova display divergent trade specialization patterns.9
The Danube Region also has many opportunities. It has many areas of out-standing natural beauty, as well as a rich history, heritage and culture. There is immense development potential, especially in the countries most affected by the transitions since 1989. There are creative ideas, and a quality labour force.10
In the following we compare the Danube Region with other regional aggre-gates, namely OECD and EU-27, to be able to better judge the Danube Re-gion’s competiveness and position in the world.
In order to take the differences within the regions into account we further divide the Danube Strategy Region into five subgroups. The Member State Area 1 consists of Bavaria, Baden-Wurttemberg and Austria. Whereas Bavaria and Baden-Wurttemberg are two of the most important economic regions of
7 EUSDR: Communication from the Commission to the European Parliament, the Council, the European Economic and Social Committee and the Committee of the Regions. 8 And European Competitiveness Report 2012: Reaping the benefits of globalization. 9 European Competitiveness Report 2012: Reaping the benefits of globalization. 10 EUSDR: Communication from the Commission to the European Parliament, the Council, the European Economic and Social Committee and the Committee of the Regions.

Progress on Competitiveness of the Danube Region: Potentials, Needs and Challenges
13
Germany which form part of the European Union since its foundation, Austria joined in 1995.
The Member State Area 2 is made up of Hungary, the Czech Republic, Slovak Republic and Slovenia. All these countries became members in the, so far big-gest (in terms of number of states), enlargement of the European Union in 2004.
Member State Area 3 contains Romania, Bulgaria and Croatia. Whereas Roma-nia and Bulgaria joined in 2007, Croatia is the most recent and newest mem-ber of the Union, since it joined in July of 2013.
The Accession Countries are Serbia, Bosnia and Herzegovina, as well as Mon-tenegro. The status of a candidate for accession has been given to Montene-gro in 2010 and to Serbia in 2012, while Bosnia and Herzegovina remains a potential candidate for accession.
The Neighbouring Countries are Ukraine and Moldova.
A brief characterization of the subgroups of the Danube Region
Member State Area 1: (Austria, Bavaria, Baden-Wurttemberg)
Bavaria and Baden-Wurttemberg are two of the most economically important and strongest regions in Germany; therefore Bavaria and Baden-Wurttemberg, as well as Austria are among the wealthiest members in the European Union. While Germany has been a part of the EU since the Union’s foundation, Aus-tria joined in 1995. Both countries have also been part of the euro area (Euro Zone) since the creation of the monetary union. They all have low unemploy-ment rates, solid competitive economies and a good investment climate.
Bavaria and Baden-Wurttemberg both have great rates of innovation especial-ly in the high-tech industry, research and development. In Baden-Wurttem-berg the industry is orientated towards the production of cars, mechanical engineering, electrical engineering and the chemical industry. Bavaria’s indus-try is turned towards the IT sector, as well as the car industry, media and the defense industry. In 2009 the real GDP growth turned negative for all three members, Baden-Wurttemberg recorded negative growth rates of about -9.15 percentage points (highest value in the Danube Region, except for Ukraine),

Progress on Competitiveness of the Danube Region: Potentials, Needs and Challenges
14
but recovered rapidly in the consecutive years. In GDP per capita a gradual growth (except during the economic crisis) is notable for all three members. In terms of productivity the Member State Area 1 also scored the highest level in comparison with the other subgroups. All in all, Member State Area 1 can be denominated as the wealthiest and most developed subgroup within the Dan-ube Region.11
Member State Area 2: (Hungary, Czech Republic, Slovakia, Slovenia)
In 2004 the biggest enlargement of the European Union to date took place and the four countries that form the Member State Area 2 were all part of it. They were also hit hard by the economic crisis and still suffer from the consequenc-es and economic contractions. GDP growth in 2012 was negative for all except the Slovak Republic. Also, the expected growth rates for the coming years are rather small or still negative (Czech Republic and Slovenia).
Hungary currently has two main aims: the creation of one million new jobs and reforms concerning competitiveness. In the meantime the Czech Republic, which is strongly orientated towards industry, especially the car industry, suf-fers from a high financial deficit.
Slovakia and Slovenia have joined not just the European Union, but also the euro area in 2009 and 2007, respectively. Whereas Slovakia suffers from high unemployment, especially among the youth and falling real wages, Slovenia is facing a severe banking crisis. Up to 2008 the economy took pride in its strong long term economic growth, thanks to investments and strong exports. How-ever, during the crisis these components contracted and the country still fights against the consequences of the crisis. In spite of these setbacks it joined the OECD in 2010.12
Member State Area 3: (Bulgaria, Romania and Croatia)
This group contains three of the poorest countries within the European Union (comparing GDP per capita, PPP).
11 Baden-Wurttemberg: Statistisches Landesamt Baden-Wurttemberg, Austria: Deutsches Auswärtiges Amt, Bavaria: Statistisches Landesamt Bavaria. 12 Federal Foreign Offices (Deutsches Auswärtiges Amt).

Progress on Competitiveness of the Danube Region: Potentials, Needs and Challenges
15
While Bulgaria and Romania already joined the EU in 2007, Croatia with its accession in 2013 is the newest member of the Union. They share the same problems concerning corruption; therefore the EU started a monitoring pro-gram for Bulgaria and Romania after their accession, which was meant to in-crease the pressure for reforms. Corruption, together with judicial systems that leave much to be desired, hampers the business environment and in-vestment climate.
Thanks to a strict austerity policy in recent years the Member State Area 3 exhibits solid public finances.
All three countries have a functioning market economy and are able to cope with the competitive pressure within the Union due to structural reforms in recent years. Yet further reforms are needed with respect to public admin-istration, employment (Croatia and Bulgaria), infrastructure and education (Bulgaria).
In Bulgaria an increasing absorption of EU funds can be observed in compari-son with previous years, still the responsible actor for applications (public ad-ministration) leaves much room for improvements, concerning efficiency. The need for investments is great and the country has to fight against demograph-ic changes, with younger people leaving the country to look for jobs elsewhere and a decreasing birth rate.
Romania faces a weak domestic demand since the crisis and a rather elevated inflation. Its dependence on the euro area is relatively high.
Meanwhile in Croatia, reforms are still needed with respect to employment.13
Accession Countries: (Serbia, Bosnia and Herzegovina, Montenegro)14
The accession countries Serbia and Montenegro already have reached the “candidate for accession” status, while Bosnia and Herzegovina is considered a “potential candidate”. They all still have deficits regarding the fulfillment of the Copenhagen Criteria in several areas. For economic development, the
13 Deutsches Auswärtiges Amt. 14 EU-Commission: Conclusion Report 2012 (Serbia, Bosnia and Herzegovina, Montene-gro).
Progress on Competitiveness of the Danube Region: Potentials, Needs and Challenges
16
hampered and partly poor business environment, which is also affected by a high level of corruption, defected rule of law and partly meager infrastructure, represents a major obstacle. Some reforms and progress have been noted in the recent past, but further improvements are needed in order to provide a safe and trustworthy business environment. The labour market conditions are far from optimal and the unemployment rate is rather high.
In recent years some progress has been made towards a functioning market economy but there is still a long way to go in order for the countries to be able to cope with the competitive pressure and market forces within the European Union.
Neighbouring Countries (Ukraine, Moldova):
The Neighbouring countries are former Soviet republics and share the corre-sponding post-communist legacy. More than 20 years after gaining independ-ence, they are still politically unstable and suffer from democratic deficits (to varying degrees).
They belong to the low-income to medium-income economies with a strong adverse legacy in their economic structures. Despite their relatively low per capita income level, they are highly industrialized and have an educated popu-lation and a relatively well-qualified labour force. They also have close ties with the EU in terms of culture, history and values.15
The banking system in both countries is generally stable and well capitalized. On the contrary, both countries still present notable deficits in their judicial systems. Moldova’s growth is supported by private consumption, which is financed through the remittances of Moldavians working in other countries. Ukraine needs to improve its image as a destination for FDI.
2.1.2 Gross Domestic Product (GDP)
Table 1 includes information about GDP of the subgroups and their respective total growth rates in the Danube Region for selected points in time or periods.
15 European Competitiveness Report 2012: Reaping the benefits of globalization.

Progress on Competitiveness of the Danube Region: Potentials, Needs and Challenges
17
Table 1: GDP and GDP growth rates for OECD, EU-27, the Danube Region and its subgroups
GDP in Billion, constant 2005€
2003 2011 Growth 2003-2012
(in %) EU-27 10,586 11,768 11.2 OECD 27,234 30,697 12.7 DANUBE 1,370 1,626 18.7 Member Area 1 921 1,062 15.3 Member Area 2 236 293 24.0 Member Area 3 124 157 26.0 Accession Countries 27 35 31.6 Neighbouring Countries 62 79 28.0
Figure 4: Real GDP (constant 2005€) in 2011
Member States_1: A,BW,BY
65%
Member States_2:
H,CZ,SK, SLO 18%
Member States_3: HR,BG,RO
10%
Acc. Countries 2% Neighb.
Countries 5%
Source: Eurostat, UNdata, Worldbank, Statistische Ämter des Bundes und der Länder. Calculation and illustra-tion: IAW.
Source: Eurostat, UNdata, Worldbank, Statistische Ämter des Bundes und der Länder. Calculation and illus-tration: IAW. Data for Neighbouring Countries and Bosnia and Herzegovina for 2012 forward not available in constant 2005 €.

Progress on Competitiveness of the Danube Region: Potentials, Needs and Challenges
18
Figure 4 shows the percentage shares of real GDP with which the five sub-groups within the Danube Region contribute to the GDP of the whole region in 2011.
Total GDP of the Danube Region amounts to 1,626 billion euros in 2011 in comparison to 1,370 billion euros in 2003 (See Table 1).
In 2011 the group formed by Austria, Baden-Wurttemberg and Bayern ac-counts for 65% of the GDP of the whole Danube Region compared to 67% in 2003 (Annex Figure 37). Hungary, the Czech Republic, Slovenia and the Slovak Republic together amount to 18% of the Danube Region’s GDP in 2011, which implies an increase by one percentage point in comparison with 2003.
The third group formed by Croatia, Bulgaria and Romania exhibits a share of 10% of total Danube Region GDP in 2011, which also exceeds the group’s share in 2003 by one percentage point.
By contrast, the shares of Accession Countries and Neighbouring Countries in total Danube Region GDP amount to 2% and 5% respectively, both in 2011 and 2003.
Table 1 shows the total real GDP growth experienced by the Danube Region, OECD and EU-27 from 2003 to 2011. The Danube Region’s growth rate during the observed period is substantially higher than the ones for OECD and EU-27. Table 1 also shows the total real GDP growth experienced by the subgroups within the Danube Region from 2003 to 2011. The area 1 formed by Bavaria, Baden-Wurttemberg and Austria grew by 15% from 2003 to 2011, the area 2 formed by Hungary, the Czech Republic, the Slovak Republic and Slovenia by 24%, the area 3 composed by Croatia, Bulgaria and Romania by 26%, Acces-sion Countries by 31,6% and Neighbouring Countries by 28%.
INFO BOX: Methodological explanation
We make use of real data, i.e. constant 2005€ in order to facilitate comparability among the subgroups of the Danube Region, since we are interested in the current state and the development of production/income and not in the development of the prices in each of these subgroups.

Progress on Competitiveness of the Danube Region: Potentials, Needs and Challenges
19
Figure 5: Real GDP growth (%)
Figure 5 shows real GDP growth calculated as percentage change on the pre-vious year from 2004 until 2011 for the whole Danube Region, OECD and EU-27. Real GDP growth evolution for OECD and EU-27 stays approximately con-stant from 2004 until 2007 at 3%. From 2007 until 2009, coinciding with the financial crisis, the series shows a sharp decrease reaching its lowest value in 2009 with a growth rate of -4%. In 2010 real GDP growth shows signs of an incipient recovery with a rate of approximately 2%. In 2011 the series again exhibits a slight decrease, however not comparable with the sharp drop expe-rienced in 2009. On the contrary, the Danube Region presents higher real GDP growth rates than OECD and EU-27 over the period 2004 to 2008 as well as during the period after the financial crisis. More specifically, growth rates amount to 7% for the Danube Region and 4% for the OECD and EU-27 in the years preceding the financial crises. During the financial crisis, i.e. the period from 2007 to 2009, the drop suffered by real GDP growth in the Danube Re-
-10%
-8%
-6%
-4%
-2%
0%
2%
4%
6%
8%
10%20
04
2005
2006
2007
2008
2009
2010
2011
% c
hang
e on
pre
viou
s yea
r(20
05€)
OECD
DANUBE
EU 27
Source: Eurostat, UNdata, Worldbank, Statistische Ämter des Bundes und der Länder Calculation and illustration: IAW.

Progress on Competitiveness of the Danube Region: Potentials, Needs and Challenges
20
gion is bigger than the one experienced by the EU-27 and OECD countries. In 2009 the Danube Region experienced a real GDP growth rate of -8%.
Given this information, one could conclude that real GDP growth is more vola-tile in the Danube Region than in the OECD and EU-27 during the observation period, implying that growth is higher in times of an economic boom and low-er in times of an economic crisis. One could also say the Danube Region’s re-covery from the crisis seems to be faster than in the countries of the OECD and EU-27.
Regarding the development of real GDP growth from 2004 until 2011 in the different subgroups of the Danube Region, the Member States have experi-enced a negative real GDP growth rate of approx. -6% in 2009, while Accession Countries exhibit a negative growth rate of “only” approx. -3.5%. The Neigh-bouring Countries have suffered more intensively from the consequences of the financial crisis, resulting in a negative growth rate of -14% in 2009. (Annex Figure 38).
2.1.3 Prosperity Indicator
Figure 6 shows real GDP per capita, PPP adjusted for the Danube Region com-pared with OECD and EU-27. For all three aggregates, GDP per capita shows a gradual raise, although it’s also clearly visible that there exist sharp changes for the years around 2008/2009. The slightly higher slope of the Danube Re-gion series could be interpreted as a modest convergence.
OECD level is well above the other two and swings around an average of about 30,000 US $ (2005, PPP) per capita. This is closely followed by the EU-27 for which GDP per capita moves in a range between 26,000 US$ and 28,000US$ (2005, PPP). The Danube Region follows at an overall level between 15,000US$ and 18,000US$ (2005, PPP).
As there is no data available yet for Bavaria and Baden-Wurttemberg, we could infer its development by taking a closer look at the data for entire Ger-many. This reveals that for 2010 there exists a positive growth rate of 5.3 per-centage points and for 2011 a positive growth rate of 2.7 percentage points, so we can see a recovery taking place. With a high degree of certainty we can assume that Baden-Wurttemberg and Bavaria as two of the most import eco-nomic areas in Germany do not act anti-cyclical. With a majority of positive

Progress on Competitiveness of the Danube Region: Potentials, Needs and Challenges
21
growth rates from the other countries for 2010 and 2011 we can presume that the entire Danube Region will have undergone a recovery in 2010 and 2011.
Figure 6: GDP per capita, PPP adjusted
Regarding the GDP per capita levels of the subgroups within the Danube Re-gion, the countries forming the group Member States 1 enjoy the highest prosperity level with a GDP per capita level around 37,000 US$. A wide margin separates them from the Member States 2, which have a GDP per capita of around 20,000 US$, followed by Member States 3 with approximately 14,000 US$, Accession Countries with 9,000 US$ and Neighbouring countries with ca. 7,000 US$ per inhabitant. The tendency for GDP per capita for all subgroups is a rising one (Annex Figure 39).
0
5,000
10,000
15,000
20,000
25,000
30,000
35,000
2003
2004
2005
2006
2007
2008
2009
2010
2011
in 2
005
US
$
DANUBE
OECD
EU 27
Source: OECD, Penn World Tables, Worldbank, GENESIS online Datenbank. Calculation and illustration: IAW. Data for years 2010 and 2009 were not available for BW and BY, thus preventing the creation of a Bench-mark for the whole Danube Region for the above mentioned years.

Progress on Competitiveness of the Danube Region: Potentials, Needs and Challenges
22
2.1.4 GDP components and sectors
There are three different approaches to measure Gross Domestic Product: the income approach, the expenditure approach and the output approach. Here we focus on the last two methods, i.e. the expenditure and the output ap-proach.
GDP main aggregates (Expenditure side)
Figure 7 shows the GDP share of the GDP components (private and public con-sumption, investment and net exports) in the Danube Region, OECD and EU-27 in 2010. In 2010, private consumption share of GDP in the Danube Region is 56.7%, public consumption share is 18.5%, investment share is 20.2% and net exports share is 3%. In 2010, private and public consumption shares are slight-ly lower in the Danube Region than in the EU-27 and OECD. On the contrary, investment and net exports shares of GDP are higher in the Danube Region than in the OECD or EU-27.
Comparing component shares of GDP in the Danube Region between 2004 and 2010, it can be pointed out that the shares of net exports and public con-sumption have increased by 0.4 and 0.7 percentage points respectively, while
INFO BOX: Methodological explanation
The expenditure approach is based on the fact that the aim for most goods and ser-vices produced in an economy is to be sold. Therefore, Gross Domestic Product can be calculated as the sum of the following components: private consumption, public con-sumption, investment and net exports.
The output approach, also called Value Added method, consists of calculating GDP as the sum of “Total gross value added“ and “Taxes less subsidies on products”. Gross value added is the net result of output valued at basic prices less intermediate con-sumption valued at purchaser’s prices. Gross value added is calculated before the consumption of fixed capital.
Gross value added can be broken down by economic activities, being the most com-mon classification of the division into Agriculture and Fishery, Industry and Services sector.

Progress on Competitiveness of the Danube Region: Potentials, Needs and Challenges
23
the shares of investment and private consumption have decreased by 1.4 and 0.5 percentage points respectively (Annex Figure 11).
Figure 7: GDP components in 2010
Figure 8 shows the GDP share of the GDP components (private and public con-sumption, investment and net exports) in the subgroups within Danube Re-gion in 2010. It can be pointed out that in 2010 in the first two groups from the left, private consumption has a share of GDP of approximately 50%, public consumption and investment 20% each and Net exports share is positive and lies over 3%.
Furthermore, in 2010 the third group and the Neighbouring Countries have a private consumption share of GDP that lies at approximately 60% and a nega-tive net exports GDP share that lies around -4%. Group 3 exhibits an invest-ment share of GDP of 24% while for the Neighbouring countries it is at approx-
56.7 58.1 62.9
18.5 22.2 19.6
20.2 18.7 18.1
3.0 1.0
-0.6
-20
0
20
40
60
80
100
120
DANUBE EU 27 OECD
in %
Private consumption Public consumption Investment Net exports
Source: Eurostat, UNdata, Worldbank, Bayerisches Landesamt für Statistik, Landesamt für Statistik Baden-Wurttemberg, Statistische Ämter des Bundes und der Länder. Calculation and illustration: IAW. Danube Region does not hit the 100 %mark because proxies have been used for net exports for Bavaria and Baden-Wurttemberg.

Progress on Competitiveness of the Danube Region: Potentials, Needs and Challenges
24
imately 19%. Public consumption presents GDP shares of 17% and 20% respec-tively.
Figure 8: GDP components in 2010
The Accession Countries, in contrast, present values that deviate significantly from the common pattern. While public consumption and investment exhibit GDP shares similar to those of the other areas, that is, shares that lie around 20% in each case; the private consumption share of GDP in 2010 is 83% and net exports exhibit a GDP share of -19%.
Comparing the GDP shares of the GDP components in 2010 with the values of 2004, we can observe the following facts (Annex Figure 47): In the group formed by Hungary, the Czech Republic, the Slovak Republic and Slovenia, the
54,5 53,3 62.6 83.1
65.2
17,6 21,1 17.2
21.1
20.4 19,1 22,1
24.0
18.1
18.6 5,2 3,5
-3.9 -19.1
-4.2
-40
-20
0
20
40
60
80
100
120
140
MemberStates_1:A,BW,BY
MemberStates_2:
H,CZ,SK, SLO
MemberStates_3:HR,BG,RO
Acc. Countries Neighb.Countries
in %
Private consumption Public consumption Investment Net exports
Source: Eurostat, UNdata, Worldbank, Bayerisches Landesamt für Statistik, Landesamt für Statistik Baden-Wurttemberg, Statistische Ämter des Bundes und der Länder. Calculation and illustration: IAW. 2010: The most recent year with complete data coverage. For Member State Area 1, 100 %mark is not reached because for Bavaria and Baden-Wurttemberg proxies have been used for net exports.

Progress on Competitiveness of the Danube Region: Potentials, Needs and Challenges
25
investment share of GDP has decreased; furthermore, this group has corrected its current account imbalances by turning from a negative net export GDP share to a positive one. The Neighbouring countries have increased their pri-vate consumption share of GDP mainly at the expense of deteriorating their current account, since net exports share of GDP has turned negative.
In contrast to this, the group formed by Croatia, Bulgaria and Romania has improved its current account balance, even if net export share of GDP remains negative, mainly at the expense of reducing the private consumption share of GDP. Accession countries have carried out a big effort to improve their current account imbalances mainly at the expense of reducing investment share of GDP. In spite of this effort, net exports share is still negative. The expenditure structure in the group formed by Bayern, Baden-Wurttemberg and Austria has not changed much between 2004 and 2010.
Figure 9 shows the total growth rate of GDP components, i.e. private and pub-lic consumption, investment, exports and imports, between 2003 and 2010 in the Danube Region, OECD and EU-27. The Danube Region imports exhibit the highest growth rate between 2003 and 2010 with an approximate rate of 50%. Exports are in second place with an approximate total growth rate of 43%. The third position is occupied by private consumption with a growth rate of ap-proximately 18%, followed by public consumption. Investment exhibits a growth rate of approximately 5% over the period 2003 to 2010.
Comparing these results with GDP component growth rates over the analyzed period for the OECD and EU-27, we need to point out that with the exception of public consumption, which exhibits similar growth rates in all three regions all components show a stronger growth in the Danube Region than in the OECD or EU-27. Furthermore, in contrast with the EU-27 and OECD, imports have grown more than exports in the Danube Region.

Progress on Competitiveness of the Danube Region: Potentials, Needs and Challenges
26
Figure 9: Growth rates of real GDP components from 2003 to 2010
Figure 10 shows the total growth rates of GDP components, i.e. private and public consumption, investment, exports and imports, between 2003 and 2010 in the subgroups within Danube Region. There are substantial differ-ences between these subgroups. Private consumption and investment exhibit low growth between 2003 and 2010 in the group formed by Baden-Wurttemberg, Bavaria and Austria. Export and import growth rates, by con-trast, amount to around 40%, with import growth slightly exceeding export growth.
In the Member State Area 2 private consumption and investment also have low growth rates. Especially noteworthy is the fact that imports have grown around 55% over this period while exports have grown around 75%.
0
10
20
30
40
50
60
DANUBE EU 27 OECD
in %
private consumption public consumption Investment Imports Exports
Source: Eurostat, UNdata, Worldbank, Bayerisches Landesamt für Statistik, Landesamt für Statistik Baden-Wurttemberg, Statistische Ämter des Bundes und der Länder. Calculation and illustration: IAW. No data available for Bosnia and Herzegovina, Montenegro, Moldova and Ukraine for 2012.

Progress on Competitiveness of the Danube Region: Potentials, Needs and Challenges
27
The group formed by Croatia, Bulgaria and Romania exhibit, with the excep-tion of public consumption, which stayed almost constant over the analyzed period, growth rates of its GDP components that lie over 40%. Import growth rates between 2003 and 2010 lie over 75%, thus, clearly exceeding export growth which exhibits a rate of approximately 50%.
Investment and import growth between 2003 and 2010 in the Accession Coun-tries lies around 60%, while export growth is around 80%. Private and public consumption exhibit growth rates of approximately 30% and 20%, respective-ly.
Imports and private consumption in the Neighbouring Countries exhibit growth rates of over 80% between 2003 and 2010. Public consumption has grown by approximately 10% over this period while exports and investment present a negative growth rate of approximately 10% over the analyzed peri-od.
Several observations can be made with respect to the yearly growth rates, i.e. percentage change from the previous year, of the different GDP components (private and public consumption, investment, exports and imports) in the Danube Region, OECD and EU-27. (Annex Figure 42 to Figure 46).
The analyzed period is from 2004 to 2011. Investment, exports and imports are the most volatile GDP components, since one-period growth rates range from +15% to -15%. Growth rates of -15% are reached in 2009, coinciding with the burst of the financial crisis.
One striking fact is that with the exception of public consumption, the remain-ing GDP components grow more strongly in the Danube Region than in the EU-27 and OECD in times of an economic boom, while they exhibit weaker growth rates in times of an economic crisis. Summarizing, we could say that the de-velopment of GDP components in the Danube Region shows a stronger link to the economic cycle than in the EU-27 and the OECD.

Progress on Competitiveness of the Danube Region: Potentials, Needs and Challenges
28
Figure 10: Growth rates of real GDP components from 2003 to 2010
All GDP components, with the exception of public consumption, exhibit posi-tive growth rates before and after the burst of the financial crises, which points to a rapid recovery. On the contrary, in 2009 all mentioned GDP com-ponents show negative growth rates.
Public consumption, in contrast, increases during the financial crisis (2009). This is probably due to the expansionary fiscal policies carried out in most of the economies of the world at the burst of the financial crisis.
Sectoral structure (Output approach)
Figure 11 demonstrates the composition of GDP between the regional aggre-gates for the year 2010. It is quite obvious that the sectorial component for services has the highest share in the composition of all three regional aggre-
-10
0
10
20
30
40
50
60
70
80
90
MemberStates_1:A,BW,BY
MemberStates_2:
H,CZ,SK, SLO
MemberStates_3:HR,BG,RO
Acc. Countries Neighb.Countries
in %
private consumption public consumption Investment Imports Exports
Source: Eurostat, UNdata, Worldbank, Bayerisches Landesamt für Statistik, Landesamt für Statistik Baden-Wurttemberg, Statistische Ämter des Bundes und der Länder. Calculation and illustration: IAW. No data available for Bosnia and Herzegovina, Montenegro, Moldova and Ukraine for 2012.

Progress on Competitiveness of the Danube Region: Potentials, Needs and Challenges
29
gates. While the OECD and EU-27 services share of GDP lies over 70% and has increased by approximately 2 percentage points from 2003 (Annex Figure 49) to 2010, the Danube Region remains below 70%, at around 64%. This share also does not change significantly between 2003 and 2010. The already rela-tively small share that agriculture holds (at around 2% for OECD and EU-27 and 3% for Danube) decreases over the depicted period for all three regional aggregates. For OECD and EU-27 the share of the secondary sector also de-creases over time (by about 2 percentage points), while it increases for the Danube Region (by a little above 1 percentage point).
Figure 11: GDP sectors in 2010
64.5 73.5 74.3
2.5 1.7 1.5
33.5 24.7 24.2
0
20
40
60
80
100
120
DANUBE EU 27 OECD
in %
Servicies, value added Agriculture, value added Industry, value added
Source: Eurostat, Worldbank, Statistische Ämter der Länder. Calculation and illustration: IAW. Anomalies are caused by rounding up or down.

Progress on Competitiveness of the Danube Region: Potentials, Needs and Challenges
30
Figure 12: GDP sectors in 2010
Figure 12 shows the GDP share of the main economic activities (Services, In-dustry and Agriculture) in the subgroups within the Danube Region in 2010.
In 2010 the Member States 1 group exhibits GDP shares of the services, indus-try and agriculture sectors of 65.6%, 33.4% and 0.9% respectively. In compari-son with 2003 (Annex Figure 50), the share of the service and agriculture sec-tor has decreased while the share of the industry sector has increased.
The Member States 2 group presents a similar economic structure to that of the Member States 1. The main difference is a bigger agricultural sector (2.9 % of GDP) and a smaller services sector. In comparison with 2003, this group shows an increase in the GDP share of the service and industry sector and a decrease in the agricultural sector.
The Accession Countries and the Neighbouring Countries, on the contrary, present agriculture shares of GDP of approximately 9%. In the case of the Ac-
65.6 62.3 58.9 64.4 60.9
0.9 2.9 6.2 9.4 8.9
33.4 34.0 34.6 26.2 30.2
0
20
40
60
80
100
120
MemberStates_1:A,BW,BY
MemberStates_2:
H,CZ,SK, SLO
MemberStates_3:HR,BG,RO
Acc. Countries Neighb.Countries
in %
Services, value added Agriculture, value added Industry, value added
Source: Eurostat, Worldbank, Statistische Ämter der Länder. Calculation and illustration: IAW. Anomalies are caused by rounding up or down.

Progress on Competitiveness of the Danube Region: Potentials, Needs and Challenges
31
cession Countries this translates into a smaller industry sector while for the Neighbouring Countries it translates into a smaller service sector.
In comparison with 2003, both country groups have succeeded in reducing the size of their agricultural sector, and especially noteworthy is the change that the Neighbouring Countries have experienced.
The Member States 3 group exhibits GDP shares of the diverse economic activ-ities, i.e. services, industry and agriculture of 58.9%, 34.6% and 6.2%. It clearly lies between the more advanced economies of the Danube Region (Member States 1 and Member States 2) and those who are still catching up (Accession Countries and Neighbouring Countries). In comparison with 2003, the agricul-tural sector has strongly diminished in size, while the industry sector has gained importance.
In the last century there has been a shift in the composition of GDP in indus-trialized countries from the primary and secondary sector towards the tertiary sector, which meanwhile has become the most important sector in advanced economies. The annual growth rates for the Danube Region range between those of the OECD and EU-27. In the pre-crisis era the growth rates have been positive or at least constant for all three regional aggregates. During the eco-nomic crisis the growth rates turned negative and declined steeply. OECD suf-fered the least dramatic drop and recovered rapidly, while the Danube Region and EU-27 suffered a deeper decline with the lowest point reaching a negative annual growth rate of -5% and -6%, respectively. After 2009 the growth rate for EU-27 turns positive again. Industry, also known under the term secondary sector, is generally placed second in the composition of GDP from the production side. Here the parallel movements of the growth rates are obvious. The Danube Region has the high-est growth rates, followed by EU-27 and then OECD. During the economic cri-sis the growth rates turned negative and suffered a steep decline. Whereas, OECD underwent a relatively moderate decline, the EU-27 and the Danube Region reached a negative growth rate of nearly -20%. The recovery for OECD and EU-27 follows closely and they got back or even overtook pre-crisis level growth rates.

Progress on Competitiveness of the Danube Region: Potentials, Needs and Challenges
32
Figure 13: Services (value added) growth
Figure 14: Industry (value added) growth
-8.00
-6.00
-4.00
-2.00
0.00
2.00
4.00
6.00
8.00
10.00
12.0020
03
2004
2005
2006
2007
2008
2009
2010
% c
hang
e on
pre
viou
s yea
r
DANUBE
EU 27
OECD
-25.00
-20.00
-15.00
-10.00
-5.00
0.00
5.00
10.00
15.00
2003
2004
2005
2006
2007
2008
2009
2010
% c
hang
e on
pre
viou
s yea
r
DANUBE
EU 27
OECD
Source: Eurostat, Worldbank, Statistische Ämter der Länder. Calculation and illustration: IAW. No data for Serbia for 2010 and for ¾ of the countries no reliable data available for 2011 forward.
Source: Eurostat, Worldbank, Statistische Ämter der Länder. Calculation and illustration: IAW. No data for Serbia for 2010 and for ¾ of the countries no reliable data available for 2011 forward.

Progress on Competitiveness of the Danube Region: Potentials, Needs and Challenges
33
Figure 15: Agriculture (value added) growth
Agriculture, also known as the primary sector, contributes only a small part to GDP in the industrialized world. The Danube Region has the highest fluctua-tions in this sector and the steepest growth rates. While OECD and EU-27 swing between +/- 5% growth rates over the depicted time series, the Danube Region reaches high points around nearly 25% of the previous year and low points around -5%.
2.1.5 Labour productivity
Figure 16 shows labour productivity calculated as real GDP, PPP adjusted per person engaged in the Danube Region compared with OECD and EU-27. The Danube Region lies well below the OECD and the EU-27 level. For OECD and EU-27 the labor productivity shows a parallel co-movement with an approxi-mate difference in overall level of 5,000 US$ (PPP). Before the economic crisis
-10.00
-5.00
0.00
5.00
10.00
15.00
20.00
25.00
30.0020
03
2004
2005
2006
2007
2008
2009
2010
% c
hang
e on
pre
viou
s yea
r
DANUBE
EU 27
OECD
Source: Eurostat, Worldbank, Statistische Ämter der Länder. Calculation and illustration: IAW. No data for Serbia for 2010 and for ¾ of the countries no reliable data available for 2011 forward.

Progress on Competitiveness of the Danube Region: Potentials, Needs and Challenges
34
the productivity for the Danube Region displays a slightly steeper slope than the other two aggregates.
Figure 16: Labor productivity (GDP per person employed)
Within the Danube Region, Member State Area 1 has unambiguously the high-est level of GDP per person employed, at around 70,000 US$ (PPP), although the level declined during the economic crisis. The labour productivity of Mem-ber State Area 2 also has a rising tendency, which might be connected with the countries’ accession to the EU in 2004. It moved from around 40,000 US $ (2005, PPP) in 2003 to nearly 50,000 US $ (2005, PPP) in 2011 (Annex Figure 51).
Member State Area 3 and Accession Countries have nearly identical levels and movements, while we can see that the Member State Area 3 has overtaken the Accession countries by some small degree in 2007 (year of EU Accession). Neighbouring Countries have the lowest labour productivity, but it has also
0
10,000
20,000
30,000
40,000
50,000
60,000
70,000
2003
2004
2005
2006
2007
2008
2009
2010
2011
Mill
ion
US$
(con
stan
t 200
5 U
S$, P
PP a
djus
ted)
DANUBE
EU 27
OECD
Source: Penn World Tables, OECD, Arbeitskreis VGL. Calculation and illustration: IAW. The Benchmark for the Danube area could not be calculated due to the missing data for years 2010 and 2011 for Bavaria and Baden-Wurttemberg and missing data for Montenegro for 2003 and 2004.

Progress on Competitiveness of the Danube Region: Potentials, Needs and Challenges
35
been rising significantly over an eight year period, from around 10,000 US$, (2005, PPP) to nearly 20,000 US$(2005, PPP), which indicates that the Neigh-boring Countries have nearly doubled their labour productivity between 2003 and 2011.
2.1.6 Labour market and migration
Population by age groups
Population ageing has become a common feature that started several decades ago in the EU countries, the Danube Region and the OECD countries as well. Ageing is reflected in the development of the age structure of the population and visible in a rising proportion of older persons and a declining proportion of both the young and - in most countries - in the working age population in the total population. Ageing of the population is expected to accelerate in the coming decades in the EU-27 and probably so in the OECD area and the Dan-ube Region, as a greater proportion of the post-war baby-boom generation reaches retirement. This will, in turn, pose a serious risk on the welfare sys-tem of these countries.
Figure 17: Population 15-64 years (share of total population)
Source: Eurostat, OECD.
As illustrated in Figure 17 the prime-age population (15-64 years) remained almost unchanged over recent years in the Danube Region and was higher than in the EU-27 and in the OECD countries. By contrast, in the two latter
60.061.062.063.064.065.066.067.068.069.0
2004 2005 2006 2007 2008 2009 2010 2011 2012
DANUBE EU 27 OECD

Progress on Competitiveness of the Danube Region: Potentials, Needs and Challenges
36
regions the working age population shrank continuously in the 2004-2012 pe-riod.
The share of young people between 0 and 14 years has been steadily on the decline both in the EU-27 and in the Danube Region in the period 2004-2012 and represented only 15.6% and 14.2% of the total population (Annex Figure 56). There are, however, huge variations among regions and individual coun-tries.
The EU-27, the Danube Region and probably so the OECD countries are facing ageing populations. Population ageing has been slightly more advanced in the Danube Region than in the EU-27 up to the year 2010 when this trend re-versed (Annex Figure 57). However in both groups of countries the share of the population above 65 years increased by 1.3 percentage points between 2004 and 2012.
Activity rates
Note: average activity rates for the regions are simple averages. For the next re-port we shall prepare weighted figures.
Figure 18: Activity rates total
Source: Eurostat, OECD. As illustrated in Figure 18 overall activity rates in the Danube Region have been traditionally lower than in the OECD and EU-27 countries; the two latter
60.0
65.0
70.0
75.0
2004 2005 2006 2007 2008 2009 2010 2011
DANUBE EU-27 OECD

Progress on Competitiveness of the Danube Region: Potentials, Needs and Challenges
37
regions reported similar developments over the 2004-2011 period with activi-ty rates exceeding the 70% mark. In general, participation rates were more resilient than expected on the basis of historical regularities in the aftermath of the recession.16 The gap between activity rates of the Danube Region and the two groups of benchmark countries widened steadily from 2005 onwards due to an ongoing deterioration in the Danube countries and reached 7 per-centage points in 2011 (versus 4 pp in 2005).
With respect to gender activity rates differed across all regions. Male rates have been highest (around 80%) in the OECD countries during the 2004-2011 period while those in the EU-27 reached 78% at best (boom years). At the same time male activity rates in the Danube Region have only slightly sur-passed the 70% mark (Annex Figure 59). As regards females, the highest and most growing female activity rates were reported in the EU-27 among the three regions under consideration. Similarly in the OECD activity of females was on the increase but remained below the EU-27 level during the whole 2004-2011. By contrast, in the Danube Region the participation of females on the labour market has been below the 60% mark (Annex Figure 60).
Unemployment
As illustrated in Figure 19 unemployment in the OECD countries has been at a lower level than in the EU-27 during the whole 2004-2012 period with the gap narrowing during the crisis, but widening again afterwards. Unemployment in the Danube Region was originally higher than in the OECD and EU-27, fell sub-stantially during the boom years before the crisis and followed a similar pat-tern like the OECD countries from 2009 onwards.
16 European Commission (2012), Labour market developments in Europe 2012, European Economy 5/2012, p. 21.

Progress on Competitiveness of the Danube Region: Potentials, Needs and Challenges
38
Figure 19: Unemployment rates
Source: Eurostat, OECD. A more detailed picture of the Danube sub-regions (Annex Figure 62) shows extremely high unemployment rates for the accession countries, particularly in Bosnia and Herzegovina (close to 30%). Having declined significantly prior to the crisis to 16%, unemployment in this region accelerated from 2009 onwards to roughly 25% in 2012. On the other hand unemployment in the EU member states and in the neighbouring countries remained below the 10% mark even during the crisis period. This is mainly due to low unemployment in the two German Länder Baden Wuerttemberg and Bavaria and in Austria (all of them belong to those EU countries least affected by unemployment). In addition, unemployment rates both in Ukraine and Moldova (in the latter mainly due to a substantial outflow of labour from the country) are comparably modest.
2.1.7 Transportation, Energy and Environment
Data
The main sources for data we used are Eurostat, the World Bank database and the CIA World Fact Book 2000-2012. The CIA World Fact Book though has raised some concerns, because the data was somewhat different than the data from Eurostat or the World Bank database. So the priority lies upon Euro-
0.0
2.0
4.0
6.0
8.0
10.0
12.0
2004 2005 2006 2007 2008 2009 2010 2011 2012
DANUBE EU 27 OECD

Progress on Competitiveness of the Danube Region: Potentials, Needs and Challenges
39
stat, then the World Bank database and if nothing else is available we use the CIA World Fact Book. For more regional data, especially for Baden-Wurttemberg and Bavaria we used some data from the Bavarian State Minis-try of Economic Affairs, Infrastructure, Transport and Technology and the Min-istry of Finance and Economics of Baden-Wurttemberg. Furthermore we used data from the World Economic Forum and the Federal Statistical Office of Germany.
Transportation
In the transportation section we concentrated on the four main transportation systems road, railroad, waterway and air. The first step was to analyse the extension and quality of these networks in each country. The second step will be to analyse the amount of goods transported inside a country, cross border to a country and transit via a country. We think this will show us the use of the infrastructure on the one hand and the specific destination of the use on the other hand. In an upcoming third step we will concentrate on how good dif-ferent types of infrastructure are linked to each other and most important how good the same type of infrastructure is linked between countries. This means if motorways are connected across borders, if railways use the same gauge and are connected across borders, etc.
Railroads
In a quantitative analysis we concentrated on indicators like “railroad in meter per area” or “railroad in meter per inhabitant” to show the different level of extend between countries.

Progress on Competitiveness of the Danube Region: Potentials, Needs and Challenges
40
Figure 20: Railroad (meter) per area (sq kilometer) (2010)
Figure 21: Railroad (meter) per inhabitant (2010)
As quality measures we calculated the “share of multi-track railroads”, the “share of electrified railroads” and the “share of electrified multi-track rail-roads”. In our opinion multi-track railroads show a higher usage and therefore a better development of this track. The share of electrified railroad tracks show a higher development of the railroad system and can be used in a later analysis in the environmental section on how environmental friendly this sort of transportation is in each country.
020406080
100120140
0.00.10.20.30.40.50.60.70.80.91.0

Progress on Competitiveness of the Danube Region: Potentials, Needs and Challenges
41
Figure 22: Share of electrified railroads (2010)17
Figure 23: Share of multi-track railroads and electrified multi-track railroads (2010)18
Furthermore we analyze the amount of goods transported in each network and the different shares of goods that are transported inside a country, cross
17 No data was available for Moldova. 18 No data was available for the electrified multi-track share of Baden-Wurttemberg and Bavaria
0%10%20%30%40%50%60%70%80%90%
100%
Blue: 2010 - Red: 2009
0%10%20%30%40%50%
Hungary: 2009 - Rest: 2010
Multi-track share of total network (2010)
Electrified multi-track share of total network (2010)
Progress on Competitiveness of the Danube Region: Potentials, Needs and Challenges
42
border or even just used the country as a transit way. This should show us the usage of each railroad network and the purpose of that usage.
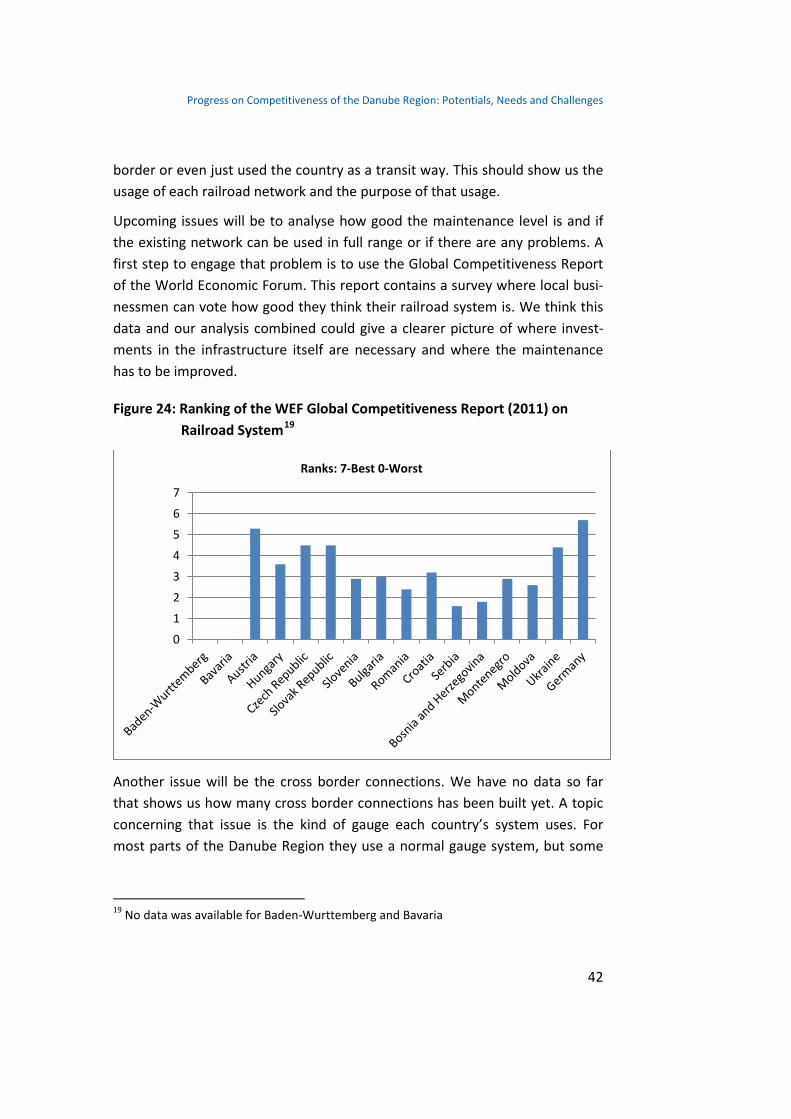
Upcoming issues will be to analyse how good the maintenance level is and if the existing network can be used in full range or if there are any problems. A first step to engage that problem is to use the Global Competitiveness Report of the World Economic Forum. This report contains a survey where local busi-nessmen can vote how good they think their railroad system is. We think this data and our analysis combined could give a clearer picture of where invest-ments in the infrastructure itself are necessary and where the maintenance has to be improved.
Figure 24: Ranking of the WEF Global Competitiveness Report (2011) on Railroad System19
Another issue will be the cross border connections. We have no data so far that shows us how many cross border connections has been built yet. A topic concerning that issue is the kind of gauge each country’s system uses. For most parts of the Danube Region they use a normal gauge system, but some
19 No data was available for Baden-Wurttemberg and Bavaria
0
1
2
3
4
5
6
7
Ranks: 7-Best 0-Worst

Progress on Competitiveness of the Danube Region: Potentials, Needs and Challenges
43
east European countries built their network with broad gauge tracks, which makes linking the systems even harder.
Roads
First we looked at the extension of the network by calculating the indicators “road in km per area” and “road in km per population”.
Figure 25: Road (meter) per area (sq km) (2010)
Figure 26: Road (meter) per inhabitant (2010)
0
500
1000
1500
2000
2500
0
5
10
15
20
25

Progress on Competitiveness of the Danube Region: Potentials, Needs and Challenges
44
The second step was to look at qualitative indicators like the “share of paved roads” and the “share of motorways” to analyse the quality of the network. Also the share and extend of roads declared as European roads is an important indicator in our opinion, because it shows on the one hand the integration in the European market and on the other hand the link between large roads across borders.
Figure 27: Share of paved roads (2010)20
20 No data was available for Baden-Wurttemberg and Bavaria
0%10%20%30%40%50%60%70%80%90%
100%
Czech Republic: 2005 - Slovenia: 2009 - Rest: 2010

Progress on Competitiveness of the Danube Region: Potentials, Needs and Challenges
45
Figure 28: Share of motorways/ European roads to all roads (2010)21
The amounts and shares of transported goods are being used again to show the importance of country inside, cross border and transit trade and therefore show the usage of the infrastructure as well as the main user.
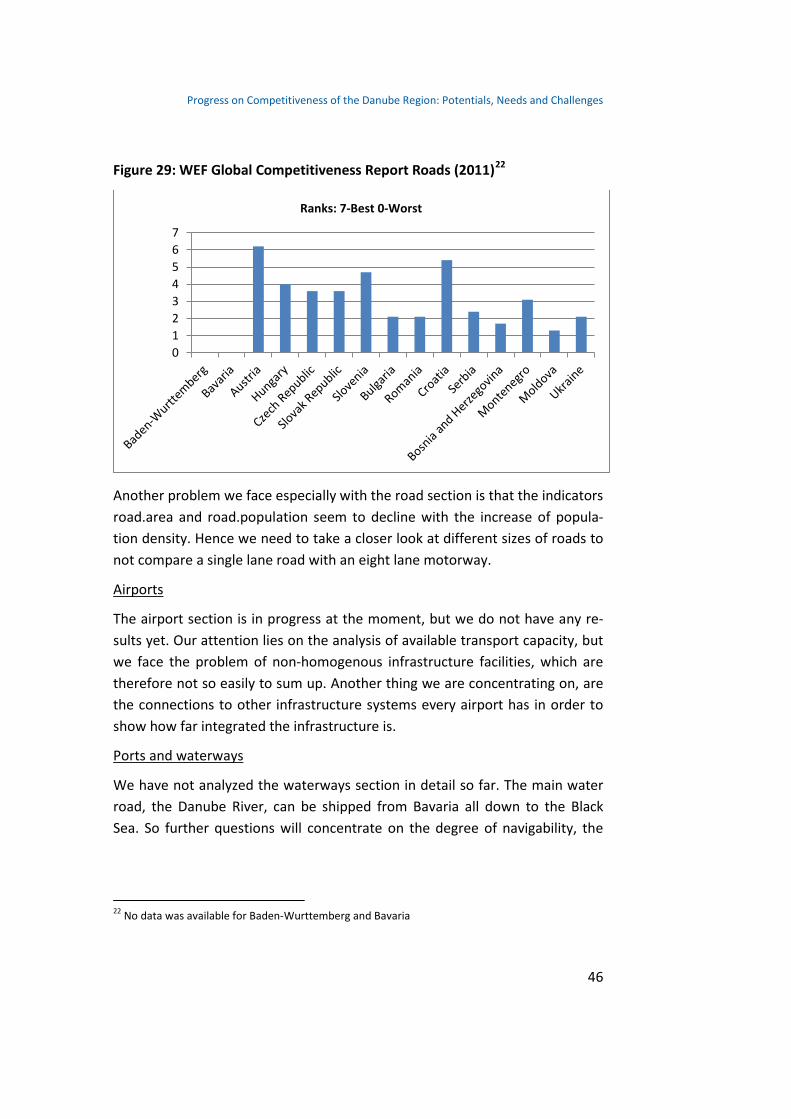
One upcoming issue will be, as with the railroads, the maintenance level of the roads in each country. Therefore we use again the Global Competitiveness Report to get an understanding how good local businessmen think the road infrastructure is and compare these results to our findings. Also the cross bor-der connections will be of concern in the on-going process.
21 No data was available for the European roads of Baden-Wurttemberg and Bavaria
0%2%4%6%8%
10%12%14%16%18%
European Road Bulgaria: 2011 - Rest: 2010
Share of Motorways (2010) Share of European Roads (2010)
Progress on Competitiveness of the Danube Region: Potentials, Needs and Challenges
46
Figure 29: WEF Global Competitiveness Report Roads (2011)22
Another problem we face especially with the road section is that the indicators road.area and road.population seem to decline with the increase of popula-tion density. Hence we need to take a closer look at different sizes of roads to not compare a single lane road with an eight lane motorway.
Airports
The airport section is in progress at the moment, but we do not have any re-sults yet. Our attention lies on the analysis of available transport capacity, but we face the problem of non-homogenous infrastructure facilities, which are therefore not so easily to sum up. Another thing we are concentrating on, are the connections to other infrastructure systems every airport has in order to show how far integrated the infrastructure is.
Ports and waterways
We have not analyzed the waterways section in detail so far. The main water road, the Danube River, can be shipped from Bavaria all down to the Black Sea. So further questions will concentrate on the degree of navigability, the
22 No data was available for Baden-Wurttemberg and Bavaria
01234567
Ranks: 7-Best 0-Worst
Progress on Competitiveness of the Danube Region: Potentials, Needs and Challenges
47
number and extension of ports and the linking of the ports to other infrastruc-ture.
Energy
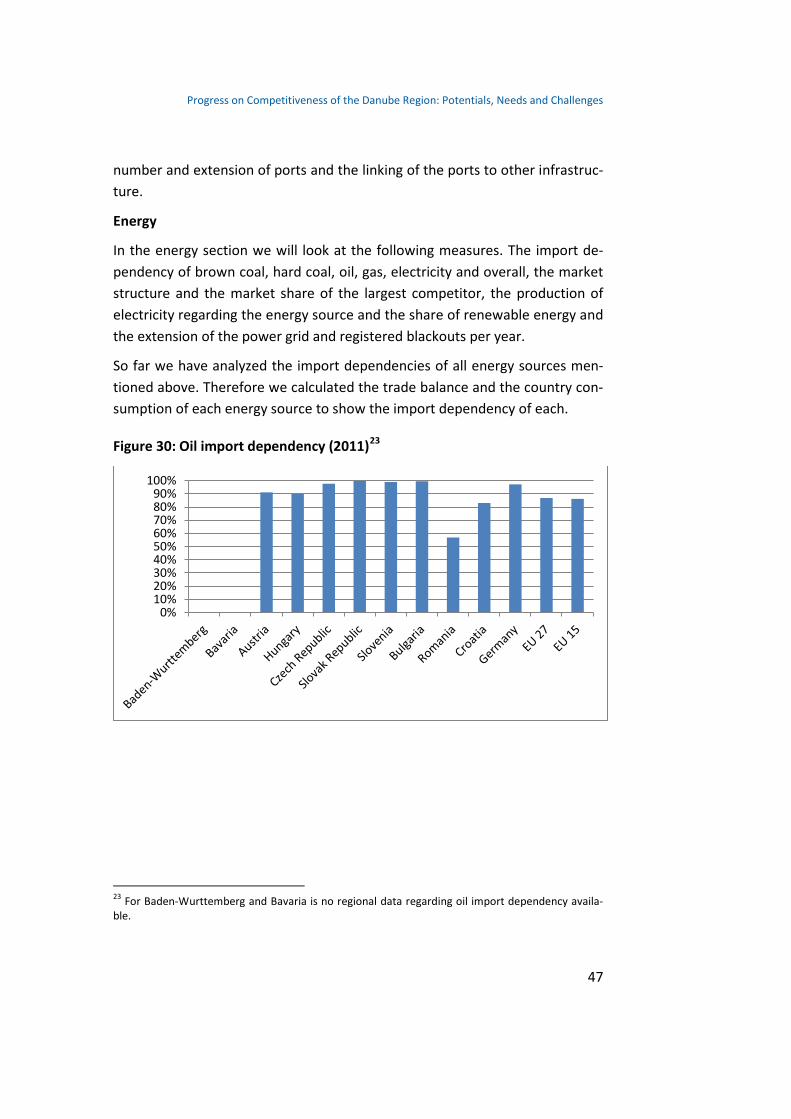
In the energy section we will look at the following measures. The import de-pendency of brown coal, hard coal, oil, gas, electricity and overall, the market structure and the market share of the largest competitor, the production of electricity regarding the energy source and the share of renewable energy and the extension of the power grid and registered blackouts per year.
So far we have analyzed the import dependencies of all energy sources men-tioned above. Therefore we calculated the trade balance and the country con-sumption of each energy source to show the import dependency of each.
Figure 30: Oil import dependency (2011)23
23 For Baden-Wurttemberg and Bavaria is no regional data regarding oil import dependency availa-ble.
0%10%20%30%40%50%60%70%80%90%
100%
Progress on Competitiveness of the Danube Region: Potentials, Needs and Challenges
48
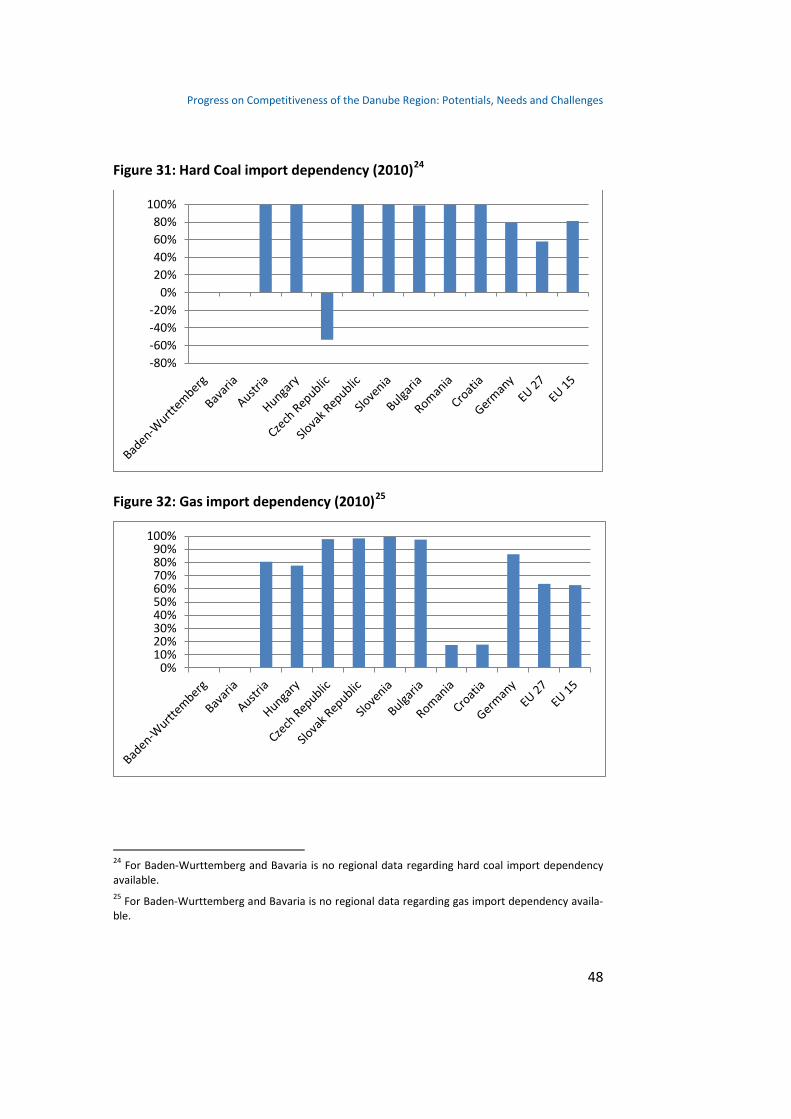
Figure 31: Hard Coal import dependency (2010)24
Figure 32: Gas import dependency (2010)25
24 For Baden-Wurttemberg and Bavaria is no regional data regarding hard coal import dependency available. 25 For Baden-Wurttemberg and Bavaria is no regional data regarding gas import dependency availa-ble.
-80%-60%-40%-20%
0%20%40%60%80%
100%
0%10%20%30%40%50%60%70%80%90%
100%

Progress on Competitiveness of the Danube Region: Potentials, Needs and Challenges
49
Figure 33: Brown Coal import dependency (2010)26
Figure 34: Electricity import dependency (2010)27
26 For Baden-Wurttemberg and Bavaria is no regional data regarding brown coal import dependency available. 27 For Baden-Wurttemberg and Bavaria is no regional data regarding electricity import dependency available.
-20%0%
20%40%60%80%
100%
-30%
-20%
-10%
0%
10%
20%
30%

Progress on Competitiveness of the Danube Region: Potentials, Needs and Challenges
50
Our main findings so far are that the Danube Region is in total very dependent on energy imports. The Danube Region has no natural resources that provide energy with one exception. Brown coal is still available in most Danube coun-tries. On the electricity market we have a divided landscape between import-ers and exporters in the Danube Region. But considering that the renewable energies are just on their rise, electricity production still depends on natural resources and therefore the electricity production depends on the import de-pendency of its respective resource. Hence electricity production in the Dan-ube Region is also highly dependent on imports.
Data regarding the market share of the largest competitor has also been gath-ered, but the work on that topic is still in progress, so we have not found any conclusion yet.
The two topics “production of electricity” and the “extension of the power grid” are next in order and will be worked on as soon as possible.
Environment
So far we concentrated on the two topics “transportation” and “energy”. We think that the topic “environment” is best analyzed with the data and analysis of the two other topics in hand, because they often correlate.
2.1.8 Regional development, urbanization, and rural areas
(To be developed at a later stage)
2.1.9 Agricultural development
(To be developed at a later stage)
2.2 Entrepreneurship and SMEs
In this part of the report entrepreneurship and the situation of SMEs in the DR will be assessed. We will analyze growth dynamics, business creation, financ-ing conditions, the regulatory and institutional environment under which they operate and to conduct a stock-taking on cluster development. The analysis will make use of various complementary data sets and fully draws on infor-
Progress on Competitiveness of the Danube Region: Potentials, Needs and Challenges
51
mation from on-going projects and activities such as the European Innovation Scoreboard or the European Cluster Excellence Initiative.
2.2.1 SME growth dynamics
Foundation activities, firm dynamics, firm growth and market exits are the relevant aspects in this task to assess the dynamics of the enterprise sector in the DR. Data for international comparisons of firm growth and market exit are more than insufficient. Therefore, the analyses will be limited to market en-tries. Besides entrepreneurship activity in terms of the numbers of start-ups, the regulatory framework for small firms and the attitudes of the population in the countries of the DR will also be analyzed with the aid of the Eurobarom-eter opinion poll. These aspects are important to assess the conditions under which entrepreneurship in the different countries take place.
The analyses here will rest on the Mannheim Firm Panel (MFP), which is an extensive micro database of enterprises in Germany compiled by the ZEW in cooperation with Creditreform, the Structural Business Statistics (SBS) by Eu-rostat, the Global Entrepreneurship Monitor (GEM) by the Babson College and the London Business School and the Entrepreneurship Indicators Programme (EIP), which is a database jointly maintained by Eurostat and the OECD. Table 6 gives an overview of the countries and years covered by the different data sets.
The analyses and results on SME growth dynamics will be included in the sec-ond progress report. Because of complex data preparation work the data will be ready for analyses only after the first progress report.
2.2.2 SME Financing
Small and Medium-sized firms (SMEs) in all countries around the world face a wide range of challenges often not faced by large firms. Among these chal-lenges access to finance is critical. It can be an issue at all stages of the SME’s developmental cycle: at the seed, start-up, growth and expansion phase. Ac-cording to the analysed studies, for SMEs in the Danube Region the financial aspect is seen as crucial as well. A missing or a difficult access to capital has become the main obstacle preventing the growth and development of the firms. A problem sharpened with the surge of the financial crisis. For many

Progress on Competitiveness of the Danube Region: Potentials, Needs and Challenges
52
Danube countries it has been mainly a demand crisis, with a drastic drop in demand, started by the end of 2008 and continued during 2009. Due to the decrease of sales and capacity utilization SMEs draw on the already limited internal funds to finance their working capital and increase the level of debt.28
When asked what the most pressing problem currently facing their firm was, 15% of SMEs’ managers in the EU and 19% of the SMEs’ managers in the Dan-ube Region cite access to finance. Thus the financing problem is placed second alongside competition in the ranking of most important companies’ issues.29
Figure 35: Most pressing problem - access to finance
A wide range of financial support institutions and instruments have been de-veloped to support SMEs at the different stages of their development cycle. These include business angels, venture capital funds, bank loans and guaran-tees, public stock markets but also informal arrangements such as friends and family. Financial support for SMEs has been provided at European level, through the financial instruments of the Competitiveness and Innovation
28 FIT4SMEs: Financial Facilities for SMEs: training and capacity building for Business Sup-port Organisations in non-EU member states of the Central European Initiative. 29 SMEs’ Access to Finance – Survey 2011 Analytical Report by the EC
0%
5%
10%
15%
20%
25%
30%
2009
2011

Progress on Competitiveness of the Danube Region: Potentials, Needs and Challenges
53
Framework Programme, financial support available under the Structural Funds and the schemes supported by the European Investment Bank and the Euro-pean Investment Fund. In the Danube Region, the EIB is the most active multi-lateral financing institution having lent a total of nearly EUR 50bn in the 14 countries of the Danube Region as a whole in the period 2007-2011. SMEs have received EIB funding through credit lines to local intermediaries that on-lend the money for small-scale capital investment and working capital re-quirements. The European Investment Fund, the risk financing arm of the EIB Group, supports small businesses in the Danube Region by means of equity instruments, SME guarantees and financial engineering products.30
In this part of the project we analyse the use of different sources of financing, the financial situation and financial needs of the SMEs in the region and com-pare it to the financial situation and needs of SMEs in the EU. We use infor-mation from studies such as the World Bank Enterprise Survey reports, the SMEs’ Access to Finance – Survey 2011 Analytical Report by the EC, the report on Financing SMEs and Entrepreneurs 2013: An OECD Scoreboard and to the report of the FIT4SMEs (2011) project on financial facilities for SMEs. Based on these studies we also evaluate the availability of external financing and the financing conditions for the SMEs in the region. Moreover, we analyse the EU programs for financial support of SMEs with their relevance for the Danube Region.
Generally speaking, loans are the main source of external SME finance and loan schemes, especially guarantees tend to have a much larger impact in terms of the number of firms affected. Venture capital and similar schemes are much more restricted. Other sources of finance such as private place-ments, listings on the regulated exchanges or issuing of bonds are not usually available for by far the majority of SMEs. However, there is some research evidence that there is a lack of awareness among medium-sized firms about opportunities in debt capital markets which could be a way to diversify fund-ing sources for them.
To address the question on how firms finance their operations we use indica-tors similar to these presented in the Enterprise Surveys of the World Bank 30 European Investment Bank
Progress on Competitiveness of the Danube Region: Potentials, Needs and Challenges
54
and the SMEs’ Access to Finance – Survey 2011 Analytical Report by the EC. The first set of indicators compares the relative use of various sources to fi-nance investment – internal funds, bank loans, trade credit financing and equi-ty financing. Excessive reliance on internal funds is a sign of potentially ineffi-cient financial intermediation or a limited access of firms to capital.
The second set of indicators measures the use of external financing by individ-ual firms. It presents the percentage of working capital that is financed by ex-ternal sources to the firm, and a measure of the burden imposed by loan re-quirements measured by collateral levels relative to the value of the loans. The third set of indicators focuses on the access to external financing as the willingness of banks to provide loans, the terms and conditions of bank financ-ing or the access to public financial support.31
Where possible we compare the indicators for the Danube Region to the EU indicators. A small set of indicators are presented below.
When looking at the recent sources of financing in the last six months, SMEs most often used external financing. Only 24% of the SMEs located in the EU27 and 22% of the SMEs in the Danube Region used internal funds. These shares of firms dropped dramatically since 2009 especially in the Danube Region. In 2009 51% of the SMEs located in the Danube Region used internal funds.
31 World Bank Enterprise Survey reports, SMEs’ Access to Finance – Survey 2011 Analytical Report by the EC.

Progress on Competitiveness of the Danube Region: Potentials, Needs and Challenges
55
Figure 36: Usage of internal funds
The studies show that there has been a significant increase in debt financing in almost all countries since 2009. This development was stronger in the Danube Region than in the EU27.
Figure 37: Usage of debt financing
0%10%20%30%40%50%60%70%80%
2009
2011
0%
20%
40%
60%
80%
100%
2009
2011

Progress on Competitiveness of the Danube Region: Potentials, Needs and Challenges
56
In total, 70% of SMEs in the Danube Region used debt financing in the past six months. This was an increase on the level in 2009, when 56% had used debt financing for the same period. However, in 2011 in the EU27 a higher percent-age (75%) of the SMEs used debt financing.
Less than one in ten SMEs (7%) in the EU27 and only 2% in the Danube Region used equity financing in the last six months. While the equity financing in the EU did not change significantly since 2009, in the Danube Region it increased from lower than 1%.
Figure 38: Usage of equity financing
The SMEs’ Access to Finance – Survey 2011 provides evidence that the banks willingness to provide loans for SMEs in the EU in 2009 had worsened. Howev-er, the bank willingness improved in 2011. The respective willingness of banks to provide a loan in the Danube Region is surprisingly better in 2009 and in 2011.
0%1%2%3%4%5%6%7%8%9%
2009
2011

Progress on Competitiveness of the Danube Region: Potentials, Needs and Challenges
57
Figure 39: Willingness of banks to provide a loan
For the quantitative evaluation of the financing conditions of the SMEs we used further data of the above mentioned surveys. These surveys provide spe-cific data on the sources and structure of financing of SMEs as well as their experiences with external financing and expectations on future financing. Ad-ditional data sources, referred to the concept and objectives of Part II in the tender for the project, are regional expert interviews covering questions re-garding the financing needs of SMEs in the region and the perceived barriers to adequate finance.
In addition, we examined indicators measuring the SMEs’ access to sources of financing, loan volumes and financing costs. With the implementation of the European Small Business Act (SBA) respective annual country factsheets moni-toring SMEs performance are published on the behalf of the DG Enterprise and Industry containing indicators on the SMEs’ access to finance. For compa-nies located in Baden-Wurttemberg and Bavaria, we can use the KfW/ZEW Start-Up Panel, a database including firms’ financial figures, which is conduct-ed by the KfW and ZEW.
In order to assess the financing condition for SMEs from a more macro-perspective viewpoint, a special questionnaire covering this topic will be im-plemented within the November issue of the CEE Financial Market Survey conducted by ZEW and Erste Group Bank AG Vienna.
-50%-40%-30%-20%-10%
0%10%20%
2009
2011

Progress on Competitiveness of the Danube Region: Potentials, Needs and Challenges
58
2.2.3 Regulation and Institutions
(To be developed at a later stage)
2.2.4 Development of Clusters
For the assessment of cluster development in the DR we work in close cooper-ation with our local partner Dragoș Pîslaru from Gea Strategy & Consulting in Romania.
Suggested Methodology
The importance of cluster-based activity is growing in the Danube Region. While there are several sources of data indicating successful cluster experi-ences, there was no attempt so far to carry out a benchmarking exercise for the entire region. Including cluster/network-related data in a regional score-board would be a useful step in setting the right framework for fruitful cluster cooperation within the entire Danube area.
Quantitative mapping of cluster potential
The first activity of this task is to take stock of the existing clusters in the Dan-ube Region. The most useful methodology and data set for the above purpose can be drawn from the European Cluster Observatory platform.
Data is available for the following countries in the Danube Region: Germany, Austria, Czech Republic, Slovakia, Hungary, Croatia, Slovenia, Serbia, Bosnia and Herzegovina, Bulgaria, Romania, Ukraine. Data allows a cross-country comparison at the level of year 2011 allowing a quantitative benchmarking of economic agglomerations based on the following structure:
• NACE 3 digit sectoral classification (42 sectors – see Annex1)
• NUTS 2 regional classification (subnational level)
• Size, Specialization and Focus of agglomerations (including the Clus-ter Observatory star rating derived from the 3 variables)

Progress on Competitiveness of the Danube Region: Potentials, Needs and Challenges
59
• Number of employees, number of enterprises and average wage (at sector level)
The quantitative data will be a first step towards cluster mapping. It will pro-vide an overview of the sectoral agglomerations per each country, which re-flects cluster potential. Moreover, it provides a relevant basis for assessing cross-country cooperation/networking potential between sectoral agglomera-tions with similar profile (e.g. automotive sector cooperation across all coun-tries with relevant agglomerations in this sector).
Limitations:
L1. Data is not available for Montenegro and Moldova.
Solution 1 – ask local experts to provide similar quantitative data from their respective countries.
Solution 2 – ask local experts to provide a qualitative assessment on the clus-ters developed in their respective countries
Solution 3 – desk research for finding any existent information on clusters in the two countries.
Qualitative validation of existing cluster initiatives / cluster development sta-tus
The data gathered for the previous activity is not providing a list of clusters per se, but only indicating cluster potential.32 In some countries there might be several institutionalized clusters in the same sector/region, in others the clus-tering process may be just emergent or informal. Desk research will be con-ducted in order to broadly assess the status of cluster development in the tar-get countries. Sources of information include European Commission, cluster collaboration platforms/portals, FP6/7 projects, research/ articles etc.
The result expected from this activity is a list of cluster initia-tives/organizations per sectors/regions with minimal details (e.g. year found-
32 Other authors make the distinction between clusters (as economic agglomerations in which actors may or may not collaborate) and cluster organizations (institutionalized forms of cooperation within the respective agglomeartions).

Progress on Competitiveness of the Danube Region: Potentials, Needs and Challenges
60
ed, type of organization, scope of activity, no of members, no of employees, turnover, amount of public funding received).
Limitations:
L2. The availability of information about cluster development status (including a validation of a list of cluster initiatives) is varying considerably across coun-tries.
Solution 1 – ask local experts to help finding any existent information on clus-ters in their respective countries.
Assessment of regional/ trans-regional networking
This activity would be conducted in parallel with the preceding activity. The project will use the framework suggested by Prof. Christian Ketels, HBS,33 by trying to classify networking initiatives in the region by four criteria:
• Geographic scope (regions within countries, national level, transna-tional)
• Industry scope (emerging pattern of relatedness across industries, broader set of industries, entire regional economy)
• Specific Issue (regional, national)
• EU-created/based networks (e.g. EEN, EBN etc.)
After an overall desk research aimed at documenting as many networks as possible relevant for the Danube Region, local experts will be asked to fill in a short survey in order to complete, validate and provide a qualitative assess-ment of the networking activity.
From the start, it is clear that a comprehensive mapping of all networking ef-fort in the region is out of the scope of this project. The assessment will be highly qualitative and meant more to explore possible policy tools for the fu-ture than to provide a rigorous picture of the current situation.
33 The impact of clusters and networks of firms on EU competitiveness, Final Report: Firm networks 2012, Specific Contract 605748 found on 11/09/2013 at http://www.clustercollaboration.eu/documents/10147/23229/Cluster+and+Networks+FINAL+REPORT+05-10-12+CK.pdf

Progress on Competitiveness of the Danube Region: Potentials, Needs and Challenges
61
A first application of the concept to Romania and a presentation of trans-regional programmes and for competitiveness and clusters initiatives a will be included in the second progress report. The complete cluster mapping will be presented in the draft of the final report of the territorial analysis.

Progress on Cooperation and Networks to Increase Competitiveness in the Danube Region
62
3 Progress on Cooperation and Networks to Increase Competitiveness in the Danube Region
The DR represents an innovative mode of territorial cooperation of different regions and nations, with balanced and sustainable development as a shared goal. The DR is not a further institutional level within the European Union (like states, regions, municipalities, etc.) but rather a network, a joint initiative in-volving several European, national and regional stakeholders, policies and funding programmes. For this reason, it focuses on a number of challenges identified and shared by the partners who are part of it. The aim of this report is to provide an overview of the existing organizations and networks related to economic cooperation in the DR. At this first stock-taking phase the text below rely mainly on the information reported on the websites of organizations.
3.1 Networks and Initiatives in the Danube Region: International Cooperation of Administrative Bodies within the Region to Increase Competitiveness
• Visegrad Group
Established in 1991 the Visegrad Group (V4) comprises the Czech Republic, Hungary, Poland and Slovakia – three of which are in the DR. The backbone of this cooperation consists of mutual contacts at all levels, from the highest-level political summits to expert and diplomatic meetings, to activities of the non-governmental associations in the region, think-tanks and research bodies, cultural institutions or numerous networks of individuals. The V4 was a vehicle of EU and NATO accession and remains an important network to support joint interest of members in the European Union. The V4 may set an example what level of cooperation may be achieved in the DR in the various fields of activi-ties. The Hungarian Presidency in the Visegrad Group (2013–2014) set various economic targets from energy security through transport connection to cluster cooperation. The related document states that “the regional cooperation of states in the framework of the EU macroregional strategies like the EUSDR are aiming mainly at the improvement of security, prosperity and the sustainabil-ity of the given macro region in a coherent way. These tools stretching across

Progress on Cooperation and Networks to Increase Competitiveness in the Danube Region
63
the counties of the Visegrad Group could play an important role during the next budgetary period to achieve major development goals of the V4, in terms of North-South infrastructure connection as well as in boosting growth and rising employment, improvement of R&D capacities and acceleration of the technology transfer. Through a strategic V4 thinking, cooperation and new partnerships, based on shared interest the V4 should enhance the efficiency of these tools in our region, in practice these actions could serve as a bridge con-cerning the institutional cooperation between the Baltic and the Danube Re-gions.” http://www.visegradgroup.eu/about/cooperation
An activity of the V4 is the ClusterCOOP Project led by the Hungarian Ministry of National Economy in the framework of the EU’s Central Europe Programme. It was initiated on the basis of a Memorandum (signed on 26 November 2009) on cooperation of V4 countries in the field of clusters. It also incorporates Slo-vene, Italian and German partners. It will terminate by March 2014 after ap-proval of its results by a ministerial conference planned for autumn 2013 in Bratislava. The results are expected to support the preparation for the next Multiannual Financial Framework (MFF) period 2014–2020.
• Central European Initiative (CEI)
The CEI is an intergovernmental forum promoting political, economic, cultural and scientific cooperation among its Member States. Its core mission is: Re-gional Cooperation for European Integration. Moreover, the CEI considers itself in a unique position to act as a bridge between macro-regions, such as the Baltic, Danube, Adriatic and Black Sea Regions. Member states include all DR countries minus Germany plus some neighbouring non-EU members. The CEI Cooperation Activities are projects of small scale and limited duration, which mainly take the form of seminars, workshops, short training courses or other kind of meetings. CEI participates in EU Projects, has a Know-how Ex-change Programme, a University Network and a Science and Technology Net-work. http://www.cei.int
• Regional Cooperation Council (RCC)
The Regional Cooperation Council (RCC) was launched by the Ministers of For-eign Affairs of the South-East European Cooperation Process (SEECP) in 2008,

Progress on Cooperation and Networks to Increase Competitiveness in the Danube Region
64
as the successor of the Stability Pact for South Eastern Europe. Through a re-gionally owned and led framework, the RCC focuses on promotion and en-hancement of regional cooperation in South East Europe (SEE) and supports European and Euro-Atlantic integration of the aspiring countries. The RCC pro-vides operational capacities to and works under the political guidance of the SEECP. The work of the RCC focuses on the priority areas of economic and social development, energy and infrastructure, justice and home affairs, secu-rity cooperation, building human capital, and parliamentary cooperation as an overarching theme. The organization develops and maintains close working relationships with all relevant actors and stakeholders in these areas, such as governments, international organizations, international financial institutions, regional organizations, civil society and the private sector. The RCC partici-pants comprise 46 countries, organizations and international financial institu-tions includes all countries participating in the DR except Germany and Ukraine; further European countries as well as international organization like the EU and NATO also participate. The activity of the RCC is not directly linked to the EUSDR although most of its member states and policy goals are identi-cal. www.rcc.int
Various activities of RCC cover different sets of countries but the West-Balkan countries comprise the core. In the Economic and Social Development priority area, the RCC is partnering with 10 regional initiatives – four promoting busi-ness and investment climate in the SEE as outlined below.
o South East Europe Investment Committee (SEEIC)
SEEIC is a high-level coordination body that supports the implementation of policies promoting foreign and domestic investment. http://www.seeic.rcc.int Members of SEEIC include Albania, Bosnia and Herzegovina, Bulgaria, Croatia, The Former Yugoslav Republic of Macedonia, Moldova, Montenegro, Romania, Serbia, with Kosovo* as an observer. SEEIC was empowered to engage in the SEE 2020 vision-building and placed into regional ownership. SEEIC currently has three main objectives:
- Development of the South East Europe 2020 Strategy (jointly with the SEE countries), based on 5 growth pillars: 1) integrated, 2)

Progress on Cooperation and Networks to Increase Competitiveness in the Danube Region
65
smart, 3) sustainable and 4) inclusive growth underpinned by 5) governance for growth
- Increasing competitiveness and enhancing regional value chains - Promoting the SEE region as an attractive investment destination
o Central European Free Trade Agreement 2006 (CEFTA)
CEFTA, in its current form, came into existence through the Agreement to amend and enlarge the Central European Free Trade Area in 2006 and signed by Albania, Bosnia and Herzegovina, Croatia, Macedonia, Moldova, Montene-gro, Serbia and UNMIK on behalf of Kosovo. The main objectives of the agreement are to expand trade in goods and services and foster investment by means of fair, stable and predictable rules, eliminate barriers to trade be-tween the members, provide appropriate protection of intellectual property rights in accordance with international standards and harmonize provisions on modern trade policy issues such as competition rules and state aid. www.cefta.org
o The Regional Rural Development Standing Working Group of SEE (RRDSWG)
RRDSWG is an intergovernmental organisation for regional rural development in SEE, which aims to empower and promote sustainable agriculture and rural development through networking and permanent cooperation between stakeholders in the SEE region.
o Association of Balkan Chambers (ABC)
The Association of Balkan Chambers of Commerce was established in 1994 with the aim of assisting business activities in the Balkans. Members include Chambers of Commerce and Industry of Albania, Bulgaria, Greece, The Former Yugoslav Republic of Macedonia, Montenegro, Romania, Turkey and Serbia. Its activity thus stretches beyond the SEE and DR. The main priorities of ABC are: development of cooperation among the business communities in the Balkan region, as well as with third parties; encouragement and support of activities aimed at structural changes in the economies of Balkan countries with the view to EU accession; initiation and implementation of global interest projects

Progress on Cooperation and Networks to Increase Competitiveness in the Danube Region
66
for the Balkan region; representing, through the Association, interests of the member Chambers in front of international bodies; joint participation in EU programmes and other partnership programmes.
3.2 EU Development Policy towards Danube Region Countries at Various Stages of Alignment
(To be developed at a later stage)
3.3 Business Networks and Competitiveness Initiatives, Clusters and their International Networking
3.3.1 Transnational business networks
• Enterprise Europe Network
The Enterprise Europe Network is a key instrument in the EU's strategy to boost growth and jobs. Bringing together close to 600 business support organ-isations from more than 50 countries, the Network helps small companies seize business opportunities in the EU Single Market. The Network member organisations include chambers of commerce and industry, technology cen-tres, research institutes and development agencies. Most of them have been supporting local businesses for a long time. The members are linked up through powerful databases, sharing their knowledge and sourcing technolo-gies and business partners across all Network countries. They are also closely linked with the European Commission, which enables them to keep abreast of EU policies and to feed small companies' views on them back to Brussels. Ser-vices of the Network include:
• Technology transfer • Access to finance • Advice on EU law and standards • Advice on Intellectual Property Rights (IPRs) • Speak up on EU law • Research funding – support to companies to find partners for FP7 pro-
jects • Going international – brokerage services
Progress on Cooperation and Networks to Increase Competitiveness in the Danube Region
67
All 14 countries of the Danube Region have Enterprise Europe Network points. There is no sub-network for the DR countries. A list of Network contacts is available on http://een.ec.europa.eu/about/branches.
• European Association of Development Agencies (EURADA)
The EURADA has a membership of about 130 regional development agencies from across the European Union. It runs conferences and seminars and has an extensive publications programme. It keeps its members up-to-date with EU policy developments and provides briefing on critical issues such as state aid rules. It alerts members to funding and contract opportunities and helps with forming and running partnerships. EURADA lobbies and briefs the European Commission on behalf of members and maintains a communications network there. Countries from the Danube area involved are Austria, Bosnia and Her-zegovina, Bulgaria, Czech Republic, Romania, Serbia and Slovakia.
• Association of the European Chambers of Commerce and Industry (Eurochambers)
Eurochabers represents, serves and promotes member chambers through: - strengthening the voice and position of European chambers as sig-
nificant, respected, valued influencers of EU affairs on all major economic issues;
- developing the participation of European chambers in projects of value to business;
- delivering services to the members, and developing a European network of services for enterprises.
All countries from the DR participate in Eurochambers.
• C.R.E.A.M. Europe PPP Alliance
C.R.E.A.M. Europe PPP Alliance is an European Public Private Partnership Association and the acronym stands for COMMUNITY, REALIZATION, EUROPE-AN, AID, MASTERPLAN. C.R.E.A.M. is a Think Tank and Learning Organization to promote and initiate PPP projects in all infrastructure areas as a sustainable
Progress on Cooperation and Networks to Increase Competitiveness in the Danube Region
68
regional development strategy. The knowledge network consists of 9 national own Public Private Partnership associations and over 200 PPP units worldwide. www.cream-europe.eu
• Vienna Economic Forum (VEF)
The aim of the VEF is popularising and promoting investment opportunities in the region from the Adriatic to the Black Sea. Providing impulses and pointing out – on the basis of research – the joint projects required in the region for short-term, medium-term and long-term realisation, and promoting their im-plementation. Becoming a place of definition, encounter, and of realising the public and private interests in connection with the various projects in the re-gion as part of the United Europe. The members are companies and organiza-tions from a wide region covering all DR countries. http://www.vienna-economic-forum.com
• Business Advisory Council for Southeastern Europe and Eurasia (BACSEE)
BACSEE is an advisory body composed of some 35 international investors and business representatives from more than 20 countries, whose experience and activities span across a wide range of sectors which are key to regional growth and development. The network calls for effective public-private partnerships and communication on cross-border cooperation, competitiveness, good gov-ernance, human capital, infrastructure, and regional trade and investment. BAC works in close cooperation with the European Commission, various IFIs (such as the World Bank and the EBRD) and development organizations(such as OSCE and OECD), as well as regional bodies and local business communities. As such, BAC is regularly invited to contribute to regional and international policy-making forums, and holds meetings and missions in various centers of the region. Annual activities are highlighted by a highly-profiled event, which brings together key policy makers from the sphere of business, finance, poli-tics and academia.

Progress on Cooperation and Networks to Increase Competitiveness in the Danube Region
69
3.3.2 Danube Region networks
• Danube Chambers of Commerce Association (DCCA)
Danube Chambers of Commerce Association wishes to be one of the new di-mensions of DR cooperation, which due to the chamber system’s historically established traditional advocacy and representation structure, aims to enforce the common representation and advocacy of the enterprises and entrepre-neurs along the Danube. The inspiration of founding the DCCA was the Dan-ube Strategy thus its activity is directly linked to the EUSDR process. The Asso-ciation's philosophy is to create a single platform of economic opportunities enhancing economic co-operation and strengthening cohesion between the entrepreneurs and enterprises operating scattered all over the macro-region. By strengthening the cooperation between the chambers of commerce in-volved they contribute greatly to the development of the Danube Region. Members are chambers in cities along the Danube river or closed to it and not the national chambers of EUSDR members. http://www.danubechambers.eu/
• Danube Business Advisory Council (DBAC)
DBAC is an independent network organization whose members are promoting or providing high quality innovation support and technology transfer services to firms, with the ultimate aim to develop the knowledge economy and boost the wealth creation process. The network involves decision makers from all over the Danube Region and beyond to establish production networks of companies/research/universities to stay at the cutting-edge of technology, further interaction between different disciplines, sub-sectors, economic fields. A more intensive, systematic and wide-range collaboration between economy, academia and scientific institutions is promoted, as well as public-private initi-atives to support the development of Danube Business and Technology plat-forms. Being in charge to develop and implement the European research and innovation policy, the EC Directorate-General for Research and Innovation ensures the policy coordination of the DBAC’s strategy with a view to achiev-ing the goals of Europe 2020 and the Innovation Union. www.danubeinnovationunion.com

Progress on Cooperation and Networks to Increase Competitiveness in the Danube Region
70
• Council of Danube Cities and Regions (CODCR)
Launched in Ulm by the "Deklaration der Donastädte" on 4 July 1998, the CODCR is a major inter-municipal and interregional network, to become an example of cross-border cooperation in the Danube Region. With its political Head Office in Ulm and operational Headquarters and General Secretariat in Bucharest, the Council of Danube Cities and Regions is a bridge that links Eu-ropean, regional and local institutions to the academic, business, financing networks and other representatives of the civil society. http://www.codcr.com
• Danube Competence Centre (DCC)
The Danube Competence Centre (DCC) is a regional network of public, private and non-government organizations involved in tourism sector development along the Danube. DCC was founded in early 2010 as the initiative of 22 organ-izations and is supported by the German Ministry of Economic Cooperation and Development through its agency GIZ (Deutsche Gesellschaft für Interna-tionale Zusammenarbeit). It involves 60 members from 9 Danube countries, its mission being strengthening visibility of the Danube Region and enhancing and promoting cross-border cooperation and sustainable tourism development. Countries from the Danube area involved are: Germany, Austria, Slovakia, Hungary, Croatia, Serbia, Romania, Bulgaria, Moldova and Ukraine. http://www.danubecc.org/
• Danube Alliance
Danube Alliance is an informal, demand-driven and results-oriented forum for regional cooperation in the Danube macro region that identifies political goals, creates action plans, initiates projects and serves as a platform for the ex-change of ideas concerning regional issues of common interest. It is an open and transparent network for cooperation with a multi-stakeholder. Members are various government ministries and agencies from the 14 countries in-volved in the EUSDR, the European Commission, numerous intergovernmental and non-governmental organisations, academic and financial institutions, as well as local, city and sector networks. It brings together people who are ac-tive in a variety of different sectors: transport, energy, tourism and culture,

Progress on Cooperation and Networks to Increase Competitiveness in the Danube Region
71
environment, biodiversity, quality of waters, research, education and ICT, competitiveness, institutional capacity and cooperation, security. The Danube Alliance Strategy is currently under development and so is the Danube Alliance Portfolio of Actions and Flagship Projects. The latter are con-crete projects that ensure a value-added contribution to regional sustainability and high visibility of the results and outcomes. http://www.eudanube.com
• Arge Donauländer
Created in 1990, the Arge Donauländer aims at promoting co-operation among its members for the development of the Danube area to serve the in-terests of its inhabitants and to foster peaceful cooperation in Europe. Loca-tion of the Secretariat: St Pölten, Land Lower Austria, AT.
• Steinbeis Danube Center
Steinbeis Danube Center is a non-profit institution for fostering the imple-mentation of Danube Strategy. It acts as the integrative link for all stakehold-ers of Danube Region. The Center is directly involved in activities of several Steering Groups (PA 7, 8, 9). Its work is based on 17 years of experience in economic promotion and regional development in Middle and Eastern Europe.
3.3.3 Cluster networks involving networks in the Danube Region
• European Union initiatives
Cluster development at the European Union is part of innovation policy help-ing companies to perform better and contributing to wider social objectives such as growth, jobs and sustainability. “Clusters are powerful engines of eco-nomic development and drivers of innovation in the European Union. They provide a fertile business environment for companies, especially SMEs, to col-laborate with research institutions, suppliers, customers and competitors lo-cated in the same geographical area.” http://ec.europa.eu/enterprise/policies/innovation/policy/clusters/index_en.htm.

Progress on Cooperation and Networks to Increase Competitiveness in the Danube Region
72
Support for innovative clusters is provided through several channels as initiat-ed in the document “Towards world-class clusters” /Com(2008) 652/. The re-lated organizations include the Europe INNOVA Cluster Innovation Platform, the European Cluster Alliance for policy dialogue and the European Cluster Observatory for information service on clusters for enterprises. As part of a the policy aimed at promoting international cluster cooperation for the bene-fit of SMEs, DG Enterprise and Industry of the European Commission has launched a number of cluster/SME matchmaking events.
The European Cluster Alliance (ECA) is backed by the project TACTICS which brings together seven national and regional innovation agencies that are committed to developing new cluster policies to meet the current challenges facing European policy makers and to contributing to the future European Innovation Plan.
The European Cluster Observatory is an online platform that provides a single access point to information and analysis of clusters and cluster policy in Eu-rope. Launched in 2007, the Observatory offers a range of services providing data and analysis on clusters and competitiveness, a cluster library, and a classroom for cluster education. The European Cluster Observatory also pro-duces analysis and reports on regional competitiveness conditions, transna-tional cluster networks, clusters in emerging industries, and studies on better practices in cluster organisations.
Started in September 2009 the European Cluster Excellence Initiative (Cluster-Excellence.eu) constitutes a central pillar within this approach training the trainers and providing quality insurance.
• CENTRAL EUROPE
Central Europe is a European Union programme that encourages cooperation among the countries of central Europe to improve innovation, accessibility and the environment and to enhance the competitiveness and attractiveness of their cities and regions (www.central13.eu). The programme is financed by the European Regional Development Fund and runs from 2007 to 2013. CENTRAL EUROPE invests €231 million to provide funding to transnational cooperation projects involving public and private organisations from Austria, the Czech Republic, Germany, Hungary, Italy, Poland, the Slovak Republic, Slovenia and

Progress on Cooperation and Networks to Increase Competitiveness in the Danube Region
73
Ukraine (seven countries are part of the DR). The programme has four priority areas supporting projects in these specific areas. Two of them are linked to improving competitiveness.
Priority 1: Facilitating innovation across Central Europe
Innovation is a key driver for strengthening Central Europe’s competitiveness and it is a top policy priority for the European Union. Projects under this priori-ty aim at improving the climate for innovation in all regions and enabling them to make better use of their innovation potential. They create favourable framework conditions for innovation and build up capabilities for the effective transfer and application of innovation. They also foster knowledge develop-ment and help people to obtain the qualifications they need for the knowledge-based economy.
Priority 4: Enhancing competitiveness and attractiveness of cities and regions
“European cities and regions attract investment and employment by offering economic opportunities and a high quality of life. Cities and regions can do a lot to improve their attractiveness and competitiveness and, thus, to contrib-ute to economic growth and more and better jobs. Projects under this priority aim at improving the quality of life in cities and regions and promote sustaina-ble urban development. They support polycentric development to avoid dis-parities within urban areas that are due to social and spatial segregation, and they address demographic and social change, as well as the protection, preservation and exploitation of cultural resources.”
Accelerating regional competitiveness (ACCESS)
As an example for the activity of CENTRAL EUROPE is the project, ACCESS, a sector-based excellence through innovation management tools and tech-niques. It is implemented by 11 partner organizations from 8 Central European countries that have a common interest in improving their innovation policy. The projective focuses on two specific facets: Which are the tools and tech-niques of regional innovation management that might be useful to improve innovation capacities? Which potentials might be hidden in a sector-based focus for innovation management?
Cluster and Network Cooperation for Business Success in Central Europe (CNCB)

Progress on Cooperation and Networks to Increase Competitiveness in the Danube Region
74
This CENTRAL EUROPE project focuses on the development of cluster initia-tives. Its aim is to target specific challenges of the participating regions related to the cluster management qualification and working on elaboration of a standardized transferable module that is not available so far.
• Upper Austrian Technology and Marketing Company (TMG Group)
Together with Clusterland Oberösterreich, CATT Innovation Management and tech2b, the Upper Austria Technology and Marketing Company forms the TMG Group and hence the Upper Austrian's business agency. The aim of the TMG Group is to boost the competitiveness of Upper Austrian business and industry in the global location contest. It constitutes the region’s network for location development and marketing, company foundations and settlement, innova-tion and cooperation. TMG initiated DanuClus in April 2013 which will coordi-nate projects for a wide target audience of clusters in the Danube Region.
• danubiz
“local global GmbH” in Stuttgart has developed the concept of “danubiz” to promote are actively sustainable business development in the DR. It works towards fostering competitiveness in an effort to deliver improvement in the business performance of small and medium enterprises. They envision danubiz as an expanding entity that comes as a natural response to the current infor-mational and economic impediments that are holding SMEs back from ex-panding outside their national environment towards international markets.
3.4 Networks and Initiatives of the Danube Region with Neighbouring Regions, International Cooperation of Administrative Bodies beyond the Danube Region
• The Adriatic-Ionian Macroregion
The Adriatic-Ionian Macroregion is not a geographical region with predefined boundaries; it is a functional area, composed of national, regional, and local bodies coming together to tackle a number of shares issues and it involves in territories in Albania, Bosnia- Herzegovina, Croatia, Greece, Italy, Montenegro,
Progress on Cooperation and Networks to Increase Competitiveness in the Danube Region
75
Serbia and Slovenia. Together with to other two European macro- regions, the Baltic Sea and the Danube, the Adriatic- Ionian Macroregion is the connection between Northern and Southern Europe because, since it also includes the central eastern Mediterranean area, it can relieve the congestion of the south- eastern access to Europe.
The intergovernmental cooperation among the eight Participating Countries has been constantly upgraded in 2012-2013. Nine projects proposals will be co-financed during 2013. Projects are aimed at increasing cooperation in prior-ity areas such as tourism, rural development, small and medium enterprises and the support to the establishment of the Adriatic and Ionian Macro Region. A further task is the presentation of a new EU Strategy for the Adriatic and Ionian Region before the end of 2014. http://www.aii-ps.org/index.php/adriatic-ionian-macroregion
• BSEC - Organisation of the Black Sea Economic Cooperation
The BSEC came into existence in 1992 as a multilateral political and economic initiative aimed at fostering interaction and harmony among the Member States (Albania, Armenia, Azerbaijan, Bulgaria, Georgia, Greece, Moldova, Ro-mania, Russia, Serbia, Turkey and Ukraine), as well as to ensure peace, stability and prosperity, encouraging friendly and good-neighbourly relations in the Black Sea region. http://www.bsec-organization.org
EUROLINK-House of Europe is the co-ordinator of the Black Sea - Danube Re-gional Network for Social & Economic Innovation, which was launched in 2011. Within an institutional partnership with the National Coordinator of the EU Strategy for the Danube Region, the Regional Network plays the role of inte-grator of initiatives and partnerships from the Black Sea - Danube area.

Annex
76
4 Annex
Table 2: Population and population growth rates in the Danube Region and its subgroups
Population
2003 2011 Growth 2003-2012 (in %)
DANUBE 156,316,884 153,664,049 -1.7 Member Area 1 31,183,423 31,745,635 1.8 Member Area 2 27,712,254 27,919,042 0.8 Member Area 3 34,005,570 33,013,760 -2.9 Accession Countries 11,989,818 11,718,711 -2.3 Neighbouring Countries 51,425,819 49,266,901 -4.2
Figure 40: Real GDP (constant 2005€) in 2003
Member States_1: A,BW,BY
67%
Member States_2:
H,CZ,SK, SLO 17%
Member States_3: HR,BG,RO
9% Acc. Countries
2%
Neighb. Countries
5%
Source: Worldbank, Genesis Online Datenbank. Calculation and illustration: IAW.
Source: Eurostat, UNdata, Worldbank, Statistische Ämter des Bundes und der Länder. Calculation and illustration: IAW.

Annex
77
Figure 41: Real GDP growth within the region (%)
Figure 38 shows real GDP growth calculated as percentage change in the pre-vious year from 2004 until 2011 for the subgroups within the Danube Region.
It is especially interesting to compare the consequences of the financial crisis on each of these areas. In the graph it can be observed how the Member States have experienced a negative real GDP growth rate of approx. -6% in 2009, while Accession countries exhibit a negative growth rate of ‘’only’’ ap-prox. -3.5%. The Neighbouring Countries have suffered the consequences of the financial crisis more intensively, presenting a negative growth rate of -14% in 2009.
-15%
-10%
-5%
0%
5%
10%
15%20
04
2005
2006
2007
2008
2009
2010
2011
% c
hang
e on
pre
viou
s yea
r (20
05€)
Year
Member States_1:A,BW,BY
Member States_2:H,CZ,SK, SLO
Member States_3:HR,BG,RO
Acc. Countries
Neighb. Countries
Source: Eurostat, UNdata, Worldbank, Statistische Ämter des Bundes und der Länder. Calculation and illustration: IAW.
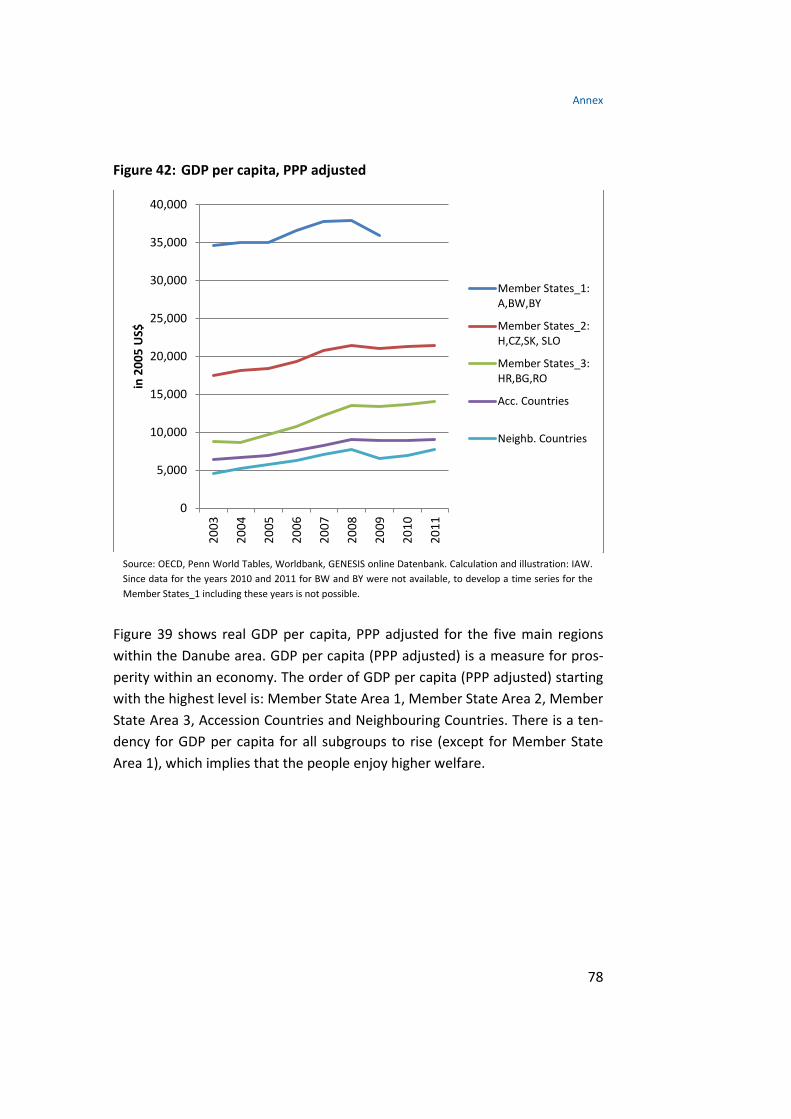
Annex
78
Figure 42: GDP per capita, PPP adjusted
Figure 39 shows real GDP per capita, PPP adjusted for the five main regions within the Danube area. GDP per capita (PPP adjusted) is a measure for pros-perity within an economy. The order of GDP per capita (PPP adjusted) starting with the highest level is: Member State Area 1, Member State Area 2, Member State Area 3, Accession Countries and Neighbouring Countries. There is a ten-dency for GDP per capita for all subgroups to rise (except for Member State Area 1), which implies that the people enjoy higher welfare.
0
5,000
10,000
15,000
20,000
25,000
30,000
35,000
40,00020
03
2004
2005
2006
2007
2008
2009
2010
2011
in 2
005
US$
Member States_1:A,BW,BY
Member States_2:H,CZ,SK, SLO
Member States_3:HR,BG,RO
Acc. Countries
Neighb. Countries
Source: OECD, Penn World Tables, Worldbank, GENESIS online Datenbank. Calculation and illustration: IAW. Since data for the years 2010 and 2011 for BW and BY were not available, to develop a time series for the Member States_1 including these years is not possible.

Annex
79
Figure 43: GDP per capita growth, PPP adjusted
The graphic shows the growth rates of real GDP per capita, PPP adjusted for the Danube Region compared with EU-27 and OECD. The growth rate of the Danube Region is pretty high in the pre-crisis era and has suffered a deep de-cline during the economic crisis. OECD and EU-27 also underwent a notable decline during the economic crisis and reached the lowest point in 2009. After 2009 OECD recovered rapidly and moved back to its pre-crisis level.
-8%
-6%
-4%
-2%
0%
2%
4%
6%
8%
10%
12%20
04
2005
2006
2007
2008
2009
2010
2011
% c
hang
e on
pre
viou
s yea
r (20
05 U
S$)
Year
DANUBE
EU 27
OECD
Source: OECD, Penn World Tables, Worldbank, GENESIS online Datenbank. Calculation and illustration: IAW. Data for years 2010 and 2009 were not available for BW and BY, thus preventing the creation of a Bench-mark for the whole Danube Region for the above mentioned years.

Annex
80
Figure 44: GDP per capita growth, PPP adjusted
The graphic shows the growth rates of real GDP per capita (PPP adjusted) of the five main subgroups within the Danube Region. GDP per capita is a good indicator for prosperity. For all subgroups of the Danube Region the growth rates turned negative from 2007 until 2009. After 2009 the growth rates re-covered and turned positive again. The Neighbouring countries especially had a deep decline of GDP per capita growth, but also a fast and steep recovery.
The Member State Area 3 had a steep rise of the growth rate from 2004 to 2005, while all the other subgroups had a more or less parallel co-movement over time.
-15%
-10%
-5%
0%
5%
10%
15%
20%20
04
2005
2006
2007
2008
2009
2010
2011
% c
hang
e on
pre
viou
s yea
r (20
05 U
S$)
Year
MemberStates_1:A,BW,BYMemberStates_2:H,CZ,SK, SLOMemberStates_3:HR,BG,ROAcc. Countries
Neighb.Countries
Source: OECD, Penn World Tables, Worldbank, GENESIS online Datenbank. Calculation and illustration: IAW. Data for years 2010 and 2009 were not available for BW and BY, thus preventing the creation of the corre-sponding Benchmarks for the above mentioned years.

Annex
81
Figure 45: Real private consumption growth
The series for the Danube Region presents a higher volatility with respect to EU-27 and OECD, meaning that private consumption growth is higher in the Danube Region in times of an economic boom while it is lower in times of an economic crisis. Private consumption growth in the Danube Region reaches its peak in 2006 with a rate of ca. 4% and reaches its lowest value in 2009 with a negative growth rate of ca. -2.5%. Recovery from the financial crisis in the Danube Region with respect to the evolution of private consumption real growth rates seems to be faster than in the countries of the OECD and the EU-27. Moreover, real consumption growth in the Danube area exceeded the corresponding growth in the OECD and EU27 area in six out of eight years dur-ing the observation period.
-3.00%
-2.00%
-1.00%
0.00%
1.00%
2.00%
3.00%
4.00%
5.00%
2004
2005
2006
2007
2008
2009
2010
2011
% c
hang
e on
pre
viou
s yea
r (20
05€)
Year
DANUBE
EU 27
OECD
Source: Eurostat, UNdata, Worldbank, Statistische Ämter des Bundes und der Länder. Calculation and illus-tration: IAW. For Montenegro, Bosnia and Herzegovina, Baden-Wurttemberg and Bavaria no data available for 2012.
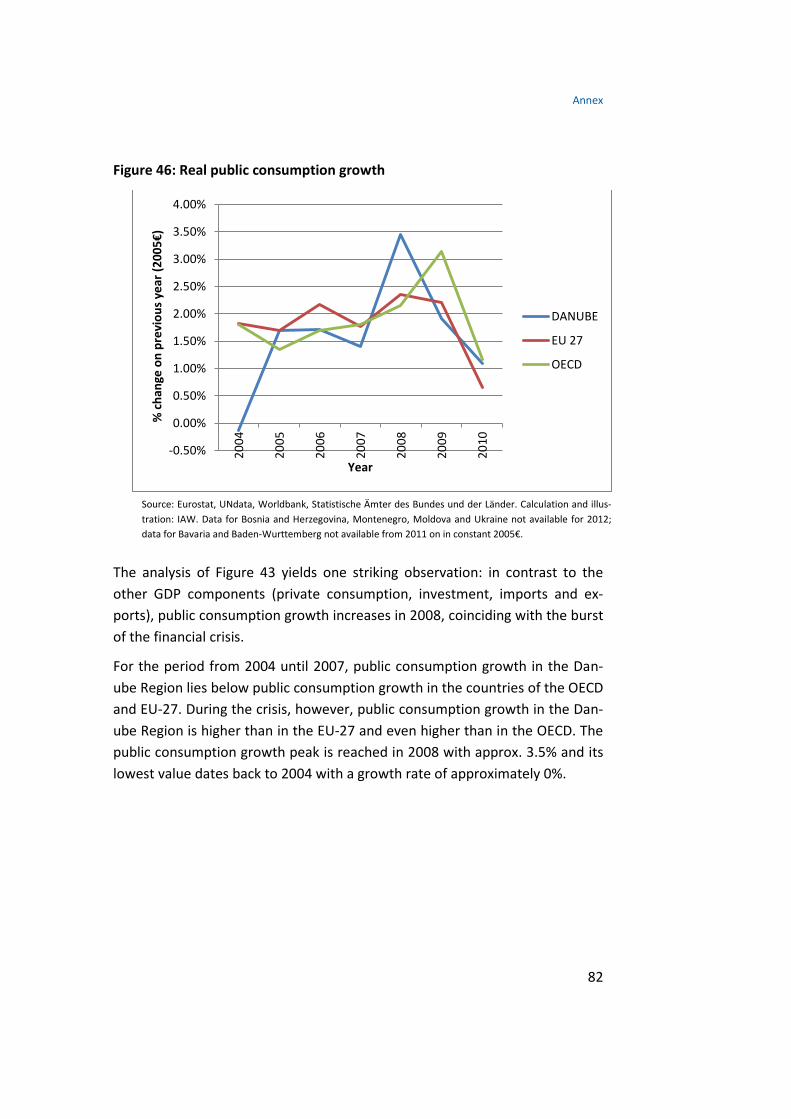
Annex
82
Figure 46: Real public consumption growth
The analysis of Figure 43 yields one striking observation: in contrast to the other GDP components (private consumption, investment, imports and ex-ports), public consumption growth increases in 2008, coinciding with the burst of the financial crisis.
For the period from 2004 until 2007, public consumption growth in the Dan-ube Region lies below public consumption growth in the countries of the OECD and EU-27. During the crisis, however, public consumption growth in the Dan-ube Region is higher than in the EU-27 and even higher than in the OECD. The public consumption growth peak is reached in 2008 with approx. 3.5% and its lowest value dates back to 2004 with a growth rate of approximately 0%.
-0.50%
0.00%
0.50%
1.00%
1.50%
2.00%
2.50%
3.00%
3.50%
4.00%
2004
2005
2006
2007
2008
2009
2010
% c
hang
e on
pre
viou
s yea
r (20
05€)
Year
DANUBE
EU 27
OECD
Source: Eurostat, UNdata, Worldbank, Statistische Ämter des Bundes und der Länder. Calculation and illus-tration: IAW. Data for Bosnia and Herzegovina, Montenegro, Moldova and Ukraine not available for 2012; data for Bavaria and Baden-Wurttemberg not available from 2011 on in constant 2005€.

Annex
83
Figure 47: Real investment growth
Investment, together with imports and exports, are generally the most volatile GDP components.
The Danube Region exhibits positive and increasing investment growth rates from 2005 until 2006. The peak is reached in 2006 with an investment growth rate of ca. 14%. After 2006 a sharp decrease in investment growth starts. In 2009 a negative growth rate of approximately -17% is reached and the fact that in 2010 growth rates lie again in the positive range points to an incipient recovery from the financial crisis.
Differences and similarities with respect to the development of investment growth rates in the OECD and the EU-27 need to be pointed out. Growth rates in the Danube Region in the years before the financial crisis are higher than in the OECD or EU-27. Furthermore, growth rates in the Danube Region start dropping already in 2007 while in the OECD and EU-27 the biggest drop does not occur before 2008.
-20.00%
-15.00%
-10.00%
-5.00%
0.00%
5.00%
10.00%
15.00%20
04
2005
2006
2007
2008
2009
2010
% c
hang
e on
pre
viou
s yea
r (20
05€)
Year
DANUBE
EU 27
OECD
Source: Eurostat, UNdata, Worldbank, Statistische Ämter des Bundes und der Länder. Calculation and illus-tration: IAW. Data for Bosnia and Herzegovina, Montenegro, Moldova and Ukraine is not available for 2012; data for Bavaria and Baden-Wurttemberg not available from 2011 on in constant 2005€.

Annex
84
However, the reaction of investment growth to the financial crisis and the posterior recovery show the same degree of intensity in all three regions (Danube, EU-27 and OECD).
Figure 48: Real export growth
In the years before the financial crisis the Danube Region exhibits export growth rates of ca. 10%, in 2007 export growth already starts dropping reach-ing its lowest value in 2009 with a negative growth rate of -15%. Export growth however, seems to have recovered fully from the financial crisis since in 2010 positive growth rates of ca. 15% are reached.
Differences with respect to the evolution of export growth in the EU-27 and OECD are minimal. In times of economic boom, export growth in the Danube Region is around 2 percentage points higher than in the OECD and EU-27, while it is around 2 percentage point lower during the financial crisis. All three series evolve in a parallel manner.
-20.00%
-15.00%
-10.00%
-5.00%
0.00%
5.00%
10.00%
15.00%
20.00%
2004
2005
2006
2007
2008
2009
2010
2011
% c
hang
e on
pre
viou
s yea
r (20
05€)
Year
DANUBE
EU 27
OECD
Source: Eurostat, UNdata, Worldbank, Bayerisches Landesamt für Statistik, Landesamt für Statistik Baden-Wurttemberg. Calculation and illustration: IAW. No data available for Bosnia and Herzegovina, Montenegro, Moldova and Ukraine for 2012.

Annex
85
Figure 49: Real import growth
The development of import growth rates in the Danube Region, OECD and EU-27 occurs in a parallel manner, and growth rates differ only slightly, therefore we focus solely on the Danube Region.
In the years before the burst of the financial crisis, the Danube Region exhibits import growth rates that lie over 5% reaching their peak in 2007 with a rate of ca. 11%. From 2007 until 2009 a sharp drop in import growth rates takes place, the lowest value being -10%. Analogously to export growth, import growth seems to have recovered fully by 2010, despite a new slight drop that can be observed in 2011.
-15.00%
-10.00%
-5.00%
0.00%
5.00%
10.00%
15.00%20
04
2005
2006
2007
2008
2009
2010
2011
% c
ahng
e on
pre
viou
s yea
r (20
05€)
Year
DANUBE
EU 27
OECD
Source: Eurostat, UNdata, Worldbank, Bayerisches Landesamt für Statistik, Landesamt für Statistik Baden-Wurttemberg. Calculation and illustration: IAW. No data available for Bosnia and Herzegovina, Montenegro, Moldova and Ukraine for 2012.

Annex
86
Figure 50: GDP components in 2004
Comparing component shares of GDP in the Danube Region between 2004 and 2010, it can be pointed out that the shares of net exports and public con-sumption have increased by 0.4 and 0.7 percentage points respectively, while the shares of investment and private consumption have decreased by 1.4 and 0.5 percentage points respectively.
57.2 58.1 62.3
17.8 20.7 17.9
21.6 20.0 20.6 2.6 1.2
-0.8
-20
0
20
40
60
80
100
120
DANUBE EU 27 OECD
in %
Private consumption Public consumption Investment Net exports
Source: Eurostat, UNdata, Worldbank, Bayerisches Landesamt für Statistik, Landesamt für Statistik Baden-Wurttemberg, Statistische Ämter des Bundes und der Länder. Calculation and illustration: IAW. Danube Region does not hit the 100 %mark because proxies have been used for net exports for Bavaria and Baden-Wurttemberg.

Annex
87
Figure 51: GDP components in 2004
56.1 53.7 66.8 82.0
54.7
16.8 21.1 17.6
21.0
17.5
19.7 26.6 24.3
27.1
21.4 5.9
-1.4 -8.7 -29.1
6.5
-40
-20
0
20
40
60
80
100
120
140
MemberStates_1:A,BW,BY
MemberStates_2:
H,CZ,SK, SLO
MemberStates_3:HR,BG,RO
Acc. Countries Neighb.Countries
in %
Private consumption Public consumption Investment Net exports
Source: Eurostat, UNdata, Worldbank, Bayerisches Landesamt für Statistik, Landesamt für Statistik Baden-Wurttemberg, Statistische Ämter des Bundes und der Länder. Calculation and illustration: IAW. 2003: First year with complete data availability. For Member State Area 1, 100 % is not reached because for Bavaria and Baden-Wurttemberg proxies have been used for net exports.

Annex
88
Figure 52: GDP sectors in 2003
Figure 53: GDP sectors in 2003
64.1 71.5 72.5
3.2 2.1 1.9
32.3 26.2 25.6
0
20
40
60
80
100
120
DANUBE EU 27 OECD
in %
Services, value added Agriculture, value added Industry, value added
66.3 61.9 57.8 61.4 53.2
1.2 3.6 10.6 12.0 12.5
32.3 32.9 31.5 26.7 34.2
0
20
40
60
80
100
120
MemberStates_1:A,BW,BY
MemberStates_2:
H,CZ,SK, SLO
MemberStates_3:HR,BG,RO
Acc. Countries Neighb.Countries
in %
Services, value added Agriculture, value added Industry, value added
Source: Eurostat, Worldbank, Statistische Ämter der Länder. Calculation and illustration: IAW.

Annex
89
Figure 54: Labor productivity (GDP per person employed)
0
10,000
20,000
30,000
40,000
50,000
60,000
70,000
80,00020
03
2004
2005
2006
2007
2008
2009
2010
2011
200
5US$
, PPP
adj
uste
d
Year
Member States_1:A,BW,BY
Member States_2:H,CZ,SK, SLO
Member States_3:HR,BG,RO
Acc. Countries
Neighb. Countries
Source: Penn World Tables, OECD, Arbeitskreis VGL. Calculation and illustration: IAW. Data for BW and BY for 2010 and 2011 is not yet available. Data for Montenegro for 2003 and 2004 is not available.
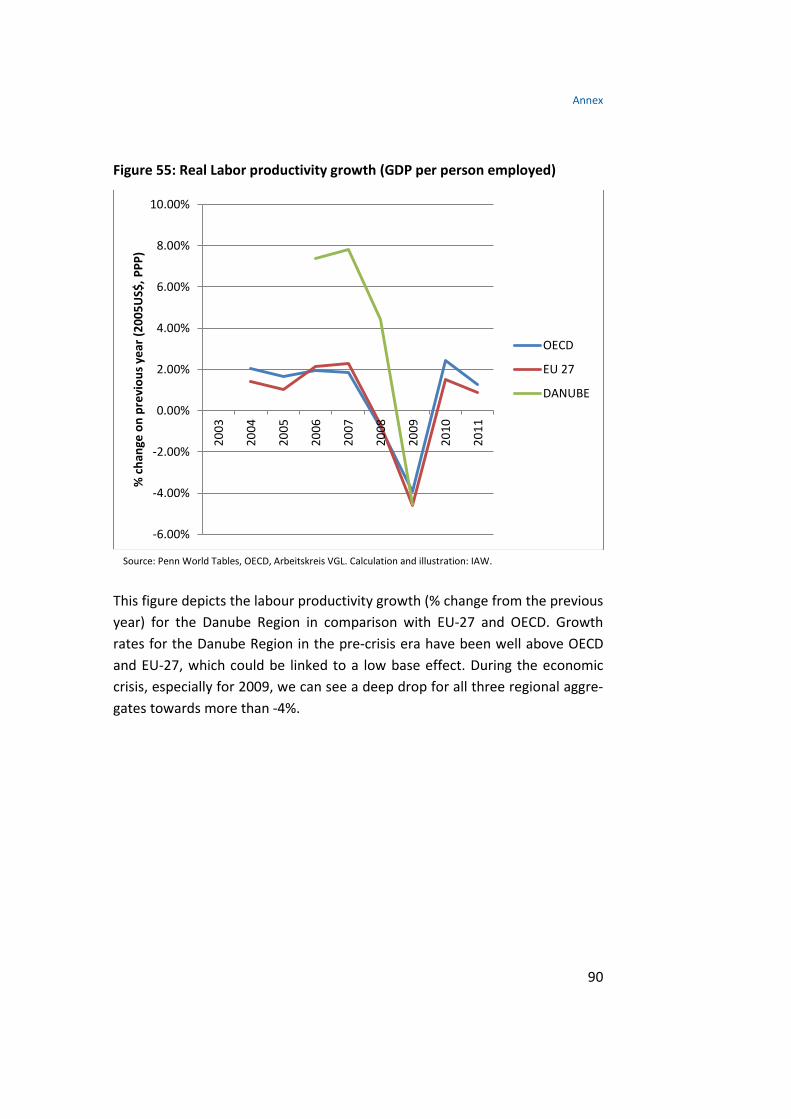
Annex
90
Figure 55: Real Labor productivity growth (GDP per person employed)
This figure depicts the labour productivity growth (% change from the previous year) for the Danube Region in comparison with EU-27 and OECD. Growth rates for the Danube Region in the pre-crisis era have been well above OECD and EU-27, which could be linked to a low base effect. During the economic crisis, especially for 2009, we can see a deep drop for all three regional aggre-gates towards more than -4%.
-6.00%
-4.00%
-2.00%
0.00%
2.00%
4.00%
6.00%
8.00%
10.00%20
03
2004
2005
2006
2007
2008
2009
2010
2011
% c
hang
e on
pre
viou
s yea
r (20
05U
S$, P
PP)
OECD
EU 27
DANUBE
Source: Penn World Tables, OECD, Arbeitskreis VGL. Calculation and illustration: IAW.

Annex
91
Figure 56: Labor productivity (GDP per person employed)
The figure shows labour productivity calculated as real GDP, PPP adjusted per person engaged. More specifically, the percentage deviation of a selection of regions from the Danube average is represented. As we can see, Member State Area 1’s productivity is nearly double that of the Danube Region aver-age, while Member State Area 2 also lies 20% above the regional average. Accession Countries and Neighbouring Countries lie closely together, but un-derneath the Danube average. As we can see, the “new” Member States are steeply rising. Especially since 2007 (year of EU accession of Romania and Bul-garia) their average labor productivity has overtaken the labor productivity of the Accession Countries. In the meantime, Neighbouring Countries swing around - 60% of the Danube average.
-80%
-60%
-40%
-20%
0%
20%
40%
60%
80%
100%
120%20
03
2004
2005
2006
2007
2008
2009
2010
2011
%de
viat
ion
from
Dan
ube
aver
age
(200
5 U
S$, P
PP)
Member States_1:A,BW,BY
Member States_2:H,CZ,SK, SLO
Member States_3:HR,BG,RO
Acc. Countries
Neighb. Countries
Danube
Source: Penn World Tables, OECD, Arbeitskreis VGL. Calculation and illustration: IAW. Data was not available for BW and BY for the years 2010 and 2011. Data was not available for Montenegro for the years 2003 and 2004. This facts prevented the creation of the Danube average for the mentioned years, and thus also the creation of the percentage deviation from this average.
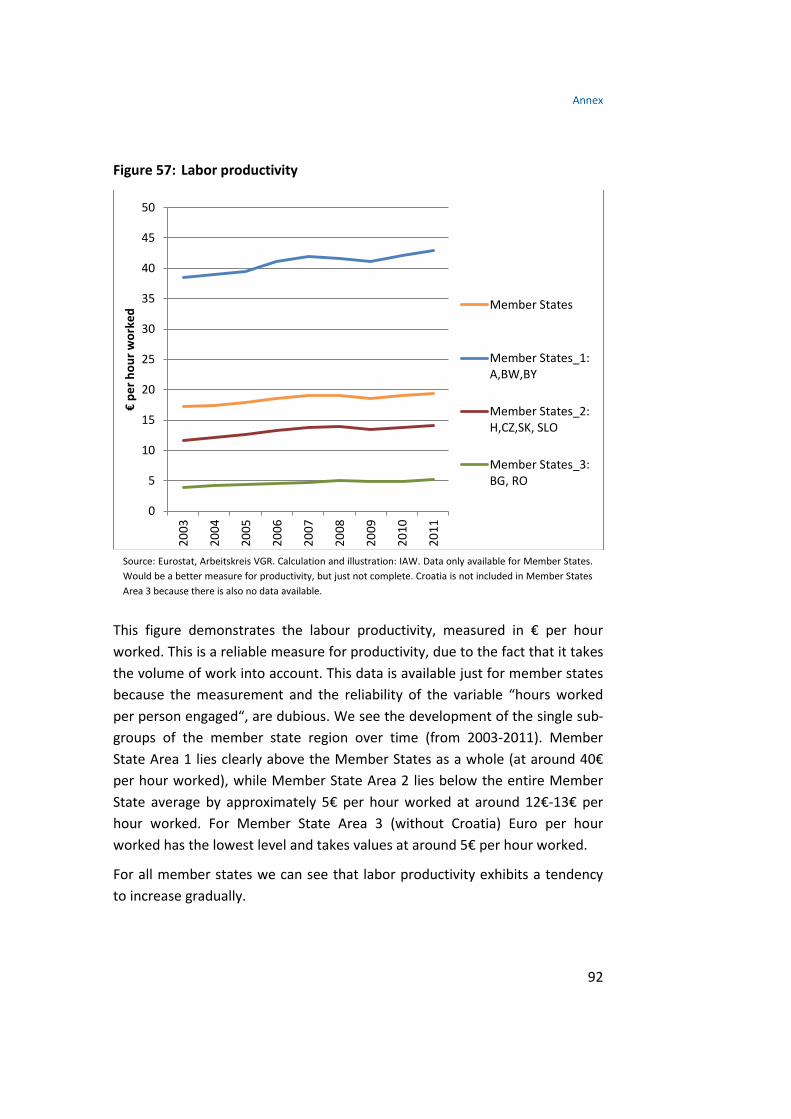
Annex
92
Figure 57: Labor productivity
This figure demonstrates the labour productivity, measured in € per hour worked. This is a reliable measure for productivity, due to the fact that it takes the volume of work into account. This data is available just for member states because the measurement and the reliability of the variable “hours worked per person engaged“, are dubious. We see the development of the single sub-groups of the member state region over time (from 2003-2011). Member State Area 1 lies clearly above the Member States as a whole (at around 40€ per hour worked), while Member State Area 2 lies below the entire Member State average by approximately 5€ per hour worked at around 12€-13€ per hour worked. For Member State Area 3 (without Croatia) Euro per hour worked has the lowest level and takes values at around 5€ per hour worked.
For all member states we can see that labor productivity exhibits a tendency to increase gradually.
0
5
10
15
20
25
30
35
40
45
50
2003
2004
2005
2006
2007
2008
2009
2010
2011
€ pe
r hou
r wor
ked Member States
Member States_1:A,BW,BY
Member States_2:H,CZ,SK, SLO
Member States_3:BG, RO
Source: Eurostat, Arbeitskreis VGR. Calculation and illustration: IAW. Data only available for Member States. Would be a better measure for productivity, but just not complete. Croatia is not included in Member States Area 3 because there is also no data available.

Annex
93
Figure 58: Population 0-14 years (share of total population)
Source: Eurostat, OECD.
Figure 59: Population 65 years and over (share of total population))
Source: Eurostat, OECD.
10.011.012.013.014.015.016.017.018.0
2004 2005 2006 2007 2008 2009 2010 2011 2012
DANUBE EU-27
10.0
11.0
12.0
13.0
14.0
15.0
16.0
17.0
18.0
2004 2005 2006 2007 2008 2009 2010 2011 2012
DANUBE EU 27

Annex
94
Figure 60: Activity rates - males
Source: Eurostat, OECD.
Figure 61: Activity rates - females
Source: Eurostat, OECD.
65.0
70.0
75.0
80.0
85.0
2004 2005 2006 2007 2008 2009 2010 2011
DANUBE EU 27 OECD
50.0
55.0
60.0
65.0
70.0
2004 2005 2006 2007 2008 2009 2010 2011
DANUBE EU 27 OECD

Annex
95
Figure 62: Unemployment by regions
Source: Eurostat, OECD.
0.0
5.0
10.0
15.0
20.0
25.0
30.0
2004 2005 2006 2007 2008 2009 2010 2011 2012
DANUBE_Member States DANUBE Acc. Countries
DANUBE Neighb. Countries