Social desirability and controllability in computerized ... · PDF filecomputerized and...
22
Computers in Human Behavior PERGAMON Computers in Human Behavior 18 (2002) 389^10 www.elsevier.com/locate/comphumbeh Social desirability and controllability in computerized and paper-and-pencil personality questionnaires Shaul Fox*, David Schwartz Department of Psychology, Bar-Han University, Ramat-Gan 52900, Israel Abstract The main objective of this study was to examine Steel's [Advances in Experimental Social Psychology 21 (1988) 261] self-affirmation theory, by checking the effects of different levels of manipulated control on participants' performance on personality tests. Specifically, we assessed the impact of participants' level of control (i.e. prior familiarity of questionnaire's items, choosing of test content) and anonymous or identified data collection on two different forms of socially desirable responses: impression management and self-deception [Journal of Personality and Social Psychology 46 (1984) 598]. Second, we compared these effects on paper-and-pencil versus computerized testing conditions. In Study 1 (JV=91) we showed that perceived control can be manipulated in computerized tests and that higher level of control is related to more positive attitudes towards the test and to lower levels of anxiety experienced during test taking. In Study 2 (TV =200) we found a significant positive relationship between manipulated control and impression management. The hypothesis claiming a significant rela- tionship between controllability and self-deception has not been corroborated. In addition, no differences were found between the paper-and-pencil and the computerized mode of adminis- tration on measures of perceived control, trust, candor, and social desirability. © 2002 Published by Elsevier Science Ltd. Keywords: Perceived control; Social desirability; Computerized testing; Personality tests 1. Introduction The prevalent use of self-report measures of personality in psychological research has raised doubts regarding the accuracy of these measures in assessing personality * Corresponding author. E-mail address: [email protected] (S. Fox). 0747-5632/02/S - see front matter © 2002 Published by Elsevier Science Ltd. PII: 80747-5632(01)00057-7
Transcript of Social desirability and controllability in computerized ... · PDF filecomputerized and...
Computers inHuman Behavior
PERGAMON Computers in Human Behavior 18 (2002) 389^10www.elsevier.com/locate/comphumbeh
Social desirability and controllability incomputerized and paper-and-pencil personality
questionnaires
Shaul Fox*, David SchwartzDepartment of Psychology, Bar-Han University, Ramat-Gan 52900, Israel
Abstract
The main objective of this study was to examine Steel's [Advances in Experimental SocialPsychology 21 (1988) 261] self-affirmation theory, by checking the effects of different levelsof manipulated control on participants' performance on personality tests. Specifically, weassessed the impact of participants' level of control (i.e. prior familiarity of questionnaire'sitems, choosing of test content) and anonymous or identified data collection on two differentforms of socially desirable responses: impression management and self-deception [Journal ofPersonality and Social Psychology 46 (1984) 598]. Second, we compared these effects onpaper-and-pencil versus computerized testing conditions. In Study 1 (JV=91) we showed thatperceived control can be manipulated in computerized tests and that higher level of controlis related to more positive attitudes towards the test and to lower levels of anxiety experiencedduring test taking. In Study 2 (TV =200) we found a significant positive relationship betweenmanipulated control and impression management. The hypothesis claiming a significant rela-tionship between controllability and self-deception has not been corroborated. In addition, nodifferences were found between the paper-and-pencil and the computerized mode of adminis-tration on measures of perceived control, trust, candor, and social desirability. © 2002Published by Elsevier Science Ltd.
Keywords: Perceived control; Social desirability; Computerized testing; Personality tests
1. Introduction
The prevalent use of self-report measures of personality in psychological researchhas raised doubts regarding the accuracy of these measures in assessing personality
* Corresponding author.E-mail address: [email protected] (S. Fox).
0747-5632/02/S - see front matter © 2002 Published by Elsevier Science Ltd.PII: 80747-5632(01)00057-7

390 S. Fox, D. Schwartz I Computers in Human Behavior 18 (2002) 389-410
attributes. Self-report measures may be so heavily influenced by response sets thatthey may not provide a valid picture of the respondents' psychological condition.One of the most common of these response sets that has raised concern amongpersonality researchers is social desirability. This tendency to create a positiveimpression is manifested especially when respondents are highly motivated toachieve some goal, such as when applying for a job. In these situations, people maybe strongly motivated to make a positive impression, and may alter their responsesto deny negative elements of their personality and to claim favorable qualities.
There is still controversy in the literature on whether socially desirable responsesto self-report personality tests are only contaminants or whether they may disclosesubstantive information regarding the respondents' personality. On the one hand,they could merely be reflecting respondents' deceptive accounts of themselves thatmay adversely affect the validity of the tests (Levin & Montag, 1987; Zerbe & Paul-hus, 1987). However, these responses could possibly represent certain traits relatedto other scores of personality measures as well as to external criteria, and thus mayserve as predictors in their own right (McCrae & Costa, 1983; Nicholson & Hogan,1990; Ones, Viswesvaran, & Reiss, 1996).
A significant contribution to this debate was introduced by Paulhus (1984). Hedistinguished between two categories of socially desirable responses: self-deceptionand impression management. Self-deception is an unconscious drive to perceiveoneself in a favorable light, to reduce inconsistency, or to protect one's ego.Respondents, in this case, do not try to fabricate their responses, rather they answerthe questions honestly, as they believe. However, this belief is a concealment derivedfrom their positively biased view of themselves (or from lack of self-insight). Self-deception is mainly manifested in the tendency of respondents to deny their negativequalities.
In contrast, the impression management component of social desirability is aconscious attempt to impress others, and to present a false facade in order to pursuea personally meaningful goal. The respondents purposely try to present an honor-able front by claiming positive qualities they know they do not possess, or bydenying negative qualities they know they have. Paulhus (1984) developed a socialdesirability scale (Balanced Inventory of Desirable Responding, BIDR) that mea-sures these two aspects.
Respondents to self-report personality tests are required to expose their weak-nesses to a stranger, who could possibly use the information to make critical deci-sions about their future. Socially desirable responses can be viewed, therefore, as adefensive means against this threat. Making a good impression on others is a com-mon behavioral tactic in many interpersonal interactions, and it is assumed to beused more frequently in threatening or stressful social interaction situations, wherethe impression made may determine the likelihood of achieving personally sig-nificant goals.
Aside from the motivation to impress others, when responding to a self-reportpersonality questionnaire one is directly exposed to his or her own faults. This is anunpleasant and threatening situation that may arouse ego-protective processes.Therefore, by denying one's faults and at the same time stressing positive

S. Fox, D. Schwartz I Computers in Human Behavior 18 (2002) 389-410 391
self-aspects one is able to ward off ego-threatening information and maintainpsychological equanimity.
One pertinent question regarding social desirability is whether the drive torespond in a socially desirable manner always exists? Are there conditions in whichthe person can take other steps against the threat instead of using socially desirableresponses?
1.1. Self-affirmation theory
Self-affirmation theory (Steele, 1988) indicates that there are situations in whichpeople do not protect the ego by dealing directly with the threatening cause. Rather,when some aspect of the self is threatened, the person may restore self-integrity byseeking other positive aspects of the self. Being aware of other aspects of the selfthan the one under threat, and choosing to behave in a manner that may strengthenpositively perceived aspects of the self, may sustain self-esteem. This defensivestrategy may enable the subject to cope adequately with the existing threat and toreaffirm his or her general sense of worth. A central aspect of the theory is that selfpreservation is conducted by referral to a broader self concept, and not necessarilyfocusing on those aspects geared to solve the specific self-concept threats. This,according to Steele (1988), illustrates the fluidity of the self-affirmation process,wherein one resource of the self may compensate for other negative components andthus maintain a sense of self-worth.
When applying self-affirmation theory to personality test-testing, we hypothesizethat by inducing a general sense of self worth we may buffer participants' inclinationto utilize defensive impression management strategies, since an awareness of theirstrengths and virtues may weaken their need to employ ego-protective maneuvers.
It seems that one possible way of activating global feelings of self worth is byinducing a personal sense of control. It is hypothesized that inducing participantswith a sense of control over the testing situation will create positive feelings that willenhance their self-integrity. Following this sense of controllability participants mayperceive their general "totalitarian ego" (Greenwald, 1980) as positive and strong,reducing the need to affirm their worth and goodness by other means.
1.2. Perceived control
There is ample evidence in the psychological literature on the favorable psycho-logical implications of having a sense of control (Friedman & Lackey, 1991), andthe negative implications of loss of control (Abramson & Alloy, 1980; Averill,1973; Greenberger, Strasser, Cummings, & Dunham, 1989; Langer & Rodin, 1976;Seligman, 1975). People are generally motivated to produce behavior-outcomecontingencies and they seek to exert control over the environment (White, 1959).Control is a major component of the individual's emotional well-being (Green-berger & Strasser, 1991): it helps to adjust to major life events and to cope withstress and pain; it leads to better health outcomes; it helps make behavioral changes;and it improves performance (Thompson & Spacapan, 1991). Thus, we assume that

392 S. Fox, D. Schwartz I Computers in Human Behavior 18 (2002) 389-410
augmenting the personal sense of control may serve as a resource that may increase theoverall sense of self-worth and consequently, may serve as a compensatory element inthe face of threat to self-esteem. Our main hypothesis, therefore, is that as peopleaffirm an image of themselves as competent and able to control important outcomes(i.e. they can control the outcomes of the personality test), they will cope with thethreat of self-exposure without resorting to socially desirable responses.
The question is whether this effect of heightened perceived control will affect boththe impression management and the self-deception components of socially desirablebehavior equally. Since self-deception is the mechanism people employ to protecttheir self-esteem, it is reasonable to assume that a heightened sense of control willserve as a self-affirming cognition regarding their self worth, that will diminish theneed to protect the ego with a self-deception strategy.
However, since impression management is a conscious behavior that may beinstrumental in achieving external goals, a greater sense of control may actuallyencourage participants to further pursue their goals, and may, therefore, increasetheir motivation to impress others. Consequently, we hypothesize that the use ofimpression management strategies will increase as feelings of control increase.
1.3. Anonymity
One of the methods suggested to curb the tendency to respond in a socially desir-able manner is by soliciting participants' responses to personality tests under con-ditions of anonymity (Holden, Magruder, Stein, Sitarenios, & Sheldon, 1999).However, anonymity seems to affect only impression management. When respon-dents are convinced that their identity cannot be determined from the questionnaire,they will not expect their responses to help them in achieving their personal goals.On the other hand, since the self-deception component of social desirability is amechanism used to protect the self, it should not be affected by anonymity, and theneed to deny negative aspects of the self will remain. A few studies tested theseassumptions, however, their esults are equivocal. Although Paulhus (1984) foundthis anonymity effect, both Booth-Kewley, Edwards, and Rosenfeld (1992) andLautenschlager and Flaherty (1990) found that anonymity decreased both impres-sion management and self deception scores (however, in Lautenschlager and Flah-erty's study, scoring of a subset of self-deception items that better representanonymous and identified conditions, yielded no significant differences betweenanonymous and identified conditions, as initially expected regarding the effects ofanonymity on self-deception).
We expected to find an interaction effect of assigned control and anonymity on thetwo social desirability scores. When participants are identified, those with a highlevel of control will have a higher score on impression management scale in com-parison to those with low level of control. On the other hand, in the anonymouscondition no difference is expected between high and low levels of control. In com-parison to impression management scores, self-deception scores are expected to belower when the respondents have a higher level of control, with no expected differ-ences between anonymous and identified conditions.

S. Fox, D. Schwartz I Computers in Human Behavior 18 (2002) 389-410 393
1.4. Computerized testing
Computerized testing is the most advanced recent development in testing tech-nology. The use of computers as a means of administering psychological tests hasbecome increasingly prevalent due to its' advantages over paper and pencil testing.Computerized testing saves time, it eliminates coding and scoring errors, it enablesmore standardization, and it allows collecting information about many variablesthat are not accessible in the conventional non-computerized mode, such as timelatency, order of responses, number of corrections and more. One of the greatestadvantages of computer testing is that it enables the simple manipulation of vari-ables and the examination of subjects' responses in carefully controlled experimentalconditions. Thus, it is possible to provide instant feedback to performance, theduration of the exposure of each item can be controlled, and participants freedom togo backward and forward, or to change their answers can be constrained. Thesecharacteristics facilitate the control over selected variables and enable a preciseexamination of their effects on responses and scores. In the present study we tookadvantage of computerized testing to manipulate different levels of controllabilitywhen responding to personality questionnaires.
The question of whether participants tend to respond in a socially desirable man-ner in paper-and-pencil tests more often than in computerized tests is still notresolved. Although several studies showed that participants tend to be less defensiveand respond more openly on computerized personality tests (Evan & Miller, 1969;Koson, Kitchen, Kochen, & Stodolsky, 1970; Lucas, Mallins, Luna, & Mclnrry,1977; Martin & Nagao, 1989), other studies did not find any real differences betweencomputerized and paper and pencil tests in regard to social desirability responses(Greist, 1975; Skinner & Allen, 1983). In a recent meta-analysis conducted byDwight and Feigelson (2000) a small significant effect was found for impressionmanagement, where scores were lower when responses were given by means ofcomputer. However, this effect diminished over time and in recent studies virtuallyno differences were found. As expected no differences between computer and paper-and-pencil administration were found for self-deception factor. Similar results arereported in another meta-analysis conducted by Richman, Kiesler, Weisband, andDrasgow (1999), although Richman et al. found that when participants answeredthe questionnaires alone and when they could check and correct previous answers,computer mode of administration yielded lower social desirability scores. Since weassume that perceived control influences socially desirable responding, we willexamine whether perceived control differentially affects social desirability scores onpaper-and-pencil personality tests versus computerized modes of administration.
To summarize, the research's objectives are twofold: the research's main objectiveis to examine the influence of different levels of perceived control and identified/anonymous conditions on the impression management and self-deception compo-nents of social desirability; the second objective of the study is to compare compu-terized testing with paper-and-pencil test administration.
Two studies were conducted. The first study was a preliminary exploratory stagedesigned to ensure that sense of control on testing behavior could be manipulated.

394 S. Fox, D. Schwartz I Computers in Human Behavior 18 (2002) 389-410
In the second experiment we tested our hypotheses regarding the relationshipbetween perceived control, anonymity, and socially desirable behavior and we alsocompared paper-and-pencil and computerized modes of administration on severalcriteria.
2. Study 1
It appears that previous studies have not examined the effect of level of controltesting behaviour. Therefore, our first study was conducted to examine whether dif-ferent levels of perceived control can be manipulated during test taking, and whetherthe effects of felt control will be reflected in cognitive, emotional and behavioralaspects related to test taking. We examined the extent of participants' trust in the testto tap the cognitive aspect, the level of their anxiety while test taking to tap theemotional aspect, and participants' readiness to provide candid answers to person-ality items to tap the behavioral aspect. We assumed that the positive implicationsof having a higher level of control would be reflected in expressing a higher degree oftrust in the test, experiencing lower levels of anxiety during the test, and expressing astronger readiness to cooperate and provide genuine answers to the tests' questions.
2.1. Method
2.1.1. ParticipantsThe participants in the study were 91 men, 18-20 years of age who were candi-
dates for a prestigious military course. Participation in the course was on a volun-tary basis and dependent upon the successful completion of screening tests. Aftercompleting their standard tests they were asked to participate in the study. It wasmade clear that participation in the experiment was on a voluntary basis and that itwould not affect the decision regarding their admittance to or rejection from thecourse. Most of the applicants agreed to partake in the experiment.
2.7.2. Questionnaires and tests2.1.2.1. Tennessee Self Concept Scale (TSCS). This test was developed by Fitts(1965) and was adjusted to Israeli norms by Frankel and Arzi (1976). It consists of100 items and answered on a five-point Likert scale. The test was transformed to acomputerized version for the present study by a program developed by the TOP-CCompany. The test assesses participants' feelings about themselves. It consists of atotal self-concept score and three sub-scales measuring self identity, self satisfaction,and behavior. In addition, the scale also includes a self-criticism scale. Each of thefirst three sub scales is measured by 30 items tapping five self-aspects: physical,moral-ethical, personal, familial and social. The self-criticism scale consists of 10items taken from the MMPI Lie scale. In the present study we administered only thefirst three sub scales and removed four items that were judged unsuitable for oursample. Thus the final scale consisted of 86 items. We used this test as a stimulus tomanipulate the extent of participants' sense of control.

S. Fox, D. Schwartz / Computers in Human Behavior 18 (2002) 389-410 395
2.1.2.2. Perceived control (PC). This questionnaire was developed by the authorsfor the present research. It examines respondents' feelings of personal control ontheir test behavior. The questionnaire was developed by constructing 14 items cov-ering different aspects of perceived control in test settings. When selecting items, weattempted to cover most aspects of perceived control (see Langer, 1983) such asparticipants' ability to direct responses to items according to their objectives, theirfreedom to choose how to answer the items and in what order, having enoughinformation about the test and how to respond to it, and the ability to manage thedesired impression. This first version of the questionnaire was administered to 200candidates to a prestigious military course (these subjects did not take part in theother studies) after completing the Tennessee Self Concept Test (Fitts, 1965). Out-comes of several standard psychometric tests led us to reframe seven items and toadd one more item.
This second, revised version of the questionnaire, was administered to an additionalsample of 150 military candidates (these subjects did not take part in other studies),after completing the Tennessee Self Concept Test (Fitts, 1965). In a factor analysisconducted on the revised scale (principal component analysis with Varimax rotation)three factors were extracted. The first factor was labeled: Perceived Control onResponses. This factor included eight items (e.g. "To what extent did you feel that youcould present yourself as you wished?"; "To what extent did you feel that you hadenough freedom while answering the test?"). The second factor was labeled: Ability toInfluence the Outcome of the Test. This factor consisted of four items (e.g. "To whatextent did you feel that you could influence the eventual impression of yourself on thebasis of your responses to the questionnaire?"). The third factor was labeled: Choice.This factor included two items (e.g. "To what extent did you feel that you couldchoose what items to respond to and what items to skip?"). One item had low load-ings on all factors, and was weakly correlated with the overall score of the ques-tionnaire and was therefore removed. Participants answered all items on a five-pointLikert-type scale from 1—a very low extent, to 5—a very high extent. Reliabilitymeasures for the three factors were quite low (Cronbach's alphas = 0.72, 0.60, 0.52for the three factor scores, respectively). The internal reliability for the entire ques-tionnaire was suitable (Cronbach's alpha = 0.73). Therefore, in the following analyseswe used only the overall score for measuring perceived control.
2.1.2.3. Attitude toward the test. We developed this questionnaire in order to exam-ine respondents' attitude towards the test as a fair instrument to evaluate their per-sonality, and their readiness to provide candid responses. First we constructed 17items which covered these aspects. This first version of the questionnaire wasadministered to the same 200 participants who answered the first version of theperceived control questionnaire (see earlier). Half of the participants answered thisquestionnaire first (after completing the Tennessee Self-Concept Scale) and the otherhalf answered it after completing the perceived control questionnaire. Following theresults of this initial step, a few changes were made. We rephrased two items,removed five other items which had very low correlations with the overall score, andadded two additional items.

396 S. Fox, D. Schwartz / Computers in Human Behavior 18 (2002) 389-410
This revised version of the questionnaire which consisted of 14 items was admi-nistered to 150 participants, the ones who took part in answering the second versionof the perceived control questionnaire (coutnerbalancing the order of the two ques-tionnaires). Factor analysis conducted on the responses of this sample yielded twofactors. The first factor was labeled: Trust in the Test as a Just and Effective Instru-ment for Diagnosing Personality. This factor included eight items (e.g. "To whatextent do you think the test is a fair test"? "To what extent do you think thatresponses to this test reliably tap respondents personality?"). The second factor waslabeled: Candor. This factor included six items (e.g. "To what extent were yourresponses to the test candid?" "To what extent do you think that your friends willcooperate in providing candid answers to this test"?), Cronbach's alpha for the firstfactor was 0.84 and for the second factor 0.85. For the overall questionnairealpha = 0.87. Thus, the final questionnaire had 14 items, scored on a five-point scalefrom 1—a very low extent to 5—a very high extent. In the following analyses resultswill be provided separately for each factor.
2.1.2.4. State-Trait Anxiety Inventory (STAI, Spielberger, Gorsuch, & Lushene,1983). We chose to test the level of anxiety experienced by the participants whileanswering the personality test with the state component of the STAI. This part ofthe inventory, which consists of 20 items (Hebrew version, translated by Teichman& Melnick, 1984) measures transitory anxiety response to a specific situation. Inthe present study we were interested in assessing the level of anxiety arousedby the personality questionnaire, and the differences in anxiety level as a function ofthe level of perceived control participants have over their testing behavior.
The three questionnaires (perceived control, attitude toward the test and theanxiety scale) were administered by computer. All the items were randomly mixedand were administered as one questionnaire. Each item was shown on a separatescreen and the participants answered it by using the keyboard.
2.1.3. Experimental manipulationsThe experimental manipulations used in the present study were improved follow-
ing initial studies. The results of these studies led us to strengthen the controlmanipulations and to increase the differences between the experimental groups.Four experimental groups were manipulated as follows:
2.1.3.1. Fair control. This group received a computerized version of the TSCS gen-erally equivalent to the original paper and pencil version. Each item was presentedon a separate screen. The instructions were generally similar to the original paperand pencil version. However, additional instructions notified the respondents thatthey had to answer each item when presented on the screen, they had to answer allthe items and would not be able to skip any items, or go back to view an item orchange their responses.
2.1.3.2. Weakened control. In addition to the same instructions given in the faircontrol condition, the respondents of this group were given additional instructions

S. Fox, D. Schwartz I Computers in Human Behavior 18 (2002) 389-410 397
informing them that each item would be shown on the screen only for 3-9 s and theywould have to respond to the item within this time limit. "You have to answerquickly, you will not be able to think too long, and you will not have enough time tochange your answer." They were further told that they would not be able to know inadvance how long the item would be presented. For each item a red digital clock,which showed how many seconds passed from the time the item was shown,appeared on the screen. The location of the clock and its' fonts were randomlychanged along the test screens. If the allotted time expired without getting ananswer, the item disappeared and on the screen appeared a warning in red letters:"You did not meet the time limit. Go back and answer the item within the timelimit. Please notice that the number of times you do not meet the time limit isrecorded". After a few screens, an additional unexpected note was presented: "Thisquestionnaire consists of items which cover several personality aspects. We calculatescores for each of these aspects". We assumed that this unexpected and unclearinformation would create uncertainty and would further impair feelings of control.Finally, two times during the trial the respondents were told that the computer couldnot accept their answers, since they probably mistakenly chose a number larger than5. The items reappeared on the screen and the participants were asked to be carefuland choose only responses between 1 and 5 (this note was screened to all subjects,unrelated to their real responses).
2.1.3.3. The choice group. After reading the general instructions participants in thisgroup were given information about the test. They were told that the test measuresthree aspects: self-identity, present behavior, and behavior in childhood (the twofirst measures were real, while the third was false. The original behavior factor of theTSCS was included but no information was provided regarding it). For each aspecta few sample questions were presented. For the third aspect—behavior in child-hood—which was not part of the original scale, sample items were "When I wasvery young I wept a lot at night", "When I was a young child I had difficulties tostop suckling". The objective of this measure was to manipulate participants' beliefthat they had control over the tests' content. Accordingly, participants were toldthey could choose which aspects they would like to respond to. The measure ofbehavior in childhood was added, in fact, since it was assumed that most partici-pants would choose not to answer it, and thus all participants would undergo thesame test. Indeed, most of the participants chose not to respond to this scale, andthe four participants who chose to answer it were not included in the sample. Inorder to assure participants that their choice was real, an announcement appearedon the screen for five seconds that said: "please wait until the computer prepares thetest according to your choice." In addition, participants were allowed to go backand change their responses, and there was no time limit for answering the test. Toremind participants that the test was structured according to their preference, at theend of the test another note was screened that read: "The test included only ques-tions which examined two aspects—self-identity and present behavior—as youchose. We did not include items regarding behavior in childhood which you pre-ferred not to answer". This procedure was assumed to lead participants to believe

398 S. Fox, D. Schwartz I Computers in Human Behavior 18 (2002) 389-410
that they chose the topics they would be tested on while in fact all participantscompleted the exact same scales.
2.1.3.4. Prior familiarity of stimuli and responses group. According to Langer (1983)familiarity of the responses and of the stimuli increases the person's illusion of con-trol. We applied this idea in the current study by providing the respondents with adetailed explanation on the self-aspects the test examines (physical self, personal self,etc.), and gave them examples of sample items. They were urged to practiceanswering these items, knowing that this part is a practice stage in whichtheir answers would not be taken into consideration. In addition, they were pro-vided with information on answers' alternatives, and on the way their score is com-puted. They were assured that they would not need to memorize this information.The information about the test's aspects reappeared when the respondents startedanswering the test: For each item information about the aspect that the item exam-ines also appeared. The instructions informed respondents that they could go backand change their responses, and that the test has no time limit.
2.1.4. General procedureAfter completing the standard military screening tests for which the participants
were summoned to, all those who volunteered to take part in the experiment wereseated before a computer. They were given detailed explanations on the procedureand completed practice exercises to familiarize them with the computer (most of thesubjects had prior knowledge on computers and they did not need too long prac-tice). Before administering the tests they were told that they do not need to provideany information about themselves, since their responses are anonymous. Followingthis initial procedure the TSCS and the three other questionnaires—perceived con-trol, attitudes, and STAI in their computerized form were given. As mentionedbefore, the items of these three questionnaires were combined and randomly mixedforming one questionnaire. Each item was presented on a separate screen. Thetest and the questionnaires were administered to a group of three respondents eachtime, and each group was randomly assigned to one of the four experimental groups(i.e. fair control, weakened control, etc.).
2.2. Results
Table 1 presents the means and standard deviations for each of the four reactionstoward the personality test, according to the four experimental control manipulations.
An omnibus MANOVA was significant, F(\2, 222) = 2.32. P<0.008 (WilksLambda). Follow-up one-way ANOVAs revealed significant differences between thefour experimental groups for all the dependent variables: perceived control, F(3,87) = 6.28, P<0.01, Trust, F(3, 87) = 2,82, P<0.04, Candor, F(3, 87) = 3.42,P<0.02, and Anxiety, F(3,87) = 5.83, P<0.001.
Contrast analysis across all the dependant variables, yielded significant differences(P<0.05) between the weakened control group and the choice and familiaritygroups. Differences that approached significance were found between the weakened

5. Fox, D. Schwartz I Computers in Human Behavior 18 (2002) 389-410 399
Table 1Means and standard deviations of perceived control, trust, candor and state anxiety for the four experi-mental groupsa
Condition
Weakened controlFair controlChoiceFamiliarity
N
25242121
Perceivedcontrol
44.24a (6.36)45.62a (7.79)50.90b (6.60)50.76b (5.09)
Trust
24.12a(5.07)26.58ab (4.52)27.24b(4.15)27.90b (5.23)
Candor
23.84a (3.49)25.25ab (3.39)
25.95b(2.13)26.52b (2.69)
State anxiety
32.56a (9.22)26.29b (7.89)25.33b (7.59)24.14b (4.33)
a Within columns, means with the same letter are not significantly different at P<0.05.
control group and the fair control group (P<0.06), and between the fair controlgroup and the choice group (P<0.08).
Contrast analyses conducted for the perceived control scores yielded significantdifferences (/><0.01) between the weakened control group and the choice andfamiliarity groups—where, as expected, the weakened group also had significantly(P<0.05) lower perceived control scores in comparison to the choice and familiaritygroups. No other significant differences were found (weakened control vs. fair con-trol groups, and choice vs. familiarity groups).
For both the trust and candor factors, contrast analyses revealed significant dif-ferences between the weakened control manipulation and both the choice andfamiliarity groups (/)<0.03). Participants with a stronger manipulated control hadmore favorable feelings towards the test.
The contrast analyses of the state anxiety questionnaire yielded a significantly(jP<0.01) higher level of anxiety among participants who belonged to the weakenedcontrol group in comparison to the other three experimental groups. No other sig-nificant differences were found.
Correlations between perceived control and the other three variables across thegroups yielded the following outcomes (all r's are significant at the P<0.01 level):r = 0.51, r = 0.42, and r=—0.55 for trust, candor and anxiety, respectively. Partici-pants who felt they had more control expressed more positive attitudes toward thequestionnaire, they were more ready to respond candidly and they were much lessanxious.
2.3. Discussion
The findings of Study 1 demonstrated that perceived control in testing behaviorcan be manipulated. The results showed that perceived control is positively asso-ciated with respondents trust in the test, to their readiness to respond candidly to thetest, and negatively associated with their level of anxiety while test-taking.
Participants who could choose the topics they would be tested on, and those whowere given the opportunity to familiarize themselves with the test's items and modeof response, felt that they had more control, more trust in the test, were more readyto react genuinely, and their level of anxiety was lower compared to the weakened

400 S. Fox, D. Schwartz I Computers in Human Behavior 18 (2002) 389-410
control group. A similar yet non-significant trend was found when comparing thechoice and familiarity groups with the fair control group. No significant differenceswere found between the choice and the familiarity groups.
Unexpectedly, no significant differences were found between the weakened controlgroup and the fair control group, although the means for the four dependent vari-ables were in the expected direction (the weakened control group had lower scoresthan the fair control group). This may be due to the constraints imposed upon thefair control group to respond to all items and their inability to go back and correcttheir answers.
Following our findings from Study 1 we conducted an additional study in which apaper-and-pencil administration group was added to the four experimental groupsof Study 1. The objectives of this study were to examine how different levels ofcontrol affect the impression management and self-deception aspects of socialdesirability, and to examine the degree of perceived control and the social desir-ability scores while answering paper-and-pencil scales in comparison to their com-puterized version.
3. Study 2
3.1. Method
3.1.1. ParticipantsIn the present study an independent sample of 200 males, 18-20 years of age, who
volunteered to a highly military prestigious course participated in the study. As inStudy 1, after completing screening tests for the course, participants were asked tovolunteer for the present study. It was made clear to them that the results of thisstudy will only be used for research purposes and will not affect their chances ofadmittance to the military course.
3.1.2. MeasuresThe Perceived Control questionnaire, the attitudes toward the test, with its two
factors (Trust in the test and Candor), and the State-Trait Anxiety Inventory (STAI,Spielberger et al., 1983) were administered in the same way as in Study 1. The Ten-nessee Self Concept Scale (Fitts, 1965), was used as in Study 1. However, we addedthe self-criticism scale as an additional measure of social desirability.
Three more instruments were used in the present study:
3.1.2.1. Eysenck and Eysenck's (1975) Personality Questionnaire (EPQ). This is a90-item forced-choice measure which assesses four constructs: Psychoticism (P),Neuroticism (N), Extraversion (E), and Lie (L). We used a Hebrew version of theEPQ translated by Montag (1985). The English and the Hebrew versions of the testwere found to be similar in their psychometric properties and their relationshipswith other personality inventories (Levin & Montag, 1987; Montag & Comrey,1982). The test was administered in its original pencil- and-paper form. The test was

S. Fox, D. Schwartz / Computers in Human Behavior 18 (2002) 389-410 401
used in the present study to verify that the different experimental groups were simi-lar in their social desirability (Lie scale) and personality characteristics.
3.1.2.2. Balanced Inventory of Desirable Responding (BIDR, Paulhus, 1984). Thisquestionnaire measures the two aspects of social desirability: impression manage-ment and self-deception. We used version 6 of the questionnaire which consists of 40items, 20 items for each factor. Paulhus (1994) found that the two scales are quiteindependent (the correlations between the scales ranged between 0.20 and 0.30).Scores on the impression management scale are affected by situational demands(public versus anonymous administration; Paulhus, 1984; Paulhus & John, 1998).Self-deception, on the other hand, is more stable and represents an unconsciousmotivation for self enhancement. The questionnaire was translated to Hebrew by theauthors. Three senior psychologists checked the translations and following theircomments the translation was improved. Two items (one of each scale) were omittedbecause of their unsuitability to our sample. The revised Hebrew version wasadministered to 275 subjects (an independent sample of candidates to the prestigiousmilitary course that did not take part in any of our present studies). Factor analysis(principal component analysis, with Varimax rotation) generally confirmed the fac-tor structure reported by Paulhus. Cronbach's Alphas yielded alpha = 0.84 forimpression management, and alpha = 0.71 for self-deception. The correlationbetween impression management and self-deception was r = 0.59, much higher thanthe results Paulhus (1994) reported, yet similar to what Ones et al. (1996) found.
The questionnaire was computerized and its items were randomly incorporatedwithin the items of the TSCS. The order of the items of the two original ques-tionnaires was maintained.
3.1.2.3. The Marlowe-Crowne Social Desirability Scale (MC, Crowne & Marlowe,1964). This questionnaire consists of 33 items. It is considered the most commoninstrument for measuring social desirability (Furnham, 1986). The questionnaire iswidely used for examining the influence of various variables on social desirability(Furnham, 1986; Martin & Nagao, 1989). Paulhus (1984) found that it correlated bothwith self-deception and impression management. The questionnaire was administeredin a computerized version, where each item was shown separately on a different screen.
3.1.3. ProcedureAs in the first study, after the subjects completed the standard tests used for
screening to the military course, they were asked to volunteer to take part in thisresearch. Almost all participants volunteered. First, they completed the EPQ. Then,they were randomly divided into two groups: anonymous responding, and identifiedresponding. The participants of the first group were instructed to answer the ques-tionnaires without typing their names on the computer. Participants from the other,identified group, had to type their names and were aware that their responseswere not anonymous. Then, the subjects were given the TSCS and the BIDR in fivedifferent control manipulations: Fair control, weakened control, choice, priorfamiliarity of stimuli and responses, and paper-and-pencil administration. The
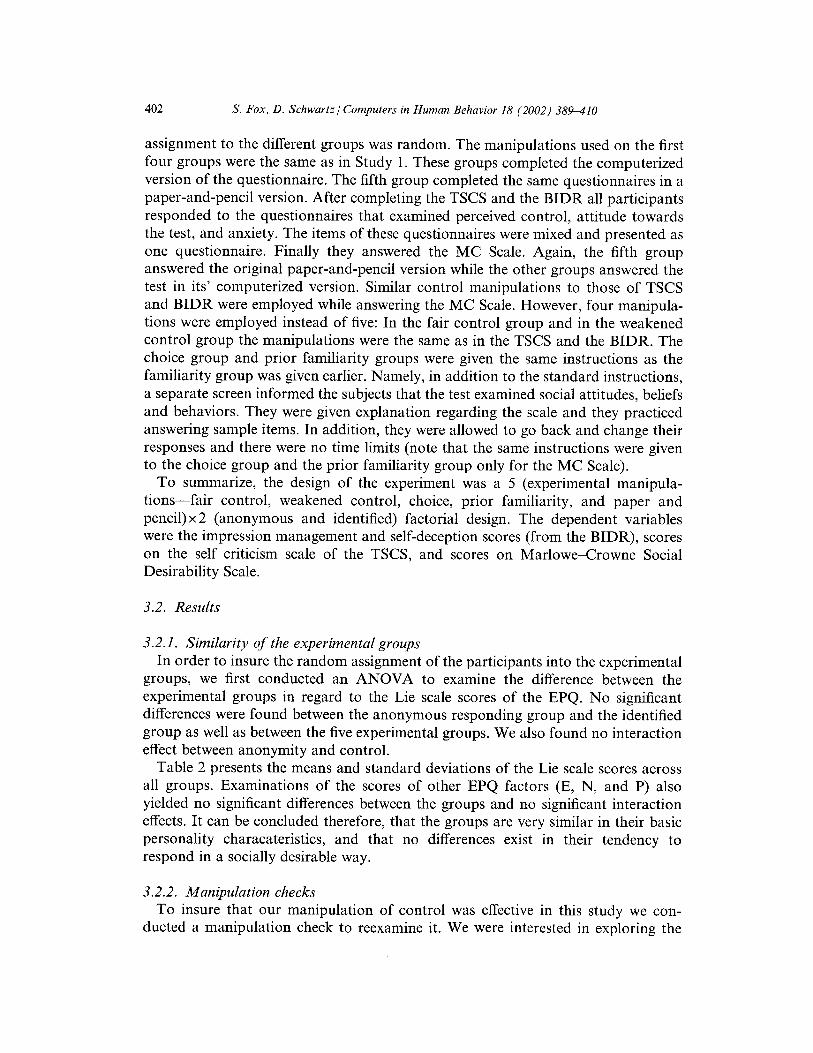
402 S. Fox, D. Schwartz / Computers in Human Behavior 18 (2002) 389-410
assignment to the different groups was random. The manipulations used on the firstfour groups were the same as in Study 1. These groups completed the computerizedversion of the questionnaire. The fifth group completed the same questionnaires in apaper-and-pencil version. After completing the TSCS and the BIDR all participantsresponded to the questionnaires that examined perceived control, attitude towardsthe test, and anxiety. The items of these questionnaires were mixed and presented asone questionnaire. Finally they answered the MC Scale. Again, the fifth groupanswered the original paper-and-pencil version while the other groups answered thetest in its' computerized version. Similar control manipulations to those of TSCSand BIDR were employed while answering the MC Scale. However, four manipula-tions were employed instead of five: In the fair control group and in the weakenedcontrol group the manipulations were the same as in the TSCS and the BIDR. Thechoice group and prior familiarity groups were given the same instructions as thefamiliarity group was given earlier. Namely, in addition to the standard instructions,a separate screen informed the subjects that the test examined social attitudes, beliefsand behaviors. They were given explanation regarding the scale and they practicedanswering sample items. In addition, they were allowed to go back and change theirresponses and there were no time limits (note that the same instructions were givento the choice group and the prior familiarity group only for the MC Scale).
To summarize, the design of the experiment was a 5 (experimental manipula-tions—fair control, weakened control, choice, prior familiarity, and paper andpencil) x2 (anonymous and identified) factorial design. The dependent variableswere the impression management and self-deception scores (from the BIDR), scoreson the self criticism scale of the TSCS, and scores on Marlowe-Crowne SocialDesirability Scale.
3.2. Results
3.2.1. Similarity of the experimental groupsIn order to insure the random assignment of the participants into the experimental
groups, we first conducted an ANOVA to examine the difference between theexperimental groups in regard to the Lie scale scores of the EPQ. No significantdifferences were found between the anonymous responding group and the identifiedgroup as well as between the five experimental groups. We also found no interactioneffect between anonymity and control.
Table 2 presents the means and standard deviations of the Lie scale scores acrossall groups. Examinations of the scores of other EPQ factors (E, N, and P) alsoyielded no significant differences between the groups and no significant interactioneffects. It can be concluded therefore, that the groups are very similar in their basicpersonality characateristics, and that no differences exist in their tendency torespond in a socially desirable way.
3.2.2. Manipulation checksTo insure that our manipulation of control was effective in this study we con-
ducted a manipulation check to reexamine it. We were interested in exploring the

S. Fox, D. Schwartz I Computers in Human Behavior 18 (2002) 389-410 403
Table 2Means and standard deviations of the experimental groups in Lie scale scores of the EPQ (N= 20 in eachgroup)
Anonymity/controllability Anonymous responses Identified responses
Weakened control 11.00 (4.37) 11.60 (4.62)Fair control 11.85 (4.69) 11.25 (3.55)Control by choice 11.00 (2.55) 10.57 (3.76)Prior familiarity 12.20 (4.21) 10.95 (3.83)Paper and pencil 11.90 (2.93) 12.35 (3.68)
effect of the anonymity variable on perceived control, trust, candor and state anxietyas well, and to examine the scores of the participants assigned to the paper-and-pencil group on these variables in comparison to other experimental groups. Table 3reports the means and standard deviations of these dependent variables across allgroups. The data were analyzed by a two-way MANOVA which yielded a controlmain effect, F(\6, 572) = 3.91 (Wilks), P<0.001, and an interaction effect betweencontrol and anonymity, F(16, 572) = 2.28 (Wilks), /)<0.01. The anonymity maineffect was not significant, F(4, 187) = 0.16 (Wilks), P> 10. A series of 5x2 ANOVAsconducted separately for each of the dependent variables generally replicated theoutcomes obtained in Study 1. The experimental groups were found to be sig-nificantly different on all four variables: Perceived control, F(4, 190) = 9.51,P<0.001, Trust, F(4, 190) = 6.16, P<0.001, Candor, F(4, 190) = 3.91, P<0.001, andAnxiety, F(4, 190) = 6.58, P< 0.001. A significant interaction effect between controland anonymity variables was found only for the trust variable, F(4, 190) = 2.57,P<0.05. Comparison analyses revealed that familiarity groups expressed strongertrust when responding was anonymous in comparison to the identified instructions.In the fair control group trust was stronger in identified versus anonymousresponding. In the other groups no differences were found between anonymity andnomination groups. The highest level of trust in the test, in comparison to all otherconditions, appeared among members belonging to the familiarity group.
For the perceived control variable, follow up comparisons yielded significant dif-ferences (J°<0.01) between weakened control and all other groups (perceived con-trol for the weakened control group was lower). In addition, the familiarity groupwas found to be significantly (.P<0.01) higher on perceived control than the faircontrol group, the choice group and the paper-and-pencil group. Generally, per-ceived control was lowest among participants belonging to the weakened controlgroup. The fair control and paper-and-pencil groups felt a moderate sense of con-trol, and the strongest level of control was perceived among members of the famili-arity group. In contrast to expectation, the manipulation of choice did notsignificantly affect the extent of perceived control, although the perceived control ofthose who answered the test anonymously, was quite high.
Similar findings were revealed in regard to the trust variable. The weakened con-trol group had the lowest level of trust in comparison to all other groups, and the

404 S. Fox, D. Schwartz / Computers in Human Behavior 18 (2002) 389-410
Table 3Means and standard deviations of manipulation check variables across the experimental groups"
Check variables/experimental groups
Weakened control
Fair control
Choice group
Prior familiarity
Paper and pencil
Anonymity
AnonymousIdentifiedAllAnonymousIdentifiedAllAnonymousIdentifiedAllAnonymousIdentifiedAllAnonymousIdentifiedAll
Perceived control
M
44464547484751474953
.15
.15
.15a
.50
.05
.77c
.25
.75
.50c
.7052.4053484848
,05b.30.55.42c
SD
7.824.956.545.747.046.355.224.365.066.905.886.365.654.334.97
Trust
M
24.23.23.25.28.
.10
.75,92a9560
27.27b26.26,26.31.27.29.26.26.26,
.55
.65,60b.1510
,12c,55,80,67b
SD
5.726.055.814.625.215.043.634.173.864.674.514.973.744.584.13
Candor
M
23.7022.1022.90a23.9524.3024.12ac24.2523.8024.02ac25.1526.0525.60b23.8525.5024.67bc
State anxiety
SD
3.683.783.773.311.972.702.823.032.903.492.743.132.943.333.21
M
28.8031.7530.27a23.8025.4024.60b24.3024.5524.42b25.4023.0024.20b28.6526.1027.37c
SD
8.038.398.243.608.286.364.234.404.267.153.695.757.406.857.15
a Within columns, only for all participants, means with the same letter are not significantly different atP-eO.05.
familiarity group expressed higher trust in comparison to the fair control group, thechoice group, and the paper-and-pencil group. It is interesting to note that no dif-ference was found between paper-and-pencil administration and fair control com-puterized administration for the trust variable.
Weaker differences were found in the comparison analyses of the candor variable.Although the weakened control group obtained the lowest score, it was significantlydifferent only in comparison to the familiarity and the paper-and-pencil groups. Inaddition, familiarity group participants expressed their readiness to provide candidresponses more strongly than members belonging to the fair control group and thechoice group. Again, no differences were found between the paper-and-pencil groupand the computerized fair control group for the candor variable.
Comparison analyses conducted on the anxiety variable revealed that the weak-ened control group and the paper-and-pencil group were more anxious than allother groups, yet, the weakened control group received significantly higher anxietyscores than the paper-and pencil-group.
Finally, correlations between perceived control scores and the other three vari-ables for the entire sample yielded the following results: Perceived control withTrust, r = 0.54 (P<0.01), with Candor, r = 0.24 (P<0.01) and with Anxiety,r = -0.37(P<0.01).
Generally, these findings replicated the general findings of Study 1. It seems thatour control manipulation was successful in creating differences among the groups intheir perceived control and in other variables as well.

S. Fox, D. Schwartz / Computers in Human Behavior 18 (2002) 389-410 405
3.2.3. Control and social desirabilityTable 4 presents the means and standard deviations of social desirability measures
across the experimental groups. Although no differences were found between theexperimental groups in terms of all personality factors measured by the EPQ, wedecided to take extra caution and examine the effect of the control manipulation onthe social desirability measures after controlling for the Lie scale scores and theNeuroticism scores. A MANCOVA analysis (controlling for these two variables)yielded only a main effect for the perceived control variable, F(16, 562) = 2.87(Wilks), P< 0.001. No significant effects were found for the anonymity variable,F(4, 184) =1.43, (Wilks), P>0.10, and for the interaction between control andanonymity, F(16, 562) =1.37 (Wilks), P>0.10. Thus our hypothesis about theexpected interaction effect of control and anonymity was not corroborated. Thecontrol variable alone affected social desirability scores.
In a following series of ANCOVAs, a main effect of the control variable wasfound only for the impression management component, F(4, 187) = 5.32, P< 0.001.Comparison analyses (Scheffe) yielded significantly higher impression managementscores for the familiarity group and paper-and-pencil group in comparison to theweakened control group. No other comparisons were found to be significant. Thepaper-and-pencil group had the highest impression management scores, while theweakened control group received the lowest scores. ANCOVAs for the self-decep-tion scores and the Marlowe Crowne scores yielded only marginally significanteffects (F(4, 187)= 1.94, P<0.10 and F(4, 187) = 2.24, P<0.06, respectively). Inthese analyses, the familiarity and paper-and-pencil groups had higher scores than
Table 4Means and standard deviations of social desirability measures across all experimental groups3
Experimental groups/ Anonymity Impressionsocial desirability managementmeasures
Self-deception Selfcriticism
Marlowe-Crowne
M SD M SD M SD M SD
Weakened control
Fair control
Choice
Familiarity
Paper and Pencil
AnonymousIdentifiedAllAnonymousIdentifiedAllAnonymousIdentifiedAllAnonymousIdentifiedAllAnonymousIdentifiedAll
61.8062.7062.66.676668
.25b
.45
.45
.95ab
.1064.5266696868667269
.35ab
.50
.25
.87a
.55
.20
.37a
7.778.227.91
119
10587
1179889
.06
.76
.31
.94
.12
.22
.30
.83
.61
.79
.86
.17
65.9069.5067.70b68.0069.5568.77b68.6068.3668.48b71.0070.4070.70a68.7570.9569.85a
5.535.455.726.716.876.755.876.866.296.345.635.926.045.435.78
29.7530.3930.02a31.8531.1031.47a32.1031.3631.74a33.1031.4532.27a31.0530.3530.70a
7.115.116.124.914.614.714.934.784.816.525.756.124.394.764.53
20.0019.2519.62a19.4520.5520.00a20.8019.5720.20a22.3520.7521.55a20.2523.0521.65a
4.614.864.694.925.615.243.344.744.074.975.645.313.984.094.23
a Within columns, only for all participants, means with the same letter are not significantly different atP<0.05.

406 S. Fox, D. Schwartz I Computers in Human Behavior 18 (2002) 389-410
all other groups. No significant differences were found in the self-criticism scores ofthe TSCS. Thus, higher perceived control did not lead to lower self-deception as weexpected. It seems that there is even a tendency towards an opposite effect—strongercontrol leads to higher socially desirable responding. This effect was most pro-nounced in the impression management component of the socially desirable behav-ior. Calculating the correlation between impression management and self-deceptionfor the whole sample yielded quite high relationship, r = 0.49 (/)<0.05).
3.3. Discussion
3.3.1. Control and social desirabilityOur hypotheses on an interaction effect between perceived control and anonymity
on the impression management and self-deception components of social desirabilitywere not corroborated. We did not find significant interaction effects between per-ceived control and anonymity nor did we find a main effect of anonymity. Inaccordance with our expectation, participants' level of perceived control affectedimpression management. Participants in the prior familiarity group, who had thestrongest sense of control, had the highest impression management scores, whereasthe group who had the least control—the weakened control group—had the low-est scores. However, unexpectedly, control manipulations did not affect self-deceptionscores. No significant differences were found in self-deception scores between groupswith heightened level of control and groups which were assigned to lower controlconditions. Participants tended to give more socially desirable responses when theyhad more control.
Participants with higher perceived control took advantage of the control they hadto better manage their impression. They portrayed themselves more favorably thanothers with less sense of control. Since making a good impression may be instru-mental to achieving external goals, participants who felt they could more easilymanipulate this impression felt less restraints to take the opportunity. It should benoted that the study took place in a setting where all participants were undergoingselection to an elite military unit. Although participants were told that their answerson the questionnaires are part of a separate research that would not affect the deci-sion regarding their selection to the unit, we could not be sure that this did not affecttheir impression management motivations. Many of them could still be concernedthat the study was just a guise for obtaining more information about their person-ality that could be used by the military. That may also explain the lack of differencesbetween the anonymous and identified context. It is reasonable to assume that inthis specific context of test taking, many of them did not believe that the conditionwas really anonymous. Thus, it seems that when the motivation to achieve somegoal is strong, and the possibility to make a good impression exists (i.e. there is morecontrol over the test), participants will take the advantage and will overreportdesirable behaviors and underreport their faults in order to maximize the likelihoodof achieving their goal.
Yet, the present study offers a way by which social desirability may be reduced.We found that when participants had the lowest levels of perceived control (i.e.

S. Fox, D. Schwartz / Computers in Human Behavior 18 (2002) 389-410 407
weakened control group) their impression management scores were the lowest, incomparison to all other groups, including the paper-and-pencil group. Thus, itseems that restricting the control over participants' test behavior may reduce theirtendency to fabricate their answers.
Contrary to our hypothesis, the self-deception component of social desirability didnot decrease in the heightened control conditions. Since self-deception is assumed tobe an unconscious process by which the person maintains his or her self-worth, wehypothesized, in accordance with self-affirmation theory (Steele, 1988), that partici-pants who had higher levels of control would not need to deny their faults. Thecontrol that they felt would provide them with sufficient ego protection.
Self-affirmation theory was not supported in the present study. Having high con-trol over the situation did not serve as an ego protector. Participants with a strongersense of control tended to act similarly to those without control in terms of sociallydesirable responding. There is even some indication that they tended to cope withthe threat of exposure by providing responses that are even more acceptable thanthose with less control.
One possible reason for not obtaining reduced self-deception scores under heigh-tened control situations is that the self-deception measure does not successfullytap the specific elements which people are likely to deny, that are clearly differentfrom the elements which are used for impression management. Tetlock and Man-stead (1985) claimed that there is no difference between these two concepts, that thedistinction between impression management and intrapsychic explanations such asself-deception for behavior are arbitrary and empirically indiscriminable. Indeed,there are indications that the impression management and self-deception scores ofthe BIDR (Paulhus, 1984) are not independent. Ones et al. (1996) report observedcorrelations in the magnitude of 0.40-0.70 between these two components, as well asa similar pattern of correlations between the two measures and the Big Five dimen-sions. In the present research we used an advanced version of the test. Whereasformer studies found lower inter-correlations (0.20-0.32, see Paulhus, 1994), in oursample we found a correlation of 0.49 (P<0.05) and in our pre-test group we founda correlation of 0.59 (P<0.01) between the two scales. Paulhus (1994) points out thatthe correlations between the scales tend to be particularly high under conditionsthat exert high demands for self-presentation. It seems that the two scales are notentirely independent in selection settings. However, there is still a great deal ofvariance for each scale, which raises expectations for different results on impressionmanagement and self-deception as a function of relevant manipulations.
A more substantive explanation for the present findings is that the manipulationof perceived control in this study does not serve as an ego protective element. Itseems to be a specific form of control that does not affect the person's whole self-image. Participants may not be able to generalize from the sense of control theyhave in this testing context to their total personality. Therefore, when confrontingthe threatening items in the questionnaire, the respondents may have not beenable to rely on this temporary form of control to overcome the threat. Instead,their sense of control may have served as a means to deny the negative character-istics they possess. Further studies should be conducted to examine what specific

408 S. Fox, D. Schwartz / Computers in Human Behavior 18 (2002) 389-410
virtues affect the broader self-concept which may serve as a protective compensationminimizing the need for socially desirable behaviors.
3.3.2. AnonymityThe results show that no differences were found between anonymous and identi-
fied modes of responses across all groups. The only significant interaction effect wasfound for the trust variable. It seems that this interaction is due to the highest levelof trust expressed by the familiarity—anonymous group, in comparison to all othergroups. These results may indicate that strong feelings of control under anonymoustesting conditions lead to the highest level of trust in the test.
The general nonsignificant differences between the anonymity and identity situa-tions are in accordance with the results of other studies (Britton, Richardson, Smith,& Hamilton, 1983; Holden et al., 1999; Szekely, Raffeld, & Snodgrass, 1989; Welch,1990). Yet, there are some studies that demonstrated the effect of anonymity onsocial desirability scores (Becker, 1976; Booth-Kewley et al., 1992; Lautenschlager &Flaherty, 1990; Paulhus, 1984). Thus, this issue is still not resolved (see also themeta-analysis findings of Richman et al., 1999). As mentioned, it may be assumedthat in the present context of testing, the participants were highly motivated to passthe screening tests for the military unit. This may have led them to disregard the factthat they were not required to enter their names as well as our assurance that theirresponses will have no affect on their admittance to the course. Moreover, respond-ing on the computer may have raised respondents' suspicion that their identity maybe identified even without providing their names ("the big brother syndrome", seeRosenfeld, Booth-Kewley, Edwards, & Thomas, 1996).
3.3.3. Comparisons between the paper-and-pencil modes and computerized testingParticipants who answered the tests on the paper-and-pencil mode were no dif-
ferent from their counterparts who answered the computerized version (fair control)in the degree of control that they experienced, in their trust in the test, and in theirdeclared readiness to give genuine responses. Yet, their level of anxiety during testtaking was higher. Furthermore, no significant differences were found in the varioussocial desirability scores between the paper-and-pencil and the computerized stand-ard mode.
The findings regarding the effect of mode of administration on social desirabilityare in accordance with both Dwight and Feigelson's (2000) and Richman et al.'s(1999) meta-analyses data. However, our study highlights the facts that paper-and-pencil and computerized testing are equivalent in other important aspects suchas perceived control, trust in the test, and readiness to react candidly.
The present study demonstrates the specific advantages and possibilities of thecomputerized mode of personality testing. We showed how perceived control, atti-tude toward the test, and anxiety level can be manipulated by special instructions,constraints, and notes appearing on the screen during the test. These manipulationswhich are difficult or impossible to conduct on conventional paper-and-pencil stud-ies, open wide and new research possibilities on testing in general and on personalitytests in particular.

S. Fox, D. Schwartz I Computers in Human Behavior 18 (2002) 389-410 409
References
Abramson, L. Y., & Alloy, L. S. (1980). Judgment of contingency: errors and their implications. InA. Baum, & J. Singer (Eds.), Advances in environmental psychology (pp. 111-130). Hillside, NJ: Erl-baum.
Averill, J. R. (1973). Personal control over aversive stimuli and its relationship to stress. PsychologicalBulletin, 80, 286-303.
Becker, W. M. (1976). Biasing effect of respondents' identification on responses to social desirability scale:a warning to researchers. Psychological Reports, 39, 756-758.
Booth-Kewley, S., Edwards, J. E., & Rosenfeld, P. (1992). Impression management, social desirability,and computer administration of attitude questionnaires: does the computer make a difference? Journalof Applied Psychology, 77, 562-566.
Britton, B. K., Richardson, D., Smith, S. S., & Hamilton, T. (1983). Ethical aspects of participating inpsychology experiments: effects of anonymity on evaluation and complaints of distressed subjects.Teaching of Psychology, 10, 146-149.
Crowne, D. P., & Marlowe, D. A. (1964). The approval motive. New York: Wiley.Dwight, S. A., & Feigelson, M. E. (2000). A quantitative review of the effect of computerized testing on
the measurement of social desirability. Educational and Psychological Measurement, 60, 340-360.Evan, W. M., & Miller, J. R. (1969). Differential effects on response bias of computer vs. conventional
administration of a social science questionnaire: an exploratory methodological experiment. BehavioralScience, 14, 216-227.
Eysenck, H. J., & Eysenck, S. B. G. (1975). Manual of the Eysenck Personality Questionnaire. Kent:Hodder and Stoughton.
Fitts, W. H. (1965). Manual for the Tennessee self concept scale. Nashville, TN: Counselor Recording andTests.
Frenkel, Y., & Arzi, Y. (1976). Sulam ledimui atzmi (self concept scale). Ramat-Gan: Bar-Han University,Bar-Oryan.
Friedman, M. I., & Lackey, G. H. Jr. (1991). The psychology of human control: a general theory of pur-poseful behavior. New York: Praeger.
Furnham, A. (1986). Response bias, social desirability, and dissimulation. Personality and Individual Dif-ferences, 7, 385-400.
Greenberger, D. B., & Strasser, S. (1991). The role of situational and dispositional factors in theenhancement of personal control in organizations. Research in Organizational Behavior, 13, 111-145.
Greenberger, D. B., Strasser, S., Cummings, L. L., & Dunham, R. B. (1989). The impact of personalcontrol on performance and satisfaction. Organizational Behavior and Human Decision Processes, 43,29-51.
Greenwald, A. G. (1980). The totalitarian ego: fabrication and revision of personal history. AmericanPsychologist, 35, 603-618.
Greist, J. H. (1975). The computer interview as a medium for collecting questionnaire data on drug use:Predicting adolescent drug abuse. In D. J. Lettieri (Ed.), Predicting adolescent drug use: a review ofissues, methods, and correlates (pp. 147-164). Washington, DC: US Government Printing Office.
Holden, R. R., Magruder, C. D., Stein, S. J., Sitarenios, G., & Sheldon, S. (1999). The effects of anon-ymity on the Holden Psychological Screening Inventory. Personality and Individual Differences, 27, 737-742.
Koson, D., Kitchen, C., Kochen, M., & Stodolsky, D. (1970). Psychological testing by computer: effect onresponse bias. Educational and Psychological Measurement, 30, 803-810.
Langer, E. J. (1983). The psychology of control. Beverly Hills: Sage.Langer, E. J., & Rodin, J. (1976). The effects of choice and enhanced personal responsibility: a field
experiment in an institutional setting. Journal of Personality and Social Psychology, 34, 191-198.Lautenschlager, G. J., & Flaherty, V. L. (1990). Computer administration of questions: more desirable or
more social desirability?. Journal of Applied Psychology, 75, 310-314.Levin, J., & Montag, I. (1987). The effect of testing instructions for handling social desirability on the
Eysenck Personality Questionnaire. Personality and Individual Differences, 8, 163-167.

410 S. Fox, D. Schwartz I Computers in Human Behavior 18 (2002) 389-410
Lucas, R. W., Mullins, P. J., Luna, C. B., & Mclnrry, D. C. (1977). Psychiatrists and a computer asinterrogators of patients with alcohol-related illness: a comparison. British Journal of Psychiatry, 131,160-167.
Martin, C. L., & Nagao, D. H. (1989). Some effects of computerized interviewing on job applicantresponses. Journal of Applied Psychology, 74, 72-80.
McCrae, R. R., & Costa, P. T. Jr. (1983). Social desirability scales: more substance than style. Journal ofConsulting and Clinical Psychology, 51, 882-888.
Montag, I. (1985). Eysenck Personality Questionnaire—revised, Hebrew version for research purposes. TelAviv: Medical Institute of Road Safety.
Montag, I., & Comrey, A. L. (1982). Personality construct similarity in Israel and United States. AppliedPsychological Measurement, 6, 61-67.
Nicholson, R. A., & Hogan, R. (1990). The construct validity of social desirability. American Psycholo-gist, 45, 290-292.
Ones, D. S., Viswesvaran, C., & Reiss, A. D. (1996). Role of social desirability in personality testing forpersonnel selection: the red herring. Journal of Applied Psychology, 81, 660-679.
Paulhus, D. L. (1984). Two-component models of socially desirable responding. Journal of Personality andSocial Psychology, 46, 598-609.
Paulhus, D. L. (1994). Balanced inventory of desirable responding: reference manual for BIDR version 6.Unpublished manuscript. University of British Columbia.
Paulhus, D. L., & John, O. P. (1998). Egoistic and moralistic biases in self-perception: the interplay ofself-deceptive styles with basic traits and motives. Journal of Personality, 66, 1025-1060.
Richman, W. L., Kiesler, S., Weisband, S., & Drasgow, F. (1999). A meta-analytic study of social desir-ability distortion in computer-administration questionnaires: traditional questionnaires and interviews.Journal of Applied Psychology, 84, 754-775.
Rosenfeld, P., Booth-Kewley, S., Edwards, J. E., & Thomas, M. D. (1996). Responses on computer sur-veys: impression management, social desirability, and the big brother syndrome. Computers in HumanBehavior, 12, 263-274.
Seligman, M. E. P. (1975). Helplessness: on depression, development and death. San Francisco: Freeman.Skinner, H. A., & Allen, B. A. (1983). Does the computer make a difference? Computerized versus face-to-
face versus self-report assessment of alcohol, drug, and tobacco use. Journal of Consulting and ClinicalPsychology, 51, 267-275.
Spielberger, C. D., Gorsuch, R. C., & Lushene, R. E. (1983). Manual for the state-trait anxiety inventory(rev. ed). Palo Alto, CA: Consulting Psychological Press.
Steele, C. M. (1988). The psychology of self-affirmation: sustaining the integrity. Advances in ExperimentalSocial Psychology, 21, 261-302.
Szekely, B. C., RafFeld, P. C., & Snodgrass, G. (1989). Anonymity, sex, and weight-preoccupation asvariables on the Eating Disorder Inventory with normal college students. Psychological Reports, 65,795-800.
Teichman, Y., & Melnick, H. (1984). Manual for the Hebrew State-Trait Anxiety Inventory (2nd ed).Tel-Aviv: Ramot.
Tetlock, P. E., & Manstead, A. S. R. (1985). Impression management versus intrapsychic explanations insocial psychology: a useful dichotomy? Psychological Review, 92, 59-77.
Thompson, S. C., & Spacapan, S. (1991). Perceptions of control in vulnerable populations. Journal ofSocial Issues, 47, 1-21.
White, R. W. (1959). Motivation reconsidered: the concept of competence. Psychological Review, 66, 297-333.
Welch, C. E. (1990). Two procedures to reduce response bias in reports of alcohol consumption. Journalof Studies on Alcohol, 51, 327-330.
Zerbe, W. J., & Paulhus, D. L. (1987). Socially desirable responding in organizational behavior: a recon-ception. Academy of Management Review, 12, 250-264.
![Gershom Scholem (Shaul Magid) [REVISED October 30, 2013]](https://static.fdocuments.us/doc/165x107/577ccd211a28ab9e788b93d5/gershom-scholem-shaul-magid-revised-october-30-2013.jpg)