Smart City Platform Development for an Automated Waste ...
15
sustainability Article Smart City Platform Development for an Automated Waste Collection System Cicerone Laurentiu Popa 1 , George Carutasu 2, * ID , Costel Emil Cotet 1 , Nicoleta Luminita Carutasu 1 and Tiberiu Dobrescu 1 1 IMST Faculty, MSP Department, University Politehnica of Bucharest, 060042 Bucharest, Romania; [email protected] (C.L.P.); [email protected] (C.E.C.); [email protected] (N.L.C.); [email protected] (T.D.) 2 Computer Science for Business Management Faculty, ISM Department, Romanian-American University, 012101 Bucharest, Romania * Correspondence: [email protected]; Tel.: +40-721-397-676 Received: 18 October 2017; Accepted: 8 November 2017; Published: 10 November 2017 Abstract: Nowadays, governments and companies are looking for solutions to increase the collection level of various waste types by using new technologies and devices such as smart sensors, Internet of Things (IoT), cloud platforms etc. In order to fulfil this need, this paper presents solutions provided by a research project involving the design, development and implementation of fully automated waste collection systems with an increased usage degree, productivity and storage capacity. The paper will focus on the main results of this research project in turning the automated waste collection system into a smart system so that it can be easily integrated in any smart city infrastructure. For this purpose, the Internet of Things platform for the automated waste collection system provided by the project will allow real time monitoring and communication with central systems. Details about each module are sent to the central systems: various modules’ statuses (working, blocked, needs repairs or maintenance etc.); equipment status; storage systems status (allowing full reports for all waste types); the amount of waste for each module, allowing optimal discharging; route optimization for waste discharging etc. To do that, we describe here an IoT cloud solution integrating device connection, data processing, analytics and management. Keywords: waste management; smart city; waste collection system; WEEE; Internet of Things; sensors; cloud platform 1. Introduction Due to the fast decrease of the available natural resources and the increased costs of raw material extraction, the European Union strategy suggests the replacement of the natural resources required to manufacture products with materials from recycled parts and products [1]. Also, technological innovation accelerates the replacement of equipment which generates an increase of waste electrical and electronic equipment (WEEE) [2]. The recovery and reuse of renewable resources are the main objectives of sustainable development for our society, being a part of the general effort to reduce the exploitation of natural resources which leads to a continuous degradation of environmental quality. Taking a look into the history of separate waste collection and recycling, one can notice that, in time, several solutions were used, but only when a lack of resources appeared did the government and local authorities take action in order to establish rules for separate waste collection. During World War II, the combatant countries started campaigns by strongly encouraging individuals to collect and recycle materials including paper, cans, metal and even kitchen fat [3]. In the 1970s, people became more and more aware of the variety of environmental issues, including trash disposal and the need for recycling and reuse [3]. However, only at the beginning of the 1990s was separate waste Sustainability 2017, 9, 2064; doi:10.3390/su9112064 www.mdpi.com/journal/sustainability
Transcript of Smart City Platform Development for an Automated Waste ...

sustainability
Article
Smart City Platform Development for an AutomatedWaste Collection System
Cicerone Laurentiu Popa 1, George Carutasu 2,* ID , Costel Emil Cotet 1,Nicoleta Luminita Carutasu 1 and Tiberiu Dobrescu 1
1 IMST Faculty, MSP Department, University Politehnica of Bucharest, 060042 Bucharest, Romania;[email protected] (C.L.P.); [email protected] (C.E.C.);[email protected] (N.L.C.); [email protected] (T.D.)
2 Computer Science for Business Management Faculty, ISM Department, Romanian-American University,012101 Bucharest, Romania
* Correspondence: [email protected]; Tel.: +40-721-397-676
Received: 18 October 2017; Accepted: 8 November 2017; Published: 10 November 2017
Abstract: Nowadays, governments and companies are looking for solutions to increase the collectionlevel of various waste types by using new technologies and devices such as smart sensors, Internetof Things (IoT), cloud platforms etc. In order to fulfil this need, this paper presents solutions providedby a research project involving the design, development and implementation of fully automated wastecollection systems with an increased usage degree, productivity and storage capacity. The paperwill focus on the main results of this research project in turning the automated waste collectionsystem into a smart system so that it can be easily integrated in any smart city infrastructure. For thispurpose, the Internet of Things platform for the automated waste collection system provided by theproject will allow real time monitoring and communication with central systems. Details about eachmodule are sent to the central systems: various modules’ statuses (working, blocked, needs repairsor maintenance etc.); equipment status; storage systems status (allowing full reports for all wastetypes); the amount of waste for each module, allowing optimal discharging; route optimizationfor waste discharging etc. To do that, we describe here an IoT cloud solution integrating deviceconnection, data processing, analytics and management.
Keywords: waste management; smart city; waste collection system; WEEE; Internet of Things;sensors; cloud platform
1. Introduction
Due to the fast decrease of the available natural resources and the increased costs of raw materialextraction, the European Union strategy suggests the replacement of the natural resources requiredto manufacture products with materials from recycled parts and products [1]. Also, technologicalinnovation accelerates the replacement of equipment which generates an increase of waste electricaland electronic equipment (WEEE) [2]. The recovery and reuse of renewable resources are the mainobjectives of sustainable development for our society, being a part of the general effort to reduce theexploitation of natural resources which leads to a continuous degradation of environmental quality.
Taking a look into the history of separate waste collection and recycling, one can notice that,in time, several solutions were used, but only when a lack of resources appeared did the governmentand local authorities take action in order to establish rules for separate waste collection. During WorldWar II, the combatant countries started campaigns by strongly encouraging individuals to collectand recycle materials including paper, cans, metal and even kitchen fat [3]. In the 1970s, peoplebecame more and more aware of the variety of environmental issues, including trash disposal andthe need for recycling and reuse [3]. However, only at the beginning of the 1990s was separate waste
Sustainability 2017, 9, 2064; doi:10.3390/su9112064 www.mdpi.com/journal/sustainability

Sustainability 2017, 9, 2064 2 of 15
collection introduced in legislation, first in Germany, and later in the EU countries [4,5]. In this way,“the product life-cycle could be closed by making the producers responsible for their products fromcradle to grave” [6]. Green, blue, brown, yellow and gray bins became available for separate wastecollection and, within a few years, the reports showed improvements in the quality and the quantityof waste collected for recycling [6,7].
Introducing reverse vending machines (RVM) to the market was the next big step in wastemanagement. In this way, the citizens were motivated to bring back plastic bottles, glass receptaclesand aluminum cans in order to receive in exchange vouchers that could be used in supermarkets.Nowadays, hundreds of thousands of RVMs developed by Tomra, Envipco, RVM Systems, DieboldNixdorf and other RVM producers are used all over the world [8–11]. The latest RVMs containadvanced vision systems able to instantly detect barcodes and security marks (allowing users to insertcontainers rapidly in a continuous flow) and to quickly and accurately distinguish between thousandsof different receptacles [8].
Recently, along with the development and the implementation of smart city technologies andplatforms, new solutions for smart waste collection are being used. The smart waste collectiontechnology sector is still in an early phase, but Smart Bins [12] have now started to be used for wastecollecting. Smart collection bins with ultrasonic sensors attached to them in order to measure theempty space can be located in different areas of the city. A sensor gateway based on long range widearea network (LoRaWAN) protocol and cloud platforms for data collection, analysis and visualizationshould be used [13,14].
Theoretical solutions and preliminary results regarding IoT platforms for waste managementcan be found in the dedicated literature. Zanella and Vangelista present an IoT platform solutionfor a smart city, with a Padova city case study, where the proposed system is supposed to collectinteresting environmental parameters, such as CO level, air temperature and humidity, vibrationsand noise [15]. Zygiaris is presenting a smart city reference model to be used by smart city plannersto define the conceptual layout of a smart city and to describe the smart innovation characteristicsin each one of the six layers [16]. Clement et al. propose a service oriented reference architecturedefining the relationship between the various service oriented architectures (SOAs) from each domainto be integrated [17].
Several papers describe the IoT features and characteristics [18], but only a few of them includeresults. For example, in Romania, a vacuum waste collection system for the historical city centerof Sibiu was developed based on several parameters: waste volume—which is a wide variable becauseof seasonal events; composition of waste; source concentration; current infrastructure; distance fromsources; and the level of public concern [19,20].
In Sweden, for example, the automated vacuum waste collection system is able to collect onlyfour types of waste: general waste, organic waste, recyclable paper and recyclable cardboard [21].This system is not able to collect WEEEs, batteries, light bulbs and fluorescent lamps, large sheetsof cardboard, glass recipients etc. The vacuum system is a very rigid one because the pipes mustto be arranged to guarantee access without digging into other cables and pipes, also described as the“spaghetti effect” [22,23]. Also, changing an existing network is very difficult and costly. Planningand building the network therefore needs to be done at the very first stages of a residential area [22].It is hard to implement this system for an entire large city like Paris, London, Amsterdam etc.
However, a fully automated integrated waste collection system (able to separately collect differenttypes of waste: plastic recipients, glass recipients, aluminum cans, WEEEs, paper, cardboard, batteries,light bulbs and fluorescent lamps etc.) and a smart city platform dedicated for this kind of system wasnot identified by the authors in the specialized literature and in the investigated US and EU patents.
The paper is organized as follows: in chapter two, details about our research project are presentedtogether with the automated waste collection system solution resulted from our project. In chapterthree, the platform solutions for the integration of the automated waste collection system into the

Sustainability 2017, 9, 2064 3 of 15
smart city infrastructure are presented, while chapter four discusses the conclusion of the research andfuture work.
2. Materials and Methods
2.1. The SmartCollect Project
Romania has a level of waste collection well below the EU average and by 2020 should reacha target of 50% regarding the preparation for reuse and recycling of waste. Along with the public’s lowawareness regarding the necessity for selective waste collection, the lack of waste collection systemsrepresents an obstacle in achieving the target. Currently, human operators are still used in separatewaste collecting systems for performing tasks associated with
• Paper and cardboard sorting and weighing. Also, the operators transport the paper or cardboardto the baler, operates the bale press and the resulted bales are stored, etc.;
• Unloading containers of plastic and glass recipients or aluminum cans;• Large and small WEEEs identification, weighing, transport, transfer and storage.
To increase the level of waste collection, it is necessary to obtain a fully automated waste collectingsystem. The separate waste collection solutions currently implemented in Romania are not fullyautomated or ready to be integrated in the smart city infrastructure.
In this context, our research project started in 2016. The main project goals are to modernizeand to automatize the current waste collection system developed in the past by our project partnerand to obtain a fully automated waste collection system (AWCS). The first objective of the projectis to increase the use of the system, improve its productivity and its collected waste storage capacity.The second objective is to integrate the system into the infrastructure of the smart city.
Until now, our research work has included the following:
1. Based on data provided by the company (project partner) and on studies conducted on thecurrent systems, a detailed description was given for each module of the waste collection system.Based on these data, the waste collection system’s modelling and simulations were performedin Witness Horizon in order to achieve the system’s diagnosis. The problems encounteredon each system’s module were presented [24]. The simulation was made for a working weektime frame by defining a function: 60 min × 10 h × 7 days to reflect the 10 h/day and 7 daysper week (including Saturday and Sunday) according to the actual program. The results fromthe simulation showed that a total of 2050 aluminum cans, 1400 glass recipients, 4200 plasticrecipients, 400 kg of cardboard, 200 kg of paper and 26 WEEEs (big or small) are collected [24];
2. Based on the diagnosis results, the changes needed for the system redesign were describedin order to increase the usage degree, the productivity and storage capacity of the waste collectionsystem. The proposals concerning the characteristics and configuration of each module weredescribed to obtain an optimized system version [24];
3. In the conception phase, several systems configurations were proposed and analyzed. UsingWitness Horizon, a new waste flow simulation based on this new system configurations hasbeen made. The simulation was made for 60 min × 24 h × 7 days to reflect the 24 h/7 dayssystem desired availability. In feedback questionnaires, most of the customers said theyprefer a system that is available 24/7. The results showed that 10,821 plastic recipients werecollected, in comparison with 4200 units originally, 5305 aluminum cans were collected in total,in comparison with 2050 initially, 3618 glass recipients were collected, in comparison with1400 units originally, 800 kg of cardboard and 450 kg of paper were collected, 65 WEEEs(big or small) were collected in comparison with 26 originally [24];
4. The new modular system configuration was chosen. The AWCS configuration is presentedin Section 2.2;

Sustainability 2017, 9, 2064 4 of 15
5. The design phase. Each system’s module was designed using CATIA V5;6. Patents were applied for the chosen solutions;7. A waste identification system was developed which includes an electronic weighing scale,
a metal component detection system and a vision system (video camera, neural networkapplication). In Figure 1, the vision system software as a part of the system’s prototypeis presented. The identification is based on machine vision, a convolutive neural networkspecifically trained to recognize electrical and electronic equipment, batteries, light bulbs andfluorescent lamps. The user places the product in the pickup area and clicks the Scan button.After identifying the category, weight and the proposed price are displayed. The user can acceptor cancel the transaction;
8. Equipment for all module prototypes were chosen.
Sustainability 2017, 9, 2064 4 of 16
specifically trained to recognize electrical and electronic equipment, batteries, light bulbs and fluorescent lamps. The user places the product in the pickup area and clicks the Scan button. After identifying the category, weight and the proposed price are displayed. The user can accept or cancel the transaction;
8. Equipment for all module prototypes were chosen.
Figure 1. Part of the system’s prototype (the vision system software interface).
Currently, our research teams in working on plastic & glass receptacles and aluminum cans module prototype; large WEEE module prototype; small WEEE module prototype; and developing the IoT platform in order to integrate the AWCS into the smart city infrastructure.
2.2. Automated Waste Collection System
The automated waste collection system which resulted from our research is able to collect separately different types of waste: plastic receptacles, glass receptacles, aluminum cans, WEEEs, paper, cardboard, batteries, light bulbs and fluorescent lamps etc.
The AWCS contains different modules based on the waste type:
• Small WEEE module; • Large WEEE module; • Plastic & glass recipients and aluminum cans module; • Paper and cardboard module; • Batteries module; • Light bulb and fluorescent lamp module.
Due to modularity, different configurations of the system can be obtained based on location requirements. A configuration of the system (Figure 2) could include one plastic & glass receptacles and aluminum cans module; one paper and cardboard module; one light bulb and fluorescent lamp module; one batteries module; two small WEEE modules; two large WEEE modules.
Figure 1. Part of the system’s prototype (the vision system software interface).
Currently, our research teams in working on plastic & glass receptacles and aluminum cansmodule prototype; large WEEE module prototype; small WEEE module prototype; and developingthe IoT platform in order to integrate the AWCS into the smart city infrastructure.
2.2. Automated Waste Collection System
The automated waste collection system which resulted from our research is able to collectseparately different types of waste: plastic receptacles, glass receptacles, aluminum cans, WEEEs,paper, cardboard, batteries, light bulbs and fluorescent lamps etc.
The AWCS contains different modules based on the waste type:
• Small WEEE module;• Large WEEE module;• Plastic & glass recipients and aluminum cans module;• Paper and cardboard module;• Batteries module;• Light bulb and fluorescent lamp module.
Due to modularity, different configurations of the system can be obtained based on locationrequirements. A configuration of the system (Figure 2) could include one plastic & glass receptaclesand aluminum cans module; one paper and cardboard module; one light bulb and fluorescent lampmodule; one batteries module; two small WEEE modules; two large WEEE modules.

Sustainability 2017, 9, 2064 5 of 15Sustainability 2017, 9, 2064 5 of 16
Figure 2. A configuration for the automated waste collection system.
2.2.1. The Small WEEE Module
This module includes the following:
• Touch screen: This allows clients to select the waste type (phones, PC drives, printers, laptops, video consoles, microwave ovens etc.). The client can confirm the quantity and the amount of money calculated by the system, and the client will receive a voucher that can be used in supermarkets;
• Video recognition system for identifying the waste type; • Weighing equipment; • Smart sensors for waste containers (to know when a container is full), metal detection
(percentage of metal in a product), ultrasonic sensors, proximity sensors, fire sensors etc.; • Conveyor system; • Storage system (including sensors for counting the number of products, product placement
identification etc.).
The waste flow: The client selects the waste type by using the touch screen, the door opens and the client puts the waste on the loading zone. The door closes, and waste identification and weighing is performed. The sensors for metal detection are used to detect the percentage of metal in the product. If the system accepts the waste, the user confirms if he agrees with the voucher value and receives the voucher. The product (waste) is pushed into a container placed on a conveyor. When the container is full (ultrasonic sensors) the conveyer will transport it to the storage system.
2.2.2. The Large WEEE Module
This module includes the following:
Figure 2. A configuration for the automated waste collection system.
2.2.1. The Small WEEE Module
This module includes the following:
• Touch screen: This allows clients to select the waste type (phones, PC drives, printers, laptops,video consoles, microwave ovens etc.). The client can confirm the quantity and the amountof money calculated by the system, and the client will receive a voucher that can be usedin supermarkets;
• Video recognition system for identifying the waste type;• Weighing equipment;• Smart sensors for waste containers (to know when a container is full), metal detection (percentage
of metal in a product), ultrasonic sensors, proximity sensors, fire sensors etc.;• Conveyor system;• Storage system (including sensors for counting the number of products, product placement
identification etc.).
The waste flow: The client selects the waste type by using the touch screen, the door opens andthe client puts the waste on the loading zone. The door closes, and waste identification and weighingis performed. The sensors for metal detection are used to detect the percentage of metal in the product.If the system accepts the waste, the user confirms if he agrees with the voucher value and receives thevoucher. The product (waste) is pushed into a container placed on a conveyor. When the containeris full (ultrasonic sensors) the conveyer will transport it to the storage system.
2.2.2. The Large WEEE Module
This module includes the following:

Sustainability 2017, 9, 2064 6 of 15
• Touch screen: This allows clients to select the waste type (refrigerators, washing machines,TVs etc.). The client can confirm the quantity and the amount of money calculated by the system,and the client receives a voucher that can be used in supermarkets;
• Safety system with doors;• Video recognition system for identifying the waste type;• Weighing equipment;• Smart sensors for counting, product placement identification, proximity sensors, fire sensors etc.;• Conveyor system (the waste is stored directly on the conveyor).
The waste flow: The client selects the waste type by using the touch screen, the door opensand the client puts the waste on the loading zone. The door closes, the waste identification andweighting are made. The sensors for metal detection are used to detect the percent of metal in theproduct. If the system accepts the waste, the client confirms if he agrees with the voucher value andreceives the voucher. The transport and storage are performed on the conveyor. The conveyor worksin accumulation, which means that each object is pushed forward by a new object until the depositarea/conveyor is filled.
2.2.3. The Plastic & Glass Recipients and Aluminum Cans Module
This module includes the following:
• RVM (reverse vending machine): RVM will take, identify and sort the waste;• Conveyor system;• Smart bins (containers).
The waste flow: There are two pieces of RMV equipment which will identify and sort the waste.The conveyor will transport the waste to the dedicated container (cans, plastic, glass). The conveyercontains deviation units to sort the waste to the dedicated container. The ultrasonic sensors will noticewhen a container is full and the conveyer will transport the waste to the next available container.At the end, the client receives the voucher.
2.2.4. The Paper and Cardboard Module
This module includes the following:
• Touch screen;• Weighing equipment;• Smart sensors: humidity sensors, fire sensors etc.;• Baling press;• Conveyor system;• Storage system (where the bales are stored—paper and cardboard separately).
The waste flow: The client introduces the waste using the input slot. The paper and cardboard areweighed and tested for humidity. The client receives the voucher. If the paper or the cardboard is toohumid, it is sent to a different container. The accepted paper and cardboard are sent to the bailingpress. The resulted bale is transported by a conveyor to the storage system.
2.2.5. The Batteries Module
This module includes the following:
• Touch screen;• Video recognition system for identifying the waste type;• System for collecting the wastes in larger containers;• Smart sensors (ultrasonic sensors, sensors for counting the number of products etc.).

Sustainability 2017, 9, 2064 7 of 15
The waste flow: The client introduces the batteries using the input slot. Next, the batteryidentification is performed. The batteries are collected in a large container. When the container is full,the conveyor will transport it to the storage system.
2.2.6. The Light Bulb and Fluorescent Lamp Module
This module includes the following:
• Touch screen;• Video recognition system for identifying the waste type;• System for collecting the wastes in larger containers;• Smart sensors (ultrasonic sensors, sensors for counting the number of products etc.).
The waste flow: The client introduces the waste using the input slot. Next, the waste identificationand sorting are performed. The waste is collected in larger containers. Special containers are usedto avoid breaking the light bulbs or the fluorescent lamps. When a container is full, it will be pushedto the conveyor in order to be transported to the storage system.
3. Results and Discussion
The IT reference architecture for smart cities represents a generic framework for developingapplications that use data transmitted by IoT (Internet of Things) to generate actions or to assistdecisions. Proposed architectures are covered by various authors [25], enlarging IoT usage to assist andmonitor ecological issues [26] or for implementing the Industry 4.0 concept in several industries [27].
Using cloud platforms allows diverse sensors to connect to the service hosted by the cloudplatform, to transmit measured data, and to generate active actions or alarms when the measuredvalues exceed a certain threshold. Moreover, generated data could be further analyzed to properluassess the resources needed or manage processes. A detailed description of IoT platforms availableon the market is given in [28]. In our case study, the platform for the automated waste collectionsystem allows real time monitoring and communication with the central systems by giving detailsabout each module:
• Module status (working, blocked, needs repairs or maintenance etc.);• Status for all equipment;• Storage system status (allows full reports for all waste types);• The amount of waste for each module, allowing optimal discharging;• Full reports for clients, companies and city hall (or other public entities);• Possibility of supporting a mobile application for clients and company;• Client redirection to other systems if current system is full (including distance route etc.);• Route optimization for waste discharging (on city or county level).
3.1. Cloud Services Overview for Azure IoT Suite and Reference Architecture
The virtualization of IT capabilities offers various forms of services. Mainly, startedas an infrastructure as a service form, where the user had access to superior hardware, the cloudproviders further developed solutions for offering access to the customer of preinstalled softwarearchitectures (platform as a service) or for service access (software as a service). The detailed featuresof Microsoft Azure presented in [29] reveal a series of services which can be integrated into an IoTsuite, having as a result a coherent application. Microsoft offers also preconfigured IoT servicesto demonstrate the technology capabilities [30]. The IoT suite for automated waste collection systemis currently under development, and in this paper, design principles and some special issues relatedto the data collection and deliver functionalities according to scope are presented.
Data collected from AWCS is received via Internet by an IoT Hub to ensure the proper securitymeasures. The security of IoT communication still remains an issue, largely debated in [31].

Sustainability 2017, 9, 2064 8 of 15
The advantage of using IoT Hub is that a single point-to-point communication channel could be usedby all AWCS sensors, grouped into a device. Moreover, using twinning function for devices willallow an easier scalability function. The P2P is established using a GSM module through mobilenetwork. After receiving data from AWCS, the content is filtered by stream analytics and, dependingon the subject, is deposited into blobs. By comparing measured data with threshold value, an alarmor action is triggered. By reading data from blobs and integrating the notification flow, PowerBI is used to display relevant information regarding the waste collection process. The results areshown to various types of users, identified using the active directory service, in desktop or mobiledevice versions, or available as web page. The collection reports and other type of resulted documentsare stored into blobs. Using the collecting and discharging of waste data, the forecast of waste collectionand discharging volume are applied using a machine learning module and the resulted data is returnedto blobs for storage. The correspondence between IoT suite functions, Azure services and actionsrequired is given in Table 1.
In Figure 3 the block diagram for chosen reference architecture is presented, with the followingmodules: IoT Hub, stream analytics, Azure storage, event hub, Azure app service, Azure machinelearning and Azure logic apps. For each block, the main functions, files and additional developingresources are depicted.
Sustainability 2017, 9, 2064 8 of 16
all AWCS sensors, grouped into a device. Moreover, using twinning function for devices will allow an easier scalability function. The P2P is established using a GSM module through mobile network. After receiving data from AWCS, the content is filtered by stream analytics and, depending on the subject, is deposited into blobs. By comparing measured data with threshold value, an alarm or action is triggered. By reading data from blobs and integrating the notification flow, Power BI is used to display relevant information regarding the waste collection process. The results are shown to various types of users, identified using the active directory service, in desktop or mobile device versions, or available as web page. The collection reports and other type of resulted documents are stored into blobs. Using the collecting and discharging of waste data, the forecast of waste collection and discharging volume are applied using a machine learning module and the resulted data is returned to blobs for storage. The correspondence between IoT suite functions, Azure services and actions required is given in Table 1.
In Figure 3 the block diagram for chosen reference architecture is presented, with the following modules: IoT Hub, stream analytics, Azure storage, event hub, Azure app service, Azure machine learning and Azure logic apps. For each block, the main functions, files and additional developing resources are depicted.
Figure 3. Proposed Azure Internet of Things (IoT) reference architecture for waste management.
Figure 3. Proposed Azure Internet of Things (IoT) reference architecture for waste management.

Sustainability 2017, 9, 2064 9 of 15
Table 1. Correspondence between proposed automated waste collection system (AWCS) platformfeatures, Azure services and actions required.
Feature Full Description Action Required
F1 Module statusThe platform signalizes by alarming thestatus change of AWCS modules
A1 Post alarm in notification areaA2 Send email to maintenance teamA3 Point on repair action map the AWCS with statuschange descriptionA4 Modify module status into AWCS diagram
F2 Status for all equipment The platform signalizes by alarming theoverall status change of AWCS
A5 Post alarm into notification area (working, full,needs repair or maintenance)A6 Point on discharge action map the AWCS withwaste type descriptionA7 Modify AWCS overall status into AWCS diagram
F3 Storage systems status
Data transmitted by weight and countersensors are received through IoT Hub,aggregated with stream analytics anddisplayed in Power BI
A8 Post alarm in notification area when the valueexceeds the thresholdA9 Send email to collection area managerA10 Point on collection map the module withexceeded thresholdA11 Read and display value in AWCS diagram foreach module
F4 Full reports for clients,companies and city hall
Data deposited in blobs queried withstream analytics, using Azure activedirectory for ID and displayed usingPower BI integrating Bing Maps.Forecast waste volume usingmachine learning
A12 Client report notification and voucher releaseA13 Collection report notification anddischarge reportA14 Reset AWCS module values after collectionA15 Deposit collection report data for further usageA16 Forecasting waste volume
F5 Supports a mobileapplication for clientsand company
Data displayed through web page usingPower BI enhanced by auto adjust toscreen display resolution
A17 Auto adjust content to screen resolution
F6 Clients redirection toother systems if currentsystem is full
AWCS position is detected, queryingproximity available AWCS anddisplaying alternative options
A18 Read current position from AWCS identificationA19 Select available AWCS for selected waste typeA20 Display alternative AWCS positionA21 Share coordinates and direction to client forselected AWCS
F7 Route optimization forwaste discharging
Reading coordinates for selected AWCShaving full status are depending onwaste type and optimize the route
A22 Select AWCS with full statusA23 Read weight and countA24 Calculate optimized routeA25 Display and share route to collection manager
3.2. Data Collection and Azure IoT Hub
The Azure IoT Hub allows data collection from a wide range of sensors connected to variousdevices [32], assuring a two-way communication between cloud applications and registered devices.The device lifecycle in Azure IoT Hub contains five stages:
• Planning: where the cloud application operator defines and creates the metadata scheme. Later,it will be used for querying relevant data and grouping devices by using a twin device. The deviceproperties are stored into Cosmos DB database;
• Provisioning: discovering relevant device options and achieving scalable operations using a bulktechnique for device identities and credentials;
• Configuring: managing device changes using already provisioned bulk properties, to updateit to current state;
• Monitoring: the status of running operations and health of devices are continuously checkedby the service and anomalies are reported as notifications that further could be displayed usingAzure app service;
• Retiring: the device is replaced or decommissioned at the end of lifecycle.
In the AWCS case, data received into IoT Hub are presented into an endpoint and furtherused using stream analytics. The metadata scheme is stored in Cosmos DB, containing relevantinformation regarding the device. From this application perspective, the geographical coordinated

Sustainability 2017, 9, 2064 10 of 15
and telemetry properties are listed and could be modified according to scope. The telemetry invokedfor the application purpose is the weight and number of items deposited into waste compartmentdescribed above. The frequency of sending data by sensors is not yet established—after equipmentfull deployment and a series of tests a decision will be made—and sending internal images of AWCSremains an issue to be discussed with the AWCS beneficiary. For the provisioned flow of IoT Suite,the frequency is set to 5 min, being temporarily stored by the IoT Hub for up to seven days, beingavailable for all protocols. If additional images are required to be sent, data are stored in the Azurestorage account, with a frequency being lower in this case because of IoT Hub limitations [33].
From an AWCS point of view, each waste compartment has several sensors, some of whichwill be used to monitor the current operational status of equipment and others to monitor and alertwaste collection level using notifications, monitoring the weight or number of waste items collectedto be discharged by discharge operators. All AWCS sensors will be connected to a single board whichhenceforth will be called the device. Currently under development, the AWCS’ complete list of sensorswill be further updated. From the first category, power off, conveyor jammed, fire detectors, proximitysensors, and the identification of the percentage of metals are mentioned. In the case of waste collectionmonitoring, when the collection level exceeds a threshold of 80% of the total, taking into considerationweight and/or number, an alarm is set off to signal the discharge readiness status. Each type of wasteshould be discharged separately by different discharging teams.
However, in the case of IoT Hub and connected Azure, the following services are critical:
• Managing devices;• Managing messages;• Store IoT messages;• Visualize sensors data;• Collection and discharging forecast.
3.3. Stream Analytics and Azure Storage
The data stream concept, used to manipulate data inside of IoT reference architecture, supposesthat the records do not have a specific format, because data content depends on type of sensorsused, representing data flow through application. As types of data presented to IoT Hub which willbe further sorted and aggregated using stream analytics, the following can be foreseen:
• Telemetry: indicating values from selected sensors; in the AWCS case, weight and numberof collected waste items;
• State, notifications and actions: for each AWCS compartment, several sensors are provisioned andlack of flow could indicate the change of status health;
• Time stamps: for each record, a time stamp is added when it is presented to IoT Hub, being usedfor further processing into the system;
• Device metadata: when a device firmware is updated or device is replaced, the metadatacontaining the main features parameters is send to be recorded into Cosmos DB, associatedto device parameters and functions.
Regarding the endpoint for stream analytics, the data flow could be routed to storage, in relationalor non-relational form, blobs being often used in Event Hub in the case of notifications or alerts andin Azure app service for the instant visualization of telemetry transmitted from devices. Furthermore,stream analytics might route the dataflow as follows:
• Unaltered: when the records from dataflow are routed, for instance, to be stored into a blob,the stream using the endpoint of IoT Hub as source and a blob as output, having a single inputand a single output;
• Telemetry transformation: when data presented by sensors is in a different measurement systemand it is transformed for further storage or visualization;

Sustainability 2017, 9, 2064 11 of 15
• Statistics over time series: calculating various statistics parameters (e.g., minimum, maximum,average value) in a time frame, using tumbling and hopping window techniques fordata sampling;
• Notifications and alerts: filtering only values that exceed the threshold, an action being foreseenin case of alerts, by the back-end application, using twinning a single threshold is defined for alldevices for a certain telemetry;
• Peer-device telemetry: dataflow is routed to multiple storage, using device ID for filtering inputstream, having in that way an easier access to device telemetry history.
Analyzing Table 1 and keeping in mind the similar solution developed by Microsoft [30], severalstreams are proposed, with some changes over the preconfigured solution:
• Device info: where only the messages regarding device information that could be displayedin late queries are filtered from the stream; this kind of message being sent by the device at firststart or by system request, the input is data stream and output event hub;
• Threshold and notifications: values of thresholds that generate a notification might be determinedeither by direct coding or to have as separate entries to a table. The monitored parameters foreach device, in the AWCS case weight and count for each waste compartment type, is comparedto threshold value and a notification is generated that is pushed to the event hub. For weighttwo such thresholds are foreseen, one for 80% of total weight, when the system only displays thisnotification into AWCS dashboard, and one for 95% of total weight, the AWCS being displayedto discharge the map, and signalize dispatch manager for imminent discharging by e-mail. In thiscase, the input is given by IoT Hub endpoint stream and output is the event hub. Blob storage forall notifications and blob for status report;
• Device status: for the operational point of view, the foreseen sensors to identify AWCS malfunctionstatus (e.g., jammed, black out, fire detector) are separately filtered from the stream; in this case,changing values over the last record or exceeding a threshold will generate an immediate action,operated by back-end application, pointing out, on the maintenance map, the AWCS, sendingmessages to the maintenance team, delivering details about status change. However, the inputis the same the IoT Hub stream and output; first the event hub and second, a dedicated blob,for status report;
• Telemetry: presented in Figure 4, for each compartment, values obtained for weight and countwill be stored into separate blobs, for further usage of data in the web app and discharge forecast.In this stream, various additional data could be summarized which result from direct usageof filtered data: daily weight of waste, daily average waste weight by type, last discharge, percentof total weight etc. As input is considered the IoT Hub stream having multiple output, blob forraw telemetry, daily collected weight by waste type and discharging reports by type.
Sustainability 2017, 9, 2064 12 of 16
of total weight etc. As input is considered the IoT Hub stream having multiple output, blob for raw telemetry, daily collected weight by waste type and discharging reports by type.
Figure 4. Job diagram for device telemetry stream.
3.4. Event Hub and Web Application
The event hub is used to forward the stream data from the device into stream analytics to update existent Cosmos DB and to actualize the content for rules (threshold, notification and actions). The event processor reads messages from the event hub and post its into web page by web job. The retention of messages into the event hub is limited by default to 24 h, for the standard pricing tier [34] (84 GB of event storage), up to 1 MB/s incoming messages and 2 MB/s outgoing messages consumed by an external app. The event hub has also the possibility of capturing events for a greater retention period using the Azure storage blob account. The incoming events in AWCS case are represented by setting new devices and the definition of new rules or changing rules, so it is not expected to reach the basic tier limits. The consumers in the current situation are given by Cosmos DB device info and rules. The content of captured notifications is stored into the consumers’ directory together with the last version of the device info and rules table.
The web application service allows the delivery of the content of a web page for desktop and mobile. The Azure platform offers three other similar services for web service deployment: Cloud services, virtual machines and service fabric. Complex web services using various architectures, such as microservices, could be deployed in the web application service [35]. From an AWCS deployment point of view, regarding the functions defined in Table 1, the next sections of web content would be as follows:
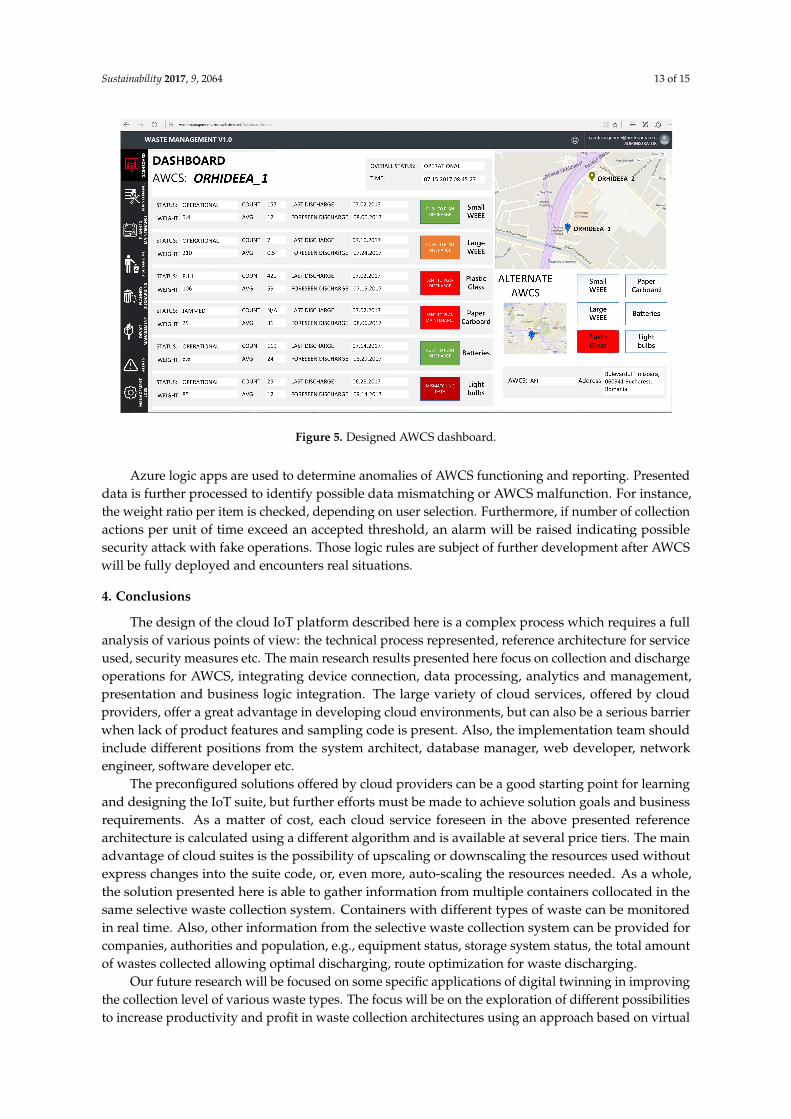
• Device dashboard: shown in Figure 5, with map position, overall status, compartment status, weight and count for each department, discharging alerts, last seven days’ average collected waste by type, push on discharge map by type, alternative AWCS position when status is full;
• Maintenance: with devices list, device location on map, type of alert, number of incidents, last seven days’ number of incidents, push to planned maintenance map;
• Planned maintenance:, where planned maintenance action is revealed, pointing on map position of planned AWCS for maintenance, assigning maintenance team and time slot, push to maintenance team to do list;
• Discharging: AWCS list by type having full status, last discharge time stamp, map with pointed AWCS, total waste weight by type, number of AWCS with full status, display forecasted waste weights and discharging remaining time, display last seven days’ total average collected waste weight by type, push AWCS to planned discharging map;
• Planned discharging: a list of AWCS planned for discharging by waste type, pointing on map planned AWCS, weight and count for waste discharging, multiple selection of AWCS resulting total weight value, assigning discharging team and time slot, checking if total weight exceeds the discharging capacity, push AWCS list to discharging team to do list, optimize discharging route, send route to discharging team using Bing Map;
• Device management, device list and status, twinning option, available metadata, job scheduler; • Thresholds, alerts and actions, for each compartment telemetry values are set for alarms and
actions (e.g., send email, point on map); • Management jobs, updating software, checking status.
Figure 4. Job diagram for device telemetry stream.
3.4. Event Hub and Web Application
The event hub is used to forward the stream data from the device into stream analytics to updateexistent Cosmos DB and to actualize the content for rules (threshold, notification and actions).The event processor reads messages from the event hub and post its into web page by web job.The retention of messages into the event hub is limited by default to 24 h, for the standard pricing

Sustainability 2017, 9, 2064 12 of 15
tier [34] (84 GB of event storage), up to 1 MB/s incoming messages and 2 MB/s outgoing messagesconsumed by an external app. The event hub has also the possibility of capturing events for a greaterretention period using the Azure storage blob account. The incoming events in AWCS case arerepresented by setting new devices and the definition of new rules or changing rules, so it is notexpected to reach the basic tier limits. The consumers in the current situation are given by CosmosDB device info and rules. The content of captured notifications is stored into the consumers’ directorytogether with the last version of the device info and rules table.
The web application service allows the delivery of the content of a web page for desktop andmobile. The Azure platform offers three other similar services for web service deployment: Cloudservices, virtual machines and service fabric. Complex web services using various architectures,such as microservices, could be deployed in the web application service [35]. From an AWCSdeployment point of view, regarding the functions defined in Table 1, the next sections of webcontent would be as follows:
• Device dashboard: shown in Figure 5, with map position, overall status, compartment status,weight and count for each department, discharging alerts, last seven days’ average collectedwaste by type, push on discharge map by type, alternative AWCS position when status is full;
• Maintenance: with devices list, device location on map, type of alert, number of incidents,last seven days’ number of incidents, push to planned maintenance map;
• Planned maintenance:, where planned maintenance action is revealed, pointing on mapposition of planned AWCS for maintenance, assigning maintenance team and time slot,push to maintenance team to do list;
• Discharging: AWCS list by type having full status, last discharge time stamp, map with pointedAWCS, total waste weight by type, number of AWCS with full status, display forecasted wasteweights and discharging remaining time, display last seven days’ total average collected wasteweight by type, push AWCS to planned discharging map;
• Planned discharging: a list of AWCS planned for discharging by waste type, pointing on mapplanned AWCS, weight and count for waste discharging, multiple selection of AWCS resultingtotal weight value, assigning discharging team and time slot, checking if total weight exceeds thedischarging capacity, push AWCS list to discharging team to do list, optimize discharging route,send route to discharging team using Bing Map;
• Device management, device list and status, twinning option, available metadata, job scheduler;• Thresholds, alerts and actions, for each compartment telemetry values are set for alarms and
actions (e.g., send email, point on map);• Management jobs, updating software, checking status.
3.5. Forecasting Waste Discharging with Machine Learning and Logic Apps
In the AWCS prototype, the waste forecasting is not yet fully deployed because of missinghistorical data about waste collection and discharging. However, the prediction of a discharging dateis made using the last seven days’ average and considering available collecting weight or countat disposal for each waste type. After sufficient data storage into designated blobs into Azurestorage regarding the daily average collected weight, more elaborated prediction algorithms couldbe applied [36] for a long-term prediction of collected waste weight or discharging planned data.Moreover, sophisticated reports will be available by using time-series prediction.
As a process, Azure machine learning reads values stored into a designated blob, applies sorting,filtering and check data consistency. The reference data is computed using prediction algorithm andforeseen data are obtained. As programming languages for prediction algorithms, R and Pythoncould be used. The result is saved into forecast data blob and further used by the Azure app serviceto be displayed into device dashboard or other reports.
Sustainability 2017, 9, 2064 13 of 15
Sustainability 2017, 9, 2064 13 of 16
Figure 5. Designed AWCS dashboard.
3.5. Forecasting Waste Discharging with Machine Learning and Logic Apps
In the AWCS prototype, the waste forecasting is not yet fully deployed because of missing historical data about waste collection and discharging. However, the prediction of a discharging date is made using the last seven days’ average and considering available collecting weight or count at disposal for each waste type. After sufficient data storage into designated blobs into Azure storage regarding the daily average collected weight, more elaborated prediction algorithms could be applied [36] for a long-term prediction of collected waste weight or discharging planned data. Moreover, sophisticated reports will be available by using time-series prediction.
As a process, Azure machine learning reads values stored into a designated blob, applies sorting, filtering and check data consistency. The reference data is computed using prediction algorithm and foreseen data are obtained. As programming languages for prediction algorithms, R and Python could be used. The result is saved into forecast data blob and further used by the Azure app service to be displayed into device dashboard or other reports.
Azure logic apps are used to determine anomalies of AWCS functioning and reporting. Presented data is further processed to identify possible data mismatching or AWCS malfunction. For instance, the weight ratio per item is checked, depending on user selection. Furthermore, if number of collection actions per unit of time exceed an accepted threshold, an alarm will be raised indicating possible security attack with fake operations. Those logic rules are subject of further development after AWCS will be fully deployed and encounters real situations.
4. Conclusions
The design of the cloud IoT platform described here is a complex process which requires a full analysis of various points of view: the technical process represented, reference architecture for service used, security measures etc. The main research results presented here focus on collection and discharge operations for AWCS, integrating device connection, data processing, analytics and management, presentation and business logic integration. The large variety of cloud services, offered by cloud providers, offer a great advantage in developing cloud environments, but can also be a serious barrier when lack of product features and sampling code is present. Also, the implementation team should include different positions from the system architect, database manager, web developer, network engineer, software developer etc.
The preconfigured solutions offered by cloud providers can be a good starting point for learning and designing the IoT suite, but further efforts must be made to achieve solution goals and business requirements. As a matter of cost, each cloud service foreseen in the above presented reference
Figure 5. Designed AWCS dashboard.
Azure logic apps are used to determine anomalies of AWCS functioning and reporting. Presenteddata is further processed to identify possible data mismatching or AWCS malfunction. For instance,the weight ratio per item is checked, depending on user selection. Furthermore, if number of collectionactions per unit of time exceed an accepted threshold, an alarm will be raised indicating possiblesecurity attack with fake operations. Those logic rules are subject of further development after AWCSwill be fully deployed and encounters real situations.
4. Conclusions
The design of the cloud IoT platform described here is a complex process which requires a fullanalysis of various points of view: the technical process represented, reference architecture for serviceused, security measures etc. The main research results presented here focus on collection and dischargeoperations for AWCS, integrating device connection, data processing, analytics and management,presentation and business logic integration. The large variety of cloud services, offered by cloudproviders, offer a great advantage in developing cloud environments, but can also be a serious barrierwhen lack of product features and sampling code is present. Also, the implementation team shouldinclude different positions from the system architect, database manager, web developer, networkengineer, software developer etc.
The preconfigured solutions offered by cloud providers can be a good starting point for learningand designing the IoT suite, but further efforts must be made to achieve solution goals and businessrequirements. As a matter of cost, each cloud service foreseen in the above presented referencearchitecture is calculated using a different algorithm and is available at several price tiers. The mainadvantage of cloud suites is the possibility of upscaling or downscaling the resources used withoutexpress changes into the suite code, or, even more, auto-scaling the resources needed. As a whole,the solution presented here is able to gather information from multiple containers collocated in thesame selective waste collection system. Containers with different types of waste can be monitoredin real time. Also, other information from the selective waste collection system can be provided forcompanies, authorities and population, e.g., equipment status, storage system status, the total amountof wastes collected allowing optimal discharging, route optimization for waste discharging.
Our future research will be focused on some specific applications of digital twinning in improvingthe collection level of various waste types. The focus will be on the exploration of different possibilitiesto increase productivity and profit in waste collection architectures using an approach based on virtual

Sustainability 2017, 9, 2064 14 of 15
modelling and simulation. The proposed main topics of this further research are the characteristicsof digital twinning in diffused and concentrated waste collection architectures, virtual modelling of thewaste collection architecture structural elements, digital twinning simulation algorithms, and diagnosisand optimization for waste collection architectures in a smart city environment using digital twinning.The digital twin of the waste collection or processing architecture will become a part of the wastecollection system design. This digital twinning will provide a diagnose of the system performancesin different waste collection scenarios.
Acknowledgments: This work was supported by a grant of the Romanian National Authority for ScientificResearch and Innovation, CNCS/CCCDI—UEFISCDI, project number PN-III-P2-2.1-BG-2016-0437, withinPNCDI III.
Author Contributions: This paper represents a result of teamwork. Cicerone Laurentiu Popa, George Carutasuand Costel Emil Cotet conceived the idea and carried out the literature review. Cicerone Laurentiu Popa,Costel Emil Cotet and Tiberiu Dobrescu wrote Section 2. Section 3 was written by George Carutasu in closeassociation with Nicoleta Luminita Carutasu, Cicerone Laurentiu Popa and Costel Emil Cotet.
Conflicts of Interest: The authors declare no conflict of interest.
References
1. The 2008/98/CE Directive of the European Parliament and of the Council from 19 November 2008 RegardingWaste and the Abrogation of Certain Directives. Available online: http://eur-lex.europa.eu/legal-content/EN/TXT/?uri=celex%3A32008L0098 (accessed on 19 July 2017).
2. Guo, X.; Zhang, Y.; Xu, K. Metallurgical recovery of metals from Waste Electrical and Electronic Equipment(WEEE) in PRC. In Metal Sustenability—Global Challenges, Consequnces and Prospects; John Wiley & Sons:Chichester, UK, 2016.
3. Goodyear, S. A Brief History of Household Recycling. Available online: https://www.citylab.com/city-makers-connections/recycling/ (accessed on 19 July 2017).
4. Government of Germany. Ordinance on the Avoidance of Packaging Waste; Federal Ministry for the Environment,Nature Conservation and Nuclear Safety: Bonn, Germany, 1991.
5. European Commission DGXI.E.3. European Packaging Waste Management Systems—Main Report2001. Available online: http://ec.europa.eu/environment/waste/studies/packaging/epwms.pdf (accessedon 20 July 2017).
6. Michaelis, P. Product Stewardship, Waste Minimization and Economic Efficiency: Lessons from Germany.J. Environ. Plan. Manag. 1995, 38, 231–243. [CrossRef]
7. Sedee, C.; Jantzen, J.; de Haan, B.J.; Pearce, D.W.; Howarth, A. Technical Report on Waste Management.Available online: http://ec.europa.eu/environment/enveco/priority_study/pdf/waste.pdf (accessedon 20 July 2017).
8. Tomra. Tomra Reverse Vending Technology. Available online: https://www.tomra.com/en/solutions-and-products/collection-solutions/reverse-vending/tomra-technology/ (accessed on 20 July 2017).
9. Envipco. Reverse Vending Machine. Available online: https://www.envipco.com/recovery-solutions/reverse-vending.php (accessed on 20 July 2017).
10. RVM Systems. Available online: http://www.rvmsystems.com/sollutions/ (accessed on 20 July 2017).11. Diebold Nixdorf. Reverse Vending Systems. Available online: http://www.wincor-nixdorf.com/internet/
site_PT/EN/Products/Hardware/Retail/ReverseVendfing/Node.html (accessed on 20 July 2017).12. Smart Bins Solutions. Available online: https://www.smartbin.com/ (accessed on 20 July 2017).13. Lundin, A.C.; Ozkil, A.G.; Jensen, J.S. Smart Cities: A Case Study in Waste Monitoring and Management.
In Proceedings of the 50th Hawaii International Conference on System Sciences, Waikoloa, HI, USA,4–7 January 2017; pp. 1392–1401.
14. Anagnostopoulos, T.; Kolomvatsos, K.; Anagnostopoulos, C.; Zaslavsky, A.; Hadjiefthymiades, S. Assessingdynamic models for high priority waste collection in smart cities. J. Syst. Softw. 2015, 110, 178–192. [CrossRef]
15. Zanella, A.; Bui, N.; Castellani, A.; Vangelista, L.; Zorzi, M. Internet of things for smart cities. IEEE IntrenetThing J. 2014, 1, 22–32. [CrossRef]
16. Zygiaris, S. Smart city reference model: Assisting planners to conceptualize the building of smart cityinnovation ecosystems. J. Knowl. Econ. 2013, 4, 217–231. [CrossRef]
http://www.wincor-nixdorf.com/internet/site_PT/EN/Products/Hardware/Retail/ReverseVendfing/Node.html

Sustainability 2017, 9, 2064 15 of 15
17. Clement, S.J.; McKee, D.W.; Xu, J. Service-Oriented Reference Architecture for Smart Cities. In Proceedingsof the 2017 IEEE Symposium on Service-Oriented System Engineering (SOSE 2017), San Francisco, CA, USA,6–9 April 2017; pp. 81–85.
18. Arasteh, H.; Hosseinnezhad, V.; Loia, V.; Tommasetti, A.; Troisi, O.; Shafie-khah, M.; Siano, P. IoT-basedSmart Cities: A Survey. In Proceedings of the 16th IEEE International Conference on Environment andElectrical Engineering (IEEE—EEEIC’16), Florence, Italy, 6–8 June 2016; pp. 1–6.
19. Ciudin, R.; Isarie, C.; Cioca, L.; Petrescu, V.; Nederita, V.; Ranieri, E. Vacuum waste collection system foran historical city centre. UPB Sci. Bull. 2014, 76, 215–222.
20. Rada, E.C.; Grigortu, M.; Ragazzi, M.; Fedrizzi, P. Web Oriented Technologies and Equipment for MSWCollection. In Proceedings of the International Conference on Risk Management, Assessment and Mitigation(RIMA ’10), Bucharest, Romania, 20–22 April 2010; pp. 150–153.
21. MariMatic. Automated Solid Waste Collection System. Available online: http://www.metrotaifun.com/automatic_solid_waste_collection_system/ (accessed on 1 November 2017).
22. Larsson, V. Procurement of the Vacuum Waste Collection Systems. The Cases of Hammarby Sjöstad and StockholmRoyal Seaport; Stockholm University: Stockholm, Sweden, 2013.
23. Nakou, D.; Benardos, A.; Kaliampakos, D. Assessing the financial and environmental performanceof underground automated vacuum waste collection systems. Tunn. Undergr. Space Technol. 2014, 41,263–271. [CrossRef]
24. Popa, C.L.; Cotet, C.E. Virtual Model in Monitoring and Optimization of a Selective Waste CollectionIntegrated System. In Proceedings of the 5th International Conference on Advanced ManufacturingEngineering and Technologies—NEWTECH 2017, Belgrade, Serbia, 5–7 June 2017; pp. 41–55.
25. Jalali, R.; El-khatib, K.; McGregor, C. Smart City Architecture for Community Level Services through theInternet of Things. In Proceedings of the 18th International Conference on Intelligence in Next GenerationNetworks, Paris, France, 17–19 February 2015; pp. 108–113.
26. Zhu, N.; Zhao, H. IoT applications in the ecological industry chain from information security and smart cityperspectives. Comput. Electr. Eng. 2017. [CrossRef]
27. Shrouf, F.; Ordieres, J.; Miragliotta, G. Smart Factories in Industry 4.0: A Review of the Concept andof Energy Management Approached in Production Based on the Internet of Things Paradigm. In Proceedingsof the 2014 IEEE International Conference on Industrial Engineering and Engineering Management,Bandar Sunway, Malaysia, 9–12 December 2014; pp. 697–701.
28. Ray, P.P. A survey of IoT cloud platforms. Future Comput. Inform. J. 2016, 1, 35–46. [CrossRef]29. Carutasu, G.; Botezatu, M.A.; Botezatu, C.; Pirnau, M. Cloud Computing and Windows Azure.
In Proceedings of the 8th International Conference on Electronics, Computers and Artificial Intelligence(ECAI), Ploiesti, Romania, 30 June–2 July 2016; pp. 1–6.
30. Azure IoT Preconfigured Solutions. Microsoft Docs. Available online: https://docs.microsoft.com/en-us/azure/iot-suite/iot-suite-what-are-preconfigured-solutions (accessed on 23 July 2017).
31. Mathur, A.; Newe, T.; Elgenaidi, W.; Rao, M.; Dooly, G.; Toal, D. A secure end-to-end IoT solution.Sens. Actuators A Phys. 2017, 263, 291–299. [CrossRef]
32. Microsoft Azure IoT Device Catalog. Available online: https://catalog.azureiotsuite.com/ (accessedon 27 July 2017).
33. Azure IoT Hub Documentation—Tutorials. API Reference. Microsoft Docs. Available online: https://docs.microsoft.com/en-us/azure/iot-hub/ (accessed on 28 July 2017).
34. Azure Event Hubs FAQ. Microsoft Docs. Available online: https://docs.microsoft.com/en-us/azure/event-hubs/event-hubs-faq (accessed on 31 July 2017).
35. Familiar, B. IoT and Microservices. In Microservices, IoT, and Azure; Apress: Berkeley, CA, USA, 2015;pp. 133–163.
36. Lungu, I.; Bara, A.; Carutasu, G.; Pirjan, A.; Oprea, S.V. Prediction intelligent system in the field of renewableenergies through neural networks. Econ. Comput. Econ. Cybern. Stud. Res. 2016, 2016, 85–102.
© 2017 by the authors. Licensee MDPI, Basel, Switzerland. This article is an open accessarticle distributed under the terms and conditions of the Creative Commons Attribution(CC BY) license (http://creativecommons.org/licenses/by/4.0/).