Skill building: Determining priorities and decision making: Using the best evidence and mindful...
21
Skill building: Determining priorities and decision making: Using the best evidence and mindful community process Sharon McDonnell MD MPH
-
date post
21-Dec-2015 -
Category
Documents
-
view
218 -
download
0
Transcript of Skill building: Determining priorities and decision making: Using the best evidence and mindful...

Skill building: Determining priorities and decision making:
Using the best evidence and mindful community process
Sharon McDonnell MD MPH

Objectives
• Discuss issues- what = success in the process of decision-making in short and long term?
• Review processes and programs set up to facilitate community prioritization such as MAPP, APEX, Assessment initiative.
• Evidence based epidemiological approach using PAR analysis– What is PAR, how calculated, data
needed?– Comparing different problems and
approaches to decide “best” decision

Decision-making and priority setting
• Discuss issues- what = success in the process of decision-making in short and long term?

Decision-making and priority setting
• Formal processes and programs designed to facilitate community prioritization:– MAPP - includes a data collection and comparison process– APEX, – Assessment initiative. – Other myriad methods emphasizing one or more of following
elements
– Community participation & Process– Political support and engagement of institutions– Evidence-based– Outcomes – Sustainability

Priority setting
• Emphasizing different weights of “so what test” – Magnitude– Severity– feasibility– Acceptability– Political support– Economics/cost– others

Evidence based Public healthPopulation attributable risk (PAR)
• To improve evidence for magnitude and effect
• To improve evidence about effectiveness

Population Attributable Risk
Pe (relative Riska – 1)--------------------------1 + Pe (relative Riska – 1)
Where Pe = proportion of the population that is exposedRelative Riska = the Relative Risk of the specific condition
If we ask ourselves what proportion of disease in the population is a result of a specific exposure or risk?

Risk Factor RR Prevalence PAR
High blood pressure 2-4 42% of population in US 25 (20-29)
Cigarette smoking 15 20% in US (**) 22 (17-25)
High cholesterol 2-4 28% US (**) 43 (39-47)
Diabetes (fasting glucose (140 mg/dL)
2-4 6.4% in US (**) 8 (1-15)
Obesity <2 31% of population (**) 17 (7-32)
Physical inactivity <2 35 (23-46)
Environmental tobacco smoke <2 18 (8-23)
Poor Social Support 1.5 or 2.42
High Perceived mental Stress (Japanese women)
2.28 (1.17–4.43)
Adjusted risk factors. 20% (n=43,244) had high stress
17
Anxiety 3.77 (1.64-8.64)
Dose response
Inadequate health literacy elderly 1.56 25% of Medicare enrollees
Anger 2.66 (1.26-5.6)
Dose response with hostility
Population Attributable Risk for death from CVD selected cardiovascular Risk Factors

Risk Factor RR Prevalence PAR
Poor self-rated and objectively measured health,
2.0? See BRFSS
Social class 1.5 1/2 of study insofar as either manual or non-manual Similar results were obtained
for all-cause mortality.
22% or 14.5 if adjust for CR factors (but watch out)
Depression Multiplier effect of all other risk factors
Social networks 2.1 Syme and Berkman
Poor Social Support 1.5 or 2.42
Cat ownership 30-40% reduced risk of all CVD
Study among 4000 US over 10 years ? Is it owning the cat or the type of people what own cats? Does not extend to dogs
17
Low socioeconomic status a.6903 first stroke events registered by the FINMONICA Stroke Register in 3 areas of Finland during 1983 to 1992
For the death it was 56% for both sexes.
36% 1st stroke for both sexes. from first ischemic stroke,
Population Attributable Risk II for death from CVD selected cardiovascular Risk Factors


• Inadequate social connection or social isolation increases all cause mortality (2-2.8 times)
• Inadequate health literacy increases all cause mortality nearly twofold.
• ADD in Alameda tables and syme re various data sets on social isolation
• How social isolation defined

• Smoking and lung cancer slide with determinants
• Terms- determinant, risk, influencing factor etc
• Culture - how to measure and watch?• Make a commercial targeted to ill health• The opposite of a risk factor is not a
health factor

Risk factor Measure of Risk (RR or OR)
% population exposed
Estimated PAR
Intervention Efficacy of Intervention
See word file table for preferred table
Thacker paper
Community guide

QuickTime™ and a decompressor
are needed to see this picture.

Efficacy and effectiveness
• Efficacy –refers to the impact of an intervention in a clinical trial, differing from 'effectiveness' which – Immunization in the laboratory or clinical trial
• Effectiveness – refers to the impact in real world situations.– immunization in real world

Influences on Efficacy
• Efficacy:
– Inherent to drug/intervention
– Interacting with human(s)
– In a context

Influences on effectiveness
• Effectiveness:– Human resources and training
• Recruitment, qualifications, didactic and applied training, continuing education
– Infrastructure• Supplies and equipment, salary, transportation, supervision
– Community support• Access and demand

Population35 y/o men
(20 yrs)
exercise
No exercise
Death from CHD (p = 0.06)
Death from CHD (p = 0.03)
Good Health (p=0.87)
Good Health (p = 0.74)
Infarction or other CHD (p= 0.09)
Infarction or other CHD (p = 0.12)
Hyptothetical population used to apply probabilities of various events
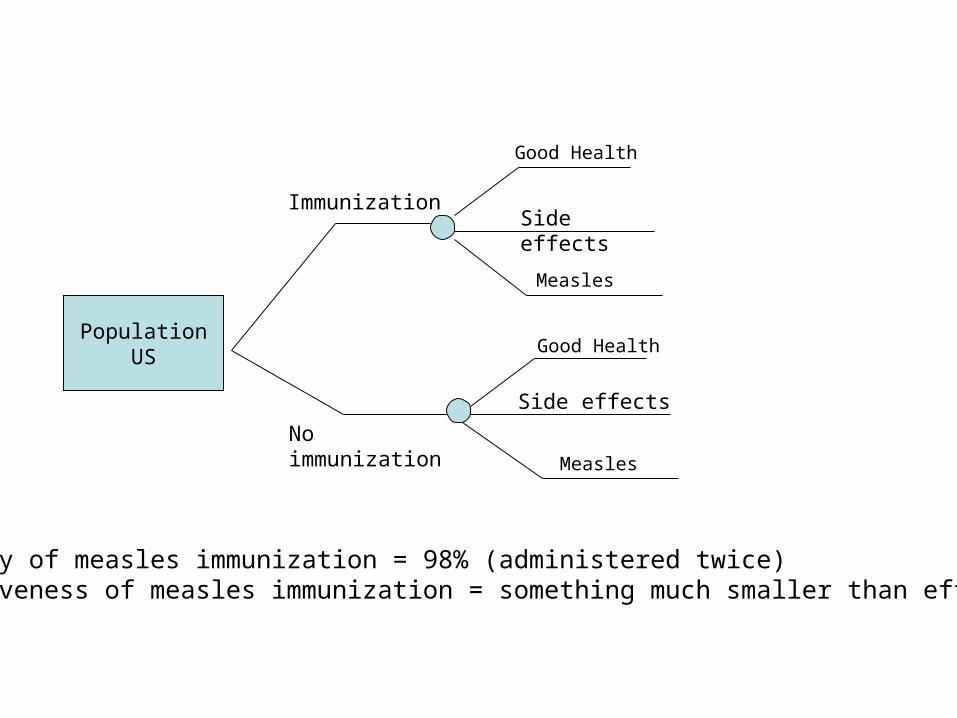
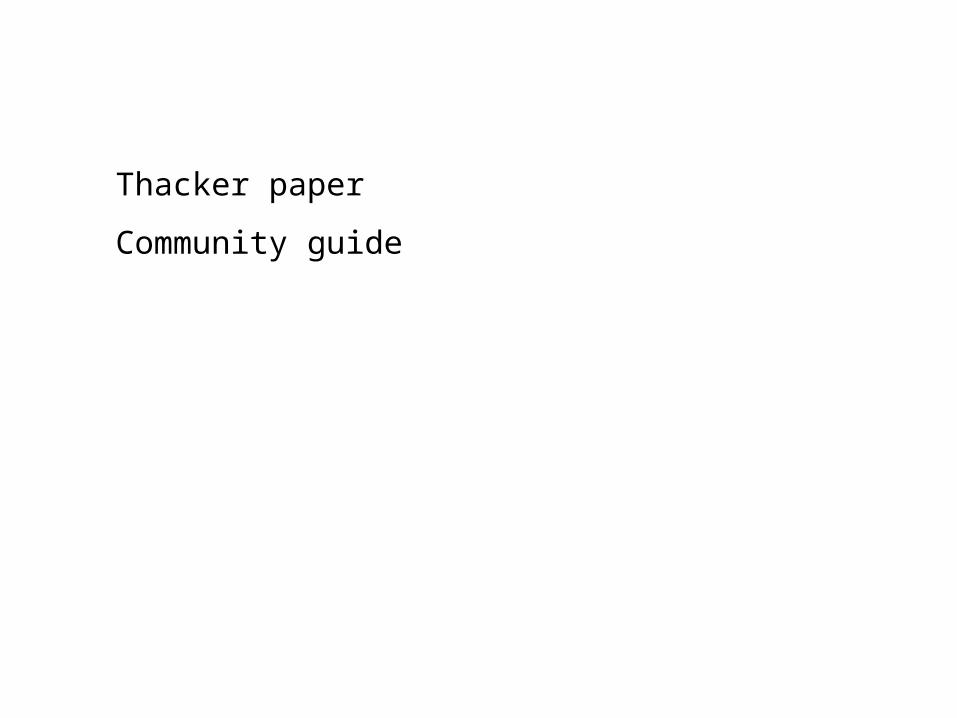
PopulationUS
Immunization
No immunizationMeasles
Measles
Good Health
Good Health
Side effects
Side effects
Efficacy of measles immunization = 98% (administered twice)Effectiveness of measles immunization = something much smaller than efficacy