Simply Measured Q3 2014 Instagram...
15
Simply Measured Q3 2014 Instagram Study
Transcript of Simply Measured Q3 2014 Instagram...
Simply Measured Q3 2014 Instagram Study

Simply Measured Q3 2014 Instagram Study 2
Introduction Instagram is one of the fastest growing social networks in history. The mobile photo-sharing app, which launched in October of 2010, now boasts 200 million monthly active users, 60 million photos posted each day, and 1.6 billion likes per day.
This incredible growth has shaken up the way social marketers think about visual content and marketing to mobile audiences. Today, 86% of top brands have Instagram accounts, up from 71% at this time last year.
This study analyzes the top brands in the world and how they use Instagram to build their brand, engage audiences, and promote their wares by identifying the successful (and unsuccessful) tactics that these brands are using, the results they’re seeing, and lessons to be learned from them.
200 million
1.6 billionlikes per day
monthly active users
photos per day60 million

Simply Measured Q3 2014 Instagram Study 3
Methodology The “Simply Measured Q3 2014 Instagram Study” looks at the Instagram activity of the Interbrand 2013 Top 100 Brands.
At the end of each year, Interbrand ranks the top 100 global brands based several factors, including market, brand, competitor, and financial data.
The Interbrand 100 is an industry standard and a standard for Simply Measured network studies. This list is analyzed because the companies included are the best in the world at building and maintaining a brand, which is a prerequisite to a successful social media strategy.
Statistics cited in this study are based on data from Q3 2014 (7/1/14 - 9/30/14).
All data was analyzed using Simply Measured’s industry-leading social media analytics and reporting platform.
This study also incorporates data for benchmarking from previous Simply Measured studies, “How Top Brand Marketers Use Instagram” (October 2013) and “Top Brands See The Big Picture With Instagram” (October 2012).
6,075 posts by 80 brands
1,314,427 comments
113,030,987 likes
THIS STUDY ENCOMPASSES:

Simply Measured Q3 2014 Instagram Study 4
ADOPTION
More Top Brands See Value in Instagram At the end of Q3 2012, only 54% of the Interbrand 100 had Instagram accounts. Today, 86% of the Interbrand list has an account on the mobile network.
Key Findings• Active brands (brands who’ve posted at least once in Q3 2014)
have almost doubled since Q3 2012.
• 73% of brands post at least one photo or video per week. This is a 35 percentage point increase over 2012.
• The number of brands with 10,000 or more followers has grown by 34 year-over-year.
• The number of brands with more than 100,000 followers has grown by 15 year-over-year.
Take Away Brands are joining Instagram at a substantial rate and are dedicating resources to maintaining a brand presence on the network. By doing so, many brands are finding successful ways to grow their audience.
Have an Account
Shar
e of
Inte
rbra
nd 1
00 B
rand
s
100%
90%
80%
70%
60%
50%
40%
30%
20%
10%
0Active Account
(Posted in Quarter)1+ Post
per Week10,000+ Followers
20,000+ Followers
100,000+ Followers
More Brands Are Active and Building Large AudiencesQ3 2012 Q3 2013 Q3 2014
Simply Measured Q3 2014 Instagram Study 5
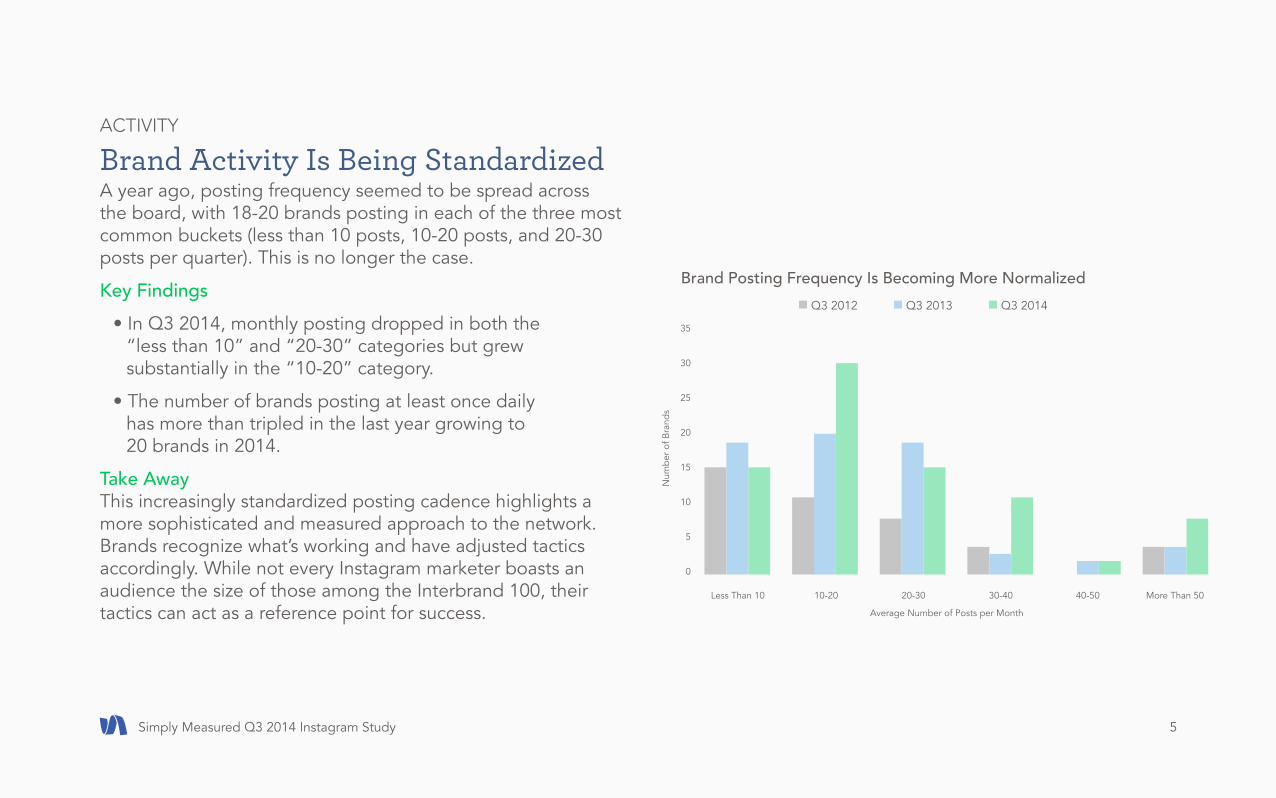
ACTIVITY
Brand Activity Is Being Standardized A year ago, posting frequency seemed to be spread across the board, with 18-20 brands posting in each of the three most common buckets (less than 10 posts, 10-20 posts, and 20-30 posts per quarter). This is no longer the case.
Key Findings• In Q3 2014, monthly posting dropped in both the
“less than 10” and “20-30” categories but grew substantially in the “10-20” category.
• The number of brands posting at least once daily has more than tripled in the last year growing to 20 brands in 2014.
Take Away This increasingly standardized posting cadence highlights a more sophisticated and measured approach to the network. Brands recognize what’s working and have adjusted tactics accordingly. While not every Instagram marketer boasts an audience the size of those among the Interbrand 100, their tactics can act as a reference point for success.
Less Than 10
Num
ber o
f Bra
nds
Average Number of Posts per Month
35
30
25
20
15
10
5
0
10-20
Q3 2012 Q3 2013 Q3 2014
20-30 30-40 40-50 More Than 50
Brand Posting Frequency Is Becoming More Normalized

Simply Measured Q3 2014 Instagram Study 6
ACTIVITY AND ENGAGEMENT
Active Brands Are Driving More Engagement As activity among top brands grows, so does engagement. With more brands engaging larger audiences, more posts being published, and tactics becoming more sophisticated, users are becoming more receptive to brand content on the network, giving large brands a bigger return on their investment in the network.
Key Findings• Monthly engagement (likes and comments) for the
Interbrand 100 has more than doubled since Q3 last year and grown by almost 12 times since Q3 2012.
• Engagement with brand posts is growing at a greater rate than new brands are adopting the network.
Take Away Now is a better time than ever before for brands to invest in Instagram. As audiences become more receptive to branded content, the potential for high engagement and exposure is continuing to grow substantially.
50M
45M
40M
35M
30M
25M
20M
15M
10M
5M
0M
No. of Active Brands Engagement
Active Brands Are Driving More Engagement
No.
of A
ctiv
e B
rand
s
Tota
l Eng
agem
ents
100
90
80
70
60
50
40
30
20
10
0
Mar
. 11
Mar
. 12
Mar
. 13
Mar
. 14
Jun.
11
Jun.
12
Jun.
13
Jun.
14
Sept
. 11
Sept
. 12
Sept
. 13
Sept
. 14
Dec
. 11
Dec
. 12
Dec
. 13
Q3 2014
Q3 2013
Q3 2012
Q3 2011
Simply Measured Q3 2014 Instagram Study 7
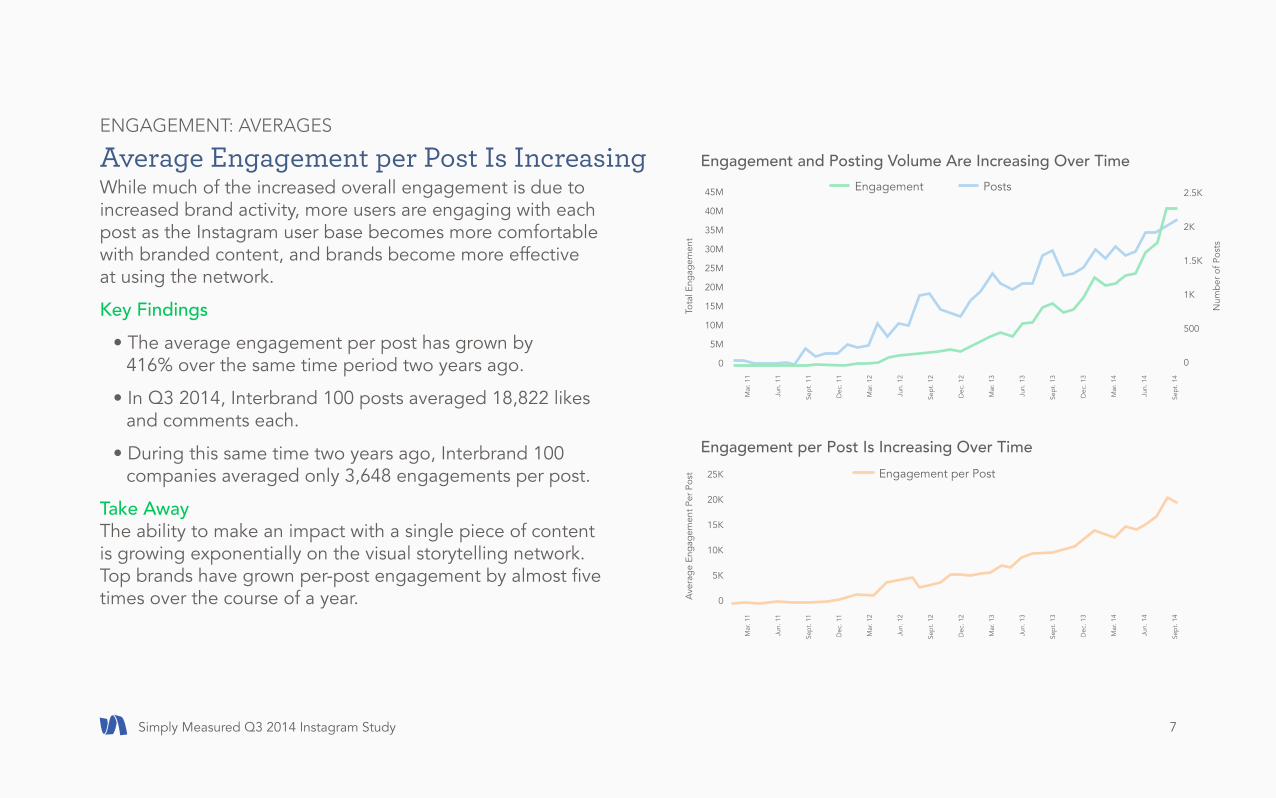
ENGAGEMENT: AVERAGES
Average Engagement per Post Is IncreasingWhile much of the increased overall engagement is due to increased brand activity, more users are engaging with each post as the Instagram user base becomes more comfortable with branded content, and brands become more effective at using the network.
Key Findings• The average engagement per post has grown by
416% over the same time period two years ago.
• In Q3 2014, Interbrand 100 posts averaged 18,822 likesand comments each.
• During this same time two years ago, Interbrand 100companies averaged only 3,648 engagements per post.
Take AwayThe ability to make an impact with a single piece of content is growing exponentially on the visual storytelling network. Top brands have grown per-post engagement by almost five times over the course of a year.
45M
40M
35M
30M
25M
20M
15M
10M
5M
0
2.5K
2K
1.5K
1K
500
0
Engagement and Posting Volume Are Increasing Over TimeEngagement Posts
Mar
. 11
Mar
. 12
Mar
. 13
Mar
. 14
Jun.
11
Jun.
12
Jun.
13
Jun.
14
Sept
. 11
Sept
. 12
Sept
. 13
Sept
. 14
Dec
. 11
Dec
. 12
Dec
. 13
25K
20K
15K
10K
5K
0
Engagement per Post Is Increasing Over TimeEngagement per Post
Mar
. 11
Mar
. 12
Mar
. 13
Mar
. 14
Jun.
11
Jun.
12
Jun.
13
Jun.
14
Sept
. 11
Sept
. 12
Sept
. 13
Sept
. 14
Dec
. 11
Dec
. 12
Dec
. 13
Ave
rage
Eng
agem
ent P
er P
ost
Tota
l Eng
agem
ent
Num
ber o
f Pos
ts

Simply Measured Q3 2014 Instagram Study 8
ENGAGEMENT: TIMING
Comments Happen Quickly on Instagram Most comments on Instagram happen quickly, but high-performing posts see comment volume peak later.
Key Findings• On average, posts by top brands garner 216 comments,
with 50% of comments being posted in the first 6 hours and 75% of comments being posted in the first 48 hours.
• Top brands have staying power. 10% of comments come after 13 days.
• High-performing posts (posts with double the average engagement) will peak later, taking more than 13 hours to hit 50% of total comments.
• Posts with half the average engagement get 50% of their comments in less than 3 hours.
Take Away High performing content on Instagram has a longer shelf life than average posts. This is an important reason to focus on quality. Instagram users scroll through a single stream of images, even when using the discovery tools and searching specific topics. As a post ages, it’s important to have content that will catch their eye.
100%
90%
80%
70%
60%
50%
40%
30%
20%
10%
0
Posts by Top Brands Have a Long LifeLow Engagement Posts High Engagement Posts
1 2 3 4 5Days Since Content Was Posted
Cum
ulat
ive
Perc
enta
ge o
f Tot
al C
omm
ents
Mad
e
Average Posts

Simply Measured Q3 2014 Instagram Study 9
INDUSTRY ACTIVITY
Media Brands Are The Most Active The most active industry on the Interbrand list is media; even though automotive is the most well-represented on the Top 100 List.
Key Findings• Only four media brands from the Interbrand list are
active on Instagram, but they average 62 more posts per month than the list average.
• The brands in the media industry average 23,906 engagements per post; 5,084 likes and comments more than the list average.
• Business services, financial services, and fast moving consumer goods (FMCG) have the lowest percentage of brands represented on Instagram.
• While the automotive industry has the highest number of brands on Instagram (13), the luxury segment of the Interbrand 100 list maintains 100% Instagram adoption with all seven brands active on the network.
100
90
80
70
60
50
40
30
20
10
0
20
18
16
14
12
10
8
6
4
2
0
No. of Active Brands
Ave
rage
Mon
thly
Pos
ts p
er B
rand
Num
ber o
f Bra
nds
Act
ive
in Q
3 20
14
Automotiv
e
Tech
nology
Luxu
ry
FMCG
Electro
nics
Alcoho
l
Finan
cial S
ervic
es
Apparel
Med
ia
Restau
rants
Diversi
fied
Bever
ages
Retail
Sporti
ng G
oods
Energ
y
Home Fur
nishin
gs
Busine
ss Se
rvice
s
Average Posts per Month
Instagram Activity Varies by Industry
Take Away
Instagram is a playground for brands with visually-appealing products and a unique style. Media, automotive, luxury, and apparel have all found success on the visual storytelling platform.
13
9
7 76 6 6
4 4 4 43
2 2
1 1 1

Simply Measured Q3 2014 Instagram Study 10
TACTICS: CAPTIONS
Brands Avoid Lengthy Captions… But Should They? Brands on Instagram are focused on keeping captions short. This isn’t surprising, since the network is made for visual sharing. But, it turns out engagement doesn’t drop when longer-captioned posts are shared.
Key Findings• The average caption is 138 characters long,
including hashtags.
• There is no statistically significant correlation between caption length and engagement.
Take Away While it may seem intuitive to keep post captions short, this isn’t necessarily integral to finding success on Instagram. Don’t be afraid to use the space needed to convey your message, as long as it adds to the visual focus of your post, as opposed to detracting from it.
1,200
1,000
800
600
400
200
0
Longer Captions Are Used Sparingly by Top Brands
Num
ber o
f Pos
ts
<25<12
5<22
5<32
5<42
5<52
5≥60
0<50
<150
<250
<350
<450
<550
<75<17
5<27
5<37
5<47
5<57
5<10
0<20
0<30
0<40
0<50
0<60
0
Number of Characters in Post Caption
30K
25K
20K
15K
10K
5K
0
Caption Length Does Not Significantly Affect Engagement
Ave
rage
Eng
agem
ent p
er P
ost
<25<12
5<22
5<32
5<42
5<52
5≥60
0<50
<150
<250
<350
<450
<550
<75<17
5<27
5<37
5<47
5<57
5<10
0<20
0<30
0<40
0<50
0<60
0
Number of Characters in Post Caption
Simply Measured Q3 2014 Instagram Study 11
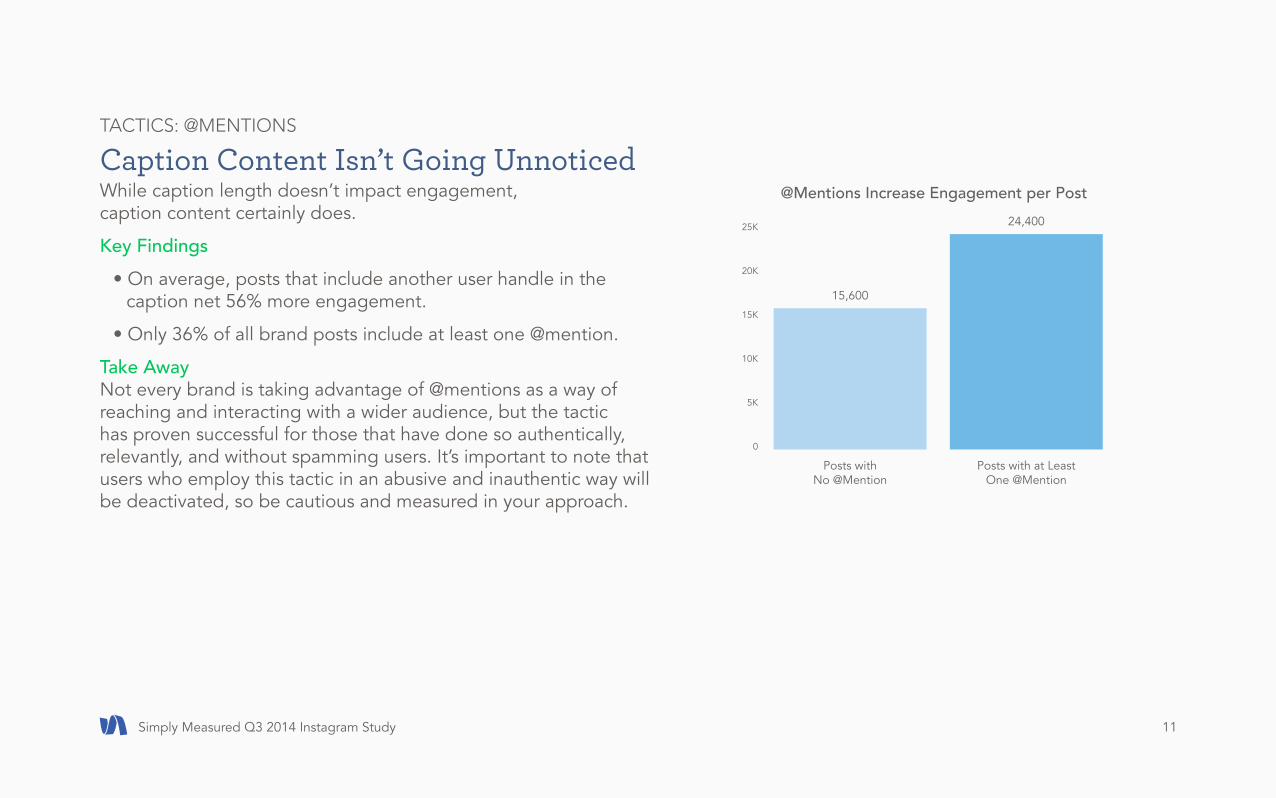
TACTICS: @MENTIONS
Caption Content Isn’t Going Unnoticed While caption length doesn’t impact engagement, caption content certainly does.
Key Findings• On average, posts that include another user handle in the
caption net 56% more engagement.
• Only 36% of all brand posts include at least one @mention.
Take Away Not every brand is taking advantage of @mentions as a way of reaching and interacting with a wider audience, but the tactic has proven successful for those that have done so authentically, relevantly, and without spamming users. It’s important to note that users who employ this tactic in an abusive and inauthentic way will be deactivated, so be cautious and measured in your approach.
25K
20K
15K
10K
5K
0
@Mentions Increase Engagement per Post
Posts with No @Mention
15,600
24,400
Posts with at Least One @Mention
Simply Measured Q3 2014 Instagram Study 12
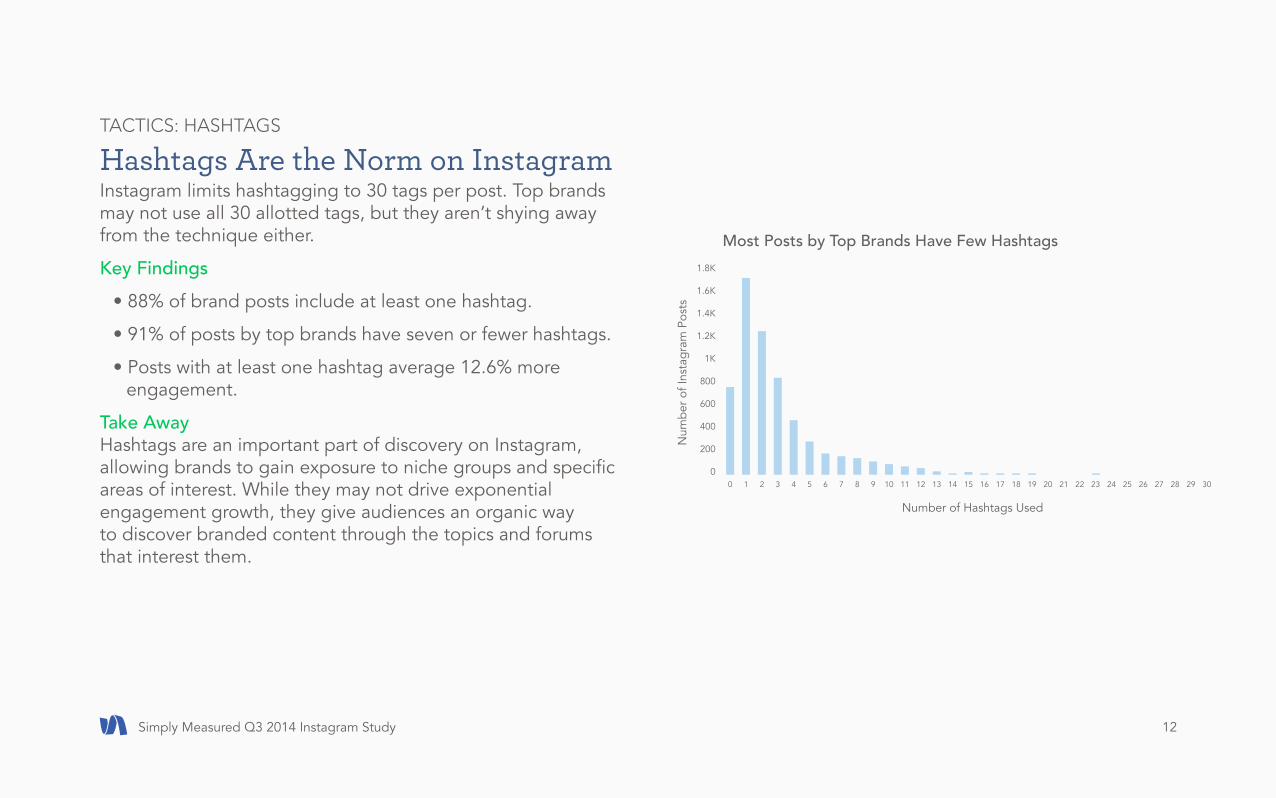
TACTICS: HASHTAGS
Hashtags Are the Norm on Instagram Instagram limits hashtagging to 30 tags per post. Top brands may not use all 30 allotted tags, but they aren’t shying away from the technique either.
Key Findings• 88% of brand posts include at least one hashtag.
• 91% of posts by top brands have seven or fewer hashtags.
• Posts with at least one hashtag average 12.6% more engagement.
Take Away Hashtags are an important part of discovery on Instagram, allowing brands to gain exposure to niche groups and specific areas of interest. While they may not drive exponential engagement growth, they give audiences an organic way to discover branded content through the topics and forums that interest them.
1.8K
1.6K
1.4K
1.2K
1K
800
600
400
200
010 5 9 13 17 21 25 26 27 28 29 302 6 10 14 18 223 7 11 15 19 234 8 12 16 20 24
Most Posts by Top Brands Have Few Hashtags
Num
ber o
f Ins
tagr
am P
osts
Number of Hashtags Used

Simply Measured Q3 2014 Instagram Study 13
TACTICS: LOCATION TAGGING
Location Tagging Tied to Engagement Growth Location tagging gives Instagram users another way to find content. Several third party apps exist that allow users to search by location, leading to increased engagement.
Key Findings• Of the 6,075 Instagram posts, 307 had a location tagged.
• Posts tagged with a location receive 79% higher engagement.
• No brand on the Interbrand list uses location tags on all posts.
Take Away Only some brands ever tag with a location, and these brands have higher engagement overall, which suggests a generally higher level of Instagram sophistication pays off for these brands. When these brands tag a location, their posts average 29% higher engagement. No brand in this sample uses location tags on all their posts.
35K
30K
25K
20K
15K
10K
5K
0
Location Tagging Increases Engagement per Post
Engagement When Location Tagged (307 posts)
32,400
25,200
Engagement When No Location Tagged (2,994 posts)
Simply Measured Q3 2014 Instagram Study 14
Conclusion Instagram has taken great care to enable quality brand storytelling. With an active ad network and analytics being slowly rolled out to enterprise partners, a highly engaged audience, and updated features, the focus of brand marketers is on implementing the best tactics for driving engagement on the network. These top brands have already recognized the opportunity with Instagram’s 200 million users by increasing their activity and working to refine their tactics.
The example from the leading companies speaks to the importance of a sophisticated presence.
1. Maintain a balanced posting cadence. 2. Don’t second guess caption length.3. Test location tagging. 4. Use hashtags to reach targeted audiences. 5. Mention influential and relevant users in captions
to engage new audiences. Keep in mind that you don’t want to come across as spam.
By following the example of these brands, and developing a practical and sophisticated measurement strategy, you can make Instagram work for your brand as well.

About Simply Measured Simply Measured is a fast-growing team of data geeks dedicated to making the world of analytics and reporting a better, more beautiful place. Find out more at simplymeasured.com
Our goal is to put the tools to understand business data in the hands of business users. We think reporting should be simple, attractive, and accessible for everyone – not just data scientists. Our software streamlines the process from data to deliverables and eliminates the countless hours spent on everyday reporting tasks. We do this by putting cloud data sources at your fingertips, providing a marketplace of best practice reports, and allowing you to generate beautiful solutions on the web, in Excel, and in PowerPoint with a couple of clicks.
Want to try Simply Measured?
Request a Free 14 Day Trial
Copyright © 2010–2014 Simply Measured, Inc. All Rights Reserved.