September 15, 2008 Dear Board members - … September 15, 2008 Dear Board members: It’s September...
274
1 September 15, 2008 Dear Board members: It’s September and time for new beginnings as our students go back to school. The legislative hearing at the House Education Committee last week went very well on math, CORE 24 and accountability. Thanks to Linda Lamb, Eric Liu, Mary Jean Ryan and Steve Floyd for attending. Our legislators heard from some amazing students who support CORE 24 and love going to school every day. I wish school could be like that for all kids. The legislative hearing room was packed with a great cross section of CORE 24 supporters thanks to the help of APCO and the League of Education Voters. On Friday night Mary Jean, Bernal Baca, Steve Dal Porto and I spent time with about 100 members of the WEA. I know how much they appreciated our Board members coming to talk about accountability with them and listen to their concerns—even if they are not very excited about the draft concepts proposed. Their main issues are were: 1) the use of the WASL in the accountability index (they do not think the WASL is a valid assessment as we have heard many times), 2) the Innovation Zone is only for a small group of schools when others will also have great needs and 3) the desire to have the union as an equal partner in the agreement to opt into the Innovation Zone. I will get you a summary of their concerns soon. We had a wonderful retreat last month. Special thanks to Amy Bragdon, Jack Schuster, Sheila Fox, and Steve Dal Porto for their help preparing for the retreat. The highlight was dinner at Jack and Gini Schuster’s house with delicious food, Kathe playing the fiddle, a group of very musical Karaoke Boardies, tales of Austianna Quick’s amazing adventures inTajikistan and much more! I would like to see if several Board members would be interested in helping Brad look at our by- laws this fall. You have been working together for over two years now and I think it would be useful to review them. Let Mary Jean or me know if you are interested. And now on to our Board meeting in Pasco! Tuesday, September 23, 2008 Pasco Schools Tour We will have a tour of Pasco Schools with Superintendent Saundra Hill starting at 9:30 a.m. (details will come soon). Saundra would like to have you to visit her schools and see how they are dealing with issues of school improvement. While I realize the timing is not great for you, this is what she requested. Kathe and I will attend. Andy and Meghan from Mass Insight are available that evening for an informal dinner if you would like to visit with them.
Transcript of September 15, 2008 Dear Board members - … September 15, 2008 Dear Board members: It’s September...

1
September 15, 2008
Dear Board members:
It’s September and time for new beginnings as our students go back to school. The legislative
hearing at the House Education Committee last week went very well on math, CORE 24 and
accountability. Thanks to Linda Lamb, Eric Liu, Mary Jean Ryan and Steve Floyd for attending.
Our legislators heard from some amazing students who support CORE 24 and love going to
school every day. I wish school could be like that for all kids. The legislative hearing room was
packed with a great cross section of CORE 24 supporters thanks to the help of APCO and the
League of Education Voters.
On Friday night Mary Jean, Bernal Baca, Steve Dal Porto and I spent time with about 100
members of the WEA. I know how much they appreciated our Board members coming to talk
about accountability with them and listen to their concerns—even if they are not very excited
about the draft concepts proposed. Their main issues are were: 1) the use of the WASL in the
accountability index (they do not think the WASL is a valid assessment as we have heard many
times), 2) the Innovation Zone is only for a small group of schools when others will also have
great needs and 3) the desire to have the union as an equal partner in the agreement to opt into
the Innovation Zone. I will get you a summary of their concerns soon.
We had a wonderful retreat last month. Special thanks to Amy Bragdon, Jack Schuster, Sheila
Fox, and Steve Dal Porto for their help preparing for the retreat. The highlight was dinner at
Jack and Gini Schuster’s house with delicious food, Kathe playing the fiddle, a group of very
musical Karaoke Boardies, tales of Austianna Quick’s amazing adventures inTajikistan and
much more!
I would like to see if several Board members would be interested in helping Brad look at our by-
laws this fall. You have been working together for over two years now and I think it would be
useful to review them. Let Mary Jean or me know if you are interested.
And now on to our Board meeting in Pasco!
Tuesday, September 23, 2008
Pasco Schools Tour
We will have a tour of Pasco Schools with Superintendent Saundra Hill starting at 9:30 a.m.
(details will come soon). Saundra would like to have you to visit her schools and see how they
are dealing with issues of school improvement. While I realize the timing is not great for you,
this is what she requested. Kathe and I will attend. Andy and Meghan from Mass Insight are
available that evening for an informal dinner if you would like to visit with them.

2
Wednesday, September 24, 2008
System Performance Accountability
This will be a major part of our focus on Wednesday. I have spent a lot of time since our retreat
on SPA related work. The intent of the September Board meeting is for you to review the work
to date with our consultants, discuss and give further guidance. You will have a work session on
October 21 for more follow up. Then at the November Board meeting, if the Board agrees it is
ready, you may adopt an accountability framework.
There is a lot of reading material in this packet, which is divided into three parts. First, you have
a background piece from me that summarizes all the work you have done in the last year and a
half and how it leads to the work in front of you with the accountability index and the
partnerships for state and locals to address struggling schools. Second, Pete Bylsma has
developed his final draft paper on the accountability index, which will enable the Board to
identify exemplary schools as well as those that are struggling. He has worked with OSPI and a
group of school district folks to develop this based on your guidance. Pete had a short term
contract with us which is finished after he presents at this Board meeting. We will hire a long
term contractor to continue this work (and some other things) over the next 9 months. Third, you
have a report from Mass Insight (Andy Calkins and Meghan O’Keefe) on the state and local
partnerships which addresses two pieces: the Innovation Zone for Priority Schools and final
consequences for all struggling schools that continue not to improve. This report is the end of
their contract unless we decide to extend it for a few more months, which I am considering as I
think they have made a lot of progress in the last few weeks.
Executive Session
It’s time for my annual evaluation. I have enclosed a self assessment based on my 2007-08
goals. You will discuss this over lunch.
Overview of Key Components of Efforts to Improve Mathematics in State
Steve Floyd and Jeff Vincent will talk about the vital need to focus on our joint math action plan
as well as the beginnings of a new joint science action plan that addresses many of the key
components to ensure our students achieve at the great levels. Jeff has been in discussion with
some businesses to find ways to strengthen the support needed to help schools in math and
science. He will bring additional information to the Board meeting.
As you will recall, once we approved the K-8 math standards, OSPI began to review a variety of
curricular materials to determine how well they aligned with the new math standards. OSPI will
provide you with their recommendations for K-8 curricular menus (the law requires they
recommend up to three for elementary, middle and high school) to the Board. They will explain

3
the very lengthy and careful process they have gone through to arrive at these
recommendations. We have hired Strategic Teaching to work with our Math Panel to review
their recommendations. That work has already begun as OSPI completed its review in mid
August. While there has been some concern on the part of some members of the Math Panel
that more than the top 3-4 curricular programs should be reviewed (there were 12 total), we
have directed Strategic Teaching to look that the top four as those are the ones we anticipated
OSPI would recommend. The reasons that some Math Panelists wanted to extend the review,
were concerns that certain program such as Singapore math should actually be a good fit (it
was ranked at the bottom) and that some of the middle of the pack curriculum programs
statistically are close the third and fourth ranked programs and therefore should be considered.
The review of high school curricular materials will be done later this fall. All of this is
summarized in the Math Panel notes I sent out in early September.
OSPI will also provide you with information on the request for information they plan to advertise
to solicit proposals to develop on-line math curriculum aligned to the new standards. They are
required to consult with us per the law that was passed last session. Based on the cost of the
proposals they receive back, they make a request to the legislature for funding an on line
curriculum for the K-12 math standards that would be free to school districts.
Proposed State Board of Education Strategic Plan, Work Plan and Budgets for
2009-2011
Due to the addition of our new goal to improve graduation rates, I have developed some specific
objectives to address this goal through personalized learning. These are reflected in the
Strategic Plan, Work Plan and Budget Requests. A summary of the proposed work is as follows:
Personalized Education for High School Students “Stop the Drop(out) Rate”
The State Board of Education, in its most recent strategic plan added a new goal to improve
graduation rates. The Board is concerned about the current trends in graduation rates, which
show that in 2006 (the most recent OSPI data), the on-time graduation rates are 70.45 percent
and the extended graduation rates are 75.1 percent. For different subgroups the picture is more
dismal. In addition with the proposed CORE 24 framework, the Board wants to ensure that the
new requirements keep students in school and that they are not pushed out.
The Board is charged by the legislature “to provide leadership in the creation of a system that
personalizes education for all students and respects diverse culture, abilities and learning styles
and promotes the achievement of the basic education goals,” (RCW 28A.305.130). During the
upcoming biennium, the Board wants to focus on “why do students drop out and what are we
going to do about it?” through its new goal of improving graduation rates. The Board believes
that an investigation of strategies to make learning more personal for high school students can
make a difference and stop the “falling through the cracks” syndrome. The Board also
anticipates receiving information on the achievement gap from various commissions and wants
to incorporate issues they identify in our strategies outlined below.

4
The Board would propose creating strategies to improve graduation rates by exploring these
issues:
A) Define the reasons students drop out of high school now, by reviewing the current literature and conducting projects in Washington State as well as to conduct a study on barriers perceived by students and their parents.
B) Determine how to operationalize competencies for high school credits. C) Examine ways to create a model of how alternative education could be strengthened for
students. D) Examine the current status of online learning in Washington and nationally to determine
what policies should be put in place to ensure the quality of online learning opportunities.
You have four documents to review: 1) an updated strategic plan, (see pages 11-14) to reflect
work we need to do this year under all three goals, 2) a draft work plan for the year and how it
meets our goals, 3) a draft monthly planner for Board meetings and work sessions and 4) the
draft SBE budget requests– both a supplemental request for the science curricular review of
$150,000 for work we will do this spring and $820,000 request for the 2009-11 biennium to do
the work on Personalized Education for High School Students “Stop the Drop(out) Rate.” Please
note I had to send the draft budget up to OFM on September 2nd, but I told them I would get
back to them with the final budget request (if changes were made) after our Board approved it at
our September Board meeting.
Dinner will be at The Cedars Restaurant. Directions are in your packet.
Thursday, September 25, 2008
CORE 24 Implementation Task Force Charter
Jack Schuster and Steve DalPorto have agreed to be the co-leads on the CORE 24
Implementation Task Force Charter. We are still finishing up the memo on this and will send out
via email. The motion at the July meeting provides the direction for the implementation charter.
Here is a reminder of that motion:
Approval of Framework for CORE 24 High School Graduation Requirements 1. Establish the CORE 24 Graduation Requirements Policy Framework, per the attached Adoption Document, consisting of subject area requirements, culminating project, and high school and beyond plan to be phased in over four years, beginning with the class of 2013 and becoming fully implemented with the class of 2016, contingent upon funding approved by the legislature. 2. Maintain the culminating project and high school and beyond plan as graduation requirements, with modifications developed in consultation with the Board’s implementation advisors. Begin the high school and beyond plan in middle school.
5
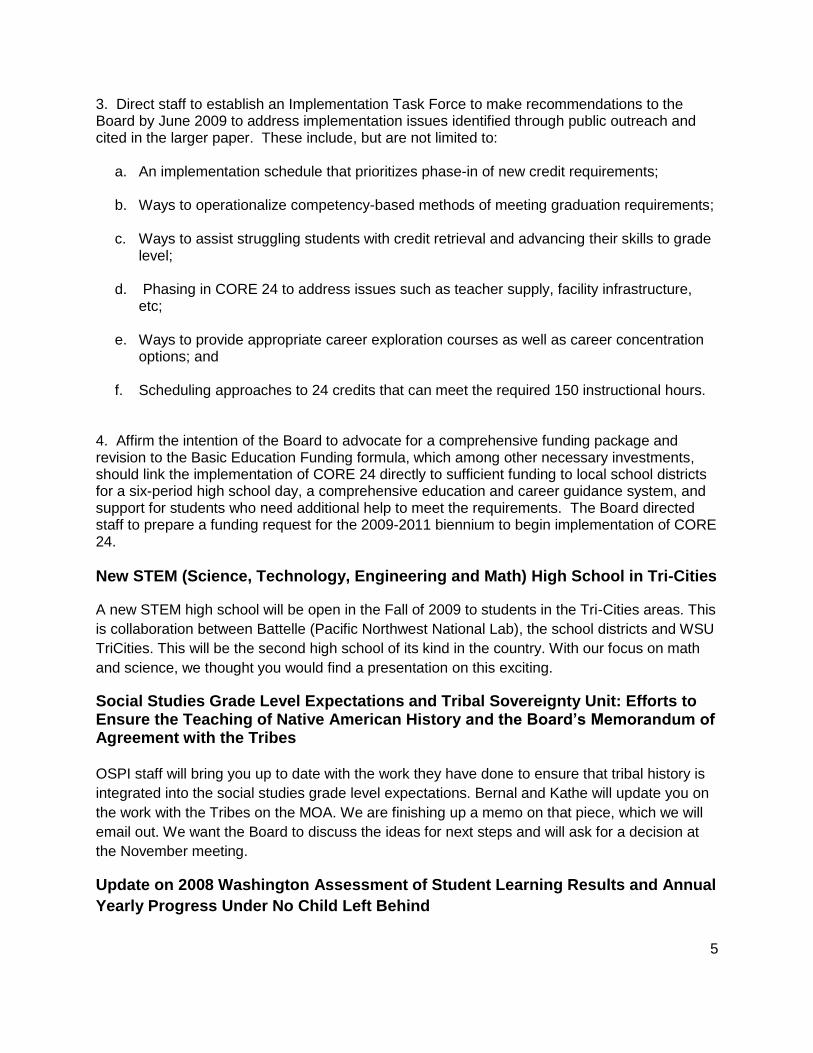
3. Direct staff to establish an Implementation Task Force to make recommendations to the Board by June 2009 to address implementation issues identified through public outreach and cited in the larger paper. These include, but are not limited to:
a. An implementation schedule that prioritizes phase-in of new credit requirements;
b. Ways to operationalize competency-based methods of meeting graduation requirements;
c. Ways to assist struggling students with credit retrieval and advancing their skills to grade level;
d. Phasing in CORE 24 to address issues such as teacher supply, facility infrastructure,
etc;
e. Ways to provide appropriate career exploration courses as well as career concentration options; and
f. Scheduling approaches to 24 credits that can meet the required 150 instructional hours.
4. Affirm the intention of the Board to advocate for a comprehensive funding package and revision to the Basic Education Funding formula, which among other necessary investments, should link the implementation of CORE 24 directly to sufficient funding to local school districts for a six-period high school day, a comprehensive education and career guidance system, and support for students who need additional help to meet the requirements. The Board directed staff to prepare a funding request for the 2009-2011 biennium to begin implementation of CORE 24.
New STEM (Science, Technology, Engineering and Math) High School in Tri-Cities
A new STEM high school will be open in the Fall of 2009 to students in the Tri-Cities areas. This
is collaboration between Battelle (Pacific Northwest National Lab), the school districts and WSU
TriCities. This will be the second high school of its kind in the country. With our focus on math
and science, we thought you would find a presentation on this exciting.
Social Studies Grade Level Expectations and Tribal Sovereignty Unit: Efforts to Ensure the Teaching of Native American History and the Board’s Memorandum of Agreement with the Tribes OSPI staff will bring you up to date with the work they have done to ensure that tribal history is
integrated into the social studies grade level expectations. Bernal and Kathe will update you on
the work with the Tribes on the MOA. We are finishing up a memo on that piece, which we will
email out. We want the Board to discuss the ideas for next steps and will ask for a decision at
the November meeting.
Update on 2008 Washington Assessment of Student Learning Results and Annual
Yearly Progress Under No Child Left Behind

6
OSPI staff will provide a short update on the 2008 WASL results (the results are mixed with still
limited progress in math and science) as well as AYP. Many more schools are not meeting AYP
this year due to the double digit increase of the state uniform bar in reading and math targets at
all levels.
Business Items
We will have a draft motion sheet for you at the meeting for all the business items. Look over the consent agenda and decide if you want an item pulled. Let me know before the business part of the meeting starts, if you want the items pulled off. This is a new way we plan to do some of our business items that need to be approved but do not need discussion. The purpose of the Consent Agenda is to act upon routine matters in an expeditious manner. Items placed on the Consent Agenda are determined by the Chair, in cooperation with the Executive Director, and are those that are considered common to the operation of the Board and normally require no special Board discussion or debate. Please note on consent agenda items as follows:
We have a contract for a consultant to help us with accountability index and data analysis, but we have not yet received the proposals to provide you with a recommendation. Kris Mayer, Joe Willhoft and I will review proposals on Friday September 19th and then bring the final one that we select to you at the Board meeting.
We have also revised the meeting dates to have several meetings that will occur on Wednesday and Thursdays before three day weekends, otherwise our meetings will be Thursdays and Fridays. We have moved the retreat from August to one day in July.
We have pulled out the Private Schools to discuss before approving them. We will provide the
list private schools in your FYI folders recommended for approval. There has been concern
expressed about a private online learning school in Yakima and whether it really meets the
expectations of a private school in Washington State. OSPI and Kathe are prepared to answer
any questions you may have.
See you in Pasco!

7

State Board of Education MeetingESD 123
3918 W Court Street Pasco, WA 99301
Shelly Moos: (509) 544-5785 September 24 9:00 a.m.-5:00 p.m.
September 25 8:30 a.m.-1:30 p.m.
AGENDA Tuesday, September 23, 2008 9:30-1:30 Tour of Pasco Schools with Superintendent Saundra Hill (optional for
Board members) Wednesday, September 24, 2008 9:00 a.m. Call to Order
Welcome Mr. Bruce Hawkins, Superintendent, ESD 123 Pledge of Allegiance
Agenda Overview Approval of Minutes from the July 23-24 and July 30 Meetings (Action Item)
9:10 a.m. Update on System Performance Accountability Dr. Kris Mayer, Board Lead, SBE
Ms. Edie Harding, Executive Director, SBE 9:40 a.m. Proposed Accountability Index Dr. Pete Bylsma, Consultant Board Discussion 10:30 a.m. Break 10:45 a.m. State/Local Partnership Proposed Accountability Concepts Mr. Andy Calkins, Mass Insight
Ms. Meghan O’Keefe, Mass Insight
11:45 a.m. Public Comment 12:15 p.m. Lunch (Lewis and Clark Room) and Executive Session (Whitman
Room) Mary Jean Ryan, Chair Warren T. Smith Sr., Vice Chair Dr. Terry Bergeson, Superintendent of Public Instruction Dr. Bernal Baca Amy Bragdon Dr. Steve Dal Porto Steve Floyd Dr. Sheila Fox Phyllis Bunker Frank Austianna Quick Linda W. Lamb Eric Liu Dr. Kristina Mayer John C. "Jack" Schuster Lorilyn Roller Jeff Vincent Edie Harding, Executive Director (360) 725-6025 TTY (360) 664-3631 FAX (360) 586-2357 Email: [email protected] www:sbe.wa.gov.

Mary Jean Ryan, Chair Warren T. Smith Sr., Vice Chair Dr. Terry Bergeson, Superintendent of Public Instruction Dr. Bernal Baca Amy Bragdon Dr. Steve Dal Porto Steve Floyd Dr. Sheila Fox Phyllis Bunker Frank Austianna Quick Linda W. Lamb Eric Liu Dr. Kristina Mayer John C. "Jack" Schuster Lorilyn Roller Jeff Vincent Edie Harding, Executive Director (360) 725-6025 TTY (360) 664-3631 FAX (360) 586-2357 Email: [email protected] www:sbe.wa.gov.
Annual Evaluation of Executive Director 1:00 p.m. State/Local Partnership Proposed Accountability Concepts Mr. Andy Calkins, Mass Insight Ms. Meghan O’Keefe, Mass Insight Board Discussion 2:15 p.m. Break 2:30 p.m. Overview of Key Components of Efforts to Improve Mathematics in
State Mr. Steve Floyd, Math Lead Ms. Edie Harding, Executive Director Update on OSPI Math Curricular Menu Recommendations And Update on On-Line Math Curriculum Request Ms. Lexie Domaradzki, Assistant Superintendent, OSPI
Ms. Porsche Everson, Consultant to OSPI on Math Curricular Review SBE Role in Math Curricular Menu Review Mr. Steve Floyd, Math Lead Ms. Edie Harding, Executive Director Ms. Linda Plattner, Consultant, Strategic Teaching 3:15 p.m. Public Comment 4:00 p.m. Proposed State Board of Education Strategic Plan, Work Plan and
Budgets for 2009-2011 Ms. Edie Harding, Executive Director Board discussion
4:30 p.m. Public Comment 5:00 p.m. Adjourn

Mary Jean Ryan, Chair Warren T. Smith Sr., Vice Chair Dr. Terry Bergeson, Superintendent of Public Instruction Dr. Bernal Baca Amy Bragdon Dr. Steve Dal Porto Steve Floyd Dr. Sheila Fox Phyllis Bunker Frank Austianna Quick Linda W. Lamb Eric Liu Dr. Kristina Mayer John C. "Jack" Schuster Lorilyn Roller Jeff Vincent Edie Harding, Executive Director (360) 725-6025 TTY (360) 664-3631 FAX (360) 586-2357 Email: [email protected] www:sbe.wa.gov.
Thursday, September 25, 2008
8:30 a.m. CORE 24 Implementation Task Force Charter Dr. Kathe Taylor, Policy Director Board discussion 9:30 a.m. Break
9:45 a.m. New STEM High School in Tri-Cities Mr. Mike Kluse, Director, Pacific Northwest National Laboratory Ms. Saundra Hill, Superintendent, Pasco School District Ms. Vicki Carwein, Chancellor, Washington State University, Tri-Cities 10:15 a.m. Social Studies Grade Level Expectations and Tribal Sovereignty Unit:
Efforts to Ensure the Teaching of Native American History Mr. Caleb Perkins, Supervisor, Social Studies and International Education
Program, OSPI
Tribal MOA Dr. Kathe Taylor, Policy Director
Dr. Bernal Baca, Board Lead 11:00 a.m. Public Comment 11:30 a.m. Update on 2008 Washington Assessment of Student Learning
Results and Annual Yearly Progress Under No Child Left Behind Dr. Terry Bergeson, Superintendent, OSPI 12:00 p.m. Lunch (Lewis and Clark Room) 12:30 p.m. Business Items
• SBE Revised Strategic Plan, Budget Proposals and Work Plan (Action Item)
• Approval of Implementation Task Force Charter (Action Item) Consent Agenda The purpose of the Consent Agenda is to act upon routine matters in an
expeditious manner. Items placed on the Consent Agenda are determined by the Chair, in cooperation with the Executive Director, and are those that are considered common to the operation of the Board and normally require no special Board discussion or debate. A Board member; however, may request that any item on the Consent Agenda be removed and inserted at an appropriate place on the regular agenda. Items on the Consent Agenda for this meeting include:

Mary Jean Ryan, Chair Warren T. Smith Sr., Vice Chair Dr. Terry Bergeson, Superintendent of Public Instruction Dr. Bernal Baca Amy Bragdon Dr. Steve Dal Porto Steve Floyd Dr. Sheila Fox Phyllis Bunker Frank Austianna Quick Linda W. Lamb Eric Liu Dr. Kristina Mayer John C. "Jack" Schuster Lorilyn Roller Jeff Vincent Edie Harding, Executive Director (360) 725-6025 TTY (360) 664-3631 FAX (360) 586-2357 Email: [email protected] www:sbe.wa.gov.
• Approval of 2009 and 2010 Board Meeting Dates (Action Item) • Contract Approval for Accountability Index Data Analysis (Action Item)
1:00 p.m. Private School 2008-09 Approval (Action Item) Mr. Jack Schuster, Board Lead Dr. Kathe Taylor, Policy Director 1:20 p.m. Reflections and Next Steps from the Board Meeting 1:30 p.m. Adjourn PLEASE NOTE: Times above are estimates only. The Board reserves the right to alter the order of the agenda. For information regarding testimony, handouts, other questions, or for people needing special accommodation, please contact Loy McColm at the Board office (360-725-6027). This meeting site is barrier free. Contact during the meeting is: Shelly Moos at 509-544-5785.

Executive Summary
Draft Recommendations for a New State Accountability Index
State Board of Education System Performance Accountability
September 24, 2008
Pete Bylsma, EdD, MPA

CREATING THE ACCOUNTABILITY INDEX
The legislature requires the State Board of Education to develop a statewide accountability system to
identify schools and districts for recognition and further support. To meet this requirement, the
Board has developed an accountability index to sort schools and districts into different “tiers” based
on multiple measures. Schools and districts in most need have “Priority” status and are eligible to
receive more significant support. These Priority schools and districts would be required to
participate in a state system of support if initial offers of additional support were not accepted and
substantial improvement does not occur after two years.
Several principles guided the development of the system. Stakeholders believe the accountability
system should: (1) be transparent and simple to understand, (2) use existing data, (3) rely on multiple
measures, (4) include assessment results from all grades and subjects tested statewide, (5) use
concepts of the federal No Child Left Behind Act (NCLB) and its Adequate Yearly Progress (AYP)
system when appropriate, (6) encourage the improvement of student learning and cooperation
among educators, (7) be fair, reasonable, and consistent, (8) be valid and accurate, (9) focus at both
the school and district levels, (10) apply to as many schools and districts as possible, (11) use
familiar concepts when possible, (12) rely mainly on criterion-referenced measures instead of norm-
referenced measures; and (13) provide multiple ways to demonstrate success and earn recognition.
The proposed index is based on how schools and districts perform on a set of five outcomes and four
indicators. The five outcomes are the results of state assessments in four subjects (reading, writing,
mathematics, science) and the “extended” graduation rate (for high schools and districts). These five
outcomes are examined using four indicators (1) achievement, (2) achievement compared to similar
schools (controlling for the level of students who are English language learners, have a disability,
live in a low-income family, and are mobile), (3) improvement, and (4) achievement of students
from low-income families. The results of the 20 measures form a matrix as shown in Table 1.
Table 1: Accountability Matrix
OUTCOMES INDICATORS Reading Writing Math Science Grad Rate Achievement Ach. vs. peers Improvement Ach. of low-inc.
Each cell of the matrix is rated on a 5-point scale (0-4) using fixed benchmarks, with 4 being the best
outcome. Each of the four subjects is rated using the same set of benchmarks across the entire school
(i.e., all subjects have the same set of benchmarks and the assessment results are the aggregate totals
for all the tested grades). The index is the simple average of all 20 ratings. The index ranges from 0.0
to 4.0 and is a number similar to a GPA where 4.0 is the highest score (the higher the index, the better
the level of performance). Table 2 shows the four indicators, how the five outcomes are measured,
and the benchmarks that produce the various ratings. Tier assignments are determined based on the
index score. Schools and districts would fall into four tiers, with an in-depth analysis of the data and
conditions of those in the lowest tier to see if they merit being placed in a fifth (Priority) tier.

Table 2: Measures and Rating System for Multiple Indicators and Outcomes
Indicator
How Outcomes Are Measured
Benchmarks and Ratings Assessments1 Graduation2
Achievement Assessments: Percentage of “all” students
meeting standard on the WASL/WAAS for all
grades assessed
Graduation: Extended graduation rate for “all”
students
86-100% ......... 4
70-85.9% ........ 3
55-69.9% ........ 2
40-54.9% ........ 1
< 40% ............. 0
> 95% ............. 4
85-94.9% ........ 3
75-84.9% ........ 2
65-74.9% ........ 1
< 65% ............. 0
Achievement
compared to
peers3
Assessments: Learning Index of “all” students
adjusted for student characteristics (percent of
low-income, ELL, special education, and
mobile students4) for all grades assessed
Graduation: Extended graduation rate adjusted
for student characteristics (percent low-income,
ELL, special education, and mobile students4)
> .20 ................ 4
.10 to .20 .......... 3
-.099 to .099 .... 2
-.20 to -.10 ...... 1
< -.20 .............. 0
> 12 ................ 4
5.01 to 12 ....... 3
-5 to 5 .............. 2
-5.01 to -12 .... 1
< -12 ............... 0
Improvement Assessments: Change in the Learning Index
from the previous year using results for all
grades assessed
Graduation: Percentage point change in the
extended graduation rate from the previous year
> .12 ................ 4
.051 to .12 ....... 3
-.05 to .05 ....... 2
-.051 to -.12 ..... 1
< -.12 .............. 0
> 6 .................. 4
3.01 to 6 ......... 3
-3 to 3 ............. 2
-6 to -3.01 ...... 1
< -6 ................. 0
Achievement
of low-income
students
Assessments: Percentage of low-income
students meeting standard on the
WASL/WAAS for all grades assessed
Graduation: Extended graduation rate for all
low-income students
86-100% ......... 4
70-85.9% ........ 3
55-69.9% ........ 2
40-54.9% ........ 1
< 40% ............. 0
> 95% ............. 4
85-94.9% ........ 3
75-84.9% ........ 2
65-74.9% ........ 1
< 65% ............. 0 1 The same assessment ratings are used for all subjects in all grades. 2 This outcome only applies to schools that are authorized to graduate students. 3 This indicator adjusts the outcomes using statistical methods (multiple regression) to control for student
characteristics beyond a school’s control. Scores are the difference between the school’s actual level and the
average of the school’s peers. Scores above 0 are “beating the odds” and negative scores are below the predicted
level. Separate analyses are conducted for the four assessments in elementary, middle, and high schools. 4
Mobility is the percentage of students not continuously enrolled from October 1 through the testing period.
INITIAL RESULTS
Table 3 shows the suggested ranges of for the tier assignments and the number of schools and
districts that would have been placed in each tier in 2007 using the above criteria. Table 4 provides
an example of the ratings for an actual high school and how the average of the individual ratings
generates the index/tier assignment.1 The school’s average rating of 1.65 is the index score, which
puts the school in the middle of the “adequate” tier. The index is shown graphically relative to the
entire continuum. Tiers and average ratings are color-coded to correspond with the colors used for
the WASL levels shown on the OSPI Web site. A set of “stars” indicate the rating so the overall
results can be seen at a glance. These types of results could be made public on the Web site (the
format for presenting the results must still be determined). Results presented in this “dashboard”
1 The school is located in a medium-sized suburb of a large city with fewer low-income students than the average high
school.

give policymakers, educators, and the public a quick snapshot of where a school is strong and weak,
its overall rating, and where it falls within the tier. It also provides transparency about how the index
number is determined.
Table 3: Tier Ranges and Preliminary Results (2007)
Tier Index
Range Percent of
Schools Percent of
Districts
Exemplary 3.00 – 4.00 4% 1%
Good 2.00 – 2.99 32% 35%
Adequate 1.00 – 1.99 51% 59%
Struggling 0.00 – 0.99 13% 5%
Priority (eligible for Innovation Zone)1 0.00 – 0.99 TBD TBD 1 Those in this tier would be determined after an in-depth analysis of their data and local conditions.
Table 4: “Actual” High School, 2007
Indicator Reading Writing Math Science Grad Rate Average
Achievement 3 3 1 0 3 2.00 Ach. vs. peers 1 1 1 1 3 1.40 Improvement 0 2 0 2 4 1.60 Low-inc. ach. 2 2 0 0 4 1.60
Average 1.50 2.00 0.50 0.75 3.50 1.65
Achievement *** *** * ***
Ach. vs. peers * * * ***
Improvement * ** ****
Low-inc. ach. ** ** ****
The proposed system holds districts accountable using the same indicators, outcomes, and criteria
that are used for schools. The results are based on districtwide data for all grades rather than being
disaggregated by grade bands (elementary, middle, high). In addition, financial data are used in the
“peers” indicator to control for the amount of total operating revenue per pupil available (adjusted
for student need). A deeper analyses would occur for districts that have an index number in the
“struggling” tier to determine if they merit receiving extra support, just like the process used for
schools.
Other tables and charts can illustrate school and district results as well. Table 5 shows how all the
results can be shown across multiple years for a hypothetical district (data in shaded cells are not
available). In addition, Figure 1 shows the distribution of the number of schools by tier for an actual
district.
0 1 2 3 4
Actual
High School Worse Better
Struggling Adequate Good Exemplary

Table 5: Showing Longitudinal District Results (All Grades)
Indicator/Outcome YEAR Achievement 2004 2005 2006 2007 Reading ** *** *** ***
Writing ** ** ** ***
Math * * * **
Science
Grad. rate ** ** **
Ach. vs. peers Reading ** ** ** **
Writing ** ** ** **
Math ** ** ** **
Science ** ** ** **
Grad. rate ** ** **
Improvement Reading **** **** ** **
Writing *** **** **
Math **** *** ** **
Science *** *** ** **
Grad. rate *** *
Low-income ach. Reading * ** ** **
Writing * * ** **
Math *
Science
Grad. rate * * *
INDEX 1.73 1.84 1.80 1.75
Figure 1: Distribution of Schools by Grade Level and Tier in “Actual” District
6
1
2
4
3 1
1
0
3
6
9
12
Elementary Middle/Jr Hi High
Nu
mb
er
of
sc
ho
ols
Exemplary
Good
Adequate
Struggling

The proposed system does not include AYP results generated for NCLB. Feedback from all the
stakeholders revealed a lack of confidence in the validity of AYP results for accountability purposes.
The proposed system is not only more valid and transparent for accountability purposes, but it is
more inclusive than the federal system because it includes both writing and science, uses a smaller
minimum number for reporting (10 students across the entire school/district), and includes the
results of all students, regardless of how long they have been attending school or district. However,
AYP results would still be used as one source of data to identify Priority schools and districts once
the initial index is calculated.
IDENTIFYING “PRIORITY” SCHOOLS AND DISTRICTS (LOWEST TIER)
Various quantitative and qualitative data will be used to determine which schools and districts that
fall in the “struggling” tier should be placed in the “Priority” tier and be eligible to receive more
significant support. The data fall in four categories.
Contextual Data: Type of school
Changes in student population
Programs served by the school
Level of student mobility
WASL/WAAS Results
Trends over multiple years for each subject area
Subgroup trends
Results for students who have been enrolled for at least two years
AYP Results:
Distance from the annual goal
Type of cells not making AYP
Percentage of cells not making AYP
Other Data:
Graduation and dropout rates for subgroups
Student/teacher ratio
Teacher education and experience levels
Funding from local levies/bonds and outside sources
Recent changes in leadership (key central office staff and principals) and teachers
The process would begin when OSPI computes the index using the most recent data and prepares a
set of preliminary results. Given the relatively large number of schools that may fall into the
“struggling” tier,2 the schools must be screened to eliminate those that clearly should not fall into the
Priority tier, which would reduce the number of schools and districts that require a deeper analysis.
OSPI staff would review the index results for each school and district in the “struggling” tier and
sort them into two categories:
(1) Schools/districts that are Not for Priority designation are those that have not been in the
“struggling” tier in the past two years or have obvious data problems that affected their results
(e.g., errors in reporting the number of graduates, missing data for ELL, special education, and low
income students that can affect the results of the “peers”).
(2) The remaining schools/districts are placed in a Possible Priority tier category pending a deeper
analysis.
2 The number will still be far fewer than those not making AYP or identified for “improvement” under NCLB.

OSPI staff will conduct a deeper analysis available data for the schools and districts placed in the
possible Priority tier category. This may require contacting the district and/or local ESD to get more
information. Based on this review, the schools and districts are sorted again into the same two
categories. Those placed in the possible Priority tier are notified of the possible designation and
given the reasons why designation is possible. The district/school is given a chance to avoid the
Priority designation by providing more information that would explain the low index results, and it
could provide more favorable results and information on any plans being made to address the
shortcomings. Appeal would then be made with school board approval. OSPI would review the
additional information, and then recommend a final Priority list to the State Board of Education for
review and approval.
INTEGRATING THE SYSTEMS
Federal law requires states to have a single accountability system. Many states combine their state
accountability system with the federal NCLB system. Washington state can pursue two options to
meet this requirement.
1. The preferred approach is to request that the state system be used in place of the current federal
system. A new administration may provide more flexibility to states that design alternative
systems. The proposed system has many desirable features that could make it a viable
alternative to the current rules used to measure AYP.
2. If Washington is not allowed to use the proposed system to replace the current AYP system, the
results of the calculations from the two systems could still be used when determining the type
of assistance the state provides. Those in “improvement” status under AYP would still face the
required sanctions. However, schools that do not make AYP and fall into school improvement
may also achieve relatively favorable index results. In these cases, the amount of assistance the
state provides would be minimal. Some schools will make AYP and not be in school
improvement but still have relatively low index results. This happens most often in small
schools that have less than 30 continuously enrolled students in a grade band. In these cases,
state funds could be used to focus assistance in areas of greatest need.
If two systems coexist, the state must be sure to clarify what happens when schools and districts fall
into the various AYP categories and state tiers, and it must try to minimize confusion that could
occur about the two ways for measuring accountability.
RECOGNITION
The accountability system should provide multiple ways to demonstrate success and earn
recognition, and it should also rely mainly on criterion-referenced measures. The proposed
recognition system uses the results from the accountability matrix and provides recognition in each
of the 30 cells of the matrix: the 20 “inner” cells of the matrix, the average of the four indicators and
five outcomes, and the overall index. A minimum rating of 3.00 is required to receive recognition in
the 20 “inner” cells, and a minimum of 2.75 rating is needed to receive recognition for the
“averaged” cells (see Table 6). Any cell with a 3.5 or above would receive recognition “with
honors.” The ratings will be calculated every year, and recognition is given when the two-year
average rating meets the minimum requirement. This ensures that recognition is given for sustained
exemplary performance.

Table 6: Minimum Requirements for Recognition**
Indicator Reading Writing Math Science Grad Rate Average
Achievement 3.00 3.00 3.00 3.00 3.00 2.75
Ach. vs. peers 3.00 3.00 3.00 3.00 3.00 2.75
Improvement 3.00 3.00 3.00 3.00 3.00 2.75
Low-inc. ach. 3.00 3.00 3.00 3.00 3.00 2.75
Average 2.75 2.75 2.75 2.75 2.75 2.75
**Any cell of the matrix with a 2-year average rating of 3.50 or above would be recognized “with honor.”
Figure 2 shows how many of the 2,046 schools would have received awards if the proposed system
was in place in 2007. The largest number of schools would have received recognition in just one or
two of the 30 areas, and 16% would not have received any recognition. At the other extreme, about
14% of schools would have received recognition in 10 or more areas, and 2 schools would have
received recognition in 22 of the 30 cells of the matrix. The largest number of schools (52% of 2,046
schools) met the criteria for reading achievement. Achievement in math, science, and among low-
income students had fewer schools meeting the criteria. Only 4% had an overall average of 2.75 on
the accountability index over the 2-year period.
Figure 2: Number of Schools of Distinction, by Number of Recognitions (2007)
0
50
100
150
200
250
300
350
0 1 2 3 4 5 6 7 8 9 10 11 12 13 14 15 16 17 18 19 20 21 22
Nu
mb
er
of
sch
oo
ls
Number of recognitions at a school
This system of recognition would supplement and could replace some types of recognition currently
in place. The federal government provides funding for three awards, primarily for schools receiving
Title I funds. OSPI also provides awards but no funding as part of the recognition. Schools and
districts that receive recognition in the proposed system would not be compensated monetarily,
although exceptions could be made. In its compensation proposal to the Basic Education Finance
Task Force, OSPI recommended that schoolwide financial rewards be given each year when a
school reaches a certain level of improvement. The improvement dimension of the proposed
recognition system could be used as a basis for these rewards. For example, schools that have an
average of at least 3.0 for overall improvement could be given a schoolwide financial bonus. In
2007, about 8% of the schools statewide would have qualified for this bonus.
The proposed accountability system will need to remain flexible to adapt to changes in NCLB and
graduation requirements, the assessment system, and other factors that may impact the results.

Draft Recommendations for a New State Accountability Index
State Board of Education System Performance Accountability
September 24, 2008
Pete Bylsma, EdD, MPA

TABLE OF CONTENTS
Background 2 Accountability Index 3 District Accountability 7 Identifying Priority Schools and Districts (Lowest Tier) 10 Integrating the Systems 12 Recognition 13 Appendix A – Indicators and Outcomes 19 Appendix B – Identifying Priority Schools and Districts 33 Appendix C – Current State Assistance Program 36 Appendix D – Advisory Group Members 37

BACKGROUND The legislature requires the State Board of Education to develop a statewide accountability system. Part of that requirement is to identify schools and districts for recognition and for receiving additional state support. To meet this requirement, the Board is developing an accountability index to sort schools and districts into different “tiers” based on multiple factors. The Board hired Pete Bylsma, an independent consultant, to work with a set of advisors to develop the proposed index for Board review and to identify data that could be used that would help identify “Priority” schools and districts in most need. (Mass Insight is designing a system to support the schools and districts in most need, and this system will be aligned with the system of support that OSPI offers.) This document provides the initial recommendations for the index and information about identifying Priority schools and districts. The Board plans to present a proposal to the 2009 Legislature. A number of principles guided the development of the system. These include the principles the Board adopted in previous meetings (in bold) and others that reflect feedback about the system and advice from the advisors. Specifically, the accountability system should: • Be transparent and simple to understand; • Use existing data; • Rely on multiple measures; • Include assessment results from all grades (3-8, 10) and subjects tested statewide
(reading, writing, mathematics, science); • Incorporate concepts of the federal No Child Left Behind (NCLB) Act and its
Adequate Yearly Progress (AYP) system when appropriate; • Encourage the continuous improvement of student learning and cooperation among
educators; • Be fair, reasonable, and consistent; • Be valid and accurate; • Focus at both the school and district levels; • Apply to as many schools and districts as possible; • Use familiar concepts when possible; • Rely mainly on criterion-referenced measures instead of norm-referenced measures; and • Provide multiple ways to demonstrate success and earn recognition.
Three assumptions were made during the development of the index. • Priority schools and districts should be those that are the most challenged in the state –
they should meet a “common sense” test as those needing the most support. • Priority schools and districts would be eligible to receive additional resources to make
dramatic improvement in student outcomes through an initiative such as that being developed by Mass Insight. Criteria to be met to receive this support will be specified by the State Board of Education.
• Priority schools and districts would be required to participate in a state-supported initiative, as described by the system being designed by Mass Insight, if offers of additional support are not accepted and substantial improvement did not occur after two years.

ACCOUNTABILITY INDEX The proposed index is based on how schools and districts perform on a set of indicators and outcomes. The recommended system uses a matrix of five outcomes and four indicators. The five outcomes are: the results of state assessments in four subjects (reading, writing, mathematics, science) and the “extended” graduation rate (for high schools and districts). These five outcomes are examined using four indicators: (1) achievement, (2) achievement compared to peer schools (this controls for four student characteristics—special education, ELL, low income, and mobility), (3) improvement, and (4) achievement of students from low-income families. This results in 20 different measures, forming a matrix noted in Table 1. Table 1: Accountability Matrix OUTCOMESINDICATORS Reading Writing Math Science Grad RateAchievement Ach. vs. peers Improvement Ach. of low-inc.
Each cell of the matrix is rated on a 5-point scale (0-4) using a set of fixed benchmarks. These benchmarks reflect the performance in each cell, with 4 being the best outcome. Each of the four subjects is rated using the same set of benchmarks across the entire school (i.e., all subjects have the same set of benchmarks and the assessment results are the aggregate totals for all the tested grades). The index is the simple average of all 20 ratings. The higher the index, the better the level of performance of the school or district. Table 2 shows the four indicators, the five outcomes, and the benchmarks that produce the various ratings. The index ranges from 0.0 to 4.0 and is a number similar to a GPA where 4.0 is the highest score. This numbering scheme also reflects the same system used to describe the levels of performance on the WASL (Levels 0-4). The Learning Index is used to measure the assessment outcome for two indicators: achievement compared to peer schools and improvement . This index (not to be confused with the accountability index) takes into consideration the percentage of students performing at the five different WASL levels, not just those meeting standard. The Learning Index ranges from 0 to 4, with 4.00 the highest score (similar to a grade point average). This index is explained in detail in Appendix A. The proposed system does not include AYP results generated for NCLB. AYP results were included in a previous proposal, but feedback from the advisors, members of the Board, and other stakeholders showed a lack of confidence in the validity of AYP results for accountability purposes. The proposed system is more inclusive than the federal system because it includes both writing and science, uses a smaller minimum number for reporting (10 students across the entire school/district), and includes the results of all students, regardless of how long they have been attending school. Nevertheless, various stakeholders believe AYP results still have a role in the state accountability system because (1) the law will likely remain in effect for several more years and AYP results must be calculated, (2) the disaggregation of results by subgroups provides additional details that provide deeper insights into the level of student learning taking place in schools and districts and at individual grade levels, and (3) federal law requires a single accountability system, which

means AYP results need to be included in some way. As a result, the proposed system uses AYP results as one source of data to identify Priority schools and districts once initial index numbers are computed. Table 2: Measures and Rating System for Multiple Indicators and Outcomes Indicator
How Outcomes Are Measured
Benchmarks and Ratings Assessments1 Graduation2
Achievement • Assessments: Percentage of “all” students meeting standard on the WASL/WAAS for all grades assessed
• Graduation: Extended graduation rate for “all” students
86-100% ......... 4 70-85.9% ........ 3 55-69.9% ........ 2 40-54.9% ........ 1 < 40% ............. 0
> 95% ............. 485-94.9% ....... 3 75-84.9% ....... 2 65-74.9% ....... 1 < 65% ............. 0
Achievement compared to peers3
• Assessments: Learning Index of “all” students adjusted for student characteristics (percent of low-income, ELL, special education, and mobile students4) for all grades assessed
• Graduation: Extended graduation rate adjusted for student characteristics (percent low-income, ELL, special education, and mobile students4)
> .20 ............... 4 .10 to .20 .......... 3 -.099 to .099 .... 2 -.20 to -.10 ...... 1 < -.20 .............. 0
> 12 ................ 45.01 to 12 ....... 3 -5 to 5 .............. 2 -5.01 to -12 .... 1 < -12 ............... 0
Improvement • Assessments: Change in the Learning Index from the previous year using results for all grades assessed
• Graduation: Percentage point change in the extended graduation rate from the previous year
> .12 ............... 4 .051 to .12 ....... 3 -.05 to .05 ....... 2 -.051 to -.12 ..... 1 < -.12 .............. 0
> 6 .................. 43.01 to 6 ......... 3 -3 to 3 ............. 2 -6 to -3.01 ...... 1 < -6 ................. 0
Achievement of low-income students
• Assessments: Percentage of low-income students meeting standard on the WASL/WAAS for all grades assessed
• Graduation: Extended graduation rate for all low-income students
86-100% ......... 4 70-85.9% ........ 3 55-69.9% ........ 2 40-54.9% ........ 1 < 40% ............. 0
> 95% ............. 485-94.9% ....... 3 75-84.9% ....... 2 65-74.9% ....... 1 < 65% ............. 0
1 The same assessment ratings are used for all subjects in all grades. 2 This outcome only applies to schools that are authorized to graduate students. 3 This indicator adjusts the outcomes using statistical methods (multiple regression) to control for student
characteristics beyond a school’s control. Scores are the difference between the school’s actual level and the average of the school’s peers. Scores above 0 are “beating the odds” and negative scores are below the predicted level. Separate analyses are conducted for the four assessments in elementary, middle, and high schools.
4 Mobility is the percentage of all students that are not continuously enrolled from October 1 through the testing period, as defined by in OSPI’s Core Student Record System.
Tier assignments are determined based on the index score. Schools and districts would initially fall into four tiers based on their accountability index score, with an in-depth analysis of the data and conditions of those in the lowest tier to see if they merit being placed in a fifth (Priority) tier and be eligible to receive more intensive support. A 5-tier system provides sufficient differentiation among schools and districts and corresponds with the numbering of the index system.

Table 3 shows the suggested ranges for the 5-tier system. A suggested descriptive name is given for each tier rather than a numeric designation to avoid confusion about what tier numbers mean. The rating and tier information could be available in a “report card” available to the public, with a set of “stars” indicating the rating so the overall results can be seen at a glance. This intuitive rating symbolism is used in other settings (e.g., rating movies, restaurants, athletes, tourist attractions) and does not require much interpretation. The table also shows the distribution of schools using the criteria shown in Table 2 and data from 2007. A total of 2,046 schools had an index score. Figure 1 shows the index distribution for the 2,046 schools in the analysis. There was little difference in the distribution of schools based on their grades served (i.e., elementary, middle, high). Table 3: Tier Ranges and 2007 Results (N=2,046)
Tier/Suggested Name Index Range
Number of Schools
Percent of Schools
Exemplary 3.00 – 4.00 72 3.5% Good 2.00 – 2.99 664 32.5% Adequate 1.00 – 1.99 1,043 51.0% Struggling 0.00 – 0.99 2672 13.0% Priority (eligible for Innovation Zone)1 0.00 – 0.99 TBD TBD
1Schools and districts in the lowest tier would be determined after an in-depth analysis of quantitative and qualitative information.
2Of these schools, 103 (39% of this group) were alternative schools or served other special populations. There were about 83,000 students enrolled in the schools in this tier in 2007 (about 8.3% of all students statewide). About 70,000 students attended “regular” schools that were in this tier.
Figure 1: Distribution of Schools by Index Score**
0. 00 1. 00 2. 00 3. 00
A ccount ability Inde x (Rating Ave r age )
0
50
10 0
15 0
Num
ber o
f sch
ools
Mean = 1.81
** All the schools with an index of 0.00 served special populations (correctional facilities, alternative schools, dropout recovery programs), and most had fewer than 10 assessed students so their results would not be reported. The lowest index for a regular school was 0.13, but this school made substantial gains in 2008.

Tables 4 and 5 give examples of how the individual ratings generate the index/tier assignment for two actual schools using results available from 2007. The schools’ final index is shown graphically relative to the entire continuum. The tiers and average ratings are noted in colors that correspond to the colors used for the WASL levels on the OSPI Report Card. The results could be made public as part of the OSPI Report Card (the format of the presentation must still be determined). Results presented in this type of “dashboard” give policymakers, educators, and the public a quick snapshot of where a school is strong and weak, its overall rating, and where it falls within the tier. It also provides transparency about how the index number is determined.
• The high school described in Table 4 is located in a medium-sized suburb of a large city with fewer low-income students than the typical high school in the state. Its WASL scores had been about the state average in most subjects but both reading and math scores dropped dramatically from 2006 levels. Like many high schools, it has low math and science scores. It also has lower scores than high schools serving similar students, and the performance of its low-income students was below that of “all” students in four subjects. Its graduation rate is fairly high, even when compared to its peers, the rate improved substantially from the previous year, and surprisingly, low-income students had a higher rate than the “all” students rate. Its index of 1.65 puts it close to the middle of the “adequate” tier, which is probably worse than educators and community members expected.
• The elementary school described in Table 5 is located in a medium-sized city with above-average levels of low-income, ELL, and mobile students. Its WASL scores are well above the state average in several grades but below the state average in one grade. It had sharp declines from very high WASL scores the previous year, resulting in low improvement ratings in 3 subjects. Its reading and writing scores are still quite high and its scores are very high compared to schools serving similar students. Low-income students had the same rating as “all” students in three subjects but were lower in writing. The graduation rate does not apply. Its index of 2.13 is slightly above the middle of the index scale and in the lower end of the “good” tier.
Table 4: “Actual” High School, 2007 Indicator Reading Writing Math Science Grad Rate Average Achievement 3 3 1 0 3 2.00 Ach. vs. peers 1 1 1 1 3 1.40 Improvement 0 2 0 2 4 1.60 Low-inc. ach. 2 2 0 0 4 1.60 Average 1.50 2.00 0.50 0.75 3.50 1.65
Achievement *** *** * ***Ach. vs. peers * * * ***Improvement * ** ****Low-inc. ach. ** ** ****
0 1 2 3 4
Worse Better
Struggling Adequate Good Exemplary

Table 5: “Actual” Elementary School, 2007 Indicator Reading Writing Math Science Grad Rate Grad Rate Average Average Achievement 3 3 2 0 2.00 Ach. vs. peers 4 4 4 3 3.75 Improvement 0 2 1 1 1.00 Low-inc. ach. 3 2 2 0 1.75 Average 2.50 2.75 2.25 1.00 2.13
Achievement *** *** ** Ach. vs. peers **** **** **** ** Improvement * ** * Low-inc. ach. *** ** **
0 1 2 3 4
Worse Better
Struggling Adequate Good Exemplary DISTRICT ACCOUNTABILITY The proposed system would hold districts accountable using the same rules, indicators, and outcomes that are used for school accountability. The results would be based on districtwide data for all grades rather than being disaggregated by grade bands (elementary, middle, high). District results are more likely to be made public when using the combined results for all grades—only five extremely small districts, with a combined total of 34 students, had fewer than 10 students in their tested grades in 2007. Financial data, which is available only at the district level on a consistent basis, is used as an additional independent variable in the district-level regression to control for the amount of total operating revenue per pupil available to the district. The same type of deeper analyses would occur for districts that have an index number in the lowest tier in order to determine if they merit receiving extra support, just like the process used for schools.1 This closer look would also include examining the percentage of schools and number of students that are found in the lowest tier and the consistency of problems in a particular set of grade bands or subjects. Since more information is available at the district level, district accountability could include additional measures besides the 20 in the matrix. Moreover, other data could be used when analyzing districts and their peers, such as unemployment rates, crime rates, per capita income, and tax base if this information is available at the district level. Various tables and charts can illustrate the district results. Table 6 and Figure 2 show how all the results for a district can be shown across multiple years to show trends over time. (State results are used, and the data in shaded cells of the table are not available.) Figure 3 shows the distribution of the number of schools by tier for an actual district. Figure 4 shows the percentage of students enrolled at those schools. (One alternative high school has relatively few students.)
1 Districts are not required to have an improvement plan unless they are in district improvement. The State Board could require districts to have such a plan, just like schools. A review of the district plan (its quality and use) could be part of the more intensive analysis of district conditions.

Table 6: Showing Results Over Time (All Grades) YEAR Indicator/Outcome 2003 2004 2005 2006 2007Achievement 1.25 1.25 1.60 1.60 2.00 Reading ** ** *** *** *** Writing ** ** ** ** *** Math * * * * ** Science Grad. rate ** ** **
Ach. vs. peers1 2.00 2.00 2.00 2.00 2.00 Reading ** ** ** ** ** Writing ** ** ** ** ** Math ** ** ** ** ** Science ** ** ** ** ** Grad. rate ** ** **
Improvement 2.50 3.67 3.25 2.60 1.80 Reading ** **** **** ** ** Writing *** **** ** Math *** **** *** ** ** Science *** *** ** ** Grad. rate *** * Low-income Ach.2 0.50 0.80 1.00 1.20 Reading * ** ** ** Writing * * ** ** Math * Science Grad. rate * * * Account. Index 1.73 1.84 1.80 1.75
1This indicator does not apply in this example because the state has no peer, so a middle rating is given in each year for all outcomes. 2Student counts for subgroups are not available for 2003, so no rating was determined and no index is calculated. Figure 2: Average Ratings, 2003-2007
0.00
0.50
1.00
1.50
2.00
2.50
3.00
3.50
4.00
Achievement Ach. vs. peers Improvement Low‐income Ach.
Account. Index
2003 2004 2005 2006 2007
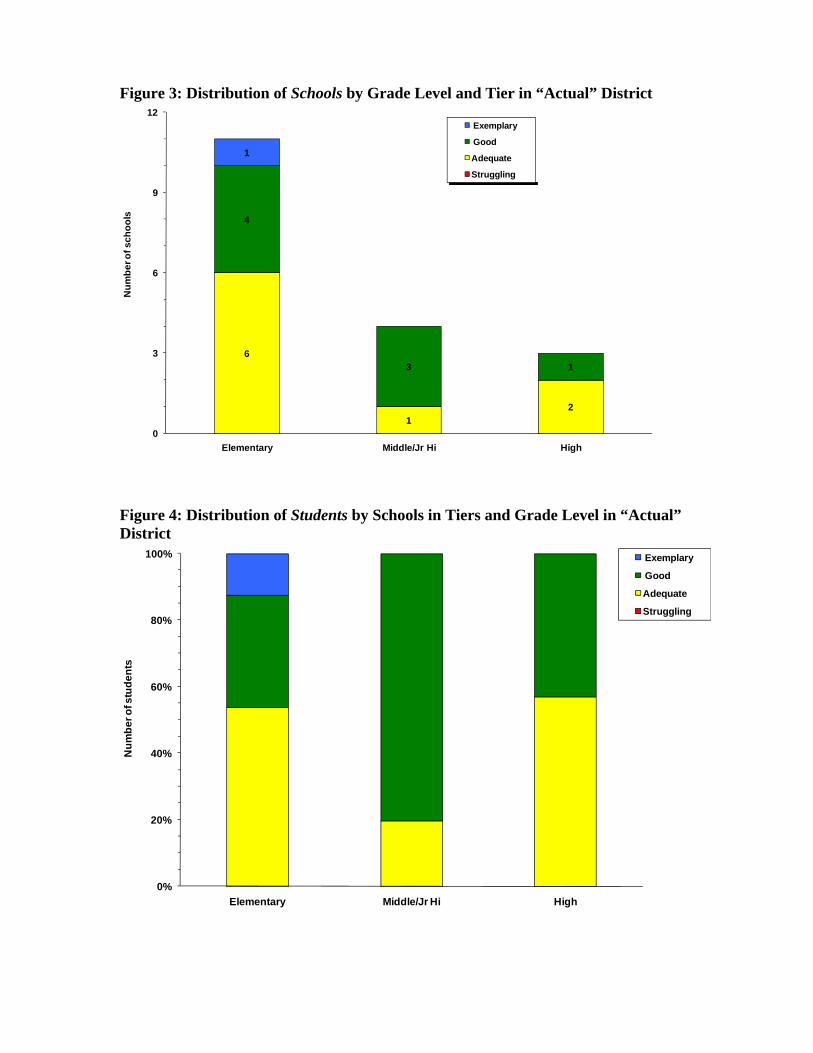
Figure 3: Distribution of Schools by Grade Level and Tier in “Actual” District
6
12
4
3 1
1
0
3
6
9
12
Elementary Middle/Jr Hi High
Num
ber o
f sch
ools
Exemplary
Good
Adequate
Struggling
Figure 4: Distribution of Students by Schools in Tiers and Grade Level in “Actual” District
0%
20%
40%
60%
80%
100%
Elementary Middle/Jr Hi High
Num
ber o
f stu
dent
s
Exemplary
Good
Adequate
Struggling

Table 7 shows the district results using the same criteria and rating system used for schools. Districts are more tightly clustered in the distribution than schools, with fewer districts in the top and bottom tiers (see Figure 5).2 Figure 6 provides a different view of the district index results. Of the 16 districts in the “struggling” tier, the average size was about 1,000 students (the median was slightly more than 400 students). Half of the 16 districts made AYP in part because the AYP targets were relatively low in 2007, the margin of error is large for small districts, and many of the student groups in the smaller districts had fewer students than the required minimum to make a AYP determination. Table 7: Tier Ranges and 2007 Results for Districts (N=296)
Tier/Suggested Name Index Range
Number of Districts
Percent of Districts
Exemplary 3.00 – 4.00 3 1.0% Good 2.00 – 2.99 102 34.5% Adequate 1.00 – 1.99 175 59.1% Struggling 0.00 – 0.99 16 5.4% Priority (eligible for Innovation Zone) 0.00 – 0.99 TBD TBD
Figure 5: Distribution of Districts by Index Score
1. 00 2. 00 3. 00
Inde x, 2007
5
10
15
20
25
Num
ber o
f Dis
trict
s
Mean = 1.78
2 District results do not include several types of schools. For example, correctional institutions, tribal schools, contract schools, and schools serving more than 50% of students outside the district boundary. The aggregation rules using in these calculations are the same as those used by OSPI when calculating district results.

Figure 6: Distribution of All Districts by Index Score
0.00 0.50 1.00 1.50 2.00 2.50 3.00 3.50 4.00
IDENTIFYING PRIORITY SCHOOLS AND DISTRICTS (LOWEST TIER) The process for identifying Priority schools and districts would begin when OSPI computes the index in mid-August using the most recent data and prepares a set of preliminary results. Given the relatively large number of schools that may fall into the “struggling” tier,3 the schools must be screened to eliminate those that clearly should not fall into the Priority tier, which would reduce the number of schools and districts that require a deeper analysis. When OSPI and SBE staff are confident the index has been calculated correctly, OSPI staff review the index results for each school and district that falls in the “struggling” tier, and then sort them into two categories:
(1) Schools/districts that are Not for Priority designation are those that have not been in the “struggling” tier in the past two years or have obvious data problems that affected their results (e.g., errors in reporting the number of graduates, missing data for ELL, special education, and low income students that can affect the results of the “peers”). (2) The remaining schools/districts are placed in a Possible Priority tier category pending a deeper analysis.
OSPI staff will conduct a deeper analysis available data for the schools and districts placed in the possible Priority tier category. This may require contacting the district and/or local ESD to get more information. A comprehensive list of quantitative and qualitative data was developed that could be used to help determine which schools in the “struggling” tier should fall into the “Priority schools” tier (see Appendix B). Given the comprehensive nature of the list and the limited capacity to analyze all the data for every school and district in the “struggling” tier, the list was refined to determine which were the most important data to analyze. The data that would be initially reviewed at this exploratory phase fall into four general areas:
• Contextual Data: Type of school Changes in student population Programs served by the school Level of student mobility
• WASL/WAAS Results Trends over multiple years for each subject area Subgroup trends Results for students who have been enrolled for at least two years
• AYP Results: Distance from the annual goal Type of cells not making AYP Percentage of cells not making AYP
• Other Data: Graduation and dropout rates for subgroups Student/teacher ratio Teacher education and experience levels Funding from local levies/bonds and outside sources Recent changes in leadership (key central office staff and principals) and teachers
3 The number will still be far fewer than those not making AYP or identified for “improvement” under NCLB.

Based on this review, the schools and districts are sorted again into the same two categories—not for Priority designation and possible Priority tier. By the end of August, districts of schools placed in the possible Priority tier are notified of the possible designation and given the reasons why designation is possible. If required by federal law, this initial list would be made public. During the month of September, the district/school is given a chance to avoid the Priority designation by providing more information that would explain the low index results, and it could provide more favorable results (e.g., feeder school information, results of district assessments, personnel changes, type of interventions made to date) and any plans being made for the future. Any appeal needs to have school board approval. OSPI reviews the additional information, and by mid-October, it determines the schools and districts placed in the Priority tier. Figure 7 provides a flow chart of this process. Figure 7: Process for Identifying Priority Schools and Districts
OSPI staff sort schools and districts into two categories and develop rationale for those in the Priority tier
Not Priority
tier
Possible Priority
tier
OSPI notifies district of preliminary designation in Priority tier and the reasons for the designation by end of August, requests response/appeal information by end of September (appeal must have school board approval)
OSPI staff review information, decides by mid-October if school/district should be placed in Priority tier
OSPI notifies school/district in Priority tier and assistance available, prepares to provide assistance
Priority tier designations
OSPI recommends final Priority list to SBE for approval
OSPI calculates index for schools and districts in mid-August

INTEGRATING THE SYSTEMS Federal law requires states to have a single accountability system. Many states combine their state accountability system with the federal system described by NCLB. The details for integrating the federal and state system must still be determined. Washington state can pursue two options to meet this requirement.
1. The preferred approach is to request that the proposed system be used in place of the current system. A new administration may provide more flexibility to states to design alternative accountability systems and approve them if they meet certain requirements. The proposed system has many desirable features that could make it a viable alternative to the current rules used to measure AYP.
2. If Washington is not allowed to use the proposed system to replace the current AYP system, the results of the calculations from the two systems could still be used when determining the type and level of assistance the states provide. Those that fall into “improvement” status under AYP would still face the required sanctions. However, schools that do not make AYP and fall into school improvement may also achieve relatively favorable index results. In these cases, the amount of assistance the state provides would be minimal. On the other hand, some schools will make AYP and not be in school improvement, but they may have relatively low index results. In these cases, state funds could be used to focus assistance in areas of greatest need. Regardless of the results from the two systems, the state must be sure to clarify what happens when schools and districts fall into the various AYP categories and state tiers and make every effort to minimize confusion that could occur about the two ways for measuring accountability. Appendix C provides an overview of the current assistance system being used by OSPI to help schools and districts that are in “improvement” status. RECOGNITION Three of the guiding principles for developing the accountability system are to (1) provide multiple ways to demonstrate success and earn recognition, (2) rely mainly on criterion-referenced measures, and (3) simple to understand. The proposed recognition system is consistent with these principles. It will use the results from the accountability matrix and provide recognition in each of the 30 cells of the matrix: each of the 20 “inner” cells of the matrix, the average of the four indicators and five outcomes, and the overall index. A minimum rating of 3.00 is required to receive recognition in the 20 “inner” cells, and a minimum of 2.75 rating is needed to receive recognition for the “averaged” cells (see Table 8). Any cell with a 3.5 or above would receive recognition “with honors.” The ratings will be calculated every year, and recognition is given when the two-year average rating meets the minimum requirement. This ensures that recognition is given for sustained exemplary performance. Table 8: Minimum Requirements for Recognition Indicator Reading Writing Math Science Grad Rate Average Achievement 3.00 3.00 3.00 3.00 3.00 2.75 Ach. vs. peers 3.00 3.00 3.00 3.00 3.00 2.75 Improvement 3.00 3.00 3.00 3.00 3.00 2.75 Low-inc. ach. 3.00 3.00 3.00 3.00 3.00 2.75 Average 2.75 2.75 2.75 2.75 2.75 2.75

Table 9 and Figure 8 show how many of the 2,046 schools would have received awards if the proposed system was in place in 2007 (district results were not calculated). The largest number of schools would have received recognition in just one or two of the 30 areas, and 16% would not have received any recognition. At the other extreme, about 14% of schools would have received recognition in 10 or more areas, and 2 schools would have received recognition in 22 of the 30 cells of the matrix. Table 9: Number of Schools of Distinction, by Number of Recognitions (2007)
Number of recognitions
at a school Number of
schools Pct of all
schoolsCumulative
percent0 330 16.1% 16.1% 1 338 16.5% 32.6% 2 260 12.7% 45.4% 3 185 9.0% 54.4% 4 169 8.3% 62.7% 5 143 7.0% 69.6% 6 104 5.1% 74.7% 7 85 4.2% 78.9% 8 77 3.8% 82.6% 9 64 3.1% 85.8%
10 59 2.9% 88.7% 11 55 2.7% 91.3% 12 33 1.6% 93.0% 13 41 2.0% 95.0% 14 18 0.9% 95.8% 15 20 1.0% 96.8% 16 14 0.7% 97.5% 17 18 0.9% 98.4% 18 12 0.6% 99.0% 19 10 0.5% 99.5% 20 6 0.3% 99.8% 21 3 0.1% 99.9% 22 2 0.1% 100.0%
Figure 8: Number of Schools of Distinction, by Number of Recognitions (2007)
0
50
100
150
200
250
300
350
0 1 2 3 4 5 6 7 8 9 10 11 12 13 14 15 16 17 18 19 20 21 22
Num
ber o
f schoo
ls
Number of recognitions at a school

Table 10 shows the number of schools that met the recognition criteria in each area in 2007. The largest number of schools (52%) met the criteria for reading achievement. Achievement in math, science, and among low-income students had fewer schools meeting the criteria. Only 4% had an overall average of 2.75 on the accountability index over the 2-year period. Although schools would have received recognition in a total of 9,082 areas, this represents less than 15% of the total maximum possible (30 cells x 2,046 schools). Figure 9 shows the percentage of all schools that would have received each type of recognition. Table 10: Distribution of Schools of Distinction, by Type of Recognition (2007)
Type of Recognition# of “Schools
of Distinction”
# of “Schools of Distinction”
with Honor
Total # of schools
recognized Pct of all schools**
Reading achievement 727 330 1,057 51.7% Writing achievement 309 255 564 27.6%
Math achievement 204 60 264 12.9% Science achievement 37 9 46 2.2%
Ext. grad rate achievement 75 83 158 36.0% Subtotal, Achievement1 1,352 737 2,089
Reading improvement 135 100 235 11.5% Writing improvement 322 446 768 37.5%
Math improvement 230 209 439 21.5% Science improvement 286 265 551 26.9%
Ext grad rate improvement 54 50 104 23.7% Subtotal, Improvement1 1,027 1,070 2,097
Reading among peers 210 210 420 20.5% Writing among peers 221 254 475 23.2%
Math among peers 176 312 488 23.9% Science among peers 191 313 504 24.6%
Ext graduation rate among peers 46 46 92 21.0% Subtotal, Peers1 844 1,135 1,979
Low-income reading achievement 259 105 364 17.8% Low-income writing achievement 128 78 206 10.1%
Low-income math achievement 26 17 43 2.1% Low-income science achievement 5 4 9 0.4%
Low-income ext grad rate 38 61 99 22.6% Subtotal, Low Income1 456 265 721
Achievement overall 179 41 220 10.8% Improvement overall 297 29 326 15.9%
Achievement vs peers overall 311 125 436 21.3% Low-income achievement overall 30 7 37 1.8%
Reading overall 306 30 336 16.4% Writing overall 374 48 422 20.6%
Math overall 103 8 111 5.4% Science overall 33 6 39 1.9%
Grad rate overall 153 40 193 44.0% Accountability Index 75 1 76 3.7%
Total1 5,540 3,542 9,082 ** N=2046 for academic measures; N=439 for extended graduation rate measures 1 Duplicated count

Figure 9: Percentage of Schools of Distinction, by Number of Recognitions (2007)
0% 20% 40% 60% 80% 100%
Accountability Index
Grad rate overall
Science overall
Math overall
Writing overall
Reading overall
Low‐income achievement overall
Achievement vs peers overall
Improvement overall
Achievement overall
Low‐income ext grad rate
Low‐income science achievement
Low‐income math achievement
Low‐income writing achievement
Low‐income reading achievement
Ext graduation rate among peers
Science among peers
Math among peers
Writing among peers
Reading among peers
Ext grad rate improvement
Science improvement
Math improvement
Writing improvement
Reading improvement
Ext. grad rate achievement
Science achievement
Math achievement
Writing achievement
Reading achievement
Distinction w/ Honor

This system of recognition would supplement and could replace some types of recognition currently in place. The federal government provides funding for three types of awards, primarily for schools receiving Title I funds. OSPI also provides awards but no funding as part of the recognition.4 Schools and districts that receive recognition in the proposed system would not be compensated monetarily, although exceptions could be made. In its compensation proposal to the Basic Education Finance Task Force, OSPI has recommended that schoolwide financial rewards be given each year when a school reaches a certain level of improvement. The proposed recognition system could be used as a basis for these rewards. For example, schools that have an average of at least 3.0 for overall improvement could be given a schoolwide financial bonus. In 2007, about 8% of the schools statewide would have qualified for this bonus (15% of the districts averaged 3.0 or better in the improvement cells). The amount of the bonus suggested by OSPI was $20 to $50 per student FTE. Other types of recognition, with or without financial awards, could be developed. These could be available to all that meet certain criteria and/or be competitive in nature.
* * * * * *
The proposed accountability system needs to be flexible. Changes in NCLB requirements, graduation requirements, the graduation rate formulas, the assessment system, and content standards may have an impact on some measures, which may require changes to the system. And as data systems improve statewide and more information becomes available, other indicators could be added to the system and other more sophisticated analyses could be used (e.g., growth models). These changes could be in the form of additional columns in the matrix (e.g., college eligible rates) or additional factors outside the matrix that could be included when calculating the index (e.g., funding amount of local levies). Appendix A provides more details about how the index is calculated. Appendix B provides a list of possible data that could be used to identify Priority schools. Appendix C gives an overview of the current state assistance system that is funded primarily by the federal government. Appendix D lists the names of those who provided advise and feedback during the development of this proposal.
4 Blue Ribbon schools are nominated by OSPI and selected by the U.S. Department of Education based on high academic performance. In order to be selected, nominated schools must provide detailed information about their school, they can be any type of school (including private schools), and they must make AYP in the year of the nomination and the following year. For the Academic Achievement Award program, Title I Part A schools that met AYP for three consecutive years in math and/or reading can apply for recognition of improving student achievement in one or both content areas. Up to nine schools can receive an award of $10,000. The application provides details about successful math and/or reading strategies, and these strategies are showcased at state conferences and on OSPI’s website in order to assist other schools. For the Distinguished Schools Award, four Title I Part A schools are selected, two in the national category and two in the state category. Schools must apply for this award, which focuses on either exceptional student performance for two or more years or significant progress in closing the achievement gap. National award winners receive $10,000 while state award winners receive $5,000. OSPI began recognizing Schools of Distinction in 2007 based on improvement over an extended period of time and achievement that exceeds the state average. Only the top 5% of schools received this award. Finally, OSPI has been giving Improvement Awards since 2004 to schools and district that make at least a 10% reduction in the percentage of students not meeting standard in reading, writing, and math in grades 4, 7, and 10. Wall plaques with metal plates for updates are provided to those receiving this award. In 2007, there were 1,255 schools that received a total of 2,190 awards in the three grades and subjects; 241 districts that received a total of 804 awards in the three grades and subjects. OSPI does not provide any recognition or results based on how schools or districts compare to their peers.
APPENDIX A
INDICATORS AND OUTCOMES This appendix provides more detailed information about the proposed accountability index. It also includes information about how the indicators and outcomes were selected and how the index number is calculated. SELECTION OF INDICATORS AND OUTCOMES One of the guiding principles for the accountability system is the use of multiple measures. The advisors (see Appendix D) recommended using four indicators and five outcomes, resulting in a 4x5 matrix with 20 outcomes. Other indicators and outcomes were discussed besides the WASL and graduation rates, and other outcome data were desired in order to have multiple measures. However, no other reliable and accurate data are available statewide that is collected in the same manner. The index is achieved by using the simple average of the ratings across the 20 outcomes. The graduation rate is not applicable for elementary and middle schools, but these types of schools have multiple grades with WASL results that generate the ratings. By using averages, schools without data for some indicators are still included in the system and a separate system is not needed for different types of schools to generate the index. The advisors preferred a system that uses fixed criteria rather than norm-referenced measures in order to keep the measures simple and to avoid changing goals over time and the use of measures (e.g., standard deviations) that vary by subject. This means that recognition would be given when schools meet certain criteria, and there would not be a limit to how many schools can be recognized (unlike the Schools of Distinction which only recognized the top 5% based on improvement). With fixed criteria in place, a school and district would know in advance what it needed to do to receive recognition, regardless of how others perform. It would also encourage cooperation among educators because they would not be in competition with one another for recognition. The advisors discussed other types of analyses that could provide more accurate results (e.g., structural equation modeling, hierarchical linear modeling, value-added growth models). However, these methods were not selected because they lack transparency, are overly complex, and are not calculated easily at the school and district levels due to capacity and software limitations. All stakeholder groups believed the federal AYP system is not a valid way to identify schools for recognition and additional support. The advisors felt the current system is too complex, has too many adjustments, and is neither transparent nor fair in its accountability determinations. Moreover, AYP is almost entirely punitive in nature and does not include two subjects (writing and science) that are assessed in a standardized manner statewide, which has resulted in a narrowing of the curriculum. AYP’s narrow emphasis on students who meet standard has often resulted in more focused help being given to students that perform near that cut point (known as the “bubble kids”) and at the expense of students who are farther above and below that level of performance.

The proposed system is preferred because it is more inclusive and less complex than the federal AYP system. The ratings are based on the results for all students, including those who are not “continuously enrolled” since October 1. No margin of error is used, and the minimum N is 10 across the entire school/district (rather than a grade) in order to increase the chance that very small schools and districts (e.g., those with less than 10 students in a grade) are included in the accountability system. For example, a K-6 school that has only 4 students in each tested grade (grades 3-6) would have a total of 16 students with assessment results and would therefore be included in the system. (Grade-level results are not reported when there are fewer than 10 students in a grade in order to keep the results confidential.) Grade configurations are not an issue when calculating the results because the same benchmarks are used for each grade and subject (AYP uses grade bands of 3-5, 6-8, and 10 with separate results generated for each grade band, regardless of the school’s grade configuration). The current AYP system for holding districts accountable is even more complex than the school accountability system. It has different rules and sometimes produces results that are confusing and at odds with its school-level results (e.g., a district might not make AYP but all its schools do and vice versa). A district’s size is the major determinant in its AYP results—only two districts with fewer than 1,000 students are in improvement status. The proposed district accountability system is essentially the same as the system for schools, which makes it relatively easier to understand and compute. USING THE INDEX The results from the 20 ratings create an index number for each school and district based on the average rating. Schools and districts are assigned to a “tier” based on their index number. • Those with the highest index numbers, from 3.00 to 4.00, are in the “exemplary” tier. • Those with an index of 2.00 to 2.99 are in the “good” tier. • Those with an index of 1.00 to 1.99 are in the “adequate” tier. • Those with an index below 1.00 are in the “struggling” tier.
Schools should not be compared and judgments should not be made about school quality based solely on their overall index score. Even though the index uses multiple measures, some schools have missing data that can affect their index number. Moreover, schools that administer assessments with lower scores overall (e.g., science and math) will tend to have a lower index score than those that do not. For example, schools serving grades 5, 8, and 10 give the science WASL, and these results tend to be very low compared to the other subjects. So a K-4 school will likely have a higher index score than a K-5 or K-8 school. Schools serving very few students may have more volatile ratings from year to year. As a result, the index is only comparable across schools that serve the same grades. In addition, the index does not reflect how close a school may be to the benchmarks—small differences in results could still generate different ratings (e.g., 85%=3 and 86%=4). The lack of vertical alignment of the assessments presents another complicating factor when making comparisons across schools that serve different grade levels. Given the different types of schools being rating, school results should be reported for similar types of schools. The six suggested categories for reporting the results are as follows: • elementary schools (those serving from kindergarten up to grade 6) • middle/junior high schools (those serving only 6,7 or 8) • high schools (grades 9 or 10 to 12) • comprehensive schools (e.g., K-8, K-12)

• schools serving special populations (alternative schools, correctional facilities, those primarily serving ELL students and those with disabilities, private schools on contract)
• small schools (those which have their results suppressed because the y have fewer than 10 assessed students).
Many districts have only one school. As a result, their index, tier, and recognition would be the same. This has implications for how the state structures the consequences of the accountability system (either with assistance or recognition). The accountability system will need to remain flexible. Changes in NCLB requirements (e.g., number of tested grades), graduation requirements, the method for calculating the graduation rates, the assessment system (e.g., moving to end-of-course exams in math, adjustments to cut scores), and content standards (e.g., science) may have an impact on some measures, which may require adjustments to the accountability system. Moreover, as data systems improve statewide and more information becomes available, other indicators can be added to the system5 and other more sophisticated analyses could be used (e.g., growth models). Other measures of improvement could be used (computing expected change, percent increases). Changes could also be in the form of additional columns in the matrix (e.g., college eligible rates) or additional factors outside the matrix that could be included when calculating the index or peer results (e.g., funding amount of local levies). CALCULATION METHODS To calculate the achievement measures, student-level data were used and aggregated to the school and districts levels. This provides more accurate results than using aggregated school and district results. Moreover, using student-level data allows for the aggregation of results from the grade level that would be suppressed because the number of students assessed was less than 10. Results are only suppressed when there are fewer than 10 students assessed in the combined grades.6 Students who took the alternate assessments (WAAS) were included in the calculations, as were students who previously passed (this relates mainly to high school students that met standard while in grade 9, but it also applies to students that are retained). Students who met standard in a previous year did not have their level included in the student-level database, so they were considered to have performed at Level 3. Students who were exempted from taking the assessments (i.e., those with excused absences and medical exemptions, first-year ELL students, home-based and private school students) were not included in the calculations. When computing the index, all the ratings are counted equally (i.e., they are not weighted). Averages are computed only for cells of the matrix that had data (e.g., an elementary school has no graduation data, so the averages for the indicators used only the assessment outcomes). District results are based on OSPI’s aggregation rules, so the district results do not include results from correctional institutions, tribal schools, private schools or agencies 5 Most of the other outcomes relate to high schools and the transition to higher education. Some data require transcript information, such as AP enrollment, dual enrollment, and college-ready rates. Other data sources could provide information about college entrance exams, college going rates, and remediation rates in higher education institutions. 6 Very small schools (those with fewer than 10 assessed students) will have their index calculated but it will not be made public. However, the index will be viewed by state officials, and if the index is in the struggling tier on a consistent basis, the school could be placed in the Priority tier.

providing services, vocational schools/skill centers, schools that enroll more than 50% of their students from another district , and schools operated by a college or university that are not affiliated with a district. ACHIEVEMENT INDICATOR This indicator has five outcomes: the four subjects tested by the WASL/WAAS statewide (reading, writing, math, and science) and the extended graduation rate (see explanation on how the rate is calculated below). The measure used is the percentage of “all” students meeting standard. Unlike the AYP measure, this indicator is what is shown on OSPI’s online Report Card and does not reflect any adjustments (i.e., margin of error, continuous enrollment). The percent meeting standard includes both the results of the WASL and the WAAS, which is given to students with disabilities. These results are the combined total of the WASL and WAAS results found on the Report Card and are used when calculating AYP (without the margin of error and including students not continuously enrolled). For grade 10, only the first grade 10 attempt as reported in June of the tested year is used (this includes results for students who met standard in grade 9). Results from August assessments and retakes will be considered when looking at the “struggling” schools and districts to determine if they should be included in the Priority tier. This will recognize the districts that go to extra effort to help students who are in danger of not graduating unless they pass the required assessments. Subgroups results (for the various race/ethnicity groups, ELL, students with disabilities, gender) are used when examining the “struggling” schools and districts to determine if they should be included in the Priority tier. Results for low-income students are used in aggregate in a separate indicator described below. The Achievement benchmarks and ratings for each of the four assessed subjects and the extended graduation rate are as follows:
• Achievement on assessments is scored based on the following percentage of students meeting standard:
86-100% ............4 70-85.9% ...........3 55-69.9% ...........2 40-54.9% ...........1 < 40% ................0
• Achievement on the graduation rate is scored based on the extended graduation rate from the previous year (see below for more information on how the graduation rate is calculated):
> 95% ................4 85-94.9% ...........3 75-84.9% ...........2 65-74.9% ...........1 < 65% ................0

Students from all tested grades in a school are combined for each subject, and the percentage of these students that meet standard on their respective tests is the school’s percent meeting standard for that subject. This means the index can be calculated easily, regardless of a school’s grade configuration (although grade configurations influence the results due to differences in the tests given). The same scoring benchmarks are used for all subjects. This gives equal importance to each subject.7 It also encourages the vertical alignment of the state assessments. A school/district must have at least 10 students for it to be included in the accountability system. The minimum number used by OSPI is 10, but this policy is applied at the test and grade level. Using an N of 10 for a school means that very small schools will now be included in the accountability system because they will likely have at least 10 students assessed across the entire school. Combining all the test results together and using an N at the school level increases the overall N so a single student in a small school has less impact on the results and causes less of a change in the results from year to year. By using this system, scores in many schools that are currently suppressed at the grade level when there is less than 10 students assessed will become known in their aggregate form. This N policy means the state accountability system is more inclusive than the current AYP system, where the N is 30 and applies only students who are continuously enrolled. The advisors felt that the education system has a moral responsibility to serve all students, and having a small minimum N and counting students who have not been in class all year helps hold schools accountable for meeting the needs of all their students. ACHIEVEMENT VS. PEERS INDICATOR This indicator uses the Learning Index (described below) level and controls for student characteristics beyond a school’s control. Scores are the difference between the school’s adjusted level and the average level among the school’s peers. Specifically, the school/district score is the unstandardized residuals generated by a multiple regression. Those with scores above 0 are performing better than those with the same student characteristics, and those with scores below 0 are performing below those with the same student characteristics. The results are those for a single year rather than averages over multiple years for simplicity and to avoid the distortions when change takes place over time (e.g., when averaging, schools that have dramatic declines have better outcomes and schools with dramatic increases have worse outcomes).8 Separate analyses were run for elementary, middle, high, and comprehensive (e.g., K-12) schools because of the variation of the
7 The advisors did not have consensus about how to include science results in the index. Some felt that science should not be included at all because of changing standards and that it is not being taken seriously in many cases, which results in low scores across the state and relatively little improvement over time. As a result, it has little ability to differentiate school performance. Some suggested using lower cut points and raising them over time or including science but giving it less weight. After much discussion, a majority of the advisors concluded that since science will be a graduation requirement relatively soon, the only way to have science taken seriously was to treat it like the other subjects. Keeping the same rating system as the other subjects also keeps the system consistent and less complex and provides the opportunity to receive high ratings for improvement. Moreover, science achievement affects only two of the 20 cells of the matrix. Finally, not including science with equal weight penalizes those who work hard in this subject and sends the wrong message about the importance of students learning science concepts. 8 In small schools, a single student could cause large changes in the index from year to year. However, analyses found relatively little difference in the amount of change in small schools compared to larger schools from one year to the next.

variables at each grade level. Schools serving specialized student populations (e.g., alternative schools, ELL and special education centers, private schools on contract, institutions) are not included in the regressions. Excluding these schools provides a better predicted level for the remaining regular schools in the analysis and better data for use when determining the cut scores for the various ratings. Since the specialized schools have such different characteristics, results for this indicator are not computed and their index is based on an average of their remaining ratings. For schools, four student characteristics are the independent variables in the multiple regression: the percentage of (1) low-income students (percent eligible for free or reduced-price lunch9), (2) English language learners, (3) students with disabilities, and (4) mobile students (not continuously enrolled). A school’s Learning Index from each of the four assessments (using WASL and WAAS results) as well as the extended graduation rate for high schools are the dependent variables. The regressions are weighted by the number of students assessed to prevent a small “outlier” school from distorting the regression (predicted) line. Although there is a high correlation between all the independent variables except special education, the regressions showed that all four variables helped improve the quality of the predicted levels, regardless of the regression method used. For districts, three of the four student characteristics used in the school analysis were the independent variables in the multiple regression: the percentage of (1) low-income students (percent eligible for free or reduced-price lunch), (2) students with disabilities, and (3) mobile students (not continuously enrolled). The percentage of English language learners was not used because the initial analyses using this variable did not provide meaningful results. The same five dependent variables from the school-level analyses were used in the district analyses (the Learning Index for the four subjects and the extended graduation rate). Financial information was also used as an independent variable in the district analysis. Funding data are available only at the district level, and some communities are able to raise higher levels of funding. The financial variable used is the total amount of operating revenue per weighted pupil. This variable controls for the level of funds available to the district. Weighting the student count “inflates” the enrollment figure because certain students require more resources to educate. The extra weight for ELL and low-income students was .20, which is the typical amount used in school finance studies (although the actual number is likely to be much higher). The weight for students with disabilities was .93, which is consistent with both the national research and the level of funding provided by the state.
• Achievement vs. Peers on the assessments is scored based on the difference between the actual and predicted Learning Index levels:
> .20 ..................4 .10 to .20 ............3 -.099 to .099 .......2 -.20 to -.10 .........1 < -.20 .................0
9 The percentage of students in high schools who are eligible is often higher that what is reported, but this proxy for socioeconomic status is still the best available.

• Achievement vs. Peers on the extended graduation rate is scored based on the difference between the actual and predicted extended graduation rate:
> 12 ...................4 5.01 to 12 ..........3 -5 to 5 .................2 -5.01 to -12 ........1 < -12 ..................0
The mobility measure may need to be refined after further discussion takes place. Currently there is no common definition of mobility, and migrant student data does not include many students who are mobile. OSPI’s student data system includes information about students who are/are not continuously enrolled from October 1 through the end of the testing period in May as part of the AYP system. Using this measure, the average state mobility rate is less than 6%. Most schools with mobility rates above 15% are alternative schools, and very few districts (mainly those in Pierce County close to military bases) have many of their schools with this high of a rate. However, the proposed measure may not identify students who move in and out of a school or district multiple times during the school year and are considered continuously enrolled, nor does it identify students that are new to the district and are still enrolled during the entire year. The proposed measure, the percentage of non-continuously enrolled students, can be used until a better measure is identified. The scatterplot in Figure 9 illustrates how this indicator works. It shows just one of the independent variables (percent low income students) in relation to one outcome (K-6 math results). Each dot represents a school. The dark line is the average (predicted) level for a given Learning Index and low-income percentage. The distance between the school and the line is the difference from the predicted level. In this example, schools A and B have almost identical Learning Index results, but A falls well above the line while B falls well below the line. The dashed lines running parallel to the trend line represent the high and lowest cut points used for the ratings (.20 above and .20 below the trend line). When this kind of analysis is done factoring in the other variables (ELL, special education, mobility) at the same time in a multiple regression calculation, the distance from the predicted line is the school’s score, which produces a rating. If the low-income variable was the only one used in the analysis, School A would have a rating of 4 because its index is more than .20 points above its predicted level, while school B would have a rating of 0 because its index falls more than .20 points below the predicted level.

Figure 9: Scatterplot of Math Results in Elementary Schools by Percent Low Income
Linear Regression
0.0 25.0 50.0 75.0 100.0
Pct low income
0.000
1.000
2.000
3.000
4.000M
ath
Lea
rnin
g In
dex,
200
7
A
B
Math Learning Index, 2007 = 3.26 + -0.01 * PctLowIncR-Square = 0.70
The advisors discussed other possible independent variables that could be included in the analysis. These include the percentage of students who are enrolled in a gifted program, the percentage of minority students, and school size (enrollment). • A gifted variable was not included because of a lack of reliable data, although the system
should somehow take into account when a school has concentrations of these students. These schools will likely have very high index ratings.
• A race/ethnicity variable was not included because it is highly correlated with the other variables. Statistical analyses that included this variable found it added very little to the explanatory power of the model. Moreover, using this variable would reduce our ability to identify schools where students of color are treated differently. Finally, many of these students are also from low-income families, which is a separate indicator.
• A school size variable was not included because research findings to date reveal mixed results about how school enrollment levels affect student outcomes. School size is also a factor that can be controlled somewhat at the district level through the use of specialized programs and boundary lines. Other methods can be used to help schools compare themselves to those with similar sizes once the accountability results are made known.
The Learning Index is the dependent variable used for this indicator and for the Improvement indicator described below. This index, which was developed by the Commission on Student Learning and refined by the A+ Commission,10 takes into consideration the percent of students performing at the different WASL levels. Specifically, the WASL and WAAS tests have five levels of performance:
10 These Commissions are no longer in existence.

Level 0 – No score given11 Level 1 – Well below standard Level 2 – Partially meets standard Level 3 – Meets standard Level 4 – Exceeds standard
This index is calculated like a grade point average with 4.0 as the highest score, reflects the level of student performance across the entire range of proficiency, not just those meeting standard. It gives greater weight to higher levels of proficiency on the state assessments and provides an incentive to support the learning of all students, including those well below standard (Level 1) and those that already meet the standard (Level 3) to they can move up to the next level. There is a “ceiling effect” when using this measure, but preliminary results show that even high-performing schools were achieving large gains because of the movement of students from Level 3 to Level 4. Once a school has all of its students in Level 4, there would not be any possibility to improvement any more, but all ratings together would still result in a school being in highest tier. The following example shows how the Learning Index is calculated. The same method is used to calculate the index for all WASL tests (reading, mathematics, writing, science) in all the tested grades:
Level 0: 5% of all students assessed Level 1: 15% of all students assessed Level 2: 20% of all students assessed Level 3: 40% of all students assessed Level 4: 20% of all students assessed Learning Index = (0*0.05) + (1*0.15) + (2*0.20) + (3*0.40) + (4*0.20)
= 0 + .15 + .40 + 1.20 + .80 = 2.55 IMPROVEMENT INDICATOR The Improvement indicator relies on changes in the Learning Index for the four assessed subjects and the graduation rate from one year to the next. Specifically: • Improvement on assessments is scored on the levels of annual change in the Learning
Index:
> .12 ..................4 .051 to .12 .........3 -.05 to .05 ..........2 -.051 to -.12 ........1 < -.12 .................0
• Improvement on graduation rate is scored on the level of percentage point change in the
extended graduation rate from the previous year (see below for more information on how the graduation rate is calculated):
11 The “No Score” designation includes unexcused absences, refusals to take the test, no test booklets but enrolled, incomplete tests, invalidations, and out-of-grade level tests.

> 6 .....................4 3.01 to 6.00 .......3 -3.00 to 3.00 ......2 -6.00 to -3.01 .....1 < -6 ....................0
A one-year change is used rather than using averages of previous years or a change from a year further in the past because it is the simplest calculation, it reflects the most recent set of results, and it does not distort the most recent results (using a two-year average helps a school if scores go down and penalizes the school if scores go up). New schools would only need two years of data to generate an improvement score. Since results are created each year, changes over time are seen when examining the results across multiple years. The advisors discussed other possible improvement measures, including a 10% reduction in those not meeting standard (the AYP “safe harbor” measure), a 25% reduction in those not meeting standard over a 3-year period (the goal used for grade 4 reading several years ago), a percentage point gain from the previous year (or over several years), and a change in the scale score. While each of these have merit, the advisors determined that the annual change in the Learning Index provided the best measure of improvement because it focused on more than just those meeting standard and uses available data. The other measures can be used when analyzing “struggling” schools and districts for possible designation in the Priority tier. ACHIEVEMENT OF STUDENTS FROM LOW-INCOME FAMILIES Much research has shown that student achievement is highly correlated with a family’s socioeconomic status (SES). Specifically, academic achievement among students who live in low-income family is usually far below students from families that are not considered low income. This indicator focuses on the performance of low-income students. It uses the same five outcomes as the Achievement indicator: the four subjects tested by the WASL/WAAS statewide (reading, writing, math, and science) and the extended graduation rate. However, the outcome measures are the percentages of assessed students who are from low-income families who meet standard on the assessments and who graduate by the age of 21. The same rating scales are used as the achievement indicator. Low-income status is measured in terms of the percentage of students who are eligible to receive a federally-subsidized meal (e.g., free or reduced-price lunch). The percentage of students in high schools who are eligible is often higher that what is reported, but this measure is still the best available proxy for SES. This indicator is highly correlated with the percentage of ELL students and students of color, two groups of students that often have lower levels of student achievement. The indicator is also positively correlated with students with disabilities and mobility.12 The results for this indicator will not be different from the Achievement indicator if there are relatively few or no low-income students in a school. EXTENDED GRADUATION RATE MEASURE
12 The statewide correlations between the percentage of students considered low-income and the percentage of students of color and ELL students in a school are .70 and .68 respectively. The correlations with mobility and special education are .49 and .27 respectively.

The Washington State definition of the on-time graduation rate is the percentage of students who graduate from public high school with a regular diploma (not including a GED or any other diploma not fully aligned with the state’s academic content standards) in the standard number of years. The period of time required for students with disabilities to graduate is specified in each individualized education program (IEP). Students with disabilities who earn a diploma by completing the requirements of an IEP in the required period of time are counted as on-time graduates. The period of time required for EL and migrant students to graduate is determined on an individual basis when they enter the district and may be longer than the standard number of years. The period of time required to graduate for a migrant student who is not LEP and does not have an IEP can be one year beyond the standard number of years. LEP and migrant students who earn a diploma in the required period of time are counted as on-time graduates. The on-time graduation rate is calculated as follows:13 On-Time Graduation Rate 100*(1-grade 9 dropout rate)*(1-grade 10 dropout rate)*(1-
grade 11 dropout rate)*(1-grade 12 dropout rate-grade 12 continuing rate)
with Dropout Rate = number of students with a dropout, unknown, GED completer code total number of students served (less transfers out and juvenile detention)
To encourage schools to serve students who remain in school beyond 4 years, a separate graduation rate is calculated that includes students who graduate in more than 4 years. This “extended rate” is be used for AYP purposes and the rate used in the accountability index. The formula for calculating this rate is as follows: Extended Graduation Rate = number of on-time and late graduates # of on-time graduates / on-time graduation rate Dropouts are not counted as transfers. Since graduation data are not reported until after the beginning of the school year, the rates from the previous year are used. The calculation method may change in the future when the state has enough data to track students over the entire time period. The cut scores for determining the ratings may need to change if another method produces substantially different results. DISTRIBUTION OF INDEX Given the high correlation between family income and student performance, analyses were conducted to see how the school index related to the school’s percentage of low-income students. Figure 10 shows these results for the 2,046 schools used in the analysis, while Figure 11 shows the results for the 296 districts. These figures show a much weaker relationship between the two variables than what would be seen if the dependent variable was 13 See http://www.k12.wa.us/DataAdmin/pubdocs/GradDropout/03-04/Graduationanddropoutstatistics2003-04Final.pdf, chapter 1, for more information about these formulas.

achievement. Many schools and districts that have relatively few low-income students still have rather low index scores, while many that have high concentrations of low-income students have rather high index scores. The trend line is still sloping downward, but the correlations and r-squares are relatively weak (-.33 and .11 for schools, -.22 and .05 for districts). These are much weaker than the relationship between student achievement and socioeconomic status. This is because achievement represents only half the index and is moderated by two of the other variables (improvement, peers) that have low correlations with socioeconomic status (all the school correlations with the improvement and peers variables were less than + .08). It is harder for a school or district that has a high percentage of students who are low-income to achieve a very high index because the “all” students results are very similar to the low-income students results.
Linear Regression
0.0 25.0 50.0 75.0 100.0
Pct low income
0.000
1.000
2.000
3.000
4.000
Acc
ount
abili
ty In
dex
2007
Accountability Index 2007 (rating average using student data) = 2.14 + -0.01 * PctLowIncR-Square = 0.11
Figure 10: Scatterplot of Index for All Rated Schools, by Percent Low Income

Figure 11: Scatterplot of Index for Districts, by Percent Low Income
Linear Regression
0.0 25.0 50.0 75.0 100.0
Pct Low Income (FRL)
0.00
1.00
2.00
3.00
Inde
x, 2
007
Index, 2007 = 1.98 + -0.00 * Pct_LowIncomeR-Square = 0.05
RECOGNITION SYSTEM Many of the guiding principles apply to the recognition system. The system should: • Be transparent and simple to understand; • Rely on multiple measures; • Encourage the improvement of student learning and cooperation among educators; • Focus at both the school and district levels; • Rely mainly on criterion-referenced measures; and • Provide multiple ways to demonstrate success and earn recognition.
With these principles in mind, the same matrix that is used to generate the index is also used to identify schools and districts for recognition. Cut points were developed for all 30 cells of the matrix after looking at distributions of the ratings for all schools. (The impact of the cut points on districts was not calculated for this analysis. District have fewer high ratings, as noted in Figures 1 and 5, so they would receive recognition less often than schools). To ensure recognition does not occur based on one good year alone, two years are averaged, and the average must meet minimum criteria. Different cut points are used for different parts of the matrix because it is harder to achieve high ratings for some cells.
• For the “inner” 20 cells of the matrix, at least a 3.0 average is needed to receive recognition. To meet this level, a school/district needs to receive at least two straight ratings of 3, which are the second highest ratings (or it could have a rating of 2 & 4 in a

2-year period). Cells that average 3.5 or better (receive ratings of 3 & 4 or a 4 & 4) would receive recognition with “honors.”
• For the 10 “averaged” cells on the outside of the matrix, at least a 2.75 is needed. This lower average is justified because it is much harder to achieve an average of 3.0 in the multiple categories. Relatively few schools and districts would be recognized at this lower level—on average only 14% of schools reached this level in each of the 10 cells, and even fewer districts reached this level (districts do not have as many high ratings). If a 3.0 were required instead of a 2.75, only about 9% of schools, on average, would receive recognition in these cells.
To meet an average of 2.75 in the five outcome categories (assessments and graduation rate), a school/district needs to have a total of 11 points in the four indicator ratings (11/4=2.75). This would usually require a majority of ratings of at least a 3 in two consecutive years.
To meet this level in the four indicator categories (achievement, improvement, achievement vs. peers, low-income achievement), a school/district needs to have a total of 14 points in the five outcome ratings (14/5=2.80). This would usually require 4 out of 5 ratings of at least a 3 in two consecutive years.
Like the “inner” cells of the matrix, any “averaged” cell with a 2-year average of 3.5 or better would receive recognition with “honors.”
The number of schools and districts that receive recognition depends on the criteria described in Table 2. If the Board wanted to increase or decrease the amount of recognition provided, it could either change the criteria in Table 2 or change the cut points for recognition. Changes in the criteria in Table 2 would also affect the index scores for districts and schools. The Board could also request that a more formal “standard-setting” process take place to confirm or adjust the criteria used in Table 2. The Board could establish additional criteria in order for a school/district to receive recognition. For example, the Board could require that recognition be given only if the achievement gap (e.g., between genders or between various groups of students) was decreasing. If could also require a closer analysis of the data before a school/district receives recognition with honors to ensure data problems (in their favor) or other factors are not responsible for very high ratings. This would prevent inappropriate designations that could undermine the accountability system. A number of issues still need to be resolved related to the recognition. This includes what benefits accrue when a school or district meets the recognition criteria. The consequence could be as simple as highlighting the results on a Web site and issuing a press release about the winners. It could also generate financial rewards in certain cases. Another issue is what happens when a school and district are one in the same. The Board would need to make sure that any recognition is not duplicative (e.g., issuing a banner or financial reward for both the school and the district). Further, the proposed recognition should not duplicate existing awards being given by OSPI. Finally, the Board could create other types of recognition, such as special recognition for a few outstanding schools/districts and some that could be competitive in nature (e.g., require nominations or applications).

APPENDIX B
IDENTIFYING PRIORITY SCHOOLS AND DISTRICTS The advisors (see Appendix D) helped generate a comprehensive list of quantitative and qualitative data that could be used to determine which schools in the “struggling” tier should be identified as needing more significant support from the state over a longer period of time (the Priority tier). Schools in the Priority tier would have the greatest need based on consistent underperformance on multiple measures (grades, subjects, indicators) over multiple years. The advisors assumed that being in this tier would generate the opportunity for substantially more support. The following factors were initially identified. Contextual Data • Type of school (alternative school, institution) • Changes in student demographic profile (e.g., rapid increase in low-income or ELL
students) • What programs are included in the school (e.g., concentrations of ELL, special education,
gifted) • Program changes (e.g., establishing new ELL or special education programs) • Student mobility • Number of languages spoken by students • Feeder schools • Boundary changes (closures, consolidations) • Construction or renovation projects Analysis of WASL/WAAS Results (annual and trends over time) • Achievement trends over multiple years for each subject area • Size of the gap between WASL scores in different subjects • Size of the achievement gap • Percent students meeting 3 of 3 and 4 of 4 standards • Trends for subgroups (gender, race/ethnicity, low-income) and programs (ELL, special
education) • Level of growth over time • Changes in scale scores • How performance compares to similar schools • Results of students who have been in the school for longer periods of time (track cohorts of
students to see how percent meeting standard changes over time, review results for just “continuously enrolled” students, the percentage of students meeting standard the next year in the next grade compared to the previous year, e.g., the percent in grade 4 in one year compared to the percent in grade 5 the next year)
• Results from retakes (high school) and collection of evidence AYP Results • Results generated with minimum Ns, confidence intervals, and continuously enrolled
students (helps prevent false positives) • How far the “all” group is from the annual goal • Proficiency, participation, and other indicator results for all subgroups • Number and percentage of cells not making AYP
• Which subgroups and subjects did not make AYP (ELL, special education, and participation rates count less, the all and race/ethnic groups count more)
Other Quantitative Data (some may only be available at the district or school levels) • Graduation data: On-time and extended graduation rates for all students and subgroups,
difference in rates, percentage of students still enrolled after four years • Dropout data: Annual and cohort dropout rates for all students and subgroups, difference
in rates • Discipline data: Number of suspensions and expulsions, source of referrals, types of
infractions, types of students being disciplined the most • Perception results: Surveys of staff, parents, students about school conditions and how the
results differ from one another • Classroom conditions: Class sizes, student/teacher ratios by grade and subject • Staff characteristics: Percentage of staff with certificates, teacher education/experience
levels • Staff turnover: Teacher and leadership changes at school and district levels • District assessments: Results from any other assessments (e.g., MAP, grade 2 reading,
portfolios) • WLPT results: Performance of students from different language backgrounds, percentage
of students exiting ELL program • Volunteers: Number of parents volunteers, how they are used • Retention: Number and percentage of students retained in grade, number and type of
subjects not passed, level of credit deficiency • Finances: Amount generated by local levies/bonds, fund balances, amount and sources of
outside funding, stability in funding over time • District characteristics: Number and percentage of schools in Tier 3, percentage of district
students enrolled in Tier 3 schools • Data anomalies: Incorrect data reported that could affect analyses, missing data, reason for
missing data, number of ratings generating the average index Qualitative Data • District role: Resource amounts and types allocated to school, type of staff and programs
provided, funding levels, type and intensity of interventions made to date, appropriateness of district policies, data analysis capacity, role of the district in school improvement efforts
• Initiatives: Number being attempted, focus and validity of initiatives, level of integration/cohesion among activities
• Data use: Quality of data system, capacity to use data, how information is used • Self-assessments: Quality and use/implementation of school improvement plans • Staff relations: Level of collaboration among staff and administrators within the school,
union relations • Results from external reviews: Results from accreditation and OSPI’s Comprehensive
Program Review (CPR), input from ESDs Given the comprehensive nature of this list and the limited capacity to analyze all these data for every school and district in the “struggling” tier, the list was re-examined to determine which are the most important factors to analyze. Schools serving special populations require separate analyses. For example, schools serving high concentrations of more challenging student populations (e.g., alternative schools,

institutions, those primarily serving ELL students and those with disabilities) often have low index results that would put them in the “struggling” tier. These schools have great need and should not be automatically excluded from being a Priority school. A closer look is needed to see if more support should be provided and the quality of programs serving these students. These kinds of schools may require an alternative accountability system (states like Texas have set up such a system). Some institutions should be excluded (e.g., jails & detention centers) but other included (e.g., long-term psychiatric facilities). Other types of schools may need special analyses as well. For example, results for very small schools (N<10) are available but cannot be revealed to protect confidential information about students. However, the results could still be examined for trends over time. The number of virtual schools is increasing, often serving home-based students who are not required to take state assessments and may not be authorized to grant diplomas, which could mean there are few or no outcomes to measure. While some of these schools will generate results, they often serve many students outside the district, which means the school’s results are not included in the district results. Certain preconditions need to exist for schools and district for them to use the additional resources effectively. For example, schools in the lowest tier need to be ready to benefit from the extra support. Without their buy-in, the chances for a successful reform are minimal. If the number of schools in the “struggling” tier is high and exceeds the level of resources available to support them, the state may want to consider using a minimum number of students per school to ensure cost-effectiveness of the assistance and allocating support by geographic location to ensure equity in distribution. Finally, the schools and districts identified for the Priority tier may have a wide geographic distribution and be of different sizes. A single small school in a remote location may have the same level of need as a cluster of larger schools in a more accessible location. The state will need to determine how best to allocate its limited resources to ensure the cost effectiveness of its support.

APPENDIX C
CURRENT STATE ASSISTANCE PROGRAM SCHOOL IMPROVEMENT ASSISTANCE The mission of the Office of Superintendent of Public Instruction’s School Improvement Assistance (SIA) program is to help build capacity for districts and schools to improve student achievement through the use of the continuous school improvement model. This comprehensive model of support is unique in the United States. While many states have accountability systems that focus on rewards, punishments and takeovers, the SIA program provides comprehensive support for schools. Independent studies of the program have noted that the schools that received assistance for three years showed greater achievement gains than their respective comparison groups and the state as a whole. Nearly 60% of schools that have participated in SIA have exited federal improvement status and have made Adequate Yearly Progress (AYP) in the last two years of the program. The studies found further evidence that achievement gaps have been reduced in SIA schools. Program Components • School Improvement Facilitator (SIF): The facilitator works with OSPI, the school district, school, and a School Improvement Leadership Team (SILT) to develop a plan to address identified needs and to prepare and implement a jointly developed performance agreement between the school, school district and OSPI. The school improvement facilitators are experienced educators who have been successful in improving student performance and work approximately 1.5 days a week with each school for the three years of school improvement plan development and implementation. The school improvement leadership team includes representatives from the district and school staff, parents, and community members. Additional members may include educational service district (ESD) staff, OSPI staff and students. • Comprehensive Needs Assessment/School Performance Review: The needs assessment/ school performance review is completed jointly by the school improvement leadership team, school district, OSPI, and a team of peer educators and experts. The school’s strengths and challenges are identified and recommendations for improvement are developed. The school’s curriculum, leadership, instructional practices and resources, assessment results, allocation of resources, parental involvement, support from the central office, and staff, parent, and student perceptions are examined. Student performance data, indicators from the “Nine Characteristics of High Performing Schools” and the results of a review of the school’s reading and math instructional practices and program, are used to identify areas to consider for improvement. The assessment/audit includes the administration of survey instruments and an on‐site visit. • School Improvement Process, Tools, and Support: Schools are given the necessary processes, tools and expertise for the school improvement leadership team to develop a comprehensive School Improvement Plan. Funds are provided to contract with individuals to assist with components of the plan, and the school improvement facilitator are responsible for organizing and facilitating meetings in coordination with school and district staff. • Funds for Staff Planning and Collaboration: Funds for planning time related to the development of the school improvement plan are provided. These funds may be used to

provide stipends for school improvement leadership team members. A minimum of three days must be devoted to planning time for all staff during the development of the school improvement plan. The funds can be used to pay staff stipends or to pay substitute teachers. • Performance Agreement: Once the school improvement plan is completed, a two‐year performance agreement is jointly developed by the school, school district and OSPI. The agreement identifies specific actions and resources the school district, the school and OSPI will commit to implement the school improvement plan. The agreement also includes a timeline for meeting implementation benchmarks and student improvement goals. • Implementation and Sustainability: Tools and resources for the implementation of the performance agreement are provided during years two and three. The resources and expertise are determined on a case‐by‐case basis for each school, but could include such support as the provision of expertise in working with diverse student populations (e.g. special education, English language learners), funding and expertise to implement research‐based practices and programs, and funding for time for staff collaboration. Schools and school districts are expected to ensure that existing funds are used effectively and to dedicate school district resources as identified in the jointly developed Performance Agreement. • Training Workshops: Funds are provided to send a team of representatives to workshops during the school year to effectively plan for school improvement. • Professional Development: Professional development opportunities for the school’s principal and other school instructional leaders are provided in partnership with OSPI and the Association Washington School Principals (AWSP). Workshops are available during the school year. The Process Year 1: School Improvement Planning and Performance Agreement • Conduct needs assessment through school performance review (formerly educational audit) • Support staff training • Develop school improvement plan/ performance agreement • Develop student performance goals and evaluation criteria
Year 2: Implementation • Tools and resources to implement the school improvement plan and performance
agreements • Evaluate student progress based on goals in the agreement
Year 3: Sustainability • Tools and resources to build capacity and develop sustainability • Evaluate student progress based on goals in the agreement
DISTRICT IMPROVEMENT ASSISTANCE For 2008‐2009, districts fall in four district improvement groupings: (1) New in Step 1; (2) Continuing in Step 1; (3) New in Step 2; and (4) Continuing in Step 2. The technical assistance provided to districts in improvement status varies to meet the needs of districts either as they are developing their improvement plans or in various stages of implementation of their plans. The following areas are the most common types of support. A. Providing a School System Resource Guide (SSIRG): OSPI and WASA collaborated
in developing a resource planning guide that supports districts as they analyze existing

systems, structures, data, research findings, and more as they develop/revise their district improvement plan. A revision to the SSIRG is planned to be completed in 2008‐09.
B. Providing a Part‐time, External District Improvement Facilitator: District Improvement Facilitators are experienced educators who have been successful in improving student performance and receive continuous training through a partnership with WASA throughout the year. The selection of the facilitator is a collaborative effort between OSPI and each district. The facilitator works to help build the district’s capacity to support high‐quality, data‐driven, research‐based district improvement efforts.
C. Providing or Arranging for Professional Development: Additional resources for
professional development to expand capacity of district and school personnel to sustain continuous improvement focused on improvement of instruction may be provided to meet the needs of districts.
D. Provide for a District Educational On‐Site Review: Districts can request an educational on‐site review to be completed by a team of peer educators and experts. The district’s strengths and challenges are identified and recommendations for improvement are developed and provided to the district.
E. Providing Identified Expertise: Additional resources and expertise OSPI could provide
is determined on a case‐by‐case basis for each district, but could include such support as expertise in working with diverse student populations (e.g., special education, English language learners), funding and expertise to implement research‐based practices and programs, and funding for team collaboration time.
F. Providing Limited Grant Money: Districts may apply for two levels of grant support to
assist in implementing one or more of the technical assistance opportunities listed A‐E above.
OSPI recognizes the need to emphasize internal capacity building in districts and to revise its support systems and procedures over time.

APPENDIX D
ADVISORY GROUP MEMBERS Dr. Pete Bylsma, an independent consultant and former state director of research and accountability at OSPI, was hired to help prepare the proposed index for Board review. He was assisted by a number of advisors. This diverse set of advisors reviewed the work that had been done to date, discussed numerous technical issues related to the proposed index, discussed the criteria for recognizing schools and districts, and identified quantitative and qualitative data that can be used to examine schools in the “struggling” tier to determine if they should be a Priority school needing much greater state assistance. Other stakeholders from OSPI were included in some of the discussions, and a State Board working group that focused on System Performance Accountability also provided feedback on the proposal. Members of the advisory group were:
Ms. Maggie Bates, Hockinson SD (Assistant Superintendent) Ms. JoLynn Berge, OSPI (Federal Policy and Grant Administrator) Dr. Phil Dommes, North Thurston SD (Assessment Director) Dr. Linda Elman, Tukwila SD (Assessment/Research Director) Mr. Doug Goodlett, Vancouver SD (Special Services Director) Dr. Peter Hendrickson, Everett SD (Assessment Director) Dr. Feng-Yi Hung, Clover Park SD (Assessment/Evaluation Director) Dr. Nancy Katims, Edmonds SD (Assessment Director) Dr. Bill Keim, ESD 113 (Superintendent) Ms. Linda Munson, South Kitsap SD (Special Programs Director) Dr. Michael Power, Tacoma SD (Assistant Superintendent) Mr. Bob Silverman, Puyallup SD (Executive Director for Assessment) Ms. Nancy Skerritt, Tahoma SD (Assistant Superintendent) Dr. Lorna Spear, Spokane SD (Executive Director for Teaching and Learning) Dr. Alan Spicciati, Highline SD (Chief Accountability Officer)

18 Tremont Street, Suite 930 Boston, MA 02108 Telephone 617-778-1500 Fax 617-778-1505 www.massinsight.org Mass Insight Education and Research Institute is an independent 501(c) 3, nonprofit corporation
Serving Every Child Well: Washington State’s Commitment to Help Challenged Schools Succeed Draft report to the State Board of Education September 2008

SERVING EVERY CHILD WELL: WASHINGTON STATE’S COMMITMENT TO HELPING CHALLENGED SCHOOLS SUCCEED 2
Submitted in conjunction with Education First Consulting Mass Insight Education & Research Institute 18 Tremont Street Boston, MA 02108 617-778-1500 [email protected] Education First Consulting 823 NE 85th Street Seattle, WA 98115 206-529-4249 [email protected]

SERVING EVERY CHILD WELL: WASHINGTON STATE’S COMMITMENT TO HELPING CHALLENGED SCHOOLS SUCCEED 3
Serving Every Child Well: Washington State’s Commitment to Help Challenged Schools Succeed
Draft report to the State Board of Education September, 2008
Table of Contents Executive Summary ..................................................................................................... 5 I. Introduction: Overview, Need, Process, and Goals .............................................. 8
A. Overview of the Initiative ................................................................................................ 8
B. The Need ........................................................................................................................ 9
C. The Process .................................................................................................................... 11
D. Goals for the Initiative ..................................................................................................... 12
II. Washington Analysis ............................................................................................... 14 A. What Holds These Schools Back? ................................................................................ 14
B. How Should the State Respond? (The Seven Guiding Principles) ............................. 15
III. The Research on School Turnaround ................................................................... 17 How Is Turnaround Different from School Improvement? ................................................ 17
What Can We Learn from the Experience in Other States? ............................................. 22
IV. The Innovation Zone ............................................................................................... 25 A. Overview ......................................................................................................................... 25
1. What is the Innovation Zone? ......................................................................................... 25
2. Is the Zone aimed at the school level or at the district level? ....................................... 26
3. How does the Innovation Zone integrate with other efforts already underway? .......... 27
B. Incentives and Roles for Participation in the Zone ........................................................ 27
1. What are the benefits of the Innovation Zone for each stakeholder? ........................... 27
Why should the SBE propose the creation of the Innovation Zone? ............................... 28
Why should the Legislature support the Innovation Zone? ............................................... 28
Why would districts want to participate in the Innovation Zone? ...................................... 28
Why would local school directors want to participate in the Innovation Zone? ................ 28
Why would teachers and unions want to participate in the Innovation Zone? ................. 29
2. What are the roles and responsibilities for each stakeholder? ..................................... 29
C. Step by Step through the Innovation Zone ................................................................... 31
What are the eligibility requirements? ................................................................................ 34
What are the initial readiness factors? ............................................................................... 35

SERVING EVERY CHILD WELL: WASHINGTON STATE’S COMMITMENT TO HELPING CHALLENGED SCHOOLS SUCCEED 4
“Readiness Factor” Questions: Is Your District Ready to Participate in the Innovation Zone? 35
How are districts selected in the first round to receive planning funding and what happens then? .............................................................................................................................................. 36
What criteria should the State Board issue for the creation of turnaround plans? What are the essential operating conditions districts need to meet in order to be selected? ............................... 37
Recommended State Criteria for Operating and Instructional Conditions ....................... 38
People: ................................................................................................................................. 38
Program: .............................................................................................................................. 38
Time: .................................................................................................................................... 39
Money: ................................................................................................................................. 39
Why accomplishing more latitude in operating conditions is so critical ............................ 39
How can districts go about putting those conditions in place? How can the state help? 39
How are districts selected and by whom? ......................................................................... 40
Who oversees the efforts and performs evaluations of progress? ................................... 42
What about districts that have Priority schools but do not participate in the Innovation Zone in the beginning? ........................................................................................................................... 44
Proposed Timeline .............................................................................................................. 45
V. Academic Receivership: The “Backup Plan” for the Zone ................................. 47 A. Introduction and Context ................................................................................................ 47
B. Structure of the Intervention Continuum: Zone plus Backup Plan ............................... 48
C. Academic Receivership: the “Backup Plan” for the Innovation Zone .......................... 52
D. Recommendations for Washington State’s Academic Receivership Policy ............... 54
E. Other options considered ............................................................................................... 60
VI. Supporting Programs ............................................................................................. 61 Leadership Development .................................................................................................... 61
Partner Capacity Development .......................................................................................... 66
Selection of Partner Profiles ............................................................................................... 68
Data and assessment use .................................................................................................. 71
VII. Budget Considerations.......................................................................................... 72 VIII. Implementation Strategies ................................................................................... 74

SERVING EVERY CHILD WELL: WASHINGTON STATE’S COMMITMENT TO HELPING CHALLENGED SCHOOLS SUCCEED 5
Executive Summary Overview of the Initiative The Need
• Like all states, Washington has a small number of schools where students persistently achieve at significantly lower levels than at peer schools.
• Also like all states, Washington has not been able to eliminate – or even to narrow, appreciably – the large achievement gap between “have” and “have-not” students and schools.
• Finally – like all states – Washington’s public schools are not yet broadly and successfully preparing most high school graduates with college-ready skills, after 15 years or more of standards-based reform.
The Context
• The Legislature has charged the State Board of Education with developing a state system to identify Washington’s most successful and least successful public schools, and to recommend an approach to improve the latter.
• The Basic Education Funding Task Force is reviewing the state’s investments in public schools and the ways those funds are being spent, with an eye towards recommending a new funding formula capable of meeting 21st-century expectations for proficiency.
• National and Washington-based research reveals a clear set of barriers that have undercut the impact of school reform efforts to date. They include insufficient and unstable resources, insufficient time, inflexibility in allocating resources to higher need areas to improve student achievement, lack of coherent systems to recruit and prepare quality educators, insufficient coordination among intrastate agencies, and insufficient focus (i.e., with funding) on schools serving high-challenge student populations.
Core Strategies
• Prioritize success. Establish bold exemplars of systematic, comprehensive turnaround, rather than serve every needy school inadequately.
• Generate change by enabling local leaders and their partners, rather than through state mandates and alternate governance.
• Make local leaders earn the opportunity to participate by insisting on transformation with this initiative, not incremental change.
• Hold everyone accountable, from the state through the districts to the schools and the students.

SERVING EVERY CHILD WELL: WASHINGTON STATE’S COMMITMENT TO HELPING CHALLENGED SCHOOLS SUCCEED 6
Specific Recommendations The Proposed Plan
• Districts with Priority Schools as determined by the state’s new Accountability Index will have the option to apply to the Innovation Zone.
• Districts will be admitted to the Zone after being vetted by the State Board for readiness (i.e., strong signals of commitment to transformative change) and for a solid turnaround plan. Districts will be encouraged to apply on behalf of small clusters of schools – including their Priority School(s) – organized intentionally by feeder pattern or school type (within or across district lines), so that the reforms are systemic and not limited to a focus on individual schools.
• The Zone will offer $50,000 in planning and preliminary implementation grants to districts and a significant dollar amount per school in implementation grants for periods of up to five years, with benchmark expectations at two years (leaving Priority status) and at four years (moving into the state’s “adequate” tier of school performance). Districts will be strongly encouraged to work with a lead partner in designing and implementing their Zone initiative.
• Districts with Zone initiatives will maintain good standing and continue to receive support so long as a) their Priority Schools meet the benchmark expectations or b) they can develop a revised plan that addresses analysis of the reasons for continued under-performance.
• Districts with Priority Schools that do not join the Zone’s first cohort (and whose Priority Schools are not able to leave that status after two years) will be required to apply at that point for entrance into the second Zone cohort or will be referred to an Accountability Council for further action.
• Districts that cannot bring their Priority Schools out of Priority status after two full implementation years (whether they were part of the Zone or not) OR develop an acceptable Zone proposal (or revised plan) will be referred to a new, representative body, the Washington State Accountability Council. The Council will consider a range of options designed to help the district become better prepared to use Zone resources well.
Basic Definitions
• The Innovation Zone is: o At the instructional level, a chance for educators to ask fundamental
questions about what it takes to help high-challenge, high-poverty students succeed, and to reshape their approach accordingly based on research conducted nationally and in Washington State.
o At the systems level, an opportunity for district and community leaders and their partners, supported by the state, to re-imagine and rebuild the structures and operating habits that shape the nature and quality of the education they offer.
o At the policy level, an effort to pilot the next generation of standards-based reform in Washington State – an approach marked by greater degrees of accountability by every stakeholder in the enterprise.
• The Innovation Zone is not:
o Simply an effort to fix some broken schools.

SERVING EVERY CHILD WELL: WASHINGTON STATE’S COMMITMENT TO HELPING CHALLENGED SCHOOLS SUCCEED 7
o An initiative to distribute the available resources evenly across every challenged public school.
o A top-down, mandated state program.
The Rewards of Taking Action • The reauthorization of No Child Left Behind will likely produce extensive federal
investment in school intervention strategies. Some of these funds likely will be competitive. States with robust, transformative strategies in place – such as the Washington State Innovation Zone – will likely be the recipients of those competitive federal funds.

SERVING EVERY CHILD WELL: WASHINGTON STATE’S COMMITMENT TO HELPING CHALLENGED SCHOOLS SUCCEED 8
Part One: Context and Analysis
I. Introduction: Overview, Need, Process, and Goals A. Overview of the Initiative Washington, like all other states, has a group of schools with students that continue to fail to make progress meeting the state’s standards and are reaching the final steps in accountability defined by the federal government under No Child Left Behind. While currently the state has no required intervention mechanism in place to address the schools and districts that do not volunteer to participate in the OSPI school and district improvement programs, in 2006 the Washington State Legislature charged the Washington State Board of Education (SBE) with developing a statewide accountability system that identifies “schools and districts which are successful, in need of assistance, and those where students persistently fail (and)…improvement measures and appropriate strategies as needed” and to develop a statewide strategy to help the challenged schools improve. Both the Legislature and the Board have recognized that there are schools in Washington where high percentages of students, year after year, are not succeeding and that it is their collective responsibility to make sure those students get the education they deserve. Boston-based Mass Insight Education & Research Institute and Seattle-based Education First Consulting were chosen to assist the Board in developing the plan for state and local partnerships to help Washington’s lowest-performing schools improve. Mass Insight has a deep awareness of what’s happening nationally on school intervention strategies and school turnaround, as well as firsthand field experience in school and district improvement efforts in Massachusetts. Education First Consulting brings extensive knowledge of education policy and strategy nationwide, as well as deep engagement in public education in Washington. This team has spent the last several months interviewing and convening a broad range stakeholders in Washington and strategizing about what can be done for the highest-priority schools (to be identified by the Accountability Index the State Board is developing and called Priority Schools). There have been and will continue to be many perspectives and constraints to consider, as well as national research on what enables schools to become high-performing, even if they are serving high-poverty, high-challenge students. There are schools that are serving these students effectively, nationally: proof-points that it can be done. The goal for this project is to prepare recommendations and proposals for the 2009 legislative session, as well as for the Joint Basic Education Finance Task Force. While the recommendations will specifically focus on strategies to help the state’s most deeply challenged schools, they will link with the state’s larger accountability system and assistance plans for all schools. The resulting proposal is a new kind of state and local partnership in standards-based reform for Washington State. It grew directly out of a set of “guiding principles” developed by the project’s Design Team, composed of more than 20 key stakeholder

SERVING EVERY CHILD WELL: WASHINGTON STATE’S COMMITMENT TO HELPING CHALLENGED SCHOOLS SUCCEED 9
leaders. Shaped by these principles, the initiative is solely focused on student success; collectively organized and with absolute clarity on roles and responsibilities; marked by reciprocal accountability carrying reciprocal consequences among all stakeholders; focused on addressing common barriers to reform identified by research undertaken this year (through a separate SBE project) in Washington State; and reflective of a sustained commitment (financial and otherwise) by the state and all stakeholders to its mission. These principles, which are discussed in greater detail below, collectively represent the spine of the entire initiative and demonstrate the ways it will pilot some significant departures from the first incarnation of standards-based reform in Washington State. We call the central part of the initiative the Innovation Zone – a reform framework into which districts with Priority Schools can apply to participate and receive resources and other supports in exchange for meeting specific criteria and benchmarks. While we propose that participation is voluntary initially, the proposal also recognizes a point of continued school underperformance when choosing not to participate can no longer be an option and the state must require some form of intervention.
B. The Need Washington State’s challenge is no different from that being faced in virtually all of the other states: while standards-based reforms may have helped improve student achievement in many schools, there are some schools where improvement has not kept pace. There are levels of school under-performance, mandated by the federal government. Washington recently announced that nearly 700 (out of about 2000) schools in the state are now being designated for one of the levels of under-performance stipulated by the No Child Left Behind Act. Many of these schools are missing their AYP (Adequate Yearly Progress) targets for student subgroups – students in Special Education, for example, or African-American students. School districts across Washington and OSPI are already working on a range of initiatives designed to address under-performance at these levels. This flood tide of schools labeled “under-performing” has stirred concern across the landscape of American public education (as well as controversy about NCLB). Most relevant to our purposes here is the concern – shared by the State Board and the Legislature – that the ever-increasing number and percentage of schools falling into the NCLB watch-lists are masking a deeper crisis in a smaller set of schools: those in which a large proportion of students are failing to meet state standards for multiple years in a row. These are not schools that have been labeled “low performing” because of issues with a single student subgroup. These are schools that any reasonable observer would agree have shown a persistent inability to provide their students with an adequate education. While states can establish different definitions of “chronic failure,” such as 50% of students failing for two or more years in a row (and the SBE is currently completing its own accountability index), the schools in question are schools in which performance is so sufficiently and consistently low that it becomes clear that the status quo is unacceptable.

SERVING EVERY CHILD WELL: WASHINGTON STATE’S COMMITMENT TO HELPING CHALLENGED SCHOOLS SUCCEED 10
What’s true nationally of schools that have reached these extreme categories of under-performance is also true in Washington State: they tend to serve high-poverty, most often high-percentage-minority student enrollments. The downward slope in the chart shown here (for 2007 math results on WASL) is true for other curriculum areas and grade levels as well. The fact is that as a society, we have not developed a broadly effective education model for students who don’t have the advantages of relative affluence in their out-of-school-lives. The standards era has brought a sharp new awareness of the lower expectations that have marked public education for lower-income students, but it has not yet delivered broad implementation of strategies that can help high-poverty students reach higher achievement expectations.
Higher Poverty = Lower Achivement -- Usually2007 Grade 4 Math Results for All Schools in Washington
0
20
40
60
80
100
0 10 20 30 40 50 60 70 80 90 100
Percent low-income (FRL), 2007
Per
cent
mee
ting
mat
h st
anda
rd, 2
007
Adj. R-square = .573Trendline adjusts for school size
State average
28%
Source: Washington State Board of Education
Achievement generally declines as poverty in schools increases. But the outcomes of high-poverty schools are spread across a wider achievement span than are those in affluent schools. Meaning: a) high expectations can be attained in high-poverty schools, and b) school quality matters especially in high-poverty settings.
Priority Schools, which (preliminary analyses show) will be almost exclusively high-poverty schools, represent an opportunity for Washington State to address this challenge – arguably, among the most critically important challenges the State will face over the next decade. The negative economic and social impacts of under-achievement by young people in school are dramatic. High school dropouts:
• Earn $9,200 less per year, on average, than high school graduates. • Are three times more likely to be unemployed than college graduates. • Are twice as likely as high school graduates to enter poverty from one year to the
next.

SERVING EVERY CHILD WELL: WASHINGTON STATE’S COMMITMENT TO HELPING CHALLENGED SCHOOLS SUCCEED 11
• Are eight times as likely to be in prison as high school graduates. • Collectively represent a loss of about 1.6 percent of the gross domestic product
each year.1 The Innovation Zone represents an opportunity for Washington State to address two important priorities at once:
• Use the urgency represented by the Priority Schools to enable school districts to pilot new, comprehensive approaches that research suggests can bring high-poverty students to proficiency; and
• Do so in ways that avoid the pitfalls of intervention efforts in the most consistently under-performing schools that have been tried in other states, including (on the one hand) reform strategies that do little more than add a new program or provide some minimal coaching or training, and (on the other hand) total governance takeovers of schools by the state.
Both of these points are discussed at some length later in this report. The SBE is currently designing (independently but collaboratively with this project) a new accountability index for Washington State that will identify the schools that are candidates to join the Innovation Zone. The same kind of identification process is being used in other states to trigger automatic consequences, which in many cases involves increased state intervention authority. That is not the approach we and the Design Team recommend for Washington State. Rather, we recommend that the Priority Schools identification process be used to:
• highlight the schools in the state that clearly need extra attention; • require all districts with these schools to demonstrate that they have a solid plan
in place to address the challenge; • set criteria for research-based strategies that go beyond incremental “school
improvement” reforms (more on this below); and • invite districts to earn a place in the Innovation Zone – and the resources needed
to implement those strategies – by showing their readiness to meet the state’s criteria and undertake more a more fundamental kind of reform.
C. The Process Phase 1 – Outreach and Preliminary Development Work: Beginning in March, 2008, the Mass Insight/Education First team engaged with a broad array of stakeholders in thinking through the nature and the feasibility of various partnership strategies. Along with the findings of a companion study on policy barriers to student achievement completed by the Northwest Regional Education Laboratories, that engagement came through surveys of hundreds of Washington educators, interviews with dozens of education and community leaders, union leaders, legislators, and a Design Team composed of Washington educators and community leaders with a deep commitment to helping turn around low-performing schools.
1 Sources: Bridgeland, Dilulio, and Morison, The Silent Epidemic (2006); Rouse, Social Costs of Inadequate Education Symposium, Columbia Teachers College (2005)

SERVING EVERY CHILD WELL: WASHINGTON STATE’S COMMITMENT TO HELPING CHALLENGED SCHOOLS SUCCEED 12
The Design Team members include current superintendents, community and foundation leaders, a National Board Certified Teacher, local and statewide union leaders, representatives from the business community, and leaders from the professional associations of principals, superintendents, and school board members. It has been tremendously important to the design process that such distinguished (and busy) educators and education supporters committed to meet and to be part of this important work and to help develop concepts and proposals. And it has been equally fulfilling, as the design process concludes it work, to hear so many Design Team members call the process “respectful,” “highly collaborative,” and “very productive.” Our goal throughout the project has been to ensure that the proposals reflect the national research into promising practices in school turnaround and the perspectives of those who know Washington’s public education and policy landscapes the best. Phase 2 – Developing and Testing Hypotheses: Over the summer, we moved into developing hypotheses and proposals based on our work with the Design Team. We turned the input and concerns of the Design Team members into a set of Guiding Principles (see below) upon which we based our plans. We sought feedback from the Board through working sessions in June and August and through our presentation at the July Board meeting. We continued to use all of the input and feedback we received – including the emerging drafts of the barriers study from NWREL – to ground all of our proposals in what will work in Washington State. We made continual changes and refinements to our draft Innovation Zone concept as Board members, Design Team members, legislators, leaders of professional associations, and other stakeholders weighed in. During this phase, we also provided input to the team designing the Accountability Index. Phase 3 – Adding Specifics to Proposals and Developing “Backup” Plan: In the final stage of concept development, we fleshed out and added detail to the Innovation Zone proposal and developed the “Backup” plan – or, what happens when even the Innovation Zone is not enough for districts to raise achievement in their Priority Schools, either because they are unable to show improvement after two years of extensive support and the opportunity to continue for two more years with a revised plan or because they chose not to participate and could not move a school out of Priority status on their own. This is all part of the reciprocal accountability principle that lies at the heart of this initiative, and which characterizes what we’ve called the second incarnation of standards-based reform in Washington State.
D. Goals for the Initiative The goal for Innovation Zone schools is to eliminate the achievement gap. That means: by the fifth full year of implementation, reach the state average for performance by schools serving predominantly low-poverty student enrollments. That goal, we believe, should be shouted from the rooftops. It is an entirely supportable, direct response to a vexing public policy challenge. It also has the advantage of being understandable. Poor kids and minority kids should emerge from school with skills

SERVING EVERY CHILD WELL: WASHINGTON STATE’S COMMITMENT TO HELPING CHALLENGED SCHOOLS SUCCEED 13
equivalent to middle-class kids and white kids. That’s a largely unfulfilled part of the mission of public education. The Zone also serves two larger purposes for the state:
• Raising the floor of under-performance. With a maximum of collaboration, local capacity-building, and district/community partnership and a minimum of state intervention, the state fulfills its responsibility to ensure an acceptable level of education for every child.
• Raising the ceiling of achievement. As the research outlined below illustrates, some high-poverty schools nationally are showing the way to higher achievement – in some cases, nearly the equivalent of their most affluent counterparts. But their strategies reflect fundamental changes in the ways these schools work. The Zone provides school districts in the state with a vehicle to see just how far their students can go.

SERVING EVERY CHILD WELL: WASHINGTON STATE’S COMMITMENT TO HELPING CHALLENGED SCHOOLS SUCCEED 14
II. Washington Analysis A. What Holds These Schools Back? That was the central question posed by the “barriers to improvement” study undertaken this year for the SBE by the Northwest Regional Educational Labs. The SBE has received the report from NWREL and we won’t reiterate the findings in detail here. It is important, though, to note the study’s primary conclusion, that the following four barriers to educational improvement “were widely recognized as having potential impact on student achievement if removed, and within the state’s ability to remove them”:
1. Insufficient and impermanent resources 2. Time for professional development and teacher collaboration 3. Inflexibility in allocating resources to higher need areas to improve student
achievement 4. Coherent systems that support the entry, development, and retention of quality
staff members
The study also identified the following policy-related levers for change:
1. Need for program coherence among state education agencies 2. Need for permanence in funding for programs 3. Time for professional development and teacher collaboration 4. Need for operating flexibility 5. Systems that support the entry, development and retention of quality staff
members
These findings are corroborated by the conclusions reached in our own national research, funded by the Gates Foundation over the past three years. They are supported additionally by the discussions we held with the Design Team, by our interviews with more than 30 stakeholder leaders across Washington State, and by Mass Insight’s preliminary analysis of Washington’s intervention and reform strategies, which we conducted for the SBE in 2007. We would add these observations to NWREL’s conclusions:
• The current Washington system has too few positive incentives to motivate school and district leaders to embrace the kind of major change that research indicates the lowest-performing schools need in order to turn around. The result (as in many other states) is incremental program-change reform that can have a good result in middle-performing schools that are ready to move forward – but that is insufficient to have real impact in the very lowest-performing schools. (More on this from the national research, below.)
• It also provides the state with no authority to insist on more proactive reform, even where it is demonstrably needed. The state is right to emphasize district capacity-building and educator buy-in – a crucial element in school improvement of any kind. But continued, significant under-performance by schools should demand attention from government. The state should do everything in its power

SERVING EVERY CHILD WELL: WASHINGTON STATE’S COMMITMENT TO HELPING CHALLENGED SCHOOLS SUCCEED 15
to assist and enable districts to turn around their own lowest-performing schools – addressing, along the way, the barriers identified above. But then it must be prepared to take a stronger role working with districts that, even with these supports, are not able to bring their lowest-performing schools out of Priority status.
We have tried to keep all of these barriers and levers in mind in creating our proposed model. The Innovation Zone seeks to address these challenges in an achievable way, as an opt-in initiative capable of testing – affordably, in consideration of the state’s current financial straits – state and district strategies on behalf of a fairly small pilot group of districts and schools. There is one final, important point to make regarding Washington State’s current reform landscape. The challenges described above have almost entirely to do with policy. Washington State’s Office of the Superintendent of Public Instruction has been working for years to help schools improve within an incomplete and uncertain (vis a vis funding) policy environment. NWREL’s study and our own outreach efforts uncovered a fairly strong, if not universal, level of satisfaction with the quality of the intervention efforts that OSPI has developed over the years. OSPI’s newest improvement effort, the Summit Districts initiative, is to our eyes the most coherent and comprehensive reform initiative ever undertaken by the state. It is different from the Innovation Zone concept in that it envisions whole-district improvement within the current policy context and, in general, within the current framework of school district operating conditions. The Zone, by contrast, envisions using the urgency and opportunity of the state’s most persistently under-performing schools to create break-the-mold approaches. It is entirely appropriate for Washington State to support school improvement work at a series of escalating intensity levels, so long as they are done consciously and in ways that are mutually supportive and not conflicting. OSPI has shown a strong degree of commitment throughout the design of the Zone initiative to bring about that end. (See Part Two for more on this point.)
B. How Should the State Respond? (The Seven Guiding Principles) Out of examination of the barriers research (both in-state and nationally), and through the extensive conversations we have had with various stakeholders, including the State Board of Education and the Design Team, we have developed general consensus around a set of guiding principles for turnaround in Washington State. The principles shape the basic elements of the Innovation Zone. They include the following:
1. The initiative is driven by one mission: student success. Whatever the reason, most students are not succeeding in Priority Schools. This initiative is our chance to show that they can – and how they can, so that other schools can follow.
2. The solution we develop is collective. Every stakeholder may not agree with every strategy; aspects of the solution may call for new thinking and new roles for all participants. But this challenge requires proactive involvement from all of us.

SERVING EVERY CHILD WELL: WASHINGTON STATE’S COMMITMENT TO HELPING CHALLENGED SCHOOLS SUCCEED 16
3. There is reciprocal accountability among all stakeholders. This challenge needs a comprehensive solution that distributes accountability across the key stakeholders: the state, districts, professional associations, schools, and community leaders.
4. To have meaning, reciprocal accountability is backed by reciprocal consequences. Everyone lives up to their end of the agreement, or consequences ensue.
5. The solution directly addresses the barriers to reform. As identified by Washington State stakeholders, these include inadequate resources; inflexible operating conditions; insufficient capacity; and not enough time.
6. The solution requires a sustained commitment. That includes sufficient time for planning, two years to demonstrate significant improvement (i.e., leaving the Priority Schools list), and two more years to show sustained growth.
7. The solution requires absolute clarity on roles – for the state and all of its branches, districts, schools, and partners.
The principles are easy to agree to as aspirations, but much harder to live by as working strategies. The first one, for example – making success the primary goal – represents a hope that everyone certainly shares. But as an operating principle, it reflects an understanding that the state’s highest priority in the initial implementation of this initiative is not to serve every district, community, school, and child who needs help. Given that it simply isn’t feasible from a funding perspective to serve every district that contains Priority Schools, the highest priority is to test transformative reform strategies and to create a set of exemplars. Educators throughout the state and policymakers alike need to see these exemplars in order to justify funding and supporting their expansion in the years to come. The same is true for the reciprocal accountability principle, which was viewed as especially critical by the Design Team. If Priority School status is going to carry a deeper level of accountability with it, the strong view of the field is that the accountability must be shared throughout the entire system of public education, with every stakeholder living up to their end of the bargain. Legislators have made the same point to us in our discussions with them. The state needs a spark, or a platform on which everyone can take a step forward at once – and we propose that the Innovation Zone could be that platform. We kept these Guiding Principles at the forefront of our thinking as we developed the proposals, as they provide a useful framework and checkpoint for the Washington context. They will provide a useful rearview mirror as well, once the initiative is launched. Our conviction is that if the principles are adhered to faithfully, success can be the result, with scale-up to follow that can meet the magnitude of the need.

SERVING EVERY CHILD WELL: WASHINGTON STATE’S COMMITMENT TO HELPING CHALLENGED SCHOOLS SUCCEED 17
III. The Research on School Turnaround How Is Turnaround Different from School Improvement? A wide body of evidence (which Mass Insight collected and analyzed for our 2007 report, The Turnaround Challenge) suggests that efforts to “fix broken schools” by focusing on traditional improvement strategies – some training for teachers and principals, a new curriculum, even so-called whole-school change models – have not produced enduring, strongly positive results in mid-performing schools, much less in persistently underperforming ones. The work of turning around the most consistently under-performing schools certainly involves these kinds of reforms, but it has become clear that instructional, curricular, and organizational strategies must become embedded within a larger understanding of what high-poverty student enrollments need. Until our society reorients itself to assure that high-poverty students enter school with vocabulary, problem-solving, and social skills that are even remotely the equal of more affluent children, public schools serving high-poverty enrollments must reorient themselves to serve these students – with all of the challenges they face in their communities and bring to school – successfully. Deficits in kindergarten only tend to become deeper over time, meaning the challenges of high-poverty schooling – while rooted in a child’s first five years – become multiply difficult in the middle and high school grades. A common refrain in addressing the school turnaround challenge, in Washington State and nationally, is the lack of clarity around what it is, and what defines a successful turnaround. Mass Insight defines school turnaround in our report, The Turnaround Challenge, as a dramatic and comprehensive intervention in a low-performing school that produces significant gains in student achievement within two academic years, and that readies the school for the longer process of transformation into a high-performing organization. While there may be debate as to the length of time turnaround takes, there is no question that we are talking about transformative, not marginal or incremental, change. Most school improvement efforts so far have been about marginal change, and so have led to marginal results in the most chronically under-performing schools. A wide body of evidence nationally lends support to this observation.2 Because there have been so few successful turnaround efforts nationally to date (and none at scale), our research for The Turnaround Challenge focused on a small but growing number of high-performing, high-poverty (HPHP) schools and what other research has indicated are the commonalities are across those schools. What we found is that these schools tend to operate differently from traditional models, whether by original design or by virtue of having a leader who, in collaboration with a strong leadership team, is able to produce results despite the constraints of the system in which they work. These schools focus on strategies that enable the schools to acknowledge and foster students’ Readiness to Learn, enhance and focus staff’s Readiness to Teach, and expand teachers’ and administrators’ Readiness to Act, as presented in the chart below. When we think about what changes need to be made to turn around consistently low-performing
2 See Mass Insight’s 2007 report, The Turnaround Challenge, for exhaustive research on this point.

SERVING EVERY CHILD WELL: WASHINGTON STATE’S COMMITMENT TO HELPING CHALLENGED SCHOOLS SUCCEED 18
schools, we should learn from what has enabled these HPHP schools to bring highly challenged populations to high achievement.
From The Turnaround Challenge, Mass Insight Education & Research Institute, 2007
Schools that reflect the elements in the Readiness Model, above, are a compelling blend of traditional ideas in education – good teachers, high expectations, strong curriculum, monitoring of student progress – and new ideas about what it takes to engage and serve today’s disadvantaged students effectively. If there is a single theme that seems to cut across the entire literature on high-performing, high-poverty schools, it may be that they have crossed a bridge from public education’s customary focus on what’s being taught to a new, schoolwide focus on what’s being learned. That means: rather than organizing themselves around a curricular conveyer belt and offering fairly minimal support to students who don’t keep up, the HPHP schools have flipped that approach in reverse. They maintain high curricular expectations shaped at least in part by their state’s standards for achievement, but they focus intensively and relentlessly on each student, doing whatever it takes to help that child be ready and able to learn to those high expectations. The question is how districts with schools serving high-challenge, high-poverty student enrollments can move in this direction: what the strategies look like at the school level, and what’s required in terms of capacity, resources, and operating conditions at the district level that will allow this transformation to happen across clusters of schools. We ask the question that way – at the district level – because in our view, that is where the real solutions lie. Converting individual schools from low-performers to higher performers is a good thing, but it misses the point demonstrated by the achievement-vs-poverty chart on page 10. This is not a problem of isolated instances of poor

SERVING EVERY CHILD WELL: WASHINGTON STATE’S COMMITMENT TO HELPING CHALLENGED SCHOOLS SUCCEED 19
implementation within a clearly and broadly effective model. This is a problem of significant scale that requires attention at three levels: policy, systems, and instructional delivery. Currently, there are hopeful signs at the school/instructional-delivery level, represented nationally by high-performing, high-poverty schools. With this Innovation Zone initiative and with OSPI’s Summit Districts initiative (see page 28 below), Washington State is signaling its commitment to addressing the need for reform at the policy and systems levels.
This is not a problem of isolated instances of poor implementation within a clearly and broadly effective model. This is a problem of significant scale that requires attention at three levels: policy, systems, and instructional delivery.
Given all of that: What, then, are the hallmarks of genuine transformation? What separates comprehensive, transformative turnaround – the kind of reform that can enable districts and schools to serve high-poverty enrollments with dramatically greater success – from incremental improvement that might be of some help, but is insufficient to generate the results we need? The questions on the following chart provide a short set of what we believe are the most important indicators. They seem fairly straightforward on one level: of course, the leaders given responsibility to undertake the turnaround of a struggling organization should be able to shape his or her team and to revise budgets and schedules to support the turnaround plan. But in the world of public policy and public education, a concerted effort by all of the stakeholders in the system – the district, the state, the school board, the union, the community – is necessary to create the operating conditions and the capacity for turnaround to be possible.

SERVING EVERY CHILD WELL: WASHINGTON STATE’S COMMITMENT TO HELPING CHALLENGED SCHOOLS SUCCEED 20
What makes it “turnaround” instead of “improvement”?
Does the school enhance students’ readiness to learn by providing significant social supports, such as advisories, counselors, after-school programs, targeted remediation, home outreach, etc?
Priority Schools
Ability Reality
Benchmark Indicator at the School Level
Does the turnaround leadership team have flexibility over how resources are spent?
Does the school receive sufficient additional resources to achieve the turnaround plan? (Depending on school size and level: $250K-$1M per year, sustained for 3 years, new or reallocated funding)
Is a lead partner organization deeply embedded with school/district leadership to plan and execute turnaround design, make best use of the operating conditions, and align other partners? Is that lead partner present in the school on an intensive basis, and is it contractually accountable for student performance?
Do the school’s principal and turnaround leadership team have the skills necessary for success?
Necessary School-Level Capacity
Does the leadership team have authority to adjust programming to support the turnaround plan, and to make choices and respond to crises with a minimum of compliance-driven oversight?
Program
Does the turnaround leadership have the ability to adjust the school schedule as needed?
Is the day and year significantly extended to allow for more time for learning and collaborating?
Time
Is extra compensation provided to pay staff for extra time, responsibilities, and leadership roles?
Money
Can the turnaround leadership team staff the school as needed? (Hiring/removal/placement, roles)
People
Necessary School-Level Operating Conditions
This table describes school-level operating conditions that support genuinely transformative reform. The two columns at right underscore the need to address the conditions at the policy/regulation/contractual level and in the ways those policies are carried out at the ground level.
These school-level elements of comprehensive, transformative turnaround are defined further in the table below. This table illustrates the larger design objective for the Innovation Zone: to enable school districts to develop and pilot the new structures and approaches they need at the system level in order to bring all students (and especially disadvantaged students) to proficiency. The Zone offers entrepreneurial districts a chance to literally reinvent themselves, and to do so thoughtfully and achievably on behalf of a cluster of under-performing schools that have been organized around a coherent turnaround/transformation plan. In this way, the Zone is at its core a district reform initiative. It simply approaches district reform through the access point of a district’s neediest schools.

SERVING EVERY CHILD WELL: WASHINGTON STATE’S COMMITMENT TO HELPING CHALLENGED SCHOOLS SUCCEED 21
Operating conditions – Moving from improvement to turnaround
Operating Condition
Traditional School Improvement
Comprehensive Turnaround
People Help current staff perform at a higher level•Staff development, coaching•Leadership development
Establish professional norms for human capital management•Turnaround leaders have authority,resources to staff the school as needed to fulfill the turnaround plan
•Incentives to recruit highly capableteachers•Flexibility on staff hiring, allocation, work rules•Flexibility, time to make staff development coherent
Money No real impact on budgetary authority in most cases•Additional resources (usually staff development)
Authority to reallocate budget to support turnaround plan•Ability to reallocate budget strategically•Sufficient additional resources to support the plan
•Pay for extra time•Pay for incentives•Pay for partner support
Time Some initiatives: adjust schedule within same‐length school day and year•Block scheduling•Extra common planning time for educators
Expand school day and year and reinvent schedule to implement turnaround plan•Significantly more time for teacher collaborating, instruction•Strategic assessment, re‐engineering of schedule to support plan
Program Improve quality of currentstrategies•Consulting support•Curriculum, instruction, assessment tools and strategies
Tailor program and overall school approach to suit needs of high‐challengeenrollments•Coherent, whole‐school plan•Integrate strategies to address impacts of poverty on students•Relief from compliance burden in order to focus on instruction

SERVING EVERY CHILD WELL: WASHINGTON STATE’S COMMITMENT TO HELPING CHALLENGED SCHOOLS SUCCEED 22
What Can We Learn from the Experience in Other States?
All states are struggling with what to do with their low-performing schools, identified both by No Child Left Behind and their own accountability systems. Under NCLB, 5,000 or more schools are expected to require restructuring by 2009-10. State approaches to meeting this challenge vary widely due to factors such as capacity concerns, political will, and the legal relationship between LEAs and the state. Several key points can be drawn from the experiences other states have had in trying to raise student achievement in their most challenged schools. Technical assistance is not enough. States differ widely in their will to implement meaningful school-level reforms. Such differences are certain to persist, but recent policy changes in many states, including those that had previously assumed a passive role, signify growing recognition of the need for states to adopt an active role in school restructuring. For example, Ohio, initially one of the more passive states, enacted regulations that dictate state takeover of chronically under-performing LEAs. In California, a state whose passive approach was a response to severe capacity concerns, officials have recently been implementing programs that increase state aid and technical assistance to LEAs that house the state’s lowest performing schools. Recent changes to restructuring regulations in Massachusetts provide state officials with the power to intervene in schools more quickly and dramatically. Arizona officials have reformed their accountability system in ways that reward LEA compliance with state directives. The reasons for such policy shifts are difficult to pinpoint, but likely include recognition of both enforcement requirements placed on states and the untenable political scenarios that can result from a passive state approach. Research suggests that meaningful change in chronically under-performing schools is more likely when the state assumes an active role.i This research also suggests that such change has been less likely to occur when states fail to, at minimum, take affirmative steps to ensure that LEAs engage in effective restructuring practices. With so many more low-performing schools being identified, failure to turn them around increases the pressure on states to intervene. Effective state intervention requires well-defined consequences. The experiences of some states suggest that an aversion to clearly articulating a complete continuum of intervention for under-performing schools – including a deeper state role in districts and schools that chronically under-perform at very unsatisfactory levels – can undercut the impact of other intervention strategies. In Michigan, for example, a passive state role was problematic when schools began “aging out” of the No Child Left Behind continuum of mandated interventions. Michigan’s reluctance to prescribe a deeper state role for these schools, exhibited by state officials’ pleas for federal guidance, has resulted in a stalling of reform and in increasing pressure on the state to respond more proactively. While Michigan’s lack of a complete intervention continuum is not unique among the states (40 percent have no specific authority under state laws to intervene at all), their implementation of No Child Left Behind has put their schools ahead of those in other states along the intervention continuum. It thus serves as an indicator of what may be in store for other states that choose a similarly passive route.

SERVING EVERY CHILD WELL: WASHINGTON STATE’S COMMITMENT TO HELPING CHALLENGED SCHOOLS SUCCEED 23
Without some form of “buck-stops-here” authority for the state when all other interventions have failed to produce results, states have struggled to spur substantial change in all schools. Faced with this challenge, several states have devised creative responses. Florida, a state that had publicly announced it would not take over schools, threatened to withhold discretionary funds and grants from districts (Local Education Agencies, or LEAs) in which chronically under-performing schools were located if the LEAs failed to implement a set of intrusive reforms at the school level. Virginia was not permitted to take over schools, so it embraced its ability to take corrective action against LEAs that house unaccredited schools. It used this power to create additional incentives for LEA compliance. The Arizona system now dictates that severe state interventions may result from either stagnant low performance or a lack of good faith restructuring effort by the LEA. Each of these states has used a more complete intervention policy continuum to create additional incentives at the LEA-level to encourage substantial reform. That form of leverage may, in fact, be the most useful application of a more complete intervention continuum for struggling schools, as the success record for state takeovers, historically, has not been bright. States must build capacity and coherence. The experience in states like Alabama highlights the need for capacity-building efforts and the benefits of improving the coherence of state responses to restructuring mandates. Alabama had experience with school restructuring, and state officials believed the state lacked the ability to sustain improvements at the school level without a strong local governance role. Their approach entailed providing the best possible assistance to LEAs as they undertake school restructuring efforts. Recognizing a lack of the capacity needed to support LEAs, Alabama created the Accountability Roundtable, a board composed of members of each division in the state’s Instructional Support Services department. This body created a coherent task force that could collaborate across departments to provide the unique services each struggling school required. Reports from Alabama indicate that Roundtable members have incorporated an understanding of restructuring into their in-department activities, and they conduct their daily work with an awareness of the effect their actions have on school-level restructuring efforts. Hawaii, on the other hand, is faced with an extraordinary capacity problem resulting from an unusually high percentage of schools in restructuring and the lack of local governance structures to undertake restructuring efforts. (The state has just one, statewide school district.) Its response has been to contract with private service providers, who consult with schools to conduct reform efforts. As the number of restructuring schools in Hawaii continues to rise, state allotments for such private services have naturally increased. Recent comments from Hawaii officials suggest the state is beginning to confront the reality that the cost of this approach will be problematic as the scale of schools in restructuring continues to increase. If costs become untenable, Hawaii will have provided services without building capacity within the state school system to carry on the work. These are far from the only examples of the issues that states are confronting, but they all have relevance for Washington State as it moves forward – as do the other examples provided to the SBE by intern Jessica Ganet and that are available through Mass Insight’s Turnaround Challenge report. The plan that we propose for Washington addresses these key points. It goes well beyond technical assistance to comprehensive support; it defines

SERVING EVERY CHILD WELL: WASHINGTON STATE’S COMMITMENT TO HELPING CHALLENGED SCHOOLS SUCCEED 24
the intervention continuum up front so that it is clear to everyone where their accountabilities lie; it encourages and enables districts to conduct transformative change, as opposed to incremental reforms; and it helps build much-needed capacity and coherence throughout the system.

SERVING EVERY CHILD WELL: WASHINGTON STATE’S COMMITMENT TO HELPING CHALLENGED SCHOOLS SUCCEED 25
Part Two: Recommendations for a Comprehensive Initiative
IV. The Innovation Zone A. Overview
1. What is the Innovation Zone? The Innovation Zone is a voluntary initiative to catalyze truly transformative school reform, using the lowest performing schools in Washington State – virtually all of which serve high-poverty, disadvantaged student populations – as the platform and entry point.
The Zone is:
• At the instructional level, a chance for educators to ask fundamental questions about what it takes to help high-challenge, high-poverty students succeed, and to reshape their approach from a focus on what’s being taught to a focus on what’s being learned.
• At the systems level, an opportunity for district and community leaders and their partners, supported by the state, to re-imagine and rebuild the structures and operating habits that shape the nature and quality of the education they offer
• At the policy level, an effort to pilot the next generation of standards-based reform in Washington State – an approach marked by greater degrees of accountability by every stakeholder in the enterprise
The Zone is not:
• Simply an effort to fix some broken schools • An initiative to distribute evenly whatever school intervention resources are
available across every challenged public school • A top-down, mandated state program.
Briefly: the Zone will be a partnership between state and local entities with agreed-upon roles, responsibilities, metrics for success, and consequences for all parties. In fact, the State Board and local boards will enter into a contract agreeing to the roles and accountability for each. Districts will be able to apply to be part of the Innovation Zone by submitting turnaround proposals on behalf of the Priority Schools in their district, and, if selected, will receive the supports and benefits of the Zone in exchange for meeting certain design criteria, standards for operating conditions, and benchmarks. Those requirements, which will need to be addressed collaboratively through the combined efforts of the superintendent and other administrators, school board, and teacher’s union, will include putting more flexible operating conditions in place so that every decision that is made is done so with the interests of the students and the mission of the school first in mind.

SERVING EVERY CHILD WELL: WASHINGTON STATE’S COMMITMENT TO HELPING CHALLENGED SCHOOLS SUCCEED 26
The Innovation Zone is designed to enable districts to turn clusters of low-performing schools into exemplars, and to demonstrate pathways for other schools and districts to become successful, high-functioning organizations. Its primary guiding principles (described in more detail earlier) are the paramount importance of success (as opposed to equity of resource distribution), the need for clarity and collaboration throughout, and fidelity to the idea of reciprocal accountability. If initial cohorts of Zone clusters are successful, they will provide the proof points needed to scale up the initiative and expand the conditions and strategies that made that success possible. The Zone (and the “backup plan” to the Zone described in Section V of this report) also is designed to answer the tough question of what happens when schools and districts don’t make progress, even with the additional supports. School turnaround, when students are demonstrably being under-served, can be voluntary only up to a certain point, at which time the state has a responsibility to intervene.
2. Is the Zone aimed at the school level or at the district level? The Innovation Zone is focused on enabling districts, using a systems approach, to transform themselves, using the leverage and urgency of turning around their lowest-performing schools. While the state will identify individual schools as Priority Schools, those schools exist within a system and the district must be part of the solution. Individual classrooms in schools are where change actually happens, but much of what happens in schools is directed or guided by their district. To only focus on individual Priority Schools does not take into account the full context in which those schools function. Districts are reticent to put substantial changes in place for single schools, particularly when there is significant internal student mobility between schools. Single-school reform places a strong focus on an individual school, but it carries significant inefficiencies and it may not provide a sustainable systemic solution – i.e., one that is scalable across a larger set of schools. Installing a gifted principal in one school is not comprehensive, systems-oriented turnaround. It will help that school (at least temporarily), and capable leadership is a requirement of any reform effort, but it does not address the larger, systemic challenges that underperforming schools – and their principals – typically face. To paraphrase urban reformer Geoffrey Canada: that kind of approach may help some kids beat the odds, but fails to change the odds. In the Innovation Zone, districts with at least one Priority School can apply to be part of the Zone on behalf of at least that one school, and will be encouraged to apply on behalf of a cluster of at least one Priority School with associated schools, either at the same level or in the same feeder pattern. This point was a note struck very strongly by superintendent members of the initiative’s Design Team. The cluster approach, they said, would help them address the need to make the reforms more systemic and potentially more scalable. For small districts, it would also be possible to partner with nearby districts that have a similar need or interest – say, to convert an under-performing middle school into a grade 6-12 academy. Clusters of schools that can support and learn from each other are more effective than a plan that focuses solely on the level of the individual school.

SERVING EVERY CHILD WELL: WASHINGTON STATE’S COMMITMENT TO HELPING CHALLENGED SCHOOLS SUCCEED 27
3. How does the Innovation Zone integrate with other efforts already underway? The Innovation Zone must integrate with other efforts already taking place in Washington, and supplement, not supplant those efforts. The difference is that the Zone will focus on comprehensive and transformative school turnaround, not school improvement. Turnaround is fundamentally different than improvement (as described in Part One, above), requiring a different approach and envisioning a different outcome. A major point of integration is OSPI’s new Summit Districts program, which focuses on districts rather than schools (where OSPI had been mainly focused in the past). Districts that are part of the Summit Districts initiative who are also eligible for the Innovation Zone could apply to be part of the Zone as well, but would not be required to. If they chose to apply, they would be encouraged to include the work they are already doing as a Summit district as part of their turnaround plan. This can be likened to two levels of linked “family health care”: one that involves a fairly intensive wellness campaign (Summit) and another that focuses a deeper level of intervention and care on individual family members (Priority School cohorts) that need the extra attention. The important thing is to ensure that the two levels of care mesh with each other and do not conflict at the level of the individual patient.
The Zone fits into the broader landscape of district and school improvement in Washington State as the most intensive initiative, focused on the most highly challenged schools. Other priorities are served by other initiatives currently being managed by OSPI.
B. Incentives and Roles for Participation in the Zone
1. What are the benefits of the Innovation Zone for each stakeholder? State intervention initiatives are often perceived to be nearly completely about sticks with few carrots. The Innovation Zone is an effort to reverse that dynamic. Its focus is on providing clear incentives – as well as responsibilities – to each stakeholder in the work: school directors, superintendents and other school and district leaders, teachers, and the state (represented by the Board, OSPI, and the Legislature along with the Governor).
SERVING EVERY CHILD WELL: WASHINGTON STATE’S COMMITMENT TO HELPING CHALLENGED SCHOOLS SUCCEED 28
Why should the SBE propose the creation of the Innovation Zone?
• Washington public schools serving predominantly disadvantaged students generally are not serving them well – or at least well enough to bring them to college-level proficiency by graduation.
• In the state’s lowest-performing schools – the bottom 5 to 7 percent – proficiency rates fall well below 50 percent and often much further (as low, in some schools, as a quarter or less, especially in math and science). The Board has been charged by the Legislature to develop an effective solution for these schools.
• It is the Board’s responsibility to ensure that public schools in Washington are meeting the needs of all students in the state and preparing them for successful, fulfilling lives.
• The Innovation Zone offers fairness with accountability: clear timelines, supports, and incentives for districts so they can show what they can do, coupled with a “backup plan” to provide deeper assistance to schools and districts that need the extra help.
Why should the Legislature support the Innovation Zone?
• Given the financial situation in the state, new investment in education should come with increased accountability for student achievement.
• Success in the Innovation Zone will generate the proof points, strategies, and structures that the Legislature needs to justify increased funding in the future.
• The Legislature shares the Board’s responsibility for ensuring that Washington’s children are prepared for college and the workplace.
Why would districts want to participate in the Innovation Zone?
• Fulfillment of the Guiding Principles and all that they imply, especially: • Resources to pay for implementation of key elements of the turnaround plan,
including additional time, staff, professional development, and partner support (see Section VII below for details)
• Flexible operating conditions and a streamlined compliance burden • Strong strategic and implementation support from an embedded lead partner
organization • Opportunity to pilot new internal structures and approaches in a “mini-district”
cluster, as a key element in district redesign (and a way to integrate this initiative with other, on-going district reform work)
• Opportunity to provide support for classroom teachers to improve their instruction
• Best opportunity to avoid having the school placed under greater state authority
Why would local school directors want to participate in the Innovation Zone? Local boards are public schools’ closest, most direct governors. Student achievement in their district is a direct reflection of their own performance. This highly visible state effort would represent a dramatic, positive signal that their district – despite the presence of at least one Priority School – is on the move.

SERVING EVERY CHILD WELL: WASHINGTON STATE’S COMMITMENT TO HELPING CHALLENGED SCHOOLS SUCCEED 29
• Additional resources – a key priority of every local board • The principle of reciprocal accountability, meaning: school directors will be able
to hold the state accountable for doing its part, or the deal is off.
Why would teachers and unions want to participate in the Innovation Zone?
• Teachers are deeply vested in raising student achievement and the Innovation Zone will give them more tools and resources to do so, including:
• More time for professional collaboration • More support for using data to target and improve instruction • Additional flexibility and time in the school calendar to ensure that they are
providing the individual attention that students need and can include the enrichment activities that educate the whole child
• The Innovation Zone represents a tremendous opportunity for teachers and union leaders to take on collaborative, leadership roles in designing and implementing reform, and to build on some of the most promising strategies that have already been pioneered by teachers, unions, and district/school management in districts across Washington State.
2. What are the roles and responsibilities for each stakeholder? The concept of reciprocal accountability, which emerged as a key guiding principle from the Design Team discussions, characterizes the role that every stakeholder plays in the Zone. It arises, in part, from the perception by Washington State practitioners that accountability is something that has been done to them, without the state taking on equal accountability to provide the resources necessary to meet higher standards for all students. In practical terms, what this means for the Innovation Zone is that in addition to there being consequences for districts that don’t raise achievement in their Priority Schools, if any of the state entities don’t live up to their responsibilities, then the “clock” for consequences at the school level stops. We propose that the State Board have a planning and oversight role for the Innovation Zone, and that the day-to-day implementation will be done by a new office within OSPI dedicated to that purpose (or increased staff capacity for a new section in the OSPI school and district improvement office). OSPI has deep experience in program implementation and monitoring, and this will help ensure that the interventions for the Priority Schools are connected to other OSPI intervention efforts. Another possibility for implementation is to create a new cross-functional state office that would have responsibility for Priority Schools, but we don’t recommend doing that. The same purpose can be accomplished by clearly defining responsibility within the existing structures. The table that follows lays out the roles for each stakeholder: Role/ResponsibilityState Board • Prepare, submit, and advocate for plan to Legislature for 2009 session
• Set initial factors for participation in Innovation Zone (first round of vetting) and essential elements required of all turnaround plans for Priority Schools

SERVING EVERY CHILD WELL: WASHINGTON STATE’S COMMITMENT TO HELPING CHALLENGED SCHOOLS SUCCEED 30
• Selection, approval of plans for Innovation Zone (on OSPI recommendations)
• Decision‐making authority for Priority Schools after two years and monitoring of schools that do not meet benchmarks (with Accountability Council assistance)
• Catalyst in developing deeper role for, and resource base of partner organizations
State Legislature • Sustained, adequate funding for the Innovation Zone • Necessary changes to WAC/RCW, as required, so that more flexible
operating conditions can be implemented and state intervention is mandatory at a certain point
Local district (superintendent)
• Initial expression of interest in Innovation Zone on behalf of one or more Priority Schools in the district
• Creation of turnaround plan based on analysis of district and school needs and context
• Implementation of operating conditions specified for participation in Innovation Zone (working with school directors and union)
• Oversight of plan implementation and monitoring of benchmarks OSPI • Diagnostic role and assistance in developing and implementing
proposals to enter the Zone • On‐going management of the Zone initiative, in general, including
assistance to districts in integration of Zone initiative with other reform efforts, including Summit initiative
• Analysis, monitoring of school progress and recommendations to SBE after two years of implementation and at four‐year mark
• Assistance on expansion of lead turnaround partner capacity in the state
• Membership on Accountability Council
Local school directors (with assistance from WSSDA)
• Coordinate local efforts to develop turnaround plan with superintendent/district administrators, principal(s), unions, community
• Facilitator and negotiator for creating operating conditions required for participation (with local union)
• Legal signer of the contract with the state for participation in the Innovation Zone
Local and statewide teachers union
• Collaborate with state and local school boards on contractual changes in order to fulfill state turnaround criteria
• Work with the state to build on relevant reforms already underway in Washington (e.g., the Seattle teachers contract and Flight schools) and extend their usefulness to other districts
• Invitation to partner with state on a program to develop highly skilled lead teachers to serve on Innovation Zone school leadership teams, possibly with university involvement
Lead turnaround partner organizations
• Assist district in developing turnaround plans that meet the state’s essential elements
• Work in close conjunction with districts and schools to implement the turnaround plans and lead turnaround effectively (and build on it to help schools become high‐performing organizations)
• Specifically, work with school/district leadership to coordinate and integrate the work of all subcontracting school partners to ensure coherence with the turnaround plan

SERVING EVERY CHILD WELL: WASHINGTON STATE’S COMMITMENT TO HELPING CHALLENGED SCHOOLS SUCCEED 31
C. Step by Step through the Innovation Zone Note: numbers below correspond with milestones in the graphics presented on the next two pages. The graphics show how the Innovation Zone serves districts that elect to apply into the Zone (first page with dark blue milestones) and how it remains open to districts that show interest initially but are not selected and those that do not initially elect to apply, and whose Priority Schools continue to lag (second page with light blue milestones).

SERVING EVERY CHILD WELL: WASHINGTON STATE’S COMMITMENT TO HELPING CHALLENGED SCHOOLS SUCCEED 32
1
1
INNOVATION ZONE
1. State identifies Priority Schools and sets readiness factors for application to Innovation Zone. Initial response from interested
districts.
2. Districts selected from first round applicants and get assistance to develop
full plan
4. District selected for Innovation Zone and conducts preliminary
implementation
5. State evaluation of leading indicators
6. Has school left Priority status?
6a. District submits new plan.
6b. District keeps receiving support
7b. State does not approve new plan. District referred to Accountability Council.
NO
Preliminary Ground Preparation
YES
3. Districts submit turnaround plan showing how they will implement the state’s essential elements and criteria for effective turnaround
Year Two
Implementation Year One
Washington State’s Innovation Zone: Initial Cohort
7a. State approves new plan – district
implements plan
Year Four
8b. District continues receiving support
8. Has school left Priority status?
8a. District referred to Accountability Council.
YESNO

SERVING EVERY CHILD WELL: WASHINGTON STATE’S COMMITMENT TO HELPING CHALLENGED SCHOOLS SUCCEED 33
2
2
1. State identifies Priority Schools and sets readiness factors for application to Innovation Zone. Initial response from interested
districts.
10. Districts are not chosen for Innovation Zone or choose not to apply
12. Has school left Priority status?
12a. District goes through process of joining
Innovation Zone for next cohort with full turnaround
plan
12c. District continues on its own
12b. District does not seek to join Innovation Zone or submit an acceptable plan. District referred to Accountability
Council.
NO
Preliminary Ground Preparation
YES
Year Two
Year One
Washington State’s Innovation Zone: Options and Outcomes for Non‐Participants in the Initial Cohort
11. District works to raise achievement on its own with existing resources and
supports
*Process on previous page

SERVING EVERY CHILD WELL: WASHINGTON STATE’S COMMITMENT TO HELPING CHALLENGED SCHOOLS SUCCEED 34
What are the eligibility requirements? 1) State identifies Priority Schools and sets readiness factors for application
to Innovation Zone. The first step is the state identification of the Priority Schools according to the Accountability Index (currently being developed by the State Board). These schools need to meet a common-sense test: most reasonable people should look at the criteria and their corresponding performance data and conclude that this group of schools clearly needs to be helped in very significant ways. This identification process will include analysis of additional factors and context that will be useful in the districts’ development of their Innovation Zone plans. We recommend that the identification of Priority Schools come after the formation and announcement of the Innovation Zone, so that there will be no uncertainty about what Priority status brings. Once the Priority Schools have been identified, the State Board will implement the first of two hurdles that make up its vetting process for Innovation Zone participation. This is an important point. Identification as a Priority School will not mean automatic support from the state. There are a number of reasons why: not enough resources to provide meaningful support to every school that needs it; not enough clarity and knowledge (yet) about the most effective and efficient ways to spend the resources that are available; the possibility that some districts are already engaged in extensive reform initiatives and would elect not to participate in the Zone, no matter what supports are offered; and the importance of working, in the initial Zone cohorts, with districts and schools that are demonstrably ready to engage in a fundamental, transformative kind of reform process. Innovation Zone supports will not be an entitlement. Districts will have to earn them by showing they are ready to use them well. The first hurdle requires districts to demonstrate an initial level of readiness, using a set of “readiness factors” defined by the Board (see below). On a timeline set by the Board, districts with at least one Priority School will be eligible to submit a response showing how they meet – or plan to meet – the readiness factors. The point of this hurdle is to save districts (and the state) from putting the time into creating and reviewing reform plans that will not meet the Innovation Zone criteria (that’s the second hurdle). Districts with at least one Priority School can choose to submit a response or not. (Note: The State Board should not simply issue a Request for Applications and see who responds; given that this is a new initiative, there should be a period of fairly extensive outreach and communication so that all districts with Priority School(s) understand the benefits of participation and the ramifications for choosing not to apply.) The local school board is the entity that would formally submit this application, but other key leaders – particularly the superintendent and the teacher’s union – will need to be clearly engaged and supportive of the approach in order for the application to be successful.

SERVING EVERY CHILD WELL: WASHINGTON STATE’S COMMITMENT TO HELPING CHALLENGED SCHOOLS SUCCEED 35
What are the initial readiness factors? Readiness factors for application to Innovation Zone: While districts with Priority Schools will not all meet every readiness factor, the questions and categories outlined below would help them connect local stakeholders around the opportunity represented by the Zone. Their responses would enable the state to prioritize among interested districts and to provide useful feedback to districts that need to try again. Districts may submit preliminary responses on behalf of either only their Priority School(s) or a group of schools containing the Priority School(s) so that reform can be more systemic. For example, if a district has one middle school identified as a Priority School, it may decide to submit a response that is focused on only that school, or on that school and the two elementary schools that feed into it, or for all three of its middle schools. In addition, a group of districts in a region (likely small districts with single Priority schools) may respond in a regional cluster, organized around a particular level or strategy (e.g., a new-model high school with career-academy approach).
“Readiness Factor” Questions: Is Your District Ready to Participate in the Innovation Zone? The State should ask questions such as the following to determine which districts best meet the readiness factors. Many district respondents may not have specific examples to cite of initiatives that represent the factors listed here. The point is to assess their understanding of the factors’ importance and the leaders’ commitment to pursuing them.
• Has your district created a support system to assist schools producing consistently low levels of student achievement or that chronically underperform against annual improvement goals?
o To illustrate your response to this question, please provide a brief description (can be an existing document) of your district's plan to support struggling schools:
Assessments and metrics used Demographic information on Priority Schools and
achievement by student subgroup A brief description of the current strategies and supports
• What demonstrations can you provide of your district’s openness, in
general, to innovative new reform ideas and strategies? To what extent, if any, have these innovations been applied to chronically underperforming schools, or in high-poverty schools?
o To illustrate your response to this question, please briefly profile your district’s examples of innovative schools or programs, with a focus on those serving disadvantaged communities: magnets, grade 6-12 academies, community partnerships, etc.

SERVING EVERY CHILD WELL: WASHINGTON STATE’S COMMITMENT TO HELPING CHALLENGED SCHOOLS SUCCEED 36
• What evidence can you show that your district recognizes, through its
policies and programs, that effective support in underperforming schools depends in large part on an effective “people strategy” that recruits, develops, and retains strong leadership teams and teachers?
o To illustrate your response to this question, please describe the current ways that principals are named to lead schools, and how they are prepared and supported to be successful in their school. Please describe any current district-sponsored leadership development initiatives, and/or any other notable initiatives in this vein that are sponsored by school districts, foundations, or non-profit organizations and that are active in your district.
• What evidence can you provide of strong relationships in your district
between schools and partner organizations? Briefly describe the partners working in your district, including not-for-profits, universities, and regional education support districts. What outcomes, if any are available yet, have these relationships produced?
• What evidence can you provide that your district has aligned its
curriculum to state standards, and has the ability to provide the student information and data analysis systems schools need to assess learning and individualize teaching?
• What evidence can you provide that key leaders in your district – the
Superintendent, school directors, local union leaders, and community leaders – agree on the need for more intensive turnaround strategies in the district's Priority School(s)?
o To illustrate your response to this question, please describe an initiative underway in your district during the past three years that called for similar levels of consensus and collaboration.
o Though signatures from all of the key stakeholders are not required for Zone applications, they are strongly encouraged.
How are districts selected in the first round to receive planning funding and what happens then?
2) Districts selected from first round applicants and get assistance (resources and expertise) to develop a comprehensive turnaround plan. Once the eligible districts have submitted an initial response, the State Board (based on OSPI input) will evaluate them and select those that meet the required elements to move forward to the next step, which is receiving funding and resources (including content expertise) to support the development of a full plan. (Some districts might be asked to submit a revised response.) This is the second point at which the field will be

SERVING EVERY CHILD WELL: WASHINGTON STATE’S COMMITMENT TO HELPING CHALLENGED SCHOOLS SUCCEED 37
narrowed. As it will require a significant investment of time on the part of the districts to create a complete turnaround plan, the State Board should be mindful of the proposed budget here and refrain from choosing more districts than there is ultimately funding to support to move to this next stage. However, moving on to the stage of receiving funding to develop a full plan should not guarantee selection for the initial cohort of the Innovation Zone. One or more districts may show, in the development of their plan, an inability to meet Zone criteria. Under the “success as the highest priority” guiding principle, no implementation funds should go to these districts. The State Board at this point will provide guidelines and criteria for the process of developing a complete turnaround plan and what it must contain. The full plan should address the criteria presented below, and should continue to demonstrate how the local entities (superintendent, school board, principal, union leader) are in alignment and plan to work together to implement the plan. Resources for this planning period include $50,000 planning grants per district (see proposed budget below), to be allocated in two installments – one for the development of the plan and one for the preliminary implementation in year 0, provided the plan is approved. Non-financial resources could include OSPI help in further diagnostic work, assistance with data analysis and determining solutions, and planning support from a partner organization that would become a proposed part of the district’s implementation plan. (Note: the state will be tasked with supporting the development of turnaround partner organizations to assist in this process; see Section VI for more.)
What criteria should the State Board issue for the creation of turnaround plans? What are the essential operating conditions districts need to meet in order to be selected? The guidelines that the State Board sets forth should require that every turnaround plan address specified criteria for supportive operating conditions in Innovation Zone schools – conditions that research indicates are necessary for higher performance from high-challenge, high-poverty student enrollments. By establishing specific criteria, the state can also assure legislators and other policy-makers that every school's turnaround effort will meet an "adequacy threshold" justifying state support, and allow for some consistency in approval and oversight processes. While the State should require that every district turnaround plan address each of the criteria, it should also allow flexibility in implementation to address the district's particular needs and circumstances. Identified below is a recommended set of criteria for Washington's Innovation Zone. The state should allow different approaches to the various criteria, and let districts and lead turnaround partners creatively propose strategies within turnaround implementation plans that fit within this overall framework.

SERVING EVERY CHILD WELL: WASHINGTON STATE’S COMMITMENT TO HELPING CHALLENGED SCHOOLS SUCCEED 38
Recommended State Criteria for Operating and Instructional Conditions
People: 1) School-level turnaround leader: The turnaround plan designates a school-
level leader to exercise autonomies under the plan and ensure adherence to the turnaround model. Depending on the overall turnaround approach, the leader may be a principal designated by the district or a leader working under the direction of a lead turnaround partner.
2) Highly capable, distributed school leadership team: The turnaround plan must demonstrate how the school will be put on a path to distributed leadership, with a highly capable leadership team working to build a cohesive, professional teaching culture. The plan for a distributed leadership team should include the school-level turnaround leader, teachers with augmented school roles, and other community/parent/partner members as recommended by the turnaround plan.
3) Flexibility and control over staffing: The school-level turnaround leader, acting on input from the school’s leadership team, should have authority to select, counsel out, and assign staff to positions in the school as needed to support the turnaround plan and to ensure the highest-possible quality faculty in the school.
4) School-level Lead Turnaround Partner: The school turnaround plan includes a lead partner organization that brings critical capacities to turnaround planning and implementation, and helps to integrate the work of all other partners, subcontractors, agencies, and state support.3
Program: 5) Personalized student supports: The turnaround plan must identify
personalized academic and non-academic support services for targeted instructional interventions and to address student social and emotional needs.
6) Aligned and data-driven instructional systems: The turnaround plan specifically implements the following instructional systems and strategies: • Alignment of curricula, assessments, and professional development to
state standards and college- and work-ready expectations; • Development and use of frequent formative assessments permitting
immediate analysis, feedback, and targeted instruction; and • Data-driven decision-making for all activities relating to curriculum
development, instructional strategies, and student-level interventions. 7) Integration of existing instruction and professional development
activities: The turnaround plan must identify all state, district, and school instructional and professional development programs currently impacting the
3 This could be a requirement for all districts – or only those districts that are not able to show they have capacity to develop or implement a turnaround plan on their own or once a district reaches one of the mandatory stages of participation.

SERVING EVERY CHILD WELL: WASHINGTON STATE’S COMMITMENT TO HELPING CHALLENGED SCHOOLS SUCCEED 39
school, and demonstrate how these programs will be integrated with or eliminated by the turnaround effort.
Time: 8) Extended learning: The school schedule for student learning must provide
significant additional time on a daily, weekly, and/or annual basis for the delivery of instruction and provision of individualized support as needed in core academic subjects and for enrichment activities. The school's leadership team must have the ability to adjust the schedule as needed to support the turnaround plan.
9) Faculty collaboration: The weekly and annual work schedule for teachers must provide adequate time for regular, frequent, faculty meetings to discuss individual student progress, curricular or grade-level teaching approaches and other reforms, and school-wide efforts in support of the turnaround plan. This could include the creation of Professional Learning Communities focused solely on student achievement.
Money: 10) Control over financial resources: The team leading the turnaround must
have control over financial resources necessary to successfully implement the turnaround implementation plan, including the ability to pay staff for additional time, additional responsibilities, and incentives to work in the school and (collectively) to succeed. That would include reallocating existing funding as well as allocating the additional Innovation Zone resources.
Why accomplishing more latitude in operating conditions is so critical As we noted in Section III above, there are exemplars of schools that serve high poverty, challenging populations well and have strong records of student achievement. The HPHP research we reviewed for The Turnaround Challenge indicates that what many of them have in common is they have managed to achieve more flexible operating conditions and are able to make the decisions that matter most with their mission and students at the forefront – rather than with other time-bound, contractual-, or regulation-driven priorities in mind. In many schools, far too many decisions are made with the interests of adults in mind. These operating conditions include control over resources (fiscal and other), the length and scheduling of school time, school staffing, and programmatic decisions. The leadership team at the school needs to be able to identify and remove the obstacles that are preventing the school from meeting students’ needs.
How can districts go about putting those conditions in place? How can the state help? The schools that have flexible operating conditions have attained them through different means. For some, it’s by virtue of their status as a pilot school (as in Boston) or something similar; for others the flexibilities have been negotiated

SERVING EVERY CHILD WELL: WASHINGTON STATE’S COMMITMENT TO HELPING CHALLENGED SCHOOLS SUCCEED 40
with the local union (as in Chicago, Miami, and New York City, among other districts); and in some cases an enterprising principal has just insisted on them, despite the constraints of the system in which he or she is working. The Innovation Zone represents the best opportunity for Priority schools and their districts to institute this operating latitude – a final opportunity, before the state begins to assert more active control in the wake of continuing underperformance. These operating conditions must be set up as essential elements for districts and schools to participate in the initiative, but the greatest chance for successful implementation will be if their development happens locally in a collaborative way involving all stakeholders. Those districts that are able to do that will show that they have the greatest chance for success as part of the Innovation Zone. It is clear that some of the criteria for participation in the Innovation Zone overlap with practices currently governed by collective bargaining agreements. The state, led by the State Board, should take a two-pronged approach to helping districts who wish to participate meet the criteria. One is that the state can support districts in working with their local unions to negotiate the necessary changes in the contract. The second prong is that the state should seek to provide maximum flexibility from both federal and state restrictions that may inhibit turnaround implementation. • Assistance with collective bargaining: The state’s role would be to collect
and provide examples and model template language from existing contracts in Washington or from other states. There are examples of collaboratively produced language in some local contracts already and these could provide at least a partial basis for templates to be used by districts with Priority Schools across the state. Please see Part III of this report for sample language, developed for use in Washington State using a blend of local contracts and national models and for examples of how other states have sought to address this issue.
Waivers and funding flexibility: The state could specifically target regulatory and funding flexibility to schools within the Innovation Zone through a number of approaches already being piloted in other states. These are also outlined in Part III.
How are districts selected and by whom? 3) Districts submit turnaround plan showing how they will incorporate the
state’s essential elements for effective turnaround. At the midpoint of the planning period, districts will submit comprehensive turnaround plans to the State Board. Once the plans are submitted, they are evaluated and decisions made about who will be part of the initial cohort of the Innovation Zone. OSPI should manage the review process, and make recommendations to the Board. The Board will make its selections based on a series of considerations, including:
• Strength of the proposal and degree to which it specifically fulfills the Board’s turnaround criteria and conditions
• Demonstration of local capacity to collaborate to implement conditions and plan

SERVING EVERY CHILD WELL: WASHINGTON STATE’S COMMITMENT TO HELPING CHALLENGED SCHOOLS SUCCEED 41
• Funding availability (number of schools state is able to fund and at what level)
• Strategy around regions/locations, school levels, district capacity, partner support, likelihood of success
• Maximizing the chances for success may mean choosing some clusters over others with equal or greater needs, simply because in the judgment of OSPI and the Board, the former are readier to fully embrace the changes reflected in the state turnaround criteria. The point, once again, is that the state’s highest priority in this initial implementation of this initiative is not to serve every district, community, school, and child who needs help – at least not immediately. The most immediate need is to show what success can look like, how to get there, and what resources and conditions changes are required to allow it to happen.
4) District is selected for Innovation Zone and conducts preliminary
implementation. Once the districts are chosen, the State Board draws up the agreement with the local school board. The deep involvement and support of the superintendent and the local union are very desirable, in fact necessary, for a successful plan; however, they are not legal signers of the contract. The contract is designed to represent the “reciprocal accountability” understanding that provides the basis for this new partnership between the state and the districts. We would suggest that the overall goal of school turnaround in general is to close the poverty achievement gap within five years (e.g., to have the Priority Schools meet the state non-poverty achievement average), with points along the way to determine if the school is moving in the right direction (moving out of Priority status and to higher tiers on the Accountability Index) and if not, what to do about it. Those interim indicators include achievement on WASL, but should not be limited to that measurement alone. Additional metrics are discussed below. Elements the contract should include:
• Specific program elements relating to the district’s Innovation Zone plan • Investments and supports expected of the state • Timeline of contract and benchmarks for performance – Five years overall
with decision point at two years. (If the Priority School has not left Priority status after two years and is unable to come up with an acceptable revised plan, the district is referred to the Washington State Accountability Council – or “Accountability Council” for short, see Section V – for a recommendation under the state’s Academic Receivership program. After four years of Zone participation, the school is expected to have left Tier 4. More on this below.)
• Reporting requirements – what the district needs to provide to the State Board (both financial and academic) and they support they will receive to do so.

SERVING EVERY CHILD WELL: WASHINGTON STATE’S COMMITMENT TO HELPING CHALLENGED SCHOOLS SUCCEED 42
• Once the contract is signed, the district receives the agreed-upon resources (see proposed budget below) and moves ahead with implementation. On the suggested timeline we present below, the districts would have most of a year for planning, recruiting, and preliminary staff development. We regard this planning time as crucial to the enterprise – and so does the Design Team.
Who oversees the efforts and performs evaluations of progress? AFTER ONE YEAR: 5) State evaluation of leading indicators: After one year, the state
evaluates how well the districts are fulfilling the criteria and the terms of their turnaround plan. While major changes in student achievement could not be expected within one implementation year, the state obviously has a strong interest in monitoring whether districts and schools are on the right track at that point. The state will look at some leading indicators (such as those listed below) after one full year of implementation as well as tracking how well the districts have been able to implement the “inputs” – the elements of the turnaround plan and criteria and conditions. The district must submit a report at the end of the first year that includes the following elements:
• Attendance rates • School climate – from surveys and/or records of disciplinary actions • What changes in staffing have been made and what the leadership teams at
both the district and school level look like • Whether the school day or year has been extended, how so, and with what
impacts • What supports have been put in place for at-risk students • What data and assessments systems are being used and how that data is
informing classroom instruction and curriculum alignment • How professional development time and faculty collaboration have been used
to implement the turnaround plan • Financial information – how has the school budget been realigned to support
the turnaround plan and how have the additional Innovation Zone resources been used so far?
• *The metrics evaluated at the end of year one should correspond, where possible, to both the conditions and criteria set out by the State Board for participation in the Innovation Zone and to the items used for the deeper analysis done to identify Priority Schools.
If districts have not been able to show a significant level of impact in the Priority Schools, the State Board reserves the right in the contract to require a deeper examination of the plan and the district’s implementation, and to provide additional support to the district (through OSPI or outside partners) as needed to enable the plan to move forward.

SERVING EVERY CHILD WELL: WASHINGTON STATE’S COMMITMENT TO HELPING CHALLENGED SCHOOLS SUCCEED 43
AFTER TWO YEARS: 6) Has school left Priority status? After two full implementation years, the
state (through OSPI) evaluates whether the Priority Schools have met the expectation that the school(s) leave Priority School status.
6a) If NO: District submits revised plan. If the Priority School is unable to
leave Priority School status after two full implementation years, it will be required to revise and resubmit its turnaround plan to address problem areas identified in the first two years (through OSPI analysis). The State Board may require the district to engage more deeply with an outside partner as part of the revised plan. The Board at this point has a couple of options: 7a) The state approves the new plan and allows the district to
implement the revised plan and continue managing the Priority School(s). If the Board decides that the revised plan shows promise in enabling the district to exit Priority status, it can allow the district to continue receiving the benefits of being part of the Zone and continue local control and management of the Priority School(s).
7b) The state does not approve the revised plan and the district is referred to the Accountability Council. If the Board does not think that the district’s revised plan will support significantly increased achievement in the Priority School, then the school will be referred to the Accountability Council. Details of the options available to the Accountability Council are in Section V, Academic Receivership.
6b) If YES: District keeps receiving support. If the Priority School has left
Priority status, then the district continues to implement the turnaround plan, remains part of the Innovation Zone, and continues to receive support. There will be further expectation that the school will have moved into Tier 3 or above by the four year point.
AFTER FOUR YEARS: 8) Has school left Priority status? There is another checkpoint at the four
year point for districts that did not get their Priority School(s) out of Priority status after two years but were allowed to continue based on a revised plan.
8a) If NO: District referred to Accountability Council. If at the four year
mark, the school(s) still have not gotten out of Priority status even with a revised plan, then the district is referred to the Accountability Council.
8b) If YES: District keeps receiving support. If at the four year mark, the
school(s) have left Priority status, then the district continues to receive Innovation Zone support for the fifth year.

SERVING EVERY CHILD WELL: WASHINGTON STATE’S COMMITMENT TO HELPING CHALLENGED SCHOOLS SUCCEED 44
What about districts that have Priority schools but do not participate in the Innovation Zone in the beginning? 10) Districts are not chosen for the Innovation Zone or choose not to
apply. There will be districts that have Priority School(s) that apply to the Innovation Zone but are not selected, either because of funding constraints or because they could not create an acceptable turnaround plan. There also will be districts that, for a variety of reasons, choose not to apply. They may feel that their existing plans for raising student achievement are getting the job done, or they may not trust that the resources and benefits of the Zone will really come through. They may also not be willing or able to meet the criteria that the state sets out for participation. Regardless of the reasons, if a district chooses not to apply, the consequences of that decision are clear up front. This needs to be part of the State Board’s outreach efforts around the Innovation Zone. Every district with Priority School(s) must make an informed decision and must be prepared for the sequence of events that will follow. The next steps for those districts include the following:
11) The district works to raise achievement on its own with existing
resources and supports. While these districts will not receive the resources or benefits of being part of the Zone, their achievement will be monitored closely. They will work to move their schools out of Priority status using existing resources and supports.
AFTER TWO YEARS: 12) Has the school left Priority status? After two years, was the district able
to move the school(s) out of Priority School status? 12a) If NO: District goes through process of joining Innovation
Zone for the next cohort with a full turnaround plan. If the district has not been able to move the schools out of Priority status after two years then there are two possibilities. One is that the district applies to join the next cohort of the Innovation Zone and goes through the process of planning for turnaround. It is expected that there would be a second cohort of the Innovation Zone starting after two years.
12b) If NO: District does not seek to join Innovation Zone or does not submit an acceptable plan. If the district has not been able to move the schools out of Priority status and either still chooses not to apply to the Innovation Zone or cannot put together an acceptable plan that meets the State’s criteria, then the district will be referred to the Accountability Council for next steps. These districts will have been given every opportunity to avoid this happening, but if they still cannot raise achievement on their own and won’t at least put together a plan for how they are going to do so, then the State needs to step in.
12c) If YES: District continues on its own If the district has successfully raised achievement in its schools originally identified as Priority Schools to the point where they are no longer in that

SERVING EVERY CHILD WELL: WASHINGTON STATE’S COMMITMENT TO HELPING CHALLENGED SCHOOLS SUCCEED 45
category under the Accountability Index, then the district will continue to implement its own plan.
Proposed Timeline Fall 2008 – Spring 2009
Final State Board of Education proposal development Priority Schools identified according to Accountability Index
Spring 2009 (May) Legislative action on Board’s proposals for fiscal year 2009-2010 – authorization, funding, and any necessary changes to WAC/RCW
Summer 2009 First step of recruiting/vetting process for participating districts: Districts with at least one Priority School express initial interest in participating in the Innovation Zone with an outline of a plan that will meet state’s readiness factors Capacity-building begins among turnaround partner resource base and at OSPI to manage the initiative
Fall 2009 Second step: Districts selected from Step 1 are provided with assistance (resources, expertise, assistance from partner) to create a turnaround plan for participation in the Innovation Zone
Late Fall 2009/Winter 2010
Districts submit turnaround plans; State Board (with OSPI input) selects initial cohort and approves plans State sets two year goal of moving out of Priority status for all Priority Schools
Spring/Summer 2010 Districts and schools selected for Innovation Zone; together with their partners, plan for implementation and conditions change; recruiting, any staff changes; professional development and culture-building during the summer
Sept 2010 – Aug 2011 Year 1 of implementation of Innovation Zone At end of Year 1 of implementation, OSPI evaluates how well districts in Zone are meeting the criteria and conditions; reports to State Board
Sept 2011 – Aug 2012 Year 2 of implementation At end of Year 2 of implementation, evaluation as to whether ALL Priority Schools (and schools that are part of a Priority Schools cluster) have moved out of Priority status. Innovation Zone districts whose school(s) do not leave Priority status submit revised plan – State Board determines whether plan is approved and district continues as part of Zone or not approved and Priority School is referred to the Accountability Council. Non-participating Priority Schools that move out of Priority status continue on their own. Those that do not move out of Priority status either opt into Zone or are referred to the Accountability Council. Entire program is reviewed and adjusted as needed. If the initiative has produced promising results, State Board returns to the Legislature for new dollars to begin a more sizable second cohort.
Sept 2012– Aug 2013 Year 3 of implementation

SERVING EVERY CHILD WELL: WASHINGTON STATE’S COMMITMENT TO HELPING CHALLENGED SCHOOLS SUCCEED 46
Sept 2013 – Aug 2014 Year 4 of implementation For districts in the Innovation Zone that did not move schools out of Priority status after two years but submitted an approved revised plan, evaluation of whether they have done so after four years. If they haven’t, they will be referred to the Accountability Council. For districts that did move their schools out of Priority status after two years, evaluation of whether they have moved them further (into Tier 3 or higher).
Sept 2014 – Aug 2015 Year 5 of implementation Evaluation of whether Priority Schools match average state non-poverty achievement.

SERVING EVERY CHILD WELL: WASHINGTON STATE’S COMMITMENT TO HELPING CHALLENGED SCHOOLS SUCCEED 47
V. Academic Receivership: The “Backup Plan” for the Zone A. Introduction and Context The Innovation Zone represents a primary strategy in Washington State’s overall efforts to significantly improve student performance, particularly in schools and districts serving highly challenged, higher-poverty student enrollments. It is the state’s most comprehensive and intensive strategy, focusing on enabling districts to create and implement more transformative turnaround initiatives in their most persistently low-performing schools The Zone calls for a strong degree of local collaboration among leading stakeholders: the school board, superintendent and other district and school leadership, teachers union, and municipal leaders, as well as the active assistance of community-based organizations, other state service agencies, and a lead turnaround partner organization. The idea is that in these low-performing schools, the state has a responsibility to provide the urgency, the resources, and the framework (the Zone’s criteria set for operating conditions change and turnaround design) necessary for local leaders to practice “disruptive reform.”4 The status quo clearly hasn’t been serving students in these schools well enough and needs to be interrupted. But the basic elements and structures of school and district management and governance remain in place. Like many forms of alternative medicine (which stimulate the body to repair and renew itself), this is the state’s effort to stimulate the current school and district structure to show what it can do. But, just as some injuries, illnesses and chronic health conditions require more intrusive medical intervention, so inevitably will some schools and districts. For a range of reasons, some local Zone initiatives will not produce the desired results. The national record amply demonstrates how difficult it is to turn around persistently low-performing schools. Districts and schools may fail to identify and apply adequately skilled leadership and/or teachers (insufficient capacity), or to provide adequately supportive operating conditions (insufficient conditions change), or to organize the initiative systemically across a number of schools to fully embed the reforms so that they have a chance to endure (insufficient clustering). In Washington, a few districts may not even get that far into strategy implementation, demonstrating an inability to collaborate well enough to meet the state’s criteria for entrance into the Zone. Whatever the reason, in a state with close to 2000 schools that is working hard to achieve significantly higher achievement standards in all of them – including those serving communities with high concentrations of poverty – the state and its education partners must expect to have a backup plan to the Innovation Zone. It simply stands to reason that some districts and schools may require more help.
4 See Disrupting Class: How Disruptive Innovation Will Change the Way the World Learns. Christensen, Clayton. McGraw-Hill, 2008. A worthwhile new book on ways to catalyze transformation in education, as opposed to incremental reform with marginal results.

SERVING EVERY CHILD WELL: WASHINGTON STATE’S COMMITMENT TO HELPING CHALLENGED SCHOOLS SUCCEED 48
There is another explanation (and an important one) why the state needs to provide for such a circumstance. Change is hard – and real change is even harder. Elementary and secondary education resists change as well or better than any other form of public enterprise. Part of the state’s responsibility in enabling districts and schools to work effectively within the Zone rests on its ability to catalyze a sense of collective local urgency: the time for marginal improvement efforts is over. That means creating a deadline, and deadlines are only effective if they carry a clear and meaningful consequence. It is the deadline (and its consequence) that provides the urgency required to change the incentives that drive behavior. We use the term “consequence” guardedly. No Child Left Behind and state accountability provisions (and the experience of many states in implementing them) have generated an unproductive, emotion-filled climate around discussions of consequences for academic under-performance. It becomes difficult not to think of it all in parent-child terms: the state acting as parent, punishing a misbehaving or wayward child. The result, like many parent-child interchanges, is that real issues and real goals become obscured by clouds of emotion-fueled turf protection, mistrust, and, quite often, miscommunication. In the “backup plan” to the Zone that we describe here, by contrast, we will strive to replace this unproductive dynamic with another one – one characterized by the Guiding Principles that our Design Team developed to shape this entire initiative. We repeat them here for emphasis:
1. The initiative is driven by one mission: student success 2. The solution we develop is collective 3. There is reciprocal accountability among all stakeholders 4. To have meaning, reciprocal accountability is backed by reciprocal
consequences 5. The solution directly addresses common barriers to reform 6. The solution requires a sustained commitment 7. The solution requires absolute clarity on roles
Imbuing the entire initiative, including the Innovation Zone and its “backup plan,” with these principles is the only way to ensure the desired result: broad consensus from the field and from state policymakers that the state’s accountability provisions are clear and transparent; fair to the practitioners, to public education’s governors at every level (community and state), and to its primary investors (the legislature); and aimed as directly as possible at the only goal that has any real meaning: increased student achievement.
B. Structure of the Intervention Continuum: Zone plus Backup Plan Fulfilling this ambitious agenda requires that we articulate and organize all of the various options for intervention and restructuring that make up the turnaround landscape today. Not all of these options are strategies that we believe Washington State should implement. The Board may use the whole analysis with

SERVING EVERY CHILD WELL: WASHINGTON STATE’S COMMITMENT TO HELPING CHALLENGED SCHOOLS SUCCEED 49
the state’s most informed stakeholders on these issues, but would use a distilled version for broader public outreach. The most visible set of intervention options for persistently low-performing schools is the five “flavors” of restructuring outlined by NCLB for schools reaching its most extreme level of under-performance. (Note: we have re-ordered and labeled the five options for purposes of clarity here.)
1. [Revision] Engage in [a] form of major restructuring that involves fundamental reforms, such as significant changes in the school’s staffing and governance
2. [Reconstitution] Replace “all or most of the school staff (which may include the principal) who are relevant to the failure to make adequate yearly progress”
3. [Contract Management] Contract with “an outside entity, such as a private management company, with a demonstrated record of effectiveness, to operate the school”
4. [State Management] Turn the “operation of the school over to the state educational agency, if permitted under State law and agreed to by the State”
5. [Charter Conversion] Reopen the school as a public charter school
The NCLB option set was poorly designed in a number of ways. It amounts to little more than an undifferentiated laundry list of possibilities, ranging from the fairly benign (particularly #1) to radical changes in management in governance, including some that are specifically prohibited by pre-existing law in many states (including Washington). The wild-card option we call “Revision” leaves itself open to broad interpretation and has been used by districts and schools across the country as an easy way out of implementing truly substantial reform. Though NCLB theoretically provides backbone to support states’ accountability-driven efforts to restructure their lowest-performing schools, without real consequences for non-compliance – or lack of a substantial response under the “Revision” option – the NCLB restructuring provisions have not been the catalyst for fundamental reform that the law’s framers envisioned. As a practical matter for Washington State, we do not use the NCLB option set as a framing tool or organizer for our proposed intervention continuum. Washington State can do much better. The work of school intervention (and, for that matter, running public schools in general) can be divided into five dimensions as follows:
Five Dimensions of School and District Intervention
Where NCLB’s framework of options (if you can even call it that) falls short lies in its failure to acknowledge and support the possibility of solid turnaround work across the first three dimensions without having to resort to dramatic changes in
GovernanceManagementImplementationInitiative DesignOperating Conditions
GovernanceManagementImplementationInitiative DesignOperating Conditions
SERVING EVERY CHILD WELL: WASHINGTON STATE’S COMMITMENT TO HELPING CHALLENGED SCHOOLS SUCCEED 50
management or governance. It envisions revising programs (#1) or reconstituting staff (#2), but offers no help in addressing the first dimension – replacing the often calcified, inflexible current context of operating conditions with conditions more supportive of reform. The outcome across the landscape of school intervention efforts is that truly fundamental reform – the kind that addresses the system- and condition-related issues that “school improvement”-style reform (see Section I of this report) has failed to solve – has been reserved for the far more intrusive NCLB options (3 through 5) involving outsourced school management, state takeover, or “charterizing.” It is as though states were expected to reserve fully comprehensive intervention, spanning changes in initiative design and implementation and changes in operating conditions only for those cases where it was stepping in to make the big decisions itself. In this proposal for Washington State, we are reversing that approach, placing the emphasis on providing every possible support to enable local leaders to mount an effective, comprehensive, conditions-changing, systems-oriented turnaround effort in their lowest-performing schools. Only after local leaders have had multiple opportunities to take advantage of these supports and their Priority Schools still fail to climb out of Priority status will the state’s “backup plan” be activated. And even then (as will be seen below), the highly collaborative nature of the Innovation Zone will remain in effect. Under this proposal, the state’s role is to set the standards, the criteria, and the timeline for turnaround, and to work in collaboration with education leaders – locally at first, and then if needed at the state level – to ensure that goals are met. In the schematic below, we show where the Innovation Zone fits into the table of five dimensions of school and district intervention:
The Innovation Zone Focuses on Conditions, Design, and Implementation

SERVING EVERY CHILD WELL: WASHINGTON STATE’S COMMITMENT TO HELPING CHALLENGED SCHOOLS SUCCEED 51
ImplementationInitiative DesignOperating Conditions
Management
SCHOOL LEVEL
DISTRICT LEVEL
Innovation Zone
Governance
The Innovation Zone sets criteria for supportive operating conditions and a degree of significant change in the ways districts design and implement a Zone initiative. It also requires that work within the Zone take place at two levels: the district and the school. (Zone initiatives must create, adapt, or replace current district structures and strategies in order to implement the turnaround plan effectively across a cluster of schools.) It does not require changes in school or district management – though districts might, as part of their turnaround plan, replace one or more school principals. Likewise, it does not require changes in school or district governance. Far from it, in fact: the local school board is viewed as a linchpin in the Innovation Zone and is the official signatory on Zone proposals and agreements with the State Board of Education. It is not until even the Zone supports and resources have proved insufficient to bring a Priority School out of Priority status (for two consecutive years) and the district is unable to come up with an acceptable revised plan that Washington State’s continuum of intervention extends outward to include management and/or governance change.

SERVING EVERY CHILD WELL: WASHINGTON STATE’S COMMITMENT TO HELPING CHALLENGED SCHOOLS SUCCEED 52
C. Academic Receivership: the “Backup Plan” for the Innovation Zone Academic Receivership sounds harsh at first, within the collaborative culture of Washington State. But it draws on the generally held legitimacy of significant state intervention – “receivership” – in districts that are demonstrably unable to pull themselves out of financial disarray. Academic receivership stems from severe and chronic underperformance in delivering on the mission, as opposed to delivering satisfactory financial oversight. It also accurately describes the point in the continuum at which schools and districts will have arrived, following years and years of unsuccessful reform. The following kinds of schools will be considered to have needs that were unable to be met by the Innovation Zone alone: • Schools that fail to move out of Priority status by the second year of
implementation as part of an Innovation Zone initiative and whose district cannot demonstrate how it will correct the issues though a revised plan5
• Schools in districts that cannot move schools out of Priority status on their own and that cannot or won’t produce an Innovation Zone proposal that is judged by the State Board of Education, on a recommendation from OSPI, to meet the Board’s criteria for such proposals, even on a second attempt and with the support of a lead turnaround partner organization6
The three choices that define Academic Receivership. The state must address three basic choices in defining the Academic Receivership category of response: • Does Academic Receivership trigger an automatic response or a
differentiated one, driven by analysis of the school and its district? • Is the response directed at the school level or the district level (or both)? • Is the response focused on management change or governance change (or
both)?
We will address each question in turn. 1) Automatic vs. differentiated response. It could be argued that an automatic
response might generate the greatest incentive for district and school leaders to succeed with their Zone initiatives. Turn the school around, or X will be the outcome. That’s the prevailing theory behind other public policy aimed at changing behavior; three-strikes sentencing guidelines for drug dealers are one prominent example. We believe, however, that an automatic response would undercut the spirit of the Guiding Principles and rob the state of its ability – working in collaboration with statewide education leaders – to tailor an appropriate response to each particular circumstance. A differentiated
5 We recognize that alternative schools have unique needs and it may not make sense to hold them to the same measures. However, there must still be accountability for those schools. 6 These categories assume that the state will be able to provide recommended (and legislative approved) Zone-level funding for all Priority Schools in districts that submit successful proposals. If the state cannot meet its contractual obligations to support turnaround plans within the Zone, districts should not be placed in Academic Receivership as a result of being unable to meet performance goals.

SERVING EVERY CHILD WELL: WASHINGTON STATE’S COMMITMENT TO HELPING CHALLENGED SCHOOLS SUCCEED 53
response has its own issues, of course; it has costs, it can take time, and it can leave itself open to charges of unfairness. But in our view, the need for a customized response that targets specific needs outweighs these disadvantages. The importance of a customized response becomes clearer in light of the complexities posed by the other two questions, below.
2) School vs. district level focus. NCLB’s intervention options focus exclusively on the school level. While all states are required by the federal law to have some kind of district intervention strategy on their books, the focus of the most intensive intervention strategies has been on individual schools. Washington’s Innovation Zone focuses on reform at both levels, working at the school through the district. That’s entirely appropriate, considering the Zone’s reliance on the district, together with a lead turnaround partner, to develop and implement an effective initiative. But this choice is more complicated when management and/or governance change is contemplated, which leads us to the third question:
3) Management vs. governance change. This question has a challenging analysis at its root. Is persistent under-performance in a Priority School – or an inability even to create an Innovation Zone proposal that meets state criteria – due to mis-management by educators or to poor leadership by the district’s governors, its board of directors? Should continued poor performance in one school – even with all of the supports of an Innovation Zone – trigger a state intervention that could replace a superintendent or reconstitute an entire school board? This degree of intervention would be very new to Washington State. If it is to be made part of the Innovation’s backup plan, we believe these decisions need to rest on careful analysis; they need to be made in collaboration with statewide leaders; and they need to be integrated with related initiatives that can make Academic Receivership – like the Zone – more about supports and solutions than about labels and recrimination.
The schematic below is the completed version of the one we presented earlier. It presents the primary strategies for management and governance change at each level, school and district. The chart offers the full spectrum of possibilities, including at least one – converting schools into charter schools – that is not currently an option for Washington State and not likely to become one in the foreseeable future.

SERVING EVERY CHILD WELL: WASHINGTON STATE’S COMMITMENT TO HELPING CHALLENGED SCHOOLS SUCCEED 54
Management & Governance Change Options Beyond the Innovation Zone
ImplementationInitiative DesignOperating Conditions
Management
SCHOOL LEVEL
DISTRICT LEVEL
Innovation Zone
Governance
District-Directed Reconstitution led by state-trained and certified turnaround principal
District-Directed Contract with school mgmt organization
District-Directed Charter Conversion
State Takeover: direct control or contract with school management organization
Placement in New State Recovery District
State-Directed Charter Conversion
State-Selected Superintendent in conjunction with local school board
District-Directed Contract with district management organization
State-Directed Reconstitution of School Board through forced elections
State-Directed Restructuring of School Board: mayoral control
State Takeover of Board: names majority or creates new reform panel
x
xx
x
x Not recommended under this initiative
Once again: the options depicted here represent the full spectrum of possibilities. There are several options that, based on our understanding of Washington State culture and politics and on our knowledge of turnaround design nationally, we would not recommend be part of this proposal. We include them in this graphic (marked with a red “x”) and describe them following the recommendations so the Board has a complete picture of the range options.
D. Recommendations for Washington State’s Academic Receivership Policy All of the foregoing leads us to make the following set of recommendations for the “backup plan” for the Innovation Zone. 1) Academic Receivership should trigger a customized state response,
drawing from options for intervention at the school and/or district levels and for changes in management and/or governance, that is based on analysis of the circumstances of the school and its district. The analysis and the academic performance levels of other schools in the district would

SERVING EVERY CHILD WELL: WASHINGTON STATE’S COMMITMENT TO HELPING CHALLENGED SCHOOLS SUCCEED 55
inform decisions about where to intervene – at the school level or at the district level, and with changes in management or governance or both.
2) While the State Board of Education will make all final decisions, it will be guided by recommendations from a new body – the Washington State Accountability Council. Leaders of the state’s primary professional associations (WSSDA, WASA, AWSP, and WEA) would be invited to participate, as well as OSPI leadership, ESD leadership, parent and community representatives, other representatives of the teaching and school leadership professions, and other appointees of the Board. The State Board of Education will appoint members of the Accountability Council. OSPI will produce the analysis for the Council, perhaps in conjunction with an external, Washington-based evaluation partner.
3) Each of the professional associations will be invited to play a central role in supporting Academic Receivership interventions that relate most directly to their domains: school leadership (AWSP, WEA), district management (WASA), or district governance (WSSDA). The state will support their involvement through OSPI and, where necessary, direct investment. The associations would join this work with current efforts already underway. More on this below.
The new note being struck in these recommendations is the creation of the accountability council and the deep involvement of the professional associations in this work. This idea stems from our observation, virtually from the first day we set foot in Washington State, that leaders from these organizations are 1) genuinely ready for a “second generation” of standards-based reform in Washington State as described in Part I of this report, characterized by reciprocal accountability on the part of all stakeholders including the state; 2) necessary to incorporate into the implementation of these accountability strategies and outcomes in order to ensure their success in the field; and 3) able to provide key supports, within their area of focus, to build the ground-level capacity these interventions will need in order to be effective. As several of the leaders said to us over the course of our work together in designing this proposal: “We can offer a lot of value to this work. But we have to have a seat at the table in order to do so.” The options from which the Council (and ultimately the State Board) will choose for schools and districts that enter Academic Receivership are summarized in the following schematic:

SERVING EVERY CHILD WELL: WASHINGTON STATE’S COMMITMENT TO HELPING CHALLENGED SCHOOLS SUCCEED 56
Options for Washington Schools and Districts in Academic Receivership
ImplementationInitiative DesignOperating Conditions
Management
SCHOOL LEVEL
DISTRICT LEVEL
Innovation Zone
Governance
District-Directed Reconstitution or Close-and-Replace, led by AWSP-trained and state-certified turnaround principal. WEA-supported lead teachers
District-Directed Contract with school management organization, in conjunction with all prof’l groups
State-Selected Superintendent and District Turnaround Plan, in conjunction with WASA and local school board
State-Directed Reconstitution of School Board through forced elections, w/WSSDA
State-Directed Restructuring of Board: mayoral control, w/WSSDA
State Takeover of Board: names majority or creates panel, w/WSSDA
Note: options are not mutually exclusive and could be combined
Covering these options one group at a time: Management Change/School Level: We anticipate that the first option within this category will end up being the most frequent selection by the Council and the Board. It amounts to a recognition that Innovation Zone supports alone were not enough to challenge the status quo at a particular school, and that something more disruptive needs to take place, beginning with the school’s managerial leadership. • Under the first option, the state would work with the district and with AWSP
to place a new principal in the school – one who has been specifically prepared to lead school turnaround. During the coming two-year period, after adoption of this initiative but before any school or district would enter Academic Receivership, AWSP will be charged, if it agrees to this role, with developing (in association with OSPI) a recruitment and preparation program modeled on those emerging in some other states. This could be an extension of the new Leadership Academy. The program will prepare school leaders to become effective turnaround managers – a challenge that research indicates requires special skills and character attributes. Turnaround principals will become sought-after candidates for Innovation Zone schools, but they will be

SERVING EVERY CHILD WELL: WASHINGTON STATE’S COMMITMENT TO HELPING CHALLENGED SCHOOLS SUCCEED 57
able to earn an additional annual stipend (of at least $10,000 or 15% of a principal’s salary in that district) from the state for three years for joining a school that has been placed in Academic Receivership. (The turnaround principals development program is described in Section VI of this report.) In addition, the WEA, with its agreement, will play a critical role as part of the same turnaround development program in preparing teachers to serve in school-wide leadership positions, possibly drawing from a pool of National Board Certified teachers. Teachers who have undergone the WEA training will likewise gain a stipend for joining a school in Receivership, and the WEA will collaborate with AWSP to provide training in turnaround management to the school’s leadership team once the principal is in place. “Reconstitution” refers to a requirement that all staff members sign an Election-to-Work Agreement modeled on the State Board’s template (see Part Three) in order to remain at the school. Use of that template will be suggested for Innovation Zone schools but does not become a requirement until a school reaches Academic Receivership status. “Close-and-replace” refers to an option available to the Accountability Council and the State Board (and to local turnaround leaders), to officially close a school in Receivership status and replace it with a new school under the “fresh start” theory that it can be easier to catalyze change by starting anew than by reforming an existing institution. Close-and-replace is an option that is open to Innovation Zone planners as well, but could not required by the state – as is the case with schools in Receivership.
• The second option in this category involves a district subcontract to an external partner organization to run a Receivership school (or cluster of schools). The Accountability Council might make this recommendation to the Board on behalf of a school or a cluster of schools in a district that shows little potential for implementing the first option in this category successfully. This selection indicates a high degree of urgency about the students entering these schools and their chances of receiving a satisfactory education from current management. In all likelihood, the contracting-out option would be accompanied by Council and Board attention to possible changes in other Academic Receivership categories – district management and governance.
Management Change/District Level: Faced with a district operating multiple schools in Priority Status (as well as in Tier 4 of the state’s accountability system) and a clearly demonstrated inability to use Zone supports well enough to turn around these schools, the Council and the Board may elect to replace the superintendent. The local school board would remain in place under this option and would have some say in the selection of a new superintendent. But decision-making authority would rest with the State Board on the recommendation of the Council. There is ample experience on this option at the national level in cities like Oakland (where state appointee Randy Ward led a district restructuring effort that received widespread attention) and Cleveland. Similar to the roles played by AWSP and the WEA in the School-Level Management category above, WASA would be asked to assist the Council, State Board, and OSPI in the preparation of a cadre of superintendents, especially trained to work with fairly dysfunctional
SERVING EVERY CHILD WELL: WASHINGTON STATE’S COMMITMENT TO HELPING CHALLENGED SCHOOLS SUCCEED 58
organizations and improve them over time. Like the turnaround principals and lead teachers, superintendents taking the reins of districts in Academic Receivership would receive a three-year stipend equal to 15% of the superintendent’s annual salary in that district. (Note: OSPI already works with a number of districts that are in its District Improvement Assistance program or its District Comprehensive Improvement Assistance program, known as the Summit Districts. It is also working with schools, as part of its School Improvement initiative, that may find their way into the Zone and, if improvement does not take place, into Receivership status. OSPI’s presence on the Accountability Council is designed to ensure, among other things, that any recommendations stemming from Academic Receivership status are integrated with other reform efforts already underway.) Governance Change/School Level: We recommend no options in this category. The bottom line here is that at the school level, we believe dramatic change can and should take place through changes in management (and design and implementation) – and need not involve changes in governance that make re-entry into the district problematic and tend to rob the district of any benefit from the turnaround. When the state assumes governing control of a school that is otherwise part of a district system, it almost inevitably produces pernicious incentives and dynamics. (As one turnaround principal said to us early in our research on turnaround design: “Go ahead – have the state come in and take over one of our district’s schools. Every person in that district will now be focused on one thing: how to make that school look as bad as possible. It’s not that they’re evil; they’re just human.”) Governance Change/District Level: There may come a time and an instance when OSPI, the Council, and the Board are convinced that a district’s issues go deeper than management challenges, and that it is in fact fundamentally underserved by its governing board. There are three options within this category. As is the case in the other categories, we envision the relevant professional association in Washington State – WSSDA – playing a critical role not only on the Accountability Council in helping to make these decisions, but in supporting effective work by the reconstituted, restructured, or state-appointed boards. WSSDA leadership gets tremendous credit for thinking creatively on these questions as part of the work of the Design Team for this initiative. • State-Directed Reconstitution of School Board Through Forced Elections.
This possibility emerged from some of our Design Team discussions as a way of demonstrating school board accountability and maintaining the principle of local control. However, we believe other options in the category of governance change may be preferable as short-term strategies to assist districts where the school board has not only failed as an effective governing body, but has become an obstacle to forward progress. This option – though it has some attractiveness in that it leaves the basic governing model intact – may not have the desired result. If current board members were allowed to run again, the election would doubtless turn into a local community

SERVING EVERY CHILD WELL: WASHINGTON STATE’S COMMITMENT TO HELPING CHALLENGED SCHOOLS SUCCEED 59
referendum on the efficacy of the state’s accountability systems, WASL, and standards-based reform in general – with the mission of the schools and the performance of their students lost in all of the noise. If current board members were barred from running, the concern in most communities would be over the quality, experience, and knowledge level of an entirely new pool of candidates. In the time required to run an election, identify plausible candidates, train them up and get the new board started, one of the options described below could be well underway and operating effectively. If a district is being sufficiently ill-governed that the Accountability Council recommends district governance change, it is not a given – not by a long shot – that simply replacing current elected members with new elected members is going to cure the problem. We could find no examples nationally, in fact, of boards being reconstituted in this way on grounds of academic underperformance. If the primary goal of governance change really is to significantly improve schools and student achievement (and if possible within a relatively compressed time period), we believe that goal is probably more achievable through one of the other two strategies outlined below.
• State-Directed Restructuring of School Board Through Mayoral Control. This is a far more common approach to the dysfunctional-board problem, and shows signs in some cities (New York, Chicago, Boston) of producing positive results. (The most prominent study on the question, by Brown University professor Kenneth Wong, found that students in mayor-controlled school systems often perform better than those in other urban systems, and that test scores in mayor-controlled systems are rising “significantly.”) Providing the chief executive with majority control of the board, after all, has some recent precedence in Washington State (cf. the State Board of Education itself). Mayoral control need not be permanent, but it preserves the principle of local decision-making authority and can quickly turn an unproductive dynamic into a productive one.
• State-Directed Takeover of the School Board. The downside here, of course, is the loss of local control. The upside is the likelihood that the state can name at least a reasonably high-functioning reform panel. There are examples nationally (Philadelphia, for one) of state-appointed boards taking charge in chronically under-performing districts and catalyzing some positive forward movement. But there are others (notably Chester Upland, PA, and the current governance situation in St. Louis) that have run into trouble, often when the existing community board is left in place with some sort of power-sharing agreement. Twenty-five states have the authority to take over district governance, though almost universally on grounds of fiscal mismanagement, not academic performance. With this option, we are not recommending wholesale takeover by the state – just the possibility of an interim, appointed board to overturn a capsized ship, lead the bailing of the water, and help navigate that ship into safer harbor.
As we note on the graphic itself, these options are not mutually exclusive. The Accountability Council would be free to mix and match them together in its recommendations to the Board. Other notes about schools and districts entering Academic Receivership:

SERVING EVERY CHILD WELL: WASHINGTON STATE’S COMMITMENT TO HELPING CHALLENGED SCHOOLS SUCCEED 60
• The strategies would be supported by continuing participation in the Innovation Zone, with all of its various resources and design criteria.
• Goals for improvement, benchmarks for exiting Academic Receivership status, and timelines would be set by the Accountability Council in its recommendation to the State Board. In general, they would follow the goals for schools in the Innovation Zone: two years of implementation to leave Priority School status and four years to move into at least the state’s Tier 3 of school performance.
• It is difficult at this point to project how many schools and districts might enter Receivership status, in part because of the current flux around the state’s Priority Schools accountability formula. But since Receivership status comes about only following unsuccessful participation in the Zone – and that means at least two continuing years in Priority Status even with all of the Zone supports and investments – we are convinced that the number will be manageably small and will include only those schools and districts where this level of intervention is clearly justified.
E. Other options considered • Not recommended: District-Directed or State-Directed Charter
Conversion. Charter schools are clearly a third rail in Washington educational policy and practice, and including a charter provision in this proposal would put it at serious risk. Contemplating contracting out school management to external providers (which we do recommend including) is enough of a leap by itself.
• Not recommended: District-Directed Contract with District Management Organization. This practice has even less of a track record than contracting out the management of individual schools. Yet in some ways, it makes more sense because the reforms instituted by the management firm can be much more systemic. The most notable model in this category may be the contract (now in its seventh year of a very successful run) given to Cambridge Education in the U.K. to manage the Islington school district on the outskirts of London. But there is no capacity yet among external providers tin the U.S. to conduct this work effectively.
• Not recommended: State Takeover through Direct Control or Contract with School Management Organization. About a third of the states (16) currently have authority to take over individual schools. Washington state law specifically prohibits it. Most of the states with takeover authority have not used it, and those that have done so at least partially (Massachusetts, Arizona, Maryland, Louisiana, Alabama, and Pennsylvania, among others) have produced mixed results at best. Some efforts amount to little more than replacing the principal, a strategy we believe does not reflect genuine governance change but belongs in the “management change” category (which is where we have placed it). Moreover, while we believe that Washington should include contracting with an SMO among the options, we recommend that the option be pursued at the local level (as is being done by an increasing number of districts nationwide, including Chicago, Philadelphia, and Los Angeles). That way, the work of the SMO in managing the school or schools

SERVING EVERY CHILD WELL: WASHINGTON STATE’S COMMITMENT TO HELPING CHALLENGED SCHOOLS SUCCEED 61
can integrate better with overall district strategies and can play a useful role in improving district performance.
• Not recommended: State Recovery District. Louisiana has become known for its Recovery District, which collects and serves poorly-performing schools that have been taken over by the state. But Louisiana is a far different place than Washington State in many, many respects, with far different needs. The problem with a statewide recovery district is that it confuses the vision of these reforms, which is to enable community school districts to redesign their own strategies and structures and to deliver satisfactory results on their educational mission. The vision is not to put the state into the business of running schools. A statewide school management district would make it more difficult to return schools to their districts and would do little, by itself, to make those districts capable of accepting the schools back effectively. The focus of Washington’s intervention continuum, we believe, should remain firmly on helping the current community/district/schools management and governance model succeed for every student.
VI. Supporting Programs
Leadership Development Ensuring Adequate Leadership for Turnaround “There are virtually no documented instances of troubled schools being turned around in the absence of intervention by talented leaders. While other factors within the school also contribute to such turnarounds, leadership is the catalyst.” That is the conclusion of Wallace Foundation President M. Christine DeVita, and the critical importance of good leadership is well supported by the research on school improvement.7 However: like all of the other contributors, leadership by itself is not a silver bullet. Injecting well-prepared leaders into exactly the same environments without addressing any of the conditions that have led to persistent under-performance may help somewhat, and a few truly spectacular leaders may haul their schools towards proficiency. But they succeed (as virtually all extraordinary principals will testify) despite the system of which they’re a part. A truly comprehensive state turnaround initiative integrates solid support for good leadership with a firm commitment to give them a system that enables – rather than defeats – their efforts. Moreover, that kind of initiative defines the kind of
7 DeVita, M., Colvin, R., Darling-Hammond, L. & Haycock, K. (2007). Educational Leadership: A Bridge to School Reform. Retrieved from the Wallace Foundation website: http://www.wallacefoundation.org/KnowledgeCenter/KnowledgeTopics/CurrentAreasofFocus/EducationalLeadership

SERVING EVERY CHILD WELL: WASHINGTON STATE’S COMMITMENT TO HELPING CHALLENGED SCHOOLS SUCCEED 62
leadership turnaround schools need more broadly than as single principals, and embraces the need for strong leadership teams, composed of administrators and teachers who are prepared to work effectively in this management context.
Though quality leader preparation is crucial, states also must reduce policies that impede leaders’ ability to succeed; coordinate and collaborate with districts on leadership development; set standards and accountability for leader performance; and provide school leaders with the authority to reallocate people, time and fiscal resources.8 Taking any organization from chronic low-performance to high performance requires highly capable leadership. Decades of research on schools establishes the central importance of school leadership quality, accounting by one prominent estimate for 25% of differences in student learning (Waters et al., 2003). The importance of leadership appears even greater in a setting required dramatic improvement. American Institutes for Research and SRI International’s evaluation of the Bill and Melinda Gates Foundation’s high-school reform initiative, for example, found that leadership was one of the key determinants of successful reform in high schools (AIR/SRI, 2005) According to a cross-industry literature on “turnarounds,” about 70 percent of successful turnarounds involve changes in top management (Hoffman, 1989). A wide range of research suggests that leaders who will be effective in efforts to achieve dramatic improvement are likely to have characteristics that are very different from those of typical school leaders and take actions that diverge significantly from those required in more stable leadership situations (Kowal and Hassel, 2005; Arkin and Kowal, 2005). Finding or developing these leaders will undoubtedly prove challenging; it is therefore incumbent upon system leaders to take action that “lowers the bar,” making it more feasible for ordinary leaders, not just “super-leaders” to succeed. But given the magnitude of challenge in the subset of schools discussed here, attracting and retaining high-capacity leaders must be a priority. Turnaround Leadership: What Are the Key Attributes? There is a growing research base on what skills and attributes it takes to be a successful leader of a turnaround school (or cluster of schools). For their report, Turnarounds with New Leaders and Staff (Learning Point Associates, 2005), Kowal and Hassel distilled findings from more than a dozen different sources to produce a set of desired attributes for effective turnaround leaders in school settings. Such leaders, they suggest, tend to pursue common actions including the following:
Major Actions • Concentrate on a few changes with big, fast payoffs • Implement practices proven to work with previously low-performing
students without seeking permission for deviations from district policies
Support Steps
8 Wallace Foundation. (2006). Leadership for Learning: Making Connections Among State, District and School Policies and Practices. Retrieved from the Wallace Foundation website: http://www.wallacefoundation.org/KnowledgeCenter/KnowledgeTopics/CurrentAreasofFocus/EducationalLeadership

SERVING EVERY CHILD WELL: WASHINGTON STATE’S COMMITMENT TO HELPING CHALLENGED SCHOOLS SUCCEED 63
• Communicate a positive vision of future school results • Collect and personally analyze school and student performance data • Make an action plan based on data • Help staff personally see and feel the problems students face • Get key influencers within district and school to support major
changes • Measure and report progress frequently and publicly • Gather staff team often and require all involved in decision-making to
disclose and discuss their own results in open-air meetings • Funnel more time and money into tactics that get results; halt
unsuccessful tactics • Require all staff to change – not optional • Silence change naysayers indirectly by showing speedy successes • Act in relentless pursuit of goals rather than touting progress as
ultimate success The question for Washington State policymakers is: how can the state foster the development of such leaders and provide the most supportive reform environments for them in the field?
Current Leadership Development Efforts in Washington Rather than import national leadership and teacher training programs such as New Leaders for New Schools or The New Teacher Project, Washington State has developed its own leadership programs. A promising current initiative is the newly formed Washington State Leadership Academy (WSLA). A number of other programs, mostly affiliated with institutions of higher education, also provide leadership training but do not appear to be focused on developing skills needed to manage and lead low-performing schools into transformational improvement. Promising aspects of the WSLA program include:
• Two years of funding from the legislature to launch a sustainable program
• Strong Board of Directors/Advisors • Piloting districts first to make adjustments as needed, before full cohort
release in 2009 • Collaborations and hoped-for alignment with WASA, AWSP, OSPO,
ESDs, and a variety of other governmental agencies It is too early to determine the program’s effectiveness, but it represents a potentially strong vehicle for state investment and, perhaps, for a specialized sub-focus on developing turnaround leadership as an element in the Innovation Zone initiative.

SERVING EVERY CHILD WELL: WASHINGTON STATE’S COMMITMENT TO HELPING CHALLENGED SCHOOLS SUCCEED 64
Other leadership programs that should be noted in Washington include: • Washington State Education Leadership Intern Program. This model
is promising in its implicit acknowledgment that principals require intensive training and mentoring to acquire needed skills; districts and schools need reimbursements to cover the cost of substitutes for release time; and that principal training should include both time with students in the building, as well as sufficient time with a mentor to address non-student-related responsibilities. This program could be integrated with the Innovation Zone initiative by linking aspiring principal candidates for low performing schools with strong principals working within the Zone.
• Traditional University-based Programs. A handful of universities offer
more traditional intern and leadership programs that are approved by the Washington Professional Educator Standards Board. The state should consider creating an additional certification program or criteria for Priority School training (that includes the characteristics above), perhaps based on the model developed by the University of Virginia (the Virginia Turnaround Specialists Program).
• Center for Strengthening Teaching Profession (CSTP). CSTP’s New
Teacher Project is an example of an initiative that could include a component on the skills necessary for teaching in Priority Schools, and for serving as part of a school leadership team. The Washington NBCT Network could also be used to advocate for teaching and leadership needs in Priority Schools.
• National Board for Professional Teaching Standards (NBPTS). The
Washington Initiative for board certification is a compelling model that could be connected with the Innovation Zone as well. Providing National Board Certified teachers a salary bonus of $5000 sets precedence that some types of differential pay/bonus are acceptable in the state. The partnership between Gates, Stuart and Washington Mutual demonstrates how outside resources can help ramp up a high-priority state initiative.
• Center for Educational Leadership (CEL). CEL is described in the
Partner Capacity Development section below.

SERVING EVERY CHILD WELL: WASHINGTON STATE’S COMMITMENT TO HELPING CHALLENGED SCHOOLS SUCCEED 65
Potential Turnaround Leadership Program Design for Washington State Given the landscape partially described above, Washington State probably does not need to create a brand new program designed to support the development of turnaround leadership. However, we strongly recommend that the SBE identify leadership development as a crucial priority of its comprehensive school turnaround initiative, and that it enlist the professional associations and other organizations that are currently active in leadership development as partners in the effort. Such a commitment to supporting turnaround leadership development could include the following elements. We recognize that taken together, these suggestions could represent a state initiative of roughly the size of the entire Innovation Zone initiative, which is not what we intend. Rather, we are recommending that the state give strong consideration to funding, as a key supporting program, a concerted effort to identifying and developing the leaders (superintendents, principals, teachers and school directors) who will be needed to help the Zone fulfill its potential. 1. Collaboration with OSPI and the professional associations, along with
appropriate organizations. A state manager with strong school improvement experience and credibility should be given responsibility for implementing leadership programs (whether they are new or incorporated into current programs) that have a focus on leading highly challenged schools.
2. Seek new state funds and foundation support specifically for the development
of turnaround leadership in chronically low performing schools. Fund a statewide program for developing turnaround school leaders at one or more university campuses with the appropriate vision and capacity. Create a program of fulltime, paid internships for aspiring leaders of such schools to be administered through regional and urban leadership academies (see below). Prepare a cohort of principals and superintendents to take the helm at schools and districts that enter Academic Receivership, and fund a state pool that pays an incentive bonus (that is acceptable to the districts – perhaps a loan forgiveness grant) to them over their first three years. Allow for funding in Zone schools to be used to hire School Administrative Managers to free turnaround principals to focus a large majority of their time in the areas of teaching and learning.
3. Construct a statewide network of urban and regional leadership academies,
working through OSPI and other partners (perhaps including the ESDs), to coordinate support for school leaders. Conduct an RFP process and award five-year contracts to the most qualified universities, non-profit organizations or large districts for these purposes. Form a statewide learning community of these academies for sharing best practices. Monitor and evaluate each academy regularly.

SERVING EVERY CHILD WELL: WASHINGTON STATE’S COMMITMENT TO HELPING CHALLENGED SCHOOLS SUCCEED 66
4. Develop a certificate of turnaround expertise for leaders who graduate from
the turnaround development programs. Work with program partners to identify the knowledge and skills which must be demonstrated for initial and continuing certification. Create pathways for alternative certification for those with exceptional leadership experience in other fields. Mount and maintain a recruiting campaign to attract an outstanding and diverse pool of teacher leaders and career changers to the field of school leadership.
5. Work with the WEA and other organizations to support teacher leadership
skills and to prepare teachers to play important roles on leadership teams in Zone schools. Consider doing the same with WSSDA for school directors in districts with Zone schools.
6. Conduct ongoing evaluation of higher education leadership preparation
programs. Base program re-registration/re-certification on the quality of candidate screening, curriculum, collaborative partnerships, internship experiences, performance of graduates and accreditation.
7. Encourage statewide organizations, national non-profit entities, large districts
and others with capacity to participate in the formal preparation of school leaders, as is already taking place in other states (witness the principal and urban teacher residency programs in Boston, Chicago, New York City, and other districts).
Partner Capacity Development Role of lead turnaround partner organizations The schools that will be identified as Priority Schools (and the districts in which they are located) have shown they lack the capacity internally to successfully raise student achievement. A district can get into this situation for a variety of reasons, from a struggling superintendent to a board without focus to financial difficulties. Regardless of the reason, capacity needs to be addressed both from the inside and added from outside to accomplish the turnaround. A lead turnaround partner organization can help to add that capacity and do it quickly. Currently, Washington State (like virtually all states) lacks a substantial resource base of lead turnaround partners – organizations that are ready to work effectively with schools and districts on turnaround plans that incorporate the essential elements defined earlier in this report. The State Board and OSPI should collectively play a catalyst role in developing the resource base of partner organizations to work with schools in the Innovation Zone. One way to do this is to develop a consortium of organizations that are already working in the state to work with the initial cohort of the Zone, and to

SERVING EVERY CHILD WELL: WASHINGTON STATE’S COMMITMENT TO HELPING CHALLENGED SCHOOLS SUCCEED 67
actively invite national organizations to enter the state and play a role. OSPI might engage a single organization, or a couple working together, to take on the role of building capacity among the state’s existing resource base of school intervention groups and individuals (including OSPI’s school and district improvement specialists and the regional Educational Service Districts). The role of the partner should be well defined before the organization begins working with the district and school. Washington has many local organizations (and individuals, including improvement specialists consulting with OSPI) that currently work successfully with schools in various capacities, including social service provision, data collection and analysis, professional development, and supplemental education services, to name a few. Each tends to work independently within the school on its own piece of work, without much interaction with other partners also working in the school or connection to the overall mission of the school. This fragmented resource base could become, with training and structured support from the state, a much deeper source of “bench strength” for districts and schools entering into the Innovation Zone. That resource could be supplemented by more intensive involvement in Washington State by national organizations working successfully in other states – New Leaders for New Schools, the New Teacher Project, the Institute for Student Achievement, and others. These organizations are not active in the state because there has been little demand for them. One or more of them could be recruited to serve, along with OSPI and/or local educators and reform experts, as the “trainer of trainers” – the consortium responsible for helping to build Washington State’s turnaround partner capacity. OSPI has done some initial work in this area with the RFPs it put out for organizations to work with districts in its Summit Districts program, which have already brought some noteworthy national organizations (such as WestEd) into the state. What Washington does not currently have are any partners that take on an integrating role within the school and amongst other partners. Turning around a low performing school is a difficult task and requires facilitating a variety of entities (including external partners, district staff, OSPI staff, and others). Principals are already bogged down by the day-to-day decisions that must be made and often they do not have enough time, energy, or expertise to acquire, facilitate, and monitor a variety of external partners. This role of “lead turnaround partner” is integral to building capacity within the school and within the state. In some cases, a division within the district may act as the lead turnaround partner and facilitate the other partners in schools in the Innovation Zone. This role being served by the district is especially likely if the district oversees multiple schools all part of the Innovation Zone. An example of this integration role is the role OSPI is playing with the multiple partners who are working with schools in the Summit Districts – all of whom have different skill sets and roles (e.g professional development, data collection and analysis, etc). OSPI is ensuring that those partners work with each other in pursuit of the common goal of raising student achievement. The Innovation Zone provides another good place to demonstrate collaborations amongst partners to benefit students.

SERVING EVERY CHILD WELL: WASHINGTON STATE’S COMMITMENT TO HELPING CHALLENGED SCHOOLS SUCCEED 68
A lead turnaround partner might be responsible for directly providing or contracting out a range of services that are necessary in a school, and for working with school/district leadership to guide the central reform vision within the school. Such services could include: academic (instructional approach, site-specific student assessment, data analysis), scheduling (school calendar, daily/weekly school schedule), student support services (guidance, special education services), human resources (benefits, recruitment, hiring, professional development), operations (budgeting, IT infrastructure, data systems, transportation), and evaluation (teachers, leaders, overall performance). A small selection of partners currently working in Washington State are profiled below to highlight aspects of their work and potential alignment to the goals of the Innovation Zone. This list is in no way comprehensive, nor does it go into great depth on each organization’s services or imply endorsement of any organization. It is simply a sampling of partner organizations working in some of the critical areas for capacity development moving ahead in Washington.
Selection of Partner Profiles Professional Development/Curricular Focus Center for Educational Leadership (CEL) • Housed at the University of Washington, CEL runs a variety of professional
development and certification programs for teachers, principals and district administrators (prospective or continuing education staff).
• CEL also provides a variety of services to districts within WA and in other states. Such services include coaching, mentoring, leadership training, formal district & school partnerships, and professional development and learning around CEL’s Five Dimensions of Teaching and Learning.
• The school and district partnerships are the most directly related aspect of CEL’s work to the Innovation Zone and turning around Priority Schools.
• Promising aspects of the partnership program include: o System-wide focus, o Leadership coaching occurs in the school building, o Creates proof points that others can learn from and scale up in
other schools and classrooms, o Ensures that the district and the schools are fully committed to
provide time and resources to the work, o Encourages district and school leaders to take on increasing
responsibility for planning and leading leadership conferences to help build capacity, and
o Acknowledges that policies, practices, and structures must be aligned with learning goals to support instructional improvement.
• CEL coaches spend approximately 1-4 days a month in schools (depending on the provisions in the agreement) and while this is more time than many

SERVING EVERY CHILD WELL: WASHINGTON STATE’S COMMITMENT TO HELPING CHALLENGED SCHOOLS SUCCEED 69
partners provide nationally, Priority Schools will likely need more time from their partners to create a sustainable program.
Data/Assessment Collection, Analysis & Evaluation SynapticMash • Currently, WA schools use a variety of School Information Systems (SIS)
providers to track and manage student information. With limited funding, districts have purchased such services through ESD collaboratives, or have created their own more informal systems.
• SynapticMash could become a collaborator with schools in the Innovation Zone.
• SynapticMash provides a variety of data interfaces to allow teachers, administrators, students, and parents the ability to track and manage large quantities of information.
• SynapticMash allows schools to track and manage: students, teachers, state test results, schools, demographics, historical data, standards and interventions.
• The program also includes an assessment program (ExamQube), which allows instructional staff the ability to create their own assessments and then administer them to students by paper or online. Using the same assessments and tracking them in one data system could be helpful in tracking multiple schools undergoing the improvement process.
Northwest Evaluation Association (NWEA) • Approximately 126 districts in WA use the (Measures of Academic Progress)
MAP tests administered by NWEA. • The tests are aligned to state curriculum standards and are adaptive, so they
reflect a student’s instructional level, as well as growth over time if administered multiple times throughout the year.
• Due to the fact that so many WA districts are already utilizing MAP tests, it is likely that NWEA would be a strong partner candidate for schools in the Innovation Zone.
• Testing systems that monitor growth of student performance could be used to evaluate Innovation Zone schools to better track improvement (as opposed to meeting or not meeting NCLB AYP benchmarks).
Center for Educational Effectiveness (CEE) • CEE provides a variety of data based assistance programs to schools and
districts. • CEE provides School Improvement Facilitators (SIFs) and Technical
Assistance to schools undergoing the OSPI School Improvement process. • Measures/characteristics of high performing schools are evaluated in the
Educational Effectiveness Survey. • School climate/culture surveys for students, teachers and parents are also
available.

SERVING EVERY CHILD WELL: WASHINGTON STATE’S COMMITMENT TO HELPING CHALLENGED SCHOOLS SUCCEED 70
• Districts in the Innovation Zone could use many of CEE services, as well as strategic support for interpreting and using data.
The BERC Group (Baker Evaluation Research & Consulting) • The BERC Group currently works with 270 schools in WA by providing a
variety of evaluations and data analysis services to schools and districts. • BERC uses both quantitative and qualitative data to draw conclusions and
make recommendations for improved performance. • National standardized testing scores (SAT, ACT, AP, WASL) are used for
quantitative analysis. • Classroom observations, focus groups, and surveys are available to provide
qualitative analysis. • Classroom observations are 30 minutes each and a small research team is
expected to complete an evaluation within one or two days. • The BERC Group could play a range of roles in evaluation of districts and
schools in the Innovation Zone.
Operations/Organizational Support Services ESD 105, Yakima • ESD 105 is frequently touted as one of the best performing and most
comprehensive service districts within Washington State. • The ESD serves 25 public school districts and private schools in region and is
one of nine ESDs in state, and is aligned with both OSPI and SBE. • The ESD provides a variety of services to schools and districts including: • Administrative services (discounted technology prices, school board
development), • Certification (provider of clock hour courses on administrative, management,
and academic curricular areas), • Fiscal Services (compliance, budgeting, insurance, transportation and grant
management), • Cooperative Services (data systems, computer networks, unemployment
insurance, special education services), • Human Resources (teacher recruitment), • Teaching and Learning (arts, literacy, science and math, school improvement
plan development assistance, parent involvement programs), • Migrant Education (for students and parents, targets home, school, and
community), • Learning Supports (drug prevention, parent involvement, safety programs), • Special Education (PD for SPED staff), • Student Services (extracurricular opportunities), and • Technology Services (IT strategic planning, discounted IT prices, student
assessment systems)

SERVING EVERY CHILD WELL: WASHINGTON STATE’S COMMITMENT TO HELPING CHALLENGED SCHOOLS SUCCEED 71
• Based on the current array of services ESDs provide in Washington, they may be poised to take on the lead turnaround partner role.
• The ESDs could also work with other partners (such as those profiled) to increase capacity and better serve schools and districts within the Innovation Zone if they did become a lead turnaround partner.
Strategic Systems Assistance Panasonic Foundation • The Panasonic Foundation is designed to help schools and districts develop
system-level policies, practices and structures to improve achievement for all students.
• Panasonic has a handful of partnerships with school districts throughout the U.S., including Highline, WA.
• The Highline strategy focuses on developing embedded coaching, literacy mentoring programs for teachers, increasing the quality and quantity of external and internal coaches, and encouraging principals to establish themselves as the instructional leaders in their schools.
Other Providers There is a small but growing community of other providers that are working nationally on turnaround implementation, and a few of them might have particular reason for considering new or expanded operations in Washington State. The leaders of two organizations, School Turnaround Inc. and the Institute for Research and Reform in Education (IRRE, which produces the First Things First initiative) now live in Seattle. School Turnaround Inc. works on a very limited basis in Seattle, currently, and IRRE has no presence in the state. But they, along with other providers with whom Mass Insight is familiar (for example, Institute for Student Achievement and America’s Choice) would be ready and willing to explore working in the state under the kinds of conditions envisioned by the Innovation Zone.
Data and assessment use Data and its strategic use to inform decision-making for all activities related to curriculum development, instructional strategies, and student-level interventions are critical for school turnaround. Unfortunately, many districts (both in Washington and across the country) lack both the technological systems and the knowledge to use data effectively in these ways. The Innovation Zone represents an opportunity to establish aligned data collection and assessment systems for several reasons: • It will be important that all districts in the Innovation Zone have the ability to
collect data to report to the State Board to evaluate progress and fulfill reporting requirements
• Indicators that are part of the identification process for Priority Schools can be tracked
• Effective data use has been shown nationally to be a key contributor to the improvement of instruction and increased student achievement
SERVING EVERY CHILD WELL: WASHINGTON STATE’S COMMITMENT TO HELPING CHALLENGED SCHOOLS SUCCEED 72
• The Zone will be a small enough cohort that it is feasible for the state (possibly with an outside funder) to pilot a data initiative in the districts that join the Innovation Zone.
Whatever additional indicators besides WASL scores are used to identify Priority Schools, the State Board will want to track those indicators in the Innovation Zone. Since most districts won’t have the capacity to do that on their own, they will need support to be able to meet reporting requirements so the Board can evaluate progress. Some of these indicators are not currently tracked systematically. WASL scores may take time to increase, and so there needs to be data to evaluate on other indicators, particularly at the one- and two-year marks. In order for teachers to target instruction and improve that instruction, they must have data regarding what areas need focus, what is working and not working, and what the overall data-related goals are. Even in districts that have invested in their own data systems, what we have heard from a number of stakeholders is that they don’t have the knowledge or the time to translate it into classroom instruction. Districts need support to create professional learning communities, where all staff members are invested in learning about what information data can provide and developing strategies to address the issues it raises. Diagnostic assessments should be given frequently enough to provide information in a timely enough fashion to be able to make immediate adjustments. This is a strategy being implemented with success in a wide range of districts nationally. Most data that districts currently receive in Washington State through WASL A comprehensive data and assessment system will use regular diagnostic assessments to give teachers the feedback they need to target instruction and interventions in real time, and in parallel help them develop the skills and strategies to do so. A variety of partners currently provide such services in Washington, but they are not designed to be compatible with each other, not does any one of them necessarily provide a complete set of data. Any one of those partners, or several working together, could provide data and assessment services to districts in the Innovation Zone to specifications developed by the State once the Priority Schools indicators are finalized.
VII. Budget Considerations Successful school turnaround is resource-intensive. The supports that make it work, including additional time and staff and partner support, require additional funding. There is an optimum level of investment, at which there is funding for all key elements of a turnaround plan, and there is a threshold level below which there will not be enough resources to implement a plan that could be considered turnaround (or, we believe, that would deliver much more than incremental improvement in student achievement). Washington State’s current financial

SERVING EVERY CHILD WELL: WASHINGTON STATE’S COMMITMENT TO HELPING CHALLENGED SCHOOLS SUCCEED 73
situation needs to be taken into account and the state needs to be careful not to pilot a plan that it will not be able to afford down the road. While each district’s turnaround plan may address the conditions and criteria in a slightly different way, the threshold budget needs to include funding for these key elements: • Planning – Since it requires significant time and effort for districts to engage
all stakeholders and develop a comprehensive turnaround plan, that planning period will be supported by financial resources (a planning grant), as well as possibly other resources such as support from an outside partner and/or planning assistance from the state.
• Lead turnaround partner – Successful turnaround plans will include a major role for a lead turnaround partner who can provide support in the development and implementation of the plan, as well as either provide or integrate other providers of professional development and curriculum support. This person or organization will spend a significant amount of time in the school.
• Additional time – Successful turnaround plans will include additional time for instruction, re-teaching and enrichment, and teacher collaboration and staff development. Districts may choose to implement additional time in different ways, and they should be re-allocating existing time (along with adding time) as part of their turnaround plan, but whether they decide to extend the school day or year, there will be a cost for staffing.
An optimum budget would also include funding for: • Additional staff support – Turnaround is intensive work, and additional FTEs
of staff may be required to accomplish all of the goals of the turnaround plan. How districts choose to use these FTEs will vary by the needs of the schools, but some possibilities include math and ELL/literacy specialists, data coaches, parent coordinators, or social worker/guidance-counselors.
• Additional compensation for teachers – In exchange for additional responsibilities and leadership roles, teachers should receive additional compensation. Districts could also choose to use this funding to provide collective incentives for school improvement, to compensate teachers for extended planning time and staff development, or as incentives to attract high-capacity teachers (or teachers in high-need disciplines) to the school or cluster.
Separate from this report, we will provide a “strawman” budget for the Board and the Legislature that itemizes costs in these categories by school and district in the initial Innovation Zone cohort. These figures will represent direct supports to the Innovation Zone schools. They will not include additional estimated costs to pay for other related elements of this comprehensive plan. Those annual costs include the following. Costs in some categories will increase or decline over time; these rough projections are provided to give the Board and Legislature an idea of all of the costs related to comprehensive implementation of the initiative. • Additional staff, responsibilities for school analysis and recommendations at
OSPI, and management of the initiative: $500,000

SERVING EVERY CHILD WELL: WASHINGTON STATE’S COMMITMENT TO HELPING CHALLENGED SCHOOLS SUCCEED 74
• Leadership development for Zone clusters and schools and districts entering Academic Receivership, conducted in partnership with AWSP, WASA, and WEA (if they accept the Board’s invitation to play this role): $500,000
• Governance development, conducted in partnership with WSSDA (again, if the organization accepts the Board’s invitation to play that role): $100,000
• Additional costs for Academic Receivership schools and districts (especially stipends for recruited leaders): $100,000
• Support and development of lead turnaround partner capacity: $250,000
VIII. Implementation Strategies There is some guidance in the research literature on what turnaround might look like at the ground level, based in part on the strategies of high-performing, high-poverty schools. And there is a growing research base on the impact – or more accurately, the lack of impact – of most state intervention efforts to date on chronically under-performing schools. But there is not much guidance at all on two aspects of the work we view as critical to the success of any serious state-led effort to turn around failing schools:
• the need to free up state government’s management of the turnaround initiative from what are fairly typical public-agency constraints; and
• the need to build coalitions of leadership support for turnaround at the state and local levels.
The first is required to provide the state (and districts) with the same operating flexibility to manage school turnaround as that which schools need in order to implement it successfully on the ground. The second is required in order to create a constituency for turnaround that is strong enough to upset the status quo – and sustain sizable and continuing state investment. 9 Freeing up state government to lead turnaround effectively Policymakers often chafe (often justifiably) when business principles are applied to the affairs of state. So do public school educators. Discussions quickly devolve into arguments about why producing successful students is different from producing successful widgets. At the classroom level, the differences may be important. But at the level of managing and implementing change at scale, the differences remain relevant only if one assumes that education cannot conduct its business any differently from the ways it always has. Business has learned, far better than education, how change happens and what prevents it from happening. When a failing IBM sought to reinvent its business model in the 1970s, it did so by identifying change agents and separating
9 This portion of the report is adapted from Mass Insight’s 2007 research report, The Turnaround Challenge.

SERVING EVERY CHILD WELL: WASHINGTON STATE’S COMMITMENT TO HELPING CHALLENGED SCHOOLS SUCCEED 75
them from the structures and culture that had brought the company to its knees. The unit that produced the IBM PC was a “skunkworks” lab based in Boca Raton – far from company headquarters in Armonk, NY. The business literature, from Hamel to Tom Peters (In Search of Excellence, 1988) to Jim Collins (From Good to Great, 2001), is rife with examples of companies that understood how to successfully incubate fundamental change. Public policymaking and the implementation of new policy, for the most part, have been slow to incorporate these lessons. State education agencies are the default managers for any turnaround initiative. But they are in many ways ill-suited to conduct a dramatic-change strategy by using their customary structures and approaches – just as IBM was ill-suited to redevelop its own business model from within. Restraints over hiring, salaries, authority, and consulting work in state agencies, coupled with similar restraints over how work is conducted in schools, have conspired to make it difficult for education policy and practice to duplicate business’s occasional success at reinventing itself. What would a different model look like? There is precedent in the approach that some states have taken in creating public-private, semi-autonomous authorities to undertake important public initiatives, including infrastructure improvements and transportation management. A turnaround “authority” might well be connected with a state education agency and its commissioner – but be granted sufficient operating flexibility to be able to work effectively with turnaround schools implementing fundamental change strategies. It would not become a bureaucracy itself, with a large staff of service providers, but would take on the role of coordinating the central state functions in turnaround. Some states are experimenting with this approach, to a degree. Maryland is developing a separate turnaround enterprise, to be called The Breakthrough Center, that will coordinate the state’s school intervention strategies in its chronically low-performing schools. That initiative is patterned to a degree after Alabama’s accountability roundtable, an effort to coordinate state services around the turnaround imperative. We provide this information as a point of interest and reference, but do not believe that the SBE should propose a new and different structure in Washington State. As we observed earlier, OSPI has been working within a policy environment that places many restraints on its ability to identify school improvement needs and to catalyze a strong response in every case. We do believe that the SBE can play a role in the initiative (described in Sections IV and V) that has been missing in Washington State: that of the catalyst for district and school initiatives embodying the “second generation of standards-based reform” that we have discussed elsewhere in this proposal. OSPI will have its own considerable role to play in the initiative and will take on the responsibility – with the SBE – of positioning the Zone in the continuum of school supports and interventions being undertaken in Washington State. But the SBE should be responsive to OSPI’s ideas on how it can be most supportive of the Zone initiative, taking action to lift compliance burdens or regulatory constraints where OSPI identifies them. Many directors of current state initiatives we spoke with in the course of producing The Turnaround Challenge tended to feel that their hands

SERVING EVERY CHILD WELL: WASHINGTON STATE’S COMMITMENT TO HELPING CHALLENGED SCHOOLS SUCCEED 76
were tied behind their back. Like school leaders working on the ground, turnaround’s statewide implementers need to be freed to do their best work. Building Leadership Coalitions of Turnaround Support Beyond questions of state turnaround management is the matter of leadership commitment, at both the state and local levels. Failing schools have no natural constituency. They tend to be situated in higher-poverty neighborhoods and communities that have fallen into a continuous cycle of low expectations. Low test scores do not, as they might in more affluent communities, spark activism from parents. There is little ground-level demand for state or district intervention in struggling schools. What demand there is, comes from state policymakers monitoring the economic and racial achievement gap; non-profit and community leaders seeking to revitalize communities through improved public education; and business leaders concerned about local economies, skill levels in their recruitment pools, or the social costs of dropouts and unemployable high school graduates. There is logical precedent here; these potential supporters are the same coalition partners that, in many states (Kentucky, Massachusetts, Maryland, Texas, North Carolina, Michigan, and Florida, to name just a few) championed the cause of standards-based reform, even before the federal government got into the act with No Child Left Behind. In Washington, the Partnership for Learning has played that role, working collaborative with the state and with the Washington Business Roundtable. That coalition has led at times to some friction with the field, as happened over the A+ Commission’s recommendations earlier in this decade. But groups such as these, along with community-based organizations, professional associations, other constituency groups, and other school reform advocacy groups can play a critical role in building awareness of the need for action and support for the recommended state initiative. Proponents of a more proactive turnaround initiative need to consider the agendas and likely roles of each one.
• Mission-driven supporters: Selected foundations, non-profits, and business
leaders; some education leaders, including policymakers and practitioners. These are the key instigators required to even get a coalition off the ground. Washington State obviously has some organizations that fit this mold, including several sizable foundations and corporations. (A representative from Microsoft participated in our Design Team for this project.)
• Conditional supporters: Statewide political leaders including the governor,
chief education policymakers, and legislative leaders, along with local leaders, depending on whether and how their communities would benefit (or not) under a proposed state turnaround initiative. Support from this group requires a merging of multiple self-interested agendas.
Some legislators in communities without Priority schools may oppose dedicating state funding for turnaround, knowing that none of that funding will ever show up in their communities. Legislators and advocates for other investment targets (within the

SERVING EVERY CHILD WELL: WASHINGTON STATE’S COMMITMENT TO HELPING CHALLENGED SCHOOLS SUCCEED 77
realm of education reform or not) may also oppose sizable increases in public funding for under-performing schools, usually on the grounds that the state money they’re already receiving is being ill-spent. Some states have had issues building consensus among educators themselves, which is one reason why we worked so closely with Washington State educators in designing a proposal that they could support.
How to Build Support for Turnaround In his influential book, Leading the Revolution, researcher and business strategist Gary Hamel (2000) provides a blueprint for engineering dramatic change that turnaround advocates including the SBE would do well to review. The “manifesto” he describes could serve just as well as an 11-point guide for building the case for turnaround. Other relevant advice for coalition-builders and statewide turnaround strategists from his book includes the following. These points could well serve as rallying cries for the SBE in building support for the Innovation Zone:
• “We are committed to creating success, and building from there.” The
Zone is not an effort to address every failing school at once. The state is intentionally working with a manageable group of schools, districts, and clusters; establishing some success first, and then expanding from there. That is language the Legislature will be receptive to.
• “This is Washington State’s initiative, developed by a partnership
between local experts and national resources.” Turnaround cannot succeed and endure without broad engagement and buy-in. The state cannot force change, but it can enable a different kind of change than what traditional strategies have produced. Sums up one prominent national reformer, the president of Achieve, Inc.: “Researchers agree that reform only works if those most directly involved in it (teachers, school staff, school leaders, parents, and students) buy into it. Researchers… go so far as to say ‘No Buy-in, No Reform.’” (Cohen and Ginsburg, 2001) The key to gaining buy-in is establishing, at the outset, consensus that in the Priority Schools, the status quo has not worked and urgently needs to be changed.
• “The Innovation Zone is Washington State’s bet on its own future.”
Positive messages generate support better than negative messages. The Zone represents an effort by the state to be entrepreneurial and proactive about one of the great challenges of the day. Times are hard and the state’s finances are rocky. But government and taxpayers alike need to see some rays of hope. Converting low-performing schools into models of educational excellence can strike that optimistic note.
Coalition-building, as should be clear from the discussion above, needs to happen at two levels – statewide and community. Statewide leadership consensus can bring about productive policymaking and investment, but successful, sustained implementation on the ground requires support from educators, municipal leaders, parents, and students. Part Three of this report will include some Powerpoint materials that we hope will provide the talking points the SBE needs to build support at both levels for Washington’s Innovation Zone.

SERVING EVERY CHILD WELL: WASHINGTON STATE’S COMMITMENT TO HELPING CHALLENGED SCHOOLS SUCCEED 78
After six months of intensive discussion with stakeholders and policy and education leaders across the state, we have grown convinced that there is a strong appetite in Washington for more proactive, transformative reform in the state’s most deeply challenged schools. The initiative described in this proposal will require all of those stakeholders and leaders to take a long, collaborative step forward, all at once. We are privileged to be playing a role in helping the state envision that step, and look forward to working with the great state of Washington, in whatever way we can, to help it become a reality.
i See, for example: Hassel, B. & T. Ziebarth. (2005). School restructuring via the No Child Left Behind Act: Potential state roles. Education Commission of the States.

BOARD’S SYSTEM PERFORMANCE ACCOUNTABILITY PROPOSALS
BACKGROUND: The Board has focused on how to address system performance accountability issues over the last year and a half. Why has the Board engaged in this work aside from the fact that the legislature tasked the Board with the duty to create a system? The Board wants to recognize schools that are doing an outstanding job. Many of them are. It is also concerned about the 70,500 students1 enrolled (1 out of 14 students in the K-12 system) in struggling schools (identified by our accountability index) where there has not been improvement looking at a variety of different indicators. There are no state incentives or consequences for making transformational changes in these schools and districts, thus the need for the Board’s work to help students in those schools. Staff has prepared a background memo, documenting the work over the last year and a half, which is enclosed. The Board is examining two key areas: 1) an accountability index to identify schools and districts to be recognized and those who are struggling and need a targeted strategy, and 2) the targeted strategy for a state/local partnership for struggling schools, called Priority Schools, which includes an Innovation Zone and a range of possible intervention options if all else fails. Two additional reports are enclosed. One by Pete Bylsma that presents his work on the accountability index and a second by Mass Insight on the state/local partnership strategies for struggling schools. POLICY CONSIDERATION: Tquestions will be prepared for the discussion and need for further clarification. On October 21 we will have another work session to go into further detail on these issupreparation of our November Board meeting where the Board may take action on a proposed framework and budget to submit to the legislature.
he Board will discuss these basic concepts at its September meeting. Some key
es in
XPECTED ACTION:E
one
N
1 If alternative education students are included, the number is 83,000 students.
Chair- Mary Jean Ryan Vice Chair- Warren T. Smith Sr. Dr. Terry Bergeson, Superintendent of Public Instruction Dr. Bernal Baca Amy Bragdon Dr. Steve Dal Porto Steve Floyd Dr. Sheila Fox Phyllis Bunker Frank Austianna Quick
Linda W. Lamb Eric Liu Dr. Kristina Mayer John C. "Jack" Schuster Jeff Vincent Lorilyn Roller Edie Harding, Executive Director
(360) 725-6025 TTY (360) 664-3631 FAX (360) 586-2357 Email: [email protected] www:sbe.wa.gov

System Performance Accountability Final Paper on Background
I. SUMMARY OF POLICY ISSUES/SBE STRATEGIC PLAN GOAL Washington State statute1 assigns the Board the authority to create a statewide accountability system, which includes:
Setting performance improvement goals in key subject areas. Identifying cut scores for proficiency on state assessments. Identifying objective, systematic criteria for successful schools and districts. Identifying objective systematic criteria for schools and districts in need of assistance
or where significant numbers of students persistently fail to meet state standards. Identifying range of state intervention strategies for legislature to consider
authorizing. Creating performance incentives. Reviewing the assessment reporting system to ensure fairness, accuracy, timeliness,
and equity of opportunity. The Board has three strategic plan goals to: 1) improve student achievement; 2) improve graduation rates; and 3) improve student preparation for success in post secondary education, 21st century world of work and citizenship. A statewide accountability system is one strategy for meeting these goals and fulfilling the legislative requirements. In addition, the Board is developing objectives, indicators, and measures for performance improvement goals. Over the past eight years, the Board has set the cut scores on the WASL and the alternative assessments. This paper provides the work that the Board has engaged in to develop its draft proposals to address a statewide accountability framework. The proposals include two key and connected components:
1. An accountability index, which uses objective systematic criteria to identify successful schools and districts as well as those in need of assistance or those where students persistently fail to meet state standards, and
1 RCW 28A.305.130 (4). See Appendix A for full statutory language.

2. A proposal for a range of state intervention strategies for districts with schools where students persistently fail to meet state standards including: 1) an Innovation Zone for Priority Schools indentified through the Accountability Index and a subsequent detailed analysis. The Innovation Zone would allow local school boards to create a comprehensive transformation in how their schools operate through the use of state targeted investment as well changing the current rules and expectations, and 2) Options for graduated state oversight and changes at the local school board level, or school or district management level if conditions do not improve after a defined period of time.
Why has the Board engaged in this work aside from the fact the legislature tasked the Board with the duty to create a system? The Board wants to recognize schools that are doing an outstanding job and many of them are. It is also concerned about the 70,500 students2 enrolled (one out of 12 students in the K-12 system) in struggling schools (identified by our accountability index) where there has not been improvement looking at a variety of different indicators. There are no state incentives or consequences for making transformational changes in these schools and districts, thus the need for the Board’s work, to help these students. BACKGROUND A. The Current Accountability System The current accountability system for student performance is a patchwork of federal, state, and local requirements.
Current Patchwork for Education Accountability in Washington
Federal: NCLB
Local: Fed and State Rules and Local
Expectations
State: WASL and High
School Grad Requirements
2 If alternative education students are included, the number is 83,000.

1. Federal requirements Accountability for student achievement is strongly influenced by the federal “No Child Left Behind” (NCLB) law, which requires schools and districts, in each state, to make “Adequate Yearly Progress” (AYP) 3 to increase the academic proficiency of all students. Washington’s accountability system presently mirrors these federal measures. The expectation under AYP is that all schools and districts will increase the percent of students passing the reading and math tests each year so that 100 percent of all students will be proficient in reading and math by 2014. To accomplish this, each state is required to establish a uniform bar of performance, which is increased over time to reach 100 percent student proficiency in 2014. NCLB requires a state to implement a system of corrective action for all schools and districts receiving Title I federal funds4. Some of the corrective actions include:
Providing school choice. Providing supplemental services. Providing technical assistance. Replacing school personnel. Taking over specific schools for governance. Taking over a district for governance.
Schools are evaluated in up to 37 categories (and districts in up to 111 categories) that examine performance in reading and math for each grade tested for each sub group of student (e.g. race and ethnicity, poverty, special education and English Language Learners). All students must take the tests including special education and English Language Learners. A school moves into improvement if it misses its AYP goals in the same subject for two years in a row. Schools that do not receive Title I schools are not subject to these consequences, even if they have students who persistently fail to meet state standards. NCLB encourages states to provide a system of rewards, assistance, and interventions; however, it falls short of compelling such actions.5 In Washington, the legislature has not authorized any state interventions to address poor student achievement except to permit the withholding of federal funds and providing professional development. Washington has used a voluntary approach of technical assistance to work with struggling schools since 2002. 2. State requirements In addition to the Board’s statutory authority to develop a statewide accountability system, under the present system, state accountability is defined by: 1) annual measurement of student academic performance on the Washington Assessment of Student Learning (WASL) in reading and mathematics for grades 3-8 and 10, as well as science and writing for selected grades, and 2) the high school graduation requirement that students meet the state standards for reading
3Adequate Yearly Progress is defined by a baseline and increments of improvement in student performance on a state test in reading and math, (Washington uses the WASL) so that by 2014 all students by all subgroups (race and ethnicity, special education, low income, and English Language Learners) will reach proficiency. On-time graduation for high school and unexcused absences for elementary and middle school are also included as federal accountability measures. 4Title I of the Elementary and Secondary Education Act (the current reauthorization is No Child Left Behind) provides states with additional funding, to be distributed to schools and districts based on poverty as measured by having 40 percent or more students on free and reduced lunch. 5Up to 20 percent of Title I or other funds are available to pay transportation for students who choose to go to another school or for supplemental education “tutoring services.”

and writing, by passing the 10th grade WASL. Beyond public reporting of the WASL scores by different student subgroups at the school, district, and state levels, there are no consequences for schools’ or districts’ poor performance. While there are some rewards programs, they are independent of each other and are used inconsistently from year to year. A timeline of the evolution of Washington’s accountability system for the last sixteen years and major milestones is in Appendix B. 3. Local requirements Local school boards are accountable to their constituents for the continuous improvement of their students’ performance as well as additional community expectations. They are also accountable for meeting a myriad of federal and state requirements, including proper expenditures of funds, offering 180 days of instruction, meeting specified teacher-to-student ratios, assuring special education student procedures, and meeting the requirements of No Child Left Behind. B. National Perspectives on Accountability Roles and the Work to Improve
Student Achievement
1. National studies The main goal of current state and federal accountability systems is to improve student learning for all students. The primary way to measure student learning progress is through test performance and non academic measures such as dropout and attendance rates. These measures involve high stakes for students and schools, but few for teachers and administrators.6 Dr. Richard Elmore, from Harvard’s Graduate School of Education, recommends the following roles for policy makers, researchers, and practitioners: “Policy makers should focus on "translating" diverse political interests and adjudicating conflicts between them, to arrive at goals regarding what should be taught, the rewards offered for getting the job done, and the sanctions aimed at those schools or individuals consistently failing to improve… Distinguished practitioners, professional developers, and researchers (should) design pre-service and in-service learning opportunities and pilot successful new instructional practices. Administrative leader (should) design improvements in "resource allocation, hiring, evaluation, retention, and accountability."7 The Rennie Center for Education describes key roles for state departments of education to undertake: 1) providing guidance on curricular materials aligned to state standards, as well as diagnostic tools and data to help teachers understand the skills and knowledge of their individual students; 2) moving schools beyond the school improvement planning stage to address identified deficiencies in curriculum, professional development, and assessment; 3) setting standards for educators and increasing training programs for leaders; and 4) increasing expert staff in curriculum and professional development areas, particularly for math, special education, and English Language Learners.8
6 Elmore, Richard. “The Limits of Change”. Harvard Education Letter January/February 2002 7http://www.uknow.gse.harvard.edu/leadership/leadership001b.html 8Rennie Center for Education, “Reaching Capacity: A Blueprint for the State Role in Improving Low Performing Schools and Districts” Spring 2005

Randi Weingarten, President of the United Federation of Teachers in New York, proposes an accountability system that “presents a more balanced picture of the strengths and weaknesses of each school, where it is succeeding and where it needs help. It focuses on what makes a school not only academically successful, but also safe, collegial, and well supported—one that educates not only every child, but the whole child. (She suggests) four distinct pillars: academic achievement; safety, order, and discipline; teamwork for student achievement; and central-administration accountability. The information for making judgments would come primarily from three sources—available hard data, reports of highly trained independent teams who observe and evaluate schools on-site, and the results of a comprehensive survey of parents, teachers, administrators, and students.”9 McKinsey and Company conducted a study on twenty-five of the world’s school systems, including the top ten performers. They found that: “three things matter most: 1) getting the right people to become teachers; 2) developing them into effective instructors; and 3) ensuring that the system is able to deliver the best possible instruction for every child.”10 In addition to the top performing schools and systems internationally, there has been considerable research on high performing schools in the United States. These include: "Continuity of focus on core instruction; heavy investments in highly targeted professional development for teachers and principals in the fundamentals of strong classroom instruction; strong and explicit accountability by principals and teachers for the quality of practice and the level of student performance; and a normative climate in which adults take responsibility for their own, their colleagues', and their students' learning." 11 Mass Insight has done extensive research on high performing, high poverty schools in the U.S. and distilled the information into nine strategies that provide: 1) safety, discipline and engagement; 2) direct action to focus on students’ poverty driven deficits; 3) close student adult relationships; 4) shared responsibility for achievement; 5) personalization of instruction using diagnostic assessments and adjustable time on task; 6) continuous improvement through collaboration and job-embedded learning; 7) school leaders who can have authority to make decisions about people, time, and money; 8) leaders who can leverage resources and partners to enhance their work; and 9) system flexibility to respond to changing conditions. In summary, states have over invested in testing and under invested in building teaching capacity.12 Accountability goals must shift from earlier approaches, which required a focus solely on district compliance with state laws to one that builds capacity and requires states to redesign their support systems. 2. Status of States’ Intervention Authorities Thirty-two states have the authority to intervene in local schools and/or districts in some capacity if performance does not meet state standards. The interventions range from minimal measures, up through complete school and/or district takeover. Eighteen states do not have the authority to intervene in local schools/districts but offer assistance to struggling schools who
9 http://www.edweek.org/ew/articles/2008/05/14/37weingarten.h27.html?print=1 10McKinsey and Company, “How the World’s Best‐Performing School Systems Come Out on Top” September 2007. 11 http://www.uknow.gse.harvard.edu/leadership/leadership001b.html 12 SBE staff conversation with Dr. Richard Elmore December 2006.

want help. Research shows that districts are not likely to solicit state help voluntarily13. See Appendices C and D for full report. C. Current Conditions in Washington
1. Schools and Districts Not Meeting AYP and OSPI Response In 2007, 280 schools14 and 30 districts were in a step of improvement under No Child Left Behind (NCLB). These schools serve 212,787 students or one in five public school students in the state. Twenty-eight percent of the students in Title I schools are eligible for some federal funding under NCLB; however, seventy-two percent of the students who are not served in Title I schools are eligible for federal funding. Math performance is the major reason why schools are in a step of improvement. In many schools the categories of students of color is too small to be reported. In 2008, the number of schools jumped to 628 and districts to 57. Reasons for this large increase are primarily due to the increase in the uniform bar of expected reading and math proficiency (Washington has a stair step approach which increases every three years). Washington is one of the 18 states with a voluntary program for school and district improvement assistance. The Office of Superintendent of Public Instruction (OSPI) and State Board of Education are prohibited from intervening in schools and districts whose students persistently do not meet state standards, unless the Legislature authorizes such action. Over the last six years, the OSPI “focused assistance” or School Improvement Assistance Program has served 148 schools. Schools must participate for three years and the number of schools participating has steadily increased. In 2007-08, OSPI served 83 schools. Nine million dollars, from federal, state, and foundation grant sources, was invested in 2007 School Improvement Assistance program schools. An additional $2 million is provided for the High School Initiative and the District Assistance program—each school receives between $100,000 and $135,000 per year, based on size and grade levels. The support of a school or district improvement facilitator is included in the funding. The majority of the funding is from the federal government, which expects the funds to be directed primarily to Title I schools. Based on outside evaluations, the success of the OSPI School Improvement Assistance Program has been mixed, in terms of improvement of student achievement as measured by the WASL.15 The program has contributed to the success of 30 schools exiting school improvement after making AYP two years in a row. Some of the challenges include: districts are not viewed as partners in the school improvement process, a lack of continuity in facilitation, and a lack of sustainability of change, once the three years of state service has concluded. In spring 2008, OSPI launched a new federally funded initiative for $7 million, called the “Summit District Improvement Initiative” with five districts to increase their capacity to accelerate achievement for all students across the districts’ system of schools. Four consulting firms were
13 The Center for Comprehensive School Reform and Improvement (2005). School Restructuring Options Under No Child Left Behind: What Works When? State Takeovers of Individual Schools. 14This is out of a total of about 2,200 schools based on the spring 2007 administration of the WASL. 15Evaluations of the OSPI School Improvement Assistance Program have been conducted by the BERC Group and Northwest Regional Educational Lab.

hired to provide technical assistance in the areas of: effective leadership; quality instruction; access and use of data; assessment; intervention and monitoring; and system alignment and coherence. One of the main reasons for moving to a district approach is that as more schools do not make AYP, there will be insufficient capacity to serve all of them with school improvement facilitators and also districts need to develop their own internal systems to address school performance issues. 2. Student Performance on the Washington State Assessment of Learning The Board has also reviewed the WASL performance trend data. While significant improvements have been made in reading and writing, math and science performance for many students continues to lag behind even the state average. For example, in the past seven years, 343 schools had less than half their students meet the mathematics standard every single year.16 These schools had a total enrollment of 212,472 students in 2007, or about 21% of the state’s enrollment. Moreover, the gap between their average math performance and the state as a whole, is larger now than it was in 2001. Results in reading are better, but many schools still have large portions of students not meeting the standard. In reading, 73 schools had less than 60% of their students meet the standard in each of the past seven years. These schools had a total enrollment of 37,218 students in 2007. These low-performing schools need to accelerate their rate of improvement dramatically, if they are to have most of their students ready for graduation and then work or college. Below are more details about low-performing schools in mathematics: • 107 elementary schools had less than 50% of their students meet standard on the 4th grade
mathematics WASL for seven consecutive years. These schools enrolled 46,453 students in 2007. On average, only 35% of students in these schools met the math standard in 2007, which was 23 percentage points below the statewide results.
16Some of these schools have made significant progress during the seven‐year period, but they still had less than half their students meet the math standard. Some are relatively new and did not administer the WASL all seven years.

0%
10%
20%
30%
40%
50%
60%
70%
80%
90%
100%
2001 2002 2003 2004 2005 2006 2007
Per
cent
mee
ting
mat
h st
anda
rdAverage Grade 4 Math WASL Results
State
Low performers (N=107)

• 129 middle/junior high schools had less than 50% of their students meet standard on the 7th
grade mathematics WASL for seven consecutive years. These schools enrolled 66,715 students in 2007. On average, only 38% of the students in these schools met the math standard in 2007, which was 16 percentage points below the statewide results.
0%
10%
20%
30%
40%
50%
60%
70%
80%
90%
100%
2001 2002 2003 2004 2005 2006 2007
Per
cent
mee
ting
mat
h st
anda
rd
Average Grade 7 Math WASL Results
State
Low performers (N=129)

• 107 high schools had less than 50% of their students meet standard on the 10th grade mathematics WASL for seven consecutive years. These schools enrolled 99,304 students in 2007. On average, only 37% of the students in these schools met the math standard in 2007, which was 14 percentage points below the statewide results.
0%
10%
20%
30%
40%
50%
60%
70%
80%
90%
100%
2001 2002 2003 2004 2005 2006 2007
Per
cent
mee
ting
mat
h st
anda
rd
Average Grade 10 Math WASL Results
State
Low performers (N=107)
While some would say that the reason for the disappointing scores is due to poverty, the Board reviewed the data of all elementary schools performance in 4th grade reading and math and found that student performance varied but that some high poverty schools were able to do a lot better than the state average and some low poverty schools did a lot worse than the state average.
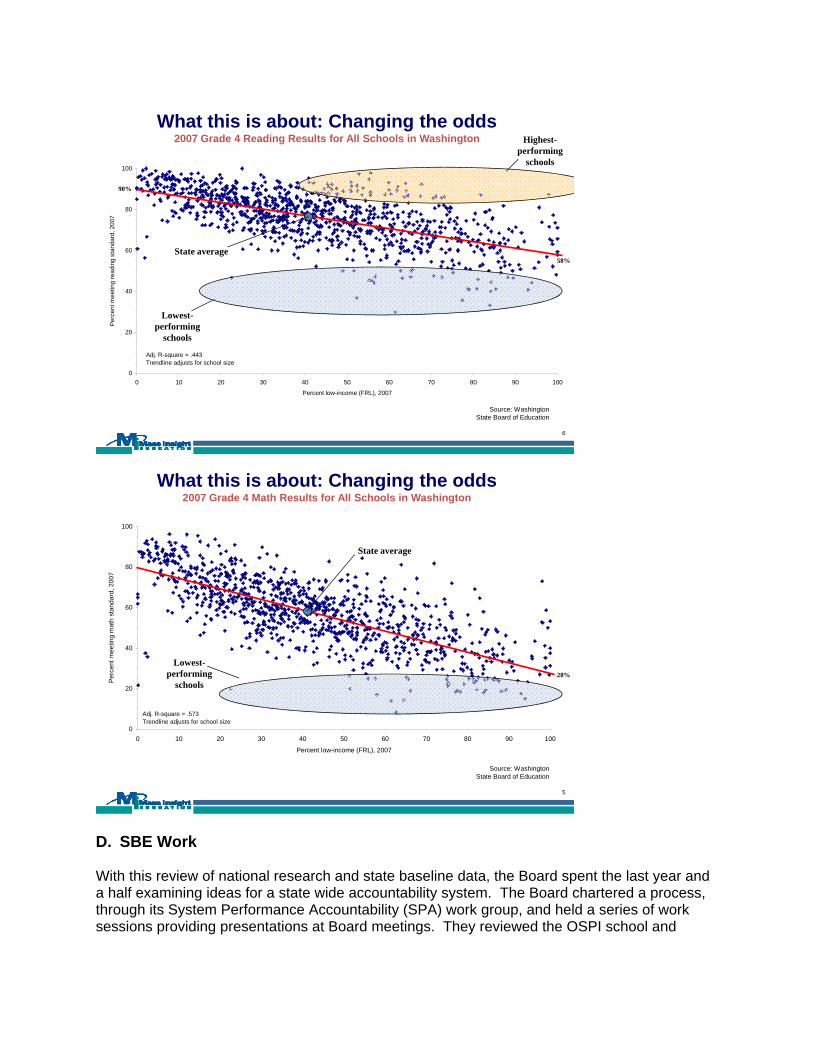
6
6
0
20
40
60
80
100
0 10 20 30 40 50 60 70 80 90 10
Percent low-income (FRL), 2007
Perc
ent m
eetin
g re
adin
g st
anda
rd, 2
007
0
Adj. R-square = .443Trendline adjusts for school size
State average58%
90%
Lowest-performing
schools
What this is about: Changing the odds2007 Grade 4 Reading Results for All Schools in Washington Highest-
performing schools
Source: Washington State Board of Education
5
5
What this is about: Changing the odds2007 Grade 4 Math Results for All Schools in Washington
0
20
40
60
80
100
0 10 20 30 40 50 60 70 80 90 100
Percent low-income (FRL), 2007
Perc
ent m
eetin
g m
ath
stan
dard
, 200
7
Adj. R-square = .573Trendline adjusts for school size
State average
28%
Lowest-performing
schools
Source: Washington State Board of Education
D. SBE Work With this review of national research and state baseline data, the Board spent the last year and a half examining ideas for a state wide accountability system. The Board chartered a process, through its System Performance Accountability (SPA) work group, and held a series of work sessions providing presentations at Board meetings. They reviewed the OSPI school and

district improvement programs, the school improvement programs in other states, and Washington teacher mobility issues. They commissioned two studies through a competitive national process: one on Washingtonian educator’s and stakeholder’s perceptions of the current Washington policy barriers and another on developing potential state/local partnerships to address schools with students that persistently fail to meet standards. The Board developed an accountability index to identify successful schools and districts, as well as those in need of greater assistance. They are also listening carefully to what a variety of stakeholders and the public have to say. The Board has had a group of System Performance Advisors including school board members, the Washington Education Association, Washington Association of School Administrators, Association of Washington School Principals, selected educators and business members participate in its work sessions. 1. Review of OSPI School Improvement Program
In spring 2007, the Board contracted with Mass Insight Education, a nonprofit research organization in Boston, to examine Washington’s current school improvement assistance program. Mass Insight Education staff has been doing extensive research, nationally, to address the issues with schools that are chronically underperforming. Major findings: The consultants highlighted the following as strengths of the current Washington School Improvement Assistance Program on which any new state assistance program should build on:
Well-regarded facilitator network. State-targeted effort of improvement for those schools that volunteer. Partially-integrated approach with the nine elements of a high performing school. Collaborative nature.
The consultants noted challenges with current school improvement initiatives across the nation, including Washington’s. These include:
No incentives or disincentives to drive major change at the local level. No means to change local operating conditions. No comprehensive strategy to address deeper needs of high poverty students. Lack of comprehensiveness, intensity, and sustainability. Lack of highly visible public and private sector commitment.
Board members affirmed many of these findings from their spring field visits to selected schools across the state. 2. Review of Other States, Advisor Input and Research
Based on staff investigations of other states; including Massachusetts, Kentucky, and North Carolina, research on effective schools, and input from its advisors, the SPA Work Group identified characteristics of high-performing schools and districts:
Strong leadership in schools and/or districts. A talented pool of effective educators to assist schools and districts. Knowledge or access to knowledge, about successful schools and districts. School and district specific challenging goals and effective ongoing feedback. A viable district curriculum and instruction aligned to state standards. Use of curriculum-based formative assessments to inform instruction. Use of data to improve instruction.

Professional development aligned to school and district strategic plans. Professional development that is job-embedded and ongoing. Use of a cycle of inquiry and reflection.
3. Trends in Teacher Retention and Mobility in Selected Washington Middle and High
Schools
In fall 2007, SBE contracted with The Center for Strengthening the Teaching Profession, (CSTP) to complete a study on teacher resources in our schools. The study focused on the middle schools and high schools in six districts—Highline, Pasco17, Seattle, Spokane, Tacoma, and Yakima. The six districts were selected based on the variability among their middle schools, in students’ performance on the WASL. As noted in the study, these six districts are not to be considered representative of districts in the state or any groups of districts in the state. Major findings: There was a high degree of mobility, particularly among middle school teachers:
46 percent left their school within five years compared to 40 percent of high school teachers.
The differences are greater among schools within a district, than across districts in teacher mobility rates and percent of teachers with fewer than five years of teaching experience. 18
The following relationships were found among teacher mobility and student and teacher characteristics:
Higher teacher mobility rates were related to higher levels of student poverty and higher percentages of teachers with fewer years of experience19 (particularly those with fewer than five years of experience).
Lower teacher mobility rates were related to higher performance on the reading and math WASL.
Implications: Four implications emerged from this study:
The middle school climate and culture in some schools may not be conducive to supporting teachers and students.
High levels of teacher mobility can be very disruptive to school cultures and the learning environment. Frequent turnovers can lead to lack of cohesiveness in the teaching community and increase the need for professional development services.
The differences in mobility rates across schools in a district, suggest possible inequities in levels of teacher resources available to a district’s students.
To the extent that level of experience differentially impacts student learning, large differences among schools in the percent of teachers with less than five years of experience may indicate inequitable distribution of learning resources for children.
17 The Pasco School District brought to the Board’s attention that the study did not take into consideration the opening of a new middle school which invalidated some of the conclusions about their district. 18 This finding is based on SBE calculations using data provided by CSTP. 19 This finding is based on SBE calculations using data provided by CSTP.

4. Study of State and Local Policy Barriers to Raising Achievement Dramatically for All
Students In spring 2008, the Board contracted with Northwest Regional Educational Lab to study the perceptions that state policy makers and local educators had on the Washington barriers to student achievement. They interviewed several hundred educators and policy makers in Washington. All stakeholders agreed that there is a lack of statewide program coherence. All too often districts receive multiple inputs from various educational policy-making bodies at the state level. Major findings: Key policy barriers identified from both teachers and administrators included:
• Insufficient and impermanent resources. • Lack of time for professional development and teacher collaboration time. • Inflexibility in allocating resources to higher need areas to improve student achievement. • Lack of coherent systems that support the entry, development, and retention of quality
staff members. Another big barrier teachers identified was class size. Principals and superintendents identified the inability to dismiss ineffective staff as a large barrier. Implications: Washington State may wish to:
Coordinate the efforts of the various state educational agencies and policy-making bodies to increase program coordination and the perception of program coherence when viewed from the district and building level.
Develop and maintain a stable funding source for school improvement that educators can count on over time.
Establish and provide additional time – allowing teaching staff and administrators the opportunity to focus on student achievement through collaboration and professional development.
Find ways to remove or moderate restrictive provisions of the collective bargaining agreement in a manner that strengthens building teams and provides adequate teacher participation in critical decisions.
5. Feedback from SPA Advisers: SPA advisers identified that districts need: • Ways to focus on improving student achievement:
o Share data on students across the state and for teachers to see how their individual students performed.
o Provide formative assessments to help teachers see where students are on a regular basis.
o Share information on interventions that work. o Provide opportunities so that cluster feeder schools enable teachers to talk with
each other. o Use peers from like schools to work with each other. o Examine different student populations.

• Meaningful and streamlined School Improvement Plans: o Reduce the time on process when we want to focus on real and authentic
change. o Avoid any accreditation system that has different requirements from a school
improvement plan. o Streamline any state review processes; avoid more layers of state review.
• Accountability that: o Creates a sense of trust. o Includes a role for local school boards. o Builds a deep level of ownership at local level.
• Resources to: o Build capacity to do school/district improvement plans and planning. o Train leaders (principals, teachers) to make changes. o Allow flexibility in resources, removing strings attached from legislature on
different pots of money and reexamining current collective bargaining agreements, increasing the number of math and science teachers through retooling for current teachers to get new endorsements and examining performance pay.
o Provide more time to review data and make changes in instructional practice.
6. Feedback from Public on Initial Accountability Proposals
The State Board of Education gathered accountability feedback from 86 group comment forms filled out at public outreach meetings and 373 online and paper surveys, for a total of 459 responses. Should the state provide more assistance to schools/districts that consistently don’t meet standards?
More than ¾ of survey respondents agree that the state should provide greater assistance to schools and districts that consistently don’t meet standards.
Who should help schools that consistently fail to meet standard?
Respondents indicate that local groups (the school district, an ESD, or some combination) are preferred, with funding from the state.

How should schools be recognized for improvement/achievement? Continued improvement on performance for all groups of students was the most selected single category. However, respondents indicated schools should be recognized for a combination of factors; the most important being continued improvement, and achievement despite challenges. Currently, schools are evaluated statewide on their student WASL scores and graduation rates. What other measures should be used to evaluate school performance? In a fall 2008 meeting with approximately 100 union members at WEA, teachers encouraged the Board not to use the WASL in its accountability index, but to use some of these other indicators:
·Other testing measures: standardized or standards based tests, other than the WASL including (but not limited to): ACT, SAT, ITBS, MAPS, and tests allowing national/international comparison. ·Future student outcomes: postsecondary attendance rates, success in postsecondary, remediation rates after high school, wages post-high school, 1-10 year post high school student outcomes, postsecondary completion rates, future life satisfaction. ·Assessment of the whole student: qualitative measurements, student satisfaction, formative assessments, multiple assessment measures to create a picture of the whole child, teacher observation, student community involvement etc. ·Individual growth: compare student data from the beginning to the end of the year, track K-12 cohort data, end-of-course assessments, student grades, and getting failing students back on track.
Draft Proposals
A. Proposed Accountability Index See Pete Bylsma’s Paper
B. Proposed Innovation Zone and Options for Graduated State Oversight See Mass Insight’s Paper

APPENDIX A - State Board of Education Statewide Accountability Duties Defined by Statute RCW 28A.305.130 (4) The state board of education shall for purposes of statewide accountability: (a) Adopt and revise performance improvement goals in reading, writing, science, and mathematics, by subject and grade level, once assessments in these subjects are required statewide; academic and technical skills, as appropriate, in secondary career and technical education programs; and student attendance, as the board deems appropriate to improve student learning. The goals shall be consistent with student privacy protection provisions of RCW 28A.655.090(7) and shall not conflict with requirements contained in Title I of the federal elementary and secondary education act of 1965, or the requirements of the Carl D. Perkins vocational education act of 1998, each as amended. The goals may be established for all students, economically disadvantaged students, limited English proficient students, students with disabilities, and students from disproportionately academically underachieving racial and ethnic backgrounds. The board may establish school and school district goals addressing high school graduation rates and dropout reduction goals for students in grades seven through twelve. The board shall adopt the goals by rule. However, before each goal is implemented, the board shall present the goal to the education committees of the house of representatives and the senate for the committees' review and comment in a time frame that will permit the legislature to take statutory action on the goal if such action is deemed warranted by the legislature; (b) Identify the scores students must achieve in order to meet the standard on the Washington assessment of student learning and, for high school students, to obtain a certificate of academic achievement. The board shall also determine student scores that identify levels of student performance below and beyond the standard. The board shall consider the incorporation of the standard error of measurement into the decision regarding the award of the certificates. The board shall set such performance standards and levels in consultation with the superintendent of public instruction and after consideration of any recommendations that may be developed by any advisory committees that may be established for this purpose. The initial performance standards and any changes recommended by the board in the performance standards for the tenth grade assessment shall be presented to the education committees of the house of representatives and the senate by November 30th of the school year in which the changes will take place to permit the legislature to take statutory action before the changes are implemented if such action is deemed warranted by the legislature. The legislature shall be advised of the initial performance standards and any changes made to the elementary level performance standards and the middle school level performance standards; (c) Adopt objective, systematic criteria to identify successful schools and school districts and recommend to the superintendent of public instruction schools and districts to be recognized for two types of accomplishments, student achievement and improvements in student achievement. Recognition for improvements in student achievement shall include consideration of one or more of the following accomplishments: (i) An increase in the percent of students meeting standards. The level of achievement required for recognition may be based on the achievement goals established by the legislature and by the board under (a) of this subsection;

(ii) Positive progress on an improvement index that measures improvement in all levels of the assessment; and (iii) Improvements despite challenges such as high levels of mobility, poverty, English as a second language learners, and large numbers of students in special populations as measured by either the percent of students meeting the standard, or the improvement index. When determining the baseline year or years for recognizing individual schools, the board may use the assessment results from the initial years the assessments were administered, if doing so with individual schools would be appropriate; (d) Adopt objective, systematic criteria to identify schools and school districts in need of assistance and those in which significant numbers of students persistently fail to meet state standards. In its deliberations, the board shall consider the use of all statewide mandated criterion-referenced and norm-referenced standardized tests; (e) Identify schools and school districts in which state intervention measures will be needed and a range of appropriate intervention strategies after the legislature has authorized a set of intervention strategies. After the legislature has authorized a set of intervention strategies, at the request of the board, the superintendent shall intervene in the school or school district and take corrective actions. This chapter does not provide additional authority for the board or the superintendent of public instruction to intervene in a school or school district; (f) Identify performance incentive systems that have improved or have the potential to improve student achievement; (g) Annually review the assessment reporting system to ensure fairness, accuracy, timeliness, and equity of opportunity, especially with regard to schools with special circumstances and unique populations of students, and a recommendation to the superintendent of public instruction of any improvements needed to the system; and (h) Include in the biennial report required under RCW 28A.305.035, information on the progress that has been made in achieving goals adopted by the board;

APPENDIX B – No Child Left Behind (NCLB) and Adequate Yearly Progress (AYP) In 2002, the No Child Left Behind legislation reauthorized the Elementary and Secondary Education Act (ESEA). The reauthorization strengthened the accountability provisions of Title 1 of ESEA. It requires states to set definitive timelines for improving student achievement and closing achievement gaps experienced by low-income and minority students (compared to non low-income and non-minority students, respectively). These requirements are the Adequate Yearly Progress (AYP) provisions. Further, NCLB ensured that parents and the public would have access to information on how schools are doing through state, district, and school report cards. Adequate Yearly Progress: NCLB requires that all (100%) students be proficient in reading and mathematics by 2014. To attain this goal, Washington State established baseline performance levels from 2000, 2001, and 2002 WASL data and annual targets (a.k.a. annual measurable objectives or state uniform bars). In addition to WASL performance goals, schools must meet annual targets for an “other performance indicator.” In Washington, this other indicator is the unexcused absence rate goal for elementary and middle schools and the graduation rate goal for high schools. Finally, school districts and schools must meet a 95% participation rate goal on both the reading and mathematics WASL. The WASL performance and the participation rate goals must be met by all students as well as by the following student subgroups: African Americans, American Indians or Alaskan Natives, Hispanics, Asians and Pacific Islanders, Caucasians, English Language Learners, Low-Income students, and special education students. Therefore, in total, there are 37 different cells for which a school or school district must meet the annual target in order to be designated as making AYP.20 School Improvement: Schools are identified for improvement when any group does not make AYP in two consecutive years for the same measure; that is, reading proficiency, math proficiency, reading participation, math participation) or the other school-wide indicator. Districts are identified as needing improvement if all their grades do not meet AYP for the same measure—reading or math proficiency or participation or other indicator—in two consecutive years. Not meeting AYP targets—same group for same measure—for the first two consecutive years puts a school or district in sep one of school improvement. A school or district advances to the next step of school improvement (i.e., steps 2, 3, 4, 5) if it continues not to make AYP for the same group and measure. If a school or district makes AYP, it remains at its current step of school improvement. Making AYP two years in a row gets a school or district out of steps of school improvement. Although all schools are identified as making or not making AYP, only Title I schools are subject to federal requirements for not making AYP. Schools identified in step one must develop a two-year plan to improve. The school receives technical assistance through the school district as it develops and implements its improvement plan. The plan must include research-based strategies, a ten percent set-aside of Title I dollars for professional development, extended learning time, strategies to promote effective parental involvement, and mentoring for new teachers. Students in step one schools must be offered the option of transferring to another
20 There are many numerous details with regard to calculating AYP. For example, there are requirements for the minimum number of students tested to do a calculation; the use of performance data for students enrolled for a “full academic year” only, and the application of margins of error to the percent proficient numbers. There are also Safe Harbor stipulations through which a student group makes AYP, even though it does not make the math or reading AYP targets or a school makes AYP even though it does not make the other indicator target.

public school in the district that has not been identified as needing school improvement. In Washington, some of these schools are invited to participate in the state’s three-year School Improvement Assistance Program (SIAP). The school district must continue to offer public school choice to the students in step two schools. In addition, students from low-income families are eligible to receive supplemental educational services, such as tutoring or remedial classes, from a state-approved provider. The school district must implement corrective actions to improve schools in step three. Corrective actions may include replacing certain staff, fully implementing a new curriculum, significantly decreasing management authority at the school level, extending the school day or year, appointing an outside expert to advise the school on its progress toward making AYP in accordance with its school plan, or internal reorganization of the school. Districts must continue to offer public school choice and supplemental educational services for low-income students. A district must initiate plans for restructuring a school in step four. Restructuring may include reopening the school as a charter school, replacing a principal and all or most of the school staff, turning over school operations, either to the state or to a private company with a demonstrated record of effectiveness, or any other major restructuring of school governance. For schools in step five, the district must implement an alternative governance plan no later than the first day of the following school year. States must institute corrective action immediately for districts receiving Title I funds and identified in step one for improvement. Such districts are required to create an improvement plan within three months, allocate ten percent of their Title I, Part A funding for professional development, and receive technical assistance. Reporting: NCLB requires each school district to disseminate annual local report cards that include information on how students in the district and in each school perform on state assessments. The report cards must state student performance in terms of three levels: basic, proficient, and advanced. The achievement data must be disaggregated by subgroups: race, ethnicity, gender, English language proficiency, migrant status, disability status, and low-income status. The report cards must also tell which schools have been identified as needing improvement and the step of improvement. The report card for each school will include:
• State assessment results by performance level, including: 1) two-year trend data for each subject and grade tested; and 2) a comparison between annual objectives and actual performance for each student group.
• Percent of each group of students not tested. • Graduation rates for secondary school students disaggregated by student subgroups. • Aggregate information on any other indicators used by the state to determine the
adequate yearly progress of students disaggregated by student subgroups. Washington has chosen unexcused absence rates for schools with elementary or middle school grades.
• Performance of school districts on adequate yearly progress measures, including the number and names of schools identified, as needing improvement.
• Professional qualifications of teachers in the state, including the percentage of teachers in the classroom with only emergency or provisional credentials, and the percentage of

classes in the state that are not taught by highly qualified teachers, including a comparison between high- and low-income schools.
States must also issue report cards for their level. In Washington, OSPI provides the NCLB-required and other information for the state, districts, and schools on its website. The report cards include WASL, NCLB, AYP, student demographic, teacher information, and financial data. Rewards: NCLB requires states to provide academic achievement awards to schools that close achievement gaps between groups of students or that exceed academic achievement goals. States are allowed to use Title I funds to reward teachers in such schools. States must designate as distinguished schools, those that have made the greatest gains in closing the achievement gap or in exceeding achievement goals. Education Accountability Timeline21: 1992: Legislature passes ESHB 5953, which creates a Commission on Student Learning,
an 11-member board appointed by the Governor and State Board of Education. The Commission is set to expire in 1999.
1993: Governor’s Commission on Education Reform and Funding established. 1993: Washington State Legislature passes the Education Reform Act, (House Bill 1209)
calling for the creation of common learning goals for all students, an assessment system to measure student progress in meeting the state standards, and accountability for continuous improvement in student learning. The Commission on Student Learning is charged with developing and implementing key components of the Act.
1993-96: Academic standards are developed in reading, writing, math, social studies, science, arts, and health and fitness.
1996-01: The Washington Assessment of Student Learning (WASL), which tests reading, writing, and math, is phased in as a requirement for grades 4, 7 and 10. Teachers and community members oversee development of WASL.
1999: Commission on Student Learning expires. 1999: Legislature passes SSB 5418, creating the Academic Achievement and Accountability
(A+) Commission, to develop and implement accountability and assistance programs for Washington’s schools and districts.
2000: State Board of Education determines that the class of 2008 will be the first to meet new statewide graduation requirements: pass the 10th-grade WASL, complete Culminating Project, create High School and Beyond Plan, and earn minimum class credits.
2001: Failed legislative effort to pass a comprehensive bill. 2001: No Child Left Behind Act (NCLB) requires annual testing in grades 3-8 and once in
high school, in reading and math. NCLB also requires every classroom to have a "highly qualified" teacher.
2004: State Legislature recommits to education reform efforts by putting into law the graduation requirements. The state provides students five opportunities to take the 10th-grade WASL and earn a Certificate of Academic Achievement. It also calls for struggling students to receive individualized academic help and an alternative for
21Marc Fraser of Education First Consulting May 2008

students that struggle, to demonstrate their skills on the high school WASL. The Certificate of Individual Achievement is created for special education students that are unable to take the WASL.
2005: Legislature passes HB 5473, which reconstitutes State Board of Education, and E2SHB 3098, which dissolves the A+ Commission and transfers its duties to the Board. The new Board consists of five members elected by local school board members, one private school representative elected by members of state-approved private schools, the Superintendent of Public Instruction elected statewide, seven members appointed by the Governor, and two non-voting high school students.
2005: Legislature approves $2 million, matched by the Bill & Melinda Gates Foundation, to expand OSPI’s school improvement assistance program to serve more school districts and high schools. Districts volunteer for improvement services and are selected through a competitive process.
2006: Students in the class of 2008 take the WASL as sophomores. Students who do not pass the exam the first time have two more years to get help, retake the exam or access an alternative to the test.
2008: First class to meet new statewide graduation requirements, including passing the reading and writing WASL.
2013: Passing the high school math and science WASL added to the graduation requirements.

APPENDIX C – The National Picture of State Intervention Authority in Low Performing Schools and Districts, Jessica Ganet Summer Intern to the SBE Washington Statute The Washington State Board of Education and the Office of the Superintendent of Public Instruction lack the authority to intervene in low performing schools and districts unless they volunteer for assistance. The statute states that the State Board of Education can:
Identify schools and school districts in which state intervention measures will be needed and a range of appropriate intervention strategies after the legislature has authorized a set of intervention strategies. After the legislature has authorized a set of intervention strategies, at the request of the board, the superintendent shall intervene in the school or school district and take corrective actions. This chapter does not provide additional authority for the board or the superintendent of public instruction to intervene in a school or school district (RCW 28A.305.130 (4) (e))
Overview This report summarizes the national picture of state authority to intervene in consistently low performing schools, along with an in depth look at the models in a few states. The information provided is collected from a variety of sources including: state statutes from each of the 50 states, Education Commission of the States (ECS), WestEd Policy Center, Education Development Center, Arizona Department of Education, REL Southwest at Edvance Research, Rhode Island Department of Education, Texas Department of Education, Louisiana Recovery School District, and Federal Department of Education Consolidated State Performance Reports. The table in Appendix A displays the intervention authority by state, along with the state laws, and a list of possible actions that states can take. The National Picture Approximately 60% of states have the authority to intervene in local schools and/or districts in some capacity. The interventions range from minimal measures, up through complete school and/or district takeover. For the most part, states that do not have the authority to intervene in local schools/districts offer assistance to struggling schools; however, in Washington, assistance is completely voluntary. Research shows that districts are not likely to voluntarily solicit state help22. States with Intervention Authority The three main authorities granted to states are: district takeover, school takeover, and school reconstitution. Thirty-two states have the authority to do one or more of the following:
· 25 states have the authority to take over whole districts. · 16 states have the authority to take over individual schools. · 20 states have the authority to reconstitute schools.
School or district takeover generally involves a comprehensive review process followed by replacing staff, administration and/or board members. In several states, takeovers also involve the state taking charge of resource allocation for the school/district.
22 The Center for Comprehensive School Reform and Improvement (2005). School Restructuring Options Under No Child Left Behind: What Works When? State Takeovers of Individual Schools.

School reconstitution presents a wide variety of options. States with this authority employ a variety of methods including (but not limited to): contracting with private or nonprofit agencies to run the school, implementing new curriculum, providing professional development, reassigning students/staff/administration, implementing research supported improvement methods, changing school procedures, establishing a state appointed expert team within the school, and creating charter schools. States with No Intervention Authority Eighteen states do not have the authority to intervene in consistently low performing schools. These states include: Alaska, Delaware, Hawaii, Idaho, Indiana, Maine, Minnesota, Montana, Nebraska, New Hampshire, North Dakota, Oregon, South Dakota, Utah, Washington, Wisconsin, Wyoming, and Virginia. In general, these states offer voluntary assistance to local schools/districts. State Intervention Models While several states have the authority to step in with local schools and districts, few have done so. Examples of different intervention models are summarized as follows: Arizona’s model involves intervening with individual schools, and has been more effective at improving achievement than most states. Texas uses a strict model that allows them to effectively monitor large numbers of underperforming schools. Rhode Island’s model intervenes with whole districts, and can specify interventions for working with collective bargaining agreements. Louisiana has an interesting model that involves transferring individual struggling schools to a state Recovery School District. Pennsylvania exercises less intervention authority, but provides very clear intervention steps for low performing schools. Arizona: School Takeover If a school fails state standards for three consecutive years, the state begins taking steps to “take over.” State staff conducts an extensive three-day site visit to classrooms and observe teachers; as well as interview students, administrators, teachers, and parents. The staff creates a report that outlines an intervention strategy. Strategies include:
• Minimal intervention, generally just giving schools more time to improve, which is rare, and has only been used twice. In both cases the schools recently made a leadership change for the better and just needed more time to improve.
• An in between step is to deploy a mentor principal appointed by the state. This is used when the current principal has some deficiencies but shows promise. The mentor principal works intensively with the building principal throughout the year. They meet two to four times per month and communicate daily.
• In most cases, more extensive interventions are deemed necessary. The state replaces the principal with a turnaround principal. Turnaround principals are selected from a pool of people that are screened and approved by the state. The principal gets a salary from the district plus a stipend from the state.
• In addition, two teachers screened and selected, by the state, are deployed to a low performing school to serve as a coach/mentor/model. These teachers are generally in a school for three years.
Arizona has had more success than many states. Originally they intervened with 11 schools; nine were successfully removed from failing status in two years. Currently, the state is intervening with nine schools; four of which are in one district. As a reaction, the state has recently extended the authority of the Arizona State Board of Education to intervene in whole

districts where 50% of the schools in a district are underperforming or failing. Arizona is currently establishing its district intervention process. Louisiana: Recovery School District (RSD) Louisiana has a unique model that transfers failing schools into the Recovery School District; a state run district overseen by the State Board of Education. All staff, teachers, and administrators for RSD are hired by the state, which uses its own salary schedule and calendar. Schools remain part of RSD for five years, at which point RSD presents a report to the Board, who decides if the school can be transferred back to its district. The RSD has a small leadership team hired by the state and a streamlined central organization providing instructional and operational support; as well as an advisory committee of local, national and international education experts who connect RSD with expertise and best practices. The district has seven main objectives:
1) Student achievement 2) Quality leadership 3) Parental and community collaboration 4) Transparency and accountability 5) Equal access and equity 6) High quality charter schools 7) Positive collaborative relationship with New Orleans Public School System.
Pennsylvania: Education Empowerment Districts Pennsylvania has limited authority to intervene in low-performing districts as a group. A few districts can be designated as “education empowerment districts”, allowing the SBE to:
• Establish any school as a charter school, or designate a school as independent from a district.
• Employ certified professional staff. • Reconstitute a school. • Reassign, suspend, or dismiss a professional employee. • Supervise and direct principals, teachers, and administrators. • Rescind the contract of the superintendent and other administrative personnel. • Reallocate resources, amend school procedures, and develop achievement plans and
other evaluation procedures Pennsylvania has intervened with a few school districts. The first interventions were unsuccessful, mainly because the process was rushed and the board appointed to oversee the process was too small; not representative of stakeholder groups; and had strong affiliations with the low-performing system. Later interventions appear to be somewhat more successful. Rhode Island: Whole District Intervention The State of Rhode Island has the following district intervention authority:
If after a three (3) year period of support there has not been improvement in the education of students as determined by objective criteria to be developed by the board of regents, then there shall be progressive levels of control by the department of elementary and secondary education over the school and/or district budget, program, and/or personnel. This control by the department of elementary and secondary education may be exercised in collaboration with the

school district and the municipality. If further needed, the school(s) shall be reconstituted. (RIGL § 16-7.1-5)
The following is an example of the actions the state took with one consistently underperforming district:
• Superintendent transition: the State Board appointed a new superintendent who is an extension of the Rhode Island Department of Education (DOE).
• Corrective action plan: the DOE read the plan submitted by the district and noted several changes that needed to be made, such as increasing building central office capacity, implementing electronic portfolios, and implementing various literacy techniques.
• Teacher contract issues: the DOE notes issues with the current teacher contract that are barriers to improvement and insists that the district reopen contract negotiation and bring barriers to the table.
• Middle school issues: include restructuring action plans, revising the tenured teacher evaluation system, establishing grade level teams, protecting staff at the alternative middle school, and working with the education commissioner.
• High school issues: include developing a corrective action plan that targets areas of concern, undertaking course analyses particularly in math, creating greater coherence between middle school and high school, and descriptions of how to work with the commissioner.
• Additional items: continuing work with a dropout prevention program, as well as new grading standards and procedures.
Rhode Island is in the middle of the improvement process with this district; therefore, the success of the process is unknown at this point. Texas: Site Based Intervention Teams The Texas model uses two different types of school intervention teams: Technical Assistance Teams (TATs) and Campus Intervention Teams (CITs). TATs are a prevention measure for schools at risk of becoming “academically unacceptable.” When schools meet standard for the current year, but score low enough to not meet standard for the next year they must form a TAT. The TAT is made up of two people from the district, but not from the at risk site. They work through an improvement process with the school but do not submit official paperwork. CITs are for “academically underachieving” schools. This two member team is made up of one external member who has no affiliation with the school or district, and one internal member who is affiliated with the district, but not the school. The CIT uses data analysis, needs assessments, and improvement plans, working closely with a state monitor. A state employee typically oversees 40-50 CITs. A CIT stays with a school until it is ranked “academically acceptable” for two consecutive years. Schools not complying with their CIT are placed on escalated intervention and a state monitor is placed in the school. Schools that remain “academically unacceptable” are at risk of losing their accreditation.

Further Resources The majority of states are still in the experimental stage of state intervention. Several education policy organizations have published studies on what has and has not worked so far. The majority of the research is based on anecdotal evidence, and cites lessons learned from failed attempts at intervention, rather than successful endeavors. The Center for Comprehensive School Reform and Improvement, in particular, has published several papers about the pros and cons of state takeovers, citing that few states have been able to truly improve student achievement through state intervention23.
• Pros: States hold the primary responsibility for education; state departments have more money than local districts; and the federal government has given states a big role in improving local education. The state is more likely to be informed about researched best practices.
• Cons: States often lack the capacity to intervene successfully; boundaries between state and local authority are complex; and improving performance in persistently low performing districts is difficult.
Some helpful lessons that have been learned through this research are2: • State intervention requires an effective oversight body that is representative,
independent, knowledgeable, well planned, tough, and sensitive to local concerns. • The State needs staff dedicated to intervention; the process is time and labor intensive. • Fairness, transparency and adequate funding are essential for success.
References
• Comprehensive School Reform (2006) School Restructuring Under No Child Left Behind: What Works When? A Guide for Education Leaders. Learning Point Associates in partnership with Southwest Educational Development Laboratory and West Ed under contract with the Office of Elementary and Secondary Education of the U.S. Department of Education.
• Comprehensive School Reform (2005) School Restructuring Under No Child Left Behind: What Works When? State Takeovers of Individual Schools. Learning Point Associates in partnership with Southwest Educational Development Laboratory and West Ed under contract with the Office of Elementary and Secondary Education of the U.S. Department of Education.
• State Statutes and Administrative Code from all 50 States • Texas Education Agency. Interview with John Matysek in Accountability (512)463-6012
on Thursday August 7, 2008. • Texas Education Agency (2008). 2008 Accountability Manual. Found at:
http://www.tea.state.tx.us/perfreport/account/2008/manual/ • Louisiana Department of Education, Recovery School District. Conversation with Pamela
Usand at the Recovery School District (504)872-0633 on August 7, 2008 • Louisiana Department of Education (2006). Recovery School District Legislatively
Required Plan. Found at: http://www.nolapublicschools.net/resources.aspx • Arizona Department of Education. Interview with Kimberly Allen, Deputy Associate
Superintendent, School Improvement and Intervention (602)364-2281 on July 21, 2008.
23 The following are from: The Center for Comprehensive School Reform and Improvement (2005). School Restructuring Options Under No Child Left Behind: What Works When? State Takeovers of Individual School. And also (2006) A Guide for Education Leaders, from the same group.

• Rhode Island Department of Education. Email correspondence with Rick Richards, State Intervention Contact [email protected] in July, 2008.
• Federal Department of Education. Consolidated State Performance Report. (2006-2007) for all 50 states.
• Education Development Center, Email correspondence with Leslie Hergert, Managing Project Director, [email protected] in July, 2008.
• WestED Policy Center, Reino Makkonen (July 30, 2008). Memo Re: State Takeovers if Individual Schools.
• Education Commission of the States (2002). Policy Brief Accountability-Rewards/Sanctions: State Takeovers and Reconstitutions.
• Consortium for School Improvement (2006). Policy Brief: State Support to Schools in Need of Improvement. Council of Chief State School Officers, Washington D.C.

APPENDIX D
Summary of States’ Intervention Authorities in Low Performing Schools and Districts
State Intervention Authority
State
District Take-over
School Take-over
School Recon-struction State Statute
State Statute
List of Possible Actions the State Can Take
Alabama Yes Yes
The state superintendent of education is required to intervene and appoint a person or persons to run the day-to-day operation of a low performing school. The local board may petition the SBE for release from state intervention by showing acceptable improvement in achievement or financial stability or other just cause.
16-6B-3 and 16-6B-6
Guide school in self-study, designate a team of practicing professionals to visit a school, conduct a study, consult with parents and make specific recommend-dations, appoint people to run the day-to-day operation of the school, assistance program for local boards of education
Alaska
The State has recommended actions (not mandatory) for actions schools in various levels of improvement. none found

State Intervention Authority
Arizona Yes Yes Yes
The SBE has the discretion to determine to what extent they will participate in the operation of a low-performing school. 15-241
Evaluation by the SBE of adherence to school improvement plan, align curriculum with academic standards, provide teacher training, prioritize the budget, implement proven strategies to improve academic performance, public hearing to determine if a government nonprofit or private organization can submit an application to manage the school, participate in the operation of the school including replacing teachers, admin, staff, and district level people, modify the budget
Arkansas Yes Yes Yes
The SBE may require the school to dismiss staff and administrators, annex the school to another school that is not in need of improvement, and/or take other such action as deemed necessary by the state department
ADE 188 (10.1.6)
Students have option to move to a school/district not in improvement, the SBE approves a plan and specifies corrective actions, school restructuring, annex the school into another school, take over the school.

State Intervention Authority and the state board.
California Yes Yes Yes
In California this is voluntary. The State Education Code says: Superintendent of Public Instruction, with the approval of the State Board of Education, shall invite schools that scored below the 50th percentile on the achievement tests administered pursuant to Section 60640 both in the spring of 1998 and in the spring of 1999 to participate in the Immediate Intervention /Underper-forming Schools Program. A school invited to participate may take any action not otherwise prohibited under state or federal law and that would not require reimbursement by the Commission on State Mandates to improve pupil
52053-52055.5

State Intervention Authority performance." If districts apply and are approved for this process there are many actions the state can take.
Colorado Yes Yes
Schools rated "unsatisfactory" for three years in a row must become a charter school 22-30.5-301

State Intervention Authority
Connecticut Yes Yes
"The local or regional board of education shall monitor progress made by the school under the improvement plan. If two years after the date of approval of the improvement plan, the SBE finds that the school has not made sufficient progress, the SBE shall develop a plan for such school that requires the board to take one or more of the following actions in order to improve student achievement: (1) Close and reconstitute the school; (2) restructure the school in terms of the grades included or the programs offered, or both; (3) provide for site-based management of the school; and (4) allow students in the attendance area of the school to attend other public schools in the school district. The local or regional board of education may P.A. 99‐288
The improvement steps up until those mentioned in the Public Act are all voluntary and are undertaken at the district level by the local or regional board, the state only steps in as stated in the Statute

State Intervention Authority include in such plan a provision for the transfer of employees in conjunction with any such action.
Connecticut cont.
The local or regional board of education shall submit its plan to the commissioner for approval and, upon such approval, shall implement the plan."
Delaware No authority to step in. DE ADC 103

State Intervention Authority
Florida Yes
Local school boards determine actions to be taken with failing school with recommendations from the state. If local decisions do not move schools out of "failing" in two years, the state can withhold funds if the local boards don't take state suggestions. SS 1008.33 Withhold funds
Georgia Yes Yes
If a school is judged as low- performing for two consecutive years, the SBE may appoint a school master or management team to oversee and direct the duties of the principal until performance improves. After three years they can implement more interventions. 20-14-41
Issue public notice to local school board, order a hearing, order an improvement plan, appoint an improvement team to conduct a comprehensive on-site evaluation, recommend changes in school operations, appoint a school master or management team to oversee the principal, remove school personnel on recommendation of the master, call for implementation of a charter school, mandate the complete reconstitution of a school, institute an intensive student

State Intervention Authority
achievement improvement plan, public school choice, set maximum class sizes, expenditure control.
Hawaii
In Hawaii the state is the LEA because there is only one district. The DOE has developed a Framework for School Improvement, which outlines requirements, sanctions, support services, reports and assessments.
CSPR 1.4.4.2
Restructuring schools may select conversion to a charter school or state takeover. The state does a comprehensive assessment by Complex Area Teams. Based on the assessment schools can access the following support from the state: Critical Ally Team, assessment and prioritization of areas needing improvement, comprehensive needs assessment, assistance implementing corrective action, professional development,

State Intervention Authority
consultative or on-site services, school leadership development, standards-based education development, assessment system, learning environment, family and community support- in Hawaii, school restructuring means state takeover
Idaho
State support is voluntary. The state does provide support for districts/schools not meeting the reading targets set by the state. 33.1616
The SDE provides an intervention program that consists of at least a site visit and recommendations to the district for improvement on the State reading goals
Illinois Yes Yes Yes
The SBE can direct the state superintendent of education to appoint an independent authority to operate a low-performing school. The SBE can also authorize the state superintendent to direct the reassignment of 5/2-3.25
Loss of state funds, remove school board members, appoint an independent authority to run the school or district, change the status of the school/district to non-recognized, reassign pupils

State Intervention Authority pupils and administrative staff.
Indiana
After the third year in the lowest category, the SBE establishes an expert team in the school that includes representatives from the community surrounding the school to assist in revising the school plan and recommend changes. After the fifth year, the SBE has the authority to take the actions listed to the right.
IC 20-31-9-3,4
After three years, establish an expert team that includes community representatives and possibly superintendents, governing bodies, teachers, special consultants, etc., to revise school plan. After five years, hold a public hearing for testimony on the following options: merge school with nearby school, assign special management team to operate school, implement department recommendations for improvements, change school procedures, professional development, intervention for teachers or administrators.
Iowa Yes No authority to step in.
Kansas Yes Nothing found in admin. code.

State Intervention Authority
Kentucky Yes No authority to step in. 703KAR5:20
Louisiana Yes
Failing school can be transferred to the statewide Recovery School District. The school shall be operated by the Recovery School District in the manner it determines most likely to bring the school to an acceptable level of performance including closing the school or contracting with an outside entity to run the school. 17:10.5
School is operated by the Recovery School District in the manner it deems necessary, revoke all school approval, school choice, reopen the school as a charter school or a school with a outside contract.
Maine
The commissioner of schools can provide assistance to districts.
SS20-A 6210
Maryland Yes Yes Yes
Code talks about prescribed actions that local districts must take upon failing to meet AYP in successive years, but doesn't talk about actions for the state to take.
SS 13A.01.04.07
State can takeover and reconstitute schools

State Intervention Authority
Massachusetts Yes Yes
If a school is deemed underperforming for 24 months after instituting an improvement plan the SBE may step in and take action. 69-1J
Remove the principal of the school for the following school year, the new principal can remove any teacher or employee in the school without regard to procedure or contract, the commissioner can make available funds to increase the salary of teachers or principal in the school, any other actions determined by the SBE to be "reasonable calculated to increase the number of students attending the school who satisfy the student performance standards.”
Michigan Yes Yes
Schools that fail to meet standards for three consecutive years have four options to choose from, listed at the right. 380.128
The superintendent of public instruction appoints a new administrator of the school at the district's expense, parents can choose to send their child to a different school, the SPI will approve a research-based

State Intervention Authority
school improvement model and/or an affiliation with a college or university, the school is closed.
Minnesota
No authority to step in. The commissioner is a resource districts can use for improvement. SS 120B.35
Mississippi Yes
If school districts fail to meet accreditation standards, the SBE establishes a mandatory program of development for the district. If the school does not comply, or conditions do not improve the Commission on School Accreditation requests that the governor declare a state of emergency in the district, which allows the state to step in and take further measures with the district. 37-17-6
Override decisions of the local board or superintendent, Assign an interim conservator to oversee the finances of the district, supervise day to day activities of district staff, attend meetings, and approve or disapprove extra-curricular activities, give students transfers to other schools, reduce supplements paid to staff for financial reasons, itemize the accounting of the district, put a notice in the newspaper, take over the district completely until the state of

State Intervention Authority
emergency is over.
Missouri Yes Yes
Local district boards have the authority to intervene in academically deficient schools. The SBE has the authority to request a school improvement plan.
160.54 and 160.720
Montana
Schools can lose accreditation status if they fail to implement improvement plans. 10.55.605
Nebraska No policy.
Nevada Yes
The state DOE can restructure the governance or oversee the operation of Title I schools that are restructuring under NCLB. 385.376
Replace employees who contributed to the failure of the school, enter into a contract with a private management company with a record of effectiveness to operate the public school, oversee operation of the

State Intervention Authority
school, restructure the governance of the school.
New Hampshire
No authority to step in. 193H:4
New Jersey Yes
"The commissioner may seek partial or full state intervention in a public school district".
NJAC 6A:30-6.2
Appoint a district superintendent, appoint one or more highly skilled professionals to provide direct oversight, appoint up to three additional district board members.
New Mexico Yes
The public education department can manage or operate "corrective action" schools. The State Secretary of Education can terminate or discharge district employees. The PED is authorized to manage or make governance changes.
6.19.2.11and 22-2C-7(j)
Suspend the authority of a local school board, the DOE will adopt rules to provide services to low income students such as tutoring, replace staff, implement a new curriculum, decrease management authority, extend the school day or year, change the school's internal organizational structure, open the school as a charter school, make other governance changes.

State Intervention Authority
New York Yes Yes
After five years of failing to meet AYP districts must create a plan to restructure the school. The state approves (or does not approve) the plan.
8NYCRR 100.2
North Carolina Yes Yes Yes
The State Board can assign an assistance team to an underperforming school. If a school fails to improve the SBE can intervene in various ways listed at the right.
115C-105.38 and 115C-105.39
Recommend that the local board retain, remediate, or remove the current principal; dismiss teachers, assistant principals, directors, and supervisors, appoint an interim superintendent, suspend the duties of the local board.
North Dakota
Local interventions, not state interventions.
Local Interventions: Year five - replace key staff, new curriculum, new management, extend the year/day, restructure and increase state oversight Year seven - defer administrative funds to improvement, offer signing bonus, offer school choice across district boundaries, contract with

State Intervention Authority
outside expert, other forms of major restructuring.
Ohio Yes
Districts can turn a school over to the DOE if that school is restructuring. 3302.04
Conduct a site evaluation of the school/district, withhold a portion of Title I funds, direct the district to replace key personnel, institute a new curriculum, establish alternative forms of governance, appoint a trustee to manage the district, appoint an intervention team.
Oklahoma Yes Yes Yes
The SBE can intervene in low performing schools via several routes listed at the right. 1210.54
Special funding, reassignment of district personnel, transfer of students, operation of the school by personnel employed by the State Department of Education, mandatory annexation, placing operation of the school with an institution of higher education as a developmental

State Intervention Authority
research school.
Oregon
DOE can provide ongoing technical assistance at the request of the district.
9-30-329.085
Pennsylvania Yes
Certain districts with high numbers of low-performing schools can take certain actions when designated "education empowerment districts.” 17-1701-B
Establish a charter school, designate a school as independent, employ professional staff, contract with for-profit or nonprofit organizations, reconstitute a school, reassign, suspend or dismiss a professional employee, supervise and direct principals, teachers and admin, rescind the contract of the superintendent, reallocate resources, amend school procedures.

State Intervention Authority
Rhode Island Yes Yes Yes
The SDE, in collaboration with the school district and the municipality can exert progressive levels of control over a low performing school's budget, program and/or personnel. 16-7.1-5
Levels of control over school budget, program, personnel, restructure the school governance, make decisions regarding the continued operation of the school, technical assistance in improvement planning, curriculum alignment, student assessment, instruction, and family and community involvement, policy support, resource oversight, help create supportive partnerships with education institutions, business, governmental, or nonprofit agencies, provide additional state resources
South Carolina Yes Yes Yes
The State Superintendent, after consulting an external review committee and with the approval of the SBE, can declare a state of emergency in a low performing school and replace the principal or 59-18-1520
Furnish continuing advice and technical assistance in implementing the recommendation of the SBE, replace the principal, assume management of the school

State Intervention Authority otherwise assume management of the schools.
South Dakota
Local District manages the improvement process, not the state. 24.42.04.11
Tennessee Yes
The state Commissioner of Education can assume any or all powers of governance for a school that has been on probation for low performance for two consecutive years and has not made any progress to meet the standards. 49-1-602
Study the school, approve allocation of state grants, provide technical assistance, approve the allocation of financial resources, appoint a local community review committee, replace or reassign staff, mandate a new research based curriculum, decrease school management authority, appoint instructional consultants, reorganize internal management structure, contract with an institution of higher education for school operation, remove the school from the school
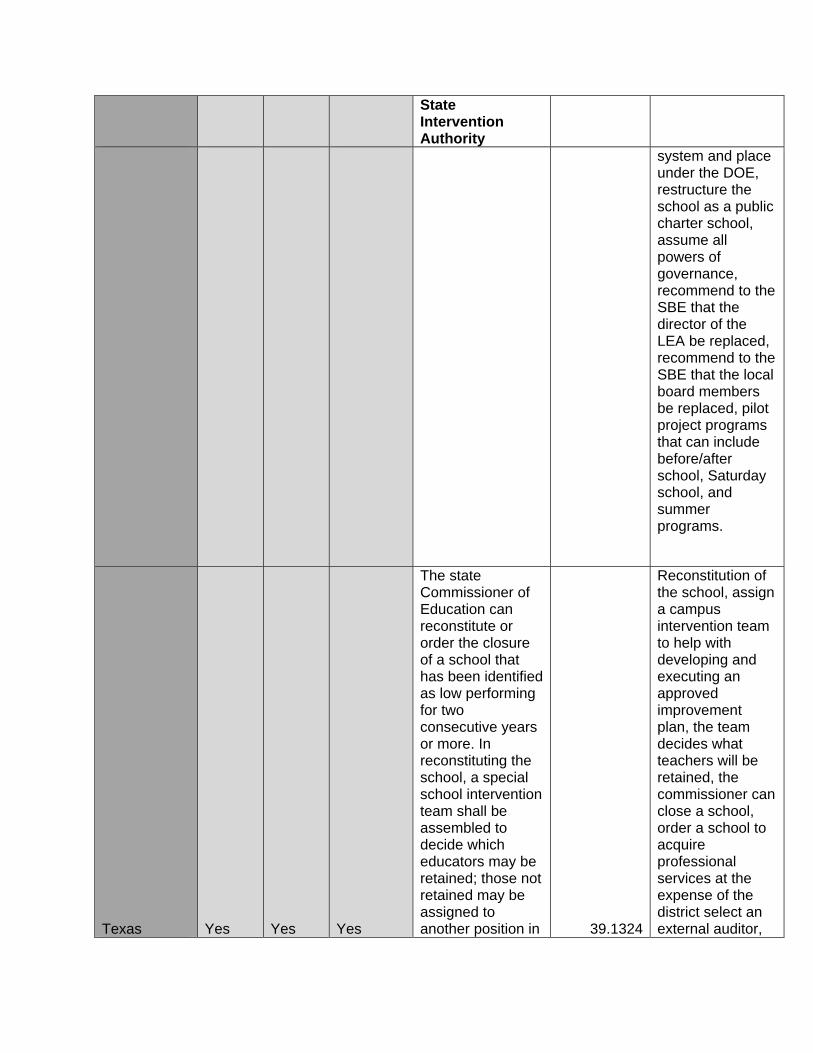
State Intervention Authority
system and place under the DOE, restructure the school as a public charter school, assume all powers of governance, recommend to the SBE that the director of the LEA be replaced, recommend to the SBE that the local board members be replaced, pilot project programs that can include before/after school, Saturday school, and summer programs.
Texas Yes Yes Yes
The state Commissioner of Education can reconstitute or order the closure of a school that has been identified as low performing for two consecutive years or more. In reconstituting the school, a special school intervention team shall be assembled to decide which educators may be retained; those not retained may be assigned to another position in 39.1324
Reconstitution of the school, assign a campus intervention team to help with developing and executing an approved improvement plan, the team decides what teachers will be retained, the commissioner can close a school, order a school to acquire professional services at the expense of the district select an external auditor,
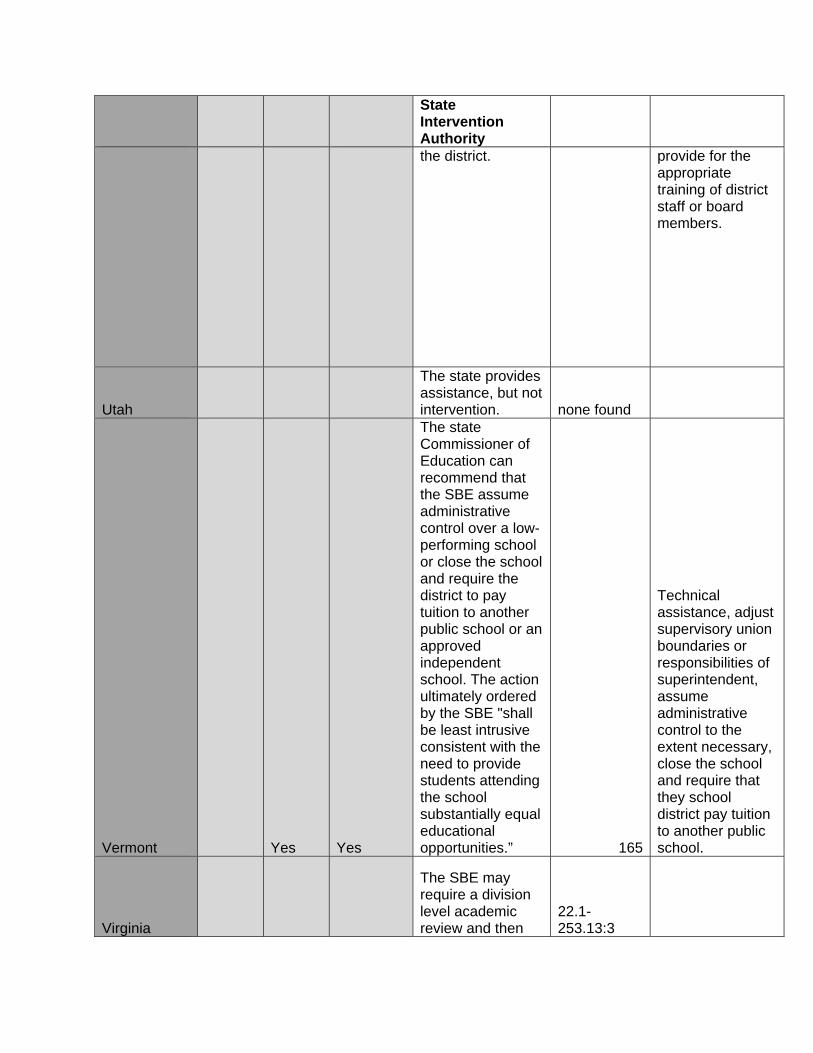
State Intervention Authority the district. provide for the
appropriate training of district staff or board members.
Utah
The state provides assistance, but not intervention. none found
Vermont Yes Yes
The state Commissioner of Education can recommend that the SBE assume administrative control over a low-performing school or close the school and require the district to pay tuition to another public school or an approved independent school. The action ultimately ordered by the SBE "shall be least intrusive consistent with the need to provide students attending the school substantially equal educational opportunities.” 165
Technical assistance, adjust supervisory union boundaries or responsibilities of superintendent, assume administrative control to the extent necessary, close the school and require that they school district pay tuition to another public school.
Virginia
The SBE may require a division level academic review and then
22.1-253.13:3

State Intervention Authority approve or disapprove a corrective action plan.
Washington
Identify schools and school districts in which state intervention measures will be needed and a range of appropriate intervention strategies. After the legislature has authorized a set of intervention strategies, at the request of the SBE, the superintendent shall intervene in the school or school district and take corrective actions. This chapter does not provide additional authority for the board or the superintendent of public instruction to intervene in a school or school district.
(RCW 28A.305.130 (4) (e))

State Intervention Authority
West Virginia Yes
The SBE can intervene in the operation of a low-performing school. Interventions may include, but are not limited to, establishing instructional programs, taking such direct action "as may be necessary to correct the low performance", and declaring that they position of principal is vacant and assigning a new principal "who shall serve at the will and pleasure of and, under the sole supervision of the state board". 18-2E-5
Technical assistance, professional development, money, additional staffing and resources, appoint a team of improvement consultants, appoint a monitor, paid at the county’s expense to cause improvements, establish instructional programs, replace the principal, allow students to transfer schools, replace the board.
Wisconsin
No state intervention authority. none found
Schools/districts follow NCLB guidelines.
Wyoming
The SBE and SPI set goals and oversee progress of schools, but do not directly step in. 21-2-304

APPENDIX
This appendix provides more detailed information about the proposed accountability system. It includes how the indicators and outcomes were selected, how the ratings and index number is calculated, the initial list of qualitative and quantitative factors that could be examined to identify Priority schools, and other issues related to the proposed system. SELECTION OF INDICATORS AND OUTCOMES One of the guiding principles for the accountability system is the use of multiple measures. The Technical Issues and Awards advisory group decided to use four indicators and five outcomes, resulting in a 4x5 matrix with 20 outcomes. The group discussed other indicators and outcomes besides the WASL and graduation rates and wanted to include more outcome data in order to have multiple measures. However, the group could not identify any other reliable and accurate data available, statewide that could be used in an appropriate way. The index is achieved by using the simple average of the ratings across the 20 outcomes. The graduation rate is not applicable for elementary and middle schools, but these types of schools have multiple grades with WASL results that generate the ratings. By using averages, schools without data for some indicators are still included in the system and a separate system is not needed for different types of schools. The group preferred a system that uses fixed criteria rather than norm-referenced measures in order to keep the measures simple and to avoid changing goals over time and the use of measures (e.g., standard deviations) that vary by subject. This means that awards would be given when schools meet certain criteria, and there would not be a limit to how many schools can be recognized (unlike the Schools of Distinction, which only recognized the top five percent, based on improvement). With fixed criteria in place, a school and district would know in advance what it needed to do to receive an award, regardless of how others perform. The advisory group discussed other types of analyses that could provide more accurate results (e.g., structural equation modeling, hierarchical linear modeling, and value-added growth models). However, these methods were not selected because they lack transparency, are overly complex, and are not calculated easily at the school and district levels, due to capacity and software limitations. The advisory groups were unanimous in their belief that the federal AYP system is not a valid way to identify schools for awards and additional support. The groups felt the current system is too complex, has too many adjustments, and is neither transparent nor fair in its accountability determinations. Moreover, AYP is almost entirely punitive in nature and does not include two subjects (writing and science) that are assessed in a standardized manner statewide, which has resulted in a narrowing of the curriculum. AYP’s narrow emphasis on students who meet standard has often resulted in more focused help being given to students that perform near that cut point (known as the “bubble kids”) and at the expense of students who are farther above and below that level of performance. The proposed system is preferred because it is more inclusive and less complex than the federal AYP system. The ratings are based on the results for all students, including those who are not “continuously enrolled” since October 1. No margin of error is used, and the minimum N is ten across the entire school/district (rather than a grade) in order to increase the chance that

very small schools and districts (e.g., those with less than ten students in a grade) are included in the accountability system. For example, a K-6 school that has only four students in each tested grade (grades 3-6) would have a total of 16 students with assessment results and would therefore be included in the system. (Grade-level results are not reported when there are fewer than ten students in a grade in order to keep the results confidential). Grade configurations are not an issue when calculating the results because the same benchmarks are used for each grade and subject (AYP uses grade bands of 3-5, 6-8, and 10 with separate results generated for each grade band, regardless of the school’s grade configuration). The current AYP system for holding districts accountable is even more complex than the school accountability system. It has different rules and sometimes produces results that are confusing and at odds with its school-level results (e.g., a district might not make AYP but all its schools do and vice versa). A district’s size is the major determinant in its AYP results—only two districts with fewer than 1,000 students are in improvement status. The proposed district accountability system is essentially the same as the system for schools, which makes it relatively easier to understand and compute. USING THE INDEX The results from the 20 ratings create an index number for each school and district based on the average rating. Schools and districts are assigned to a “tier” based on their index number. • Those with the highest index numbers, from 3.00 to 4.00, are in the “exemplary” tier. • Those with an index of 2.00 to 2.99 are in the “good” tier. • Those with an index of 1.00 to 1.99 are in the “average” tier. • Those with an index below 1.00 are in the “below average” tier.
Schools should not be compared and judgments should not be made about school quality based solely on their overall index score. Even though the index uses multiple measures, some schools have missing data that can affect their index number. Moreover, schools that administer assessments with lower scores overall (e.g., science and math) will tend to have a lower index score than those that do not. For example, schools serving grades 5, 8, and 10 give the science WASL, and these results tend to be very low compared to the other subjects. So a K-4 school will likely have a higher index score than a K-5 or K-8 school. As a result, the index is only comparable across schools that serve the same grades. In addition, the index does not reflect how close a school may be to the benchmarks—small differences in results could still generate different ratings (e.g., 85%=3 and 86%=4). The lack of vertical alignment of the assessments presents another complicating factor when making comparisons across schools that serve different grade levels. The accountability system will need to remain flexible. Changes in NCLB, graduation requirements, the assessment system (e.g., moving to end-of-course exams in math, adjustments to cut scores), and standards (e.g., science) may have an impact on some measures, which may require adjustments to the accountability system. Moreover, as data systems improve statewide and more information becomes available, other indicators can be added to the system24 and other more sophisticated analyses could be used (e.g., growth models).
24 Most of the other outcomes relate to high schools and the transition to higher education. Some data require transcript information, such as AP enrollment, dual enrollment, and college-ready rates. Other data sources could provide information about college entrance exams, college going rates, and remediation rates in higher education institutions.

ACHIEVEMENT INDICATOR This indicator looks at five outcomes: the four subjects tested by the WASL/WAAS statewide (reading, writing, math, and science) and the extended graduation rate (see explanation on how the rate is calculated below). The measure used is the percentage of “all” students meeting standard. Unlike the AYP measure, this indicator is what is shown on OSPI’s Report Card and does not reflect any adjustments (i.e., margin of error, continuous enrollment). The percent meeting standard includes both the results of the WASL and the WAAS, which is given to students with disabilities. For grade 10, only the first grade 10 attempt, as reported in June of the tested year is used (this includes results for students who met standard in grade 9). Results from August assessments and retakes will be considered when looking at the “below average” schools and districts to determine if they should be included in the Priority tier. This will recognize the districts that go to extra effort to help students who are in danger of not graduating unless they pass the required assessments. Subgroups results (for the various race/ethnicity groups, low-income, ELL, students with disabilities, gender) are used when examining the “below average” schools and districts to determine if they should be included in the Priority tier. Results for students of color are used in aggregate in a separate indicator described below. Students from all tested grades in a school are combined for each subject, and the percentage of these students that meet standard on their respective tests is the school’s percent meeting standard for that subject. This means the index can be calculated easily, regardless of a school’s grade configuration (although grade configurations influence the results due to differences in the tests given). The same scoring benchmarks are used for all subjects. This gives equal importance to each subject.25 It also encourages the vertical alignment of the state assessments. A school/district must have at least ten students for it to be included in the accountability system. The minimum number used by OSPI is ten, but this policy is applied at the test and grade level. Using an N of ten for a school means that very small schools will now be included in the accountability system because they will likely have at least 10 students assessed across the entire school. Combining all the test results together and using an N at the school level increases the overall N, so a single student in a small school has less impact on the results and causes less of a change in the results from year to year. By using this system, scores that are currently suppressed at the grade level when there are less than ten students assessed will become known in their aggregate form. This N policy means the state accountability system is more inclusive than the current AYP system, where the N is either 30 or 40 and applies only students who are continuously enrolled. The groups felt that the education system has a moral responsibility to serve all students, and having a small minimum N and counting students who
25 The advisory group did not have consensus about how to include science results in the index. Some felt that science should not be included at all because of changing standards and that it is not being taken seriously in many cases, which results in low scores across the state and relatively little improvement over time. As a result, it has little ability to differentiate school performance. Some suggested using lower cut points and raising them over time or including science but giving it less weight. After much discussion, a majority of the group concluded that since science will be a graduation requirement relatively soon, the only way to have science taken seriously was to treat it like the other subjects. Keeping the same rating system as the other subjects also keeps the system consistent and less complex and provides the opportunity to receive high ratings for improvement. Moreover, science achievement affects only two of the 20 cells of the matrix. Finally, not including science with equal weight penalizes those who work hard in this subject and sends the wrong message about the importance of students learning science concepts.

have not been in class all year helps hold schools accountable for meeting the needs of all their students. ACHIEVEMENT VS. PEERS INDICATOR This indicator uses the Learning Index (described below) level and controls for student characteristics beyond a school’s control. Scores are the difference between the school’s adjusted level and the average level among the school’s peers. Specifically, the school/district score is the un-standardized residuals generated by a multiple regression. Those with scores above zero are performing better than those with the same student characteristics, and those with scores below zero are performing below those with the same student characteristics. The results are those for a single year, rather than averages over multiple years for simplicity and to avoid the distortions when change takes place over time (e.g., when averaging, schools that have dramatic declines have better outcomes and schools with dramatic increases have worse outcomes).26 Four student characteristics are the independent variables in the multiple regressions: the percentage of (1) low-income students (percent eligible for free or reduced-price lunch27), (2) English language learners, (3) students with disabilities, and (4) mobile students (not continuously enrolled). A school’s Learning Index from each of the four assessments as well as the graduation rate for high schools and districts are the dependent variables. The regressions are weighted by headcount (number of students assessed) to prevent a small “outlier” school from distorting the regression (predicted) line. Although there is a high correlation between all the independent variables except special education, the regressions showed that all four variables helped improve the quality of the predicted levels, regardless of the regression method used. The mobility measure may need to be refined after further discussion takes place. Currently, there is no common definition of mobility, and migrant student data does not include many students who are mobile. OSPI’s student data system includes information about students who are/are not continuously enrolled from October 1 through the testing period, as part of the AYP system. The proposed measure may not identify students who move in and out of a school or district multiple times during the school year and are considered continuously enrolled. This “churn” has a detrimental effect on the learning environment. The proposed measure, the percentage of non-continuously enrolled students, can be used until a better measure is identified. (Data for these students in 2007 were obtained from OSPI using the ‘All’ student group.) The advisory group discussed other possible independent variables that could be included in the analysis. These include the percentage of students who are enrolled in a gifted program, the percentage of minority students, school size (enrollment), and the amount of local funding available. • A gifted variable was not included because of a lack of reliable data, although the
system should somehow take into account when a school has concentrations of these students.
26 Due to data limitations, analyses have not yet been conducted to see how the index changes over time among very small schools. A single student at these schools could cause large changes in the results from year to year. 27 The percentage of students in high schools who are eligible is often higher that what is reported, but this proxy for socioeconomic status is still the best available.

• A race/ethnicity variable was not included because it is highly correlated with the other variables; the statistical analyses found it added very little to the explanatory power of the model, and using it would reduce our ability to identify schools where students of color are treated differently. Instead, the performance of students of color is included as a separate indicator.
• A school size variable was not included because research findings, to date, reveal mixed results about how school enrollment levels affect student outcomes. School size is also a factor that can be controlled somewhat at the district level through the use of specialized programs and boundary lines. Other methods can be used to help schools compare themselves to those with similar sizes once the accountability results are made known.
• Funding levels can only be included at the district level because school-level financial data are not available. For district accountability, we recommend using an additional independent variable in the regression to control for the level of funding available by the community. Given the current method for distributing state funds, the recommended financial variable is the total amount of operating revenue per weighted pupil, with higher need students “inflating” the enrollment figure because they require more resources to educate. The extra weights used are .20 for ELL and low-income students and .93 for students with disabilities.
IMPROVEMENT INDICATOR The Improvement indicator relies on changes in the Learning Index for the four assessed subjects and the graduation rate from one year to the next. Specifically: • Improvement on assessments are scored on a scale of 0 to 4 based on the following levels
of change in the Learning Index: > .12 ................. 4 .051 to .12 ........ 3 -.05 to .05 ......... 2 -.051 to -.12 ....... 1 < -.12 ................ 0
• Improvement on graduation rates are scored on a scale of 0 to 4 based on the following
levels of percentage point change in the extended graduation rate from the previous year (see below for more information on how the graduation rate is calculated):
> 6 .................... 4 3.01 to 6.00 ...... 3 -3.00 to 3.00 ..... 2 -6.00 to -3.01 .... 1 < -6 ................... 0

The Learning Index was developed by the Commission on Student Learning and refined by the A+ Commission.28 The index takes into consideration the percent of students performing at the different WASL levels. Specifically, the WASL tests have five levels of performance:
Level 0 – No score given29 Level 1 – Well below standard Level 2 – Partially meets standard Level 3 – Meets standard Level 4 – Exceeds standard
The Learning Index, calculated like a grade point average with 4.0 as the highest score, reflects the level of student performance across the entire range of proficiency, not just those meeting standard. It gives greater weight to higher levels of proficiency on the state assessments and provides an incentive to support the learning of all students, including those well below standard (Level 1) and those that already meet the standard (Level 3) so they can move up to the next level. There is a “ceiling effect” when using this measure, but preliminary results show that even high-performing schools were achieving large gains because of the movement of students from Level 3 to Level 4. Once a school has all of its students in Level 4, there would not be any possibility to improvement any more, but the all ratings together would still result in a school being in highest tier. Improvement is based on the change (gain or loss) in the Learning Index from a prior year. We recommend using the one-year change rather than using averages of previous years or a change from a year further in the past because it is the simplest calculation, it reflects the most recent set of results, and it does not distort the most recent results (using a two-year average helps a school if scores go down and penalizes the school if scores go up). New schools would only need two years of data to generate an improvement score. The following example shows how the Learning Index is calculated. The same method is used to calculate the index for all WASL tests (reading, mathematics, writing, science) in all the tested grades:
Level 0: 5% of all students assessed Level 1: 15% of all students assessed Level 2: 20% of all students assessed Level 3: 40% of all students assessed Level 4: 20% of all students assessed
Learning Index = (0*0.05) + (1*0.15) + (2*0.20) + (3*0.40) + (4*0.20) = 0 + .15 + .40 + 1.20 + .80 = 2.55 The group discussed other possible improvement measures, including a 10% reduction in those not meeting standard (the AYP “safe harbor” measure), a 25% reduction in those not meeting standard over a three-year period (the goal used for grade 4 reading several years ago), a percentage point gain from the previous year (or over several years), and a change in the scale score. While each of these have merit, the group decided that a change in the Learning Index provided the best measure of improvement because it focused on more than just those meeting standard and uses available data. The other measures can be used when analyzing “below average” schools for possible designation as a Priority school.
28 These Commissions are no longer in existence. 29 The “No Score” designation includes unexcused absences, refusals to take the test, no test booklets but enrolled, incomplete tests, invalidations, and out-of-grade level tests.

ACHIEVEMENT OF STUDENTS OF COLOR INDICATOR Wide disparities exist in the level of academic achievement between white students and students of color (except some Asian groups). This indicator is included because it will keep a focus on this achievement gap. The indicator uses the same five outcomes as the Achievement indicator: the four subjects tested by the WASL/WAAS statewide (reading, writing, math, and science) and the extended graduation rate. However, the measure used is the aggregate percentage of students who are American Indian, Asian/Pacific Islander, Black, Hispanic, and multi-racial who meet standard on the assessments and who graduate by the age of 21. The results will not be different from the Achievement indicator if there are few or no white students at a school. On the other hand, a school may not have any results in this indicator if there are less than ten students of color in all the tested grades. The same rating scales are used as the achievement indicator. For simplicity, data for the individual groups are not used separately. The enrollment and outcome data are available for review on OSPI’s Report Card for those who want to know how the aggregate percentage is determined. GRADUATION RATE MEASURE The Washington State definition of the on-time graduation rate is the percentage of students who graduate from public high school with a regular diploma (not including a GED or any other diploma not fully aligned with the state’s academic content standards) in the standard number of years. The period of time required for students with disabilities to graduate is specified in each individualized education program (IEP). Students with disabilities, who earn a diploma by completing the requirements of an IEP in the required period of time, are counted as on-time graduates. The period of time required for LEP and migrant students to graduate is determined on an individual basis when they enter the district and may be longer than the standard number of years. The period of time required to graduate for a migrant student who is not LEP and does not have an IEP can be one year beyond the standard number of years. LEP and migrant students who earn a diploma in the required period of time are counted as on-time graduates. The on-time graduation rate is calculated as follows:30 On-Time Graduation Rate = 100*(1-grade 9 dropout rate)*(1-grade 10 dropout rate)* (1 -grade 11 dropout rate)*(1-grade 12 dropout rate-grade 12 continuing rate) with Dropout Rate = number of students with a dropout, unknown, GED completer code
total number of students served (less transfers out and juvenile detention) To encourage schools to serve students who remain in school beyond four years, a separate graduation rate is calculated that includes students who graduate in more than four years. This “extended rate” is being used for AYP purposes and the rate used in the accountability index. The formula for calculating this rate is as follows:
30 See http://www.k12.wa.us/DataAdmin/pubdocs/GradDropout/03-04/Graduationanddropoutstatistics2003-04Final.pdf, chapter 1, for more information about these formulas.

Extended Graduation Rate = number of on-time and late graduates
# of on-time graduates/on-time graduation rate All rates are rounded to the nearest whole number using normal rounding rules. Dropouts are not being counted as transfers. Since graduation data is not reported until after the beginning of the school year, the rates from the previous year are used. IDENTIFYING PRIORITY SCHOOLS (LOWEST TIER) The Priority Schools advisory group generated an initial list of quantitative and qualitative data that could be used to determine which schools in the “below average” tier should be identified as needing more significant support from the state over a longer period of time. These are the schools with the greatest need based on consistent underperformance on multiple measures (grades, subjects, indicators) over multiple years. The advisory group assumed that being in this tier would generate the opportunity for substantially more support and not have consequences immediately. However, the group was not clear about the level of support that schools in the various tiers would receive. The following factors were identified by the group. However, given the comprehensive nature of this list and the limited capacity to analyze all of these types of data, for every school and district in the “below average” tier, the list will be re-examined by the group to determine which are the most important factors to analyze. Contextual Data • Type of school (alternative school, institution) • Changes in student demographic profile (e.g., rapid increase in low-income or ELL students) • What programs are included in the school (e.g., concentrations of ELL, special education,
gifted) • Program changes (e.g., establishing new ELL or special education programs) • Student mobility • Number of languages spoken by students • Feeder schools • Boundary changes (closures, consolidations) • Construction or renovation projects Analysis of WASL/WAAS Results (annual and trends over time) • Achievement trends over multiple years for each subject area • Size of the gap between WASL scores in different subjects • Size of the achievement gap • Percent students meeting three of three and four of four standards • Trends for subgroups (gender, race/ethnicity, low-income) and programs (ELL, special
education) • Level of growth over time • Changes in scale scores • How performance compares to similar schools • Results of students who have been in the school for longer periods of time (track cohorts of
students to see how percent meeting standard changes over time, review results for just “continuously enrolled” students, the percentage of students meeting standard the next year in

the next grade compared to the previous year, e.g., the percent in grade 4 in one year compared to the percent in grade 5 the next year)
• Results from retakes (high school) and collection of evidence AYP Results • Results generated with minimum Ns, confidence intervals, and continuously enrolled students
(helps prevent false positives) • How far the “all” group is from the annual goal • Proficiency, participation, and other indicator results for all subgroups • Number and percentage of cells not making AYP • Which subgroups and subjects did not make AYP (ELL, special education, and participation
rates countless, all and race/ethnic groups count more) Other Quantitative Data (some may only be available at the district or school levels) • Graduation data: On-time and extended graduation rates for all students and subgroups,
difference in rates, percentage of students still enrolled after four years • Dropout data: Annual and cohort dropout rates for all students and subgroups, difference in
rates • Discipline data: Number of suspensions and expulsions, source of referrals, types of
infractions, types of students being disciplined the most • Perception results: Surveys of staff, parents, and students about school conditions and how
the results differ from one another • Classroom conditions: Class sizes, student/teacher ratios by grade and subject • Staff characteristics: Percentage of staff with certificates, teacher education/experience levels • Staff turnover: Teacher and leadership changes at school and district levels • District assessments: Results from any other assessments (e.g., MAP, grade 2 reading,
portfolios) • WLPT results: Performance of students from different language backgrounds, percentage of
students exiting ELL programs • Volunteers: Number of parent volunteers, how they are used • Retention: Number and percentage of students retained in grade, number and type of subjects
not passed, level of credit deficiency • Finances: Amount generated by local levies/bonds, fund balances, amount and sources of
outside funding, stability in funding over time • District characteristics: Number and percentage of schools in Tier 3, percentage of district
students enrolled in Tier 3 schools • Data anomalies: Incorrect data reported that could affect analyses, missing data, reason for
missing data, number of ratings generating the average index Qualitative Data • District role: Resource amounts and types allocated to school, type of staff and programs
provided, funding levels, type and intensity of interventions made to date, appropriateness of district policies, data analysis capacity, role of the district in school improvement efforts
• Initiatives: Number being attempted, focus and validity of initiatives, level of integration/cohesion among activities
• Data use: Quality of data system, capacity to use data, how information is used • Self-assessments: Quality and use/implementation of school improvement plans • Staff relations: Level of collaboration among staff and administrators within the school, union
relations • Results from external reviews: Results from accreditation and CPR, input from ESDs

ADVISORY GROUP MEMBERS Pete Bylsma and two advisory groups are working to prepare the proposed index for Board review. The Technical Issues and Awards advisory group is working on the details of the “tiered” accountability system. This group reviewed the work that was done to date, discussed numerous technical issues related to the proposed index, and will be discussing a set of specific criteria for making awards at its next meeting. Members of this group are:
Ms. JoLynn Berge, OSPI (Federal Policy and Grant Administrator) Dr. Phil Dommes, North Thurston SD (Assessment Director) Dr. Linda Elman, Tukwila SD (Assessment/Research Director) Dr. Peter Hendrickson, Everett SD (Assessment Director) Mr. Doug Goodlett, Vancouver SD (Special Services Director) Dr. Feng-Yi Hung, Clover Park SD (Assessment/Evaluation Director) Dr. Nancy Katims, Edmonds SD (Assessment Director) Dr. Bill Keim, ESD 113 (Superintendent) Mr. Bob Silverman, Puyallup SD (Executive Director for Assessment)
The Priority Schools advisory group identified quantitative and qualitative data that can be used to examine schools in the “below average” tier, to determine if they should be a Priority school needing much greater state assistance. Members of this group are:
Ms. Maggie Bates, Hockinson SD (Assistant Superintendent) Ms. JoLynn Berge, OSPI (Federal Policy and Grant Administrator) Mr. Doug Goodlett, Vancouver SD (Special Services Director) Dr. Bill Keim, ESD 113 (Superintendent) Ms. Linda Munson, South Kitsap SD (Special Programs Director) Dr. Michael Power, Tacoma SD (Assistant Superintendent) Mr. Bob Silverman, Puyallup SD (Executive Director for Assessment) Ms. Nancy Skerritt, Tahoma SD (Assistant Superintendent) Dr. Lorna Spear, Spokane SD (Executive Director for Teaching and Learning) Dr. Alan Spicciati, Highline SD (Chief Accountability Officer)
Outreach meetings SBE Conducted June-October 2008 Community meetings were held in Spokane, Yakima and Seattle in early June. Board members and staff met individually with the following groups: Association of Washington School Principals City of Seattle Office for Education League of Education Voters The Bill & Melinda Gates Foundation Washington Association of School Directors Washington Education Association Washington State Parent Teacher Association Washington State School Directors Association

MATHEMATICS UPDATE
BACKGROUND: The Board, along with Strategic Teaching, completed its revisions of the K-12 math standards this spring and summer. OSPI has adopted the standards and completed work with its consultant and reviewers on the K-8 math menu curricular review. OSPI will share the review process they used at the Board meeting. In addition they will present recommendations for up to three curricular menus for elementary and middle school from their review. Within two months, the Board is expected to give them comments on their recommendations by statute. The Board has hired Strategic Teaching to assist with the review of these curricular menu recommendations. Strategic Teaching is conducting its own independent review of the top four programs in each elementary and middle school as ranked by OSPI. The Math Panel has met twice this summer on the curricular menu – first with OSPI and then with Strategic Teaching to go over the process that will be used to provide the independent analysis. The Board received all the notes and materials from the August 26 Math Panel meeting. The Math Panel will meet on October 14 to go over Strategic Teaching’s findings with the anticipation of a recommendation to the Board at its November meeting. Attached is a one page description of what Strategic Teaching will be doing in its review. One additional piece that OSPI will share with the Board is its request for information to develop an online curriculum that aligns with the new standards. The legislature asked OSPI to explore this possibility. Bidders will be solicited this fall to provide cost estimates and then OSPI will seek funding for the project during the 2009 session if there is a successful bid. The legislature would like to provide this at no cost to the school districts. It is important for the Board to examine all the many pieces going on in math and to continue to work with its partners on the Joint Math Action Plan. Attached is a timeline of all the different math requirements the legislature has mandated. POLICY CONSIDERATION: None at this point. EXPECTED ACTION: The Board will take action at its November meeting on the Strategic Teaching recommendations on the math curricular menus for K-8 and report back to OSPI.
Chair- Mary Jean Ryan Vice Chair- Warren T. Smith Sr. Dr. Terry Bergeson, Superintendent of Public Instruction Dr. Bernal Baca Amy Bragdon Dr. Steve Dal Porto Steve Floyd Dr. Sheila Fox Phyllis Bunker Frank Austianna Quick
Linda W. Lamb Eric Liu Dr. Kristina Mayer John C. "Jack" Schuster Jeff Vincent Lorilyn Roller Edie Harding, Executive Director
(360) 725-6025 TTY (360) 664-3631 FAX (360) 586-2357 Email: [email protected] www:sbe.wa.gov

2007 (as revised per 2008 session) and 2008 Legislative Assignments and Time Line For Math Standards and Assessments
September 1, 2008
SBE State Board of Education OSPI Office of the Superintendent of Public Instruction PESB Professional Educator Standards Board WSIPP Washington State Institute for Public Policy
Lead Agency
Assignment Due Date
SBE SBE shall review the consultant's draft report of the analysis of the February 2008 version of the revised math standards, consult the mathematics advisory panel, hold a public hearing to receive comment, and direct any subsequent modifications to the consultant's report. After the modifications are made, the State Board of Education shall forward the final report and recommendations to the OSPI for implementation. (SB 6534) Note: SBE approved adoption of K-8 math standards 4/28/08 and high school on 7/30/08
5/15/08
SBE Status report on math and science reviews to legislature. (HB 1906) 6/1/08 OSPI OSPI shall revise the math standards to conform precisely to and incorporate each of the
recommendations of the SBE and submit revisions to the SBE. (SB 6534) 7/1/08
SBE SBE shall approve adoption by SPI of the final revised standards or develop a plan for ensuring recommendations are completed to adopt by 9/25/08. (SB 6534)
7/31/08
OSPI and SBE
Within 30 days of adoption, OSPI and SBE will work together on a Request for Information (RFI) for private vendors or non profits to adapt an existing math curriculum to be aligned with the new standards and make the curriculum available on line at no cost to school districts. (2SHB 2598) Note: Draft RFI has been circulated. OSPI plans to advertise in September, review results in November, and make funding request to 2009 legislature.
8/31/08

Lead Agency
Assignment Due Date
SBE Status report on math and science reviews to legislature. (HB 1906) 9/1/08 OSPI Within six months after standards approval, OSPI shall present to the SBE recommendations for
three basic math curricula each for elementary, middle and high school grade spans. (2SHB 2598)
10/28/08 for K-8 1/31/09 for high school
SBE Within two months after presentation of recommended curricular, provide official comment and recommendations on OSPI proposed math curricular menu. (2SHB 2598)
12/28/08 for K-8 3/31/09 for high school
OSPI OSPI shall conduct a comprehensive survey of math curricula being used by school districts at all grade levels and the textbook and curriculum purchasing cycle of districts. (2SHB2598)
11/15/08
PESB PESB shall conduct a comprehensive analysis of math and science teacher supply and demand issues, which include: 1) current number of math and science teachers assigned to teach math and science with and without the appropriate endorsements, 2) projected demand needed by 2010-11, 3) specific recommendations on how the demand will be met, 4) identification of strategies to improve rigor and productivity of state funded math and science teacher prep programs (ESHB 2687- Supplemental budget)
12/1/08
PESB/WSIPP WSIPP will provide PESB a study on differential pay for teachers in math and science (ESHB 2687- Supplemental budget)
12/1/08
OSPI OSPI will have new WASL for new K-8 math standards for Spring 2010 (pilot items in 2009) No legislative deadline
OSPI OSPI will consult with the SBE to develop end of course (EOC) assessments for Algebra I, Geometry, Integrated I and Integrated II. (ESHB 3166) Note: Due the adoption of the Math High School Standards in July 2008, OSPI plans to ask the Legislature for a deadline extension on Algebra I and Integrated I EOCs to complete the following year (Spring 2011 rather than the current Spring 2010) when the Geometry and Integrated II are due.
2009/10 school year for Algebra I and Integrated I 2010/11 school year for Geometry and Integrated II Class of 2013 shall be required to use EOCs to

Lead Agency
Assignment Due Date
show they met standard Class of 2014 shall be required to use EOCs to earn Certificate of Academic Achievement
SBE Sunset Math panel with its work completed on standards and curriculum reviews. (HB 1906) 6/30/12

AssessmentsOSPI to revise math WASL as appropriate to align with standards and curricula.
2008–2010: OSPI to identify and disseminate formative and diagnostic assessments; pilot of revised Math WASL that aligns with standards and curriculum.
By Spring 2010 (deadline may be revisited) OSPI to develop end of course assessment for Algebra I and Integrated Math I.
By Spring 2011: OSPI to develop end of course assessment for Geometry and Integrated Math II.
For Class of 2014 end of course assessments in math will be used to demonstrate meeting state standards.
Teacher Preparation, Certification & Continuing Education
Improve math teacher recruitment and retention strategies; professional development opportunities; expand “alternative routes” program; revise and adopt endorsement competencies for math teachers; align teacher education math test with new competencies; strengthen teacher preparation programs.
High School Achievement
Clarify and strengthen high school math graduation requirements.
Provide opportunities for Juniors to take college placement test.
Provide opportunities to take classes in rigorous math.
Require student learning plans for students not on track to graduate due to WASL scores, credit deficiencies or absences.
Adopting World-Class Math Standards to Drive Higher Math Achievement in Washington State’s K-12 Schools
Curricula Select math curricula that is appropriate to the revised standards.
OSPI recommends no more than three basic math curricular options each for elementary, middle and high school; SBE will provide feedback. OSPI also examines supplemental materials and proposals for online curriculum at no cost to school districts.
Data Management
Gather meaningful data to strengthen accountability.
Expand core student record system.
Create teacher credential and placement data system.
Revised Washington
Math Standards
n Lead agency is Washington State Board of Education (SBE)
n Lead agency is Office of Superintendent of Public Instruction (OSPI)
n Lead agency is the Professional Educator’s Standards Board (PESB)
December 2008
PESB reports on comprehensive analysis of math and science teacher supply and demand issues, as well as, Washington State Institute for Public Policy’s differential pay study.
Fall 2008
In consultation with SBE, OSPI will develop a request for information from private vendors for online curriculum.
Fall 2008
SBE, its Math Panel and consultant review and comment on recommended top three curricular menus for elementary, middle and high school.
Fall 2008
OSPI reviews math curricula to assess alignment with new standards and makes recommendations to SBE for curricular menus.
July 2008
SBE approves and OSPI adopts final new K-12 math standards. SBE adopts third math credit, beginning with Class of 2013.
Effective Instruction and Intervention
Expand availability of math intervention courses and materials.
Identify effective intervention programs and strategies.
Washington State Board of Educationwww.sbe.wa.gov

STRATEGIC TEACHING UPDATE ON THE INSTRUCTIONAL MATERIALS REVIEW
SEPTEMBER 11, 2008
BACKGROUND
OSPI has been tasked by the legislature to recommend up to three mathematics programs1 to the SBE within six months of the adoption of the new mathematics standards. To that end, OSPI retained Relevant Strategies.
After a great deal of work with advisory groups, Relevant Strategies convened and trained forty-two reviewers during the week of June 22-27, 2008 to evaluate twenty-seven different comprehensive programs for elementary and high school. It also provided a statistical analysis of the curriculum review results that resulted in a rank ordering of all reviewed programs.
The reviewers reconvened during the first week in September to review supplemental materials that align to specific programs.
The SBE has contracted with Strategic Teaching 1) to review the methods used by Relevant Strategies, 2) to examine the highest-ranking programs to be sure there is a clear content match to the standards, and 3) to make sure that those programs are mathematically sound.
Strategic Teaching will judge the process used by OSPI against common practice and by having an educational statistician review the methodology used by OSPI.
To complete the curriculum review validation, each program will be independently reviewed by two reviewers at the grade levels of 2, 4, and 7. After their independent work, reviewers will discuss their results, particular any score points where scorers do not agree. Reviewers do not have to find consensus. Program attributes, such as the amount of content that is present but does not match Washington standards, will also be noted.
The mathematical soundness of a program will be judged by a mathematician, who will review every program to see how a few key ideas
1 2008 Second Substitute House Bill 2598
OLD CAPITOL BUILDING.ROOM 253.P.O. Box 47206.600 S.E. WASHINGTON.OLYMPIA, WA 98504-7206
WASHINGTON STATE BOARD OF EDUCATION

(multiplication, area of a triangle, proportionality, linear equations) are developed, regardless of grade level.
Originally Strategic Teaching intended to examine three elementary programs and three middle-school programs. Relevant Strategies analysis uncovered a statistical tie at the elementary level for the third and fourth ranked programs and another statistical tie at the middle level for the programs in the second, third, and fourth places. To allow OSPI to have as much information as possible before making a decision, Strategic Teaching will review all four programs for both.
One of the Math Panel members, a statistician, applied some different, but quite sound, types of statistical analysis to the results of the curriculum review. He presented a compelling case to the Math Panel that the top six programs in both elementary and middle school should be considered because statistically there is no difference between the programs that ranked #3 and those that ranked #6. At this time, Strategic Teaching is reviewing just the top four.
Work is well underway and about one-third of the curriculum has been reviewed.
Linda Plattner shared draft instruments and methodology with the Math Panel on August 26, 2008 for feedback. All tools are now final and reviewers have been trained. Publishers have been extremely helpful in getting materials to Strategic Teaching reviewers so everyone has what they need to complete the work.
It is expected that the draft report will be deliver on time in early October and discussed at the Math Panel meeting on October 14, 2008. This allows time for revision before the report would go to SBE in time for its November meeting.
The curriculum alignment for high school standards will begin in the late fall. OSPI will make a recommendation to the SBE and the SBE will engage Strategic Teaching and its Math Panel for feedback on the OSPI recommendation.
EXPECTED ACTION:
None

Chair- Mary Jean Ryan Vice Chair- Warren T. Smith Sr. Dr. Terry Bergeson, Superintendent of Public Instruction Dr. Bernal Baca Amy Bragdon Dr. Steve Dal Porto Steve Floyd Dr. Sheila Fox Phyllis Bunker Frank Austianna Quick
Linda W. Lamb Eric Liu Dr. Kristina Mayer John C. "Jack" Schuster Jeff Vincent Lorilyn Roller Edie Harding, Executive Director
(360) 725-6025 TTY (360) 664-3631 FAX (360) 586-2357 Email: [email protected] www:sbe.wa.gov
BOARD’S STRATEGIC PLAN, WORK PLAN AND BIENNIEUL BUDGET REQUEST FOR 2009-11
BACKGROUND: In May 2008 the Board approved a draft Strategic Plan for submission to the Office of Financial Management (OFM) in June. A new goal of improving graduation rates was added. Staff has prepared a work plan (and monthly schedule) for our meetings that incorporate all the work we are doing now and anticipate working on for the next year to meet our goals and legislative requirements. Our ongoing major projects include: the implementation considerations of CORE 24, joint work on the science and math action plans, system performance accountability with a focus on the academic index, Innovation Zone and ultimate management and governance consequences for schools and districts that do not improve. We will also work on legislative and stakeholder strategy for all of these for 2009 and beyond. Under policy consideration, below are some staff ideas about how to address improving graduation rates. In addition, there are four documents for Board consideration that incorporate these ideas: 1) a revised strategic plan, 2) a work plan, 3) a board monthly planner and 4) the draft budget submission document. POLICY CONSIDERATION: To address our new goal of improving graduation rates, staff has drafted a work plan and 2009-11 biennial budget request around the theme of Leadership to Enhance Personalized Education for High School Students or “Stop the Drop(out) Rate.” We would like the Board to review this new package, as well as a supplemental budget request for a science curricular menu review, which staff has submitted in draft form to OFM to meet their September 2 deadline. Below is the justification for both budget requests: FY 09 Supplemental Request: To complete this biennium’s work, the Board requests $150,000 to conduct a review of the science curricular menu that the Office of the Superintendent of Public Instruction will recommend to the Board. While the legislature provided a specific appropriation for the Board to conduct its review of math and science standards and curriculum, there are no funds left for the science curricular
Chair- Mary Jean Ryan Vice Chair- Warren T. Smith Sr. Dr. Terry Bergeson, Superintendent of Public Instruction Dr. Bernal Baca Amy Bragdon Dr. Steve Dal Porto Steve Floyd Dr. Sheila Fox Phyllis Bunker Frank Austianna Quick
Linda W. Lamb Eric Liu Dr. Kristina Mayer John C. "Jack" Schuster Jeff Vincent Lorilyn Roller Edie Harding, Executive Director
(360) 725-6025 TTY (360) 664-3631 FAX (360) 586-2357 Email: [email protected] www:sbe.wa.gov
menu review. The math review of curricular menu materials is $150,000 and we are requesting the same amount for the science curricular menu review. FY 09-11 Budget Enhancement Decision Package: The Board is also requesting an enhancement to its current funding to address its new strategic plan goal to improve graduation rates. To do this work, the Board has proposed a decision package of $820,000 to Personalize Education for High School Students to “Stop the Drop(out) Rate.” The Board is charged by the legislature “to provide leadership in the creation of a system that personalizes education for all students and respects diverse culture, abilities and learning styles and promotes the achievement of the basic education goals,” (RCW 28A.305.130). With the Board’s adoption of the CORE 24 framework, it wants to make sure that the additional requirements do not cause more students to drop out of school. During the upcoming biennium, the Board hopes to focus on “why students drop out and what are we going to do about it?” through its new goal of improving graduation rates. The Board believes that an investigation of strategies to make learning more personal for high school students can make a difference and stop the “falling through the cracks” syndrome. The Board also anticipates receiving information on the achievement gap from the various commissions charged with this review and wants to incorporate issues they identify in its strategies outlined below. The Board proposes creating strategies to improve graduation rates by exploring these issues:
A) Define the reasons students drop out of high school now, by reviewing the current literature and ongoing projects in Washington State as well as to conduct a study on barriers perceived by students and their parents.
B) Determine how to operationalize competencies for high school credits. C) Examine ways to create a model of how alternative education could be
strengthened for students. D) Examine the current status of online learning in Washington, and nationally, to
determine what policies should be put in place to ensure the quality of online learning opportunities.
The Board anticipates hiring consultants to conduct the work and through the findings, develop policies and practices to reduce the dropout rate of high school students and improve graduation rates. We will assume all the rest of the work under our current budget. If this funding for the Personalized Education package is not approved by the legislature, we will need to explore other avenues of funding or delay the work. Staff is working with OSPI on funding for CORE 24, math and science fundamentals, professional development to eliminate the 180 day waivers and accountability. If these costs are completed by our September Board meeting, we will share them with you. EXPECTED ACTION: The Board will approve (with any modifications needed) the draft strategic plan, work plan, and SBE budget request for the supplemental budget and 2009-11 budget request.

IMP
RO
VE STUDENT PREPARA
TIO
N
IMPROVE G
RA
DU
ATI
ON RATES
IMPR
OVE
STUD
EN
T
ACHIEVEMENT
Wo
rld-
Clas
s Math and Science
System Performance Accountability Personalized Educa
tion
Init
iati
ves
Mea
ningful HIgh School Diploma

Strategic Plan 2009-2015
Submitted to the Office of Financial Management June 13, 2008 with revisions for September 24-25 Board meeting
by Mary Jean Ryan, Chair
Edie Harding, Executive Director www.sbe.wa.gov

WASHINGTON STATE BOARD OF EDUCATION STRATEGIC PLAN
TABLE OF CONTENTS
Introduction ___________________________________________________________ 1
Vision for Washington’s K-12 Education System _____________________________ 3
Authority and Mandates _________________________________________________ 3
Environmental Scan ____________________________________________________ 5
Performance Assessment _________________________________________________ 9
Mission, Goals and Indicators ____________________________________________ 10
Strategies ____________________________________________________________ 13
Internal Capacity and Financial Health ____________________________________ 15
Appendix A: Authorizing Statute _________________________________________ 16

WASHINGTON STATE BOARD OF EDUCATION STRATEGIC PLAN – PAGE 1
WASHINGTON STATE BOARD of EDUCATION STRATEGIC PLAN 2009-2015
Introduction The world is a more competitive place than it used to be, and our children must be much better prepared than graduates of 20 years ago. The vast majority of decent-paying jobs now require some kind of training or education after high school. Business leaders report they can’t find qualified employees who can read operating manuals, write coherent memos and compute sales prices. There are significant differences in achievement among student populations, and too many of our students are still struggling with the basics.
In our fast-moving, high-tech, global economy, we need people who have strong skills in mathematics, science and communication. To succeed in life, whether buying a home, reading the newspaper, or applying for and keeping a job, people must be able to think critically and solve problems creatively. In recognition of this imperative, the legislature passed the Basic Education Act, in order to:
…provide students with the opportunity to become responsible and respectful global citizens, to contribute to their economic well-being and that of their families and communities, to explore and understand different perspectives, and to enjoy productive and satisfying lives. Additionally, the state of Washington intends to provide for a public school system that is able to evolve and adapt in order to better focus on strengthening the educational achievement of all students, which includes high expectations for all students and gives all students the opportunity to achieve personal and academic success. To these ends, the goals of each school district, with the involvement of parents and community members, shall be to provide opportunities for every student to develop the knowledge and skills essential to: (1) Read with comprehension, write effectively, and communicate successfully
in a variety of ways and settings and with a variety of audiences; (2) Know and apply the core concepts and principles of mathematics; social,
physical, and life sciences; civics and history, including different cultures and participation in representative government; geography; arts; and health and fitness;

WASHINGTON STATE BOARD OF EDUCATION STRATEGIC PLAN – PAGE 2
(3) Think analytically, logically, and creatively, and to integrate different experiences and knowledge to form reasoned judgments and solve problems; and
(4) Understand the importance of work and finance and how performance,
effort, and decisions directly affect future career and educational opportunities.1
The legislature recognizes that our schools should not only prepare all students to read, write and do mathematics, but also to understand scientific findings, reflect critically on contemporary issues, and appreciate the diversity of cultural and artistic contributions. Our children need these abilities in order to succeed personally and professionally in an increasingly global and competitive economy.
But for decades, we haven’t reached all students – only some of them. We can no longer afford to let any student "fall through the cracks" of our education system. If students leave high school without the skills they need to succeed in life, they will struggle personally and professionally, because their choices will be limited. And they will have difficulty making informed decisions about everything from managing their money to electing local, state and national leaders.
For our children’s sake, we must improve our schools and improve student results.
1 RCW 28A.150.210 Basic education act — Goal

Vision for Washington’s K-12 Education System
The State Board of Education envisions a learner-focused state education system that is accountable for the individual growth of each student, so that students can thrive in a competitive global economy and in life.
The K-12 system that we envision is one which:
• Provides all students with opportunities to learn • Provides multiple pathways for satisfying graduation requirements • Graduates students with the knowledge, skills and abilities needed to
thrive in the workforce, succeed in future studies and serve as responsible citizens
• Is accountable for its results as well as its use of resources • Uses performance data to guide continuous improvement and provides an
early warning system to guide interventions • Puts the education of the students first in developing policy • Provides and supports quality teaching and counseling at all levels • Provides the resources to support learning and teachers • Is nimble and innovative, focused on supporting learning at all grade levels • Shares responsibility and collaboration across the system • Has the capacity – systems, infrastructure, technology – to support learning • Provides seamless connections between preschool, kindergarten,
elementary, middle and high schools and postsecondary education • Makes effective use of compulsory and supplementary learning time • Supports students in making good choices for their lives beyond K-12.
Authority and Mandates RCW 28A.305.130 authorizes the State Board of Education to “provide advocacy and strategic oversight of public education; implement a standards-based accountability system to improve student academic achievement; provide leadership in the creation of a system that personalizes education for each student and respects diverse cultures, abilities, and learning styles; and promotes achievement of the goals of RCW 28A.150.210 .“
The State Board of Education has several specific responsibilities related to the establishment of standards for student achievement and attendance, graduation from high school, and the accountability of schools and districts. These and other administrative responsibilities of the Board are detailed in Appendix A.
WASHINGTON STATE BOARD OF EDUCATION STRATEGIC PLAN – PAGE 3
WASHINGTON STATE BOARD OF EDUCATION STRATEGIC PLAN – PAGE 4
It should be noted that in 2005, the legislature significantly changed the role of the State Board of Education. Before that time, the Board had focused largely on administrative issues, such as school district boundary adjustments and oversight of school construction and accreditation. The new Board retains some administrative duties, but it is now mandated to provide a broad leadership role in strategic oversight and policy for K-12 education.
The Governor and the Legislature have set high expectations for the Board. We welcome that responsibility, but we know that progress will only come from collaboration. The quality of our work will depend on listening and learning from educators and others across the state. For this reason, the Board’s statute also mandates it to work closely with the institutions of higher education, workforce development representatives, and early learning policymakers and providers, to coordinate and unify the work of the public school system.
Board Membership The State Board of Education is composed of sixteen Washington state citizens: five who are elected by school district school board members (three from western Washington and two from eastern Washington), seven appointed by the Governor, the Superintendent of Public Instruction, a representative of private schools elected at-large by the members of the boards of directors of all accredited private schools, and two students. Appointees of the governor must be individuals who have demonstrated interest in public schools and are supportive of educational improvement, have a positive record of service, and who will devote sufficient time to the responsibilities of the Board. The Board is staffed by an Executive Director and five additional staff.
The members of the board are:
• Mary Jean Ryan, Seattle, Chair • Warren T. Smith Sr., Spanaway, Vice Chair • Dr. Bernal Baca, Des Moines • Dr. Kristina L. Mayer Ed.D., Port Townsend • Dr. Terry Bergeson, Superintendent of Public Instruction • Amy Bragdon, Newman Lake • Dr. Steve Dal Porto Ed.D., Quincy • Steven Floyd, Gig Harbor • Dr. Sheila Fox, Bellingham • Phyllis Bunker Frank, Yakima • Linda W. Lamb, Olympia • Eric Liu, Seattle • John C. Schuster, Ocean Shores • Jeff Vincent, Bainbridge Island

WASHINGTON STATE BOARD OF EDUCATION STRATEGIC PLAN – PAGE 5
• Lorilyn Roller, Renton • Austianna Quick, Oroville
Environmental Scan Upon taking office in 2005, Governor Gregoire and the Legislature commissioned the Washington Learns initiative, requiring a comprehensive review of the state of education in Washington State. According to the Washington Learns final report,
“Right now, in Washington:
• Less than 50 percent of children enter kindergarten ready to learn.
• Only 70 percent of ninth graders graduate from high school with their peers.
• Only 60 percent of black and Hispanic students graduate from high school with their peers.
• One-third of the adult population has only a high school diploma or less.
• The younger working age population is less educated than their older counterparts.
• 51 percent of employers report difficulty finding qualified job applicants with occupation-specific skills.
• 32 percent of Washington students who go to college must take remedial math classes before taking college level classes”.
• Washington’s rate of high school graduates going directly to college is the lowest in the nation.”2
This data does not bode well for the future of the Washington’s employers or their employees.
Washington Learns estimates that sixty percent of today’s jobs require some form of post secondary education or job training; by 2014 that percent will increase to 76 percent. However, in 2007, Washington ranked last in advanced degrees per thousand. At the current rate, only 19 out of 100 students in the ninth grade will earn an associates’ degree or higher. For the first time in US history, we are falling behind other developed or developing countries in the percent of 24-35 year olds with an associate degree or higher.3
2 Washington Learns, November 2006 3 Higher Education Coordinating Board “2008 Master Plan for Higher Education in Washington”

In addition, although the economy and labor market into which we send our graduates has dramatically changed, credit requirements have not changed since 1985. In fact, Washington requires a full credit less than the median for all other states in Math, English and Science, and a ½ credit less in Social Studies.4 To meet the need for skilled workers, we have been importing educated workers from other states and nations to fill our best jobs, leaving the less stable and lower paying jobs for people educated in Washington.5
Employers are not the only beneficiaries of a strong education system. Since the mid-1980s, earnings of people with baccalaureate and graduate degrees have been growing relative to those with only a high school diploma: in 2004, people with baccalaureate degrees earned 1.8 times what high school graduates earned, while advanced degree holders earned 2.7 times what high school graduates earned. Even one additional year of school beyond high school, especially if it results in a workforce certificate or credential, brings a significantly higher paycheck.6
Yet, our children are graduating from high school poorly prepared for higher learning. A recent study ascertained that 52% of community and technical college students who graduated from high school in 2006 required remedial classes in math, English or reading.
The impact of the skill gap is amplified for students in poverty and students of color, who continue to show significant achievement gaps in reading, writing, math and science (Fig 1).
Students of color are vastly underrepresented in postsecondary education, even though, by 2030, 37 percent of Washington’s K-12 students will be people of color. Yet, a study commissioned by the U.S. Department of Education
indicates that a more rigorous K-12 curriculum actually benefits students from lower socio-economic situations: low-income students with a rigorous high
Sour OSPI ce:
Fig. 1: The Achievement Gap is Significa
42% 44%49% 52%
57% 56%
14% 16%20%
24% 25% 26%
13% 14% 16%20% 23% 23%
0%
10%
20%
30%
40%
50%
60%
70%
80%
90%
100%
2001-02 2002-03 2003-04 2004-05 2005-06 2006-07
School Year
White Hispanic African American
WASHINGTON STATE BOARD OF EDUCATION STRATEGIC PLAN – PAGE 6
4 Education Commission of the States, August 2006 5 Washington Learns 6 ibid

school curriculum were almost 50% more likely to obtain a BA in four years than the average low-income college entrant.7
With the release of the WASL scores in 2006 for the Class of 2008, the first year that scores could be used to determine eligibility for graduation, brought a renewed sense of urgency to the issue.
The good news is that great progress has been made overall for students meeting the Washington Assessment of Student Learning standards in reading and writing. Writing scores are trending upwards for all grades (Fig. 2), while reading scores improved most dramatically at the 7th grade level (Fig. 3).
Fig 2. WASL Writing Scores Improving in All Grades
65%
50%54%
56%58%
60% 60%53%
55%
58%61%
65%68%
54%
61%
65%
80%84%
40%
50%
60%
70%
80%
90%
2001-02 2002-03 2003-04 2004-05 2005-06 2006-07School Year
Fig 3. WASL Reading Scores Improving in All Grad4th Grade 7th Grade
WASHINGTON STATE BOARD OF EDUCATION STRATEGIC PLAN – PAGE 7
However, based on the WASL scores, at least half of our students are not learning the math skills they need (Fig. 4), and science achievement lags math. In addition, on-time graduation rates showed no statistically significant level of change
ig. 5 ).
(F
Why are our students not achieving standards? Performance assessments in education point to a number of
7 Adelman, Clifford. The Toolbox Revisited, U.S. Department of Education, 2006.
10th Grade
Source: OSPI
4th Grade 7th Grade
67%
74%80%
45%48%
62%
73%66%
81%
77%
60%
69% 69%59% 60%65%
82%
81%
30%
40%
50%
60%
70%
80%
90%
2001-02 2002-03 2003-04 2004-05 2005-06 2006-07School Year
10th Grade
Source: OSPI
Fig 4: WASL Math Score Results are Mixed
30%
37%
52% 55%60% 61% 59% 58.1%
51%46%
37%
49%
54.6%39%
44%48%
51%
50.4%
0%
20%
40%
60%
80%
100%
2001-02 2002-03 2003-04 2004-05 2005-06 2006-07
School Year
4th Grade 7th Grade 10th Grade
Source: OSPI
Fig. 5 On Time Graduation Rates are Static
66% 66%70%
74% 70%
20%
40%
60%
80%
100%
School Year
0%2001-02 2002-03 2003-04 2004-05 2005-06
Source: OSPI

WASHINGTON STATE BOARD OF EDUCATION STRATEGIC PLAN – PAGE 8
contributing factors, including the lack of individualized support for students, insufficient funding, and inadequate systems of accountability. Standards of performance for the various entities in the system are lacking, and there are multiple authorities – local, state and federal - to which they report.
Local school boards are accountable to their communities for the continuous improvement of their students’ performance. They are also accountable for meeting a myriad of federal and state requirements, such as offering 180 days of instruction, meeting specified teacher-to-student ratios, assuring special education student procedures, and ensuring proper management of funds.
At the state level, the accountability system is defined by annual measurement of student academic performance on the Washington Assessment of Student Learning (WASL) in reading and mathematics for grades 3-8 and 10, as well as science and writing for selected grades, and the high school graduation requirement that students pass the 10th grade WASL in math and reading.
However, beyond public reporting of the WASL scores by different student subgroups at the school, district, and state level, there are no state-level consequences for schools’ or districts’ poor performance. The economy and labor market into which we send our graduates has dramatically changed, skill requirements are rising.
The federal “No Child Left Behind” (NCLB) law requires schools and districts in each state to make “Adequate Yearly Progress” (AYP) to increase the academic proficiency of all students. NCLB requires a state to implement a system of corrective action for all schools and districts receiving Title I federal funds. Some of the corrective actions recommended by NCLB include:
• Providing school choice;
• Providing supplemental services;
• Providing technical assistance;
• Replacing school personnel;
• Taking over specific schools for governance; and
• Taking over a district for governance.
NCLB encourages states to provide a system of rewards, assistance, and interventions; however, it falls short of compelling such actions. In Washington, the legislature has prohibited any state interventions to address poor student achievement except to permit the withholding of federal funds and providing professional development. Washington has used a voluntary approach of technical assistance to work with struggling schools since 2002.

WASHINGTON STATE BOARD OF EDUCATION STRATEGIC PLAN – PAGE 9
The myriad levels of accountability and standards make it difficult for schools and districts to focus on the issues and efforts that will improve outcomes. Requirements and resources vary widely from district to district, which means that benchmarking to improve is difficult. And, where any element of the system fails to meet standards, there is little clear authority to enforce them.
In response to the recommendations of the Washington Learns report, the Governor established the P-20 council with a mandate to improve student success and transitions within, and among the early learning, K-12 and higher education sectors. The Governor chairs the P-20 council, bringing together the major components of the P-20 system on a regular basis. The Chair of the State Board of Education is a member of the council and reports to the Council on the Board’s progress toward its own strategic objectives. However, the P-20 council has no statutory authority to intervene at the local or federal level.
Performance Assessment 2006 and 2007 were formative years for the Board as it realigned its efforts around a new mandate and the goal of dramatically improving student achievement. The Board shifted the focus of its attention from administrative duties to policy establishment and advocacy around three key issues:
• Meaningful graduation requirements
• Achievement in mathematics and science and
• Development of an accountability system.
Meaningful High School Diploma
The Board launched its work on graduation requirements by surveying all 246 districts with high schools and developing a database of the varying requirements. The Board sought input from parents, students, community and business leaders, community and technical college educators, and higher education administrators and heard: “One diploma - multiple pathways.”
Based on its research, the Board established that a student’s ability to attain a meaningful high school diploma depended on student access to a more rigorous high school curriculum, provisions for individualized learning, and stronger support for High School and Beyond Plans. As the Board determined:
“the purpose of the diploma is to declare that a student is ready for success in post secondary education, gainful employment, and citizenship, and is equipped with the skills to be a lifelong learner.”
The Board drafted its recommendations and reviewed them with interested parties at a series of public outreach sessions in the fall of 2007. The Board anticipates adoption of a final proposal in July 2008 to inform the work of the K-

WASHINGTON STATE BOARD OF EDUCATION STRATEGIC PLAN – PAGE 10
12 Task Force on funding for Basic Education. The Board is especially sensitive to identifying potential implementation challenges, since stronger graduation requirements will require additional investment and revisions to the definition of Basic Education.
Achievement in Math and Science
The Board chose to focus initially on improving achievement in math and science. Currently, each school district decides on its own curriculum, and Washington State requires only two math credits to graduate. Students who transfer between schools are then confronted with different standards, and many high school graduates who go on to a college or university must enroll in remedial math because they are not prepared for college level work. The Board voted to add a third year of mathematics to the requirements for graduation, and expects to complete the required rule amendment in 2008. The Board also began working with the Professional Educator Standards Board to ensure that qualified teachers are in place to support the new curriculum.
Accountability System
A workable accountability system is foundational to improving student outcomes. Accordingly, in 2005 the state Legislature directed the Board to create a system of accountability to improve student achievement. A committee of the Board began work with a review of findings from other states and the A+ Commission. The committee presented its recommendations at the September 2007 Board meeting, laying out three concepts for consideration:
• Clear, appropriate indicators and measurements to monitor progress of the education system.
• A continuous improvement assistance program for all Washington schools and districts.
• Criteria to identify schools and districts in which students are successful, need assistance, or consistently fail to meet state standards; and proposals to create targeted state/local partnerships to help improve student achievement.
The Board is currently studying the policy barriers to student achievement and options for state/local partnerships to support chronically underperforming schools, “priority schools.” The Board plans to adopt its recommendations in September 2008 and propose them to the legislature in 2009.
Mission, Goals and Indicators

The mission of the State Board of Education is to lead the development of state policy, provide system oversight and advocate for student success.
To accomplish that mission, the Board has set itself three goals. These three goals are outcome-oriented and framed in terms related to students. They define the three major areas on which the Board will focus as it sets policy and carries out its oversight role. For each goal, we have indicators for which we have current data and trends at the state level.
GOAL 1: Improve achievement for all students INDICATOR: Percent of students meeting assessment targets by subject, grade and population segment
This goal affirms the Board’s commitment to set policy and standards that will be effective in increasing student mastery of critical subjects. In particular, the Board is committed to setting policies that will address discrepancies in learning between student populations. In addition, standards which students will be expected to achieve will be set at a level consistent with the skills required by employers and institutions of post-secondary learning.
This goal will require a concerted effort on the part of all partners over the foreseeable future. The Board’s primary objective for the period of this strategic plan is to improve achievement in Math and Science, as measured by assessment results in math and science. Working with OSPI and PESB, the Board will advocate for increased alignment in the math and science curriculum and strengthening teacher preparation in those areas. The work under the Board’s accountability initiative (a foundational strategy discussed below) and the Board’s continued work on CORE 24 to enhance graduation requirements will also support this goal. One purpose for the accountability system will be to recognize schools and districts that perform well and identify those that need targeted investments through the Board’s proposed Innovation Zone as well as ultimate consequences for no improvement.
WASHINGTON STATE BOARD OF EDUCATION STRATEGIC PLAN – PAGE 11

GOAL 2: Improve graduation rates INDICATOR: Percent of students graduating using extended time by population
It is not enough to improve achievement in specific subject areas. We also must see a major improvement in the percentage of students who graduate from high school. Board policies and influence will also be aimed at supporting students in staying in school and accumulating the necessary credits for graduation over the course of high school.
To advance this goal, with the Board’s adoption of the CORE 24 framework, it wants to make sure that the additional requirements do not cause more students to drop out of school. The Board will examine the reasons students drop out of high school by reviewing the current literature and ongoing projects in Washington State. The Board will also conduct a study on barriers perceived by students and their parents, examine how to operationalize competencies for high school credits, create a model of how alternative education could be strengthened for students, and determine what policies should be put in place to ensure the quality of online learning opportunities. This initiative on providing leadership in personalized education will be referred to as “Stop the Drop(out) Rate” or “Stop the Drop”.
GOAL 3: Improve student preparation for post-secondary education and the 21st century world of work and citizenship INDICATOR: Percent of students enrolled in post-secondary institutions or industry certification programs
Students must not only master the subjects but they must also be able to apply the skills and knowledge gained. Board policies will ensure that schools support the delivery of course material with opportunities for students to integrate academic learning with opportunities to apply that learning and explore pathways for work and learning beyond high school.
For this biennium, the Board’s objective will be to improve the credibility of the high school diploma as an indicator of student readiness for life after high school. The Board has already adopted “CORE 24”, which provides a policy
WASHINGTON STATE BOARD OF EDUCATION STRATEGIC PLAN – PAGE 12

framework for graduation requirements. Now it will begin the work on an implementation task force to address issues such as phase-in of credits and how to help struggling students retrieve credits and advance their skills to grade level. The board will work with its partners to address CORE 24 issues related to teacher supply, facility infrastructure and scheduling approaches that can meet the required 150 instructional hours. Finally, the Board will also investigate options for providing appropriate career exploration courses as well as career concentration options.
Strategies There are four strategies that are foundational to achieving the Board goals.
STRATEGY 1: Advocate for the creation of a strategic compact among SBE, OSPI, PESB, local school districts and other key stakeholders to forge a system approach to achieve the goals.
This is the cornerstone among the foundational strategies. The Board alone can do little to improve student success. The policies it sets must be operationalized by many others at the state and local level. As the Board tackles the work related to its goals, the Board will seek and welcome opportunities to partner with others who can influence the direction of K-12.
STRATEGY 2: Implement a clear, workable statewide accountability system - with shared responsibility between the state and local school districts - that fosters a learning culture, helps assess progress and informs policy-making.
Like the compact, this strategy is absolutely essential to improving K-12 outcomes. An effective accountability system is one that provides the information and data that allows managers and decision-makers to determine if things are improving, declining or having the same effect. An accountability system ensures that the feedback loop is closed and that appropriate incentives and support exist to produce and reinforce improvement. In collaboration with others, the Board intends to strengthen the data collection and review system to identify schools and districts that are effective, as well as those in which improvement is needed, and then to designate the authority and a process for ensuring that schools and districts take the necessary steps to improve.
The Board began work on a statewide performance accountability system during BY 2007-08, and expects to complete its research and recommendations in the fall
WASHINGTON STATE BOARD OF EDUCATION STRATEGIC PLAN – PAGE 13

of 2008. This will allow it to prepare its recommended budget request and suggested law changes, and to inform the work of the joint Basic Education Funding Task Force.
STRATEGY 3: Develop a comprehensive data system to inform management and instructional decisions.
An accountability system depends on the existence of credible, timely and accessible data. While the high-level indicators of success are generally agreed on, the data to track progress at the ‘objective’ level is not always of good quality. Significant gaps in availability and in access also exist. The Board will advocate for the development within the system of a shared base of data on which to base decisions and track progress toward goals.
STRATEGY 4: Advocate for results, and policies and resources to achieve them.
In developing policies to advance its goals, the Board will focus on practices that are – based on the evidence - most likely to ensure positive results in student outcomes. The Boars will then advocate for the adoption of these practices in graduation requirements, curriculum, teacher preparation and other aspects of quality education. The Board will also use its influence to advocate for the resources necessary to operationalize its policies, and is working closely with the Basic Education Funding Task Force toward that end.
The linkage between the Board’s mission, goals, objectives, strategies and indicators, and its vision for K-12 is illustrated by the following graphic:
* * * * * *
WASHINGTON STATE BOARD OF EDUCATION STRATEGIC PLAN – PAGE 14

Internal Capacity and Financial Health The Board has a challenging mission, to be accomplished with a staff of six and its current 2007-09 biennial budget of $1,895,000. The Board relies on the Office of the Superintendent of Public Instruction for much of its administrative and fiscal support, allowing it to focus on its policy role. Although the Board’s fiscal position is sound, its small budget requires that it seeks all possible opportunities to partner with others to achieve its goals.
WASHINGTON STATE BOARD OF EDUCATION STRATEGIC PLAN – PAGE 15

WASHINGTON STATE BOARD OF EDUCATION STRATEGIC PLAN – PAGE 16
Appendix A: RCW 28A.305.130 Powers and duties — Purpose
The purpose of the state board of education is to provide advocacy and strategic oversight of public education; implement a standards-based accountability system to improve student academic achievement; provide leadership in the creation of a system that personalizes education for each student and respects diverse cultures, abilities, and learning styles; and promote achievement of the goals of RCW 28A.150.210. In addition to any other powers and duties as provided by law, the state board of education shall: (1) Hold regularly scheduled meetings at such time and place within the state as the board shall determine and may hold such special meetings as may be deemed necessary for the transaction of public business; (2) Form committees as necessary to effectively and efficiently conduct the work of the board; (3) Seek advice from the public and interested parties regarding the work of the board; (4) For purposes of statewide accountability: (a) Adopt and revise performance improvement goals in reading, writing, science, and mathematics, by subject and grade level, once assessments in these subjects are required statewide; academic and technical skills, as appropriate, in secondary career and technical education programs; and student attendance, as the board deems appropriate to improve student learning. The goals shall be consistent with student privacy protection provisions of RCW 28A.655.090(7) and shall not conflict with requirements contained in Title I of the federal elementary and secondary education act of 1965, or the requirements of the Carl D. Perkins vocational education act of 1998, each as amended. The goals may be established for all students, economically disadvantaged students, limited English proficient students, students with disabilities, and students from disproportionately academically underachieving racial and ethnic backgrounds. The board may establish school and school district goals addressing high school graduation rates and dropout reduction goals for students in grades seven through twelve. The board shall adopt the goals by rule. However, before each goal is implemented, the board shall present the goal to the education committees of the house of representatives and the senate for the committees' review and comment in a time frame that will permit the legislature to take statutory action on the goal if such action is deemed warranted by the legislature; (b) Identify the scores students must achieve in order to meet the standard on the Washington assessment of student learning and, for high school students, to obtain a certificate of academic achievement. The board shall also determine student scores that identify levels of student performance below and beyond the standard. The board shall consider the incorporation of the standard error of measurement into the decision regarding the award of the certificates. The board shall set such performance standards and levels in consultation with the superintendent of public instruction and after consideration of any recommendations that may be developed by any advisory committees that may be established for this purpose. The initial performance standards and any changes recommended by the board in the performance standards for the tenth grade assessment shall be presented to the education committees of the house of representatives and the senate by November 30th of the school year in which the changes will take place to permit the legislature to take statutory action before the changes are implemented if such action is deemed warranted by the legislature. The legislature shall be advised of the initial performance standards and any changes made to the elementary level performance standards and the middle school level performance standards; (c) Adopt objective, systematic criteria to identify successful schools and school districts and recommend to the superintendent of public instruction schools and districts to be recognized for two types of accomplishments, student achievement and improvements in student achievement. Recognition for improvements in student achievement shall include consideration of one or more of the following accomplishments: (i) An increase in the percent of students meeting standards. The level of achievement required for

WASHINGTON STATE BOARD OF EDUCATION STRATEGIC PLAN – PAGE 17
recognition may be based on the achievement goals established by the legislature and by the board under (a) of this subsection; (ii) Positive progress on an improvement index that measures improvement in all levels of the assessment; and (iii) Improvements despite challenges such as high levels of mobility, poverty, English as a second language learners, and large numbers of students in special populations as measured by either the percent of students meeting the standard, or the improvement index. When determining the baseline year or years for recognizing individual schools, the board may use the assessment results from the initial years the assessments were administered, if doing so with individual schools would be appropriate; (d) Adopt objective, systematic criteria to identify schools and school districts in need of assistance and those in which significant numbers of students persistently fail to meet state standards. In its deliberations, the board shall consider the use of all statewide mandated criterion-referenced and norm-referenced standardized tests; (e) Identify schools and school districts in which state intervention measures will be needed and a range of appropriate intervention strategies after the legislature has authorized a set of intervention strategies. After the legislature has authorized a set of intervention strategies, at the request of the board, the superintendent shall intervene in the school or school district and take corrective actions. This chapter does not provide additional authority for the board or the superintendent of public instruction to intervene in a school or school district; (f) Identify performance incentive systems that have improved or have the potential to improve student achievement; (g) Annually review the assessment reporting system to ensure fairness, accuracy, timeliness, and equity of opportunity, especially with regard to schools with special circumstances and unique populations of students, and a recommendation to the superintendent of public instruction of any improvements needed to the system; and (h) Include in the biennial report required under RCW 28A.305.035, information on the progress that has been made in achieving goals adopted by the board; (5) Accredit, subject to such accreditation standards and procedures as may be established by the state board of education, all private schools that apply for accreditation, and approve, subject to the provisions of RCW 28A.195.010, private schools carrying out a program for any or all of the grades kindergarten through twelve: PROVIDED, That no private school may be approved that operates a kindergarten program only: PROVIDED FURTHER, That no private schools shall be placed upon the list of accredited schools so long as secret societies are knowingly allowed to exist among its students by school officials; (6) Articulate with the institutions of higher education, workforce representatives, and early learning policymakers and providers to coordinate and unify the work of the public school system; (7) Hire an executive director and an administrative assistant to reside in the office of the superintendent of public instruction for administrative purposes. Any other personnel of the board shall be appointed as provided by RCW 28A.300.020. The Board may delegate to the Executive Director such duties as deemed necessary to efficiently carry on the business of the Board including but not limited to, the authority and employ necessary personnel and the authority to enter into, amend and terminate contracts on behalf of the Board. The executive director, administrative assistant, and all but one of the other personnel of the board are exempt from civil service, together with other staff as now or hereafter designated as exempt in accordance with chapter 41.06 RCW; and (8) Adopt a seal that shall be kept in the office of the superintendent of public instruction.

WASHINGTON STATE BOARD OF EDUCATION STRATEGIC PLAN – PAGE 18

Update on State Board of Education Work Plan for 2008-09 and Recent Work Completed for 2007-08
September 2008
VISION
The State Board envisions a learner-focused state education system that is accountable for the individual growth of each student, so that students can thrive in a competitive global economy and in life. Adopted 9/06
MISSION
The mission of the State Board of Education is to lead the development of state policy, provide system oversight and advocate for student success. Adopted 9/06; Refined 5/08 BOARD GOALS:
1. Improve achievement for all students. Adopted 9/06; Refined 5/08
2. Improve graduation rates. Adopted 5/08
3. Prepare all Washington State students for the opportunity to succeed in post-secondary education, in the 21st century world of work, and citizenship. Adopted 5/07
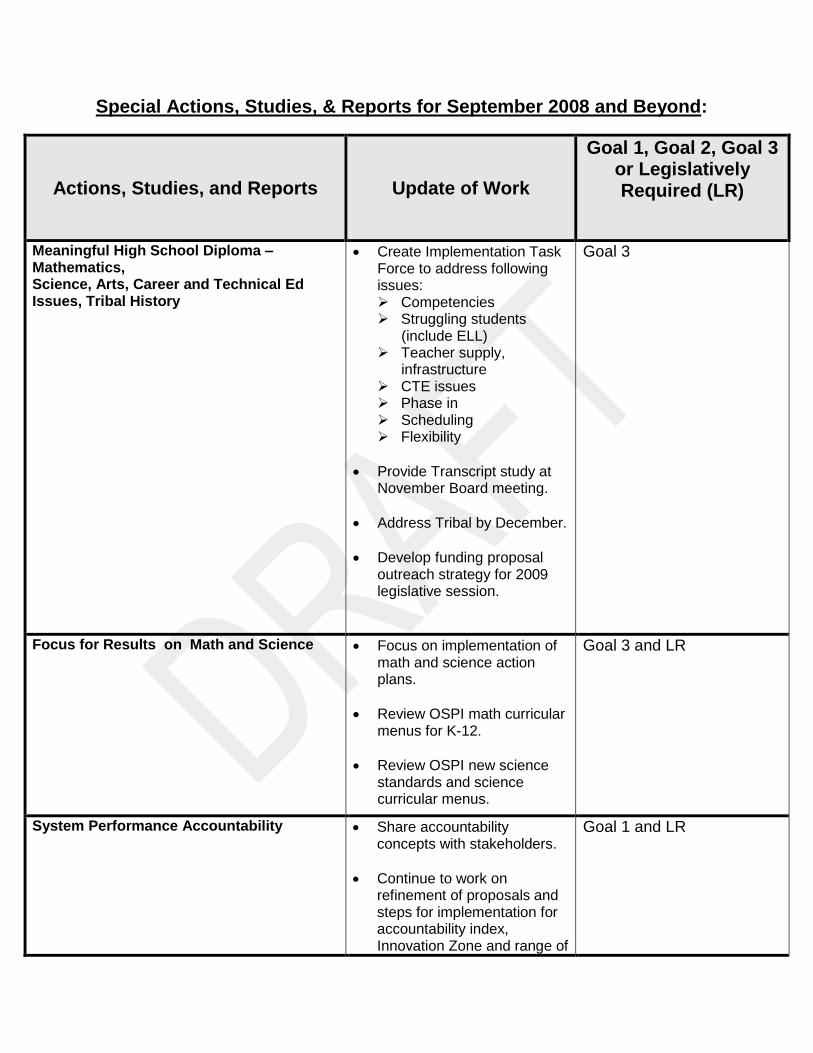
Special Actions, Studies, & Reports for September 2008 and Beyond:
Actions, Studies, and Reports Update of Work
Goal 1, Goal 2, Goal 3 or Legislatively Required (LR)
Meaningful High School Diploma – Mathematics, Science, Arts, Career and Technical Ed Issues, Tribal History
Create Implementation Task Force to address following issues: Competencies Struggling students
(include ELL) Teacher supply,
infrastructure CTE issues Phase in Scheduling Flexibility
Provide Transcript study at November Board meeting.
Address Tribal by December.
Develop funding proposal outreach strategy for 2009 legislative session.
Goal 3
Focus for Results on Math and Science Focus on implementation of math and science action plans.
Review OSPI math curricular menus for K-12.
Review OSPI new science standards and science curricular menus.
Goal 3 and LR
System Performance Accountability Share accountability concepts with stakeholders.
Continue to work on refinement of proposals and steps for implementation for accountability index, Innovation Zone and range of
Goal 1 and LR

Actions, Studies, and Reports Update of Work
Goal 1, Goal 2, Goal 3 or Legislatively Required (LR)
state interventions.
Track progress on indicators.
Develop funding and policy proposals and outreach strategy for 2009 session.
Follow up on Commissions’ regarding achievement gap.
Graduation Rates Strategies to Improve Graduation Rates “Stop the Drop” to ensure success with CORE 24 for all students. Why do students dropout and what are we going to do about it?
Barriers for parents and students study.
Achievement gap issues.
Learning for the 21st century Alternative Education Online learning
Goal 2 (Request for state funding in 2009-11 budget to do this work).
On Going Work Update rules and by-laws.

Special Actions, Studies, & Reports for September 2007–August 2008: Actions by Board are in BOLD below
Actions, Studies, and Reports Update of Work
Goal 1, Goal 2, Goal 3 or Legislatively Required (LR)
Meaningful High School Diploma – Mathematics, Science, Arts, Career and Technical Ed Issues, Tribal History
Public outreach sessions conducted in fall 2007.
Board adopted definition of a meaningful diploma at its January Board meeting.
CTE study completed and presented at January 2008 Board meeting.
February work session covered credit frameworks.
CORE 24 draft approved for spring input at March 2008 meeting.
April, June and July work sessions covered CORE 24 proposal and the high school and beyond plan as well as the culminating project.
Board agreed to address MOA to examine tribal history as part of graduation requirements new date of December 1, 2008 – Board will adopt response to MOA at November 2008 Board meeting.
Public outreach sessions in spring 2008.
Board adopted final CORE 24 graduation proposal for adoption at its July Board meeting with expectation of
Goal 3

Actions, Studies, and Reports Update of Work
Goal 1, Goal 2, Goal 3 or Legislatively Required (LR)
funding needed before going into effect.
Implementation Task Force will be created in fall 2008.
Transcript study will be ready by November Board meeting.
System Performance Accountability Board agreed to focus on three big draft concepts for statewide plan at September 2007 Board meeting:
1. Performance
Improvement Goals and Indicators to Measure System Progress.
2. A Tiered System of
Continuous Improvement for All Schools.
3. Targeted Strategies for
Chronically Underperforming Schools “Priority Schools”.
Two RFPs awarded in February 2008 to do work for: perceptions of policy barriers to student achievement study (NWREL) and development of state/local partnerships for chronically underperforming schools (Mass Insight).
February work session on OSPI District Improvement Program, Accountability Index, and ESD accreditation.
Goal 1 and LR

Actions, Studies, and Reports Update of Work
Goal 1, Goal 2, Goal 3 or Legislatively Required (LR)
Public outreach in spring 2008.
June work session on Barriers study draft report and initial concepts in state and local partnerships.
August work session on Accountability Index and Innovation Zone for Partnerships.
Board may adopt an accountability framework at its November 2008 meeting.
Possible symposium planned for winter/spring 2009 with PESB on innovative ways to address issues such as teacher shortages. Provide recommendation to legislature about when school districts need to choose from state curriculum.
Joint Mathematics and Science Action Plans
Seek support from outside groups to assist OSPI in implementation.
PESB meeting on teacher supply issues in August.
Math and science surveys through WSSDA in summer of 2008.
Goals 1 and 3
Math and Science Report Update on Standards and Curriculum Reviews
Reports due March 2008, June 2008, September 2008, etc).
LR

Actions, Studies, and Reports Update of Work
Goal 1, Goal 2, Goal 3 or Legislatively Required (LR)
*Math Standards Review and Curricular Review
Final report completed August 30, 2007
Math Panel met October, December, and February to review OSPI update.
Strategic Teaching provided February update on OSPI January 31 standards document in terms of whether it met Strategic Teaching’s seven recommendations.
Strategic Teaching contract extended to edit the K-12 math standards.
Math panel meetings in February, May, June, August and, October 2008, to provide feedback on standards and curricular menu.
Board approved K-8 standards in April for OSPI adoption and 9-12 standards in July for OSPI adoption.
Strategic Teaching hired through new competitive RFP to examine three curricular menus that OSPI develops in fall 2008.
Goals 1 and 3 and LR
SBE provide update to legislature and Governor on math and science standards and curricula reviews
September 1, 2007 (and every quarter after that – December 2007, March 2008, June 2008, etc) until 2012.
LR

Actions, Studies, and Reports Update of Work
Goal 1, Goal 2, Goal 3 or Legislatively Required (LR)
SBE revise math high school graduation requirements to 3 credits (look at CTE)
Due December 1, 2007, received an extension.
Board directed staff to draft rule on 3rd credit for Algebra II or CTE equivalent or career path math course (with sign off from parent and high school) but wait until high school math standards complete.
Board adopted 3 credits of high school math and content at July 2008 Board meeting.
LR
*Science Standards Review Heil and Associates hired and Panel in fall 2007.
SBE approved report at May 2008 Board meeting.
Heil will provide feedback on new OSPI draft science standards in fall 2008.
LR
Examine math WASL implementation date to require CAA (meet standard in math, reading, and writing) from class of 2013 to class of 2012
Board decided to keep deadline for class of 2013 at its January meeting.
LR
Science Curriculum Review Due June 30, 2009. LR
Support P-20 Council Work Three meetings have occurred in September, December 2007, and winter 2008.
Focus on ELL, data and math. Function of work group still under revision.
LR
EOC Assessment Study Alternative norm referenced tests study
Reviewed final report by Education First Consulting at January Board meeting and
Governor

Actions, Studies, and Reports Update of Work
Goal 1, Goal 2, Goal 3 or Legislatively Required (LR)
delivered to Governor January 15, 2008.
Determine SAT and ACT reading and writing cut scores
Approved SAT reading and writing and ACT reading at November 2007 Board meeting.
Approved ACT writing in July 2008.
LR
Joint Professional Educator Standards Board (PESB) /State Board of Education Report
Report due to legislature October 15, 2008 (due every even numbered year).
LR
Online learning study Presentation made at May
Board meeting.
Goals 1 and 3
State Board of Education Duties Board has not discussed duties it wants to have “back.” The issue of accreditation has come up as one to be examined.
LR
Transcript analysis study BERC awarded contract- study to be completed in November.
Goal 3
Education Gap Issues: English Language Learners (ELL) Action Plan
Examined ELL issues and received update from OSPI at January Board meeting. This will be a topic for the
P-20 group to examine.
Goals 1 and 3
Additional resources to do work SBE applied and received a
second Gates Grant, February 2008 of $850,000.
Goals 1 and 3
Update SBE Strategic Plan New goal added at May Board meeting to address improving graduation rates. Indicators drafted.
Goal 2

Ongoing Work:
Actions, Studies, Reports Components of Task Goal 1, Goal 2 or
Legislatively Required (LR)
180 Day Waiver Requests Review 180 day waiver requests from schools – new process for 2008-09 school year.
LR
Basic Education Compliance Send out form annually to districts and collect signed forms back from 295 districts.
LR
Board Meetings, Work Sessions, and Board Member Requests
Prepare and follow up for board meetings as well as work sessions and panels.
July 07-08:
59 major meetings
483 travel vouchers
Countless requests
483 trave
Meet and coordinate with Key Policy Makers
Meet with key stakeholders throughout year (legislators, WEA, WSSDA, WASA, AWSP, legislative and Governor staff).
Goal 1 and 3
Private School Approval Process Oversee the review of
private school proposals.
LR
Rules Update rules as needed.
We need to do some work on this year.
LR
Web and PR Communication Continuously improve Web site, create press releases and media opportunities.
Produced five minute video on MHSD work.
Email monthly E-newsletter to over 3,000 individuals.
Email Board highlights to key policy makers.
Goals 1 and 3

Questions on SBE work Answer constituent
questions by phone (average 15-20 per day) and email (average of 30 per day).
Goals 1 and 3
Catalogue responses on SBE actions Keep track and respond to
constituent responses SBE major initiatives.
Goals 1 and 3
Develop budget and legislative proposals
Proposals being prepared for fall 2008 to get ready for 2009 legislative session.
Goals 1-3
Prepare for annual retreat August 18-19 retreat with
Dee Endelman.
Goals 1-3
Develop work plan for year August-Sept
Goals 1-3

Draft Work Plan by Month for 2008-09 October 2008- February 2009 (Part One)
Topic Areas October 2008 November 2008 December 2008 January 2009 February 2009
Major Themes CORE 24 High school diploma/grad requirements
System Performance Accountability
Math: Review OSPI curricular rewrite and action plan
Science: Review new standards, science curricular review, and action plan
Issues related to improving graduation rates
Board Work Sessions, Public Outreach, and Meetings
Outreach to stakeholders on accountability proposals Work sessions on:
1) MHSD: TBD 2) Accountability
October 21
Math Panel meeting: October 14
Potential Board agenda items for November meeting: -Math and Science Action Plan Update -Math Curricular menu for K-8 -Transcript study -Alt Ed study by OSPI -Science Standards update
Math Panel meeting
Potential Board agenda items for January 9-10 meeting: -SPA and MHSD update -Basic Ed TF funding proposal and other key legislative issues -Joint math and
Work sessions on:
1) Graduation requirements
2) Accountability issues
Science Panel meeting

Topic Areas October 2008 November 2008 December 2008 January 2009 February 2009
Executive Committee face to face with AWSP, WASA and WSSDA: October 24
-Tribal MOA -OSPI student learning plans? -Greg Lobdell presentation on achievement gap myths Science Panel meeting
science action plans -By-laws update - Recommendations on High School Math Curricular Menus -Report from Commissions on Achievement Gap -Renton presentation on District Improvement work -Extended graduation rate data OSPI presentation -SBCTC presentation? -Dropout study from Mary Beth Calio? Science Panel meeting
Staff Follow Up -Work on CORE 24 implementation task force -Work with contractors on accountability index, Innovation Zone, and Range of interventions By-laws review Find out status of Commissions on
-Work on CORE 24 implementation task force -Work with contractors on accountability index, Innovation Zone, and Range of interventions -Find out status of Commissions on Achievement Gap
-Work on CORE 24 implementation task force -Prepare for legislative session -Work on implementation of accountability index, Innovation Zone, and Range of interventions -Start to flesh out studies for
-Work on CORE 24 implementation task force -Work on implementation of accountability index, Innovation Zone, and Range of interventions -Start to flesh out studies for improving graduation
-Work on CORE 24 implementation task force -Work on implementation of accountability index, Innovation Zone, and Range of interventions -Start to flesh out studies for improving graduation

Topic Areas October 2008 November 2008 December 2008 January 2009 February 2009
Achievement Gap
improving graduation
Reports/Studies Due
Board Decisions Due
Discuss Tribal History per Memorandum of Agreement (Dec 1) Recommendations on K-8 Math Curricular Menus
Recommendations on High School Math Curricular Menus
Current Contracts
-Strategic Teaching: Math Curricular Review - Mass Insight- Accountability -Pete Bylsma- accountability -BERC- transcript study -Heil and Associates- Science standards review and EOC examination
Other Board Potential Issues
-Executive committee board liaisons -Working with PESB -NCLB reauthorization -Working with basic education funding committee and legislators -Data issues -Working with P-20 Council -Opportunity to learn issues -Student achievement issues -ELL -General report to legislature

Topic Areas October 2008 November 2008 December 2008 January 2009 February 2009
-Rules review and duties review

Draft Work Plan by Month for 2008-09 March-September 2008 (Part Two)
Topic Areas March/April 2009 May/June 2009 July 2009 August 2009 September 2009
Major Themes CORE 24 High school diploma/grad requirements
System performance accountability
Math: review OSPI curricular rewrite and action plan
Science: review new standards, science curricular review, and action plan
Issues related to improving graduation rates
Board Work Sessions, Public Outreach, and Meetings
Potential Board agenda items for March meeting: -Legislative session update -180 Day Waiver requests -Math and Science Action plans Possible April work Session
Potential Board agenda items for May meeting: - Legislative session update -180 Day Waiver requests -Math and Science Action plans -Science curricular menu from OSPI Math Panel meeting on math curricular menu Possible June work sessions
Potential Board agenda items for July meeting: Retreat- how long? Review proposed rules on CORE 24 and accountability if funding enacted
No meetings!
Potential Board agenda items for September: Review legislative and budget proposals

Topic Areas March/April 2009 May/June 2009 July 2009 August 2009 September 2009
Staff Follow Up
-Begin Rules on CORE 24 and accountability if funding enacted and other rules clean up
-Rules on CORE 24 and accountability if funding enacted and other rules clean up Private School issues?
Work on personalized learning issues- alt ed, on line, etc
Work on personalized learning issues- alt ed, on line, etc
Work on personalized learning issues- alt ed, on line, etc
Reports/ Studies Due
March 1, 2009 Status of math and science standards and curriculum review due to legislature and Gov
June 1, 2009 Status of math and science standards and curriculum review due to legislature and Gov June 30th, 2008 Official comment due to OSPI on math curricular and instructional menu
Private School issues?
September 1, 2009 Status of math and science standards and curriculum review due to legislature and Gov
Board Decisions Due
Finalize legislative and budget requests for 2009-11 Consider moving math WASL as graduation requirement for CAA to 2012
Current Contracts
Other Board Potential Issues
Executive committee board liaisons -Personalized learning -Working with PESB -NCLB reauthorization -Working with basic education funding committee -JMAP -Data issues -Working with P-20 Council -Opportunity to learn issues

Topic Areas March/April 2009 May/June 2009 July 2009 August 2009 September 2009
-Student achievement issues -ELL issues -General report to legislature -Rules review and duties review
Chair- Mary Jean Ryan Vice Chair- Warren T. Smith Sr. Dr. Terry Bergeson, Superintendent of Public Instruction Dr. Bernal Baca Amy Bragdon Dr. Steve Dal Porto Steve Floyd Dr. Sheila Fox Phyllis Bunker Frank Austianna Quick
Linda W. Lamb Eric Liu Dr. Kristina Mayer John C. "Jack" Schuster Jeff Vincent Lorilyn Roller Edie Harding, Executive Director
(360) 725-6025 TTY (360) 664-3631 FAX (360) 586-2357 Email: [email protected] www:sbe.wa.gov
September 2, 2008 The Honorable Christine Gregoire Office of the Governor P.O. Box 40002 Olympia, WA. 98504-0004 Dear Governor Gregoire: The State Board of Education has made significant progress in defining and advancing key education policy issues over the last two years in the areas of a meaningful high school diploma, math and science standards, and accountability. This work has been accomplished through state funding as well as several grants from the Bill and Melinda Gates Foundation. We have proposed a new definition for the high school diploma as follows:
The purpose of the diploma is to declare that a student is ready for success in postsecondary education, gainful employment, and citizenship, and is equipped with the skills to be a lifelong learner. The diploma represents a balance between the personalized education needs of each student and society’s needs, and reflects at its core the state’s basic education goals. The diploma is a compact among students, parents, local school districts, the state and whatever institution or employer the graduate moves on to—a compact that says the graduate has acquired a particular set of knowledge and skills. How the student demonstrates those skills may differ. Whether a student earns credit by participating in formal instruction or by demonstrating competency through established district policies is immaterial; they are equally acceptable.
Building on that definition, the Board has developed its CORE 24 proposal, which provides a policy framework for a new set of graduation requirements. These requirements will create stronger expectations for our students and provide a greater focus to align their coursework with their future career goals. The Board will seek funding for this proposal during the 2009 session. It is also examining the implementation issues for the CORE 24 over the next year.
OLD CAPITOL BUILDING.ROOM 253.P.O. Box 47206.600 S.E. WASHINGTON.OLYMPIA, WA 98504-7206
WASHINGTON STATE BOARD OF EDUCATION

Chair- Mary Jean Ryan Vice Chair- Warren T. Smith Sr. Dr. Terry Bergeson, Superintendent of Public Instruction Dr. Bernal Baca Amy Bragdon Dr. Steve Dal Porto Steve Floyd Dr. Sheila Fox Phyllis Bunker Frank Austianna Quick
Linda W. Lamb Eric Liu Dr. Kristina Mayer John C. "Jack" Schuster Jeff Vincent Lorilyn Roller Edie Harding, Executive Director
(360) 725-6025 TTY (360) 664-3631 FAX (360) 586-2357 Email: [email protected] www:sbe.wa.gov
The Board has provided a key leadership role in making the new math and science standards truly “world class” as was called for in Washington Learns. The Board also adopted a third credit of math for high school graduation, which will be Algebra II or math credit defined upon a student’s career interest. The Board will advocate for the funding to ensure that the proper curriculum, aligned to the standards, is identified and available to support students and teachers. And finally, to complete its work from the last two years, the Board is developing some exciting new proposals around accountability to recognize the excellent work of schools and to target a strong investment in schools that chronically are underperforming through our proposed “Innovation Zone.” The Board is considering legislation for these accountability proposals for the 2009 session. The Board will send you and the Joint Basic Education Finance Task Force a memo later this fall, detailing the costs we believe are needed to implement the CORE 24, support the new math and science standards and accountability proposals, which we believe are fundamental pieces that should be incorporated into the final basic education funding proposal. Draft Budget Requests for Supplemental Budget and FY 09-11 The State Board of Education (SBE) is submitting these requests in draft form to meet the Office of Financial Management deadline of September 2, 2008. However, the Board will need to approve these proposed budgets at its September 24-25, 2008 meeting. If there are any changes at that meeting, staff will provide the revisions to your office. FY 09 Supplemental Request. To complete this biennium’s work, the Board requests $150,000 to conduct a review of the science curricular menu that the Office of the Superintendent of Public Instruction will recommend to the Board. While the legislature provided a specific appropriation for the Board to conduct its review of math and science standards and curriculum, there are no funds left for the science curricular menu review. The math review of curricular menu materials is $150,000 and we are requesting the same amount for the science curricular menu review. FY 09-11 Budget Enhancement Decision Package. The Board is also requesting an enhancement to its current funding to address its new strategic plan goal to improve graduation rates. To do this work, the Board has proposed a decision package of $820,000 to Personalize Education for High School Students to “Stop the Drop(out) Rate.” The Board is charged by the legislature “to provide leadership in the creation of a system that personalizes education for all students and respects diverse culture, abilities and learning styles and promotes the achievement of the basic education goals,” (RCW 28A.305.130). During the upcoming biennium, the Board hopes to focus on “why students drop out and what are we going to do about it?” through its new goal of improving graduation rates. The Board believes that an investigation of strategies to make learning more personal for high school students can make a difference and stop
Chair- Mary Jean Ryan Vice Chair- Warren T. Smith Sr. Dr. Terry Bergeson, Superintendent of Public Instruction Dr. Bernal Baca Amy Bragdon Dr. Steve Dal Porto Steve Floyd Dr. Sheila Fox Phyllis Bunker Frank Austianna Quick
Linda W. Lamb Eric Liu Dr. Kristina Mayer John C. "Jack" Schuster Jeff Vincent Lorilyn Roller Edie Harding, Executive Director
(360) 725-6025 TTY (360) 664-3631 FAX (360) 586-2357 Email: [email protected] www:sbe.wa.gov
the “falling through the cracks” syndrome. The Board also anticipates receiving information on the achievement gap from the various commissions charged with this review and wants to incorporate issues they identify in our strategies outlined below. The Board proposes creating strategies to improve graduation rates by exploring these issues:
A) Define the reasons students drop out of high school now, by reviewing the current literature and ongoing projects in Washington State as well as to conduct a study on barriers perceived by students and their parents.
B) Determine how to operationalize competencies for high school credits. C) Examine ways to create a model of how alternative education could be
strengthened for students. D) Examine the current status of online learning in Washington, and nationally, to
determine what policies should be put in place to ensure the quality of online learning opportunities.
The Board anticipates hiring consultants to conduct the work and through the findings, develop policies and practices to reduce the dropout rate of high school students and improve graduation rates. The State Board of Education appreciates your careful consideration of the request for a supplemental request of $150,000 for the science curricular menu review as well as its 2009-11 Decision Package of $820,000 for Leadership for Personalized Education. We believe that this work firmly supports the Governor’s Priorities of Government Result 1 to improve student achievement in elementary, middle, and high school. Based on our track record, we believe that we will provide a strong return for students on your investment. Cordially,
Mary Jean Ryan, Chair Attachments: Short Version of State Board of Education Strategic Plan FY 09 Supplemental Request 2009-11 Budget and Decision Package Request

DRAFT State Board of Education
Science Curriculum
Agency: 350 State Board of Education Budget Period: 2010-11 Recommendation Summary Text (Short Description): The legislature asked the Superintendent of Public Instruction (SPI) to present to the State Board of Education (SBE) recommendations for three basic science curricula at each school level. The legislature asked the SBE to provide official comment and recommendations about the curricula to the SPI by June 30, 2009. In order to accomplish this task, the Board is requesting $150,000 to procure the services of an independent consultant to assess the curriculum review process and conclusions reached by the SPI. Fiscal Detail
Operating Expenditures FY 2009 FY 2011 Total
General Fund 001-01 150,000 N/A 150,000
Total Cost
Staffing FY 2010 FY 2011 Annual Avg.
Total FTEs Requested 0 0 0
Package Description (Includes the following sections)
Background As part of the state’s efforts to strengthen science learning and improve the alignment of school district curriculum to the standards, the legislature asked the Superintendent of Public Instruction (SPI) to present, to the State Board of Education (SBE), recommendations for three basic science curricula at each school level. The legislature asked the SBE to provide official comment and recommendations about the curricula to the SPI by June 30, 2009. (RCW 28A.305.215)

DRAFT State Board of Education
Science Curriculum
Current Situation No money has been appropriated for the SBE to accomplish this legislative task. Proposed Solution In order to accomplish the task of providing official comment on the SPI science recommendations, the Board will require the services of an independent consultant to assess the curriculum review process and conclusions reached by the SPI.
Consultant services Contact person Edie Harding, Executive Director Narrative Justification and Impact Statement (Includes the following section) The Board expects that an independent consultant will provide an expert and neutral assessment of the OSPI work process and product, thereby giving the Board sufficient background and knowledge to offer official comment on the OSPI recommendations. Performance Measure Detail Completion of the report with sufficient detail to provide the information the SBE needs, to judge the quality of the OSPI recommendations. Completion of this task will support the Board’s strategy of strengthening science learning and curriculum alignment to the standards, in order to improve science achievement for all students. Improving student achievement is an explicit goal in the Board’s strategic plan. Reason for change: Money was not appropriated to accomplish the task. The Governor’s Washington Learns report called for Washington to adopt world-class math and science standards. Yes, this decision package makes key contributions to statewide results and would it rate as a high priority in the Priorities of Government process. This funding is needed to accomplish a legislative task given to the SBE.

DRAFT State Board of Education
Science Curriculum
Impact on Clients and Services None Impact on Other State Programs The Board needs to complete its assigned task in order to provide feedback to SPI so the work of the curriculum review can move forward. While $300,000 was appropriated for the SBE to review math and science standards, all funds will have been expended prior to review of the math and science standards. Over one-third of the $300,000 was spent to hire an independent consultant to review the math curricula. This approach worked well, and the SBE anticipates that a similar process will be essential to review the science curricula. The SBE does not have the depth of staff or Board expertise to make a determination about the adequacy of the process or product (i.e., curricula) that SPI will be recommending. The Board will not be able to provide an adequately informed judgment about the SPI recommendations. What is the relationship, if any, to the state’s capital budget? Not applicable What changes would be required to existing statutes, rules, or contracts, in order to implement the change? The SBE needs the funding to accomplish a task cited in RCW 28A.305.215 with a deadline of June 30, 2009. Expenditure and revenue calculations and assumptions: Our estimate of contract costs is based on our experience with the market rate when we hired a contractor to review the math curricula Revenue Calculations and Assumptions: Not applicable

DRAFT State Board of Education
Science Curriculum
Object Detail
FY 2009 FY 2011 Total
A Salary and Wages $0 $0 $0
B Employee Benefits $0 $0 $0
C Contracts $150,000 $0 $150,000
E Goods/Services $0 $0 $0
G Travel $0 $0 $0
J Equipment $0 $0 $0
N Grants $0 $0 $0
Interagency Reimbursement $0 $0 $0
Other $0 $0 $0
Total Objects $150,000 $0 $150,000
Expenditures & FTEs by Program
Activity Inventory Item
Prog Staffing Operating Expenditures
FY 2010
FY 2011
Avg FY 2010 FY 2011 Total
$0 $0 $0
$0 $0 $0
Total Activities
$0 $0 $0
Six-Year Expenditure Estimates
Fund 09-11 Total 11-13 Total 13-15 Total
$0 $0 $0
Expenditure Total $0 $0 $0
FTEs
Distinction between one-time and ongoing costs: The $150,000 represents a one-time cost needed to fulfill a specific legislative task. Budget impacts in future biennia: None

1
DRAFT State of Washington
State Board of Education Budget Request Decision Package Summary
Agency 350 State Board of Education Budget Period 2009-11
Decision Package Code
Decision Package Title
9BU001 Leadership to Enhance Personalized Education for High School Students or “Stop the Drop(out) Rate”

2
1. State of Washington
Recommendation Summary Agency: 350 State Board of Education Dollars in Thousands Annual Average General FTEs Fund State Other Funds Total Funds
2007-09 Current Biennium Total 7.0 1,895 0 1,895 Total Carry-Forward Level Percent Change from Current Biennium 0% 0% 0% 0% Carry Forward plus Workload changes 7.0 1,895 0 1,895 Percent change from Current Biennium 0 0% 0% 0% Total Maintenance Level 7.0 1,895 0 1,895 Percent change from Current Biennium 0% 0% 0% 0% Subtotal—Performance Level Changes 7.0 0 0 0 2009-11 Total Proposed Budget 0.0 820 0 820 Leadership on Personalized Education 0.0 820 0 820 Percent Change from current 0.0 43% 0% 43% 2009-11 Total Proposed Budget 7.0 $2,715 0% $2,715 Percent Change from Current Biennium 0% 43% 0% 43%

3
State of Washington
Summarized Revenue by Account and Source Budget Period: 2009-11
Dollars in thousands
350—State Board of Education Agency Level Supporting text included
Maintenance Level Performance Level Biennium Totals FY 2010 FY 2011 FY 2010 FY2011 FY 2010 FY 2011 Total State General Fund 947.5 947.5 410 410 1357.5 1357.5 2715

4
DRAFT State of Washington
Decision Package State Board of Education Leadership to Enhance Personalized Education for High School Students
“Stop the Drop(out) Rate” Agency: 350 State Board of Education Decision Package Code/Title: 9BU001 Budget Period: 2009-11
Recommendation Summary Text: Personalized Education for High School Students “Stop the Drop(out) Rate” The State Board of Education, in its most recent strategic plan added a new goal to improve graduation rates. The Board is concerned about the current trends in graduation rates, which show that in 2006 (the most recent OSPI data), the on-time graduation rates are 70.45 percent and the extended graduation rates are 75.1 percent. For different subgroups the picture is more dismal. The Board is charged by the legislature “to provide leadership in the creation of a system that personalizes education for all students and respects diverse culture, abilities and learning styles and promotes the achievement of the basic education goals,” (RCW 28A.305.130). During the upcoming biennium, the Board wants to focus on “why do students drop out and what are we going to do about it?” through its new goal of improving graduation rates. The Board believes that an investigation of strategies to make learning more personal for high school students can make a difference and stop the “falling through the cracks” syndrome. The Board also anticipates receiving information on the achievement gap from various commissions and wants to incorporate issues they identify in our strategies outlined below. The Board would propose creating strategies to improve graduation rates by exploring these issues:
A) Define the reasons students drop out of high school now, by reviewing the current literature and conducting projects in Washington State as well as to conduct a study on barriers perceived by students and their parents.
B) Determine how to operationalize competencies for high school credits. C) Examine ways to create a model of how alternative education could be
strengthened for students. D) Examine the current status of online learning in Washington and nationally to
determine what policies should be put in place to ensure the quality of online learning opportunities.
The Board anticipates hiring consultants to conduct the work and through the findings, develop policies and practices to reduce the dropout rate of high school students and improve graduation rates.

5
Fiscal Details $ in Thousands
Operating Expenditures FY 2010 FY 2011 Total
Enter Component Here 001-01 410 410 820
Total Cost
Staffing FY 2010 FY 2011 Annual Avg.
FTEs 0 0 0
Revenue
Fund Source FY 2010 FY 2011 Total
Total Revenue NA NA NA

6
State of Washington Decision Package
Leadership to Enhance Personalized Education for High School Students or “Stop the Drop(out) Rate”
Package Description: 1. Statement of the Problem and Opportunity:
The State Board of Education, in its most recent strategic plan, added a new goal to improve graduation rates. The Board is concerned about the current trends in graduation rates, which show that in 2006 (the most recent OSPI data), the on-time graduation rates are 70.45 and the extended graduation rates are 75.1%. For different subgroups the picture is more dismal.
2006 Data*
Group On-Time
Grad Rate Extended Grad Rate
All Students 70.4% 75.1%
American Indian 48.0% 54.0%
Asian/Pacific Islander 76.5% 80.5%
Black 53.6% 60.4%
Hispanic 57.5% 65.3%
White 74.1% 78.3%
ELL 55.5% 66.2%
Low Income 58.0% 64.8%
Special Education 54.3% 68.2%
Female 73.9% 78.0%
Male 67.1% 72.4%
*Most recent available from OSPI
While these data mirror national figures, they are still unacceptable. The Board believes that the education system must ensure that no student falls through the cracks. Through its accountability work as well as through its meaningful high school diploma work, the Board has begun to address the issues of student engagement through its innovative approach in CORE 24 (the Board’s graduation policy framework) of a career concentration, the use of competencies, and a high school guidance system focused both on the high school and beyond plan. Similarly, the Board’s approach to a performance system that tracks extended graduation rates as part of its accountability index. The Board is charged by the legislature “to provide leadership in the creation of a system that personalizes education for all students and respects diverse culture, abilities and learning styles and promotes the achievement of the basic education goals,” (RCW 28A.305.130). During the upcoming biennium, the Board wants to focus on “why do students drop out and what are we going to do about it?” through its new goal of improving graduation rates. The Board believes that an investigation of

7
strategies to make learning more personal for high school students can make a difference and stop the “falling through the cracks” syndrome. The Board also anticipates receiving information on the achievement gap from various commissions and wants to incorporate issues they identify in our strategies outlined below. 2. Plans for Examination of Personalized Education Issues The Board would propose creating strategies to improve graduation rates by exploring these issues:
A) Define the reasons students drop out of high school now, by reviewing the current literature and projects in Washington State and conducting a study on barriers perceived by students and their parents.
Washington’s push for excellence and high standards always creates a concern that students will leave the system, yet in fact, students drop out for many complex reasons that cannot easily be reduced to a single cause. Understanding better the myriad causes of dropout and barriers to student success will help to identify how the state can better support students throughout the K-12 system.
B) Determine how to operationalize competencies for high school credits
Washington allows students to earn competency-based credit but in practice, few districts have operationalized the policy. Competency-based credits offer students more flexibility to demonstrate their knowledge and skills without the constraints of seat-time limitations. Funding is sought to research the issue, convene experts from within and outside the state, and determine strategies for building capacity in this area in order to make competency-based credit more widely available.
C) Examine ways to create a model of how alternative education could be strengthened for all students
A recent study completed for OSPI on Washington’s Alternative High School initiative noted that Washington has not yet established a strong state vision of alternative education, and therefore, there is considerable variety in what falls under this general umbrella. Identifying the state’s focus and mission for alternative education would help guide future policy decisions and strengthen this important option for students.
D) Examine the current status of online learning in Washington and nationally to determine what policies should be put in place to ensure the quality of on line learning opportunities.
Many students and schools are attracted to the flexibility, access, and expanded curricular opportunities online learning provides. Many of the online opportunities are offered through the private sector—some in collaboration with school districts, and some not. Given the huge growth in online learning, a study that enables Washington to get ahead of the curve and determine what policies are needed to ensure quality education for our students is essential.

8
3. Funding package The Board will purchase the services of consultants to assist with this work. The average cost for each of these components will be approximately $205,000 per project. This figure is based on the average cost the Board has spent on projects with consultants over the past two years. The Board finds it beneficial to engage in the services of consultants using a competitive bid process. This allows for the purchase of expertise in a particular area, tailored to a specific project rather than hiring additional staff to conduct the studies. However, the Board will use its current funds to support its staff who will manage the projects, for the Board members to participate in work sessions associated with these projects, and public outreach.

9
DRAFT
State of Washington Decision Package
Narrative Justification and Impact Statement Package Description 1. Performance Outcomes
Based on the results of these projects, input from the public, and Board deliberations, the Board intends to develop policy guidance and practical ways that school districts can reduce their dropout rates and that more students will stay in school and graduate. Thus the Board would hope to see a 20% improvement in the extended graduation rates based upon the promotion of its work within five years.
Objectives for 2014 Improvements in
Extended Graduation Rates
Extended Grad Rate
Pct. Point Increase
80.1% 5.0%
63.2% 9.2%
84.4% 3.9%
68.3% 7.9%
72.2% 6.9%
82.6% 4.3%
73.0% 6.8%
71.8% 7.0%
74.5% 6.4%
82.4% 4.4%
77.9% 5.5%
2. Relation to the SBE Strategic Plan This decision package is directly related to the SBE’s new goal in its strategic plan to improve graduation rates. It is also related to the SBE’s goals for improving achievement for all students and for preparing all students for the opportunity to succeed in post-secondary education, the 21st century world of work and citizenship.
3. Support for the Governor’s Priorities of Government This decision package directly relates to the governor’s priority to improve student achievement in high school. If students are not in high school, they are unable to continue their learning and prepare for college and family wage jobs upon high school graduation.

10
4. Does this decision package make contributions to statewide results? Yes see #1 above for our plans to use this work to reduce dropouts and improve the graduation rates through more personalized learning opportunities.
5. Stakeholder Support The Board believes that all educators, parents, policy makers, business, and community leaders strongly support finding ways to keep more students in school to ensure they have the knowledge and skills they will need to be successful after high school in whatever path they choose.
6. Alternatives Explored The Board’s staff is small and has a full plate with its current work on accountability and high school graduation requirements. We have used funding from the Bill and Melinda Gates Foundation for projects in the last two years, but we believe that this work should be a state priority for funding as education in the paramount duty of the state.
7. Consequences of no funding Staff will be unable to conduct this work and we will continue to lose students that we could otherwise find ways for them to stay in school and gain skills and knowledge.
8. Relationship to State Capital budget None
9. Changes to existing laws or statutes? None 10. Expenditure calculations The SBE conducted the following policy related studies over the last two years. The average of all the costs was $205,500 so we are estimating each study at $205,000 knowing that some will cost a bit more and some a bit less.
Strategic Teaching (math standards and curricular review): $481,000
Mass Insight (Innovation Zone): $174,000
Heil and Associates (science standards review): $272,221
BERC and Associates (transcript study): $170,000
Northwest Regional Education Lab (Policy Barriers study) $81,000
Education First (end of course assessment study) $55,000
Thus we anticipate that the four proposed areas of study would cost $820,000, which is the amount we are requesting in our decision package.

11
11. Costs could be ongoing The Board anticipates in the future that it would do approximately two major studies each year related to its strategic plan and thus would like to incorporate this as ongoing funding.
12. Objects of Expenditure Object Detail FY 2010 FY 2011 Total
A Salary and Wages
B Employee Benefits
C Contracts $410, 000 $410,000 $820,000
E Goods/Services
G Travel
J Equipment
N Grants
Interagency Reimbursement
E Indirects
Total Objects $410,000 $410,000 $820,000

12
State of Washington Decision Package
Performance Measure Detail Activity Inventory Number: 9BU001
Activity Inventory Item Program FY 2010 FY 2011 Total
9BU001 $410,000 $410,000 $820,000
Output Measures FY 2010 FY 2011 Total
Develop policies and practices to improve the extended graduation rate
These would be developed for Board deliberation and action after studies are completed.

Chair- Mary Jean Ryan Vice Chair- Warren T. Smith Sr. Dr. Terry Bergeson, Superintendent of Public Instruction Dr. Bernal Baca Amy Bragdon Dr. Steve Dal Porto Steve Floyd Dr. Sheila Fox Phyllis Bunker Frank Austianna Quick
Linda W. Lamb Eric Liu Dr. Kristina Mayer John C. "Jack" Schuster Jeff Vincent Lorilyn Roller Edie Harding, Executive Director
(360) 725-6025 TTY (360) 664-3631 FAX (360) 586-2357 Email: [email protected] www:sbe.wa.gov
NEW STEM HIGH SCHOOL IN TRICITIES BACKGROUND: The STEM High School is a collaboration, between Battelle, Washington State University Tri-Cities, as well as the Richland, Kennewick, and Pasco School Districts. The school will be a small school that is highly personalized, attracts a broad spectrum of students, and immerses them in science, technology, engineering, and mathematics focused learning experiences. The team is creating an environment through partnerships that connect academic learning beyond the walls of the classroom. We want to teach and have students learn in a way that parallels how scientists, engineers, and mathematicians conduct inquires, solve problems, and expand knowledge. We want to prepare students for post-secondary education, careers, and citizenship. The school’s objectives are as follow:
Create new learning opportunities for a broad spectrum of students.
Use a model for teaching and learning that is research based, rigorous and relevant, and sustained through professional development plan.
Implement a performance-based curriculum that focuses on inquiry-centered, problem-based learning with cross-disciplinary connections, and relevant STEM learning experiences.
Engage all students through technology.
Use a student-centered teaching approach. We are in the planning stages of the project, with an anticipated opening date of August 2009. We have put together a core planning team (made up of educators, scientists and engineers, university faculty, and other community/industry partners) which are in the process of designing the core curriculum sequence and develop a supportive professional development plan. Other important points about this project include: The STEM school will not be designed solely for advanced science and math students, but will serve students from diverse socioeconomic backgrounds and interest areas throughout the Tri-Cities. Science literacy is not just about creating the next generation of scientists and engineers; and serving as a precursor to feeding the nation’s ‘innovation pipeline.’ Science literacy is needed by everyone who lives in today’s technological world. The STEM curriculum provides a strong academic foundation that can be used to solve complex problems, both inside and out of the scientific and technological realms.
OLD CAPITOL BUILDING.ROOM 253.P.O. Box 47206.600 S.E. WASHINGTON.OLYMPIA, WA 98504-7206
WASHINGTON STATE BOARD OF EDUCATION

Chair- Mary Jean Ryan Vice Chair- Warren T. Smith Sr. Dr. Terry Bergeson, Superintendent of Public Instruction Dr. Bernal Baca Amy Bragdon Dr. Steve Dal Porto Steve Floyd Dr. Sheila Fox Phyllis Bunker Frank Austianna Quick
Linda W. Lamb Eric Liu Dr. Kristina Mayer John C. "Jack" Schuster Jeff Vincent Lorilyn Roller Edie Harding, Executive Director
(360) 725-6025 TTY (360) 664-3631 FAX (360) 586-2357 Email: [email protected] www:sbe.wa.gov
The STEM school will be particularly appealing to students who seek a highly personalized, small-school approach to learning, where academic subjects are connected, and to students who wish to engage in learning beyond the school walls. The school will not be a competitor with current programs, but rather will be another option for Tri-Cities area students. The school will reinforce our community’s image as a science and technology center, perhaps contributing to economic development. We believe this school will serve as a model that could be replicated elsewhere in the state.
EXPECTED ACTION: None

Chair- Mary Jean Ryan Vice Chair- Warren T. Smith Sr. Dr. Terry Bergeson, Superintendent of Public Instruction Dr. Bernal Baca Amy Bragdon Dr. Steve Dal Porto Steve Floyd Dr. Sheila Fox Phyllis Bunker Frank Austianna Quick
Linda W. Lamb Eric Liu Dr. Kristina Mayer John C. "Jack" Schuster Jeff Vincent Lorilyn Roller Edie Harding, Executive Director
(360) 725-6025 TTY (360) 664-3631 FAX (360) 586-2357 Email: [email protected] www:sbe.wa.gov
SOCIAL STUDIES GRADE LEVEL EXPECTATIONS (GLES) &
OSPI’S TRIBAL SOVEREIGNTY UNIT: EFFORTS TO ENSURE THE TEACHING OF NATIVE AMERICAN HISTORY
INTRODUCTION OSPI has taken several steps recently to ensure that students have opportunities to learn about tribal history and governance. These steps, described briefly in this memorandum, will be discussed in more detail at the meeting, by Caleb Perkins, OSPI Social Studies and International Education Program Supervisor, BACKGROUND The State Superintendent formally adopted Social Studies Grade Level Expectations (GLEs). While these state standards focus primarily on big concepts and ideas that apply to all groups, there are several specific references to the tribes, tribal history, and treaties. For example, one of the GLEs for civics requires students to “understand and analyze the structure, organization, and powers of government at the local, state, and tribal levels, including the concept of tribal sovereignty. Specific social studies Essential Academic Learning Requirements (EALRs) and GLEs that reference Native American tribal issues can be found in Appendix A. Similarly, while none of the state-developed Classroom-Based Assessments (CBAs) in social studies require that students examine tribal governance or history, several provide opportunities for this learning. For example, the Constitutional Issues CBA could be used to study the issue of tribal sovereignty, and all of the history, geography, and economics CBAs could involve the study of tribes. Several CBAs ask students to compare the experiences of two groups. During the state pilot of these assessments, students often chose a local tribe to be one of the groups. In addition, OSPI has invested in the development of a sovereignty curriculum that is designed to help students understand sovereignty—the right to rule and govern your own people and territory—from the perspective of native peoples. A copy of the draft curriculum has been provided to the Board’s Tribal Lead, Dr. Bernal Baca, and will be available at the Board meeting for Board members to review.
OLD CAPITOL BUILDING.ROOM 253.P.O. Box 47206.600 S.E. WASHINGTON.OLYMPIA,
WA 98504-7206
WASHINGTON STATE BOARD OF EDUCATION

Chair- Mary Jean Ryan Vice Chair- Warren T. Smith Sr. Dr. Terry Bergeson, Superintendent of Public Instruction Dr. Bernal Baca Amy Bragdon Dr. Steve Dal Porto Steve Floyd Dr. Sheila Fox Phyllis Bunker Frank Austianna Quick
Linda W. Lamb Eric Liu Dr. Kristina Mayer John C. "Jack" Schuster Jeff Vincent Lorilyn Roller Edie Harding, Executive Director
(360) 725-6025 TTY (360) 664-3631 FAX (360) 586-2357 Email: [email protected] www:sbe.wa.gov
Appendix A
Social Studies Essential Academic Learning Requirements (EALRs) and Grade Level Expectations (GLEs) Pertaining to Native Americans
Social Studies EALR 4: HISTORY: "The student understands and applies knowledge of historical thinking, chronology, eras, turning points, major ideas, individuals, and themes of local, Washington State, tribal, United States, and world history in order to evaluate how history shapes the present and future." Social Studies Grade Level Expectations The history of Native Americans is introduced in the third grade, as per this description1 of the third grade learner: “In third grade, students begin to explore more complex concepts and ideas from civics, economics, geography, and history as they study the varied backgrounds of people living in Washington and the rest of the United States. Emphasis is on cultures in the United States, including the study of American Indians. Students examine these cultures from the past and in the present and the impact they have had in shaping our contemporary society. They begin to look at issues and events from more than one perspective.” The fourth grade is when study begins to deepen in civics and history: 4th Grade CIVICS GLE 1.2.1 - Understands that governments are organized into local, state, tribal, and national levels. 4th Grade CIVICS GLE 1.2.2 - Understands how and why state and tribal governments make, interpret, and carry out policies, rules, and laws. 4th Grade HISTORY GLE 4.1.2 - Understands how the following themes and developments help to define eras in Washington State history from time immemorial to 1889:
Growth of northwest coastal and plateau tribes prior to treaties (time immemorial to 1854).
Maritime and overland exploration, encounter, and trade (1774-1849). Immigration and settlement (1811-1889). Territory and treaty-making (1854-1889).
Study is revisited in seventh grade civics and history:
1 Social Studies Essential Academic Learning Requirements: A Recommended Grade-by-Grade Level Sequence for Grade Level Expectations—Grades K-12. Office of Superintendent of Public Instruction. June 2008.

Chair- Mary Jean Ryan Vice Chair- Warren T. Smith Sr. Dr. Terry Bergeson, Superintendent of Public Instruction Dr. Bernal Baca Amy Bragdon Dr. Steve Dal Porto Steve Floyd Dr. Sheila Fox Phyllis Bunker Frank Austianna Quick
Linda W. Lamb Eric Liu Dr. Kristina Mayer John C. "Jack" Schuster Jeff Vincent Lorilyn Roller Edie Harding, Executive Director
(360) 725-6025 TTY (360) 664-3631 FAX (360) 586-2357 Email: [email protected] www:sbe.wa.gov
7th Grade CIVICS GLE 1.1.1 - Understands how key ideals set forth in fundamental documents, including the Washington State Constitution and tribal treaties, define the goals of our state. 7th Grade CIVICS GLE 1.2.1 - Understands and analyzes the structure, organization, and powers of government at the local, state, and tribal levels including the concept of tribal sovereignty. 7th Grade HISTORY GLE 4.1.2 - Understands how the following themes and developments help to define eras in Washington State history from 1854 to the present:
Territory and treaty-making (1854-1889).
Railroads, reform, immigration, and labor (1889-1930).
The Great Depression and World War II (1930-1945).
New technologies and industries (1945-1980).
Contemporary Washington State (1980-present).
Study is revisited in twelfth grade civics: 12th Grade CIVICS GLE 1.2.3 - Analyzes and evaluates the structures of state, tribal, and federal forms of governments by comparing them to those of other governments.

Washington State Board of Education Meeting Dates and Locations for 2009-10
Revised
Proposed Dates/Locations for 2009 Proposed Dates/Locations for 2010
January 14-15
January 13-14
March 19-20
March 18-19
May 20-21
May 13-14
July 15-17 (15-16th Retreat, 17th Board Meeting)
July 14-16 (14-15th Retreat, 16th Board Meeting)
September 17-18
September 16-17
November 12-13
November 18-19

Chair- Mary Jean Ryan Vice Chair- Warren T. Smith Sr. Dr. Terry Bergeson, Superintendent of Public Instruction Dr. Bernal Baca Amy Bragdon Dr. Steve Dal Porto Steve Floyd Dr. Sheila Fox Phyllis Bunker Frank Austianna Quick
Linda W. Lamb Eric Liu Dr. Kristina Mayer John C. "Jack" Schuster Jeff Vincent Lorilyn Roller Edie Harding, Executive Director
(360) 725-6025 TTY (360) 664-3631 FAX (360) 586-2357 Email: [email protected] www:sbe.wa.gov
APPROVAL OF PRIVATE SCHOOLS FOR THE 2008-09 SCHOOL
YEAR BACKGROUND:
The schools herein listed, having met the requirements of RCW 28A.195 and are consistent with the State Board of Education rules and regulations in chapter 180-90 WAC, be approved as private schools for the 2008–09 school year. RECOMMENDATION:
Each private school seeking State Board of Education approval is required to submit an application to the Office of Superintendent of Public Instruction. The application materials include a State Standards Certificate of Compliance and documents verifying that the school meets the criteria for approval established by statute and regulations. A more complete description is attached for reference. Staff recommends approval of these schools. Enrollment figures, including extension student enrollment, are estimates provided by the applicants. Actual student enrollment, number of teachers, and the teacher preparation characteristics will be reported to OSPI in October. This report generates the teacher/student ratio for both the school and extension programs. Pre-school enrollment is collected for information purposes only. Private schools may provide a service to the home school community through an extension program subject to the provisions of RCW 28A.200. These students are counted for state purposes as private school students.
OLD CAPITOL BUILDING.ROOM 253.P.O. Box 47206.600 S.E. WASHINGTON.OLYMPIA, WA 98504-7206
WASHINGTON STATE BOARD OF EDUCATION