September 11 & 12, 2013 Wuksachi Lodge, Wuksachi Room...
67
September 11 & 12, 2013 Wuksachi Lodge, Wuksachi Room 64740 Wuksachi Way Sequoia National Park, CA 93262 September 11, 2013 Board Tour 1:00 – 5:00 PM Members of the Board and staff will participate in a field trip to explore issues and activities relevant to the Conservancy’s mission in the South Subregion. Members of the public are invited to participate in the field tour but are responsible for their own transportation and lunch. The tour will start in the main parking lot of the Wuksachi Lodge, 64740 Wuksachi Way Sequoia National Park, CA 93262. Reception 5:00 – 7: 00 PM Following the Board tour, Boardmembers and staff will attend a reception open to the public. The reception will be held at Wuksachi Lodge, Alta/Kaweah Rooms, 64740 Wuksachi Way Sequoia National Park, CA 93262. September 12, 2013 Board Meeting 9:00 – 1:00 PM (End time of the meeting is approximate) I. Call to Order II. Roll Call III. Approval of June 6, 2013 Meeting Minutes (ACTION) IV. Public Comments Provide an opportunity for the public to comment on non-agenda items. V. Board Chair’s Report VI. Executive Officer’s Report (INFORMATIONAL) a. Administrative Update b. Policy and Outreach Update c. 2013-14 Grant Program Update d. National Parks Service Presentation VII. Deputy Attorney General’s Report (INFORMATIONAL) VIII. 2012-13 Annual Report (ACTION) Staff will provide an overview of plans to produce the 2012-13 Annual Report. The Board may act to authorize staff to proceed with the production of the Annual Report.
Transcript of September 11 & 12, 2013 Wuksachi Lodge, Wuksachi Room...
September 11 & 12, 2013 Wuksachi Lodge, Wuksachi Room 64740 Wuksachi Way Sequoia National Park, CA 93262
September 11, 2013 Board Tour 1:00 – 5:00 PM Members of the Board and staff will participate in a field trip to explore issues and activities relevant to the Conservancy’s mission in the South Subregion. Members of the public are invited to participate in the field tour but are responsible for their own transportation and lunch. The tour will start in the main parking lot of the Wuksachi Lodge, 64740 Wuksachi Way Sequoia National Park, CA 93262.
Reception 5:00 – 7: 00 PM Following the Board tour, Boardmembers and staff will attend a reception open to the public. The reception will be held at Wuksachi Lodge, Alta/Kaweah Rooms, 64740 Wuksachi Way Sequoia National Park, CA 93262.
September 12, 2013 Board Meeting 9:00 – 1:00 PM
(End time of the meeting is approximate)
I. Call to Order
II. Roll Call
III. Approval of June 6, 2013 Meeting Minutes (ACTION)
IV. Public CommentsProvide an opportunity for the public to comment on non-agenda items.
V. Board Chair’s Report
VI. Executive Officer’s Report (INFORMATIONAL)a. Administrative Updateb. Policy and Outreach Updatec. 2013-14 Grant Program Updated. National Parks Service Presentation
VII. Deputy Attorney General’s Report (INFORMATIONAL)
VIII. 2012-13 Annual Report (ACTION)Staff will provide an overview of plans to produce the 2012-13 Annual Report. TheBoard may act to authorize staff to proceed with the production of the AnnualReport.
September 11-12, 2013 Board Meeting Agenda
IX. Fire Threat Systems Indicators Report (ACTION)
The Board will review the Fire Threat Indicators Report and may take action on the staff recommendation to approve it.
X. 2013-14 Budget/SNC Programs Discussion (INFORMATIONAL)
Staff will present information on the status of the 2013-14 budget and alignment of expenditures with Board direction.
XI. Updates on Various SNC Activities (INFORMATIONAL) a. Bioenergy Action Plan Implementation b. Sierra Nevada Geotourism MapGuide Project
XII. Boardmembers’ Comments Provide an opportunity for members of the Board to make comments on items not on the agenda.
XIII. Public Comments Provide an opportunity for the public to comment on non-agenda items.
XIV. Adjournment
Meeting Materials are available on the SNC Web site at www.sierranevada.ca.gov. For additional information or to submit written comment on any agenda item, please contact Mrs. Burgess at (530) 823-4672, toll free at (877) 257-1212; or via email at [email protected]. 11521 Blocker Drive, Suite 205, Auburn CA 95603. If you need reasonable accommodations please contact Mrs. Burgess at least five working days in advance, including documents in alternative formats.
Closed Session: Following, or at any time during the meeting, the Conservancy may recess or adjourn to closed session to consider pending or potential litigation; property negotiations; or personnel-related matters. Authority: Government Code Section 11126(a), (c) (7), or (e).
Board Meeting Minutes June 5 – 6, 2013 West End Theater 541 Main Street Quincy, CA 95971
I. Call to Order Board Vice-Chair Tom Wheeler called the meeting to order at 8:58 AM.
II. Oath of Office for New Boardmembers
Deputy Attorney General Christine Sproul administered the oath of office to the following incoming Boardmembers: Shasta County Supervisor Pam Giacomini (North Subregion), Mariposa County Supervisor Kevin Cann (South Central Subregion), and Jerry Bird, an alternate Boardmember from the U.S. Forest Service.
III. Roll Call
Present: Todd Ferrara, Este Stifel, Pam Giacomini, Bob Kirkwood, Byng Hunt, Tom
Wheeler, Sharon Thrall, John Brissenden, Bob Johnston, Kevin Cann, and Jerry Bird
Absent: BJ Kirwan, Ron Briggs, and Don Neubacher
IV. Approval of March 7, 2013 Meeting Minutes (ACTION)
There were no changes to the meeting minutes.
Action: Boardmember Brissenden moved and Boardmember Johnston seconded a motion to approve the March 7, 2013 meeting minutes. Boardmembers Giacomini and Thrall abstained from voting. The motion passed.
V. Public Comments
There were no comments from the public.
VI. Board Chair’s Report Board Vice-Chair Wheeler thanked everyone involved with the previous day’s field trip to the Feather River Community College fish hatchery and the Heart K Ranch, as well as the reception at the Heart K.
VII. Executive Officer’s Report (INFORMATIONAL)
The Sierra Nevada Conservancy (SNC) Executive Officer Jim Branham updated the Board on a number of SNC initiatives and activities. a. Outreach and Communications Update
Branham noted that Kerri Timmer had left the SNC for a job with the Sierra Business Council and that Angela Avery was promoted to fill Timmer’s position as manager of the Regional Policy and Programs Division.
Board Meeting Minutes June 5 – 6, 2013 Page 2 of 10
Avery said she is excited to lead the team and to develop opportunities to help communicate the value of the Sierra. The recently released Proposition 84 Grant Program Report highlights some of the successes of the program, and demonstrates what the Conservancy can do with funding vehicles, such as a state water bond or revenues from “cap and trade” auctions, should that funding become available. The report is available electronically on the SNC web site, and was mailed out to more than 100 people, including current and former SNC Boardmembers, California Natural Resources Agency Secretary John Laird, other California Conservancies, State legislators, key organizations and Tribes. In addition, the report will be presented in upcoming meetings with the boards of supervisors in the Sierra’s 22 counties. The report includes an interactive story-telling map, which outlines the watersheds of the Sierra. Avery added that there is an upcoming field trip being planned for Sierra legislators and their staff. Two more legislative field trips are being planned. Avery said the water bond is not faring well in public polls right now, but voter opinion might change if the state were to move into a drought.
On the issue of “Cap and Trade” auction revenue, Avery reported that in April the SNC provided comments to the California Air Resources Board about using these revenues for forest restoration in the Sierra. However, the Governor, in his May revision of the state budget, stated he is not ready to finalize the plan for spending those revenues. Avery said the Governor’s plan was to borrow $500 million from these revenues to help with State General Fund issues. Avery said next steps for the Regional Policy and Programs Division is to start working on the Annual Report and upgrades to the SNC web site. Branham added that there is a lot of uncertainty about the upcoming water bond and the Governor’s plans for the Delta. He says the SNC and the Board need to keep delivering the message that any water bond that does not include the watersheds is incomplete by definition. He urged the Board to continue to help make the connection. On the “Cap and Trade” auction revenue issue, Branham said he has met with Secretary Laird and his staff, and with Cal-EPA, with the assistance of Boardmember Bird. He added that forest management work has a very strong nexus to watershed health and carbon sequestration. Board Vice-Chair Wheeler said he believed it is more effective to meet directly with the legislative members themselves, rather than staff.
Board Meeting Minutes June 5 – 6, 2013 Page 3 of 10
Branham added that legislative tours the SNC is planning are the best way to do that. He added that Assembly Member Brian Dahle has been a champion of Sierra issues and would be organizing the upcoming tour.
Boardmember Cann said a recent water bond presentation to the California State Association of Counties’ Legislative Conference by a representative from the California Natural Resources Agency was not well received.
b. Administrative UpdateSNC Administrative Chief Theresa Parsley reported that there were no changes tothe SNC’s budget in the May revise, and that it appears furloughs will end with thecurrent fiscal year. Labor union talks are underway and results are expected byJuly 1.
Parsley reported that project #731 to the Sequoia River Lands Trust in TulareCounty has been withdrawn due to declining land values. The project’s grantaward of $347,000 was intended to support the acquisition of a conservationeasement in the White River Watershed. She added that staff has not yet enteredinto grant agreements for the two additional projects awarded by the Board inMarch:
• Greenhorn Creek Restoration Project by the Plumas Corporation; and,• Butte Creek Meadow Restoration Project, awarded to the Pit Resources
Conservation District in Lassen County.
Parsley said these two projects represent $636,000 in awards. If the SNC were ultimately unsuccessful in entering into grant agreements for these projects, those funds would be included in the next grant round. That would mean over $3 million would be available for the Healthy Forests and Abandoned Mine Lands grant program.
c. Proposition 84 ReportBranham announced the release of an interactive report, “Investing in California’sWatershed,” on the successes of the SNC’s Proposition 84 projects in the Sierra.The report features an interactive map and examples of a variety of projects. Hesaid The Nature Conservancy is working with SNC to make more improvements onthe map. Branham added that the issues surrounding the Delta are obscuring theneeds of the upper watershed in the Sierra.
Branham said the report has been well distributed, both electronic and hard copyversions. He said it is important to celebrate the SNC’s ability to disperse $50million in Proposition 84 funds thus far to valuable projects throughout the Sierra,and that it is a testament to SNC’s Staff, the Board, and partners in the Sierra.
Board Meeting Minutes June 5 – 6, 2013 Page 4 of 10
Boardmember Kirkwood added that the SNC has distributed those funds a lot faster than some other agencies have. Boardmember Brissenden asked for bullet points and contact information about each project to assist Boardmembers in their communications as they travel throughout the Region. Branham said he is looking forward to developing some of these tools because there is a long list of successful projects. Kirkwood asked if the videos can be placed on TV and what can be done to get major media outlets involved, like some larger agencies have. Branham said the SNC has been trying to get larger market media involved in telling the story but have not been successful to date.
Boardmember Johnston suggested working with the environmental and outdoor sports reporters with the San Francisco Chronicle and the Los Angeles Times, as well as the development of a strong press strategy. He added that a packet should be put together for each member of the Legislature. Branham said a packet has been developed for each Sierra legislator. Boardmember Hunt said the county supervisors on the Board have access to their local press and should be helping to carry the message. He asked for some small public relations pieces for Boardmembers to share with their local reporters. Branham said the SNC is beginning a tour to present to all 22 counties and will be looking for the supervisors‘ help. Board Vice-Chair Wheeler said the SNC needs to educate the masses, noting that the U.S. Forest Service is using corporate advertising partners. Branham said the SNC’s focus is to educate the people who are making the decisions in the Legislature, something that is more manageable. He added that educating 30 million Californians would be more difficult, and that more help is needed from some of the SNC’s larger partner agencies.
Branham acknowledged the attendance of former Plumas County Supervisor Robert Meacher, who has been a strong supporter of the issues of the upper watershed for many years. He indicated much of the work the SNC is undertaking builds upon Meacher’s past efforts.
Board Meeting Minutes June 5 – 6, 2013 Page 5 of 10
d. Federal Partner Presentation – U.S. Forest Service Boardmember Bird introduced Earl Ford, Forest Supervisor, Plumas National Forest.
Ford welcomed the Board to Plumas County. He said he has been in the Forest Service for 40 years, and this is the most exciting job he has had. He said the Feather River watershed has 35,000 square miles, making it one of the largest in the State. He noted that there are 20,000 people in Plumas County, but the area provides water for 15 million users. He provided a general overview of key issues facing the Plumas National Forest.
Branham took the opportunity to thank the Quincy Chamber of Commerce for the packet of information. He also acknowledged the attendance of John Sheehan who he said is among many in Plumas County who have been working on these issues for a long time, citing his work with the Quincy Library Group and Plumas Corporation.
VIII. Deputy Attorney General’s Report (INFORMATIONAL)
Deputy Attorney General Christine Sproul gave an update on proposed bills in the Legislature regarding California Environmental Quality Act (CEQA). The sweeping changes that were being proposed are going nowhere. One bill, SB731 (Steinberg) is moving forward. However, at this point there are few provisions moving forward that would have any significant impact on SNC. Wheeler said that information garnered from his recent visit with the Legislature in Sacramento also indicated that nothing was going to happen with CEQA this year.
IX. Waiver of Conflict Of Interest – State Coastal Conservancy Legal Services
(ACTION) The Board considered a waiver of potential conflict of interest related to an interagency agreement with the State Coastal Conservancy’s (SCC) for legal services.
Branham noted that the SNC does not have full-time legal counsel and intends to enter into an agreement with the SCC for legal services related to human resources, contracting, and other administrative matters. The Board action is a pro forma acknowledgment that the SNC is aware of a potential for a conflict of interest on any given matter in the future. While Branham noted that it is unlikely for such a conflict to occur, when an attorney wants to represent more than one client, current laws and rules require that both clients make such an acknowledgement. Branham said that the SCC Board had already taken such action.
Sproul said this waiver does not restrict either agency from working with their counsel in the Attorney General’s office to resolve actual conflicts of interest that may arise, adding that the Board is not waiving its right to deal with such conflicts. She noted
Board Meeting Minutes June 5 – 6, 2013 Page 6 of 10
that the staff recommendation is to authorize Branham to resolve any actual conflicts of interest should they arise. Boardmember Ferrara asked if the SCC represented other agencies. Parsley noted that the SCC is providing other administrative services to other conservancies, but the SNC would be the first to enter into an agreement for legal services. Boardmember Brissenden asked why we don’t use Ms. Sproul to provide these services. Sproul responded that she does not have as much expertise in administrative matters.
Action: Boardmember Kirkwood moved and Boardmember Hunt seconded a
motion to approve the Waiver of Conflict of Interest with the State Coastal Conservancy Legal Services and direct staff to enter into a contract and authorize the Executive Officer to execute the contract. The motion passed unanimously.
X. Proposition 84 Draft Grant Guidelines (ACTION)
Branham reviewed the Board packet and the public outreach process that has taken place. The amount of dollars available for this grant round will likely grow, as projects cannot be completed or fulfilled. Branham said this round would be a more ongoing, collaborative process, rather than a hard deadline for grant applications. He added the SNC would be more proactive in addressing the National Environmental Policy Act (NEPA) and California Environmental Quality Act (CEQA) issues on projects on federally managed lands. If the NEPA process has been completed, the SNC may undertake the additional analysis needed to meet CEQA requirements. Branham also reported that the SNC is developing a screening tool for staff use. Boardmember Bird said that recently the Lahonton Regional Water Quality Control Board used this same NEPA/CEQA streamlining process.
Boardmember Johnston asked how the “no-deadline” approach would work in the new grant round. Boardmember Kirkwood added that the new approach would reinforce the programmatic efforts of the SNC. Branham said the SNC has enough known partners with good projects to enable the distribution of these limited funds, so a single hard deadline would not be needed for this small amount of money.

Board Meeting Minutes June 5 – 6, 2013 Page 7 of 10
Public Comment: Izzy Martin, C.E.O. of The Sierra Fund, said this is a very creative grant program and applauded the inclusion of legacy mine cleanup. She said The Sierra Fund is working to bring attention to these issues, and is leading tours of the Yuba River Watershed, including one with Assembly Member Brian Dahle and other members of the Legislature in a few weeks.
Action: Boardmember Kirkwood moved and Boardmember Brissenden
seconded a motion to approve the 2013-14 Proposition 84 Grant Guidelines and direct staff to take necessary actions to implement the program. The motion passed unanimously.
XI. End-of-Year Report on 2012-13 Action Plan (INFORMATIONAL)
SNC Assistant Executive Officer Joan Keegan reported the SNC has made significant progress on most of the deliverables from the Action Plan, despite some of the challenges faced due to staffing and other issues. Keegan said the two initiatives where the SNC did not make significant progress in the past year are the Mt. Whitney Fish Hatchery and the Pacific Stewardship Council. The lack of progress was due to the constraints of our partners. She reviewed the highlights contained in the staff report.
Boardmembers Kirkwood and Wheeler complimented Keegan on a good report on a good year’s work. Boardmember Cann added his congratulations for setting short-term action plans and then following up on them, getting focused work done.
XII. 2013-14 Action Plan and Amendment to Strategic Plan (ACTION)
Keegan presented the proposed Action Plan for the 2013-14 fiscal year and recommended changes to the current Strategic Plan to incorporate Abandoned Mine Lands activities. Keegan reported that the SNC continues to pursue and receive input from throughout the Region. General feedback from the Region indicates people like what the SNC is doing. Keegan noted that the new Action Plan is organized somewhat differently. For example, Biomass Utilization now is its own initiative owing to the new roles defined for the SNC by the 2012 California Bioenergy Plan. She also reported that funding efforts have been weaved into other activities. The major change recommended is the addition of the Abandoned Mine Lands initiative to the Strategic Plan, recommended per direction from the Board at the last meeting.
Keegan asked the Board to approve the Action Plan and amendment to the SNC Strategic Plan. She highlighted activities identified in the staff report

Board Meeting Minutes June 5 – 6, 2013 Page 8 of 10
Keegan said this is an aggressive plan, but that preliminary workload analysis indicates the SNC can take on this workload. She noted that if this turns out to be more work than expected the plan may be scaled back, but that the Board will be kept informed of significant changes.
Boardmember Kirkwood said he believes the original purpose of the Abandoned Mine Land initiative was to reinforce natural upstream storage of water, however he has concerns that as it is currently written, it seems to indicate that the SNC would be doing work to maintain man-made dams in the upper watershed. He suggested changes to ensure that the work is focused on treating meadows and forests to increase water capacity and improve forest health through fuels reduction. Kirkwood indicated he would like to see changes made to clarify the actual intent of the program.
Branham said the SNC understands Kirkwood’s concerns and recommended approval of the item, while working with the Board on modifying the language.
Boardmember Wheeler noted that many reservoirs in the Sierra are full of sediment, which reduces storage, and that it is important for the SNC to work with agencies that own and operate reservoirs.
Kirkwood agreed, but added that where a dam operator benefits from sediment prevention or removal, there ought to be some payment for the restoration work being done upstream.
Boardmember Johnston suggested the language to read “reducing sedimentation in reservoirs and lakes.”
Boardmember Cann said he strongly supports the SNC moving forward as soon as possible with working on this issue. He said this component of the Action Plan is an issue that is exploding in his county, and the SNC can be a good catalyst to make progress.
Branham said the SNC would work on language that would satisfy the Board’s concerns that investment should be above the dams, while still allowing for the SNC to bring awareness of existing sedimentation in reservoirs.
Action: Boardmember Kirkwood moved and Boardmember Brissenden
seconded a motion to approve the 2013-14 Action Plan and to amend the current Strategic Plan, with modifications as discussed. The modified Strategic Plan will be distributed to Boardmembers. The motion passed unanimously.
XIII. Change of Grantees (ACTION)
The Board was asked to modify two previously authorized SNC Grants for purposes of changing the grantees.
Board Meeting Minutes June 5 – 6, 2013 Page 9 of 10
a. SNC 317 – Willow Creek Watershed Restoration Planning Project Action: Boardmember Hunt moved and Boardmember Brissenden seconded
a motion to approve the transfer of Grant SNC317 from Coarsegold Resource Conservation District to the Yosemite/Sequoia Resource Conservation and Development Council and direct staff to prepare appropriate documentation to the facilitate the transfer. The motion passed unanimously.
b. SNC 079 – Yuba River Wildlife Area – Rice’s Crossing Priority Acquisition Project
Action: Boardmember Thrall moved and Boardmember Hunt seconded a motion to approve the transfer of Grant SNC079 from The Sierra Fund to the Bear Yuba Land Trust and direct staff to prepare appropriate documentation to the facilitate the transfer. The motion passed unanimously.
XIV. Updates on Various SNC Activities (INFORMATIONAL)
a. Sierra Nevada Forest and Community Initiative (SNFCI) Branham said that throughout the Sierra, this Initiative has proven to be very fruitful. The collaborative group work continues and the SNC is helping to keep the momentum going for them. The SNC hopes to report at the next Board meeting in September about the different and more favorable pricing structure created through legislation last year. The Public Utilities Commission is working on this process now. Branham reported that at a meeting last week U.S. Regional Forester Randy Moore indicated that there has not been a single project in the Sierra Nevada in the past two years that has been litigated. In contrast, Siskiyou County has seen nearly every forest project has been blocked by litigation. Branham credited the success with Sierra Nevada projects to collaborative efforts, like those involved in SNFCI, strong leadership in the conservation community from Craig Thomas and Susan Britting with Sierra Forest Legacy, and others. He added that the pace and scale of forest management work in the Sierra needs to increase, and as it does, there always exists the possibility for more litigation.
Boardmember Kirkwood asked about the progress on the California Department of Forestry and Fire Protection’s Environmental Impact Report on vegetative management. He added that it is unlikely that the process will be of any value to the upcoming SNC grant program.
b. Mt. Whitney Fish Hatchery Update Mt. Whitney Area Manager Julie Bear reminded the Board that this effort began as a desire on the part of the former Director of the California Department of Fish and Wildlife (DFW) for DFW to transfer ownership of this property to another entity since it can no longer be operated as a hatchery. Operated currently by the
Board Meeting Minutes June 5 – 6, 2013 Page 10 of 10
Friends of the Mt. Whitney Fish Hatchery, Bear said that the facility is a cherished site for Inyo County residents both because of its historic significance and as a community resource. The SNC continues to explore the potential to accept ownership of the property on a temporary basis in order to facilitate a transfer of the property to Inyo County, should such a transfer align with the SNC’s mission and meet all DFW and other State requirements. Bear said Inyo County has hired a new person who will be facilitating this process on behalf of the county. SNC will help to continue the flow of information and monitor and assist with the process. Boardmember Hunt stated that this is another example of how the SNC has helped to facilitate important issues in the Region. Boardmember Stifel asked if the property would come without strings attached. Branham said that there would be constraints on future use as defined by the DFW and that the SNC would need to assure that future use would align with our mission before a transfer could occur.
XV. Boardmembers’ Comments
Boardmember Bird thanked the Board for the opportunity to participate in the meeting. He noted that the tour and the events of the previous day were great. He said the U.S. Forest Service is still taking comments on its “Leadership Intent for Ecological Restoration” plan and expects it will be finalized next year. He invited comments from the public and the Board.
XVI. Public Comments
There were no comments from the public.
XVII. Adjournment Board Vice-Chair Wheeler announced the next meeting will be in September in Tulare County and adjourned the meeting at 11:00 AM.
Sierra Nevada Conservancy Agenda Item VI a September 12, 2013 Administrative Update Background In this new fiscal year, Sierra Nevada Conservancy (SNC) Staff are looking forward to new opportunities, priorities and challenges. The Regional Policy and Programs Division is considering its new opportunities as it welcomes its newest member, Nic Enstice. Mr. Enstice has worked with SNC previously as a student and as a consultant, assisting with the Sierra Nevada Forest and Community Initiative and the Mokelumne Watershed Environmental Benefits initiatives. Current Status – Grants Administration Along with completing final grant agreements for the 2012-13 grant round and assisting area staff with amendments and management of current agreements, Grants Administration (GA) staff are busy creating and updating various grant-related policies and procedures. In addition to these updates, staff have completed the first draft of the SNC Grants Operations Manual, which documents important aspects of the grant program as it has developed over the course of the distribution of bond funds received to date. This Manual, along with the policies and procedures being completed, help to ensure consistency in grant development and management over time, and will keep SNC’s grant program in compliance with the Bond Accountability and Audits Guide developed by the California Natural Resources Agency, the Department of Finance (DOF) and the Office of State Audits and Evaluations. In addition, SNC has received notice from DOF of a new grantee audit, for the Sierra Nevada Alliance, Grant 070020. This is a closed and completed grant project that was approved in 2007-08. SNC has participated in prior DOF audits of five grantees, as well as an audit of its overall Proposition 84 grant program. To date, we are pleased that no significant issues have been raised relative to the SNC’s administration of the grant program. Current Status – Budget Although all of the final reports have not yet been received, the SNC 2012-13 budget was successfully closed at the end of June 2013. There were no surprises in the final budget for Fiscal Year 2013-14. Funding was provided from the Environmental License Plate Fund (ELPF) and Proposition 84 for SNC’s overall support budget of $4.744 million. A summary of SNC’s budget over the years is included in Agenda Item X. Current Status – Human Resources As of July 1, 2013, SNC staff are operating under new labor contracts that have provided a guarantee of no new furloughs for the next two years, along with a wage increase and various miscellaneous benefits. Also at the beginning of the fiscal year, SNC’s personnel transactions support smoothly moved from the Franchise Tax Board to the Department of Forestry and Fire Protection (CAL FIRE). These services are provided through an Interagency Agreement with CAL FIRE.
Sierra Nevada Conservancy Agenda Item VI a September 12, 2013 Administrative Update Page 2 Current Status – Information Technology Planning is underway to complete SNC’s 2013-14 Agency Information Management System report. This report will tie IT goals, activities and accomplishments to SNC’s Strategic Plan and current annual Action Plan. Major IT activities for 2013-14 include transition to consolidated e-mail services and upgrades to SharePoint and Microsoft Office. IT staff will also create and deploy SNC’s first external SharePoint site, allowing for easier and more efficient document and information collaboration with external SNC partners. Current Status – Facilities After several false starts and delays, Mariposa staff will have a new home in late September or early October. The new office is located on 4988 11th Street, about a block from Highway 140 at 11th Street. Staff is anxiously awaiting scheduling by the Department of General Services of the final walk through and move-in dates. Recommendation This is an informational item only; no formal action is needed by the Board at this time, although Boardmembers are encouraged to share their thoughts and comments.
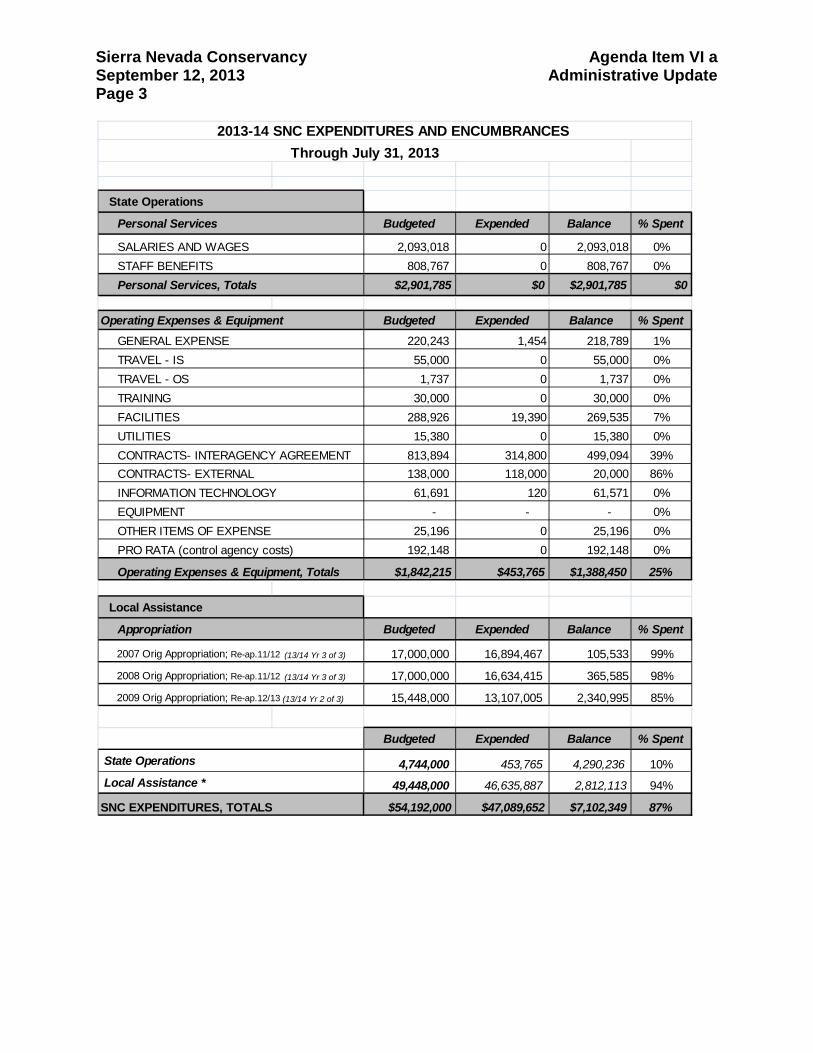
Sierra Nevada Conservancy Agenda Item VI a September 12, 2013 Administrative Update Page 3
Budgeted Expended Balance % Spent
2,093,018 0 2,093,018 0%808,767 0 808,767 0%
$2,901,785 $0 $2,901,785 $0
Operating Expenses & Equipment Budgeted Expended Balance % Spent220,243 1,454 218,789 1%55,000 0 55,000 0%1,737 0 1,737 0%
30,000 0 30,000 0%288,926 19,390 269,535 7%15,380 0 15,380 0%
813,894 314,800 499,094 39%138,000 118,000 20,000 86%61,691 120 61,571 0%
- - - 0%25,196 0 25,196 0%
192,148 0 192,148 0%
$1,842,215 $453,765 $1,388,450 25%
Budgeted Expended Balance % Spent
17,000,000 16,894,467 105,533 99%
17,000,000 16,634,415 365,585 98%
15,448,000 13,107,005 2,340,995 85%
Budgeted Expended Balance % Spent
4,744,000 453,765 4,290,236 10%
49,448,000 46,635,887 2,812,113 94%
$54,192,000 $47,089,652 $7,102,349 87%
Local Assistance
OTHER ITEMS OF EXPENSE
2007 Orig Appropriation; Re-ap.11/12 (13/14 Yr 3 of 3)
2008 Orig Appropriation; Re-ap.11/12 (13/14 Yr 3 of 3)
SNC EXPENDITURES, TOTALS
Appropriation
2009 Orig Appropriation; Re-ap.12/13 (13/14 Yr 2 of 3)
State Operations
Local Assistance *
INFORMATION TECHNOLOGY
TRAVEL - ISTRAVEL - OSTRAINING
Operating Expenses & Equipment, Totals
FACILITIESUTILITIES
PRO RATA (control agency costs)
CONTRACTS- EXTERNALCONTRACTS- INTERAGENCY AGREEMENT
EQUIPMENT
GENERAL EXPENSE
2013-14 SNC EXPENDITURES AND ENCUMBRANCES
State Operations
Personal Services
SALARIES AND WAGES STAFF BENEFITS Personal Services, Totals
Through July 31, 2013
Sierra Nevada Conservancy Agenda Item VI b September 12, 2013 Policy and Outreach Update
Background At previous meetings, the Board directed Sierra Nevada Conservancy (SNC) Staff to take appropriate actions to increase awareness about the importance of the Sierra Nevada Region to the State’s environmental and economic health and well-being. Since that time, staff has been conducting a variety of outreach activities to ensure that the upper watersheds of the Sierra Nevada are considered appropriately in water bond funding and other activities and discussions relating to funding and policy. Current Status On Friday, June 20th SNC, The Sierra Fund, and Assembly Members Brain Dahle and Richard Gordon’s office conducted a tour of forest and abandoned mine lands projects in Placer and Nevada Counties. Assembly Members Dahle and Gordon, were joined by their Assembly colleagues Wes Chesbro, and Mark Levine, as well as staff from Assembly Members Frank Bigelow and Steven Bradford’s offices. Tour stops included the American River Shaded Fuelbreak in Auburn, the Combie Reservoir mercury removal project (both of these projects included funding from the SNC), and the Empire Mine in Grass Valley. As a result of the tour, Assembly Members Dahle and Gordon agreed to co-author an Op-Ed detailing the importance of the Sierra Nevada to the rest of California. The Op-Ed ran in the Grass Valley Union on August, 23, 2013 (Attachment A). On Friday, July 26th SNC hosted a tour of the Mokelumne River Watershed for a group of six legislative staff members and a representative of the Department of Finance. These staff members represented the offices of Assembly Member Bigelow and Assembly Member Bloom, the Assembly Water, Parks, and Wildlife Committee, the Assembly Republican Office of Policy, and the Assembly Natural Resources Committee. The purpose of this tour was to give staff members an on-the-ground look at the water source for 1.3 million East Bay residents, provide an opportunity to learn about the possible impacts that large catastrophic wildfires can have on a water source, and demonstrate the types of projects that can prevent or lessen those impacts. Tour stops included Pardee Reservoir where East Bay Municipal Utility District draws their water, Lower Bear Reservoir where water storage begins, and the Power Fire burn area where a large damaging fire has already set sedimentation in motion. In July, Assembly Member Anthony Rendon, Chair of the Water, Parks and Wildlife Committee, and the Assembly Water Bond Working Group (Working Group), released a set of proposed Principles for Developing a Water Bond (Principles) (Attachment B). SNC provided comments to the Working Group encouraging them to consider modifications to the Principles to ensure that discussions about California’s water future are more holistic. We encouraged the Working Group to add upper watershed work to promote water reliability and protect existing storage capacity and water quality for the entire state – including forest and meadow restoration, reduced sedimentation and water quality improvements such as mercury remediation. SNC also provided assistance to a Sierra coalition in drafting and sending comments on the Principles
Sierra Nevada Conservancy Agenda Item VI b September 12, 2013 Policy and Outreach Update Page 2 (Attachment C). The coalition, headed by Mountain Counties Water Resources Association, was composed of eight additional partner organizations including California Forestry Association, California Rangeland Trust, The Nature Conservancy, Pacific Forest Trust, Sierra Business Council, Sierra Institute, Sierra Cascade Land Trust Council, and The Trust for Public Land. Staff is also working with partners to schedule a series of meetings in August and September with legislators and their staff including: Assembly Member Rendon, Senators Wolk, Pavley, Berryhill, and others. These meetings will focus on the critical need to address source watersheds in any water bond or solutions to California’s water future. By the time of this meeting, the Great Sierra River Cleanup will be just over a week away. Legislative outreach efforts for the event yielded a total of thirteen legislative co-chairs including: Senators
• Jean Fuller (R – Bakersfield) • Ted Gaines (R – Rocklin) • Fran Pavley (D – Agoura Hills) • Lois Wolk (D – Davis)
Assembly Members
• Luis Alejo (D-Salinas) • Connie Conway (R – Tulare) • Beth Gaines (R – Roseville) • Richard Gordon (D – Menlo Park) • Adam Gray (D – Merced) • Jim Patterson (R – Fresno) • Henry Perea (D – Fresno) • Ken Cooley (D – Rancho Cordova) • Kristin Olsen (R – Modesto)
As co-chairs, these representatives agreed to assist with SNC outreach efforts by letting their constituents know about the event and agreed to be listed as Cleanup supporters in SNC promotional materials. Additionally, we opened an Instagram account to help promote the Cleanup. Staff is utilizing this social media tool to connect with potential volunteers by sharing photos of our beautiful Region, as well as photos of past cleanup efforts.
Sierra Nevada Conservancy Agenda Item VI b September 12, 2013 Policy and Outreach Update Page 3 Next Steps Staff is working with partners to finalize plans for an informational event in late October. The purpose of the event is to inform legislators and their staff about the value of investing in forest restoration as opposed to dealing with the impacts to a water source from a large intense fire. Details of the event are still being confirmed, but the intent is to focus on the forest/fire/water connection with the goal of sharing some of the results from the Mokelumne River Watershed Avoided Cost Analysis and research relating to forest conditions and water yield. Staff is also coordinating with staff to the California State Assembly Committee on Natural Resources and The Sierra Fund to organize a January, 2014 legislative oversight hearing with the goal of educating legislators about abandoned mine lands and the need to address the associated legacy mine issues which pose a significant threat to public health. Additionally, SNC is working to organize our first legislative tour in the eastern portion of the SNC Region in September. The goal of this tour is to bring Los Angeles legislators to the area that this is the source of a significant amount of Los Angeles’ water supply, educating them about activities that are taking place to protect their watershed. Additionally, we are working with Assembly Member Bigelow’s office to arrange for the Assembly Member and his staff to visit SNC funded projects in his district. SNC will continue to work with The Nature Conservancy to develop a detailed interactive map designed to connect Legislators to the watersheds that provide their water. This effort will kick off between now and the end of the year, which is a little bit later than originally reported. In the meantime, staff will continue to work with partners to identify new opportunities to meet with key decision makers and provide input into the efforts that will result in investment in the important work needed in our Region. And, we will continue to engage partners and sister agencies to create opportunities to communicate the value and benefits investment in the Region provide to the rest of the State. Recommendation This is an informational item only; no formal action is needed by the Board at this time, although Boardmembers are encouraged to share their thoughts and comments.
Sierra Nevada Conservancy Agenda Item VI c September 12, 2013 2013-14 Grant Program Update Background In June 2013, the Sierra Nevada Conservancy (SNC) Governing Board approved Grant Guidelines for the Grant Round beginning in fiscal year 2013-14. This grant round will be SNC’s final awards using funding from the Proposition 84, Safe Drinking Water, Water Quality and Supply, Flood Control, River and Coastal Protection Bond Act of 2006 (Proposition 84). The Grant Guidelines from this round identified that in addition to complying with Proposition 84 requirements and SNC’s mission and program goals, projects will need to meet established criteria in the focus areas of Healthy Forests and Abandoned Mine Lands. As a reminder, this round has no final application due dates. Applicants may contact SNC Staff at any time while funding remains and staff will work with potential applicants to develop project proposals. All proposals will be evaluated by a SNC internal evaluation team, with assistance from technical experts (during this round, staff may notify potential applicants that their project will not likely score highly enough to be recommended). In those instances, a full proposal will not be invited and the potential applicants will be provided an explanation to support this decision. Those projects that will provide the greatest benefit by meeting identified evaluation criteria will be presented for Board approval. Staff will present projects at each Board meeting until funding is exhausted. Current Status Funding available is estimated at approximately $2.8 million, a $200,000 increase from our June estimate, based on a number of factors resulting from closing of projects.
Staff released public notification of this Grant Round on June 27, 2013. Since that time, staff has been busy working with potential applicants to determine the eligibility and readiness of their projects. As of the posting date of this report, up to 30 projects had been identified at different levels of development, potentially requesting more than $10 million in funding. Staff expects to bring the first set of project recommendations forward for Board action in December, 2013. For this round, staff expects the number of projects presented to the Board at any given meeting to be much smaller than in the past. This provides an opportunity for Boardmembers to review any or all projects being evaluated. Staff do not anticipate using Board Subregional committees as in the past, however will make certain that Subregional representatives are aware of proposed projects in their Subregion. It should be noted that, with these limited funds and such a great need for work and investment throughout the Sierra Region, staff are making significant effort to find and leverage other sources of funding. As part of this final Grant Round, SNC is working with the Wildlife Conservation Board as they administer their Proposition 84 funded Forest Conservation Program, identifying Sierra projects that may qualify for award of these funds and notifying applicants of its availability. Staff is also coordinating with the California Conservation Corps (CCC) on potential use of CCC crews for projects.

Sierra Nevada Conservancy Agenda Item VI c September 12, 2013 2013-14 Grant Program Update Page 2 Recommendation This is an informational item only; no formal action is needed by the Board at this time, although Boardmembers are encouraged to share their thoughts and comments.
Sierra Nevada Conservancy Agenda Item VIII September 12, 2013 2012-13 Annual Report
Background The Sierra Nevada Conservancy (SNC) is required by statute, Public Resource Code Section 33350, to “make an annual report to the Legislature and to the Secretary of the Natural Resources Agency regarding expenditures, land management costs, and administrative costs.” In the early years of the SNC, the annual report was produced as an expanded education and outreach tool. In more recent years, due to budget and operational constraints, the Annual Report has been scaled down in scope while still satisfying legislated requirements and providing an overview of key activities. Current Status Staff is in the process of producing another scaled-down, in-house Annual Report for FY 2012-13. The report, which will be four to six pages in length and designed primarily for electronic distribution, will fulfill statutory requirements while highlighting projects and activities that demonstrate and support the need for investment in upper watersheds. The Annual report and the recently released Proposition 84 Report ‘Investing in California’s Watershed’ will complement one another and staff can use both reports together in future outreach efforts. Proposed Outline:
• A word from the Executive Officer – linking FY 2012-13 activities to current outreach and messaging and activities
• Video – Revised ‘Who is the SNC?’ • The Sierra Delta Connection – including
o Investment in our “natural infrastructure” o Great Sierra River Cleanup o Abandoned Mine Lands
• Healthy Forests - including o Sierra Nevada Forest and Community Initiative o Mokelumne River Environmental Benefits Program o Forest Bioenergy
• Budget and Fiscal information • Grant Program Information
o Awarded amount 2012-13 o Closed out projects o Awarded amount by year
Next Steps Staff will draft the Annual Report as described above and will complete design, layout, and illustrations in-house. Graphics may include budget charts or graphs and a small number of photos. With Board concurrence, staff will prepare the Annual Report and distribute it appropriately. Anticipated distribution and posting on the SNC Web site is October 31, 2013.

Sierra Nevada Conservancy Agenda Item VIII September 12, 2013 2012-13 Annual Report Page 2 Recommendation Staff recommends the Board approve the proposed approach for completing the 2012-13 Annual Report and direct staff to develop and distribute the report.
Sierra Nevada Conservancy Agenda Item IX September 12, 2013 Fire Threat Systems Indicator Report
Background The Sierra Nevada Conservancy (SNC) 2006 Strategic Plan identifies the need to develop System Indicators to measure progress in improving the environmental, economic, and social well-being of the Sierra Nevada Region. Since that time, staff has worked diligently to overcome data limitations and other obstacles in order to develop a set of Indicator Reports that include all of the nineteen Board approved Indicators. While staff previously reported to the Board that there would be five Indicator reports, further analysis suggested that a sixth report - the one presented today - was needed to deal comprehensively with data related to fire threat within the entire Region. Therefore, the six reports are:
• Demographics and the Economy • Land Conserved and Habitat • Water and Air Quality and Climate • Forest Health and Carbon Storage • Fire Threat • Agricultural Lands and Ranches
The first report on Demographics and the Economy was presented at the September, 2011 Board meeting. The second report on Land Conservation and Habitat was presented at the December, 2011 Board meeting. The third report on Water and Air Quality and Climate was presented at this September, 2012 Board meeting. The fourth report on Forest Health and Carbon Storage was presented at the December, 2012 Board meeting. This fifth report on Fire Threat is being presented at this September, 2013 Board meeting. Current Status There is important linkage between this Fire Threat report and the previously produced Forest Health and Carbon Storage report. Therefore, some fire-related information is included in the report on Forest Health, while references to the Forest report is contained in this Fire Threat report. This report extends the discussion beyond forest to provide a comprehensive set of data on fire threat that addresses the threat not only to forest lands within the Sierra, but agricultural lands and communities as well. Fire Threat Indicators Report This fifth report includes Indicators related to Fire Threat on all lands within the 25 million acre SNC Region. Three Indicators have been developed for this report, two of which utilize already established data and methodology, and one (burn severity) for which data is not yet available but is in the process of being developed. The three Indicators are:
• Number of Acres by Fire Threat Class • Number of Acres that Burn Annually • Acres Burned by Severity
Sierra Nevada Conservancy Agenda Item IX September 12, 2013 Fire Threat Systems Indicator Report Page 2 These indicators will be tracked for the entire SNC Region, plus as a subset for the Wildland Urban Interface (WUI) lands. Report Highlights Fire Threat For purposes of this report the SNC is using the definition of fire threat developed by CALFIRE’s Forest Resources Assessment Program (FRAP): “Fire Threat is a measure of fire hazard that includes components for both probability (chance of burning) and the nature of the fire (fire behavior). Taken collectively, these two features assess the basic threat features of periodic wildfires and their capacity to drive fire effects. It is important to understand that fire threat carries no direct measure of fire effects and associated value change associated with fire risk.” Fire threat is categorized from extreme to low. For this report, we have grouped the extreme, very high, and high classes together into a ‘High and Above’ class and left the moderate and low classes separate.
• The threat of major fire events is a constant in the Sierra Nevada and its foothills. More than two-thirds of the SNC Region (17.5 million acres) is classified as High and Above fire threat, compared to just less than half of the state as a whole.
• All Subregions have at least two-thirds of the area in the High and Above fire threat, with the exception of the East Subregion which has just under half of the area in that category. The North Subregion has the most amount of land in High and Above fire threat – 4.8 million acres (76 percent of the land area), while the North Central Subregion has the highest percentage in the High and Above category, with 78 percent.
• Sixty-four percent of federal land is in High and Above fire threat, while 78 percent of private land is classified as High and Above.
Fire History The number of large fires, and the acreage burned, varies greatly from year to year, primarily due to specific weather conditions. Nonetheless, tracking this information over time will provide important trend information.
• To meet the tracking criteria of this System Indicators report, fire data only extending back to 1998 was used. This short time frame can’t substantiate a clear trend of increasing number acres burned annually, though 2008 and 2012 were two of the biggest fire years in recorded history. Other studies do support increasing high-severity fire size and increasing acres burned annually since 1980.
• While about 60 percent of the SNC Region is in federal management, 75 percent of area burned between 1998 and 2012 was on federal land.
Fire in the Wildland Urban Interface The majority of human occupation and development within the SNC Region is classified as Wildland Urban Interface (WUI). For this report, the definition of WUI comes from FRAP: WUI is based on housing density where there are no more than 2 homes (units) per acre and no less than 1 house per 40 acres.
Sierra Nevada Conservancy Agenda Item IX September 12, 2013 Fire Threat Systems Indicator Report Page 3
• Six and one-half percent of the SNC Region land area (1.65 million acres) is classified as WUI. The Central Subregion accounts for 39 percent of the Region’s WUI, and 25 percent of the Central Subregion land area is WUI.
• Eighty-four percent of the WUI is in High and Above fire threat, ranging in a north-to-south trend from 66 percent in the North Subregion to 94 percent in the South Subregion. Only 49 percent of East Subregion WUI is in High and Above fire threat.
• Wildfire in the WUI accounts for a small proportion of total fire in the Region, about one to three percent of total area burned in most years since 1998. In most years, 90 to 99 percent of WUI fire is on land classified as High and Above fire threat. Particularly in years where WUI experiences a large amount of fire, much of that fire is in oak woodland.
Fire Severity Complete elimination of severe wildfire is not desirable, but current forest conditions lead to large fires dominated by high severity burning with unwanted consequences. Varying levels of burn severity within a fire help create or maintain a mosaic of ecosystem habitats and corridors, but when large areas burn with high severity it not only destroys or eliminates critical habitat but creates erosion and water problems as well, and provides for the introduction of non-native and invasive species further changing the habitat from the pre-fire regime. Low intensity fires tend to remove fuel and thin vegetation and generally reduce competition for nutrients and water and reduce insect and disease populations.
• It would be hugely useful to comprehensively document the severity of fire in the Sierra and foothills. Methodology is being developed to be able to characterize and track fire severity in the future.
Next Steps The data in this report, along with the methodologies and frameworks that have been, and will be, developed, will allow consistent tracking of wildfire threats and impacts over time. Information relative to these indicators will be available on the SNC Web site and will be updated periodically as the underlying data is updated. In addition to providing information relevant to the administration of SNC’s programs throughout the Sierra Nevada Region, we hope that this information will also be useful to others located in or working in the Region, including other State agencies, as they develop and implement their own projects and programs. Recommendation Staff recommends the Board approve the Fire Threat System Indicators Report after making any revisions resulting from its review.
System Indicators
DRAFT REPORT September 2013
Fire Threat
Lead Author
Mark Stanley, Consultant, Sierra Nevada Conservancy
GIS data development and spatial analysis by
Steve Beckwitt, Consultant, Sierra Nevada Conservancy
Table of Contents Introduction ........................................................................................................... 2 Highlights ............................................................................................................... 4 Indicators:
Number of Acres by Fire Threat Class ...................................................................................... 6
Number of Acres that Burn Annually ..................................................................................... 11
Number of Acres by Fire Threat Class and Number of Acres that Burn Annually Within the Wildland-Urban Interface (WUI) ................................................ 14
Acres Burned by Fire Severity ................................................................................................... 22
Conclusion ........................................................................................................... 24 Appendices .......................................................................................................... 25
1
Introduction This fifth report in the System Indicators series examines fire threat across the entire 25 million acres in the Sierra Nevada Region. The Forest Health and Carbon Storage Indicator report looked at wildfire from a forest health perspective, and only analyzed wildfire relative to the approximately 10.5 million acres of ‘productive’ forest land in the Region. Some of the information on wildfire included in the Forest Health and Carbon Storage report is also referenced in this report within the broader geographic framework.
As covered in the Forest Health and Carbon Storage Indicators report, overall long-term ecosystem health cannot be discussed without considering both the potential negative and positive impacts from fire. Fire has, and always will be, present in California. It is generally accepted that fire is a natural part of California’s ecosystem and for many animal species and vegetation types, fire is necessary in order to maintain those species or the habitats they are dependent on. Fire intensity, size, and location are some of the factors that affect the level of disturbance and potential long term damage, and therefore long term health of natural systems.
However, the characteristics of fire in the Sierra are very different today than prior to European settlement more than 150 years ago, when mostly low-severity fire was a frequent occurrence on the landscape and helped to maintain forest health by thinning out small trees, removing fuel accumulations, and reducing major insect and disease events. A combination of over 100 years of human encroachment into the wildlands and fire suppression led to a drastic reduction in natural fire on the landscape and changed the character of the forest, much of which has filled in with heavy undergrowth which is now much more prone to high severity fire. The past few decades have seen a significant increase in the size of high-severity fires and the acreage subjected to catastrophic burn. Both ecosystems and human infrastructure are at increased risk.
What is “Fire Threat”?
For the reader to understand this report, it is critical that the meaning and implications of “Fire Threat” are clearly understood, and how it is different than risk. Different agencies define and analyze Fire Threat differently. For this report, the definition provided by the California Department of Forestry and Fire Protection (CAL FIRE), Forest Resource Assessment Program (FRAP) will be applied throughout.
According to FRAP, “Fire Threat is a measure of fire hazard that includes components for both probability (chance of burning) and the nature of the fire (fire behavior). Taken collectively, these two features assess the basic threat features of periodic wildfires and their capacity to drive fire effects. It is important to understand that fire threat carries no direct measure of fire effects and associated value change associated with fire risk.” This could be simplified as the possibility of a fire occurring based on the history of fire occurrence and the potential damage based on the behavior a fire may exhibit.
2
This report does not address Fire Risk, which is a measure of expected damage from fire to assets (both natural and economic) that hold value to society. Rather, this Indicator report establishes several measures of Fire Threat that can be tracked accurately and repeatedly over time to assist in policy decisions and actions related to the occurrence, size, and impacts of wildfire in the Sierra and its foothills.
Three Indicators have been selected for this report, two of which utilize already establish data and methodology, and one (burn severity) for which data is not yet available but is in the process of being developed. The three Indicators are:
1) Number of Acres by Fire Threat Class
2) Number of Acres that Burn Annually
3) Acres Burned by Severity
These indicators will be tracked for the entire SNC Region, plus as a subset for the Wildland-Urban Interface (WUI) lands.
3
Highlights Fire Threat
• The threat of major fire events is a constant in the Sierra Nevada and its foothills. More than two-thirds of the SNC Region (17.5 million acres) is classified as High and Above fire threat, compared to just less than half of the state as a whole.
• All Subregions have at least two-thirds of the area in the High and Above fire threat, with the exception of the East Subregion which has just under half of the area in that category. The North Subregion has the most amount of land in High and Above fire threat – 4.8 million acres (76 percent of the land area), while the North Central Subregion has the highest percentage in the High and Above category, with 78 percent.
• Sixty-four percent of federal land is in High and Above fire threat, while 78 percent of private land is classified as High and Above.
Fire History
• To meet the tracking criteria of this System Indicators report, fire data only extending back to 1998 was used. This short time frame can’t substantiate a clear trend of increasing number acres burned annually, though 2008 and 2012 were two of the biggest fire years in recorded history. Other studies do support increasing high-severity fire size and increasing acres burned annually since 1980.
• While about 60 percent of the SNC Region is in federal ownership, 75 percent of area burned between 1998 and 2012 was on federal land.
Fire in the Wildland-Urban Interface
• Six and one-half percent of the SNC Region land area (1.65 million acres) is classified as Wildland-Urban Interface (WUI). The Central Subregion accounts for 39 percent of the WUI, and 25 percent of the Central Subregion land area is WUI.
• Eight-four percent of the WUI is in High and Above fire threat, ranging in a north-to-south trend from 66 percent in the North Subregion to 94 percent in the South Subregion. Only 49 percent of East Subregion WUI is in High and Above fire threat.
• Wildfire in the WUI accounts for a small proportion of total fire in the Region; about one to three percent of total area burned in most years since 1998. In most years, 90 to 99 percent of WUI fire is on land classified as High and Above fire threat. Particularly in years where the WUI experiences a large amount of fire, much of that fire is in oak woodland.
Fire Severity
• It would be hugely useful to comprehensively document the severity of fire in the Sierra and foothills. Methodology is being developed to be able to characterize and track fire severity in the future.
4
5
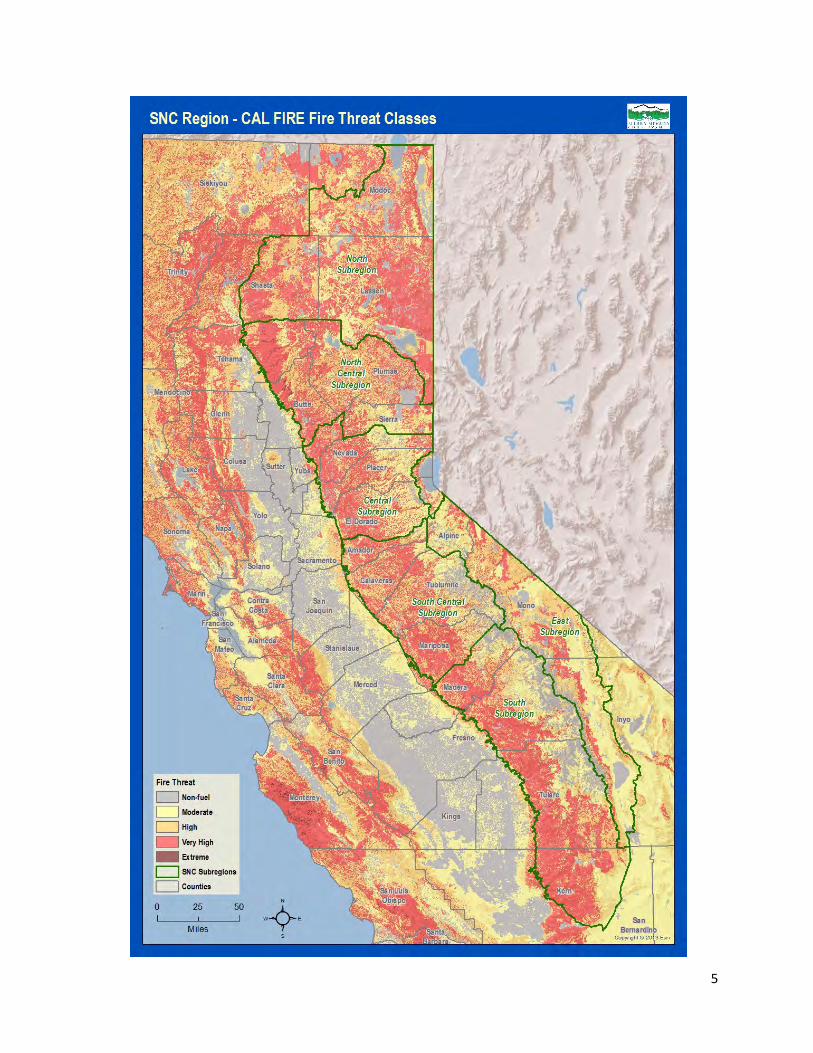
Number of Acres by Fire Threat Class
It is important to track changes in fire threat class over times as the higher the threat class, the higher the potential for large fires that burn with higher intensities creating more significant short term and long term impacts on watersheds and the natural and economic assets they provide.
CAL FIRE identifies and tracks changes in five fire threat classes: Extreme, Very High, High, Moderate, and Low or No threat. The preceding map highlights the five threat classes for the SNC Region. For this report, we have grouped the Extreme, Very High, and High classes together into a ‘High and Above’ class and left the Moderate and Low classes separate. Combining the higher threat classes together simplifies the discussion of fire threat without losing any pertinent considerations. The distinctions between High, Very High, and Extreme have little bearing on how SNC sees its role in trying to understand and reduce fire threat in the Sierra Nevada. Any threat above moderate is a dire condition. (For a more detailed reference, Table 2 in the appendix provides data for all five threat classes.)
The SNC Region, both forest and non-forest, is dominated by the higher fire threats – 17.5 million acres, 68 percent of the Region, is classified as High and Above as compared to 48 percent for California as a whole. Twenty percent of the Region is classified as Moderate, and only 12 percent is classified as Little or No threat. Most of the Little/No threat area is in the high alpine elevations. Of the 17.5 million acres in the High and Above threat class, 63 percent is Very High; there is very little that is actually classified as Extreme.
Fire Threat by Subregion
As shown in the table and chart below, fire threat is uniformly high across the Subregions within the Sierra, with the exception of the East Subregion. The North, North Central, and South Central Subregions average about 75 percent in the High and Above fire threat classes, while about two-thirds of the Central and South Subregions is in that threat range. There are likely a number of factors that lead to a bit lower threat class for the latter Subregions. The landscape the Central Subregion, which contains the bulk of the Region’s population, has been much more modified than other Subregions. The South Subregion is likely at slightly lower overall threat because it has the highest elevations and contains the most area at Little or No fire threat, which is primarily high alpine terrain with little vegetation. The large area of National Park land is the South may also play into the figures. Only 48 percent of the East Subregion is in the High and Above threat range, due mostly to lack of heavy vegetation to carry large fires due to dry conditions on the east slope of the Sierra and in the Owens Valley.
6
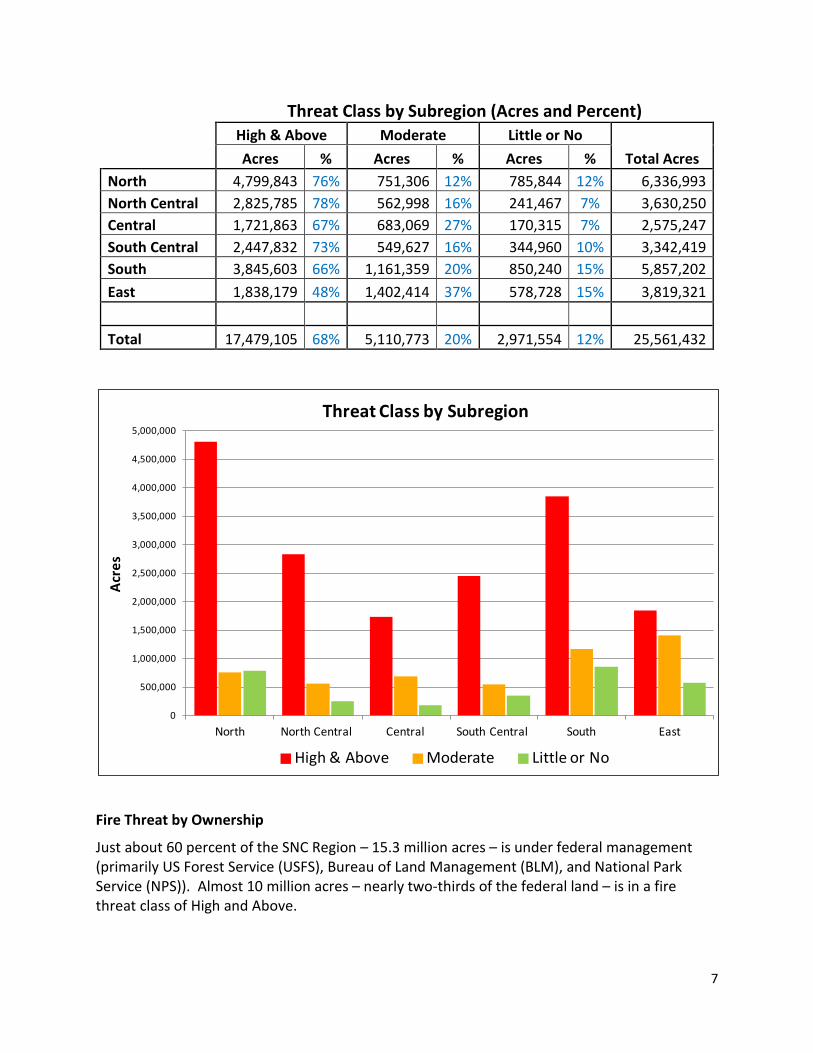
Threat Class by Subregion (Acres and Percent)
High & Above Moderate Little or No
Total Acres
Acres % Acres % Acres % North 4,799,843 76% 751,306 12% 785,844 12% 6,336,993 North Central 2,825,785 78% 562,998 16% 241,467 7% 3,630,250 Central 1,721,863 67% 683,069 27% 170,315 7% 2,575,247 South Central 2,447,832 73% 549,627 16% 344,960 10% 3,342,419 South 3,845,603 66% 1,161,359 20% 850,240 15% 5,857,202 East 1,838,179 48% 1,402,414 37% 578,728 15% 3,819,321 Total 17,479,105 68% 5,110,773 20% 2,971,554 12% 25,561,432
Fire Threat by Ownership
Just about 60 percent of the SNC Region – 15.3 million acres – is under federal management (primarily US Forest Service (USFS), Bureau of Land Management (BLM), and National Park Service (NPS)). Almost 10 million acres – nearly two-thirds of the federal land – is in a fire threat class of High and Above.
0
500,000
1,000,000
1,500,000
2,000,000
2,500,000
3,000,000
3,500,000
4,000,000
4,500,000
5,000,000
North North Central Central South Central South East
Acre
s
High & Above Moderate Little or No
Threat Class by Subregion
7
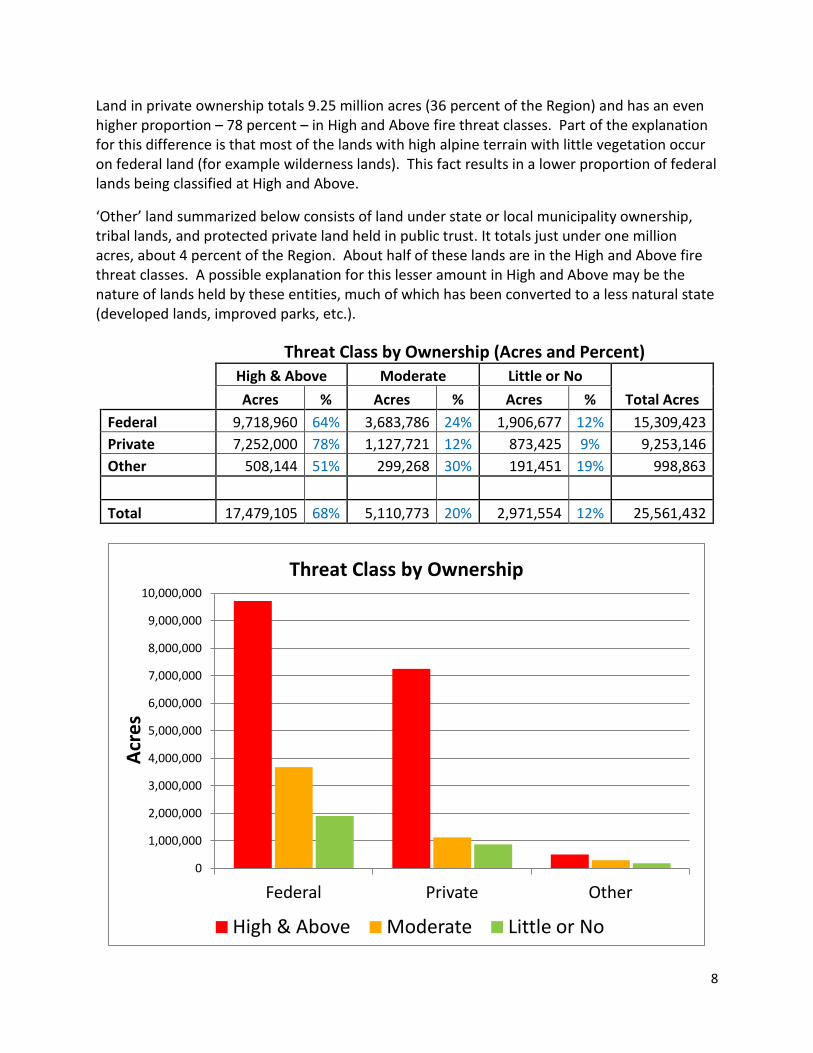
Land in private ownership totals 9.25 million acres (36 percent of the Region) and has an even higher proportion – 78 percent – in High and Above fire threat classes. Part of the explanation for this difference is that most of the lands with high alpine terrain with little vegetation occur on federal land (for example wilderness lands). This fact results in a lower proportion of federal lands being classified at High and Above.
‘Other’ land summarized below consists of land under state or local municipality ownership, tribal lands, and protected private land held in public trust. It totals just under one million acres, about 4 percent of the Region. About half of these lands are in the High and Above fire threat classes. A possible explanation for this lesser amount in High and Above may be the nature of lands held by these entities, much of which has been converted to a less natural state (developed lands, improved parks, etc.).
Threat Class by Ownership (Acres and Percent)
High & Above Moderate Little or No
Total Acres
Acres % Acres % Acres % Federal 9,718,960 64% 3,683,786 24% 1,906,677 12% 15,309,423 Private 7,252,000 78% 1,127,721 12% 873,425 9% 9,253,146 Other 508,144 51% 299,268 30% 191,451 19% 998,863 Total 17,479,105 68% 5,110,773 20% 2,971,554 12% 25,561,432
0
1,000,000
2,000,000
3,000,000
4,000,000
5,000,000
6,000,000
7,000,000
8,000,000
9,000,000
10,000,000
Federal Private Other
Acre
s
High & Above Moderate Little or No
Threat Class by Ownership
8
Impacts of Fuel Treatments on Threat Class
As part of their 2010 Strategic Plan, CAL FIRE is developing programs to track fuel reduction and fuel modification treatments throughout the state. Some tracking is being done now, but not comprehensively and across all landowners in all areas. The CAL FIRE effort will collect data on area treated and type of treatment (whether prescribed fire or mechanical) for a comprehensive GIS database.
Over time, CAL FIRE threat class mapping is adjusted as relevant factors, including forest conditions, change. The hope is that strategically implemented forest treatments will improve forest conditions such that significant land will be reclassified from higher threat classes to lower threat classes over time. Tracking the extent of fuel treatment projects, and comparing the treatment areas to existing and future threat class maps, will indicate the effectiveness of the treatments in making forest and other lands safer and healthier.
Having this information will help landowners and funders understand landscape scale conditions and coordinate on where to strategically implement projects to maximize benefits. Tracking fuel reduction and installation of other fire suppression structures, like fuel breaks, can also be used in fire suppression actions during active fire situations.
There are complicating factors to lowering fire threat beyond fuels treatments. Threat levels may change in areas that convert from wildland to expanding WUI. People play a part in the threat level due to higher fire frequency from human caused fires, both accidental and intentional, especially in the WUI. But WUI areas also have expanded access for responding to fire.
Potential Future Impact of Climate Change on Fire Threat
Weather conditions have a major effect on the occurrence of fire and its behavior. The likelihood of hotter, drier summers, and perhaps higher winds, in a warming climate is of great concern. These kinds of conditions would certainly increase fire threat in the Sierra Nevada, as well as making already difficult fire-fighting efforts even more challenging.
Large fires are controlled when either weather conditions change to be more favorable for fire fighters, or the fire runs out of fuel to burn. Warmer high elevation temperatures are leading to earlier snow melt and earlier drying of the landscape, potentially allowing for a longer fire season. If late winter and spring precipitation continues to shift from snow to rain, this trend would only be strengthened. Warmer spring temperatures and available liquid water may also lead to an increase in the lighter fuels that tend to lead to more severe fire seasons, as well as faster growth rates for all the vegetation. All these factors to could lead to higher fuel loading and the need for more frequent maintenance on fuel reduction projects than we have seen in the past.
The concern is not only the potential for more ‘bad’ fire years, but also the potential for changes in the timing of fires within each year and the pattern of fires over time. Many of the ecosystems in California are fire dependent and require some kind of fire to either regenerate or rejuvenate the landscape. Timing of seed production or offspring has evolved over the
9

centuries to align with traditional timing of more historic natural fire occurrence. Significant shifts in average fire timing could disrupt these processes significantly and threaten the survival of some species. Creating an environment where fire can be used more widely as a management tool is a longer term goal for many.
10
Number of Acres that Burn Annually
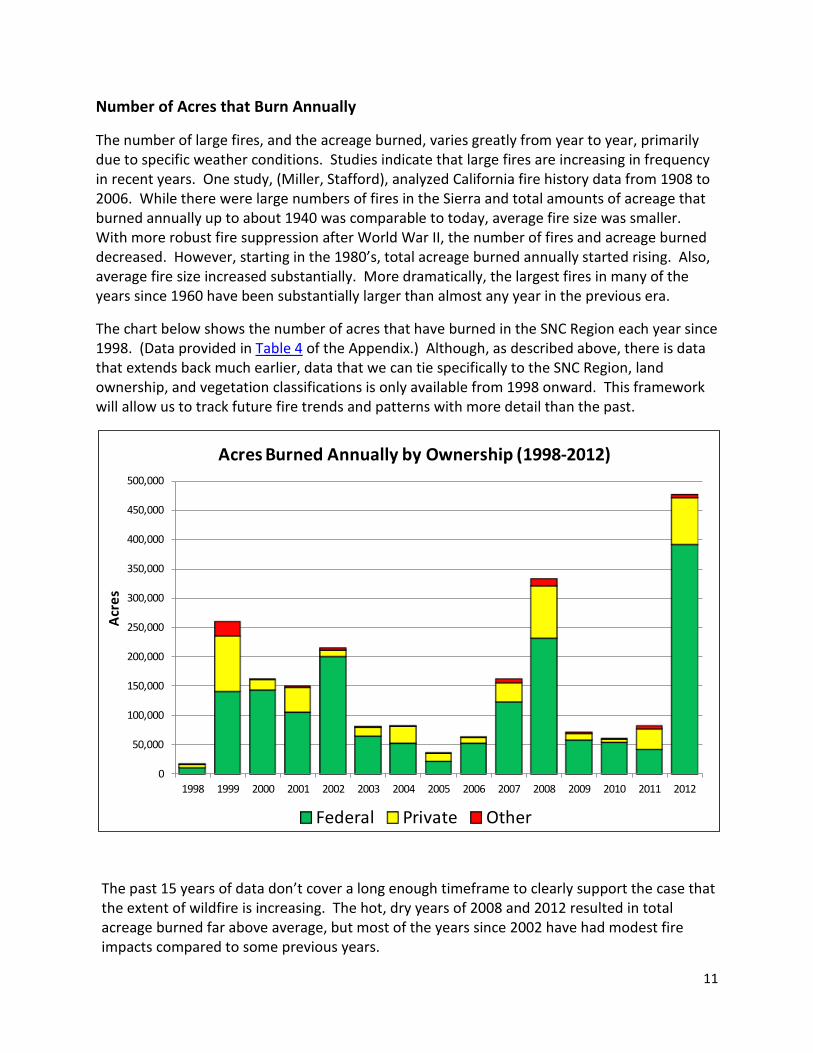
The number of large fires, and the acreage burned, varies greatly from year to year, primarily due to specific weather conditions. Studies indicate that large fires are increasing in frequency in recent years. One study, (Miller, Stafford), analyzed California fire history data from 1908 to 2006. While there were large numbers of fires in the Sierra and total amounts of acreage that burned annually up to about 1940 was comparable to today, average fire size was smaller. With more robust fire suppression after World War II, the number of fires and acreage burned decreased. However, starting in the 1980’s, total acreage burned annually started rising. Also, average fire size increased substantially. More dramatically, the largest fires in many of the years since 1960 have been substantially larger than almost any year in the previous era.
The chart below shows the number of acres that have burned in the SNC Region each year since 1998. (Data provided in Table 4 of the Appendix.) Although, as described above, there is data that extends back much earlier, data that we can tie specifically to the SNC Region, land ownership, and vegetation classifications is only available from 1998 onward. This framework will allow us to track future fire trends and patterns with more detail than the past.
The past 15 years of data don’t cover a long enough timeframe to clearly support the case that the extent of wildfire is increasing. The hot, dry years of 2008 and 2012 resulted in total acreage burned far above average, but most of the years since 2002 have had modest fire impacts compared to some previous years.
0
50,000
100,000
150,000
200,000
250,000
300,000
350,000
400,000
450,000
500,000
1998 1999 2000 2001 2002 2003 2004 2005 2006 2007 2008 2009 2010 2011 2012
Federal Private Other
Acre
s
Acres Burned Annually by Ownership (1998-2012)
11

The chart above also indicates acreage burned by major ownership category. In the past 15 years there have been consistently more acres burned from wildfires on federal lands than private or other ownerships. On the one hand, this might be expected since there is more federal than private land area in the Sierra Nevada. On the other hand, as discussed above, private land has a higher proportion in the High and Above threat classes. However, while about 60 percent of the SNC Region is in federal ownership, about 75 percent of the total acreage burned over the past 15 years has been on federal lands. There are certainly a number of factors that likely contribute to this outcome. Federal land is generally more remote than private land, making it more difficult to access in order to contain fire size; and fires on federal land often don’t pose the same imminent risk to humans and communities. These facts lead can lead to a different approach from fighting fire on private lands. For example, wildfires on federal lands (of all federal ownerships) are frequently ‘managed’ in order to remove understory vegetation, leading to larger burn areas.
The chart below more clearly shows the relative acreage burned each year by ownership.
In addition to a larger proportion of acres being burned on federal lands, the Miller Stafford report also documented that there is an increasing trend of larger fires and higher fire severity over larger areas within the fires’ perimeters, causing more damage to the watersheds on federal lands. Many of those watersheds are the headwaters of our major rivers in the state.
As expected, because most of the Region is in the High and Above fire threat classes, most of the acreage burned in any year is in that threat category. In both of the big fire years of 2008
55% 54%
88%
70%
93%
79%
63% 60%
83%76%
69%81%
89%
51%
82%
39% 37%
11%
28%
5%
18%
35% 38%
16%20%
27%15%
9%
44%
17%
6.3% 9.3% 0.8% 1.8% 2.0% 2.5% 1.5% 2.6% 0.5% 3.5% 3.8% 3.4% 2.2% 5.3% 1.0%
0%
10%
20%
30%
40%
50%
60%
70%
80%
90%
100%
1998 1999 2000 2001 2002 2003 2004 2005 2006 2007 2008 2009 2010 2011 2012
Tota
l Are
a of t
he SN
C Re
gion
Bur
ned
Each
year
% Federal % Private % Other
Percent of Total Acres Burned by Ownership Group
12
and 2012, 88 percent of the total acreage burned was in High and Above fire threat classes. Fire distribution across the Region is particularly variable, owing to the erratic nature of where large fires might occur. The North, North Central, and South Subregions generally experience more fire than the other Subregions. As examples, due to particularly large fires, 71 percent of total acreage burned in 2012 was in the North Subregion. In the big fire year of 2008, 48 percent of acreage burned was in the North Central Subregion, while in 2011 only 88 acres burned in the North Central (1/10th of one percent of the total). Detailed tables for annual acres burned by Subregion and threat class are included in the Appendix (Tables 5 and 6).
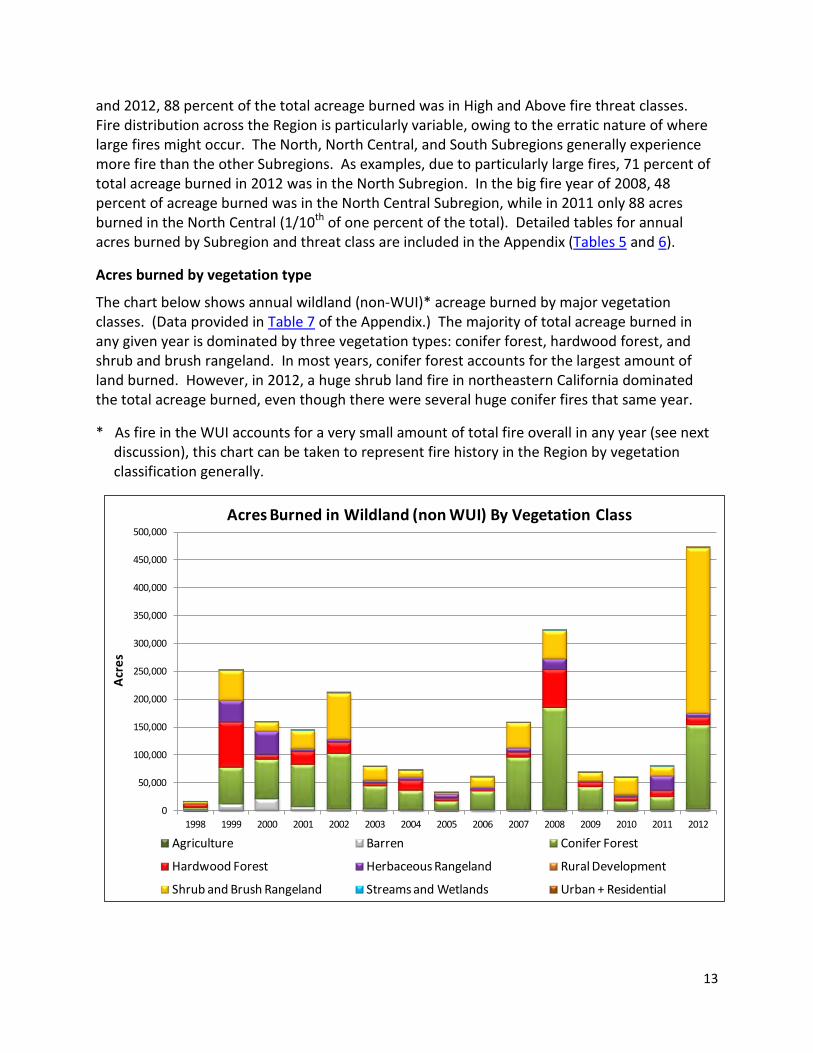
Acres burned by vegetation type
The chart below shows annual wildland (non-WUI)* acreage burned by major vegetation classes. (Data provided in Table 7 of the Appendix.) The majority of total acreage burned in any given year is dominated by three vegetation types: conifer forest, hardwood forest, and shrub and brush rangeland. In most years, conifer forest accounts for the largest amount of land burned. However, in 2012, a huge shrub land fire in northeastern California dominated the total acreage burned, even though there were several huge conifer fires that same year.
* As fire in the WUI accounts for a very small amount of total fire overall in any year (see next discussion), this chart can be taken to represent fire history in the Region by vegetation classification generally.
0
50,000
100,000
150,000
200,000
250,000
300,000
350,000
400,000
450,000
500,000
1998 1999 2000 2001 2002 2003 2004 2005 2006 2007 2008 2009 2010 2011 2012
Acre
s
Agriculture Barren Conifer Forest
Hardwood Forest Herbaceous Rangeland Rural Development
Shrub and Brush Rangeland Streams and Wetlands Urban + Residential
Acres Burned in Wildland (non WUI) By Vegetation Class
13
Number of Acres by Fire Threat Class and Number of Acres that Burn Annually Within the Wildland-Urban Interface (WUI)
The majority of human occupation and development within the SNC Region is classified as Wildland-Urban Interface (WUI). For this report the definition of WUI comes from FRAP. WUI is based on housing density where there are no more than 2 homes (units) per acre and no less than 1 house per 40-acres. There is very little urban land in the Sierra, which is defined as more than 2 homes per acre. WUI is characterized by much more vegetation and fire risk than urban land, being more integrated into the wild landscape. The WUI is a particular complication to fire management in the Sierra. As people have moved into what were traditionally more wildland environments, fire suppression tactics have been focused first on protecting life and property, and then on the wildland fire suppression activities.
In any fire suppression action, the initial attack period - generally the first 1-2 hours of the fire - is critical in suppressing the fire while it is still small, therefore minimizing its impact or damage. Control structures associated with the WUI such as roads and fuel breaks, greatly aid the quick attack on a fire. Most areas that contain WUI have additional firefighting resources through local paid or volunteer fire protection districts paid for by local residents. However there may not be enough resources in the early stages of a significant fire to aggressively attack both the structure assets and the wildland portions of a fire at the same time. Where there is wildland involved in the incident and firefighting resources are limited in number initially, the wildland fire portion of these events have tended to grow larger as suppression and protection is targeted first at life and property. As suppression activities move from those life and property assets to the wildland, the fire may have grown to a size and intensity that makes it more difficult to contain or even manage, therefore adding to acres burned and potentially negative impacts to the environment. Along with the physical difficulty in suppressing larger fires, the increase in costs of fire suppression, and post fire restoration and mitigation costs puts an additional strain on federal, state, and local budgets.
Development of historically wildland or agricultural lands is expected to continue as population pressures grow, which will increase the amount of WUI and continue to influence priorities in firefighting. Some recent changes in regulations such wider road widths and turn-around to provide greater access and egress, as well as water source requirements and building codes changes to “harden” the structures being constructed may help mitigate those impacts.
Six-and-a-half percent of the SNC Region land area is classified as WUI. The maps on the following two pages show the distribution of the 1.65 million acres of WUI within the Region. WUI land is represented by the orange areas.
14
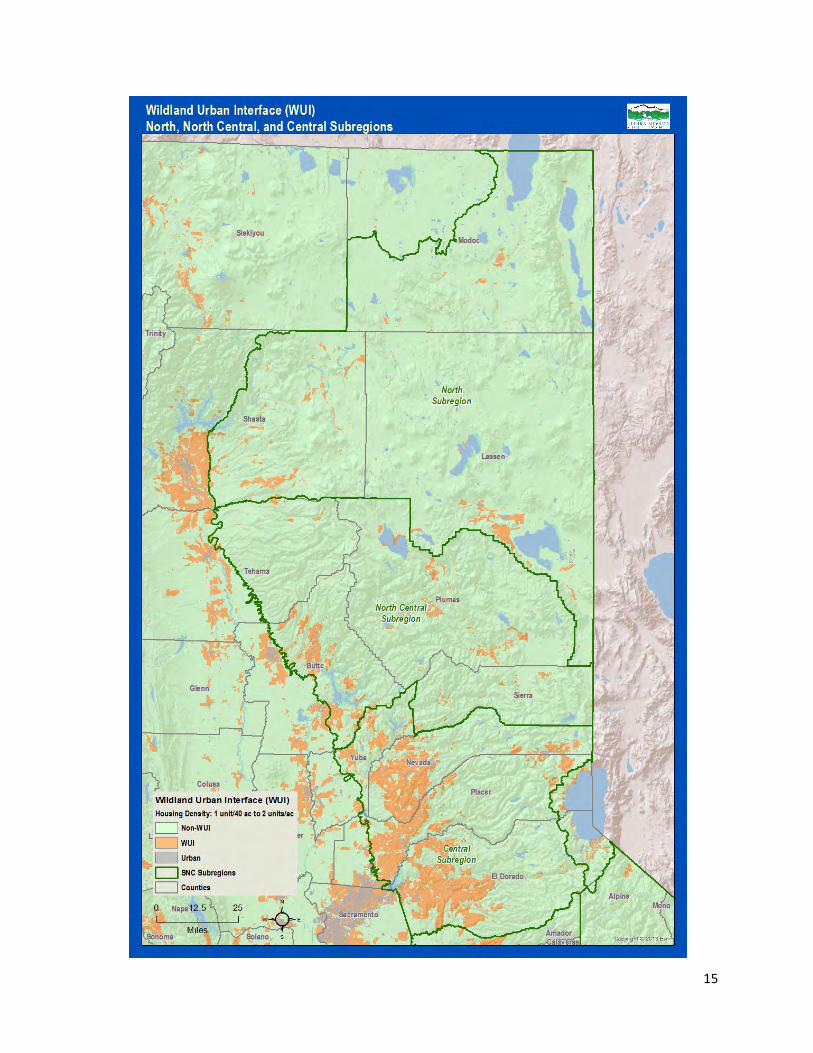
15
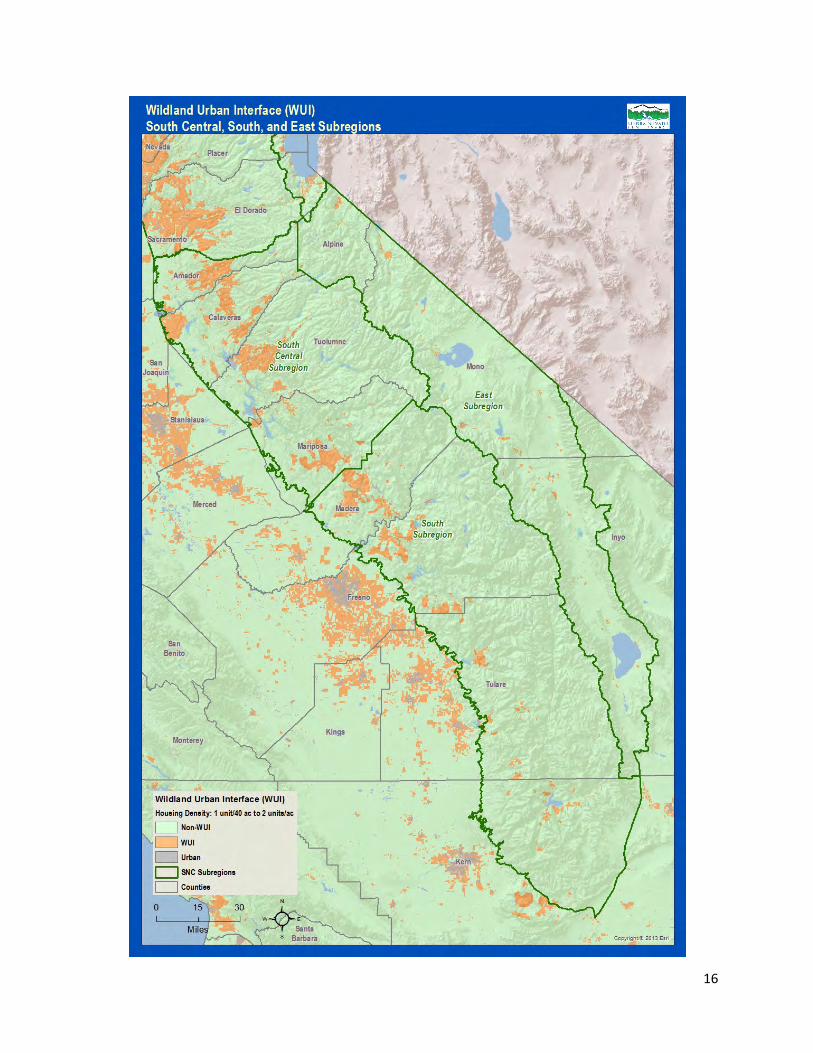
16
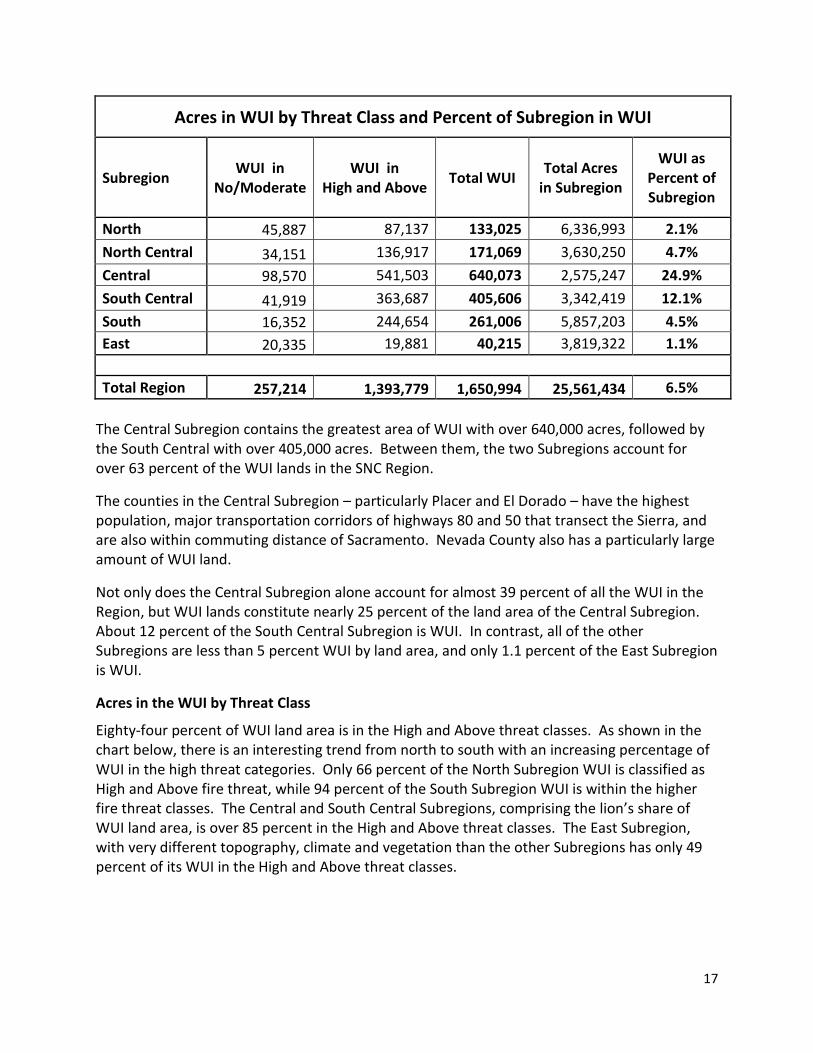
Acres in WUI by Threat Class and Percent of Subregion in WUI
Subregion WUI in No/Moderate
WUI in High and Above Total WUI Total Acres
in Subregion
WUI as Percent of Subregion
North 45,887 87,137 133,025 6,336,993 2.1% North Central 34,151 136,917 171,069 3,630,250 4.7% Central 98,570 541,503 640,073 2,575,247 24.9% South Central 41,919 363,687 405,606 3,342,419 12.1% South 16,352 244,654 261,006 5,857,203 4.5% East 20,335 19,881 40,215 3,819,322 1.1%
Total Region 257,214 1,393,779 1,650,994 25,561,434 6.5%
The Central Subregion contains the greatest area of WUI with over 640,000 acres, followed by the South Central with over 405,000 acres. Between them, the two Subregions account for over 63 percent of the WUI lands in the SNC Region.
The counties in the Central Subregion – particularly Placer and El Dorado – have the highest population, major transportation corridors of highways 80 and 50 that transect the Sierra, and are also within commuting distance of Sacramento. Nevada County also has a particularly large amount of WUI land.
Not only does the Central Subregion alone account for almost 39 percent of all the WUI in the Region, but WUI lands constitute nearly 25 percent of the land area of the Central Subregion. About 12 percent of the South Central Subregion is WUI. In contrast, all of the other Subregions are less than 5 percent WUI by land area, and only 1.1 percent of the East Subregion is WUI.
Acres in the WUI by Threat Class
Eighty-four percent of WUI land area is in the High and Above threat classes. As shown in the chart below, there is an interesting trend from north to south with an increasing percentage of WUI in the high threat categories. Only 66 percent of the North Subregion WUI is classified as High and Above fire threat, while 94 percent of the South Subregion WUI is within the higher fire threat classes. The Central and South Central Subregions, comprising the lion’s share of WUI land area, is over 85 percent in the High and Above threat classes. The East Subregion, with very different topography, climate and vegetation than the other Subregions has only 49 percent of its WUI in the High and Above threat classes.
17
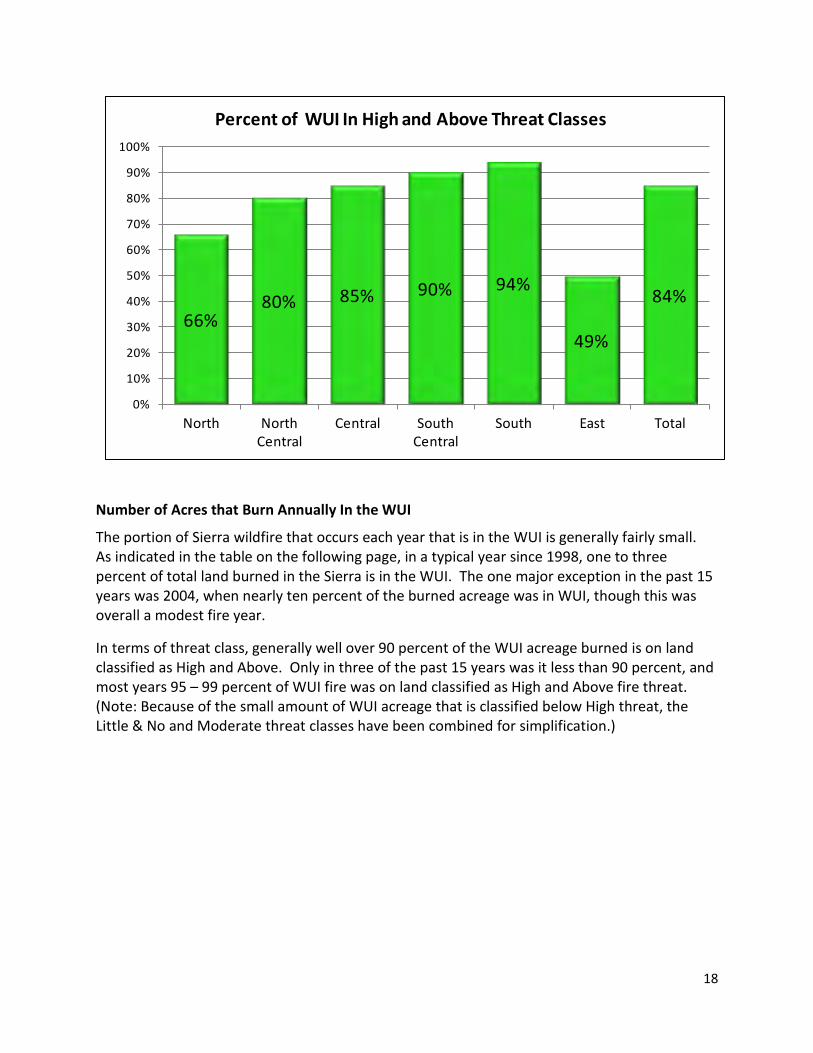
Number of Acres that Burn Annually In the WUI
The portion of Sierra wildfire that occurs each year that is in the WUI is generally fairly small. As indicated in the table on the following page, in a typical year since 1998, one to three percent of total land burned in the Sierra is in the WUI. The one major exception in the past 15 years was 2004, when nearly ten percent of the burned acreage was in WUI, though this was overall a modest fire year.
In terms of threat class, generally well over 90 percent of the WUI acreage burned is on land classified as High and Above. Only in three of the past 15 years was it less than 90 percent, and most years 95 – 99 percent of WUI fire was on land classified as High and Above fire threat. (Note: Because of the small amount of WUI acreage that is classified below High threat, the Little & No and Moderate threat classes have been combined for simplification.)
66%80% 85% 90% 94%
49%
84%
0%
10%
20%
30%
40%
50%
60%
70%
80%
90%
100%
North North Central
Central South Central
South East Total
Percent of WUI In High and Above Threat Classes
18
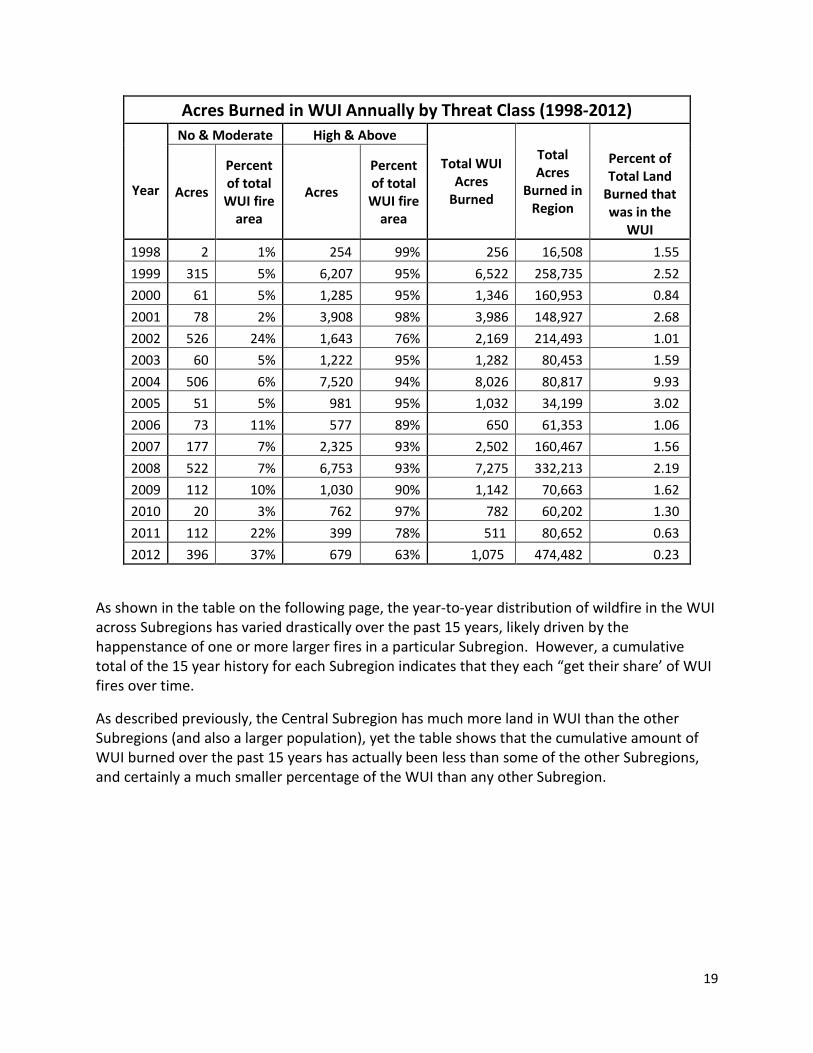
Acres Burned in WUI Annually by Threat Class (1998-2012)
Year
No & Moderate High & Above
Total WUI Acres
Burned
Total Acres
Burned in Region
Percent of Total Land
Burned that was in the
WUI
Acres
Percent of total WUI fire
area
Acres
Percent of total WUI fire
area
1998 2 1% 254 99% 256 16,508 1.55 1999 315 5% 6,207 95% 6,522 258,735 2.52 2000 61 5% 1,285 95% 1,346 160,953 0.84 2001 78 2% 3,908 98% 3,986 148,927 2.68 2002 526 24% 1,643 76% 2,169 214,493 1.01 2003 60 5% 1,222 95% 1,282 80,453 1.59 2004 506 6% 7,520 94% 8,026 80,817 9.93 2005 51 5% 981 95% 1,032 34,199 3.02 2006 73 11% 577 89% 650 61,353 1.06 2007 177 7% 2,325 93% 2,502 160,467 1.56 2008 522 7% 6,753 93% 7,275 332,213 2.19 2009 112 10% 1,030 90% 1,142 70,663 1.62 2010 20 3% 762 97% 782 60,202 1.30 2011 112 22% 399 78% 511 80,652 0.63 2012 396 37% 679 63% 1,075 474,482 0.23
As shown in the table on the following page, the year-to-year distribution of wildfire in the WUI across Subregions has varied drastically over the past 15 years, likely driven by the happenstance of one or more larger fires in a particular Subregion. However, a cumulative total of the 15 year history for each Subregion indicates that they each “get their share’ of WUI fires over time.
As described previously, the Central Subregion has much more land in WUI than the other Subregions (and also a larger population), yet the table shows that the cumulative amount of WUI burned over the past 15 years has actually been less than some of the other Subregions, and certainly a much smaller percentage of the WUI than any other Subregion.
19
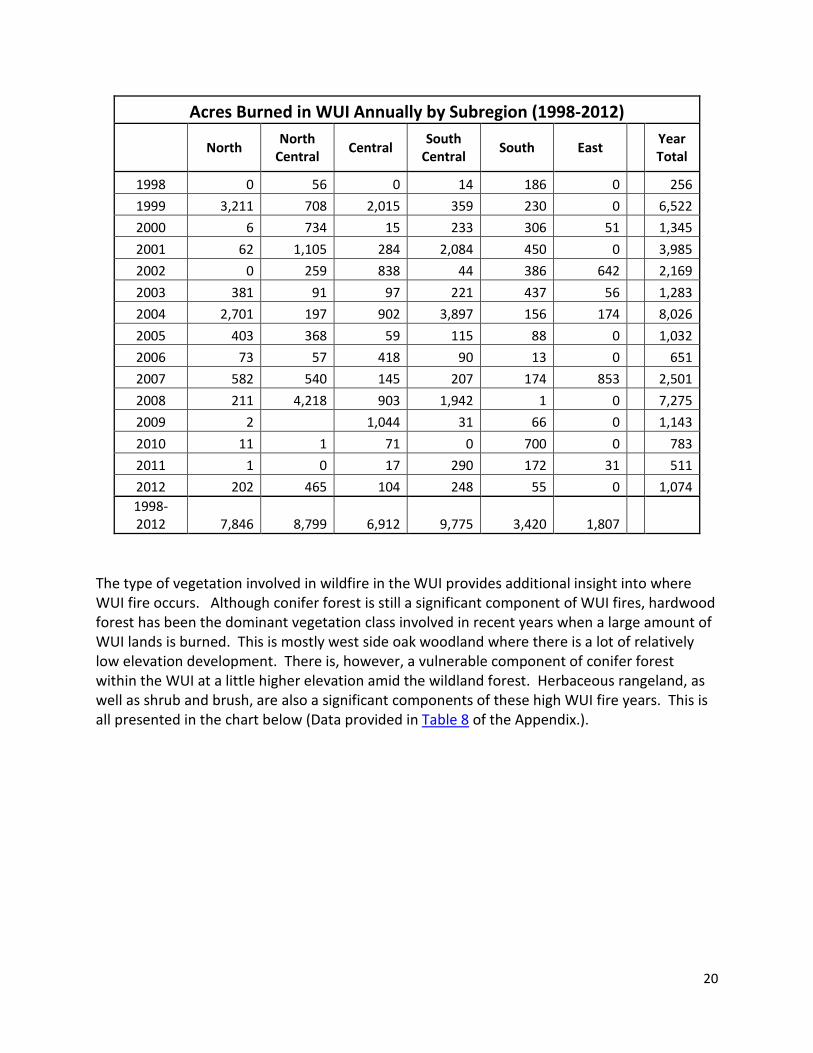
Acres Burned in WUI Annually by Subregion (1998-2012)
North North
Central Central South Central South East Year
Total
1998 0 56 0 14 186 0 256 1999 3,211 708 2,015 359 230 0 6,522 2000 6 734 15 233 306 51 1,345 2001 62 1,105 284 2,084 450 0 3,985 2002 0 259 838 44 386 642 2,169 2003 381 91 97 221 437 56 1,283 2004 2,701 197 902 3,897 156 174 8,026 2005 403 368 59 115 88 0 1,032 2006 73 57 418 90 13 0 651 2007 582 540 145 207 174 853 2,501 2008 211 4,218 903 1,942 1 0 7,275 2009 2 1,044 31 66 0 1,143 2010 11 1 71 0 700 0 783 2011 1 0 17 290 172 31 511 2012 202 465 104 248 55 0 1,074 1998-2012
7,846
8,799
6,912
9,775
3,420
1,807
The type of vegetation involved in wildfire in the WUI provides additional insight into where WUI fire occurs. Although conifer forest is still a significant component of WUI fires, hardwood forest has been the dominant vegetation class involved in recent years when a large amount of WUI lands is burned. This is mostly west side oak woodland where there is a lot of relatively low elevation development. There is, however, a vulnerable component of conifer forest within the WUI at a little higher elevation amid the wildland forest. Herbaceous rangeland, as well as shrub and brush, are also a significant components of these high WUI fire years. This is all presented in the chart below (Data provided in Table 8 of the Appendix.).
20
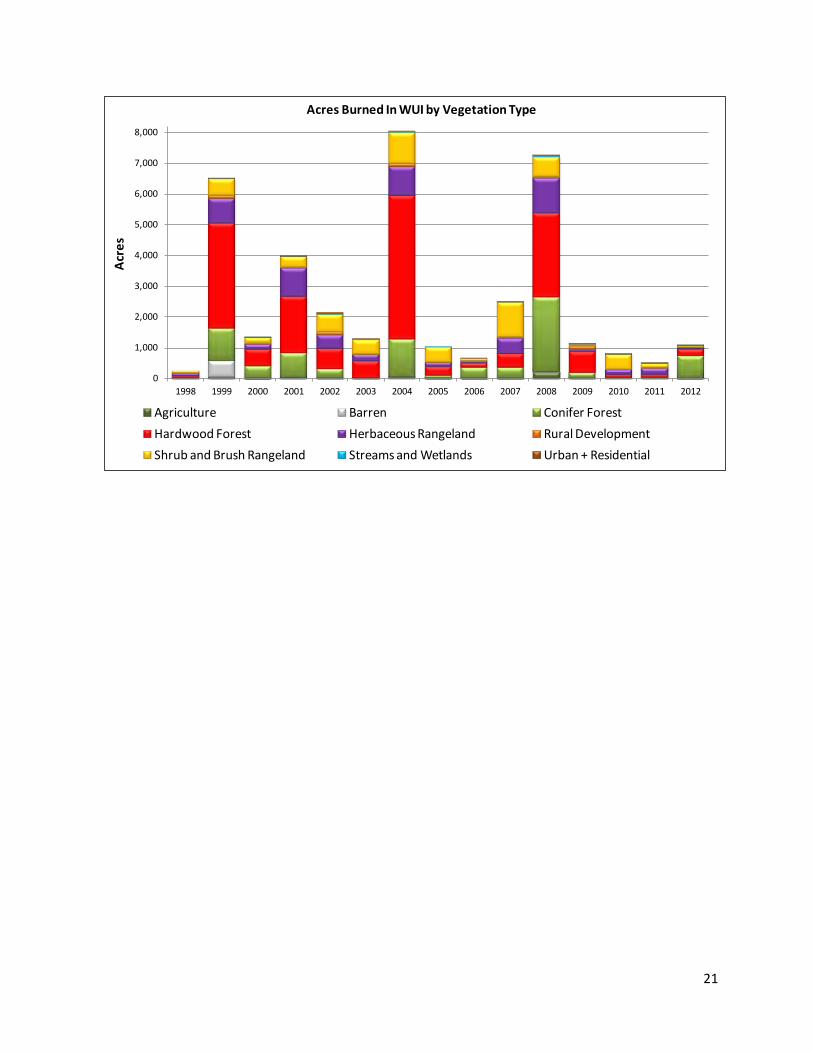
0
1,000
2,000
3,000
4,000
5,000
6,000
7,000
8,000
1998 1999 2000 2001 2002 2003 2004 2005 2006 2007 2008 2009 2010 2011 2012
Acre
s
Agriculture Barren Conifer ForestHardwood Forest Herbaceous Rangeland Rural DevelopmentShrub and Brush Rangeland Streams and Wetlands Urban + Residential
Acres Burned In WUI by Vegetation Type
21
Acres Burned by Fire Severity
Not only is fire size important in measuring the impact of fire on the watershed but the severity at which the fire burns and the amount of area burned at a high severity is just as important.
Measuring and Reducing Fire Severity
Complete elimination of severe wildfire is not desirable, but current forest conditions lead to large fires dominated by high severity burning with unwanted consequences. Varying levels of burn severity within a fire help create or maintain a mosaic of ecosystem habitats and corridors, but when large areas burn with high severity it not only destroys or eliminates critical habitat but creates erosion and water quality problems as well, and provides for the introduction of non-native and invasive species further changing the habitat from the pre-fire regime. Low intensity fires tend to remove fuel and thin vegetation and generally reduce competition for nutrients and water and reduce insect and disease populations. The mosaic of disturbances created by a variety of burn severities within a fire more closely mimic historic natural fire occurrence.
A USFS report, Sierra Nevada Fire Severity Monitoring 1984-2004 (Miller, Stafford), documents that there has been an increase in the proportion of acres burned at high severity in most of the fires experienced on US Forest Service lands in the Sierra Nevada during the survey period. Overall, 14 percent of wildfire burned at high severity in 1984, while 23 percent of fire area was at high severity just twenty years later. Different forest types exhibited varying levels of change in fire severity over the twenty year period. The proportion of severe fire in mixed conifer stand fires increased from 17 percent to 27 percent; while severity in white fir and black oak stands increased 200 – 300 percent, and there was no appreciable increase in fire severity in low-elevation west side Ponderosa pine and high-elevation forests.
While burn severity within a fire perimeter has been documented and measured in this and other studies on some lands, currently a consistent methodology and data set is not available to provide a Region-wide indicator related to fire severity. CAL FIRE is currently developing a methodology to consistently measure burn severity within the fire perimeter on all fires above a certain acre threshold. The SNC will continue to work with CAL FIRE and the US Forest Service to develop a uniform database of fire severity on all lands in the Sierra Nevada, by forest type, ownership category, and level of severity, so that trends in fire severity can be comprehensively tracked over time.
Fire Return Interval and Fire Severity
As discussed in the SNC Forest Health and Carbon Storage Indicators report, the Fire Return Interval Departure (FRID) shows that the frequency of fire return has a great deal of bearing on fire intensity when fires do occur. The fire return interval prior to European settlement (before about 1850) averaged 20 years or less on 75% of the forest lands in the Sierra Nevada, whereas 75 percent of the forest has not experienced fire in the past 103 years. The lack of periodic low severity fire on the land allows forest fuels to become overstocked so that fires burn more intensely when they do occur. As forests and vegetative cover gets denser there is more
22
competition for moisture and stands get thicker with increased mortality and dead standing and ground fuels.
Landscape Priority for Treatment
As discussed in the Forest Health and Carbon Storage Indicators report, CAL FIRE has identified watersheds with a high potential for risk of damage from severe wildfires. They identified that the North and North Central sub regions have areas with the highest threat to watershed health in the event of a high severity fire. High severity fires on the landscape have the potential to have dramatic impacts of watershed function including sedimentation rates, and changing micro climate by burning up litter, roots and other organics exposing soils to erosive precipitation. The larger the areas burned under a high severity condition, the higher the potential for damage to the ecosystem. Where infrastructure is located in or near these watersheds there is also significant risk to those improvements and assets.
Treatments in these watersheds can be performed in a number of ways and there is no one-size-fits-all approach, though there is general agreement that the ideal situation would be the return of more frequent low intensity fires that would approximate historic conditions. Prescribed fire is the most economical way to maintain low or more historic fuel loads as well as return to more historic fire regimes, but there are a number of factors that make this extremely difficult. Infrastructure and homes built in the wildland areas make it more problematic to conduct burns in these areas. It has also been difficult for land managers to schedule prescribed burns in a “burn window” where the fire will burn to get the desired results and still comply with air quality restriction or limitations. Potential liability in the event the prescribed fire escapes is also a serious consideration. In many instances, prior to introducing fire to the landscape, the heavy fuel loads of overstocked forest stands due to long term fire exclusion would require some mechanical thinning of biomass before fire could be reintroduced to those areas. Steep terrain and other sensitive areas can even require hand thinning. These mechanical and hand treatments are expensive.
Shaded fuel breaks can complement general forest thinning and help control the potential spread of wildland fires, and is particularly important in protecting communities from catastrophic wildfire. An understanding of fire threat and fire severity history can aid in strategically designing and locating fuel breaks. There are many areas in the Sierra that have developed Community Wildfire Protection Plans (CWPP) that do identify priority areas or actions to reduce the potential for large damaging fires, but coordinating across ownerships has been difficult for many communities due to a lack of funding or coordinated timing for available funding to either start or finish a project.
23
Conclusion Much of the Sierra does not have the same forest conditions as in the past, and a changing climate regime may have additional impacts to those conditions. Restoring the health of the forest and reducing fire threat will take a significant amount of time (most likely decades) and increased investment. These Fire Threat Indicators can help us track the progress that is being made in terms of on-the-ground efforts to improve forest conditions and reduce fire threat over time and help inform strategic investment.
References California Department of Forestry and Fire Protection, Resource Assessment Program, California’s Forests and Rangelands: 2010 Assessment
USDA Forest Service, Pacific Southwest Region, Jay Miller and Hugh Stafford, R5-TP-027, August 2008, Sierra Nevada Fire Severity Monitoring 1984-2004
Contact Information For more detailed information on the individual Indicators or explanation of their development, please contact: Chris Dallas
Sierra Nevada Conservancy
(530) 823-4673
24
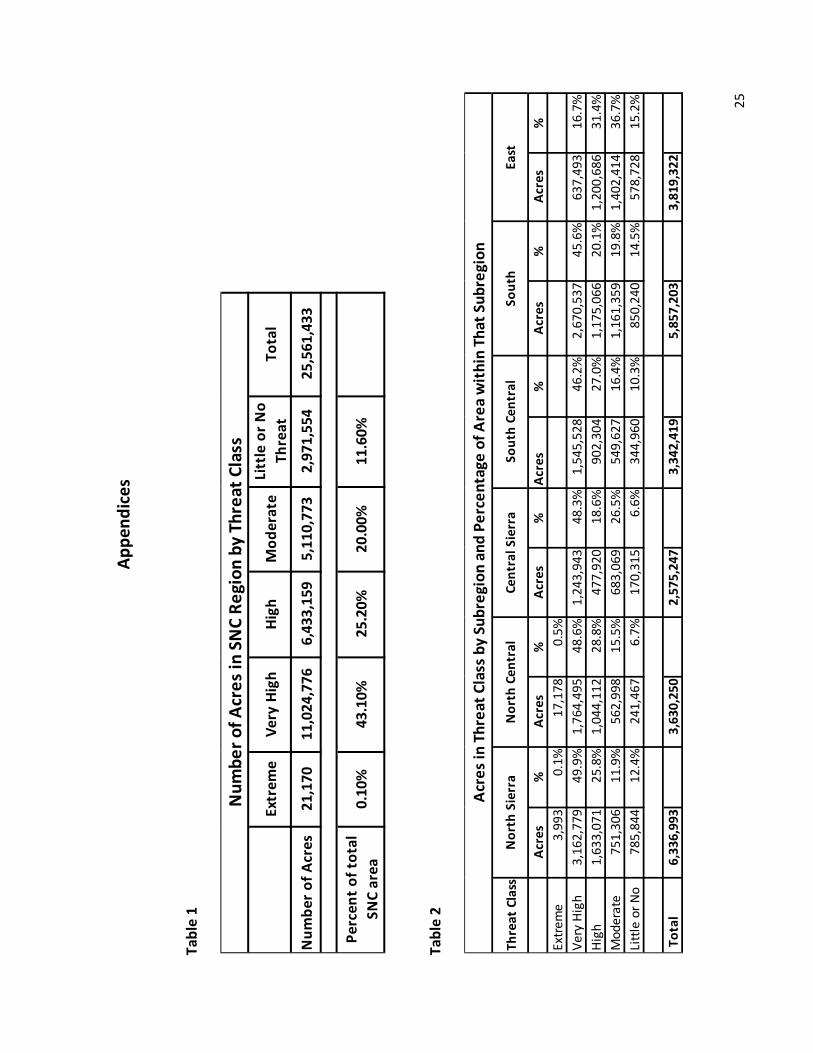
Appe
ndic
es
Ta
ble
1
Ta
ble
2
Extr
eme
Very
Hig
hHi
ghM
oder
ate
Litt
le o
r No
Thre
atTo
tal
Num
ber o
f Acr
es21
,170
11,0
24,7
766,
433,
159
5,11
0,77
32,
971,
554
25,5
61,4
33
Perc
ent o
f tot
al
SNC
area
0.10
%43
.10%
25.2
0%20
.00%
11.6
0%
Num
ber o
f Acr
es in
SN
C Re
gion
by
Thre
at C
lass
Thre
at C
lass
Acre
s%
Acre
s%
Acre
s%
Acre
s%
Acre
s%
Acre
s%
Extre
me
3,99
30.
1%17
,178
0.5%
Very
Hig
h3,
162,
779
49.9
%1,
764,
495
48.6
%1,
243,
943
48.3
%1,
545,
528
46.2
%2,
670,
537
45.6
%63
7,49
316
.7%
High
1,63
3,07
125
.8%
1,04
4,11
228
.8%
477,
920
18.6
%90
2,30
427
.0%
1,17
5,06
620
.1%
1,20
0,68
631
.4%
Mod
erat
e75
1,30
611
.9%
562,
998
15.5
%68
3,06
926
.5%
549,
627
16.4
%1,
161,
359
19.8
%1,
402,
414
36.7
%Li
ttle
or N
o78
5,84
412
.4%
241,
467
6.7%
170,
315
6.6%
344,
960
10.3
%85
0,24
014
.5%
578,
728
15.2
%
Tot
al6,
336,
993
3,63
0,25
02,
575,
247
3,34
2,41
95,
857,
203
3,81
9,32
2
Acr
es in
Thr
eat C
lass
by
Subr
egio
n an
d Pe
rcen
tage
of A
rea
wit
hin
That
Sub
regi
on
Nor
th S
ierr
aN
orth
Cen
tral
Ce
ntra
l Sie
rra
Sout
h Ce
ntra
l So
uth
East
25
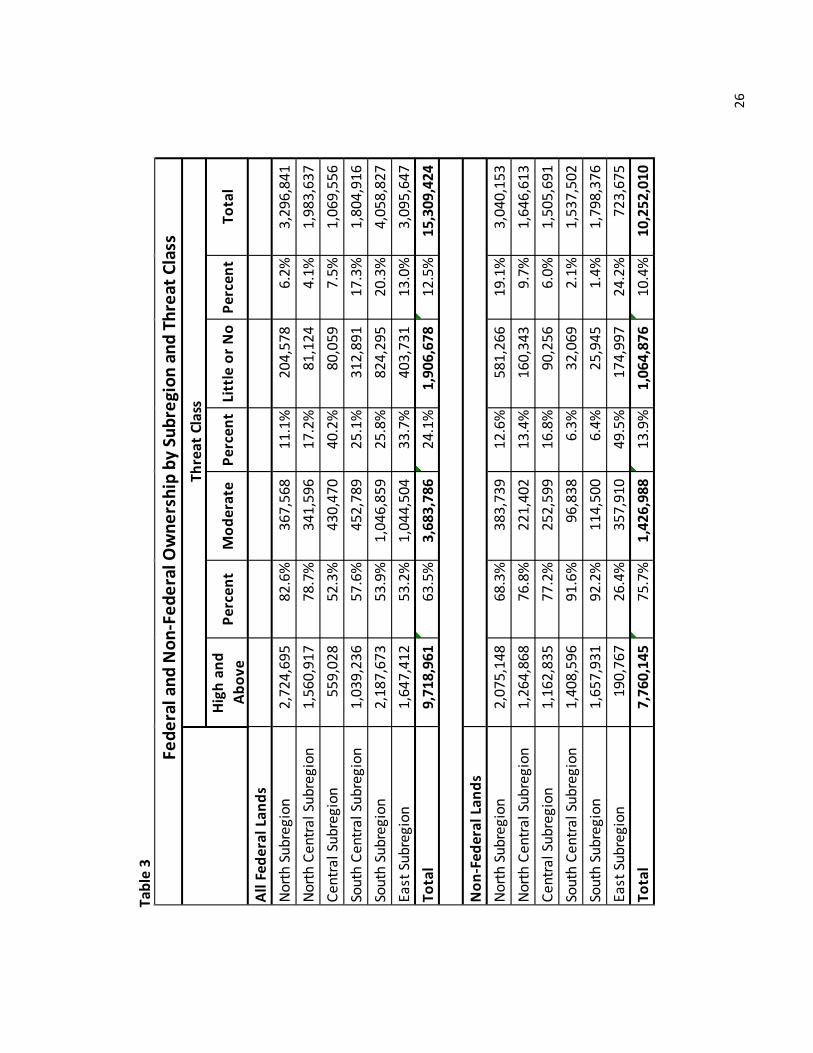
Ta
ble
3
High
and
Ab
ove
Perc
ent
Mod
erat
ePe
rcen
tLi
ttle
or N
oPe
rcen
tTo
tal
All F
eder
al L
ands
North
Sub
regi
on2,
724,
695
82
.6%
367,
568
11.1
%20
4,57
8
6.
2%3,
296,
841
North
Cen
tral S
ubre
gion
1,56
0,91
7
78.7
%34
1,59
6
17
.2%
81,1
24
4.1%
1,98
3,63
7
Ce
ntra
l Sub
regi
on55
9,02
8
52
.3%
430,
470
40.2
%80
,059
7.
5%1,
069,
556
Sout
h Ce
ntra
l Sub
regi
on1,
039,
236
57
.6%
452,
789
25.1
%31
2,89
1
17
.3%
1,80
4,91
6
So
uth
Subr
egio
n2,
187,
673
53
.9%
1,04
6,85
9
25.8
%82
4,29
5
20
.3%
4,05
8,82
7
Ea
st S
ubre
gion
1,64
7,41
2
53.2
%1,
044,
504
33
.7%
403,
731
13.0
%3,
095,
647
Tota
l9,
718,
961
63
.5%
3,68
3,78
6
24.1
%1,
906,
678
12
.5%
15,3
09,4
24
Non
-Fed
eral
Lan
dsNo
rth S
ubre
gion
2,07
5,14
8
68.3
%38
3,73
9
12
.6%
581,
266
19.1
%3,
040,
153
North
Cen
tral S
ubre
gion
1,26
4,86
8
76.8
%22
1,40
2
13
.4%
160,
343
9.7%
1,64
6,61
3
Ce
ntra
l Sub
regi
on1,
162,
835
77
.2%
252,
599
16.8
%90
,256
6.
0%1,
505,
691
Sout
h Ce
ntra
l Sub
regi
on1,
408,
596
91
.6%
96,8
38
6.3%
32,0
69
2.1%
1,53
7,50
2
So
uth
Subr
egio
n1,
657,
931
92
.2%
114,
500
6.4%
25,9
45
1.4%
1,79
8,37
6
Ea
st S
ubre
gion
190,
767
26.4
%35
7,91
0
49
.5%
174,
997
24.2
%72
3,67
5
Tota
l7,
760,
145
75
.7%
1,42
6,98
8
13.9
%1,
064,
876
10
.4%
10,2
52,0
10
F
eder
al a
nd N
on-F
eder
al O
wne
rshi
p by
Sub
regi
on a
nd T
hrea
t Cla
ssTh
reat
Cla
ss
26
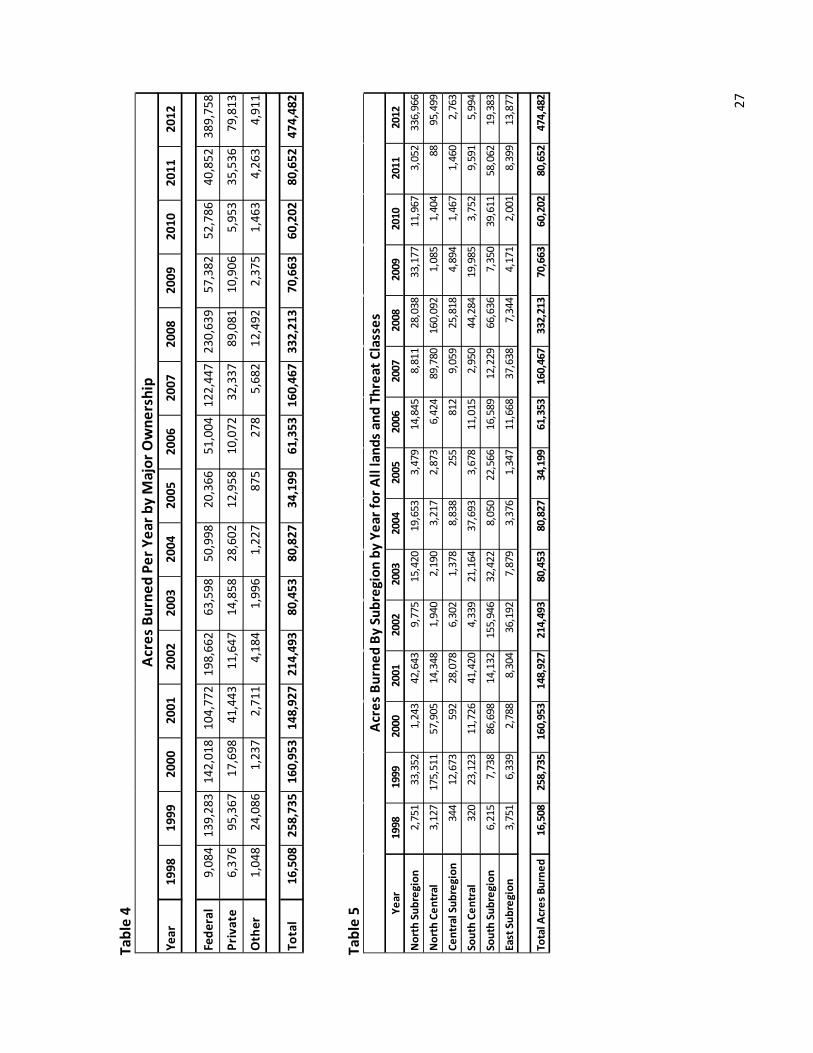
Ta
ble
4
Ta
ble
5
Year
1998
1999
2000
2001
2002
2003
2004
2005
2006
2007
2008
2009
2010
2011
2012
Fede
ral
9,08
413
9,28
314
2,01
810
4,77
219
8,66
263
,598
50,9
9820
,366
51,0
0412
2,44
723
0,63
957
,382
52,7
8640
,852
389,
758
Priv
ate
6,37
695
,367
17,6
9841
,443
11,6
4714
,858
28,6
0212
,958
10,0
7232
,337
89,0
8110
,906
5,95
335
,536
79,8
13
Oth
er1,
048
24,0
861,
237
2,71
14,
184
1,99
61,
227
875
278
5,68
212
,492
2,37
51,
463
4,26
34,
911
Tota
l16
,508
258,
735
160,
953
148,
927
214,
493
80,4
5380
,827
34,1
9961
,353
160,
467
332,
213
70,6
6360
,202
80,6
5247
4,48
2
Acr
es B
urne
d Pe
r Yea
r by
Maj
or O
wne
rshi
p
Year
1998
1999
2000
2001
2002
2003
2004
2005
2006
2007
2008
2009
2010
2011
2012
Nor
th S
ubre
gion
2,75
133
,352
1,24
342
,643
9,77
515
,420
19,6
533,
479
14,8
458,
811
28,0
3833
,177
11,9
673,
052
336,
966
Nor
th C
entr
al
3,12
717
5,51
157
,905
14,3
481,
940
2,19
03,
217
2,87
36,
424
89,7
8016
0,09
21,
085
1,40
488
95,4
99
Cent
ral S
ubre
gion
344
12,6
7359
228
,078
6,30
21,
378
8,83
825
581
29,
059
25,8
184,
894
1,46
71,
460
2,76
3
Sout
h Ce
ntra
l 32
023
,123
11,7
2641
,420
4,33
921
,164
37,6
933,
678
11,0
152,
950
44,2
8419
,985
3,75
29,
591
5,99
4
Sout
h Su
breg
ion
6,21
57,
738
86,6
9814
,132
155,
946
32,4
228,
050
22,5
6616
,589
12,2
2966
,636
7,35
039
,611
58,0
6219
,383
East
Sub
regi
on3,
751
6,33
92,
788
8,30
436
,192
7,87
93,
376
1,34
711
,668
37,6
387,
344
4,17
12,
001
8,39
913
,877
Tota
l Acr
es B
urne
d16
,508
258,
735
160,
953
148,
927
214,
493
80,4
5380
,827
34,1
9961
,353
160,
467
332,
213
70,6
6360
,202
80,6
5247
4,48
2
Acr
es B
urne
d By
Sub
regi
on b
y Ye
ar fo
r All
land
s an
d Th
reat
Cla
sses
27
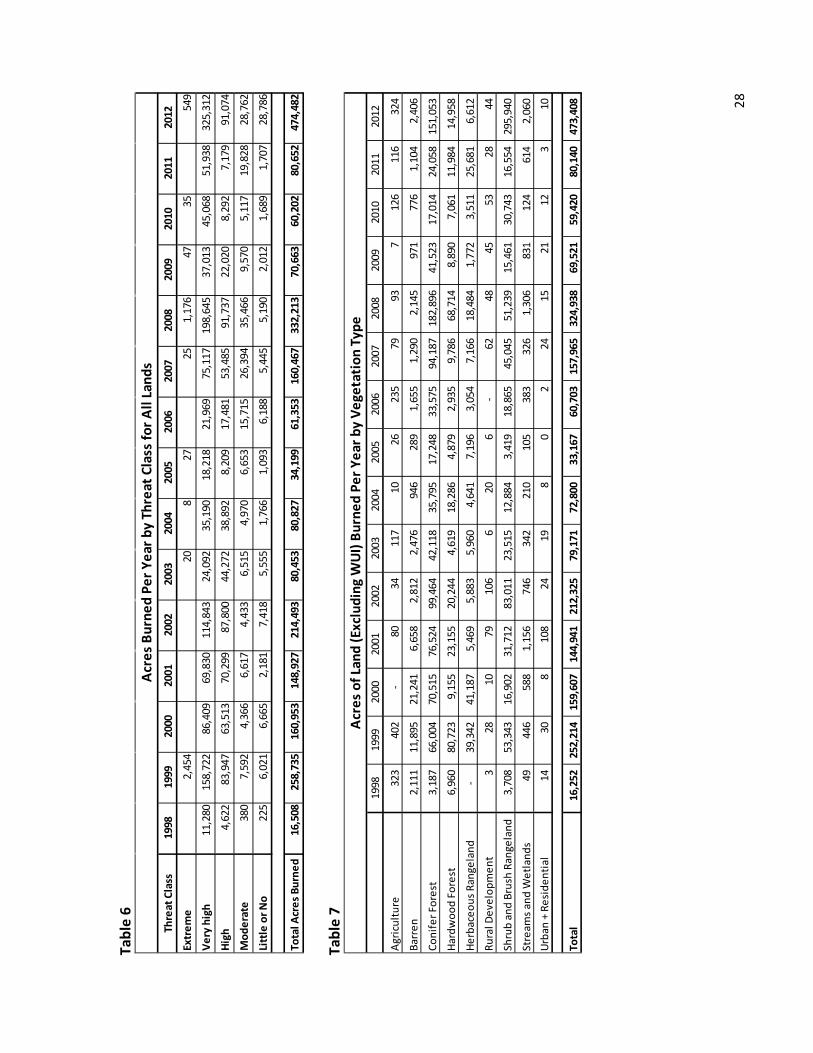
Ta
ble
6
Ta
ble
7
Thre
at C
lass
1998
1999
2000
2001
2002
2003
2004
2005
2006
2007
2008
2009
2010
2011
2012
Extr
eme
2,45
420
827
251,
176
4735
549
Very
hig
h11
,280
158,
722
86,4
0969
,830
114,
843
24,0
9235
,190
18,2
1821
,969
75,1
1719
8,64
537
,013
45,0
6851
,938
325,
312
High
4,62
283
,947
63,5
1370
,299
87,8
0044
,272
38,8
928,
209
17,4
8153
,485
91,7
3722
,020
8,29
27,
179
91,0
74
Mod
erat
e38
07,
592
4,36
66,
617
4,43
36,
515
4,97
06,
653
15,7
1526
,394
35,4
669,
570
5,11
719
,828
28,7
62
Litt
le o
r No
225
6,02
16,
665
2,18
17,
418
5,55
51,
766
1,09
36,
188
5,44
55,
190
2,01
21,
689
1,70
728
,786
Tota
l Acr
es B
urne
d16
,508
258,
735
160,
953
148,
927
214,
493
80,4
5380
,827
34,1
9961
,353
160,
467
332,
213
70,6
6360
,202
80,6
5247
4,48
2
Acr
es B
urne
d Pe
r Yea
r by
Thre
at C
lass
for A
ll La
nds
1998
1999
2000
2001
2002
2003
2004
2005
2006
2007
2008
2009
2010
2011
2012
Agric
ultu
re32
3
402
-
80
34
11
7
10
26
235
79
93
7
126
11
6
324
Barr
en2,
111
11,8
95
21,2
41
6,65
8
2,
812
2,47
6
94
6
289
1,
655
1,29
0
2,
145
971
77
6
1,10
4
2,
406
Coni
fer F
ores
t3,
187
66,0
04
70,5
15
76,5
24
99,4
64
42,1
18
35,7
95
17,2
48
33,5
75
94,1
87
182,
896
41
,523
17
,014
24
,058
15
1,05
3
Hard
woo
d Fo
rest
6,96
0
80
,723
9,
155
23,1
55
20,2
44
4,61
9
18
,286
4,
879
2,93
5
9,
786
68,7
14
8,89
0
7,
061
11,9
84
14,9
58
Herb
aceo
us R
ange
land
-
39,3
42
41,1
87
5,46
9
5,
883
5,96
0
4,
641
7,19
6
3,
054
7,16
6
18
,484
1,
772
3,51
1
25
,681
6,
612
Rura
l Dev
elop
men
t3
28
10
79
106
6
20
6
-
62
48
45
53
28
44
Shru
b an
d Br
ush
Rang
elan
d3,
708
53,3
43
16,9
02
31,7
12
83,0
11
23,5
15
12,8
84
3,41
9
18
,865
45
,045
51
,239
15
,461
30
,743
16
,554
29
5,94
0
Stre
ams a
nd W
etla
nds
49
446
58
8
1,15
6
74
6
342
21
0
105
38
3
326
1,
306
831
12
4
614
2,
060
Urba
n +
Resi
dent
ial
14
30
8
10
8
24
19
8
0
2
24
15
21
12
3
10
Tota
l16
,252
25
2,21
4
159,
607
14
4,94
1
212,
325
79
,171
72
,800
33
,167
60
,703
15
7,96
5
324,
938
69
,521
59
,420
80
,140
47
3,40
8
Acr
es o
f Lan
d (E
xclu
ding
WU
I) Bu
rned
Per
Yea
r by
Vege
tati
on T
ype
28
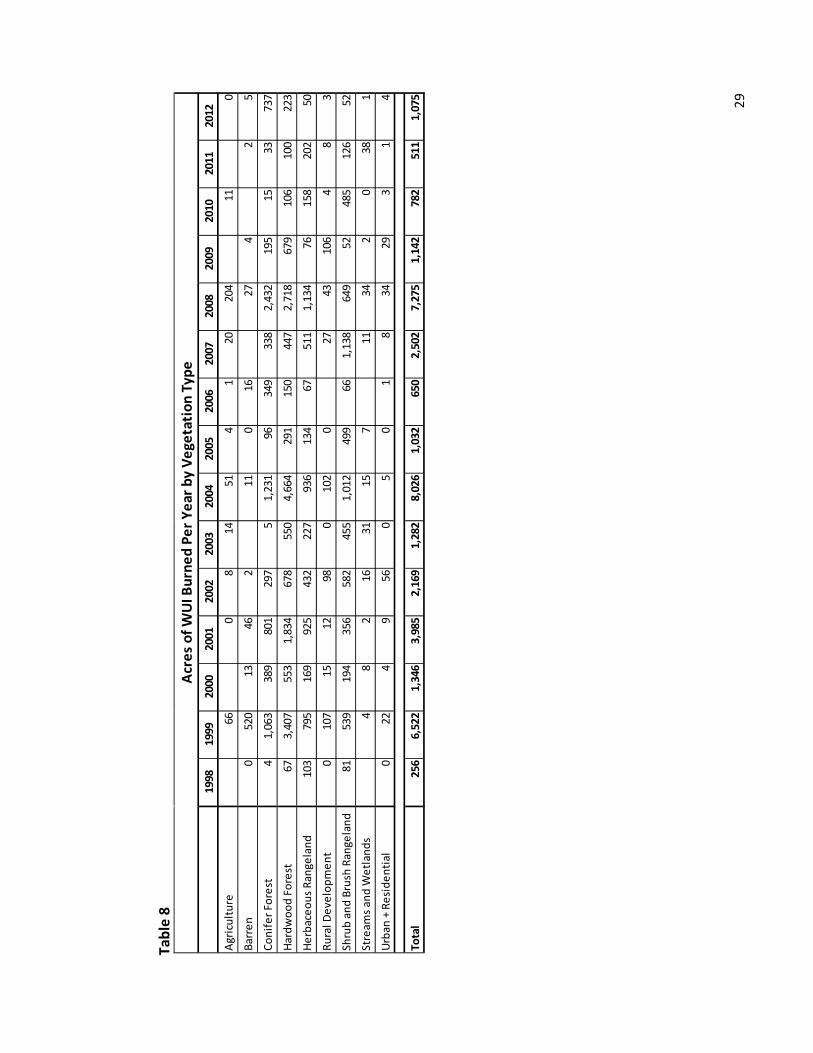
Ta
ble
8
1998
1999
2000
2001
2002
2003
2004
2005
2006
2007
2008
2009
2010
2011
2012
Agric
ultu
re66
08
1451
41
2020
411
0
Barr
en0
520
1346
211
016
274
25
Coni
fer F
ores
t4
1,06
338
980
129
75
1,23
196
349
338
2,43
219
515
3373
7
Hard
woo
d Fo
rest
673,
407
553
1,83
467
855
04,
664
291
150
447
2,71
867
910
610
022
3
Herb
aceo
us R
ange
land
103
795
169
925
432
227
936
134
6751
11,
134
7615
820
250
Rura
l Dev
elop
men
t0
107
1512
980
102
027
4310
64
83
Shru
b an
d Br
ush
Rang
elan
d81
539
194
356
582
455
1,01
249
966
1,13
864
952
485
126
52
Stre
ams a
nd W
etla
nds
48
216
3115
711
342
038
1
Urba
n +
Resi
dent
ial
022
49
560
50
18
3429
31
4
Tota
l25
66,
522
1,34
63,
985
2,16
91,
282
8,02
61,
032
650
2,50
27,
275
1,14
278
251
11,
075
Acr
es o
f WU
I Bur
ned
Per Y
ear b
y Ve
geta
tion
Typ
e
29
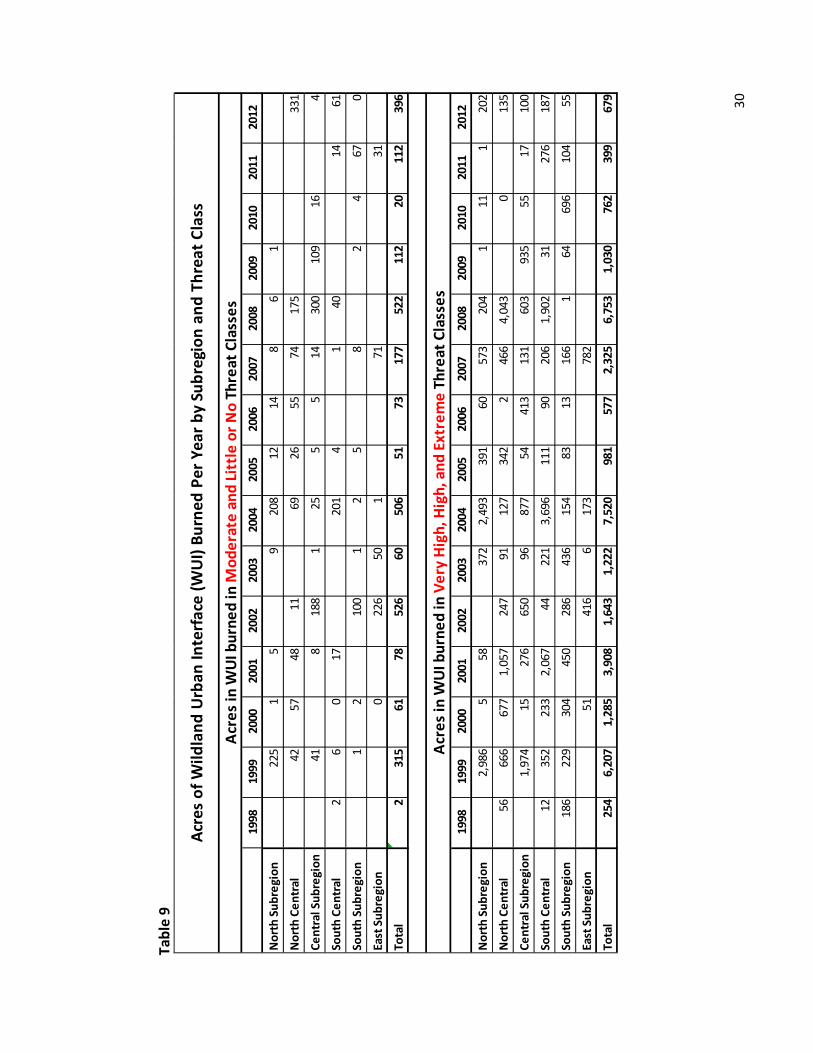
Ta
ble
9
1998
1999
2000
2001
2002
2003
2004
2005
2006
2007
2008
2009
2010
2011
2012
Nor
th S
ubre
gion
225
15
920
812
148
61
Nor
th C
entr
al42
5748
1169
2655
7417
533
1
Cent
ral S
ubre
gion
418
188
125
55
1430
010
916
4
Sout
h Ce
ntra
l2
60
1720
14
140
1461
Sout
h Su
breg
ion
12
100
12
58
24
670
East
Sub
regi
on0
226
501
7131
Tota
l2
315
6178
526
6050
651
7317
752
211
220
112
396
1998
1999
2000
2001
2002
2003
2004
2005
2006
2007
2008
2009
2010
2011
2012
Nor
th S
ubre
gion
2,98
65
5837
22,
493
391
6057
320
41
111
202
Nor
th C
entr
al56
666
677
1,05
724
791
127
342
246
64,
043
013
5
Cent
ral S
ubre
gion
1,97
415
276
650
9687
754
413
131
603
935
5517
100
Sout
h Ce
ntra
l12
352
233
2,06
744
221
3,69
611
190
206
1,90
231
276
187
Sout
h Su
breg
ion
186
229
304
450
286
436
154
8313
166
164
696
104
55
East
Sub
regi
on51
416
617
378
2
Tota
l25
46,
207
1,28
53,
908
1,64
31,
222
7,52
098
157
72,
325
6,75
31,
030
762
399
679
Acre
s in
WUI
bur
ned
in M
oder
ate
and
Litt
le o
r No
Thre
at C
lass
es
Acre
s in
WUI
bur
ned
in V
ery
High
, Hig
h, a
nd E
xtre
me
Thre
at C
lass
es
Acre
s of
Wild
land
Urb
an In
terf
ace
(WU
I) Bu
rned
Per
Yea
r by
Subr
egio
n an
d Th
reat
Cla
ss
30
Sierra Nevada Conservancy Agenda Item X September 12, 2013 2013-14 Budget/SNC Programs Discussion Background In September 2012, staff identified seven programs that encompass the activities the Sierra Nevada Conservancy (SNC) undertakes on behalf of the Region. These programs align with the SNC’s mission and enabling legislation and provide a means to organize its activities in support of the seven subject matter focused program goals also included in its enabling legislation. These program areas are:
• Policy Development (State and Federal) • Education and Advocacy • Region-wide Projects • Grants • Collaborative Planning • Technical and Other Assistance • Research and Monitoring
In June 2013 the SNC Board approved the 2013-14 Action Plan, which includes the following major initiatives and projects to be undertaken by the SNC between July 2013 and June 2014, consistent with SNC’s Strategic Plan:
• Grant Program • Sierra Nevada Forest and Community Initiative (SNFCI) • Biomass Utilization • Abandoned Mine Lands • Regional Agriculture and Ranching • Regional Tourism and Recreation • Ecosystem Services • Education and Communications • Great Sierra River Cleanup • Pacific Forest and Watershed Lands Stewardship Council (Stewardship Council) • Mt. Whitney Fish Hatchery • Sierra Nevada System Indicators • Internal Operations
Current Status Today’s report provides more detail regarding the SNC’s overall budget and expenditures in the category of personal services and contracts, and focuses on aligning anticipated contract expenditures for Fiscal Year (FY) 2013-14 with the seven programs and the 2013-14 Action Plan noted above. Staff expects to present this information at the September meeting each year, following approval of the coming year’s Action Plan in June.
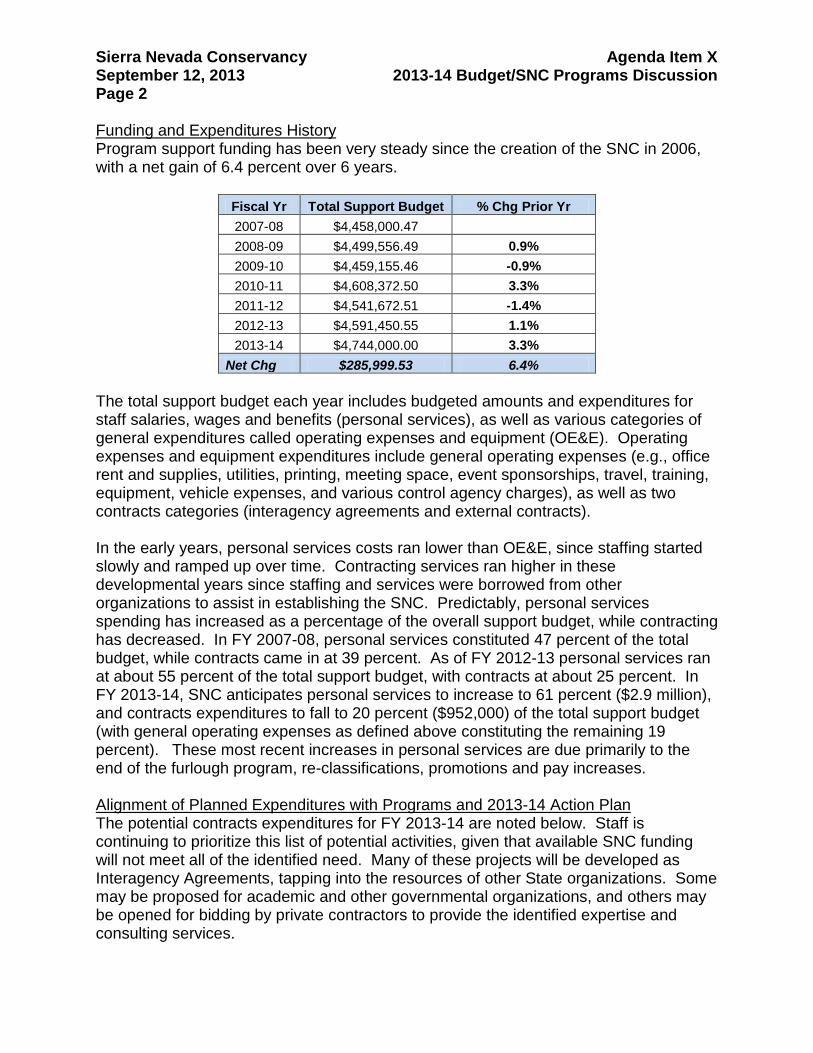
Sierra Nevada Conservancy Agenda Item X September 12, 2013 2013-14 Budget/SNC Programs Discussion Page 2 Funding and Expenditures History Program support funding has been very steady since the creation of the SNC in 2006, with a net gain of 6.4 percent over 6 years.
Fiscal Yr Total Support Budget % Chg Prior Yr 2007-08 $4,458,000.47
2008-09 $4,499,556.49 0.9% 2009-10 $4,459,155.46 -0.9% 2010-11 $4,608,372.50 3.3% 2011-12 $4,541,672.51 -1.4% 2012-13 $4,591,450.55 1.1% 2013-14 $4,744,000.00 3.3%
Net Chg $285,999.53 6.4% The total support budget each year includes budgeted amounts and expenditures for staff salaries, wages and benefits (personal services), as well as various categories of general expenditures called operating expenses and equipment (OE&E). Operating expenses and equipment expenditures include general operating expenses (e.g., office rent and supplies, utilities, printing, meeting space, event sponsorships, travel, training, equipment, vehicle expenses, and various control agency charges), as well as two contracts categories (interagency agreements and external contracts). In the early years, personal services costs ran lower than OE&E, since staffing started slowly and ramped up over time. Contracting services ran higher in these developmental years since staffing and services were borrowed from other organizations to assist in establishing the SNC. Predictably, personal services spending has increased as a percentage of the overall support budget, while contracting has decreased. In FY 2007-08, personal services constituted 47 percent of the total budget, while contracts came in at 39 percent. As of FY 2012-13 personal services ran at about 55 percent of the total support budget, with contracts at about 25 percent. In FY 2013-14, SNC anticipates personal services to increase to 61 percent ($2.9 million), and contracts expenditures to fall to 20 percent ($952,000) of the total support budget (with general operating expenses as defined above constituting the remaining 19 percent). These most recent increases in personal services are due primarily to the end of the furlough program, re-classifications, promotions and pay increases. Alignment of Planned Expenditures with Programs and 2013-14 Action Plan The potential contracts expenditures for FY 2013-14 are noted below. Staff is continuing to prioritize this list of potential activities, given that available SNC funding will not meet all of the identified need. Many of these projects will be developed as Interagency Agreements, tapping into the resources of other State organizations. Some may be proposed for academic and other governmental organizations, and others may be opened for bidding by private contractors to provide the identified expertise and consulting services.
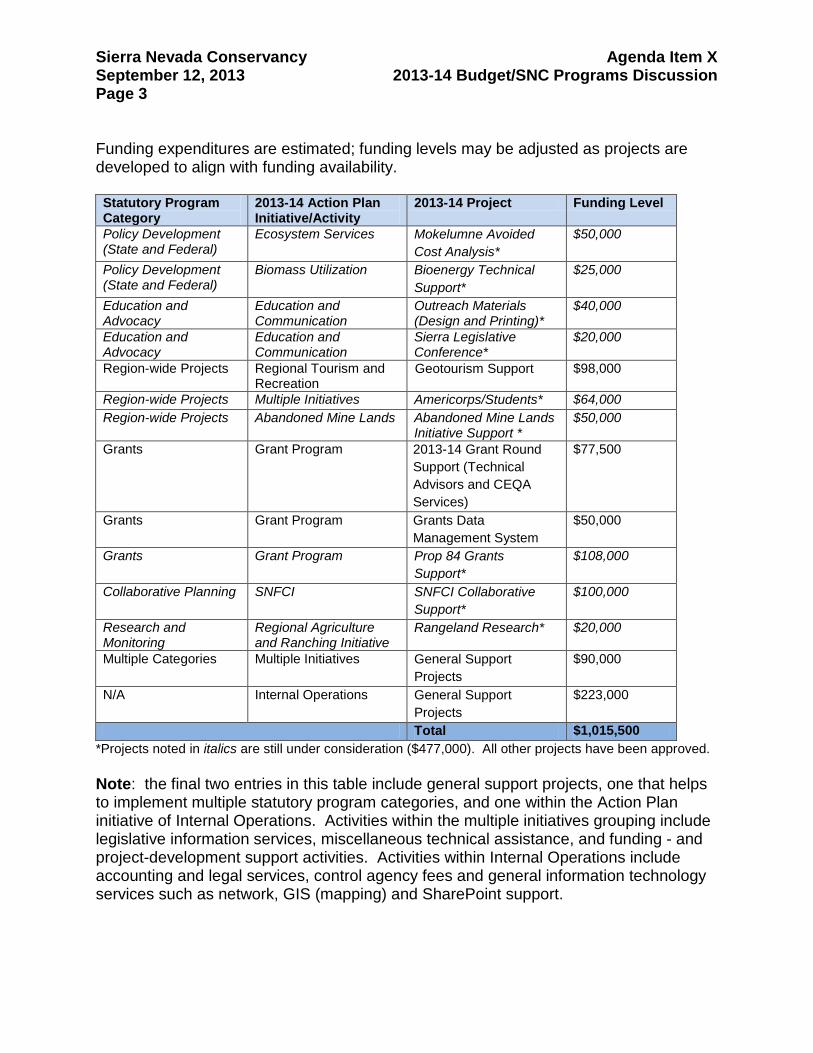
Sierra Nevada Conservancy Agenda Item X September 12, 2013 2013-14 Budget/SNC Programs Discussion Page 3 Funding expenditures are estimated; funding levels may be adjusted as projects are developed to align with funding availability. Statutory Program Category
2013-14 Action Plan Initiative/Activity
2013-14 Project Funding Level
Policy Development (State and Federal)
Ecosystem Services Mokelumne Avoided Cost Analysis*
$50,000
Policy Development (State and Federal)
Biomass Utilization
Bioenergy Technical Support*
$25,000
Education and Advocacy
Education and Communication
Outreach Materials (Design and Printing)*
$40,000
Education and Advocacy
Education and Communication
Sierra Legislative Conference*
$20,000
Region-wide Projects Regional Tourism and Recreation
Geotourism Support $98,000
Region-wide Projects Multiple Initiatives Americorps/Students* $64,000 Region-wide Projects Abandoned Mine Lands Abandoned Mine Lands
Initiative Support * $50,000
Grants Grant Program 2013-14 Grant Round Support (Technical Advisors and CEQA Services)
$77,500
Grants Grant Program Grants Data Management System
$50,000
Grants Grant Program Prop 84 Grants Support*
$108,000
Collaborative Planning SNFCI SNFCI Collaborative Support*
$100,000
Research and Monitoring
Regional Agriculture and Ranching Initiative
Rangeland Research* $20,000
Multiple Categories Multiple Initiatives General Support Projects
$90,000
N/A Internal Operations General Support Projects
$223,000
Total $1,015,500 *Projects noted in italics are still under consideration ($477,000). All other projects have been approved. Note: the final two entries in this table include general support projects, one that helps to implement multiple statutory program categories, and one within the Action Plan initiative of Internal Operations. Activities within the multiple initiatives grouping include legislative information services, miscellaneous technical assistance, and funding - and project-development support activities. Activities within Internal Operations include accounting and legal services, control agency fees and general information technology services such as network, GIS (mapping) and SharePoint support.

Sierra Nevada Conservancy Agenda Item X September 12, 2013 2013-14 Budget/SNC Programs Discussion Page 4 Recommendation This is an informational item only; no formal action is needed by the Board at this time, although Boardmembers are encouraged to share their thoughts and comments.
Sierra Nevada Conservancy Agenda Item XI a September 12, 2013 Bioenergy Action Plan Implementation
Background During the past few years, the Sierra Nevada Conservancy (SNC) has been actively addressing the need for forest restoration efforts through its grant program and the Sierra Nevada Forest and Community Initiative (SNFCI). Large damaging fires have been increasing in size and severity and most scientists predict that this will continue under current forest conditions and increasing temperatures. For a variety of reasons, there is currently excess biomass ‘fuel’ (mostly brush and small diameter trees) built up in the forest. One means to reduce large, catastrophic fire is through forest restoration treatments involving removal of biomass. Developing markets for the utilization of biomass is important to provide financial support for forest treatment and more specifically fuel reduction at the scale necessary to reduce fire size and severity. In many instances the costs of collection, processing, and transport of biomass is prohibitive, resulting in other means of disposal – such as piling and burning – or restoration projects not being accomplished. Recent state planning efforts and policies support the use of biomass to create renewable energy while at the same time protecting the state’s valuable forests, and the region’s communities, from catastrophic wildfire. Development of additional biomass power generation facilities in the Sierra Nevada Region that utilize forest byproduct will provide a ready market for biomass. Recently, State policy and planning has focused on supporting small scale facilities distributed in fire threat areas. The 2012 State Bioenergy Action Plan was released in August of last year. This plan, prepared by the Bioenergy Interagency Working Group, acknowledges the benefits of forest biomass, stating:
“Increased utilization of forest biomass residues improves community safety and forest health by offsetting costs of forest restoration, fuel reduction, and forest thinning treatments. These activities reduce wildfire hazards and mitigate wildfire damage to public health and safety, natural resources, infrastructure, and public and private property. Restoration activities can also make forest ecosystems more resilient to the effects of climate change. Community-scale distributed generation facilities using forest biomass residues are important for forest restoration and protection as well as community development. Scaling bioenergy facilities to the community’s resource potential ensures that biomass use is environmentally and economically sustainable. Sustainable development will promote long-term economic and social stability in rural, economically-disadvantaged communities by providing construction, plant operation, and in-forest biomass collection and transportation jobs.”
The 2012 Bioenergy Action Plan includes a broad array of action items related to the promotion of forest bioenergy. The SNC is identified as one of the key responsible agencies for these action items, particularly in assisting forested communities to develop small scale forest bioenergy facilities.
Sierra Nevada Conservancy Agenda Item XI a September 12, 2013 Bioenergy Action Plan Implementation Page 2 Shortly following the adoption of the Bioenergy Action Plan, legislation requiring large utilities to purchase bioenergy was signed into law. Senate Bill 1122 (Rubio, Chapter 612 Stats. 2012), adds new benchmarks for the development of small scale forest biomass projects. It requires the state’s three large investor owned utilities to collectively purchase 50 megawatt (MW) of energy from new small scale (3 MW or less) bioenergy projects using byproduct of sustainable forest management. Senate Bill 1122 added new urgency to the SNC’s responsibilities under the Bioenergy Action Plan by adding an additional 50 MW of forest biomass from a minimum of 16 new facilities in the next 10 years. This will take a concerted and coordinated effort and SNC is prepared to continue playing a lead role in the development of forest bioenergy facilities in the Sierra Nevada Region. Current Status SNC Staff is focused on specific tasks to support both the Action Pan and SB 1122 implementation. The California Public Utilities Commission (CPUC) is responsible for implementing SB 1122 and is conducting a formal public process to receive input from various stakeholders on specific implementation issues. SNC staff has submitted written comments as well as attended workshops and meetings to provide verbal comments on these issues. Senate Bill 1122 requires that California Department of Forestry and Fire Protection (CALFIRE) assist CPUC to determine the megawatt allocations based on the amount of forest byproduct derived from sustainable forest management practices. CALFIRE has requested SNC assist with outreach to key stakeholders and to help develop a transparent process that can support consensus with standards to support this determination. SNC and CALFIRE are planning the second workshop to convene stakeholders to develop some common understanding and agreement with this. SNC has provided professional facilitation services for this process through the Sacramento State Center for Collaborative Process. SNC Staff is also coordinating with up to 12 communities interested in a forest bioenergy facility in their area. Staff has been providing support by identifying funding sources and assisting with funding applications, helping to coordinate outreach efforts to build support for projects, providing technical assistance and funding. There are three communities that are well into the project planning process. These include a 1 MW project in Calaveras County (Wilseyville), which has completed a feasibility study and was recently awarded federal funding for the design and engineering of a facility. A 1 MW facility in Madera County (North Fork), which has completed a feasibility study and is currently engaged in pre-development design/engineering and California Environmental Quality Act (CEQA) documentation. The SNC has been providing assistance to the Wilseyville and North Fork projects, which are both in communities suffering from severe economic conditions. It is intended that these two projects will act as demonstrations for other communities in the Region where forest bioenergy would be both feasible and beneficial.
Sierra Nevada Conservancy Agenda Item XI a September 12, 2013 Bioenergy Action Plan Implementation Page 3 Additionally, Placer County is pursuing a 2 MW facility and recently adopted the Environmental Impact Report (EIR) and issued the conditional use permit. The County’s EIR was appealed by the Center for Biological Diversity (CBD) and SNC Staff assisted the County and other partners to negotiate conditions leading to CBD withdrawing the appeal. More recently, CBD has appealed the environmental report supporting the North Fork project implementation. SNC Staff is now leading a similar negotiation process between Madera County, the project proponents and CBD. The Action Plan directs SNC to develop community scaled facility criteria to support appropriate sizing and location of facilities. SNC is coordinating with UC Berkeley, CALFIRE and US Forest Service to develop location criteria and a tool to pre-assess the validity of specific locations to support a successful project. This tool will also be used to proactively identify suitable sites for bioenergy facilities. TSS Consulting was recently retained to provide technical assistance and some policy support to SNC and project partners. SNC remains involved in the Biomass Working Group, which includes representatives from federal and state agencies, forest and energy industries, conservation and community development groups as well as technical experts. The SNC is an active member of the working group and has provided coordination assistance and additional resources for the activities it undertakes. In addition, SNC participates in the State Bioenergy Working Group, led by the Natural Resources Agency and Cal EPA. The purpose of this group is to coordinate several key State agencies to implement the Bioenergy Action Plan. This group meets quarterly in the Governor’s office. Next Steps Focus areas for the SNC’s Forest Bioenergy Team’s activities, working with CALFIRE, Forest Service and other partners, over the next year will include:
• Continuing to provide project support for the North Fork and Wilseyville Projects and evaluate and prioritize other projects to lend support to;
• Identifying new funding opportunities and providing grant writing assistance for appropriate funding opportunities;
• Evaluating projects that have completed pre-assessment work as potential candidates for SNC’s Healthy Forest grant program;
• Developing the optimal location criteria and tool to identify the most appropriate sites for forest bioenergy;
• Working with CALFIRE to convene stakeholders to develop a common understanding of feedstock from sustainable forest management to support SB 1122 implementation;
• Facilitating efforts to resolve CEQA concerns and other potential project barriers to reach resolution;
• Providing targeted education and assisting in tours for representatives of key agencies, such as the CPUC, the Energy Commission, and the Air Resources Board; and,
Sierra Nevada Conservancy Agenda Item XI a September 12, 2013 Bioenergy Action Plan Implementation Page 4
• Assisting to develop educational materials and participating in workshops regarding SB 1122 implementation.
Recommendation This is an informational item only; no formal action is needed by the Board at this time, although Boardmembers are encouraged to share their thoughts and comments.
Sierra Nevada Conservancy Agenda Item XI b September 12, 2013 Sierra Nevada Geotourism MapGuide Project Update
Background The Sierra Nevada Geotourism (SNGT) MapGuide Project is a multi-faceted tourism promotion effort managed through a partnership of the Sierra Nevada Conservancy (SNC), National Geographic, and the Sierra Business Council (SBC). Through the use of an interactive Web site, a printed MapGuide, mobile phone applications, and social media tools the project highlights and promotes California’s Sierra Nevada Region as a world class tourism destination. The project supports the SNC’s mandate to enhance tourism in the Sierra Nevada Region while also promoting the preservation of cultural and heritage resources. Funding and in-kind support for the project has come from several sources, in addition to the SNC, including: The National Scenic Highways and Byways Administration, Sierra Business Council, Morgan Family Foundation, U.S. Forest Service, National Park Service, Bureau of Land Management, California State Parks, Nevada Commission on Tourism, multiple Sierra counties, several Tribal Entities, Northern Sierra Partnership, and many more local businesses and service groups. The project has grown a list of more than 92 supporters that have formally endorsed the project, including all 22 Sierra Nevada counties. Current Status The SNGT Web site continues to be the foundational element of the project. The site currently contains more than 1,549 published destination pages, 180 videos, and receives more than 179,000 content views from 113 countries every month. Staff continues to assist local contributors establish new destination pages and events every month. The site can be accessed at www.sierranevadageotourism.org. During the last year, the project launched mobile phone applications (apps) for iPhone and Android users providing access to the entire Web site content while traveling in the Region. Users have the option of enabling GPS technology to enhance functionality of the apps for real-time updates based on their current location in the Sierra. Software developers are currently working to enable “alert” tools for the apps allowing travelers to be notified of business special alerts, travel packages, itinerary suggestions, traffic conditions, and current events. More than 4,481 people have downloaded apps, which are available for free to the public. To help promote the Web site and increase usage, the partnership has printed and distributed 160,000 printed MapGuides, highlighting 250 destinations in the Region. The MapGuides were strategically distributed at visitor centers, California Welcome Centers, corporate locations, rental car agencies, sports events, museums, and businesses to encourage more travel to the Region. Marketing of the project’s services and products has been a primary focus during the last year. Significant achievements been made to build brand identity and reach target markets of travelers most inclined to visit the Region. Marketing accomplishments include earned-media attention in more than 140 printed publications, television and radio interviews and references in online and social media. The project has also
Sierra Nevada Conservancy Agenda Item XI b September 12, 2013 Sierra Nevada Geotourism MapGuide Project Update Page 2 secured advertising placement in Visit California’s Annual Travel Planner, Sunset Magazine, Via Magazine, and Sierra Heritage Magazine. Since print advertising began in April 2013, content views on the Web site have increased by 55 percent (179,000+ in July). Sunset, Via, and California Travel Planner offer their readers the opportunity to request more specific information about destinations. As a result of this service, more than 1,400 MapGuides have been direct-mailed to individuals who requested more information on reader service cards. Next Steps SNC Staff and project partners will continue to assist in the development and addition of fresh content to the Web site and will also be working with existing destination page-owners to strengthen their support and use of the site as a marketing tool. Project partners also publish and distribute a monthly GeoExplorer Newsletter to a subscriber database of 3,054 and growing. The newsletter features Web site tips, business marketing suggestions, new destinations, and additional opportunities for supporter involvement. A broad range of marketing efforts will continue for all aspects of the project, including distribution of regular press releases, attendance at shows, events, and conferences, and placement of paid advertising. Project partners are also pursuing grant opportunities to further develop the project. To date, the development of the project and its supporting products has been co-managed by the SNC and the SBC. Staffs from both organizations are currently developing a Memorandum of Understanding (MOU) that outlines the future management strategy of the project. As the project has shifted from a construction phase to a business maintenance phase it has become apparent that management should be consolidated under one entity. This approach will ease decision making and maximize use of resources for both organizations. The MOU will outline the ongoing commitments of the SBC to manage the business aspects of the project and also identify the ongoing roles of the SNC as a founding partner. In order to consolidate business operations, some of the project assets (mobile phone applications) are anticipated to be transferred to SBC to support the ongoing success and growth of the project. The SNC will continue to support the project and participate in annual strategic planning to help guide future developments and improvements to the project. Recommendation This is an informational item only; no formal action is needed by the Board at this time, although Boardmembers are encouraged to share their thoughts and comments.