Seminar 11 - Optimization for Next Generation Systems
20
Optimization of Air-to-Refrigerant Evaporator with Low-GWP Refrigerants Piotr A. Domanski National Institute of Standards and Technology [email protected] Seminar 11 - Optimization for Next Generation Systems
Transcript of Seminar 11 - Optimization for Next Generation Systems

Optimization of Air-to-Refrigerant Evaporator with Low-GWP Refrigerants
Piotr A. Domanski
National Institute of Standards and Technology
Seminar 11 - Optimization for Next Generation Systems

• Explain how circuitry optimization affects both heat exchanger performance and the system performance
• Describe how multi-objective optimization is needed to improve heat exchanger performance according to multiple performance criteria
• Understand the potentials of buildings as virtual batteries
• Understand how to use AMPL for building modeling and optimization
Learning Objectives

Honghuyun ChoChosun University, S. Korea
This presentation is based on the paper:Cho, H., Domanski, P.A., 2016. Optimized Air-to-Refrigerant Heat Exchanger with Low-GWP Refrigerants, 12th IIR Gustav Lorentzen Conference on Natural Working Fluids, Edinburgh, UK, August 21-24, 2016. DOI:10.18462/iir.gl.2016.1140
Acknowledgements

Outline/Agenda
Evaluation of Alternative Refrigerants Performance
Studied Case
o Evaporator Design and Air Distribution
Refrigerant Circuitry Optimization Process
Optimization Results
Conclusions
o Refrigerants

Evaluation of Alternative Refrigerant Performance
Cycle simulations Semi-theoretical models
Drop-in system tests with ‘soft optimization’ Changed: expansion device
refrigerants chargelubricant
Abdelaziz, O., Shrestha, S., Munk, J., Linkous, R., Goetzler, W., Guernsey, M., Kassuga, T., 2015. Alternative Refrigerant Evaluation for High-Ambient-Temperature Environments: R-22 and R-410A Alternatives for Mini-Split Air Conditioners, ORNL/TM-2015/536
Unchanged: compressor (volumetric displacement, design) evaporator and condenser (refrigerant circuitry)
Question: How much different will be air conditioner capacity and COP when the evaporator circuitry is optimized?
Tests in optimized systems

Studied Refrigerants
Fluid Composition Mass fraction (%)
Temperature glide (K)
Safety classification GWP
R22 groupR22 R22 100 0 A1 1760
MIX-1 R32/R125/R134a/R1234yf 13/13/31/43 4.0 A1 904R444B R32/R152a/R1234ze(E) 41.5/10/48.5 7.9 A2L 295R454C R32/R1234yf 21.5/78.5 6.1 A2L 146R290 R290 100 0 A3 3
R1270 R1270 100 0 A3 2 R717 R717 100 0 B2 <1
R410A group R410A R32/R125 50/50 0.1 A1 1924
MIX-2 R32/R1234yf/R1234ze(E) 68/26/6 1.7 A2L 461R32 R32 100 0 A2L 677
MIX-3 R32/134a/1234ze(E) 76/6/18 2.7 A2L 593R452B R32/R125/R1234yf 67/7/26 1.0 A2L 676R447A R32/R125/R1234ze(E) 68/3.5/28.5 3.8 A2L 572R744 R744 100 0 A1 1
*
*
*
* Blend not classified by ASHRAE

Liquid viscosity pressure drop
Refrigerant Properties referenced to R22 or R410A
Vapor specific volume pressure drop, dTsat/dP
Liquid conductivity heat transfer coefficient
R22 group R410A group
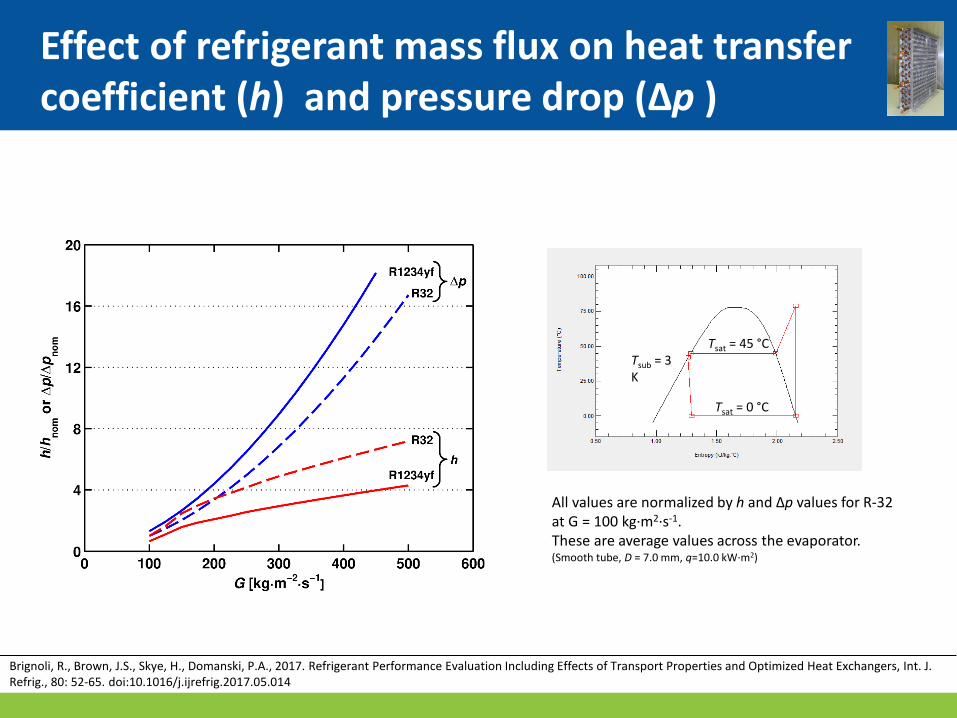
Effect of refrigerant mass flux on heat transfer coefficient (h) and pressure drop (Δp )
All values are normalized by h and Δp values for R-32at G = 100 kg∙m2∙s-1. These are average values across the evaporator.(Smooth tube, D = 7.0 mm, q=10.0 kW∙m2)
Tsat = 0 °C
Tsat = 45 °CTsub = 3 K
Brignoli, R., Brown, J.S., Skye, H., Domanski, P.A., 2017. Refrigerant Performance Evaluation Including Effects of Transport Properties and Optimized Heat Exchangers, Int. J. Refrig., 80: 52-65. doi:10.1016/j.ijrefrig.2017.05.014

Location
Velo
city
Mountingbrackets
Metalsheet
Condensatecollectiontray
Evaporator Design and Air Distribution

Mountingbrackets
Metalsheet
Condensatecollectiontray
Location
Velo
city
Evaporator Design and Air Distribution

Location
Velo
city
Mountingbrackets
Metalsheet
Condensatecollectiontray
Evaporator Design and Air Distribution

Location
Velo
city
Mountingbrackets
Metalsheet
Condensatecollectiontray
Evaporator Design and Air Distribution

Refrigerant Circuitry Optimization Process
EVAP-COND: simulation package with refrigerant circuitry optimization module
Features: Tube-by-tube or tube sectional simulation One-dimensional, non-uniform air distribution Simulation of refrigerant distribution Refrigerant circuitry optimization (ISHED)
- evolutionary computation- knowledge based + symbolic learning
Optimization parameters: Number of members in a population: 40 Number of populations: 300
12000 members evaluated in a single optimization run
Heat Exchanger
Model
Evolutionary Learning Module
Symbolic Learning Module
Architecture Generation Submodule
Architecture Modification Submodule
Control Module
Evaluation of Architectures
Calls
CallsRule
Select Architecture
Candidate Architecture
Candidate Architecture
Air flow
Air velocity profile
Coil height
Air velocity
Fins
Refrigerant exit tube
Refrigerant inlet tube
Refrigerant exit tubeReturn bend on the near side
Return bend on the far side

Operating Conditions
Inlet air condition Dry-bulb temperature: 26.6 °C Relative humidity: 50 % Pressure: 101.325 kPa
Refrigerant conditionsExit dew-point temperature: 7.2 °CExit superheat: 5.6 °CInlet quality:
Refrigerant Inlet quality (%)R22 17.6
MIX-1 22.2R444B 18.7R454C 22.4R290 20.8
R1270 20.3R717 10.8
R410A 22.0MIX-2 19.3R32 17.6
MIX-3 18.1R452B 19.7R447A 18.6R744 28.4
Three refrigerant circuitries considered
Original
Optimized for R22 or R410A Optimized for each refrigerant
Tsat= 42.0 °C
Tsub= 5.0 °C
Tsat= 7.2 °C
Tsup= 5.6 °C

Capacity with Circuitry Optimized for R22 & R410A
R22 group R410A group
Original circuitry:
referenced to the capacity with the original circuitry
-4.0
-2.0
0.0
2.0
4.0
6.0
8.0
10.0
12.0
R22 MIX-1 R444B R454C R290 R1270 R717
(Q-Q
ORI
G )/Q
ORI
G ·1
00 %
(QO
PT,R
22 -
QO
RG )/
QO
RG
(%)
0.0
2.0
4.0
6.0
8.0
10.0
12.0
14.0
16.0
R410A MIX-2 R32 MIX-3 R452B R447A R744
(QO
PT,R
401A
-QO
RG)/
QO
RG
(%)
Optimized circuitries: R22 R410A
2 outlets 2 inlets 2 outlets 1 inlet

Capacity with Circuitry Optimized for Each Refrigerant
R22 group R410A group
referenced to the capacity with the original circuitry
Number of outlet tubes1 2 3 4
Number of inlet tubes
1 R744 R410A, MIX-2, R32, R452B, MIX-3, R12702 R22, R444B, R290 R447A, R454C MIX-1, R717

Domanski, P.A., 1989. Rating Procedure for Mixed Air Source Unitary Air Conditioners and Heat Pumps Operating in the Cooling Mode - Revision 1, NISTIR 89-4071
Impact on System Performance
≈QOPT
QORG
0.21COPOPT
COPORG
≈QOPT
QORG
0.35QSYSTEM,OPT
QSYSTEM,ORG
When the evaporator is replaced, QSYSTEM and COP
will scale with the ratio of coil capacities QOPTQORG Tsat
0.351.12 = 1.04 (4 %)
1.12 = 1.024 (2.4 %)0.21
Pevap
mref
Pcond
Note: sensitive heat ratio will change

Conclusions
Zeotropic blends with a significant temperature glide are particularly sensitive to the layout of refrigerant circuitry.
We optimized refrigerant circuitry of an evaporator to account for thermophysical refrigerant thermophysical properties and non-uniform air distribution.
All fluids benefited from optimization over the original R22 design. Higher-pressure fluids benefits more from optimization than lower-pressure fluids.
Optimized evaporator circuitries would improve “drop-in” system capacities by 1 % to 4 % and COPs by 1 % to 2.4 %.

Bibliography
Abdelaziz, O., Shrestha, S., Munk, J., Linkous, R., Goetzler, W., Guernsey, M., Kassuga, T., 2015. Alternative Refrigerant Evaluation for High-Ambient-Temperature Environments: R-22 and R-410A Alternatives for Mini-Split Air Conditioners, ORNL/TM-2015/536
Cho, H., Domanski, P.A., 2016. Optimized Air-to-Refrigerant Heat Exchanger with Low-GWP Refrigerants, 12th IIR Gustav Lorentzen Conference on Natural Working Fluids, Edinburgh, UK, August 21-24, 2016. DOI:10.18462/iir.gl.2016.1140
Domanski, P.A., 1989. Rating Procedure for Mixed Air Source Unitary Air Conditioners and Heat Pumps Operating in the Cooling Mode - Revision 1, NISTIR 89-4071
Domanski, P.A., Yashar, D.A, Wojtusiak, J., 2014. EVAP-COND, Version 4.0: Simulation Models for Finned-Tube Heat Exchangers with Circuitry Optimization. National Institute of Standards and Technology, Gaithersburg, MD.https://www.nist.gov/services-resources/software/evap-cond
Brignoli, R., Brown, J.S., Skye, H., Domanski, P.A., 2017. Refrigerant Performance Evaluation Including Effects of Transport Properties and Optimized Heat Exchangers, Int. J. Refrig., 80: 52-65. doi:10.1016/j.ijrefrig.2017.05.014