Semi-Annual Report 2012 - ENR
40
Semi-Annual Report 2012
Transcript of Semi-Annual Report 2012 - ENR
Semi-Annual Report 2012


Letter to Shareholders 4 – 5
Economic and Political Review 6 – 9
Portfolio Investments 10 – 13
Financial Statements 14 – 35
Annexure: Investment Guidelines 36 – 37
Shareholder Information and Corporate Details 38
Contents
3

Dear shareholders,
For the six months ended June 30, 2012 ENR Russia Invest SA (“ENR” or the “Company”) and its subsidiaries made a consolidated net profit of CHF 3.81 million (CHF 345’779 net profit at June 30, 2011). At June 30, 2012 our IFRS based consolidated net asset value was CHF 102.09 million (CHF 98.28 million at December 31, 2011).
The six months up to June 30, 2012 was rather flat for Russian Federation (“Russia”) stock mar-kets and year-to-date (“YTD”) the RTS index ap-preciated by 0.75% in US dollar terms and by 1.90% in CHF terms. The USD/CHF exchange rate was 0.9381 at the start of 2012 and 0.9485 at June 30, 2012. The Rouble gained 0.34% against the CHF for the six months ended June 30, 2012.
In the first half of 2012, spreads on bonds tight-ened, face values increased and we generated an aggregate return of 5.73% in USD terms on our USD and CHF fixed income instruments. In aggregate we have realised CHF 24.79 million via bond sales or redemption transactions and rein-vested CHF 28.86 million in fixed income instru-ments of known Russian companies in the first half of 2012.
On the private equity side ENR continued with a leading role in assisting Transterm Holdings Cy-prus Limited (“Transterm”) with the disposal of
its remaining asset in Russia. Transterm, in late June 2012 concluded a sale agreement to dis-pose of this asset and it is expected that the transaction could close in the third quarter of 2012. Transterm will then proceed to distribute available net sale proceeds to its shareholders, where we will receive our proportionate share.
In March 2012 Kuzbassenergo, a Russian ther-mal power generation and electric power distri-bution business spun-off certain of its subsid-iaries to eliminate cross-subsidization between profitable and loss-making power plants. We re-ceived shares in the following private compa-nies which were spun-off: Kuznetskaya TPP; Barnaulskya TPP-3; Kemerovskaya Generatsia; Novokemerovkaya TPP; and Barnaulskaya Generatsia.
During June 2012 we were successful with a bid to acquire a small non-performing loan portfo-lio (“NPL”) sold by a Russian bank for a purchase consideration of RUR 15’562’269 (CHF 454’216). This NPL portfolio will be collected on our behalf by National Recovery Services, Russia’s largest collection business.
Based on the aggregate value of our invest-ments (including treasury shares) ENR was 96.31% invested at June 30, 2012.
4
Letter to Shareholders

Following the recent Russian presidential elec-tions, Mr. Putin’s returned to the presidency and Mr. Medvedev was appointed as prime minister. Russia’s gross domestic product (“GDP”) is ex-pected to grow between 3% - 4% in 2012. For 2013, the International Monetary Fund forecast GDP growth of 3.9% and the European Bank for Reconstruction and Development forecasted 3.3%. In June 2012 unemployment was at 5.4%, a historic low and consumer price inflation was at 4.3%. Expectations are that inflation could increase during the remainder of 2012 with higher housing, public transport and utility tar-iffs and food prices. The Russian Central Bank is moving from exchange rate management to in-flation targeting, but has kept interest rates un-changed at its July 2012 meeting.
The main downside risks to the economy are from adverse developments in the world econo-my, principally from the Euro zone and a sus-tained fall in world energy prices which will im-pact negatively on Russia’s export and budget revenues. Russia will introduce a fiscal rule in 2013 where the government will take into ac-count average oil prices over a 10 year period when budgeting. This will result in a base budget oil price less than USD 90 per barrel and may lead to a reallocation of reserve funds. As down-side risks remain, we maintain our prudent ap-
proach when considering potential new invest-ment opportunities. On the private equity side, we have a solid pipeline of potential opportuni-ties under investigation, have made good prog-ress with a due diligence investigation and will soon be in a position to assess whether to pro-ceed to close a transaction in this field.
On June 7, 2012 ENR was notified by Dr. Dmitry Amunts of his appointment to the Federal Gov-ernment of Russia as an advisor to the Minister of Culture (“Federal Government”). In accor-dance with Federal Government regulations he could no longer serve as a director of the Com-pany and tendered his resignation from the Company’s board of directors. I wish to thank Dr. Amunts for his contributions during his ten-ure as a director of the Company.
Mr. Urs Maurer-LambrouChairman, ENR Russia Invest SAGeneva, August 2012
5

6
Russian Federation
Russia’s gross domestic product (“GDP”) is ex-pected to grow between 3% - 4% in 2012. Re-cently the International Monetary Fund (“IFM”) marginally reduced its 2013 forecast to 3.9%. The European Bank for Reconstruction and De-velopment reduced its forecasts to 3.1% in 2012 and 3.3% in 2013. The Ministry for Economic Development estimated that real GDP was 3.9% higher in Q2 year-on-year (“YOY”), compared with 4.9% YOY in Q1. Industrial production growth slowed down and retail sales growth grew in the second quarter 2012, underpinned by growth in real incomes. Unemployment was unchanged at 5.4% in June, a historic low.
Consumer price inflation also reached a post-Soviet low of 3.6% in April and May, increasing to 4.3% in June. Expectations are that inflation could increase for the remainder of 2012 with higher housing, public transport and utility tar-iffs and food prices, exceeding the govern-ment’s 6% target by year-end 2012. Some com-mentators have predicted that it could peak at 8% in early 2013. The Russian Central Bank is in a process of moving from exchange rate man-agement to inflation targeting, but has kept in-terest rates unchanged at its July 2012 meeting.
The main downside risks to the economy are from adverse developments in the world econo-my, principally from the Euro zone and a sus-tained fall in world energy prices which will im-pact negatively on Russia’s export and budget revenues. At a July investor conference, Presi-dent Putin, who secured a third term as presi-
dent and was inaugurated in May 2012 (Mr. Medvedev also became new prime minister in late May) emphasized that Russia should reduce its non-oil and gas budget deficit and create a budget with sufficient strength to cope with changes in oil prices. Deputy prime minister, Mr. Arkady Dvorkovich, has announced that Russia will introduce a fiscal rule in 2013 where the government will take into account average oil prices over a 10 year period when budgeting. This will result in a base budget oil price less than USD 90 per barrel and may lead to a real-location of reserve funds.
The finance ministry tabled a draft budget for 2013-2015 showing that public expenditure will decline from 21.2% of GDP in 2012 to 18.8% of GDP in 2015 and the non-oil budget deficit will reduce from 10.1% to 8.6% of GDP. The respon-sibility for financing some health, education and infrastructure expenditure will shift to regional and local governments to release federal budget resources for additional defense spending. The draft budget will be submitted to the Duma in September this year.
Mr. Dvorkovich also confirmed that the privati-zation of federal assets will continue and that the program will be completed by 2017. The fi-nance ministry expects to raise 1.24 trillion Ru-bles (USD 38.5 billion) in privatisation proceeds in 2013-2015. Candidates for full or partial sale are the two largest banks Sberbank and VTB Bank, Russian Railways, the shipping company Sovcomflot, the technology company Rusnano, United Grain Company and Rosagroleasing. Some of these sales have been postponed and a debate continues about the timing and terms of
Economic and Political Review

7
the privatisations. Mr. Dvorkovich cautioned that delays may be possible if required prices cannot be achieved, but added that long-term delays are only likely if Russia face an economic crisis similar to that of 2008-2009.
He also confirmed that one of the most urgent tasks for the government is the diversification of the economy and that the government plans to channel funds into areas such as education, pharmaceuticals and energy efficiency. Russian pension fund reforms are expected to be an-nounced later in 2012 as the pension fund has a deficit of 5% of GDP which could grow to 8.5% of GDP if policies remain unchanged.
The finance ministry announced that the Rus-sian financial agency, which is established to manage the country’s reserve funds and gov-ernment debt, may invest a limited amount in equities to supplement its holdings of interna-tional government bonds. President Putin stated that Russia had no intention of reducing the proportion of its foreign exchange reserves in-vested in Euro-denominated assets.
Russia’s net private capital outflow fell to an es-timated USD 9.5 billion in the second quarter of 2012 from USD 33.9 billion in the first quarter according to Russian Central Bank data. In Au-gust deputy economic development minister, Mr. Andrei Klepach advised that capital flight from Russia may reach USD 50 billion in 2012.
Russia has completed ratification of legislation to allow it to join the World Trade Organisation (“WTO”) and became a full member on 22 Au-gust 2012. The Minister of Economic Develop-
ment, Mr. Andrei Belousov highlighted that compliance with international standards should help Russia to attract foreign investments and accelerate its modernisation process for indus-tries, but that import tariffs will decline from 9.5% to 6% by 2015 (estimated direct budget losses from tariff decrease of RUB 188 billion in 2013 and RUB 257 billion in 2014). Anticipated increased trade volumes should act as a coun-terbalance, generating tax receipts and offset-ting a negative impact from declining import duties. Main benefits of WTO membership for Russia are improved:• market access (expected to contribute mod-
estly to GDP as Russia already negotiated most-favored-nation status with most of its key export partners);
• allocation of resources due to lower tariffs (likely to be a modest contributor to GDP) where Russia will shift resources from less-productive to more-productive areas to com-bat competition from foreign producers. With more foreign products available in Russia, productivity gains should arise for Russian in-dustries using these inputs; and
• liberalisation of business services (this could be a more significant contributor to GDP gains) as Russia will benefit from lower barri-ers to providing international services. The lib-eralisation of entry barriers for multinational service providers will lead to stronger compe-tition, variety and higher productivity growth in various sectors.
A further benefit of higher capital levels is sub-ject to business climate improvements which are linked to liberalisation and modernisation goals.
8
Ukraine
IFM estimates are that GDP growth will slow to 3% in 2012 due to weaker demand for Ukraine’s exports. In July the World Bank cut its forecast for Ukraine’s GDP by 0.5% to 2% for the full year 2012. Demand for exports such as steel has fallen amid Europe’s debt crisis, and the Ukrai-nian government has the challenge of restarting a USD 15.6 billion bailout program and to intro-duce measures to reduce energy costs.
Reserves have reduced with government sup-port of the Hryvnia and IMF forecasts show that reserves will further contract to USD 24.4 billion by year-end. Ukraine Central Bank Governor Mr. Serhiy Arbuzov advised that the recent decline in reserves was caused by foreign-debt repay-ments, not by a worsening Ukraine’s economic situation. He also advised that the Central Bank is not in a hurry to change current policies relat-ing to the Hryvnia’s “artificial” peg to the US dollar and to allow the exchange rate to fluctu-ate within a corridor to help control consumer-price growth. He advised that a gradual move to-ward a flexible exchange rate is set out in the IMF program and that the Central Bank will adhere thereto, adding that such a shift has to be accom-panied by a recovery in Ukraine’s financial system.
Inflation is projected at around 7% for the year with a current account deficit of 6.25% of GDP based on current government policies. It will be a key government objective to strengthen the fiscal position as a recent supplementary bud-get has increased wage and pension expendi-tures and targets higher revenue collection to finance these initiatives.
Kazakhstan
According to the Kazakhstan State Statistics Agency, GDP expanded 5.6% in the first half 2012 from a year earlier. IFM estimates are that GDP growth of 5.9% in 2012 and 6% in 2013 could be achieved, with a rebound in non-oil ac-tivity. Oil output is expected to grow slightly as existing fields are close to full capacity and the first phase of Kashagan, a large hydrocarbon extraction project, was postponed to 2013.
According to the IFM, Kazakhstan banks, due to poor past lending practices (particularly to real estate and construction sectors) have burdened banks with a high and increasing levels of non performing loans (“NPLs”). Aggregate NPLs amount to 11% of GDP and banks have been re-luctant to write off bad debts to avoid recording losses. Accordingly, capital adequacy and provi-sioning ratios may be overstated by doubtful recoveries and the possible under-recognition of bad loans.
The main downside risks to the economy are from adverse market developments in Russia and China, a further slow-down in Europe and any sustained fall in world energy prices which will impact negatively on export and budget revenues. The current situation of the banking system brings additional confidence-related risks which could limit capital inflows and trade financing.
The Central Bank confirmed that monetary poli-cy will aim to prevent sharp fluctuations of the exchange rate, whilst keeping inflation within the 6% - 8% target. It also signaled its readiness

9
to cut policy rates should inflation remain low. In August the Central Bank reduced it bench-mark refinancing rate for a fourth time in 2012 where the rate was cut to a record 5.5% after inflation had eased to 4.7% in July 2012. Unem-ployment was at 5.2%.
The government is committed to reduce the non-oil deficit to a medium-term sustainable level, primarily through expenditure reduction and to rebuild a fiscal buffer. Oil accounts for 25% of GDP, half of fiscal revenues, and two thirds of export proceeds. The government seeks to reduce this dependence by accelerating in-dustrialization and infrastructure development in other sectors. Medium-term plans envisage an increased share of manufacturing in GDP, im-proved productivity in agriculture, development of advanced technologies, health and education reforms and some privatisations.
Belarus
According to the National Statistics Committee, Belarus’ GDP grew 2.8% in first half 2012 com-pared against the same period in 2011. Belarus gold and foreign-currency holdings reduced 1.2% in July to USD 8.23 billion according to the Central Bank. Belarus aims to maintain its re-serves at between USD 6.1 billion and USD 7 bil-lion until the start of 2013. The decrease in the volume of gold and foreign exchange reserves in July 2012 was due to the repayment by the gov-ernment and National Bank of Belarus of exter-nal and internal foreign exchange obligations.
In first half year 2012 the interest rate policy of the National Bank of Belarus was a gradual low-
ering of interest rates where, since the begin-ning of 2012, the refinancing rate has been re-duced six times by 14% to 31%. The National Bank of Belarus advised that in the second half of 2012 its activities will be aimed at reducing inflation to 19% - 22% and prevent a reduction in gold and foreign exchange reserves at year-end 2012.
In May Russian President Putin advised that the Russia-led Eurasian Economic Community anti-crisis fund will disburse a third portion of its USD 3 billion loan to Belarus. Belarus has al-ready received two tranches of the loan total-ling USD 1.2 billion in 2011. Belarus pledged to raise at least USD 7.5 billion from asset sales over three years as one of the conditions for re-ceiving the loan. President Putin also advised that Russia and Belarus has reached an agree-ment to begin financing the construction of a nuclear power plant in Belarus and that Russia will provide Belarus USD 200 million for the first stage of construction.
A May IMF report highlighted the importance of reducing the government’s direct control of the economy, stating that price liberalization, enter-prise reform, and privatisation would improve resource allocation and strengthen market in-centives. In the financial sector, a greater role for private banks would increase efficiency.

Transterm Holdings Cyprus LimitedTransterm Holdings Cyprus Limited (“Transterm”) through its subsidiaries operated the Batumi oil terminal in Adjaria, Georgia on the Black Sea coast. It provided oil and oil related product rail forwarding (transported oil from Gardabani on the Azerbaijan – Georgia border to the Batumi oil terminal) and transshipment and storage of these products at the Batumi port.
During 2003 to 2006 ENR invested USD 30 mil-lion in Transterm. In March 2008 Transterm sold all its Georgian based operations to the Ka-zMunaiGas group for cash. Subsequently ENR received USD 31.31 million in cash from Trans-term. During second half 2010 Transterm re-ceived a first payment under a settlement agreement with the previous Transterm manag-ing shareholder and made a distribution to its shareholders where ENR received USD 6.80 mil-lion in cash. During July 2011 ENR received a further USD 1.02 million in cash from Transterm. As part of the settlement agreement ENR’s shareholding in Transterm increased to 22.66%.
ENR continued with a leading role in assisting Transterm with the disposal of its remaining as-set in Russia. During mid June 2012 Transterm concluded a sale agreement where it is expected that the transaction could close in the third quarter 2012. A Transterm distribution of net available proceeds from the sale to its share-holders will follow, where ENR Private Equity Ltd, a wholly owned subsidiary of ENR, will re-ceive its proportional share. ENR, via further settlement proceeds could, over time, receive the balance of the receivable due to ENR. At June 30, 2012, the net book value attributable to Transterm was CHF 5.92 million.
Unique capital markets opportunityPursuant to the 2008 unbundling of Russian electricity company Unified Energy Systems, ENR received shares in various Russian electric-ity sector companies. ENR continues to hold shares in Moscow United Electricity Distribution JSC; RAO Eastern Energy System JSC; Federal Grid Company of UES OJSC; IDGC Holding (In-terregional Distribution Grid Company of Volga); INTER RAO UES JSC; Kuzbassenergo; Moscow Power JSC (Mosenergo); Federal Hydrogenera-tion Company JSC; Territorial Generation Com-panies No1; No2; No6; No9 and No 11; Quadra Power Generation JGC and First Generation Company of wholesale electricity market OJSC (WGC-1). Via a 2012 Kuzbassenergo company re-organization, ENR received shares in the follow-ing unlised Kuzbassenergo subsidiaries: Bar-naulskaya Generatsia; Barnaulskaya TPP3; Kuznetskaya TPP; Novokemorovskay TPP and Kemerovskaya Generatsia. At June 30, 2012 the aggregate value of ENR’s shares in Russian elec-tricity sector companies was CHF 3.91 million.
Investment in Russian Real EstateENR holds shares of Eastern Property Holdings Limited (“EPH”), a Russian focused real estate development company listed on SIX Swiss Ex-change. EPH is managed by a Valartis group subsidiary. As ENR is managed by another Valar-tis group subsidiary, the investment in EPH is not taken into account by ENR for its manage-ment fee calculations. At June 30, 2012 the value attributed to the EPH investment was CHF 10.30 million.
Fixed Income InvestmentsLukoil is a leading vertically integrated oil and gas group. Its business comprises the explora-
10
Portfolio Investments

tion and production of oil and gas, production of petroleum products and petrochemicals and the marketing of these outputs. It has around 1% of global oil reserves and 2.2% of global oil production and dominates the Russian energy sector, with 17.8% of total Russian oil produc-tion and 18.2% of Russian oil refining. Lukoil also operates a large number of retail stations in Russia and has a power generation business in Russia (including delivery and marketing of electrical energy and of heat produced at power plants). During the reporting period, ENR has sold Lukoil fixed income instruments with a No-vember 2019 maturity date for CHF 5.09 million. At June 30, 2012 ENR owned USD based fixed income instruments issued by the Lukoil with an aggregate value of CHF 6.51 million.
TNK-BP is a leading Russian oil company and is a vertically integrated Russian oil group with a di-versified upstream and downstream portfolio in Russia and Ukraine. Its major upstream opera-tions are located primarily in West Siberia, the Volga-Urals and East Siberia. Principal refining assets are located in Ryazan, Saratov, Nizhnev-artovsk and Lisichansk (Ukraine). TNK-BP also operates a large retail network of filling stations in central Russia and Ukraine under the BP and TNK brands. During the reporting period, ENR sold TNK BP Finance fixed income instruments with a February 2020 maturity date for CHF 259’589. At June 30, 2012 ENR owned USD based fixed income instruments issued by the TNK-BP group with an aggregate value of CHF 14.28 million.
VTB group is one of the largest universal bank-ing and financial services groups in Russia, of-fering a wide range of corporate, retail and in-vestment banking services. VTB Capital is the investment banking arm of the group offering debt and equity arrangement services, private
investment, operations in the global commodi-ties markets, asset management and advising clients on merger and acquisition transactions. During the reporting period ENR acquired USD based fixed income instruments and European Commercial Paper issued by this group with an aggregate value of CHF 2.36 million. At June 30, 2012 ENR owned fixed income instruments (USD and CHF denominated) of this group with an ag-gregate value of CHF 10.74 million.
Russian Railways has the second largest rail network in the world comprising 85,200 km of track (43,000 km electrified). It carries over 950 million passengers and 1.2 billion tones of freight annually and is responsible for more than 40% of Russia’s total freight traffic and more than 30% of passenger traffic. Rolling stock exceeds 20’000 goods and passenger lo-comotives and one million goods wagons. At June 30, 2012, ENR owned RUB and USD denom-inated fixed income instruments issued by this group with an aggregate value of CHF 1.89 million.
Gazprom is the world’s largest energy company engaged in natural gas, gas condensate and oil prospecting, production, transmission, process-ing and marketing both inside and outside Rus-sia. Major business lines are geological explora-tion, production, transportation, storage, processing and marketing of hydrocarbons and generation and marketing of heat and electric power. During the reporting period, ENR sold Gazprom fixed income instruments with April 2019 and June 2013 maturity dates for an ag-gregate amount of CHF 10.12 million. In April Gazprom group European Commercial paper was redeemed for CHF 9.04 million. During the reporting period, ENR acquired Gazprom group USD based fixed income instruments with an aggregate value of CHF 16.47 million. At June 30,
11

12
2012 ENR owned CHF and USD denominated fixed income instruments and Euro Commercial Paper of the Gazprom group with an aggregate value of CHF 17.87 million.
Sberbank is the largest credit institution in Rus-sia and the CIS accounting for 27% of the ag-gregate Russian banking assets and 26% of banking capital. During the reporting period ENR acquired fixed income instruments issued by this group for CHF 1.8 million. At June 30, 2012 ENR owned USD and CHF denominated fixed income instruments of the Sberbank group with an aggregate value of CHF 5.88 million.
Russian Agricultural Bank is state-owned bank. It is one of the leading financial institutions providing lending support to Russian agribusi-ness. It has a large network of regional branches and offices covering the whole of Russia (sec-ond largest regional branch network in the country). During the reporting period ENR ac-quired USD based fixed income instruments is-sued by this group with an aggregate value of CHF 4.13 million. At June 30, 2012 ENR owned RUB and USD based fixed income instruments issued by the Russian Agricultural Bank group with an aggregate value of CHF 5.55 million.
Vnesheconombank is a state-owned bank and supports the development of the Russian econ-omy, extending credits and loans jointly with private financial institutions and provides guar-antees and insures credit. During the reporting period ENR acquired USD based fixed income in-struments issued by this group with an aggre-gate value of CHF 2.27 million. At June 30, 2012 ENR owned CHF denominated fixed income in-struments issued by Vnesheconombank with an aggregate value of CHF 5.38 million.
The Novatek group is the largest independent
natural gas producer and the second-largest natural gas producer in Russia after Gazprom. It is principally engaged in the exploration, pro-duction, processing and marketing of natural gas and liquid hydrocarbons. At June 30, 2012 ENR owned USD denominated fixed income in-struments issued by this group with an aggre-gate value of CHF 988’876.
RusHydro is Russia’s largest power generating company in terms of installed capacity. It is the leader in power production using renewable en-ergy sources, developing power generation us-ing water flows, tidal, wind and geo-thermal energy. At June 30, 2012 ENR owned RUB de-nominated fixed income instruments issued by this group with an aggregate value of CHF 419’198.
Alrosa is the world’s largest diamond company and is engaged in the exploration, mining, man-ufacture and sale of diamonds. Operations are located primarily in the Sakha Republic/Yakutsk region in Russia. Alrosa accounts for approxi-mately 25% of the world’s rough diamond sup-ply and 97% of Russia’s rough diamond produc-tion. During the reporting period ENR acquired USD denominated Euro Commercial Paper is-sued by Alrosa for an aggregate value of CHF 1.31 million, which investment was valued at CHF 1.39 million at June 30, 2012.
Lithuania is the largest and most southern of the three Baltic republics. At June 30, 2012 ENR owned USD denominated fixed income instru-ments issued by the Lithuanian government with an aggregate value of CHF 1.86 million.
Russia is the largest economy in the Common-wealth of Independent States. During the re-porting period ENR acquired RUB based fixed income instruments with different maturity

13
dates and issued by the Russian government with an aggregate value of CHF 474’872. At June 30, 2012 ENR owned RUB denominated fixed in-come instruments issued by the Russian govern-ment with an aggregate value of CHF 467’402.
During the reporting period Russian retailer Magnit group fixed income instruments with a maturity date of March 2012 were redeemed for CHF 291’000.
ENR has an investment in the Valartis Russia & CIS Fixed Income Fund. The fund seeks total re-turns through investments in fixed income se-curities in Russia and other members of the CIS seeking both capital appreciation and income through an active strategy, depending on the global and local environments and opportunities in the market. The fund’s investment manager selects fixed income securities issued by com-panies, federal, municipal, regional governments and agencies that enjoy both high yields as well as a potential for capital appreciation, experi-encing fundamental credit improvement and have a positive outlook. As this fund is managed by a Valartis group entity, ENR does not pay management fees to its investment manager on the value of the position held in the Valartis Russia & CIS Fixed Income. At June 30, 2012 the ENR investment in this fund was valued at CHF 3.47 million.
OtherDuring June 2012 ENR was successful with a bid to acquire a small non-performing loan portfo-lio (“NPL”) sold by a Russian bank for a purchase consideration of RUR 15’562’269. The NPL port-folio has been transferred to National Recovery Services, Russia’s largest collection business, for collection on ENR’s behalf. At June 30, 2012 the ENR investment in the acquired NPL was CHF 454’216.
Based on the aggregate value of our invest-ments (including treasury shares) ENR was 96.31% invested at June 30, 2012.

14
Determination of the Net Asset Value and Attributable Net Asset Value (Currency-CHF)
30.06.2012 31.12.2011
Following IFRS
presentation
Representing the existing
shareholders’ economic interest
Following IFRS presentation
Representing the existing
shareholders’ economic interest
Assets Treasury stock - at market value – 1,457,000 – 1,482,850 Cash, investments and other assets 103,834,060 103,834,060 101,882,409 101,882,409 Total assets 103,834,060 105,291,060 101,882,409 103,365,259 Liabilities Total liabilities 1,745,539 1,745,539 3,602,045 3,602,045 Shareholders’ Equity Share capital 32,790,585 32,790,585 32,790,585 32,790,585 Capital paid in excess of par value (share premium) 75,447,951 75,447,951 75,447,951 75,447,951 Treasury stock - at cost – 1,552,228 – – 1,552,228 – Retained losses – 4,561,147 – 4,656,375 – 8,373,968 – 8,443,346 Non controlling interests – 36,640 – 36,640 – 31,976 – 31,976 Total shareholders’ equity 102,088,521 103,545,521 98,280,364 99,763,214 Total liabilities and shareholders’ equity 103,834,060 105,291,060 101,882,409 103,365,259 Number of shares outstanding 2,644,402 2,644,402 Net asset value per share 39.16 37.73 Attributable net asset value per share 39.17 37.74 Number of treasury shares 47,000 47,000
Financial Statements

15
NoteThe net asset value per share (“NAV”) is calculated in Swiss Francs as the aggregate of the value of all investments and treasury shares less the aggregate amount of the liabilities and accrued expenses di-vided by the total number of shares issued.
The main differences between the two calculations are due to applying the IFRS standards versus the Swiss GAAP standards. The differences are particularly prominent in the calculation and booking of treasury shares, and reclassifying the shareholders’ equity.
Attributable NAV per share is the consolidated NAV, less the aggregate value of all minority interests, reflecting the economic value attributed to shareholders, divided by the number of shares issued.
Consolidated ResultsThe consolidated shareholders’ equity, based on IFRS representation, at the end of the reporting period amounted to CHF 102.09 million (December 31, 2011: CHF 98.28 million).
The consolidated net profit for the 2012 half year is CHF 3.81 million (2011 half year: Consolidated net profit of CHF 345’953). The consolidated retained losses as of June 30, 2012 amounted to CHF 4.56 mil-lion (December 31, 2011: CHF 8.37 million). For more details, see the consolidated statement of changes in equity for the half year ended June 30, 2012.

16
Condensed consolidated statement of financial positions (unaudited)(Currency-CHF)
Note 30.06.2012 31.12.2011
Assets Current assets Cash and cash equivalents 6 3,824,454 10,995,950 Forward foreign exchange contracts 5 558,030 – Accounts receivable and accrued interest 7 1,666,440 951,487 Investments at fair value through profit or loss 5 97,785,136 89,934,972 Total assets 103,834,060 101,882,409 Liabilities Accounts payable and accrued expenses 8.1 1,636,915 3,474,576 Forward foreign exchange contracts 5 – 20,900 Provision for taxes 8.2 108,624 106,569 Total liabilities 1,745,539 3,602,045 Shareholders’ Equity Share capital 9 32,790,585 32,790,585 Capital paid in excess of par value (share premium) 75,447,951 75,447,951 Treasury stock – 1,552,228 – 1,552,228 Retained losses – 4,561,147 – 8,373,968 Non controlling interests – 36,640 – 31,976 Total shareholders’ equity 102,088,521 98,280,364 Total liabilities and shareholders’ equity 103,834,060 101,882,409 Number of shares issued and fully paid 9 2,644,402 2,644,402 Nominal value (in CHF) 12.40 12.40
The notes on pages 20 to 35 are an integral part of these condensed interim consolidated financial statements.

17
Condensed consolidated statement of comprehensive income for the period (unaudited)(Currency-CHF)
Note 30.06.2012 30.06.2011
Revenue Interest income 1,863,223 1,698,539 Dividend income – 10,246 Realised gains / (losses) on sale of investments through profit or loss, net 5.1 370,225 – 2,741,386 Unrealised gains / (losses) on investments through profit or loss, net 5.1 3,417,949 – 3,381,776 Realised (losses) / gains on forward foreign exchange contracts and futures, net 5.1 – 592,724 5,232,498 Unrealised gains / (losses) on forward foreign exchange contracts and futures, net 5.1 558,030 – 131,819 Exchange (loss) / gain, net – 476,521 1,202,392 Total revenue 5,140,181 1,888,693 Expenses Management fees 10 908,688 925,751 Administrative fees 87,377 141,512 Directors’ fees and expenses 111,105 53,406 Travel expenses 18,728 26,659 Legal and professional fees 117,687 303,035 Bank charges and interest expenses 192 4,385 Other expenses 88,247 88,166 Total expenses 1,332,024 1,542,914 Profit for the year before tax 3,808,157 345,779 Tax – – Profit for the year after tax 3,808,157 345,779 Attributable to Equity holders of the Company 3,812,821 345,953 Non controlling interests – 4,664 – 174 Other comprehensive income for the period – – Total comprehensive Profit for the period 3,808,157 345,779 Attributable to Equity holders of the Company 3,812,821 345,953 Non controlling interests – 4,664 – 174 Earnings per share for profit attributable to equity holders of the Company during the period: Weighted average number of outstanding shares 4 2,597,402 2,597,402 Basic earnings per share (in CHF) 4 1.468 0.133 Diluted earnings per share (in CHF) 4 1.468 0.133
The notes on pages 20 to 35 are an integral part of these condensed interim consolidated financial statements.

18
Condensed consolidated statement of cash f lows for the period (unaudited)(Currency-CHF)
Note 30.06.2012 30.06.2011
Cash Flows from Operating Activities Profit before tax 3,808,157 345,779 Adjustments for: Interest income – 1,863,223 – 1,698,539 Dividend received – – 10,246 Interest paid 192 – Foreign currency translation effects on cash and cash equivalents 1,295 12,523 Fair value adjustment on investment portfolio 5 – 3,975,979 3,513,594 Operating income before working capital changes – 2,029,558 2,163,111 Movement in working capital: Investment portfolio movement, net 5 – 4,453,114 – 5,024,928 Change in accounts receivable – 714,953 – 473,879 Change in accounts payable and accrued expenses – 1,835,606 – 232,624 Dividend received – 10,246 Interest received 1,863,223 1,698,539 Interest expenses – 192 – Net cash flow used in operating activities – 7,170,200 – 1,859,535 Cash Flows from Financing Activities Increase of share capital – – Sale of treasury stock – – Purchase of treasury stock – – Dividend paid to non controlling interests – – Net cash flow used in financing activities – – Foreign currency translation effects on cash and cash equivalents – 1,295 – 12,523 Net change in cash and cash equivalents – 7,171,495 – 1,872,058 Cash and cash equivalents at beginning of the year 6 10,995,950 23,974,180 Cash and cash equivalents at the end of the year 6 3,824,454 22,102,122
The notes on pages 20 to 35 are an integral part of these condensed interim consolidated financial statements.

19
Condensed consolidated statement of changes in equity for the period (unaudited)(Currency-CHF)
Share capital Share premium Treasury stock Retained earnings TotalNon controlling
interestsTotal share-
holders’ equity
Balance as at 1 January 2011 32,790,585 75,447,951 – 1,552,228 – 1,161,436 105,524,872 – 31,980 105,492,892 Total comprehensive income – – – 345,953 345,953 – 174 345,779Balance as at 30 June 2011 32,790,585 75,447,951 – 1,552,228 – 815,483 105,870,825 – 32,154 105,838,671 Balance as at 1 January 2012 32,790,585 75,447,951 – 1,552,228 – 8,373,968 98,312,340 – 31,976 98,280,364 Total comprehensive income – – – 3,812,821 3,812,821 – 4,664 3,808,157Balance as at 30 June 2012 32,790,585 75,447,951 – 1,552,228 – 4,561,147 102,125,161 – 36,640 102,088,521
The notes on pages 20 to 35 are an integral part of these condensed interim consolidated financial statements.

20
1. Incorporation and activityENR Russia Invest SA (“Company”) is an investment company founded on May 18, 2007 for an unlimited duration. On May 25, 2007 it was registered with the Commercial Register of the Canton of Geneva under the reference number CH-660-1263007-3 and the company name “ENR Russia Invest SA”. The Company is incorporated as a limited company under the laws of Switzerland. The Company’s registered office is 2–4, Place du Molard, Geneva, Switzerland. The Company has no employees. The Company is trading under Swiss security number 3447695 with ISIN number of the shares CH0034476959 and ticker symbol of the shares RUS.
2. Basis for the presentation of the condensed consolidated financial statementsThese condensed interim financial statements represent the unaudited condensed interim consolidated financial statements for the half year ended June 30, 2012 of the Company and its subsidiaries (col-lectively “the Group”) and are prepared in accordance with IAS 34 “Interim Financial Reporting”. The condensed interim consolidated financial statements should be read in conjunction with the annual financial statements for the year ended December 31, 2011, which have been prepared in accordance with the International Financial Reporting Standards (“IFRS”).
3. Significant accounting policies3.1 Accounting policiesExcept as described below, the accounting policies are consistent with those of the annual financial statements of the Company for the year ended December 31, 2011, as described in those financial statements.
Basis of preparation and changes to the Group’s accounting policies Basis of preparationThe interim condensed consolidated financial statements for the six months ended June 30, 2012 have been prepared in accordance with IAS 34 Interim Financial Reporting.
Condensed notes to the consolidated financial statements as of June 30, 2012(Currency - CHF)

21
The interim condensed consolidated financial statements do not include all the information and disclo-sures required in the annual financial statements, and should be read in conjunction with the Group’s annual financial statements as at December 31, 2011.
Interpretations and amendments to standards becoming effective in 2012 but not relevant to the Group
Standard/interpretation; Content; Applicable for financial years beginning on/after
• IFRS 1; Severe hyperinflation and removal of fixed dates for first-time adopters (amendment); July 1, 2011;
• IFRS 7; Disclosures – transfers of financial assets (amendment); July 1, 2011; and• IAS 12; Deferred tax: recovery of underlying assets (amendment); January 1; 2012.
Early adoption of standardsThe Group has not early adopted any other standard, interpretation or amendment that has been issued but is not yet effective.

22
3.2 Fully consolidated companiesThe condensed consolidated interim financial statements comprise the Company and the following subsidiaries:
Name of subsidiary Incorporated in Currency 2012 % Voting Currency 2011 % Voting
ENR Investment Limited Limassol, Cyprus EUR 6,576,660 100.00% EUR 6,576,660 100.00%Panariello Enterprises Limited Nicosia, Cyprus EUR 7,435 77.00% EUR 7,435 77.00%ENR Private Equity Limited Grand Cayman, Cayman Islands USD 500 100.00% USD 500 100.00%
In the condensed interim financial statements of the Company the participation in Panariello is consoli-dated. The Company has an effective economic interest of 77 % in Panariello. Therefore, under the shareholders’ equity section of the consolidated balance sheet, a non controlling interest is shown, which comprises the third party shareholders’ 23 % equity interest in Panariello.
These condensed interim financial statements of the Company and the subsidiaries are drawn up to June 30, 2012.
4. Earnings per share attributable to equity holders of the CompanyEarnings per share is calculated by dividing the net income for the period by the weighted average number of shares outstanding during the period.
30.06.2012 30.06.2011
Earnings per share basic and diluted Net profit attributable to equity holders CHF 3,812,821 CHF 345,953 Weighted average number of ordinary shares outstanding 1) 2,597,402 2,597,402Basic and diluted earnings per share CHF 1.468 CHF 0.133
1) Represents outstanding shares (net of treasury shares)

23
5. Investment portfolio
in CHF
30.06.2012 31.12.2011
Fair value of portfolio at beginning of the period 89,914,072 108,883,593 Investment Portfolio Movement for the Period Purchase of investments 28,857,092 29,792,931 Sale of investments – 24,795,103 – 13,623,194 Transterm Holdings Cyprus Ltd - capital reduction – – 23,910,789 Net realised gain / (loss) on disposal of investments 391,125 – 3,926,831 Net investment portfolio movement for the period 4,453,114 – 11,667,883 Increase / (decrease) in fair value 3,975,979 – 7,301,638 Fair value of portfolio at the end of the period 98,343,165 89,914,072 The investment portfolio is represented as follows on the balance sheet: Designated as Fair Value Through Profit or Loss: Listed equity securities and bonds held for trading 90,766,740 83,141,444 Unlisted equity securities 7,018,396 6,793,528 Total designated as fair value through profit or loss 97,785,136 89,934,972 Total financial assets at fair value through profit or loss 97,785,136 89,934,972 Derivatives held for trading : Exchange rate forward agreements 558,030 – 20,900 Total derivatives, net 558,030 – 20,900 Gains /(losses) on investments at fair value through profit or loss Net realised gains / (losses) 370,225 – 3,226,440 Changes in fair value, (decrease) 3,417,948 – 7,280,737 Total 3,788,173 – 10,507,177 (Losses) recognised on derivatives Net realised (losses) – 592,724 – 700,391 Changes in fair value, increase / (decrease) 558,030 – 20,900 Total – 34,694 – 721,291

24
5.1 Details of investments at fair value through profit or lossSecurities, Bonds and Fixed Income Balance as of 01.01.2012 Movement in period (CHF) Realised (CHF) Changes in fair value (CHF) Balance as of 30.06.2012
Quantity CHF Purchases and Additions Sales and Withdrawals Gains Losses Gains Losses Quantity CHF
MOSCOW UNITED ELECTRICITY DISTRIBUTION JSC 12,313,327 460,912 – – – – 6,846 – 12,313,327 467,758RAO EASTERN ENERGY SYSTEM JSC ORDINARY SHARES 18,400,000 160,351 – – – – – – 38,135 18,400,000 122,216RAO EASTERN ENERGY SYSTEM JSC PREFERENCE SHARES 6,400,000 48,510 – – – – – – 8,429 6,400,000 40,081FEDERAL GRID COMPANY OF UES OJSC 10,173,273 76,162 – – – – – – 20,124 10,173,273 56,038INTERREGIONAL DISTRIBUTION GRID COMPANY OF VOLGA HOLDING ORDINARY SHARES 20,900,000 1,405,840 – – – – – – 324,318 20,900,000 1,081,522INTERREGIONAL DISTRIBUTION GRID COMPANY OF VOLGA HOLDING PREFERENCE SHARES 6,400,000 255,936 – – – – – – 49,905 6,400,000 206,031INTER RAO UES JSC 215,675,995 217,463 – – – – – – 43,677 215,675,995 173,786KUZBASSENERGO JSC 5,801,111 33,400 – – – – – – 12,121 5,801,111 21,279MOSCOW POWER JSC (MOSENERGO) 50 2 – – – – – – 50 2FEDERAL HYDROGENERATION COMPANY JSC 32,708,775 832,375 – – – – – – 121,276 32,708,775 711,099TERRITORIAL GENERATION COMPANY NO 1 OJSC 927,579,908 200,221 – – – – – – 15,466 927,579,908 184,755TERRITORIAL GENERATION COMPANY NO 2 OJSC 314,979,184 27,423 – – – – – – 1,784 314,979,184 25,639QUADRA POWER GENERATION JGC 23,263,819 4,354 – – – – – – 2,145 23,263,819 2,209TERRITORIAL GENERATION COMPANY NO 6 OJSC 71,823,486 13,927 – – – – – – 7,163 71,823,486 6,764TERRITORIAL GENERATION COMPANY NO 9 OJSC 133,615,552 12,504 – – – – – – 6,584 133,615,552 5,920TERRITORIAL GENERATION COMPANY NO 11 HOLDING OJSC 6,100,000 – – – – – – – – –TERRITORIAL GENERATION COMPANY NO 11 HOLDING OJSC PREFERENCE SHARES 2,400,000 – – – – – – – – –FIRST GENERATION COMPANY OF WHOLESALE ELECTRICITY MARKET OJSC (WGC-1) 36,411,412 695,548 – – – – – – 10,683 36,411,412 684,865EASTERN PROPERTY HOLDINGS LTD 493,000 9,226,989 – – – – 1,073,458 – 493,000 10,300,447VALARTIS RUSSIA & CIS FIXED INCOME FUND 250,000 3,275,300 – – – – 191,105 – 250,000 3,466,405MAGNIT FINANCE LLC 8.2 %, 03/12, BOND 10,000,000 291,176 – – 291,000 – – 176 – – – –RUSSIAN RAILWAYS 9.4 %, 12/12, BOND 29,700,000 879,740 – – – – – – 5,518 29,700,000 874,222GAZPROM VIA GAZ CAPITAL 9.25 %, 04/19, BOND 4,500,000 5,000,681 – – 5,052,564 51,883 – – – –GAZPROM VIA GAZ CAPITAL 6.212%, 11/16, BOND 1,000,000 956,856 – – – – 61,698 – 1,000,000 1,018,554TNK - BP FINANCE SA 6.625 %, 03/17, BOND 4,500,000 4,290,058 – – – – 368,220 – 4,500,000 4,658,278VTB CAPITAL SA 6.465 %, 03/15, BOND 2,000,000 1,893,048 1,912,478 – – – 177,516 – 4,000,000 3,983,041VTB CAPITAL SA 4 %, 08/13, BOND 1,025,000 1,025,144 – – – – 20,664 – 1,025,000 1,045,808VTB CAPITAL SA 5 %, 11/15, BOND 5,000,000 5,009,350 – – – – 215,650 – 5,000,000 5,225,000LITHUANIAN REPUBLIC 6.75 %, 01/15, BOND 1,800,000 1,770,110 – – – – 80,619 – 1,800,000 1,850,729LUKOIL INTL FINANCE B.V. 7.25 %, 11/19, BOND 5,000,000 4,863,820 – – 5,085,640 221,819 – – – – –LUKOIL INTL FINANCE B.V. 6.375 %, 11/14, BOND 5,000,000 4,973,777 – – – – 107,118 – 5,000,000 5,080,895TNK - BP FINANCE 7.25 %, 02/20, BOND 250,000 242,021 – – 259,589 17,569 – – – – –SBERBANK (SB CAP SA) 5.4%, 03/17, BONDS 3,000,000 2,808,243 – – – – 148,468 – 3,000,000 2,956,711SBERBANK VIA SB CAPITAL SA, 5.499%, 07/15, BOND 1,000,000 953,383 – – – – 41,142 – 1,000,000 994,525TNK - BP FINANCE 7.5 %, 07/16, BOND 4,500,000 4,459,555 – – – – 278,855 – 4,500,000 4,738,410LUKOIL INTL FINANCE B.V. 6.356 %, 06/17, BOND 1,500,000 1,438,090 – – – – – 13,113 1,500,000 1,424,977TNK - BP FINANCE 7.875 %, 03/18, BOND 4,500,000 4,532,197 – – – – 350,449 – 4,500,000 4,882,646OJSC RUSSIAN AGRICULTURAL BANK (RSHB CAPITAL SA) 7.5%, 03/13, BOND 7,500,000 214,976 – – – – 3,379 – 7,500,000 218,355OJSC RUSSIAN AGRICULTURAL BANK (RSHB CAPITAL SA) 9%, 06/14, BOND 1,000,000 1,012,722 1,522,619 – – – 86,068 – 2,500,000 2,621,409NOVATEK FINANCE LTD 5.326%, 02/16, BOND 1,000,000 934,631 – – – – 54,245 – 1,000,000 988,876RUSSIAN RAILWAYS (RZD CAP) 5.739% , 04/17, BOND 1,000,000 940,825 – – – – 74,119 – 1,000,000 1,014,944GAZPROM 4.375%, 12/13, BOND 5,000,000 5,120,750 – – – – – – 14,500 5,000,000 5,106,250GAZPROM 04/12, EURO COMMERCIAL PAPER 5,000,000 9,263,484 – – 9,037,000 – 226,484 – – –RUSHYDRO 7.875%, 10/15, BOND 15,000,000 410,310 – – – – 8,888 – 15,000,000 419,198VEB FINANCE LTD 3.75%, 02/16, BOND 3,000,000 2,909,280 – – – – 115,470 – 3,000,000 3,024,750RUSSIAN FEDERAL BOND - OFZ 6.85%, 08/12 – – 240,946 – – – – – 7,297 8,000,000 233,649RUSSIAN FEDERAL BOND - OFZ 6.7%, 6/13 – – 233,926 – – – – – 173 8,000,000 233,753ALROSA FINANCE SA, EURO COMMERCIAL PAPER – – 1,310,308 – – – 83,187 – 1,500,000 1,393,495GAZPROM 06/13, EURO COMMERCIAL PAPER – – 7,011,655 – – – – – 149,110 7,500,000 6,862,545GAZPROM (GAZ CAPITAL) 4.95%, 05/16, BOND – – 4,692,957 – – – 185,367 – 5,000,000 4,878,324SBERBANK (SB CAP SA) 4.95%, 04/17, BOND – – 1,841,793 – – – 88,472 – 2,000,000 1,930,265GAZPROM 7.933%, 06/13, BOND – – 4,763,696 – 5,069,310 305,614 – – – – –RUSSIAN AGRICULTURAL BANK (RSHB CAPITAL SA) 7.125%, 01/14, BOND – – 2,411,770 – – 104,626 – 2,500,000 2,516,396VEB FINANCE LTD 5.125%, 05/16 – – 2,268,534 – – – 91,542 – 2,500,000 2,360,076VTB CAPITAL SA 6%, 04/17, BOND – – 452,096 – – 29,164 – 500,000 481,260RUSSIAN AGRICULTURAL BANK (RSHB CAPITAL SA) 5.298%, 12/17, BOND – – 194,314 – – – – – 1,732 200,000 192,582Sub-total listed investments at fair value through profit or loss 83,141,444 28,857,092 – 24,795,103 596,884 – 226,660 4,046,335 – 853,254 90,766,740TRANSTERM HOLDINGS CYPRUS LTD - ordinary shares 9,310,000 6,793,528 – – – – 100,908 – 9,310,000 6,894,436Kuznetskaya TPP – – – – – – 24,792 – 5,801,111 24,792Barnaulskaya TPP-3 – – – – – – 24,792 – 5,801,111 24,792Kemerovskaya Generatsia – – – – – – 24,792 – 5,801,111 24,792Novokemerovkaya TPP – – – – – – 24,792 – 5,801,111 24,792Barnaulskaya Generatsia – – – – – – 24,792 – 5,801,111 24,792Sub-total unlisted investments at fair value through profit or loss 6,793,528 – – – – 224,868 – – 7,018,396FORWARD FOREIGN EXCHANGE CONTRACTS – – 20,900 117,690,826 – 117,077,202 1,892,704 – 2,485,428 558,030 – 558,030Sub-total derivative financial instruments – – 20,900 – 117,690,826 – 117,077,202 1,892,704 – 2,485,428 558,030 – – 558,030Total investments 89,914,072 146,547,918 – 141,872,305 2,489,588 – 2,712,088 4,829,233 – 853,254 98,343,166

25
5.1 Details of investments at fair value through profit or lossSecurities, Bonds and Fixed Income Balance as of 01.01.2012 Movement in period (CHF) Realised (CHF) Changes in fair value (CHF) Balance as of 30.06.2012
Quantity CHF Purchases and Additions Sales and Withdrawals Gains Losses Gains Losses Quantity CHF
MOSCOW UNITED ELECTRICITY DISTRIBUTION JSC 12,313,327 460,912 – – – – 6,846 – 12,313,327 467,758RAO EASTERN ENERGY SYSTEM JSC ORDINARY SHARES 18,400,000 160,351 – – – – – – 38,135 18,400,000 122,216RAO EASTERN ENERGY SYSTEM JSC PREFERENCE SHARES 6,400,000 48,510 – – – – – – 8,429 6,400,000 40,081FEDERAL GRID COMPANY OF UES OJSC 10,173,273 76,162 – – – – – – 20,124 10,173,273 56,038INTERREGIONAL DISTRIBUTION GRID COMPANY OF VOLGA HOLDING ORDINARY SHARES 20,900,000 1,405,840 – – – – – – 324,318 20,900,000 1,081,522INTERREGIONAL DISTRIBUTION GRID COMPANY OF VOLGA HOLDING PREFERENCE SHARES 6,400,000 255,936 – – – – – – 49,905 6,400,000 206,031INTER RAO UES JSC 215,675,995 217,463 – – – – – – 43,677 215,675,995 173,786KUZBASSENERGO JSC 5,801,111 33,400 – – – – – – 12,121 5,801,111 21,279MOSCOW POWER JSC (MOSENERGO) 50 2 – – – – – – 50 2FEDERAL HYDROGENERATION COMPANY JSC 32,708,775 832,375 – – – – – – 121,276 32,708,775 711,099TERRITORIAL GENERATION COMPANY NO 1 OJSC 927,579,908 200,221 – – – – – – 15,466 927,579,908 184,755TERRITORIAL GENERATION COMPANY NO 2 OJSC 314,979,184 27,423 – – – – – – 1,784 314,979,184 25,639QUADRA POWER GENERATION JGC 23,263,819 4,354 – – – – – – 2,145 23,263,819 2,209TERRITORIAL GENERATION COMPANY NO 6 OJSC 71,823,486 13,927 – – – – – – 7,163 71,823,486 6,764TERRITORIAL GENERATION COMPANY NO 9 OJSC 133,615,552 12,504 – – – – – – 6,584 133,615,552 5,920TERRITORIAL GENERATION COMPANY NO 11 HOLDING OJSC 6,100,000 – – – – – – – – –TERRITORIAL GENERATION COMPANY NO 11 HOLDING OJSC PREFERENCE SHARES 2,400,000 – – – – – – – – –FIRST GENERATION COMPANY OF WHOLESALE ELECTRICITY MARKET OJSC (WGC-1) 36,411,412 695,548 – – – – – – 10,683 36,411,412 684,865EASTERN PROPERTY HOLDINGS LTD 493,000 9,226,989 – – – – 1,073,458 – 493,000 10,300,447VALARTIS RUSSIA & CIS FIXED INCOME FUND 250,000 3,275,300 – – – – 191,105 – 250,000 3,466,405MAGNIT FINANCE LLC 8.2 %, 03/12, BOND 10,000,000 291,176 – – 291,000 – – 176 – – – –RUSSIAN RAILWAYS 9.4 %, 12/12, BOND 29,700,000 879,740 – – – – – – 5,518 29,700,000 874,222GAZPROM VIA GAZ CAPITAL 9.25 %, 04/19, BOND 4,500,000 5,000,681 – – 5,052,564 51,883 – – – –GAZPROM VIA GAZ CAPITAL 6.212%, 11/16, BOND 1,000,000 956,856 – – – – 61,698 – 1,000,000 1,018,554TNK - BP FINANCE SA 6.625 %, 03/17, BOND 4,500,000 4,290,058 – – – – 368,220 – 4,500,000 4,658,278VTB CAPITAL SA 6.465 %, 03/15, BOND 2,000,000 1,893,048 1,912,478 – – – 177,516 – 4,000,000 3,983,041VTB CAPITAL SA 4 %, 08/13, BOND 1,025,000 1,025,144 – – – – 20,664 – 1,025,000 1,045,808VTB CAPITAL SA 5 %, 11/15, BOND 5,000,000 5,009,350 – – – – 215,650 – 5,000,000 5,225,000LITHUANIAN REPUBLIC 6.75 %, 01/15, BOND 1,800,000 1,770,110 – – – – 80,619 – 1,800,000 1,850,729LUKOIL INTL FINANCE B.V. 7.25 %, 11/19, BOND 5,000,000 4,863,820 – – 5,085,640 221,819 – – – – –LUKOIL INTL FINANCE B.V. 6.375 %, 11/14, BOND 5,000,000 4,973,777 – – – – 107,118 – 5,000,000 5,080,895TNK - BP FINANCE 7.25 %, 02/20, BOND 250,000 242,021 – – 259,589 17,569 – – – – –SBERBANK (SB CAP SA) 5.4%, 03/17, BONDS 3,000,000 2,808,243 – – – – 148,468 – 3,000,000 2,956,711SBERBANK VIA SB CAPITAL SA, 5.499%, 07/15, BOND 1,000,000 953,383 – – – – 41,142 – 1,000,000 994,525TNK - BP FINANCE 7.5 %, 07/16, BOND 4,500,000 4,459,555 – – – – 278,855 – 4,500,000 4,738,410LUKOIL INTL FINANCE B.V. 6.356 %, 06/17, BOND 1,500,000 1,438,090 – – – – – 13,113 1,500,000 1,424,977TNK - BP FINANCE 7.875 %, 03/18, BOND 4,500,000 4,532,197 – – – – 350,449 – 4,500,000 4,882,646OJSC RUSSIAN AGRICULTURAL BANK (RSHB CAPITAL SA) 7.5%, 03/13, BOND 7,500,000 214,976 – – – – 3,379 – 7,500,000 218,355OJSC RUSSIAN AGRICULTURAL BANK (RSHB CAPITAL SA) 9%, 06/14, BOND 1,000,000 1,012,722 1,522,619 – – – 86,068 – 2,500,000 2,621,409NOVATEK FINANCE LTD 5.326%, 02/16, BOND 1,000,000 934,631 – – – – 54,245 – 1,000,000 988,876RUSSIAN RAILWAYS (RZD CAP) 5.739% , 04/17, BOND 1,000,000 940,825 – – – – 74,119 – 1,000,000 1,014,944GAZPROM 4.375%, 12/13, BOND 5,000,000 5,120,750 – – – – – – 14,500 5,000,000 5,106,250GAZPROM 04/12, EURO COMMERCIAL PAPER 5,000,000 9,263,484 – – 9,037,000 – 226,484 – – –RUSHYDRO 7.875%, 10/15, BOND 15,000,000 410,310 – – – – 8,888 – 15,000,000 419,198VEB FINANCE LTD 3.75%, 02/16, BOND 3,000,000 2,909,280 – – – – 115,470 – 3,000,000 3,024,750RUSSIAN FEDERAL BOND - OFZ 6.85%, 08/12 – – 240,946 – – – – – 7,297 8,000,000 233,649RUSSIAN FEDERAL BOND - OFZ 6.7%, 6/13 – – 233,926 – – – – – 173 8,000,000 233,753ALROSA FINANCE SA, EURO COMMERCIAL PAPER – – 1,310,308 – – – 83,187 – 1,500,000 1,393,495GAZPROM 06/13, EURO COMMERCIAL PAPER – – 7,011,655 – – – – – 149,110 7,500,000 6,862,545GAZPROM (GAZ CAPITAL) 4.95%, 05/16, BOND – – 4,692,957 – – – 185,367 – 5,000,000 4,878,324SBERBANK (SB CAP SA) 4.95%, 04/17, BOND – – 1,841,793 – – – 88,472 – 2,000,000 1,930,265GAZPROM 7.933%, 06/13, BOND – – 4,763,696 – 5,069,310 305,614 – – – – –RUSSIAN AGRICULTURAL BANK (RSHB CAPITAL SA) 7.125%, 01/14, BOND – – 2,411,770 – – 104,626 – 2,500,000 2,516,396VEB FINANCE LTD 5.125%, 05/16 – – 2,268,534 – – – 91,542 – 2,500,000 2,360,076VTB CAPITAL SA 6%, 04/17, BOND – – 452,096 – – 29,164 – 500,000 481,260RUSSIAN AGRICULTURAL BANK (RSHB CAPITAL SA) 5.298%, 12/17, BOND – – 194,314 – – – – – 1,732 200,000 192,582Sub-total listed investments at fair value through profit or loss 83,141,444 28,857,092 – 24,795,103 596,884 – 226,660 4,046,335 – 853,254 90,766,740TRANSTERM HOLDINGS CYPRUS LTD - ordinary shares 9,310,000 6,793,528 – – – – 100,908 – 9,310,000 6,894,436Kuznetskaya TPP – – – – – – 24,792 – 5,801,111 24,792Barnaulskaya TPP-3 – – – – – – 24,792 – 5,801,111 24,792Kemerovskaya Generatsia – – – – – – 24,792 – 5,801,111 24,792Novokemerovkaya TPP – – – – – – 24,792 – 5,801,111 24,792Barnaulskaya Generatsia – – – – – – 24,792 – 5,801,111 24,792Sub-total unlisted investments at fair value through profit or loss 6,793,528 – – – – 224,868 – – 7,018,396FORWARD FOREIGN EXCHANGE CONTRACTS – – 20,900 117,690,826 – 117,077,202 1,892,704 – 2,485,428 558,030 – 558,030Sub-total derivative financial instruments – – 20,900 – 117,690,826 – 117,077,202 1,892,704 – 2,485,428 558,030 – – 558,030Total investments 89,914,072 146,547,918 – 141,872,305 2,489,588 – 2,712,088 4,829,233 – 853,254 98,343,166

26
5.2 Transterm Holdings Cyprus Limited
2011 Receipt
Transterm received further proceeds under the settlement agreement and on July 1, 2011 made a fur-ther distribution of an aggregate USD 4.5 million to its shareholders. This was done via non repayable loans and ENR received USD 1’019’700 in cash. At June 30, 2012, ENR, as part of “Accounts Payable and Accrued Expenses”, showed CHF 968’409 as a loan distribution received from Transterm. This is a con-servative accounting approach as this loan is not repayable. Once Transterm implements a further capi-tal reduction, this loan will be set-off during that process and will then no longer be shown in the ENR accounts. The remaining portion of the Transterm receivable should be generated from further settle-ment proceeds and the sale of the remaining Transterm asset.
2012 Receipt
Transterm, in June, 2012, concluded a sale agreement to dispose of its remaining asset in Russia. It is expected that this transaction could close in the third quarter of 2012. Transterm will then proceed to distribute available net sale proceeds to its shareholders, where ENR will receive its proportionate share.
Attributable Value
At June 30, 2012 the carrying value of this investment reflects what ENR expects to receive from fur-ther settlement proceeds and proceeds from the aforementioned sale transaction. The Transterm valu-ation is the sole responsibility of the board of directors and bears inherent uncertainties due to the absence of a liquid market. Realisation of these proceeds is uncertain and depends on future develop-ments which may materially impact expected amounts. Accordingly, the fair value attributed to this investment may differ from the realisable value. During the reporting period, Transterm’s net book value was impacted by movements in the CHF/USD rate as ENR’s reporting currency is in Swiss Francs and the investment is based in USD. The unrealised exchange gain of CHF 100’908 is reflected in note 5.1.

27
5.3 Fixed income instrumentsENR has acquired a range of local and foreign currency fixed income instruments issued by Russian corporates and sovereign bonds of the Lithuanian and Russian governments. During the reporting period, CHF 28.56 million was deployed to acquire fixed income instruments. The majority of the fixed income instruments have investment ratings of “BBB” from S&P Ratings Services and are denomi-nated in USD, CHF and RUB. Details of fixed income instruments are set out in the table under note 5.1. At year-end, the aggregate fair value attributed to fixed income instruments was CHF 73.21 mil-lion (excluding Valartis & CIS Fixed Income Fund – see note 5.6 below).
5.4 Shares in Russian electricity companiesPursuant to the 2008 unbundling of the Russian electricity company Unified Energy Systems (“UES”), ENR holds shares in electricity companies covering a range of market and geographical segments in the Russian electricity sector. The fair value at year-end of all electricity sector shares comprise of the last available closing prices of all listed shares at June 30, 2012, being CHF 3.79 million and the aggregate value of the following private companies which have been spun-off in a Kuzbassenergo unbundling: Kuznetskaya TPP; Barnaulskya TPP-3; Kemerovskaya Generatsia; Novokemerovkaya TPP; and Barnauls-kaya Generatsia, being CHF 123’960 (based on the pricing of a recent Kuzbassenergo buyback proposal).
5.5 Eastern Property Holdings LimitedEPH is a Russian focused real estate development company listed on the SIX Swiss Exchange. The fair value at June 30, 2012 attributed to the shares was based on the closing price of the EPH shares at this date and amounted to CHF 10.30 million.
5.6 Valartis Russia & CIS Fixed Income FundThe fund seeks total returns through investments in fixed income securities in Russia and other mem-bers of the CIS seeking both capital appreciation and income through an active strategy, depending on the global and local environments and opportunities in the market. The investment manager selects fixed income securities issued by companies, federal, municipal, regional governments and agencies that enjoy both high yields as well as a potential for capital appreciation, experiencing fundamental credit improvement and have a positive outlook. Fair value at June 30, 2012 was based on the closing share price of the fund at half year, being CHF 3.47 million.
28
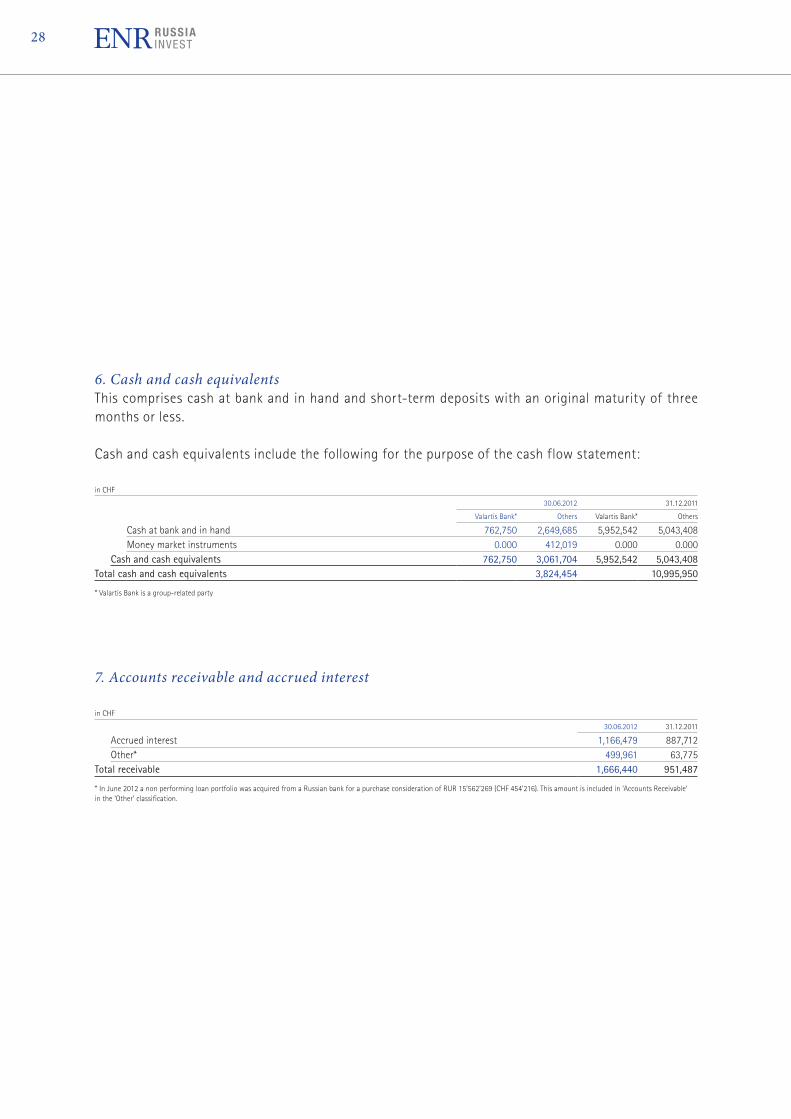
6. Cash and cash equivalentsThis comprises cash at bank and in hand and short-term deposits with an original maturity of three months or less.
Cash and cash equivalents include the following for the purpose of the cash flow statement:
in CHF
30.06.2012 31.12.2011
Valartis Bank* Others Valartis Bank* Others
Cash at bank and in hand 762,750 2,649,685 5,952,542 5,043,408 Money market instruments 0.000 412,019 0.000 0.000 Cash and cash equivalents 762,750 3,061,704 5,952,542 5,043,408Total cash and cash equivalents 3,824,454 10,995,950
* Valartis Bank is a group-related party
7. Accounts receivable and accrued interest
in CHF
30.06.2012 31.12.2011
Accrued interest 1,166,479 887,712 Other* 499,961 63,775Total receivable 1,666,440 951,487
* In June 2012 a non performing loan portfolio was acquired from a Russian bank for a purchase consideration of RUR 15’562’269 (CHF 454’216). This amount is included in ‘Accounts Receivable’ in the ‘Other’ classification.

29
8. Liabilities8.1 Accounts payable and accrued expenses
in CHF
30.06.2012 31.12.2011
Management fees 450,496 420,629 Transterm Holdings Cyprus Limited (see note 5.2) 968,409 954,235 Other creditors 218,010 2,099,712Balance at the end of the period 1,636,915 3,474,576
8.2 TaxesThe Company paid Swiss taxes on its capital of 0.07 % in 2012 (2011: 0.07 %). The Cyprus subsidiary was subject to corporation tax on taxable profits at a rate of 10% in 2012 (10% in 2011). In Cyprus, under certain conditions, interest may be subject to a defence contribution at the rate of 10% (part of such interest will be exempt from corporation tax) and in certain cases dividends received from abroad may be subject to a defence contribution at the rate of 15%. Net income from the Cayman Islands sub-sidiary is not taxed. No deferred taxes are calculated on unrealised gains on securities as they are tax exempt in the corresponding jurisdictions. The movement on tax liabilities is as follows:
in CHF
30.06.2012 31.12.2011 30.06.2011
Balance at beginning of period 106,569 260,610 260,610 Payment during the period – 13,945 – 588,974 – 16,734 Reversal of provisions 16,000 – 70,000 – Charge for the period – 504,933 – Balance at the end of the period 108,624 106,569 243,876
30
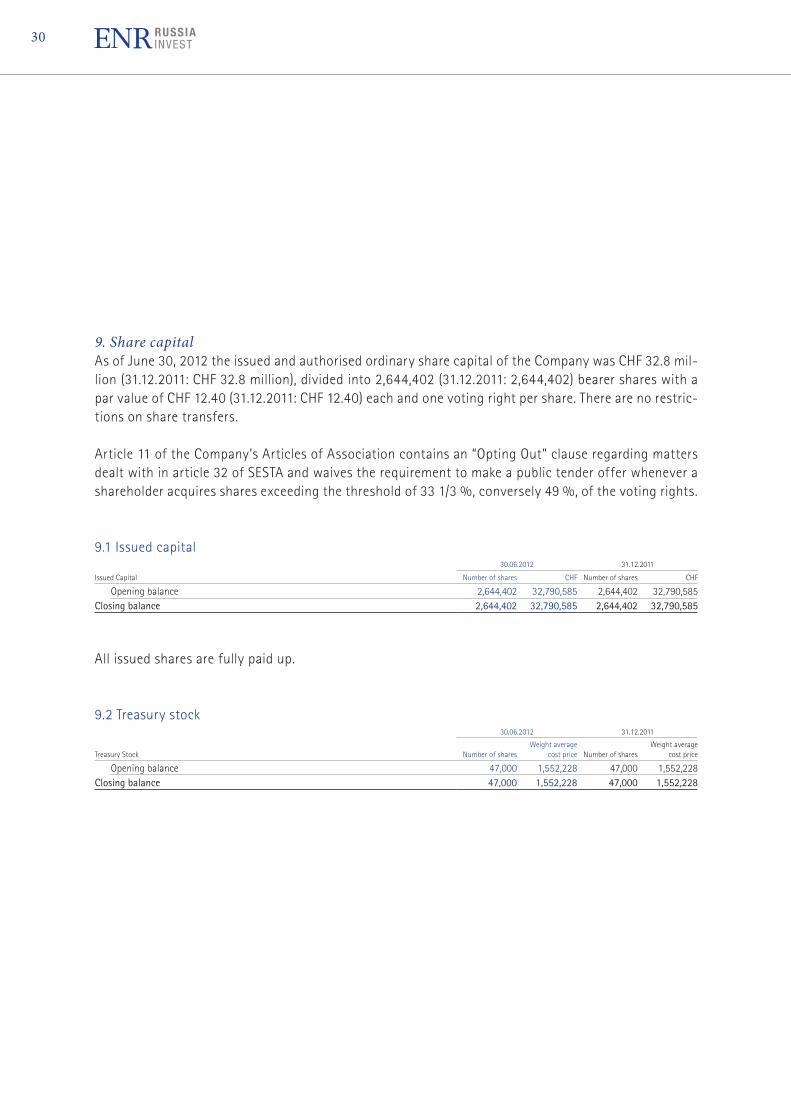
9. Share capitalAs of June 30, 2012 the issued and authorised ordinary share capital of the Company was CHF 32.8 mil-lion (31.12.2011: CHF 32.8 million), divided into 2,644,402 (31.12.2011: 2,644,402) bearer shares with a par value of CHF 12.40 (31.12.2011: CHF 12.40) each and one voting right per share. There are no restric-tions on share transfers.
Article 11 of the Company’s Articles of Association contains an “Opting Out” clause regarding matters dealt with in article 32 of SESTA and waives the requirement to make a public tender offer whenever a shareholder acquires shares exceeding the threshold of 33 1/3 %, conversely 49 %, of the voting rights.
9.1 Issued capital 30.06.2012 31.12.2011
Issued Capital Number of shares CHF Number of shares CHF
Opening balance 2,644,402 32,790,585 2,644,402 32,790,585Closing balance 2,644,402 32,790,585 2,644,402 32,790,585
All issued shares are fully paid up.
9.2 Treasury stock 30.06.2012 31.12.2011
Treasury Stock Number of sharesWeight average
cost price Number of sharesWeight average
cost price
Opening balance 47,000 1,552,228 47,000 1,552,228Closing balance 47,000 1,552,228 47,000 1,552,228

31
9.3 Conditional and authorised capitalArticle 8 of the Company’s Articles of Association provides for a conditional capital pursuant to which the Company’s share capital may be increased through the exercise of options or conversion rights up to a maximum amount of CHF 9,985,806.80 through the issue of a maximum of 805,307 bearer shares with a par value of CHF 12.40 each.
Existing shareholders have no preferential subscription rights with regards to the conditional capital.
30.06.2012 31.12.2011
Authorised capital and conditional Number of shares CHF Number of shares CHF
Conditional capital 805,307 9,985,807 805,307 9,985,807
As of June 30, 2012, the Company had no authorised capital.

32
10. Related parties, significant shareholders10.1 Valartis International Ltd.Valartis International Ltd. (a wholly owned subsidiary of Valartis Group AG, Baar, Switzerland) is the investment manager of the Company. Based on contractual terms, the Company pays to the investment manager a management fee payable quarterly in arrears in Swiss Francs of 2% (plus VAT if applicable) per annum of the Company’s average Attributable NAV, as adjusted by adding back the amount of any outstanding debt issued by the Company or by any of its subsidiaries or affiliates that is convertible into or exchangeable for shares of the Company.
Considering that another Valartis group subsidiary acts as investment manager of EPH, this investment is not taken into account for purposes of the calculation of management fees.
As the Valartis Russia & CIS Fixed Income Fund is managed by another Valartis group entity and that the ENR investment manager forms part of the Valartis group, ENR does not pay management fees to its investment manager on the value of the position held in this fund.
Out-of-pocket expenses incurred by the investment manager in carrying out the investigative and “due diligence” analysis required in pursuing likely investment opportunities and in monitoring existing in-vestments, based on contractual terms, are borne by the Company.
In addition, based on contractual terms, the investment manager is entitled to receive a performance fee equal to 17.5% (plus VAT if applicable) of the total net profits (sale proceeds less acquisition costs and transaction costs) realised by the Company on such investment in the event of a sale, another form of disposal or a refinancing of an investment held by the Company, provided the annual hurdle rate of 8% has been reached by the Company.
in CHF
Management fees 30.06.2012 30.06.2011
Management fees for the period 908,688 925,751 Balance payable at the end of the period 450,496 925,751

33
10.2 Directors’ feesThe remuneration paid to the directors of the Company amounted to:
in CHF
30.06.2012 30.06.2011
W. Fetscherin 25,000 25,000 M. Amunts* 25,000 25,000 M. Maurer 41,130 –Total 91,130 50,000
* Dr. Amunts resigned as a director during June 2012.
10.3 Significant shareholders as of June 30, 2012Valartis Bank AG, Zürich, Valartis Group AG, Valartis International Ltd and MCT Global Opportunities Fund, Grand-Cayman jointly own 60.54% (1’572’556 shares) of the outstanding share capital (issued shares minus treasury shares) of the Company.
Paramount-Finanz AG owns 34.37% (892,703 shares) of the outstanding share capital (issued shares minus treasury shares) of the Company.
10.4 OtherMr. Gustav Stenbolt is a member of the board of MCG Holding SA, the majority shareholder of the Valartis group and is a member of the investment committee and an ENR board member.

34
11. Segment reportingSince the Company has only one sector of business activity and one geographical sector, the break-down by segment does not apply.
12. Risk managementAn extensive overview of the risk factors that the Group is faced with, is included separately in the an-nual report. The Board, in cooperation with the investment manager, assesses the potential impact of these risk factors on the financial performance of the Group and implements risk management policies accordingly. Certain risk factors, e.g. portfolio concentration and hedging policies regarding currency exposure, are dealt with in the investment guidelines, which provide the general framework under which the Group’s operations are carried out.
On a day-to-day basis the investment manager has operational responsibility for the Group, including the risk management functions. This role is performed under the overview of the Board.
The Board, supported by the investment manager, performs a review of the potential risk factors, in-cluding those that arise from the accounting and financial reporting, and assess their potential impact on the Group’s operations no less frequently than annually. Throughout the internal control system framework on financial reporting relevant control measures are defined, which reduce the financial risk. Should the risk environment change substantially, measures are taken on the level of the Board to alleviate such risks, including updating relevant risk management policies.
35
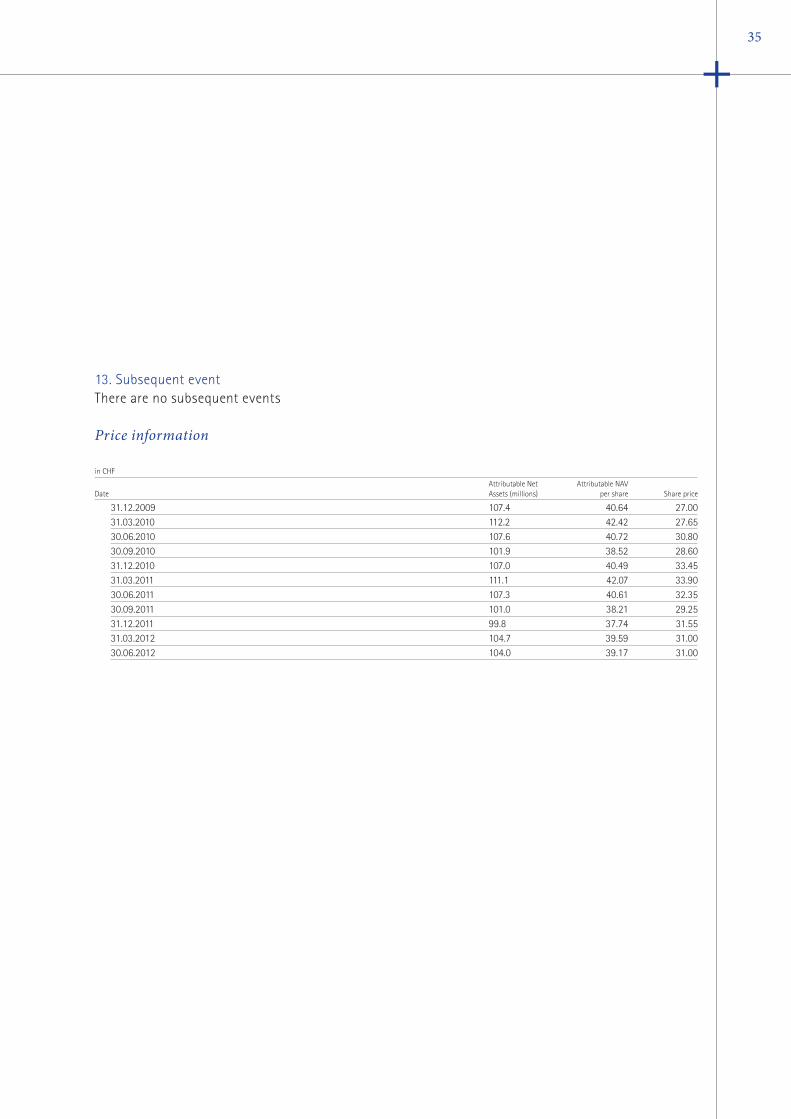
13. Subsequent eventThere are no subsequent events
Price information
in CHF
DateAttributable Net Assets (millions)
Attributable NAV per share Share price
31.12.2009 107.4 40.64 27.00 31.03.2010 112.2 42.42 27.65 30.06.2010 107.6 40.72 30.80 30.09.2010 101.9 38.52 28.60 31.12.2010 107.0 40.49 33.45 31.03.2011 111.1 42.07 33.90 30.06.2011 107.3 40.61 32.35 30.09.2011 101.0 38.21 29.25 31.12.2011 99.8 37.74 31.55 31.03.2012 104.7 39.59 31.00 30.06.2012 104.0 39.17 31.00

36
1. Investment ObjectiveTo invest in private and public companies across different industry sectors and to do so predomi-nately in Russia and other Commonwealth of In-dependent States countries and in the Baltic States and to manage the asset portfolio to achieve long term capital appreciation on invest-ed capital.
2. Investment PolicyThe investment philosophy is growth-oriented and the focus is primarily on longer term strate-gies and capital appreciation. However, from time to time there may be certain investments which have a shorter investment horizon, reflecting specific opportunities or taking account of pre-vailing market conditions. At times the asset portfolio may comprise entirely of cash or cash equivalents.
3. Investment Instruments• Investments will be done primarily through
equity and/or equity related and/or debt in-struments or derivatives instruments.
• Where capital resources have not been not fully invested, same may be invested in a range of investment products, money market instruments, investment instruments issued by governments, financial institutions or com-panies, denominated in the currency of the country where investments are made or in any freely convertible currency. The company may take temporary defensive positions if the in-
vestment manager determines that opportu-nities for capital appreciation are limited or that significant diminutions in value may occur.
• From time to time all or part of risks associat-ed with investments may be hedged through the defensive use of derivative transactions, including, but not limited to, futures, options, swaps or any combination thereof.
• From time to time leverage may be used in a manner commensurate with reasonable risk management to achieve investment objectives.
4. Investment Process and Factors considered While investment criteria may vary depending upon the type of transaction, factors taken into consideration when analysing potential invest-ments include:• Attractive valuations and purchase prices;• Strength, depth and commitment of the man-
agement team;• Existence of a coherent and realistic long term
business plan;• Relevant asset values;• Corporate governance issues;• Identifiable exit strategies; • Risk management; and• Active post-acquisition investment approach.
Investment opportunities will be identified and analysed by the investment manager or its dele-gates or agents within the framework of the in-
Annexure - Investment Guidelines

37
vestment guidelines. The investment manager or its delegates or agents will manage the screening process and, inter alia, conduct interviews with management and owners with the objective of aligning differing interests. The investment man-ager’s responsibilities include valuations, market analyses, competition analyses, debt capacity calculations, bid tactics, tax optimizing holding structures, financing structures, raising of debt finance, management incentives, personnel rein-forcements required, due diligence processes and the intended exit strategy.Day-to-day investment decisions will be made by the investment committee in accordance with the investment guidelines, as determined by the board of directors.
5. AmendmentsThe investment guidelines may be amended by the board of directors at any time, in whole or in part. Amendments will become effective upon their approval by the board of directors (after ex-piry of any notice period for regulatory publica-tions which may be required). The company may from time to time impose further investment re-strictions, compatible with or in the interest of investors, or, in certain circumstances, in order to comply with relevant country laws and regulations.
Resolved by the board of directors on July 6, 2011

Board of Directors Gustav Stenbolt Walter Fetscherin Urs Maurer-Lambrou
Domicile ENR Russia Invest SA 2–4 Place du Molard 1204 Geneva Switzerland
Auditors Ernst & Young AG Badenerstrasse 47 8022 Zurich Switzerland
Investment Manager Valartis International Limited Vanterpool Plaza, 2nd Floor Wickhams Cay 1 Road Town, Tortola, British Virgin Islands
Security Number 3447695
ISIN Number CH0034476959
Ticker Symbol RUS
Company Website www.enr.ch
38
Shareholder Information and Corporate Details

Imprint
ENR Russia Invest SA, Geneva, Switzerland
Realisation and printingGraphic Services SA, Oron-la-Ville, Switzerland

www.enr.chENR Russia Invest SAInvestor Relations2-4 place du Molard | P.O. Box 3458 1211 Geneva 3Tel: +41 22 716 1000 | Fax: +41 22 716 1001